1. Introduction
Computer-aided design and computer-aided manufacturing (CAD/CAM) technologies have become integral to contemporary restorative dentistry, enabling the routine fabrication of definitive fixed restorations from lithium disilicate glass-ceramics and resin-based materials. Subtractive manufacturing by milling, however, is associated with material waste, tool wear, and geometric limitations [
1]. Additive manufacturing (AM) has consequently gained attention as an alternative digital workflow because it enables layer-by-layer fabrication of multiple restorations with reduced material waste and considerable design flexibility [
2,
3]. Early photopolymer resins for AM were used primarily for provisional restorations and models; however, advances in resin formulation and the incorporation of inorganic fillers have expanded their indications to definitive restorations [
4]. Commercial AM resins intended for definitive crowns differ in monomer composition, filler type and content, photoinitiator systems, and processing conditions; these product-specific factors can result in substantial differences in physicomechanical properties [
4,
5,
6].
For photopolymerizable AM resins, degree of conversion (DC) is commonly used to characterize polymerization efficiency [
7]. Mechanical behavior is further characterized using standardized tests under different loading conditions, including flexural, tensile, compressive, and indentation testing [
8,
9]. These tests provide controlled measurements of specific material properties, but they do not reproduce the complex geometry and stress state of a crown restoration [
10,
11]. Unlike standardized specimens, crowns have three-dimensional contours and nonuniform thicknesses and are supported by an abutment, producing localized contact stresses and complex stress distributions during loading. Accordingly, flexural strength or hardness measured in standardized specimens may not correspond directly to crown fracture load. An evaluation of both material-level properties and restoration-level fracture behavior is, therefore, required for a more comprehensive characterization of definitive restorative materials.
Previous studies of AM resins for definitive crowns have focused primarily on physicomechanical properties measured using standardized specimens [
5,
6,
7,
12,
13]. Restoration-level studies have also examined 3D-printed fixed dental prostheses. Reymus et al. reported resin-dependent post-curing effects, higher fracture loads for distally rather than occlusally oriented specimens, and aging-related reductions in two of the tested provisional resins [
14]. However, integrated comparisons of definitive crown materials remain limited—particularly studies assessing DC in the AM resins together with multiple mechanical properties and crown fracture load across the same products within one experimental framework. Evaluating these complementary outcomes in their respective test specimens may clarify whether material rankings from standardized tests are maintained at the restoration level.
Therefore, the purpose of this in vitro study was to compare the physicomechanical properties and CFL of three AM resins indicated for definitive crowns, C&B Permanent (CB), CROWNTEC (CT), and VarseoSmile Crown plus (VS), with a CAD/CAM-milled resin-based material, SHOFU HC (HC), and a lithium disilicate glass-ceramic, Rosetta SM (RSM). DC was evaluated for the three AM resins, whereas flexural strength (FS), flexural modulus (FM), tensile strength (TS), compressive strength (CS), Vickers hardness number (VHN), and CFL were evaluated for all five materials. The first null hypothesis was that there would be no significant differences in DC among the three AM resins. The second null hypothesis was that there would be no significant differences among the five restorative materials in each of the standardized mechanical outcomes (FS, FM, TS, CS, and VHN); each outcome was tested separately. The third null hypothesis was that there would be no significant differences in CFL among the five restorative materials.
2. Materials and Methods
2.1. Materials and Experimental Design
Five commercially available restorative materials indicated for definitive fixed dental restorations were evaluated in this comparative in vitro study. Three were AM resins indicated for definitive crowns: C&B Permanent (CB; ODS Co., Ltd., Seoul, Republic of Korea), CROWNTEC (CT; Saremco Dental AG, Rebstein, Switzerland), and VarseoSmile Crown plus (VS; BEGO GmbH & Co. KG, Bremen, Germany). The remaining materials were a CAD/CAM-milled resin-based material, SHOFU HC (HC; SHOFU INC., Kyoto, Japan), and a CAD/CAM-milled lithium disilicate glass-ceramic, Rosetta SM (RSM; HASSBIO, Gangneung, Republic of Korea) (
Table 1).
Specimens from CB, CT, and VS were fabricated by vat photopolymerization-based masked stereolithography (MSLA), whereas specimens from HC and RSM were fabricated by CAD/CAM milling.
DC was evaluated only for CB, CT, and VS (
n = 5 per material). FS, FM, TS, CS, CFL, and VHN were evaluated for all five materials (
n = 10 per material); FS and FM were obtained from the same flexural specimens. Sample-size planning used the fixed-effects, omnibus one-way ANOVA procedure in G*Power (version 3.1.9.7; Heinrich Heine University Düsseldorf, Düsseldorf, Germany). With
f = 0.806 from Elkaffas et al. [
15], α = 0.05, 95% power, and five groups, the calculation gave a minimum total of 34 specimens; balanced allocation required 35 specimens (7 per material). Ten specimens per material were used for each mechanical outcome, yielding 50 specimens per outcome and allowing for potential technical losses. This allocation also matches the 10 specimens per group used by Elkaffas et al. for fracture testing of milled and 3D-printed occlusal veneers [
15]. For DC, five specimens per material are consistent with the FTIR study by Aktug Karademir et al., which used five specimens per material/post-curing subgroup for CROWNTEC and VarseoSmile Crown plus [
13]. These precedents support the sample sizes for comparative in vitro characterization, but do not establish outcome-specific power in the present study. The five-group calculation is a planning reference for the mechanical outcomes, not a guarantee of 95% power for every heteroscedastic or multiplicity-adjusted comparison. No separate a priori power calculation is reported for DC; its small sample requires cautious interpretation.
2.2. Specimen Preparation
Specimens were prepared according to the manufacturing workflow of each material and the geometry required for the respective test. CB, CT, and VS specimens were fabricated by MSLA, whereas HC and RSM specimens were fabricated by CAD/CAM milling.
All AM specimens were fabricated using an MSLA 3D printer (Lilivis; Huvitz Co., Ltd., Anyang, Republic of Korea) with a layer thickness of 100 µm and a build orientation of 0 degrees relative to the build platform. A layer thickness of 100 µm was applied to all three AM materials to maintain the same nominal printing condition across the material groups. The 100 µm setting describes the nominal layer increment, not independently measured Z-axis positioning accuracy; no independent positioning-accuracy measurement is reported and alternative layer thicknesses were not compared.
Before fabrication of the experimental specimens, printing parameters were calibrated separately for each AM resin to minimize dimensional error and improve reproducibility across printing cycles. A square calibration specimen with outer dimensions of 15 mm and inner dimensions of 10 mm was designed using CAD software (PTC CREO; Parametric Technologies Corp., Needham, MA, USA). The design file was imported into the dedicated slicing software, converted to a printable file, and fabricated separately for each material.
The printed calibration specimens were cleaned with 100% isopropyl alcohol to remove residual uncured resin and were then post-polymerized according to the protocol for each material. The length, width, and height of each calibration specimen were measured using a digital micrometer (NR293-244-30; Mitutoyo, Kawasaki, Japan). If any measured dimension differed from the design value by more than the predefined tolerance of ±0.05 mm, the layer exposure time, bottom-layer exposure time, number of transition layers, and light intensity were adjusted and the specimen was reprinted. Transition layers are intermediate layers that gradually bridge the exposure conditions between the bottom layers and the normal printing layers; five transition layers were used for each AM resin. Calibration and dimensional verification were repeated until all measured dimensions were within the predefined tolerance. The final material-specific printing parameters are presented in
Table 2 and were used for all subsequent experimental specimens. After fabrication, the dimensions of all experimental specimens were measured using vernier calipers (500–151-30; Mitutoyo, Kawasaki, Japan). A tolerance of ±0.05 mm relative to the designed dimensions was applied; specimens outside this tolerance were remade before testing. All specimens included in testing were confirmed to have met this acceptance criterion. Individual dimensional measurements were not retained; therefore, this pretest acceptance check does not constitute a quantitative assessment of dimensional trueness or precision. The implications for nominal-area stress calculations were examined in a conditional dimensional-tolerance assessment (
Section 2.9 and
Section 3.6).
After calibration, all experimental specimens were fabricated using the final material-specific printing parameters. The printed specimens were removed from the build platform and cleaned in 100% isopropyl alcohol for 3 min. They were then post-polymerized using a curing unit (Lilivis Cure; Huvitz Co., Ltd., Anyang, Republic of Korea) according to the manufacturer-recommended protocol for each material: 7 min for CB and 20 min for both CT and VS. After post-polymerization, the supports were removed and the specimens were finished according to the requirements of the respective test.
HC and RSM specimens were designed in the geometries required for each test. Toolpaths were generated using CAM software (HyperDENT 10.1; FOLLOW-ME! Technology GmbH, Munich, Germany); the specimens were fabricated by wet-milling with a 5-axis milling machine (Craft 5X; DOF Inc., Seoul, Republic of Korea). After milling, the specimens were separated from the blocks, residual connectors were removed, and the specimens were ultrasonically cleaned and steam-cleaned.
After milling and cleaning, RSM specimens were crystallized for 30 min in a ceramic furnace (Programat P310; Ivoclar, Schaan, Liechtenstein) according to the manufacturer’s crystallization protocol. After crystallization, the specimens were steam-cleaned and visually inspected. HC specimens required no crystallization and were finished according to the requirements of each test after cleaning.
Specimens were prepared in configurations appropriate for each test. The experimental design, specimen geometries, sample sizes, test methods, and outcome measures are summarized in
Table 3.
2.3. Degree of Conversion
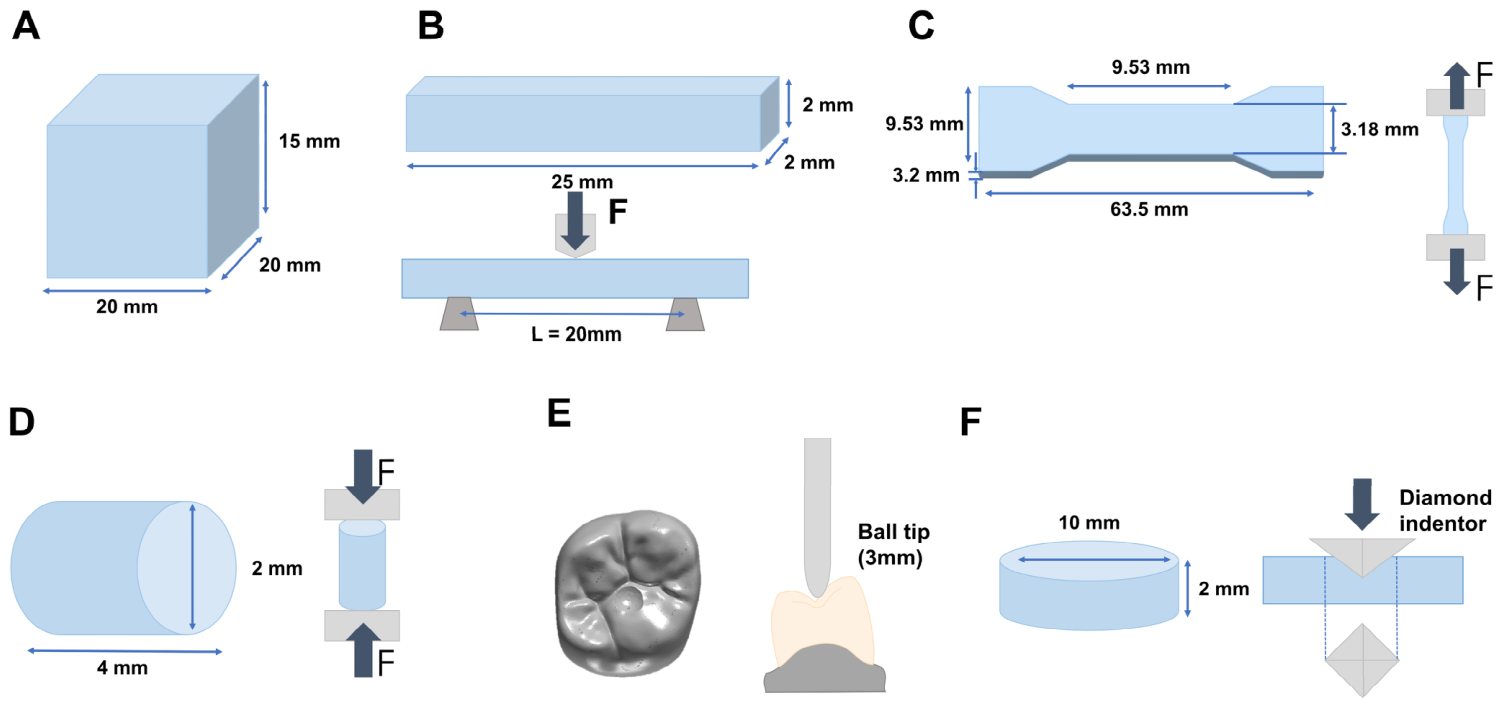
DC was evaluated in five specimens each of CB, CT, and VS. Rectangular specimens measuring 20 × 20 × 15 mm were fabricated (
Figure 1A). Before measurement, the specimen surfaces were sequentially polished with 600- to 1800-grit silicon carbide abrasive papers. DC was determined using Fourier transform infrared (FTIR) spectroscopy (Nicolet iS10; Thermo Fisher Scientific, Waltham, MA, USA) equipped with a diamond-attenuated total reflectance accessory.
The uncured resin of each material served as the reference for the unpolymerized state and was measured under the same FTIR conditions as the polymerized specimens. Spectra were acquired over a wavenumber range of 3500 to 780 cm
−1 at a resolution of 0.5 cm
−1, with 64 scans collected per specimen. The aliphatic C=C band at 1638 cm
−1 and the carbonyl C=O reference band at 1716 cm
−1 were analyzed and peak areas were integrated over 1650 to 1624 cm
−1 and 1770 to 1658 cm
−1, respectively [
16,
17]. DC was calculated using the integrated C=C and C=O peak areas (A
1638 and A
1716, respectively) before and after polymerization and expressed as a percentage:
2.4. Flexural Strength and Flexural Modulus
FS and FM were evaluated in 10 bar-shaped specimens from each material. A three-point bend test was performed using specimens measuring 25 × 2 × 2 mm (
Figure 1B) and a 20 mm support span. This specimen geometry and support span were based on the ISO 4049 flexural test configuration for polymer-based restorative materials [
18] and were applied consistently to all groups for comparison; their use does not imply full ISO 4049 compliance for the lithium disilicate glass-ceramic.
The three-point bend test was performed using a universal testing machine (AGS-X STD; Shimadzu Corporation, Kyoto, Japan). The test fixture consisted of two 2 mm-diameter support rollers positioned 20 mm apart and a central 2 mm-diameter loading roller. Each specimen was centered on the supports and loaded vertically at its midpoint at a crosshead speed of 0.5 mm/min until fracture. FS was calculated from the maximum load at fracture and expressed in MPa as follows:
where F is the maximum load at fracture (N), L is the support span (mm), b is the specimen width (mm), and h is the specimen thickness (mm).
FM was calculated from the slope of the initial linear region of the load-displacement curve and expressed in GPa as follows:
where L is the support span (mm), b is the specimen width (mm), h is the specimen thickness (mm), and m is the slope of the initial linear region of the load-displacement curve (N/mm). The factor 10
−3 converts N/mm
2 (MPa) to GPa.
2.5. Tensile Strength
TS was evaluated in 10 specimens from each material. Specimens were fabricated using an ASTM D638 Type V-based geometry [
19], with nominal dimensions of 63.5 mm in overall length, 3.18 mm in narrow-section width, and 3.2 mm in thickness (
Figure 1C).
Each specimen was mounted in the tensile grips of a universal testing machine (AGS-X STD; Shimadzu Corporation, Kyoto, Japan) with its longitudinal axis aligned with the loading direction. Tensile loading was applied at a crosshead speed of 1 mm/min until failure. TS was recalculated from the retained maximum load at failure using the nominal initial cross-sectional area of the narrow section:
where TS is the tensile strength (MPa), F is the maximum load at failure (N), and A is the nominal cross-sectional area, 3.18 × 3.2 = 10.176 mm
2. Individual dimensional measurements were unavailable; therefore, the reported values represent nominal-area stresses rather than specimen-specific dimension-corrected stresses. The original load/strength ratios implied approximately 12.72 mm
2 rather than the documented nominal 10.176 mm
2. The latter was adopted for this revision without changing any retained load; the original values and calculation assumptions are preserved in
Supplementary Information.xlsx.
2.6. Compressive Strength
CS was evaluated in 10 cylindrical specimens from each material. The specimens had nominal dimensions of 2 mm in diameter and 4 mm in height (
Figure 1D). The specimen geometry and crosshead speed were selected based on a previous dental materials study evaluating the compressive strength of CAD/CAM resin composite materials [
20]. This miniaturized configuration maintained a height-to-diameter ratio of 2:1 but was a modified comparative protocol rather than a claim of full ASTM D695 compliance.
Each specimen was positioned between parallel compression platens in a universal testing machine (AGS-X STD; Shimadzu Corporation, Kyoto, Japan), with its longitudinal axis aligned with the loading direction. A vertical compressive load was applied at a crosshead speed of 0.75 mm/min until failure. CS was recalculated from the retained maximum compressive load using the nominal initial cross-sectional area:
The nominal cross-sectional area of each cylindrical specimen was calculated as follows:
where CS is the compressive strength (MPa), F is the maximum compressive load (N), A is the nominal cross-sectional area (mm
2), and d is the nominal specimen diameter (2 mm), giving A = π mm
2. The same nominal-area calculation was applied to all 50 specimens because individual dimensional measurements were unavailable.
2.7. Crown Fracture Load
Restoration-level fracture behavior was evaluated in 10 crown specimens from each material. A maxillary right first-molar metal typodont tooth was prepared with 2.0 mm of occlusal reduction, 1.5 mm of axial reduction, and a 1.0 mm chamfer finish line. A master cast was fabricated using Type IV dental stone (New Fujirock; GC Europe N.V., Leuven, Belgium) and scanned with a calibrated desktop scanner (E1; 3Shape A/S, Copenhagen, Denmark).
The scan data were imported into dental CAD software (Dentbird; Imagoworks Inc., Seoul, Republic of Korea); crown morphology was generated using an artificial intelligence-assisted design function. The cement space was set to 60 µm, the minimum thickness to 0.1 mm, the margin height to 0.1 mm, and the margin angle to 45 degrees. The 0.1 mm value denotes a CAD minimum-thickness setting, not a measured crown wall thickness. A standardized occlusal concavity corresponding to the 3 mm spherical indenter was incorporated at the center of the occlusal surface to ensure reproducible indenter positioning during fracture testing. The final crown design was exported as a Standard Tessellation Language (STL) file; crowns were fabricated according to the manufacturing workflow of each material (
Figure 1E).
Each crown was cemented to a metal typodont abutment identical in geometry to the abutment used for crown design. A non-eugenol provisional luting cement (RelyX Temp NE; 3M Deutschland GmbH, Seefeld, Germany) was applied to the intaglio surface and the crown was seated under a constant load of 4.90 N for 1 min. Excess cement was removed after seating.
CFL was measured using a universal testing machine (AGS-X STD; Shimadzu Corporation, Kyoto, Japan) equipped with a 3 mm-diameter steel spherical indenter. The indenter was positioned in the standardized central occlusal concavity. A vertical load was applied at a crosshead speed of 1 mm/min until fracture. The maximum load recorded at fracture was defined as the CFL and expressed in N.
2.8. Vickers Hardness
VHN was evaluated in 10 specimens from each material. Disk-shaped specimens measuring 10 mm in diameter and 2 mm in thickness were fabricated for hardness testing (
Figure 1F).
The specimens were embedded in epoxy resin and sequentially wet-polished using 600-, 800-, 1200-, and 1500-grit silicon carbide abrasive papers. Vickers hardness was measured using a hardness tester (HM-112; Mitutoyo Corporation, Tokyo, Japan). A load of 2.94 N was applied with a Vickers diamond indenter for 15 s. The diagonal lengths of the resulting indentations were measured. The mean hardness value obtained for each specimen was recorded as its VHN.
2.9. Statistical Analysis
Statistical analyses were performed using IBM SPSS Statistics (v29.0; IBM Corp., Armonk, NY, USA); numerical verification and sensitivity analyses were additionally performed in Python 3.13.5 with NumPy 2.3.5, SciPy 1.17.0, and statsmodels 0.14.6. Statistical significance was set at α = 0.05, and pairwise comparisons were two-sided. The individual specimen was considered the statistical unit, and material was treated as a fixed factor. DC was analyzed among CB, CT, and VS, whereas FS, FM, TS, CS, CFL, and VHN were analyzed among CB, CT, VS, HC, and RSM. Specimen counts were defined separately for each outcome; matching row indices across different test types in
Data S1 were not treated as evidence of specimen-level pairing.
Continuous variables were summarized as mean ± standard deviation. Normality was assessed using the Shapiro–Wilk test; homogeneity of variance was evaluated using the median-centered Brown–Forsythe test. Because heterogeneity of variance was identified for some outcomes, Welch one-way ANOVA was selected as the primary omnibus test for comparisons of material means and was applied consistently to all outcomes. Significant omnibus tests were followed by Games–Howell pairwise comparisons, which accommodate unequal variances and account for multiple pairwise comparisons within an outcome. Nonsignificant pairwise comparisons were not interpreted as evidence of equivalence.
To control the family-wise error rate across the seven omnibus outcome tests, p values from the Welch ANOVAs were adjusted using the Holm procedure. This correction applied to the seven omnibus hypotheses; Games–Howell adjustment was applied separately within each outcome, not jointly across all 63 pairwise comparisons. Conventional bias-adjusted omega-squared (ω2), calculated from the pooled one-way ANOVA sums of squares, was reported as a descriptive effect-size estimate rather than a Welch-adjusted measure; inference was based on the Welch tests.
Sensitivity analyses addressed distinct assumptions. Conventional one-way ANOVA provided an equal-variance benchmark, not evidence of robustness to heteroscedasticity. The Alexander–Govern test provided an alternative comparison of means allowing for unequal variances under independence and within-group normality assumptions. Twenty percent trimmed-mean Welch tests used Winsorized variances after trimming 20% from each tail (one observation per tail for DC, leaving three per group, and two per tail for other outcomes, leaving six per group) to reduce sensitivity to extreme observations. Welch tests on natural log-transformed values examined sensitivity to scale and skewness. The latter two approaches assess trimmed means and means on the log scale, respectively, rather than the original arithmetic-mean estimand; all sensitivity analyses were exploratory.
A separate deterministic assessment examined the effect of the stated dimensional tolerance on TS and CS. At a fixed recorded load, each nominal load-bearing dimension was varied by ±0.05 mm, assuming ideal rectangular TS and circular CS cross-sections. The minimum and maximum areas were (3.18 ± 0.05)(3.2 ± 0.05) mm2 for TS and π[(2 ± 0.05)/2]2 mm2 for CS; stress bounds were obtained as F/A. The dimensional bounds worksheet provides the formulas and group-mean bounds. This conditional calculation does not impute individual measurements, estimate measurement uncertainty, or generate confidence intervals or p values.
Potential outliers were identified exploratorily using the 1.5 × interquartile range criterion; no observation was excluded from the primary analyses solely on the basis of statistical outlier status. For FS and CFL, exploratory two-parameter Weibull models (location fixed at zero) were fitted by maximum likelihood to estimate the Weibull modulus (m) and scale parameter (η). Pointwise 95% percentile confidence intervals were estimated from 10,000 nonparametric bootstrap resamples within each material and outcome, using NumPy default_rng with seed 20260914. A single random number stream was used in the order FS followed by CFL, and CB, CT, VS, HC, and RSM within each outcome. These exploratory intervals were not adjusted for comparisons across materials. Values of p < 0.001 were reported as such, whereas p values of 0.001 or greater were reported to three decimal places.
3. Results
Mean ± standard deviation values for DC and the mechanical properties of the tested materials are summarized in
Table 4;
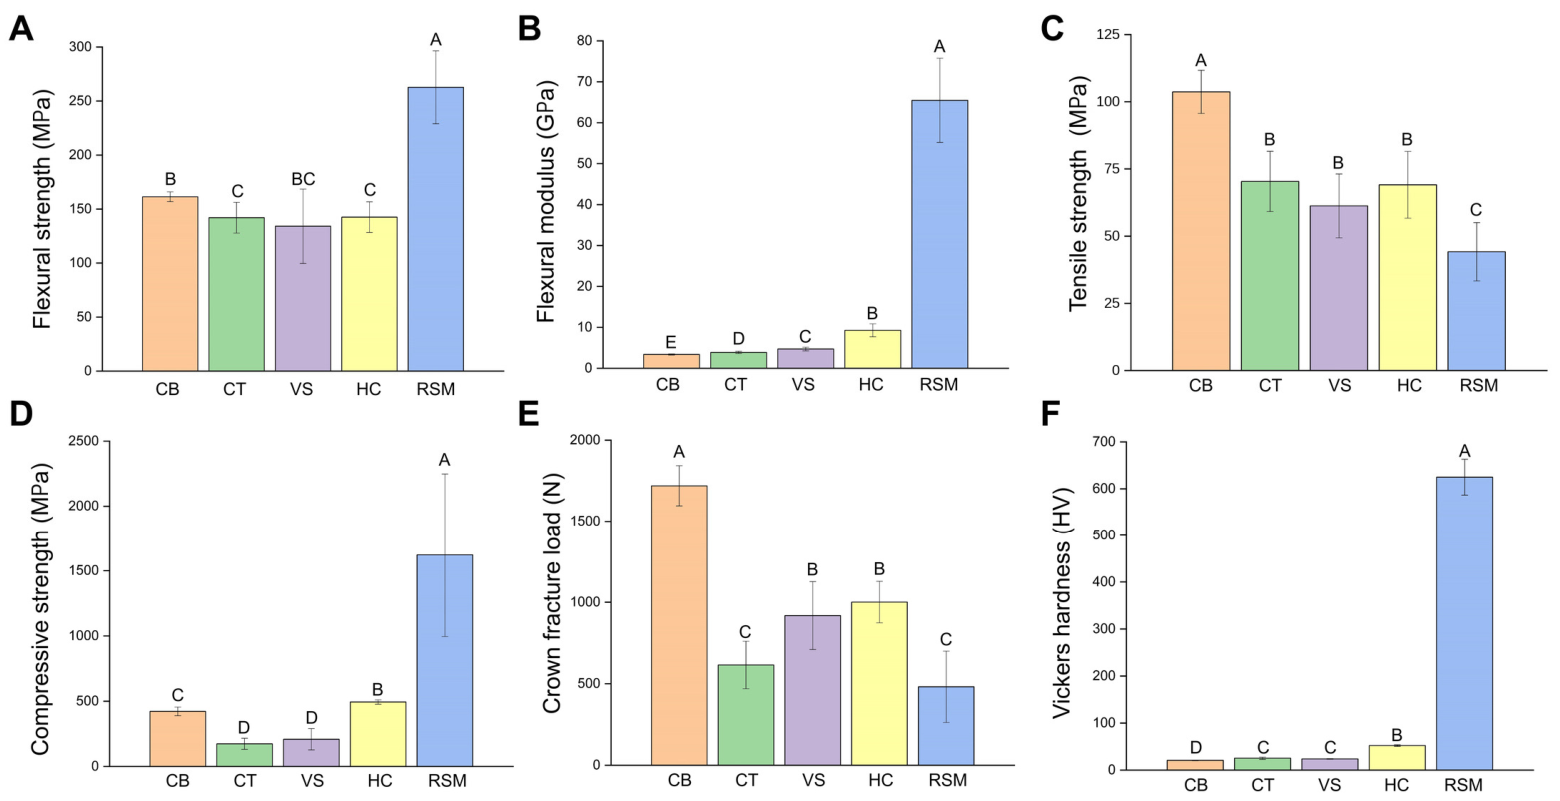
Figure 2 presents the mechanical outcomes. Welch one-way ANOVA indicated statistically significant differences among the materials for every evaluated outcome, including DC, FS, FM, TS, CS, CFL, and VHN (
p < 0.001). All seven omnibus comparisons remained statistically significant after Holm adjustment (
p < 0.001), with descriptive pooled bias-adjusted ω
2 values ranging from 0.706 to 0.995 (
Table 5).
3.1. Results of Degree of Conversion
DC differed significantly among the tested AM resins (Welch F(2, 5.74) = 32.65, p < 0.001). Mean DC was 74.98 ± 3.47% for CB, 69.92 ± 4.22% for VS, and 62.62 ± 0.77% for CT.
Games–Howell post hoc comparisons showed no significant difference between CB and VS (p = 0.159). Both CB and VS exhibited significantly higher DC than CT (p = 0.002 and p = 0.037, respectively).
3.2. Results of Flexural Strength and Flexural Modulus
FS differed significantly among materials (Welch F(4, 19.66) = 29.53, p < 0.001). RSM exhibited the highest mean FS (262.72 ± 33.75 MPa) and significantly higher FS than all other materials (p < 0.05).
CB exhibited a mean FS of 161.40 ± 4.56 MPa, which was significantly higher than those of CT (142.02 ± 14.25 MPa) and HC (142.52 ± 14.16 MPa) (p = 0.013 and p = 0.014, respectively). No significant difference was detected between CB and VS (134.10 ± 34.37 MPa; p = 0.174), and no significant differences were detected among CT, VS, and HC (p > 0.05).
FM also differed significantly among materials (Welch F(4, 20.35) = 134.60, p < 0.001). Mean FM was highest for RSM (65.47 ± 10.27 GPa), followed by HC (9.27 ± 1.58 GPa), VS (4.70 ± 0.44 GPa), CT (3.87 ± 0.26 GPa), and CB (3.36 ± 0.15 GPa). All pairwise comparisons were statistically significant (p < 0.05).
3.3. Tensile Strength and Compressive Strength
TS differed significantly among materials (Welch F(4, 22.32) = 51.81, p < 0.001). CB exhibited the highest mean TS (103.68 ± 8.03 MPa) and significantly higher TS than all other materials (p < 0.05).
Mean TS values for CT, VS, and HC were 70.33 ± 11.21, 61.25 ± 11.85, and 69.12 ± 12.41 MPa, respectively, with no significant differences among these materials (p > 0.05). RSM exhibited the lowest mean TS (44.17 ± 10.85 MPa) and significantly lower TS than CT (p < 0.001), VS (p = 0.025), and HC (p = 0.001).
CS differed significantly among materials (Welch F(4, 20.48) = 141.81, p < 0.001). RSM exhibited the highest mean CS (1621.43 ± 625.90 MPa) and significantly higher CS than all other materials (all p < 0.003).
HC exhibited a significantly higher mean CS (494.05 ± 16.73 MPa) than CB (422.03 ± 33.11 MPa) (p < 0.001). CB exhibited significantly higher CS than VS (208.32 ± 81.32 MPa) and CT (173.50 ± 42.21 MPa) (p < 0.001). No significant difference was detected between VS and CT (p = 0.751).
3.4. Results of Crown Fracture Load
CFL differed significantly among materials (Welch F(4, 22.24) = 104.45, p < 0.001). CB exhibited the highest mean CFL (1719.7 ± 123.4 N) and significantly higher CFL than all other materials (p < 0.001).
Mean CFL was 1000.8 ± 127.3 N for HC and 918.0 ± 207.9 N for VS, with no significant difference between them (p = 0.816). HC exhibited significantly higher CFL than CT and RSM (p < 0.001 for both comparisons). VS exhibited significantly higher CFL than CT (p = 0.012) and RSM (p = 0.002). No significant difference was detected between CT (615.0 ± 145.7 N) and RSM (481.6 ± 218.9 N) (p = 0.517).
3.5. Results of Vickers Hardness
VHN differed significantly among materials (Welch F(4, 21.27) = 1171.13, p < 0.001). RSM exhibited the highest mean VHN (624.73 ± 38.21 HV), followed by HC (52.10 ± 1.77 HV). Both RSM and HC exhibited significantly higher VHN than the remaining materials (p < 0.001).
Mean VHN was 25.27 ± 2.44 HV for CT and 23.81 ± 0.81 HV for VS, with no significant difference between them (p = 0.423). Both CT and VS exhibited significantly higher VHN than CB (20.69 ± 0.78 HV) (p = 0.001 and p < 0.001, respectively).
3.6. Sensitivity Analyses
Exploratory assumption checks indicated variance heterogeneity for FS, FM, CS, and VHN (median-centered Brown–Forsythe
p < 0.05). Shapiro–Wilk tests indicated departures from normality in CB for DC, HC for FS, CT, VS, and HC for FM, and RSM for CS (
p < 0.05). Conventional one-way ANOVA, the Alexander–Govern test, 20% trimmed-mean Welch tests, and Welch tests after natural log transformation each identified overall material differences for every outcome (all unadjusted sensitivity analysis
p < 0.001). Thus, the evidence of overall material differences persisted across the examined assumptions and estimands. This agreement does not imply identical pairwise results; pairwise interpretations were based on the primary Games–Howell comparisons. Neither agreement among the sensitivity analyses nor the nonsignificant assumption tests established that distributional assumptions hold, particularly with these small samples. The statistical checks worksheet in
Supplementary Information.xlsx provides the numerical test outputs.
Under the dimensional assumptions specified in
Section 2.9, TS could differ from the nominal-area value by −3.06% to +3.21%, and CS by −4.82% to +5.19%. CB remained the highest and RSM the lowest in observed mean TS throughout these bounds; the observed mean CS ordering (RSM > HC > CB > VS > CT) was also retained. The TS mean order of CT and HC could reverse. These are deterministic bounds on means, not evidence that every pairwise significance decision is insensitive to dimensional variation; the primary analyses remained based on the documented nominal areas.
3.7. Exploratory Weibull Analysis
The results of the exploratory two-parameter Weibull analyses for FS and CFL are presented in
Table 6.
For FS, CB exhibited the highest Weibull modulus (m = 46.97), whereas VS exhibited the lowest (m = 4.85). RSM exhibited the highest characteristic strength (η = 277.09 MPa).
For CFL, CB exhibited the highest Weibull modulus (m = 14.67) and characteristic fracture load (η = 1776.73 N), whereas RSM exhibited the lowest Weibull modulus (m = 2.45) and characteristic fracture load (η = 544.60 N). Because each material group comprised 10 specimens, these Weibull estimates were considered exploratory.
4. Discussion
The present study compared the physicomechanical properties and crown fracture load of three AM resins indicated for definitive crowns (CB, CT, and VS), a CAD/CAM-milled resin-based material (HC), and a lithium disilicate glass-ceramic (RSM). All seven omnibus material comparisons were significant after Holm adjustment (all p < 0.001). The first null hypothesis was rejected for DC; the second was rejected separately for FS, FM, TS, CS, and VHN; and the third was rejected for CFL. The sensitivity analyses also detected overall material differences, although they addressed different assumptions or estimands and did not replace the primary Welch and Games–Howell analyses.
DC was significantly higher for CB (74.98%) and VS (69.92%) than for CT (62.62%). In AM dental resins, post-polymerization conditions can influence DC [
13,
16,
21]; underlying polymerization behavior also depends on resin composition, light intensity, and temperature [
22]. Because the three AM resins differed in both formulation and processing parameters, the observed DC differences should be interpreted as product-specific rather than as the effect of a single compositional or processing factor. Reported DC values for AM dental resins vary across materials and post-curing protocols [
13,
16,
21]. Ferracane et al. reported less abrasive wear with increasing DC over a range of 55% to 67% in an experimental hybrid composite [
23]; this material-specific relationship does not establish a universal DC threshold for definitive AM resins. All measured DC values in the present study exceeded 60%, but this observation alone does not establish adequate polymerization or clinical success. DC alone does not characterize the complete polymer network and should, therefore, be interpreted together with material composition and post-polymerization conditions.
FM and VHN showed a pattern broadly consistent with differences in material composition and inorganic phase content. RSM, a crystallized lithium disilicate glass-ceramic, exhibited the highest FM (65.47 GPa) and VHN (624.73 HV). Among the resin-based materials, HC, which contains approximately 61 wt% inorganic filler, exhibited the highest FM and VHN. VS and CT, which contain 30 to 50 wt% inorganic filler, showed intermediate values, whereas CB, which does not contain inorganic filler, exhibited the lowest FM and VHN. Elastic modulus and hardness are influenced by filler content and type [
24,
25], as well as by the ceramic phase and resin-matrix composition [
26,
27]. The differences observed in the present study are, therefore, consistent with the distinct compositional and microstructural characteristics of the tested products. Material-dependent differences in stiffness and hardness have likewise been reported for definitive AM resins and milled resin composites [
4,
5,
6].
RSM also exhibited the highest FS and CS but the lowest TS. This combination is consistent with the characteristic mechanical response of glass-ceramic materials. Ceramics generally withstand high compressive stresses but are comparatively vulnerable to tensile stresses because pre-existing surface or internal flaws can act as crack-initiation sites [
28,
29]. The low TS of RSM should, therefore, be interpreted in the context of the stress-dependent fracture behavior of lithium disilicate and not as an isolated measure of overall material suitability. Thus, the higher FS, FM, CS, and VHN of RSM are consistent with the inherently high stiffness, hardness, and strength of lithium disilicate glass-ceramics compared with resin-based materials. RSM did not have the largest standard deviation for every outcome: VS had a larger standard deviation for FS (34.37 versus 33.75 MPa), and HC had a larger standard deviation for TS (12.41 versus 10.85 MPa). Moreover, absolute standard deviations depend on the measurement scale; the FS coefficient of variation was approximately 12.8% for RSM and 25.6% for VS. Accordingly, the error bars should not be interpreted as showing uniformly greater relative variability for RSM.
A central finding of this study was the discordance between material rankings obtained from standardized mechanical tests and those obtained from crown fracture testing. RSM exhibited the highest FS, FM, CS, and VHN but the lowest mean CFL (481.6 N), which did not differ significantly from that of CT (615.0 N). In contrast, CB exhibited the lowest FM and VHN but the highest CFL (1719.7 N), which was significantly higher than the values of all other materials. Thus, the rankings for stiffness, strength, and hardness were not preserved when the materials were evaluated as crown restorations. The exploratory Weibull analysis yielded different point estimates of characteristic values and variability, with CB exhibiting the highest estimated Weibull modulus and characteristic fracture load for CFL and for RSM, the lowest; no formal between-material comparison of Weibull parameters was performed. Because these estimates were based on 10 specimens per material, they should be interpreted cautiously and should not be regarded as definitive reliability parameters.
The lack of concordance is likely related to the different stress states generated by standardized specimen tests and crown fracture testing. Standardized tests use simple geometries and controlled loading directions to isolate specific material properties. A crown loaded with a spherical indenter, however, is subjected to localized contact stresses and complex three-dimensional stress redistribution. Tensile stresses can develop at the intaglio surface and cervical regions during deformation; a fracture may initiate from defects located within these stress-concentrated areas [
30,
31]. Restoration-level fracture behavior is, therefore, influenced by crown geometry and thickness, abutment support, loading contact, and internal or surface defects [
28,
30,
32]. Because these factors are not fully represented by bar-, dog bone-, or cylinder-shaped specimens, an individual standardized material property may not adequately describe crown fracture behavior [
10].
TS showed a ranking more similar to CFL than several other mechanical properties, but the association was not consistent across all materials. CT exhibited an intermediate TS yet belonged to the lowest CFL group. A similar lack of correspondence was observed between FM and CFL. Among the resin-based materials, CT had the second-lowest FM (3.87 GPa) after CB (3.36 GPa), but its CFL was among the lowest. In contrast, VS (4.70 GPa) and HC (9.27 GPa), which had higher FM values, exhibited higher CFL than CT. These descriptive comparisons do not support selecting materials solely from TS or FM rankings. These comparisons are descriptive rather than a validation of a predictive model or a specimen-level correlation between standardized properties and CFL.
CFL also showed no consistent pattern according to manufacturing route. Significant differences were detected among the three AM resins despite their common additive manufacturing workflow; the CFL of milled HC was lower than that of AM CB but higher than that of AM CT. Crown fracture behavior, therefore, appears to reflect the combined contribution of product formulation, physicomechanical characteristics, and fabrication conditions rather than the manufacturing route alone. Previous studies comparing 3D-printed and milled crown materials have also reported material-dependent differences in fracture resistance. VarseoSmile Crown plus did not differ significantly from milled Cerasmart 270 in fracture resistance but exceeded milled Vita Enamic, illustrating a product-dependent rather than a uniform manufacturing-route pattern [
33]. CT exhibited relatively low DC (62.62%) and CS (173.50 MPa) among the AM resins; however, these observations do not establish why its CFL was lower. DC has been associated with hardness during the setting of unfilled resins [
34], and the mechanical behavior of AM resins can vary with print orientation and post-polymerization conditions [
3,
7,
14,
21]. Postprocessing also affects restoration accuracy; rinsing-time effects have been demonstrated for printed interim crowns [
35]. However, these variables were not independently manipulated in the present study; consequently, neither the contribution of an individual factor nor an independent effect of manufacturing route on CFL can be established.
Maximum posterior bite forces around or above 400 N have been reported in adults with normal occlusion [
36]; however, a single value does not represent all patients or measurement conditions. A recent systematic review reported pooled molar-region means of 592 N in males (95% CI, 523–661 N) and 449 N in females (95% CI, 382–516 N), with substantial dependence on anatomical region and recording protocol [
37]. These confidence intervals describe uncertainty in pooled means, not the range of individual bite forces. Age also matters: a cross-sectional study reported approximately 31–33% lower mean bite force in adults older than 79 years than in those aged 20–35 years [
38]. These reference values provide context only and are not thresholds for clinical success or measures of a restoration’s safety margin. The present CFL test used a single static load without cyclic fatigue or artificial aging. Furthermore, the metal abutments are stiffer than natural teeth and may alter stress transfer, while provisional cement does not reproduce definitive adhesive cementation. The measured CFL values, therefore, cannot be extrapolated directly to clinical survival or long-term performance.
Taken together, the higher strength, stiffness, or hardness measured in standardized specimens did not necessarily correspond to a higher crown fracture load. No material consistently exhibited the highest values across all evaluated outcomes. Material selection for definitive crowns should, therefore, be indication-specific and should consider the mechanical demands of the restoration together with restoration-level fracture behavior, rather than relying solely on material class, manufacturing route, or a single mechanical property.
This study has several limitations. First, the experimental design did not reproduce thermal fluctuations, prolonged moisture exposure, or cyclic fatigue; relative material differences may change after aging. Second, all AM specimens were fabricated with one 100 µm nominal layer thickness, alternative layer thicknesses were not compared, and independent
Z-axis positioning accuracy was not reported. Borella et al. reported layer-thickness effects on DC, FS, surface roughness, and hardness, with generally less favorable results at 100 than at 50 µm [
5]. The present material rankings may, therefore, depend on the selected layer thickness. Caliper measurements confirmed acceptance within ±0.05 mm; however, individual measurements were not retained and full-surface three-dimensional trueness or precision were not assessed. TS and CS were, therefore, recalculated using documented nominal cross-sectional areas; conditional tolerance bounds were added to quantify the possible geometric effect. These bounds do not recover individual dimensions, resolve the historical TS area discrepancy, or establish the robustness of every pairwise significance decision. Such checks do not establish crown accuracy or fit, which can also depend on postprocessing; rinsing-time effects on printed crown accuracy have been reported [
35]. Third, the miniaturized 2 × 4 mm compression specimens and 0.75 mm/min crosshead speed constitute a modified protocol. Specimen size, platen friction, and loading rate may affect stress distribution and failure modes, limiting comparisons with standard-sized ASTM D695 specimens; a systematic classification of barreling and shear failure was not reported. Fourth, only five commercial products were tested; material class, composition, product, manufacturing route, and postprocessing were not independently controlled. Although supported by methodological precedents [
13,
15], the small samples, particularly
n = 5 for DC, limit precision and the assessment of distributional assumptions; the trimmed-mean DC analysis retained only three observations per group. DC inference was conditional on the material-specific, uncured-reference, peak-area ratios in
Data S1; uncertainty in these shared reference values was not propagated. Specimen independence was assumed. However, the available data do not identify manufacturing batches; therefore, batch-level dependence could not be evaluated. The retained numerical data permit the recalculation of DC from integrated peak areas, TS and CS from maximum loads and nominal areas, and the reported summary statistics. However, complete FTIR spectra and load-displacement series are unavailable for the independent reassessment of spectral preprocessing, peak integration, and elastic-region slope selection. The available records also lacked measured crown-wall thicknesses, detailed pretest storage conditions, and indentation-level counts, spacing, and diagonal measurements, limiting procedural reproducibility. Future studies should evaluate a broader range of products and fabrication conditions, quantitatively validate restoration accuracy, and test crowns after aging and cyclic loading on clinically relevant supports and with definitive cementation.