1. Introduction
Modern corporate networks operate in conditions of constant information infrastructure complexity due to the combination of heterogeneous hardware and software components, distributed network segments, cloud services and a significant number of interconnected digital resources. The use of modern architectural solutions, particularly network segmentation, firewalls, redundancy of communication channels and dynamic routing, makes it possible to increase the availability, reliability and security of corporate infrastructure [
1]. At the same time, the complication of the network structure is accompanied by the expansion of the attack surface and the need for constant monitoring of its current state. An additional risk factor is the rapid development of artificial intelligence tools, which can be used both for automated detection and prediction of cyber threats and for improving the methods of conducting attacks and bypassing traditional defense mechanisms [
2]. In enterprise-level environments, this is reinforced by the need to process large volumes of heterogeneous security data generated at the network, system and application levels [
3].
Under such conditions, ensuring an adequate level of security in the corporate network requires not only the implementation of appropriate security measures but also an objective assessment of information risks and the actual state of protection. Recent studies emphasize that purely compliance-oriented approaches may create a misleading sense of security if they do not consider the actual risk context, the accumulation of configuration deviations and changes in the operational situation [
4]. Approaches focused on identifying potential threats, determining the level of security of information systems and justifying measures to reduce risks are of great importance [
5]. However, the assessment of the security state of the corporate environment is complicated by a significant number of heterogeneous parameters that characterize the network configuration, the functioning of protection tools, the state of information resources and the results of security events. Therefore, there is a need to form an integrated approach that can provide not only the fixation of individual violations or vulnerabilities but also a comprehensive presentation of the current level of network security.
At the same time, the active development of security operations centers (SOCs), SIEM platforms, response automation tools, and artificial intelligence technologies has significantly expanded the capabilities for monitoring and analyzing cyber threats [
6]. The integration of AI with SIEM systems automates the processing of significant amounts of information about security events, increases the efficiency of cyber intelligence, and reduces the time to detect potentially dangerous activity [
7]. However, such systems are predominantly focused on operational detection, correlation, and analysis of events, while obtaining a generalized, quantified, and interpreted assessment of the current security state of the entire corporate network remains challenging. In addition, the practical application of these tools requires the integration of data from numerous heterogeneous sources, which increases the complexity of their processing and interpretation.
Another important problem is the transition from assessing individual security parameters to a comprehensive definition of the network’s ability to counter cyber threats and maintain functionality under their influence. Modern research considers cyber resilience as a complex property of an information system, encompassing the ability to resist cyberattacks, maintain or restore functionality in a timely manner, and adapt to changes in the nature of threats [
8]. This approach involves the need to take into account not only the availability of protective equipment but also the actual state of the system, the level of risk, the nature of cyber threats, and the ability of the infrastructure to adapt to their impact. Such a model should assess not only the corporate network as a whole but also individual network nodes, since their security states and roles may differ substantially. Node-level assessment makes it possible to identify critical weaknesses, determine their contribution to the overall security level, and obtain a more informative basis for security management. Therefore, there is a need to form a quantitative model that will allow integrating heterogeneous security indicators and presenting them in the form of a generalized assessment of the state of the corporate network.
The confidentiality, integrity, and availability (CIA) triad is an appropriate conceptual framework for such an assessment, as it covers the main aspects of information security and provides a universal and understandable framework for representing the security status of different types of corporate environments. The practical value of the assessment model increases if the set of indicators and the logic of their interpretation are consistent with international cybersecurity standards. Among the most recognized standards are ISO/IEC 27002:2022 [
9], which defines a modern set of information security controls, and NIST SP 800-53 Rev. 5 [
10], which provides a structured catalog of security measures for information systems and organizations. In the context of assessing the state of corporate networks, the task of developing a model that combines quantity; multi-level structure; interpretation; and the possibility of comprehensive consideration of security indicators, risk level and signs of potential compromise remains relevant.
The main contributions of this study are as follows:
A dual-channel multi-level model is proposed for quantitative assessment of the current data security state in corporate networks, separating compliance-oriented security indicators from compromise-oriented indicators.
A unified aggregation scheme is developed that consistently transforms indicator-level scores into CIA aspect-level, node-level and network-level assessments.
A node criticality weighting mechanism is incorporated into the network-level aggregation procedure, allowing more important nodes to have a stronger impact on the final assessment.
A multiplicative IOS and IOC integration mechanism is introduced at the node level to prevent cross-channel compensation when a high score in one channel would otherwise mask substantial degradation in the other channel.
The model supports top–down analytical drill-down from the global network score to problematic nodes, affected CIA aspects and specific indicators responsible for degradation.
2. Related Work
An important direction is related to approaches for assessing cybersecurity maturity, readiness and conformity. In [
11], NIST and MITRE criteria are analyzed to systematize cybersecurity processes. The study covers phishing, social engineering, DoS, brute-force and targeted attacks, supporting attack scenario analysis and countermeasure selection. In [
12], a cyber-resistivity maturity and scoring framework is developed. It considers organizations of different sizes, weighting coefficients, criticality, complexity and benchmarking. In [
13], the influence of organizational cybersecurity culture on user behavior is examined. The model combines security values, behavior mechanisms and user actions, accounting for the human factor in cyber-resilience. Study [
14] proposes an applied framework for information security and risk management in SMEs, implemented through a supporting application, while [
15] presents a risk and conformity assessment framework for healthcare systems and medical supply chains, combining security, compliance and resilience. In [
16], a cyber-resilience assessment approach for a cyber–physical energy system is proposed, considering cyberattack evolution. State-transition models and statistical simulation estimate attack success, failures and recovery, enabling assessment of resistance, adaptation and restoration.
Further developments in this area are associated with studies in which cybersecurity or cyber risk assessment takes on a clearly quantitative, dynamic and resilience-oriented character. In [
17], a quantitative assessment framework for cyber–physical systems is proposed, combining Markov-chain-based modeling of anomalies in the cyber layer with a mathematical description of degradation and recovery in the physical domain. This approach is important in terms of formalizing resilience curves and constructing a structured assessment procedure under adverse impacts. A similar orientation toward quantitative and dynamic assessment is demonstrated in [
18], where an intelligent dynamic cybersecurity risk management framework is developed. This framework considers vulnerability exploitability, asset dependencies, and a hybrid AI-enabled model for vulnerability prioritization. In [
19], dynamic threat modeling and risk assessment are implemented for space systems through a formalized TARA model aligned with security controls, while the temporal evolution of risk is described using a stochastic differential equation. In [
20] a proactive and time-sensitive cyber risk assessment model is proposed, integrating Bayesian networks, absorbing Markov chains, attack paths and EPSS to assess short-term exploitation likelihood within a given time window. In turn, ref. [
21] addresses automated cyber risk assessment for AI systems used in military and critical infrastructure. The approach combines traditional information assets with AI-model characteristics, structured taxonomies, risk metrics and threat modeling. A similar principle is supported in [
22], where integrated risk management is considered a comprehensive process of identifying, assessing and controlling hazardous factors. A systematic review defines key components and potential indicators for risk assessment and resilience. In [
23], a quantitative cyber threat assessment framework based on Bayesian statistical analysis and hazard mapping is presented, in which posterior threat probabilities are updated according to new cyber threat intelligence inputs. Taken together, these studies demonstrate a clear shift from static qualitative schemes to formalized models capable of considering temporal dynamics, asset dependencies, AI-specific characteristics, integrated risk factors and changes in the threat landscape.
Probabilistic and Bayesian-based approaches to risk assessment and situational awareness also occupy an important place in contemporary research. In [
24], a network security situational awareness and risk assessment model based on a Bayesian network is proposed. Within this model, heterogeneous data sources, including traffic anomalies, system log anomalies and external threat intelligence, are integrated for timely threat detection and forecasting. In [
25], a quantitative cybersecurity analysis framework for cyber–physical systems is presented, where security attributes are modeled by considering dependencies between security events, while attack trees are mapped onto a Bayesian network model to provide a quantitative description of attack steps. A similar probabilistic logic is developed in [
26], where a quantitative risk assessment model for industrial control systems combines an entropy-weighted multi-attribute procedure, posterior probability estimation and dynamic risk propagation in the cyber–physical domain. In [
27], risk assessment for large-scale IoT applications is implemented through Bayesian attack graphs and complex probabilities, allowing the description of non-trivial attacker behavior, including cycles and backtracking. In turn, ref. [
28] demonstrates a vulnerability assessment approach in which CVSS temporal metrics are integrated with Bayesian networks for adaptive prioritization of vulnerabilities, taking into account exploit availability, remediation efforts and confidence in reported vulnerabilities. Overall, these studies show that probabilistic modeling is one of the most actively developed directions in formalizing risk-aware security assessment, especially when it is necessary to account for attack dependencies, temporal factors and changes in threat probabilities over time.
At the same time, many studies rely on fuzzy, MCDM and lifecycle-oriented approaches to handle uncertainty, expert judgments and multi-criteria evaluation. In [
29], an intelligent risk assessment methodology for data lifecycle security is proposed, combining AHP, the entropy weight method, fuzzy comprehensive evaluation and an attention-based neural network. Study [
30] develops information security assessment based on interval-valued intuitionistic fuzzy decision-making, focusing on objective quantification of expert and attribute weights and evidence-based information fusion. In [
31], an inclusive cybersecurity and safety risk assessment model for CPS is presented using a Mamdani fuzzy inference system, considering cybersecurity and safety factors simultaneously. In [
32], security issues in smart green city IoT infrastructure are investigated. Complex network centrality measures and a malicious impact propagation model identify influential and vulnerable nodes, showing that protecting critical static nodes is important for IoT network cyber-resilience. A common feature of these approaches is improving assessment accuracy and flexibility by considering uncertainty, expert judgments, network dependencies and multi-criteria factors.
A separate group consists of domain-specific frameworks developed for particular application environments, in which cybersecurity assessment is adapted to specific domains. In [
33], the cyber intelligent risk assessment methodology (CIRA) for IIoT is proposed, where intelligent and resilient cyber risk assessment uses machine learning. In [
34], the integration of cyber-physical systems and IoT into smart grids is examined. Combining CPS, IoT and intelligent control not only improves infrastructure efficiency, reliability and resilience but also expands the cyber threat surface. Digital twins support system-state modeling and security decisions. Study [
35] addresses dynamic security risk assessment in cyber–physical energy systems, considering interdependencies between system levels and complex multi-stage attacks with cascading effects. The approach supports dynamic risk assessment and mitigation. In [
36], the use of digital twins for assessing information security risks is considered, including vulnerability identification, cyberattack prediction and testing security mechanisms in a virtual environment. Study [
37] systematizes cyber threats in virtual reality, including sensor-data manipulation, information injection and avatar compromise, highlighting the need to adapt cybersecurity to new digital environments. These studies confirm that domain-specific frameworks can be effective; however, they remain tied to specific environments and cannot always be transferred to heterogeneous corporate networks. Moreover, most focus on threat modeling, vulnerability analysis or domain resilience, leaving open the problem of a universal quantitative multi-level model for assessing corporate network security posture.
In [
38], AI and machine learning methods are examined for cyber threat prediction and anomaly detection, including automated network traffic analysis and intrusion detection. Hybrid CNN and transformer models are considered promising for improving detection accuracy. In [
39], an intelligent multimodal approach for cyber threat detection in smart devices is proposed, using sensor data from accelerometers, gyroscopes, microphones and temperature sensors to capture network and physical behavior. CNN–RNN–Transformer models enable near-real-time cyber–physical threat detection. In turn, ref. [
40] systematizes AI/ML approaches for security operations centers, emphasizing automation of event analysis, anomaly detection and threat response. Behavioral analytics, automated response and deep learning support proactive cyber defense. Taken together, these studies demonstrate the development of intelligent detection ecosystems, where automated analysis, multimodal monitoring and AI-assisted response are increasingly important for modern cyber defense. This is relevant to complex corporate infrastructures, where threats may affect network and physical components.
Within distributed security monitoring, studies also examine distributed network data collection to improve awareness of geospatial security on the Internet. In [
41], robust countermeasures and mechanisms are developed to detect adversary geolocation methods, enabling precise information location and mitigation of fraudulent activities and potential security threats.
Special attention in current research is also paid to the collection of events and metadata from endpoint devices as a basis for further security assessment. In [
42], the monitoring of Android devices using events and metadata is considered. In this approach, a mobile client collects device-specific data, platform state and system metadata and transfers them to a central SIEM component for further threat analysis using rule sets and artificial intelligence.
Simulation-based studies form another adjacent direction because they allow researchers to reproduce attack scenarios and evaluate the behavior of security mechanisms under controlled conditions. In [
43], Graphic Network Simulator 3 was used to simulate DDoS attacks against an HTTP server in a typical enterprise network. The study emphasizes that simulation remains an important technique in networking and cybersecurity research, although its reliability depends on the realism of the modeled environment and the validity of the assumptions used.
In [
44], a profile-oriented assessment of software requirements quality is proposed, where a taxonomy of metrics and indicators is used to assess the external and internal quality of a software requirements profile, while the additive convolution method provides a transition from a set of related metrics to a single scalar value. In [
45], the expert assessment method is used to determine means of monitoring information security, where the weighting coefficients of system tools are formed based on priority coefficients and a composite indicator.
Vulnerability-oriented approaches aimed at assessing the security of software components also belong to the broader area of quantitative security assessment. In [
46], the general application vulnerability rate model is presented within the SAST methodology, where web application vulnerability risks are quantitatively assessed by taking into account CVSS 3.1 and exploitability probabilities.
Another study [
47] considers adaptive decision-making in deceptive multi-computer systems, where the selection of system actions takes into account previous operating experience, component security levels, system structure and interconnections. Its methodological advantage is that security-related information becomes an input to autonomous system adaptation rather than only a passive monitoring result. However, security assessment is used mainly to support system decision-making and is not developed as an independent hierarchical model of the corporate network security state. Study [
48] proposes a method for selecting the next centralization configuration using criteria of efficiency, stability, integrity and security, together with current-state indicators and previous operating experience. The approach connects quantitative characteristics of the system state with adaptive architectural decisions while reducing the need for exhaustive configuration search. Nevertheless, security remains one of several decision criteria rather than an independent multi-level network-security assessment. Study [
49] presents a quantitative methodology for evaluating system center configurations using analytically defined criteria of efficiency, stability, integrity and security mapped to a common numerical scale. The security component incorporates cybersecurity characteristics related to confidentiality, integrity and availability and allows component-level values to be aggregated. The approach provides formal quantitative integration of security and operational properties, but its assessment remains focused on architectural configuration selection rather than the overall security state of corporate-network nodes. Study [
50] addresses distributed malware detection in a multi-computer system, where heterogeneous evidence from different nodes and operating environments is jointly processed. The methodology combines code similarity characteristics with behavioral information, allowing distributed observations to contribute to a common security decision. Its advantage is improved detection of metamorphic malware, although the assessment remains specialized for malware detection rather than general quantitative evaluation of node and network security states. Study [
51] introduces characteristic indicators for quantitative assessment of security levels of components in partially centralized distributed systems. Heterogeneous qualitative and quantitative observations are transformed into comparable numerical values using analytical mappings, aggregation and correction factors, and the obtained results support system-level decision-making. The methodology provides an important basis for component-level quantitative assessment, but it does not form a standards-oriented CIA-based multi-level assessment of the complete corporate network.
Works [
47,
48,
49,
50,
51] provide a methodological basis for representing security-related properties of corporate network components quantitatively and using the obtained values in distributed detection, architectural adaptation and autonomous decision-making. However, these approaches remain task-specific and do not combine standards-oriented security indicators, explicit IOS and IOC separation, CIA-based hierarchical aggregation, node criticality and network-to-indicator diagnostic decomposition within a single assessment procedure. This gap motivates the development of the dedicated dual-channel multi-level security-assessment model proposed in this study.
Overall, the analysis of scientific works shows that current research offers a wide range of solutions for cybersecurity tasks, including adaptive distributed architectures, maturity- and readiness-oriented frameworks, quantitative and dynamic risk assessment models, probabilistic and fuzzy methodologies, domain-specific security evaluation schemes, and intelligent detection and SOC automation approaches. However, these directions mostly develop separately from one another and focus either on the architectural organization of systems, risk assessment, maturity and conformity verification, or threat detection and response. As a result, existing studies insufficiently represent approaches aimed specifically at the holistic quantitative assessment of the current state of data security in a corporate network, with the possibility of consistent analytical detailing of results and preservation of their practical interpretability. This determines the relevance of further research in the direction of formalized models for assessing the security of corporate networks.
Compared with works [
11,
12,
13,
14,
15,
16], the proposed model differs in its assessment objective and output structure. Maturity- and readiness-oriented frameworks mainly evaluate organizational preparedness, conformity or implementation maturity, whereas the proposed model produces current quantitative security-state scores for individual nodes and for the corporate network as a whole. In contrast to approaches that aggregate security characteristics into a single general score, the proposed model explicitly separates compliance-oriented indicators from compromise-oriented indicators and preserves this distinction during hierarchical aggregation. In addition, the model supports a diagnostic path from the network-level result to the affected node, CIA aspect and concrete indicator, which is essential for administrator-oriented interpretation of the assessment result. Thus, the contribution lies in a unified current-state assessment procedure rather than in a general maturity, conformity or risk-scoring framework. More specifically, the reviewed approaches [
11,
12,
13,
14,
15,
16] do not jointly provide, within a single current-state assessment procedure, the semantic separation of IOS and IOC evidence, hierarchical indicator-to-CIA-to-node-to-network aggregation with node-criticality weighting, and a deterministic drill-down path from the network-level output to the individual indicator responsible for degradation. The integration of these capabilities within one formalized assessment pipeline constitutes the specific contribution of the proposed model.
Direct numerical benchmarking against existing Bayesian, probabilistic, maturity-oriented or ML-driven cybersecurity frameworks is methodologically limited because these approaches usually optimize different target variables, such as attack probability, exploit likelihood, vulnerability severity, maturity level or detection accuracy. In contrast, the proposed model produces interpretable dual-channel multi-level security-state scores for nodes and the whole corporate network. Therefore, the experimental comparison in this study is organized as an ablation-style baseline comparison, where the proposed multiplicative channel integration is compared with simplified direct channel averaging under the same input data, indicators, weights, and scenario.
To further clarify the positioning of the proposed model with respect to representative assessment paradigms,
Table 1 provides a qualitative point-to-point comparison. The comparison focuses not on identical numerical outputs, which are difficult to obtain across heterogeneous frameworks, but on the functional properties that are central to the objective of this study: separation of compliance and compromise indicators, hierarchical aggregation, node criticality weighting, drill-down capability and resistance to masking effects during channel integration at the node-level.
As shown in
Table 1, the novelty of the proposed model does not lie in the isolated use of CIA aspects, weighting coefficients or normalized indicators, since these elements may appear in different forms in existing studies. The contribution lies in their integration into a unified dual-channel multi-level assessment procedure that simultaneously preserves the semantic distinction between compliance-related and compromise-related indicators, supports hierarchical aggregation from indicators to the network level, accounts for node criticality and enables analytical drill-down to the sources of degradation.
3. Methods and Materials
3.1. Conceptual Overview of the Model
A corporate network includes heterogeneous nodes and observation sources, while the features that characterize its security state may differ in physical nature, verification criteria, and influence on confidentiality, integrity and availability (CIA) aspects. Therefore, the assessment of data security can be formalized as the construction of normalized quantitative indicators aligned with international cybersecurity standards and aggregated from the indicator level to the level of the entire corporate network. In this article, the proposed model is considered as a mathematical and analytical core of a decision-support system for system administrators and SOC specialists.
The generalized model for the quantitative assessment of data security in a corporate network is represented as the following tuple
:
where
is the set of network nodes of the corporate network,
is the set of indicators used to assess the level of data security,
is the set of information security aspects,
is the set of observation vectors,
is the set of normalization functions,
is the set of constraint parameter vectors,
is the vector of normalized weighting coefficients used to determine the overall priorities of CIA information security aspects,
is the vector of normalized weighting coefficients representing the criticality of corporate network nodes, and
is the set of weighting coefficients that describe the influence of indicators on the main aspects of the CIA triad.
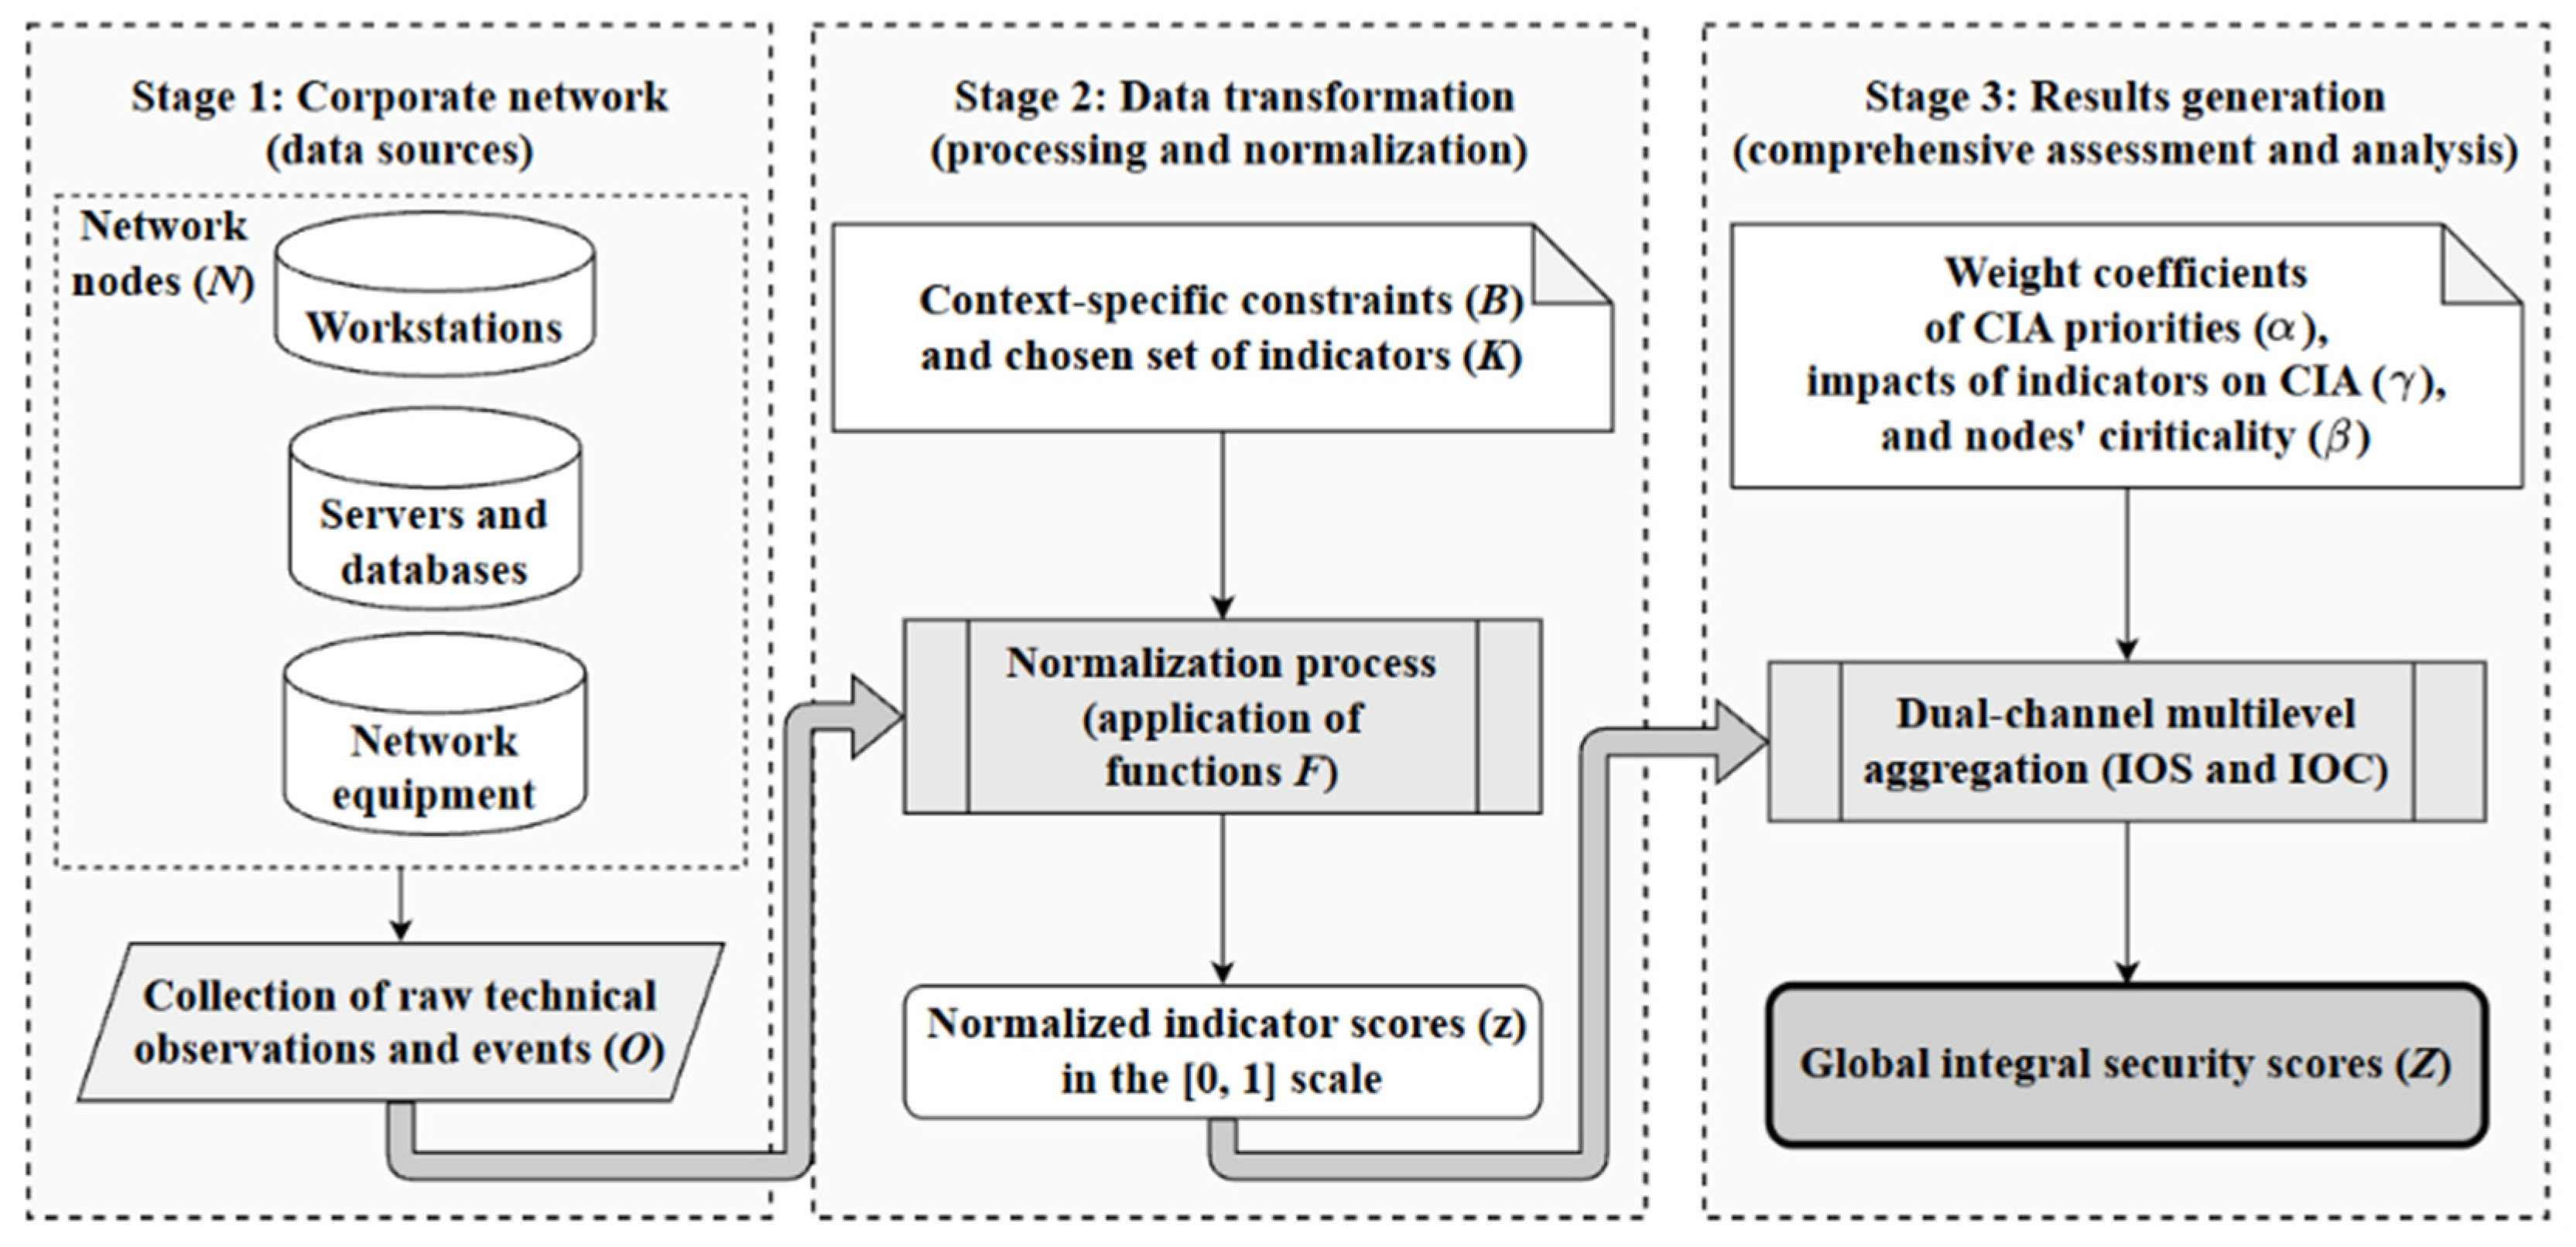
For a better understanding of the general logic of the proposed model, the conceptual scheme of the quantitative assessment process is shown in
Figure 1.
The proposed architecture reflects the general path of information transformation and conceptually divides this process into three interrelated stages. At the first stage, raw technical observations and security events are collected from the elements of the corporate network. Since the collected data are heterogeneous and of different natures, they cannot be compared directly. Therefore, in the second stage, these data are transformed through mathematical normalization. Taking into account constraints determined by corporate security policies, raw observations are converted into a unified format of standardized scores on a common scale. At the third stage, comprehensive assessment is performed; using weighting coefficients, global and interpretable security metrics are generated, allowing specialists to objectively analyze the network state and make justified management decisions.
3.2. Weighting Parameters and Assessment Objects
After the formal definition of the model tuple, it is necessary to detail the objects involved in the assessment process. Within the proposed model, one of these objects is represented by the nodes of a corporate network, on which data collection tools may be deployed and security assessment indicators may be calculated. Let the set of corporate network nodes
be denoted as follows:
where
is the
-th node of the corporate network, and
is the total number of nodes in the corporate network.
For each node, a criticality score is assigned on a 100-point scale. This score may take into account the role of the node in the network topology, its privilege level, the class of data stored or processed on it, and the possible impact of its compromise on the organization’s business processes. For further network-level aggregation, these scores are normalized into a vector of weighting coefficients
:
where
is the
-th normalized weighting coefficient of node importance,
is the
-th criticality score of the node
, and
is the total number of criticality scores, which corresponds to the number of corporate network nodes participating in the assessment process.
To account for organizational priorities, the set of aspects
is introduced, corresponding to confidentiality, integrity and availability. Primary scores of CIA aspect priority are assigned on a 10-point scale and normalized as follows:
where
is the normalized weighting coefficient of the importance of aspect
,
, and
is the importance score assigned to aspect
;
,
and
are scores for confidentiality, integrity and availability within the
scale.
3.3. Indicator System and Standards Alignment
Let
denote the general set of all indicators used within the corporate network:
where
is the
-th indicator, and
is the total number of indicators used for the quantitative assessment of the security state.
The set
defines a fixed composition of measurable characteristics that can be mapped to control requirements of international cybersecurity standards. To improve the transparency and correctness of result interpretation, indicators should be divided into types according to their semantic purpose. Within the proposed model, two conceptual groups of indicators are introduced, reflecting different aspects of the system security state. Let
denote the set of indicators that characterize the implementation of protective mechanisms and the current state of compliance with security policies, and let
denote the set of indicators that characterize the presence of signs of undesirable activity or compromise:
It is important to note that the condition is met. At the same time, the statement is also true. Thus, each indicator belongs to exactly one of the two assessment channels.
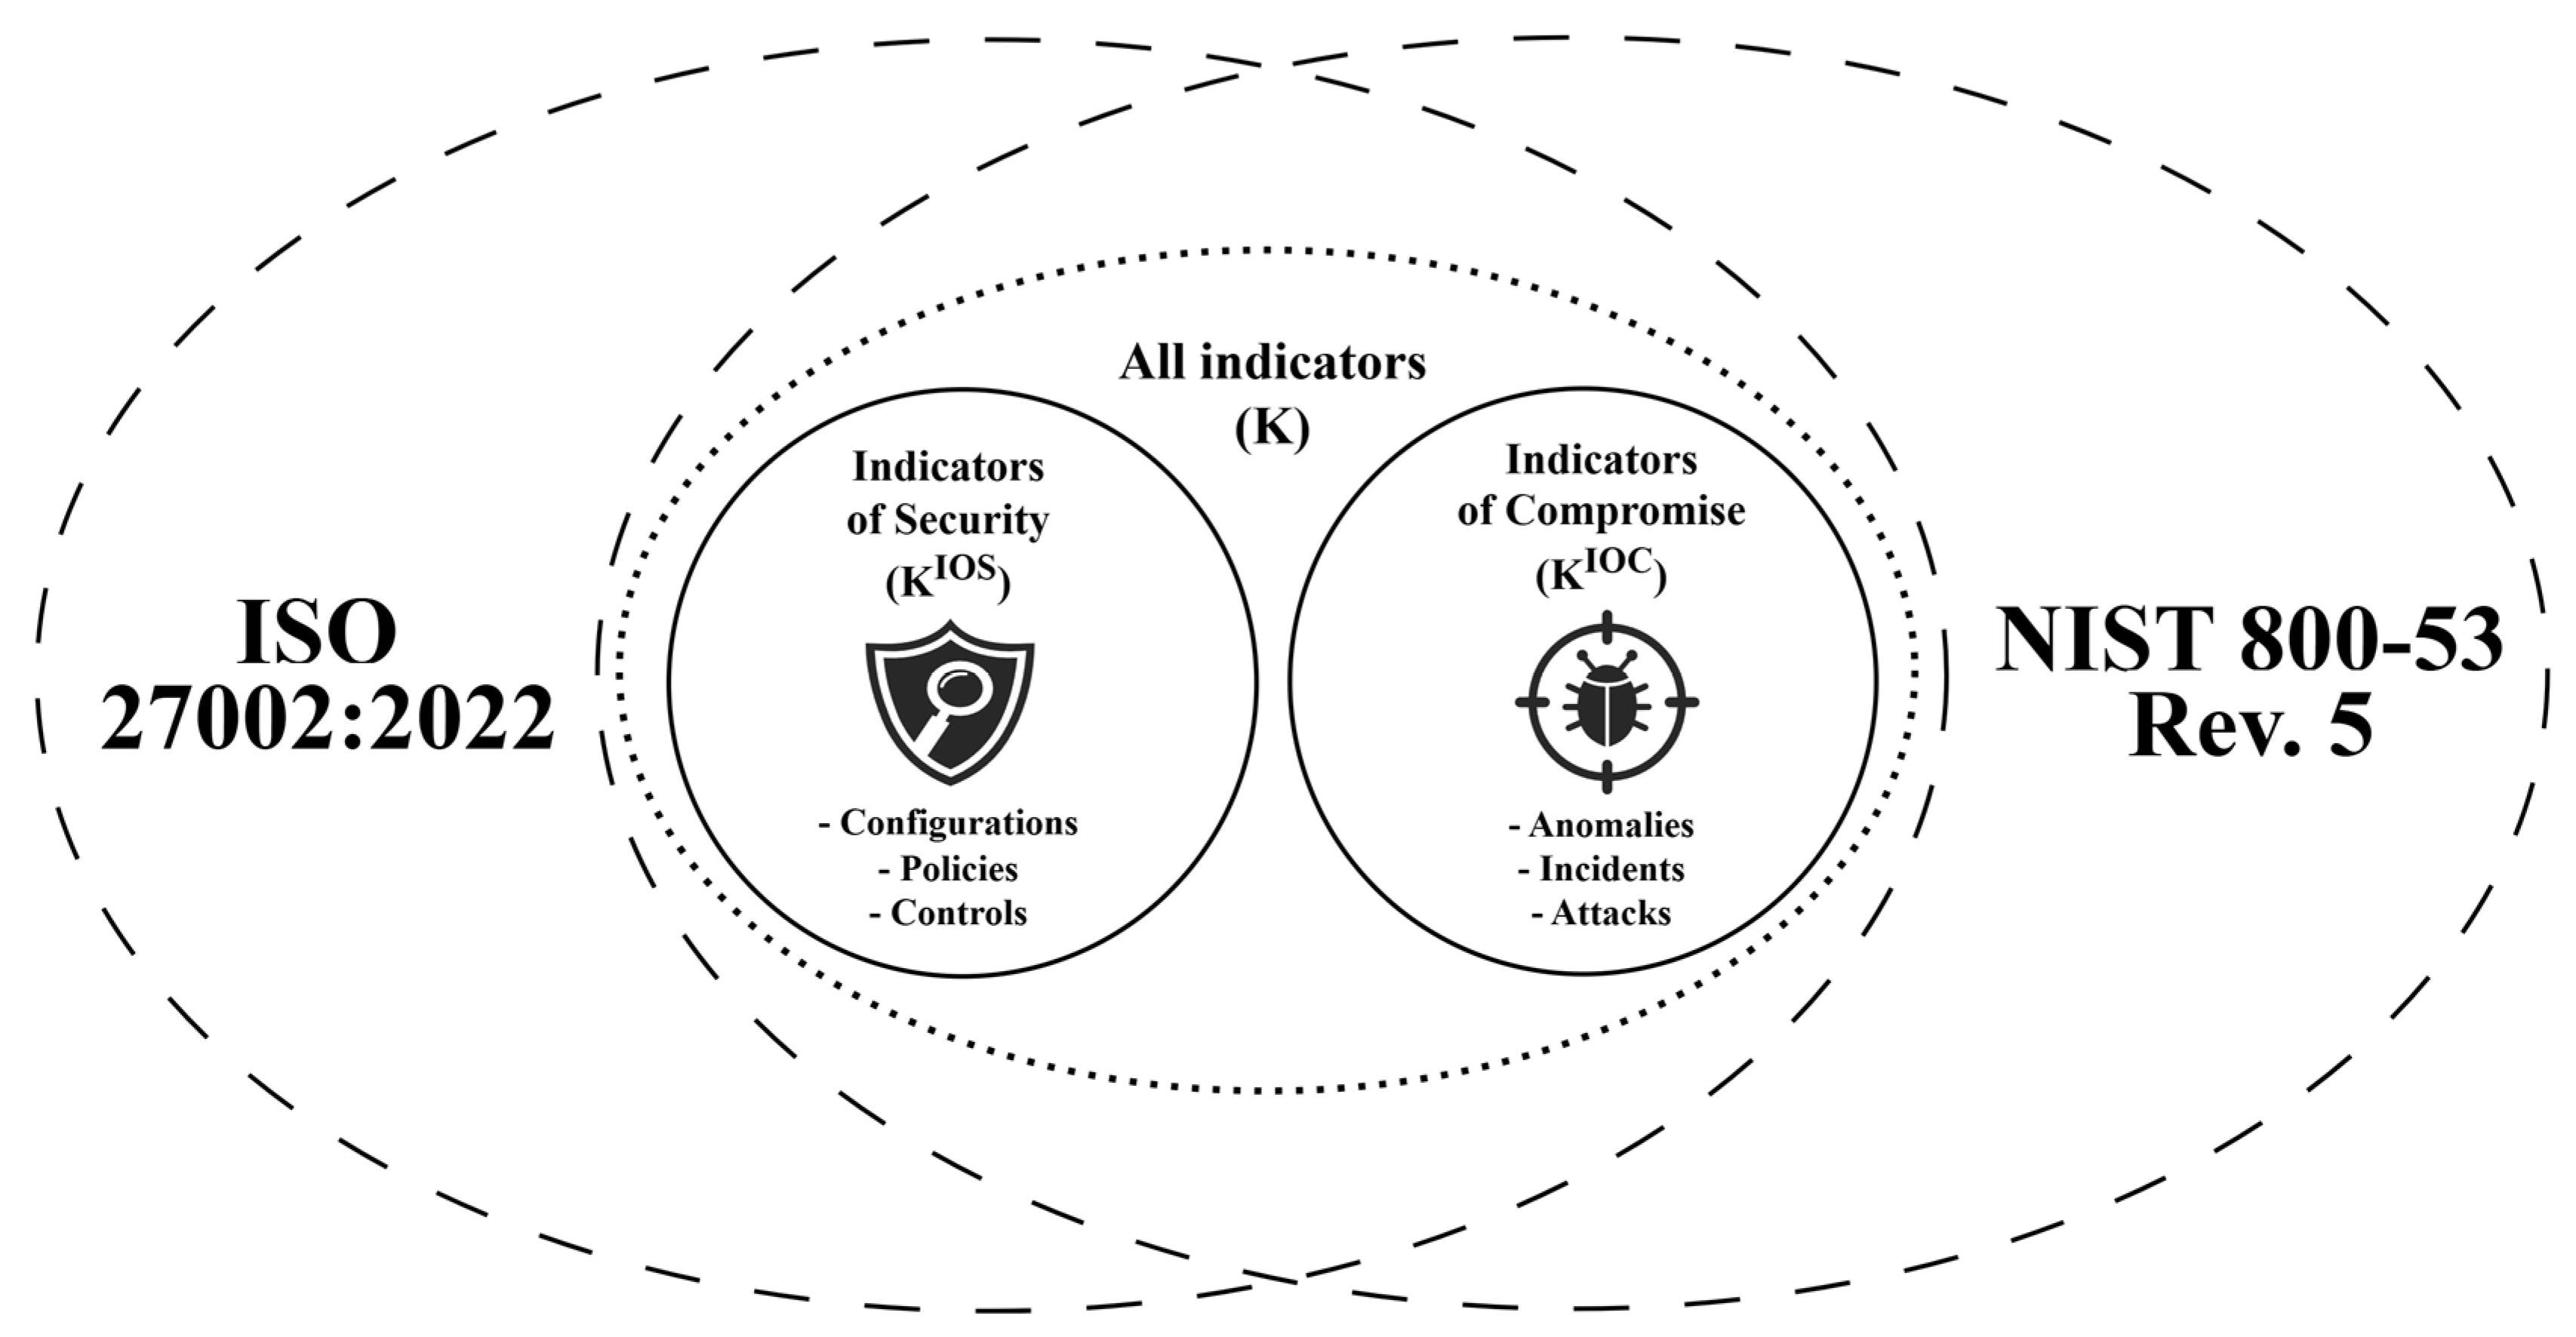
Security indicators reflect the state of implementation of protective mechanisms, compliance with security policies and fulfillment of control requirements. They have a normative-oriented nature and characterize the baseline level of system protection regardless of whether current signs of an attack are observed. In contrast, compromise indicators have an event-oriented nature and reflect the presence or absence of anomalous, undesirable or potentially malicious activity. This division makes it possible to separately analyze the state of implemented protective mechanisms and signs of possible compromise.
Within the model, indicators are interpreted as operationalized features that can be mapped to control requirements and practices defined in ISO/IEC 27002:2022 and NIST SP 800-53 Rev. 5. As a result, the indicator catalog is not arbitrary but has a normative basis and can be used for the quantitative assessment of the security state of a corporate network. A generalized representation of the IOS and IOC channels, as well as their relationship with international information security standards, is shown in
Figure 2.
To ensure the interpretability of the results, it is necessary to formally define how each indicator affects confidentiality, integrity and availability. Since the same indicator may have different significance for different CIA aspects, a matrix of primary indicator impact scores
is introduced:
where
is a score of the impact level of indicator
on information security aspect
, and
is the total number of indicators involved in the data security assessment process.
Since different subsets of indicators may be applicable to different nodes, the primary scores
are not used directly but are normalized separately for each node, aspect and assessment channel. Let
denote the assessment channel, and let
be the set of indicators of channel
applicable to node
. Then, the normalized weighting coefficient of the influence of indicator
on aspect
within channel
is defined as follows:
After normalization, for each node
, aspect
and channel
, the following condition is satisfied:
As a result of normalization, for each node and each aspect, the corresponding sets of coefficients and are formed. These coefficients constitute the general set of weighting coefficients , describing the influence of indicators on the CIA information security aspects.
The main weighting and calibration parameters of the model are configurable baseline parameters used for interpretable aggregation. In practical deployment, if weighting parameters are obtained from human experts, the consistency of expert judgments should be assessed using an inter-rater agreement statistic, such as Kendall’s coefficient of concordance. If the agreement level is insufficient, the scoring procedure should be repeated after discussions of divergent scores and clarification of the evaluation criteria. In the present proof-of-concept experiment, however, the weighting values are scenario-defined and are not treated as empirical expert judgments. These parameters include node criticality weights, CIA aspect priority weights, indicator impact weights and normalization-function parameters. However, they should not be interpreted as fixed constants. In practical deployment, node criticality weights may be updated when asset roles, business importance, privilege levels, service dependencies, topology metrics, or observed node behavior change. CIA priority weights may be revised when organizational priorities or regulatory requirements change, while indicator impact weights and normalization parameters may be recalibrated when the indicator set is extended, new node types are introduced or historical telemetry and incident analysis provide additional evidence. Thus, the proposed model supports periodic or event-triggered parameter updates without changing the general mathematical aggregation structure.
For further quantitative assessment, it is necessary to formalize two types of input data: primary observations that characterize the state of nodes and constraint parameters that define the context for interpreting these observations. For each applicable indicator
on a node
, a vector of primary observations
is introduced:
where
is the observed value of indicator
on node
,
is the total number of nodes in the corporate network,
is the total number of indicators involved in the data security assessment process, and
is the number of observed values in the observation vector of indicator
on node
.
Since the same observed value may have different interpretations depending on the node role, security policies and corporate context, a vector of constraint parameters
is additionally defined for each applicable indicator
on a node
:
where
is the
-th value of the constraint parameter vector for indicator
on node
,
is the total number of nodes in the corporate network,
is the total number of indicators involved in the data security assessment process, and
is the number of values in the constraint parameter vector of indicator
on node
.
3.4. Normalization Procedure
In a real corporate network, the security state is analyzed not by a single metric but by a large number of components of different origins. If such values are directly added or compared, the resulting assessment will be mathematically incorrect and inconsistent. Therefore, the model introduces a general mechanism that transforms each observed value of a given criterion into a normalized indicator score on a unified scale
. This transformation is performed using normalization functions
:
where
is the
-th normalization function, and
is the total number of normalization functions.
The defined normalization functions provide a transition from observation vectors to normalized values that belong to a common dimensionless interval
. These normalized values can then be correctly aggregated without exceeding the defined interval. In addition, normalization acts as a formalized representation of policy logic, where the constraint parameter vectors define the context of acceptability and threshold conditions, which may differ depending on the node type and organizational requirements. Through normalization functions, the specific values of
and
are transformed into quantitative indicator scores
on a unified scale
:
The physical meaning of the output score can be interpreted as follows: a score of 1 indicates perfect fulfillment of security policy requirements or the complete absence of signs of compromise; a score of 0 indicates a critical vulnerability, the complete absence of a required protective mechanism or confirmation of signs of potential compromise; intermediate values represent partial degradation of the security state or an increase in suspicious activity that requires additional attention. It is important to emphasize that the set of functions is not rigidly fixed. If new types of indicators appear or an organization introduces specific requirements for interpreting observations, this set can be extended with additional functions without changing the general mathematical structure of the model. The basic functions of the set , used in the current version of the model, are described below.
The parameters of normalization functions, including thresholds, boundary values, half-life parameters, inflection points and steepness coefficients, are context-dependent and should be derived from a combination of security policies, regulatory requirements, historical operational data and incident analysis. For policy-based indicators, threshold values may be directly obtained from internal security requirements or standard operating procedures. For event-based indicators, such as failed authentication attempts or abnormal network connections, parameter values may be calibrated using historical telemetry, baseline behavior of similar nodes, or previously observed incident patterns. In the absence of sufficient historical data, context-specific values can be used as an initial configuration, followed by periodic recalibration as more operational data become available. Therefore, the proposed model treats normalization parameters not as universal constants, but as configurable context-specific values.
Binary normalization is used in situations where an observation is naturally described as the fulfillment or non-fulfillment of a specific condition. Formally, the binary normalization function
is defined as follows:
where
is the observed value, and
is the reference value considered correct from the perspective of a security requirement or policy,
,
.
The threshold step normalization function with an upper limit is used when a security policy defines a strict admissibility boundary: The indicator value is considered acceptable as long as it does not exceed the specified threshold and critically unacceptable after exceeding it. Formally, the threshold step normalization function with an upper limit
is defined as follows:
where
is the observed value, and
is the constraint value that specifies the maximum permissible limit.
Similarly, the threshold step normalization function with a lower limit corresponds to situations where a security policy is formulated as a minimum mandatory requirement, meaning that the indicator is considered acceptable only when it is not lower than the specified reference value. The threshold step normalization function with a lower limit
is defined as follows:
Threshold step functions are convenient when a policy defines a strict acceptability boundary. However, in many practical cases, it is useful to represent not only the binary fact of acceptable or unacceptable but also a continuous degree of compliance with the requirement. The linear decreasing function with saturation
is intended for such cases and is defined as follows:
where
is the observed value,
is the tolerance threshold up to which the deviation is considered acceptable, and
is the critical threshold after which the state is considered unacceptable,
.
Linear decreasing normalization is simple and easy to interpret, but it does not always adequately represent the nature of security degradation. For a number of cybersecurity indicators, the effect of aging or risk accumulation is nonlinear, so the first days or periods may have only a minor influence, while later degradation becomes more significant. Exponential normalization allows such nonlinear behavior to be modeled by controlling the rate of decrease. The exponential decreasing normalization function
is defined as follows:
where
is the observed value,
is the decreasing rate parameter defined according to internal security policies, and
is the mathematical constant corresponding to Euler’s number.
To improve interpretability and make practical configuration easier for system administrators, in this model, the abstract coefficient
is defined through the half-life parameter
. This parameter has a direct physical meaning, as it denotes the observed value at which the security score decreases by half. Therefore,
can be obtained as follows:
where
is the time or value at which the score decreases to 0.5.
Taking (19) into account, the exponential normalization function can be written in its final form for the proposed model:
In some cases, security degradation is neither linear nor immediately exponential but has a clearly expressed S-shaped dynamic: At first, the observed indicator changes slowly; then, the score drops rapidly near the critical threshold, and finally, the score asymptotically approaches zero. To model such smooth threshold transitions, the decreasing sigmoid logistic normalization function
is used:
where
is the observed value,
is the mathematical constant corresponding to Euler’s number,
is the inflection point at which the score equals 0.5, and
is the steepness coefficient that determines how sharply the transition from 1 to 0 occurs near
.
In information security management practice, some indicators have a categorical ordinal nature rather than a numerical one. Such indicators are characterized by a finite set of possible states, each corresponding to a different risk level. In such cases, the appropriate approach is to map each category to a predefined value on the
scale. This ensures interpretability and makes it possible to formally define correspondence scales. The discrete multi-level normalization function provides a direct mapping of elements of a finite set to the corresponding normalized scores. Let
be a finite set of admissible categories or states of the observed value
, and let
be the context-defined mapping:
Then, the discrete multi-level normalization function
is defined as follows:
where
is the observed value, and
is the context-defined mapping that assigns a normalized security score to each state,
.
If , the function returns a penalty value, which is usually equal to 0. The score is determined solely by context-defined judgment encoded in the mapping . If belongs to a safer or more desirable class, it is assigned a higher value from the interval . If it belongs to a less desirable class, it is assigned a lower value. The number of levels and their values are defined so as to preserve the interpretability of the scale: 1 corresponds to full compliance with requirements, 0 corresponds to complete non-compliance, and intermediate values correspond to partial or conditionally acceptable states.
For some indicators, the interpretation is not monotonic. This means that both too small and too large values may be undesirable, while the best state corresponds to a certain interval. For such situations, the trapezoidal normalization function
is used. It formalizes the concept of an optimal interval and gradual degradation when moving away from it and is calculated as
where
is the observed value, and
is a tuple of constraint parameters that define the corresponding intervals for the observed value,
.
A separate group includes cases where an indicator is determined not by a single object or value but by a set of controlled elements. In such cases, violation of only one element may be sufficient for the entire indicator to receive an unacceptable score. The conjunctive binary normalization function
is used when the security policy requires a condition to be satisfied for all elements of a set and is defined as follows:
where
is the observation vector,
is the vector of constraint values for the elements of
,
is the total number of elements involved in calculating a particular indicator score,
is the constraint value for observation value
, and
,
is the binary normalization function used to assess the compliance of each element.
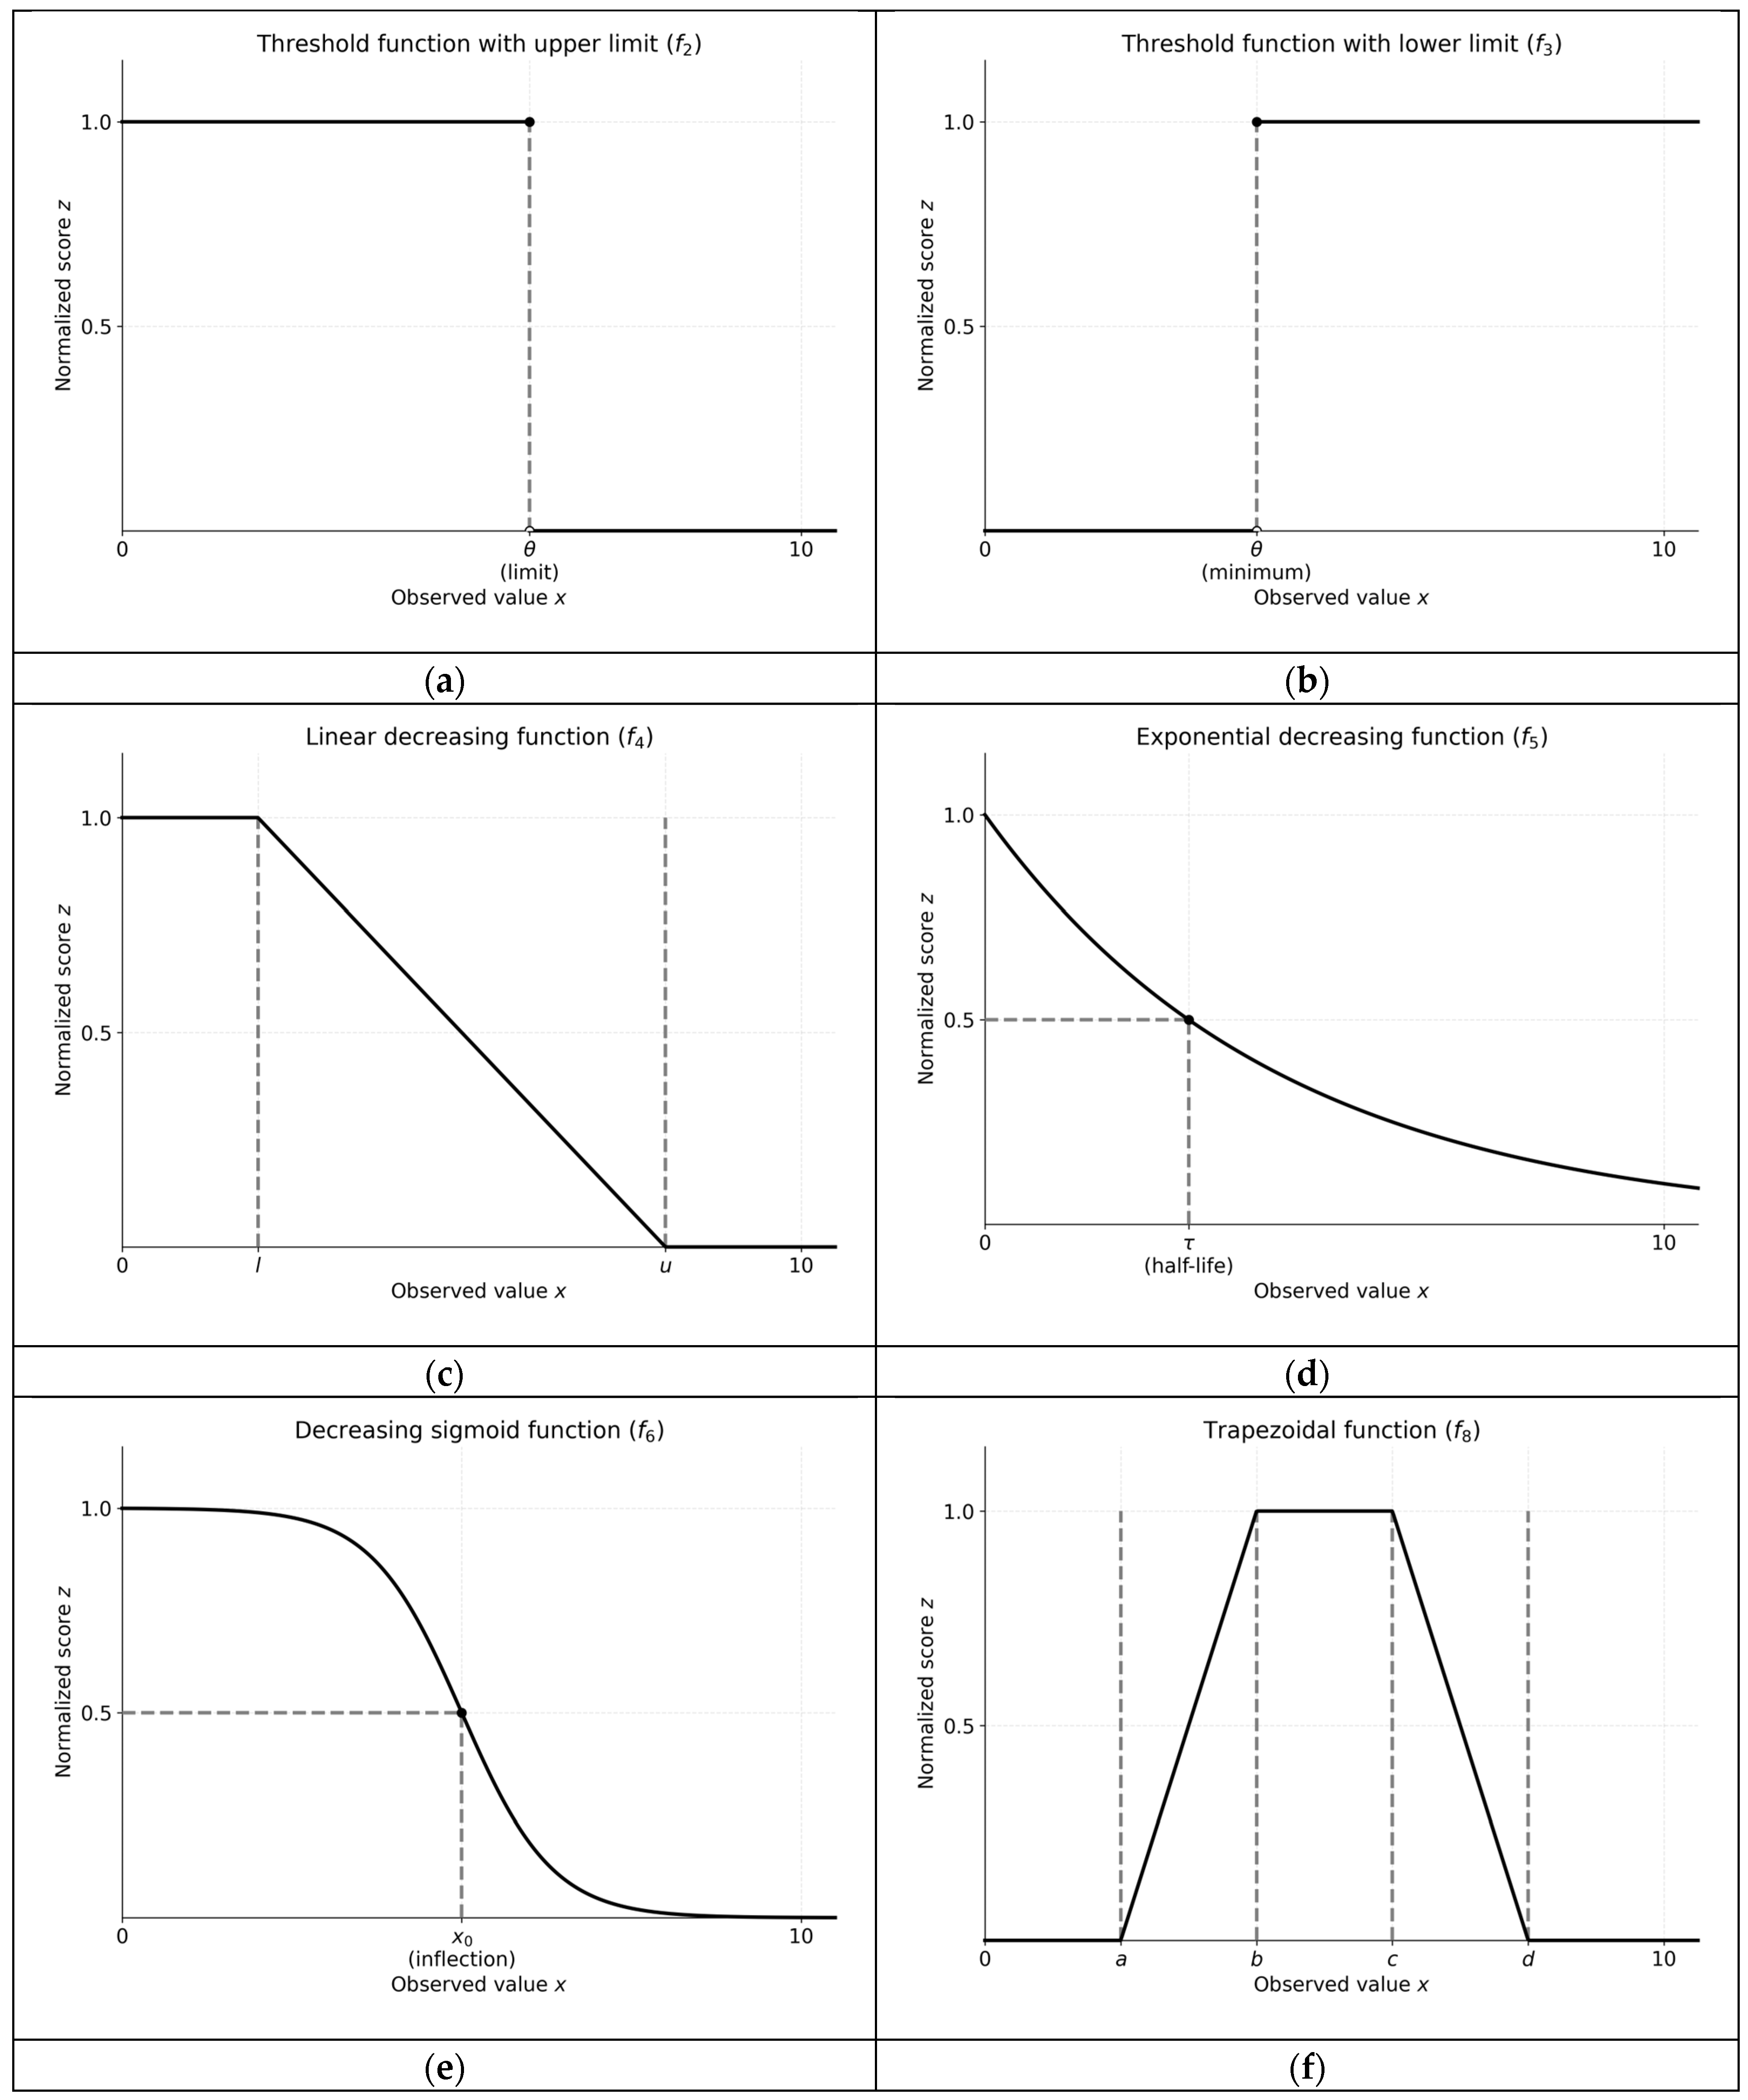
Figure 3 presents graphs of several normalization functions used in the proposed model.
In the proposed model, indicators are considered formalized measurable characteristics that reflect either the implementation of information security requirements or the manifestation of undesirable events in the corporate environment and on its target nodes. Their purpose is to transform qualitative requirements and control practices into an operationally observable form suitable for further mathematical processing and meaningful analysis by cybersecurity specialists. In this context, an indicator is not an abstract statement about the presence of security but a specific criterion based on a certain observation in the system and formalized conditions for its interpretation. This ensures the reproducibility of assessment. It means that for the same input data and the same interpretation parameters, the model produces the same output values. It should be noted that the set of indicators used in the current version of the model is not universally fixed for all possible environments. Corporate networks may contain different types of nodes, roles and operating modes, which affect both the availability of particular observations and the correct boundaries for their interpretation. If necessary, the current indicator set can be modified or extended with additional indicators according to the characteristics of a particular organization.
For further use of the model, all considered indicators are summarized in
Table 2. The table shows their division by assessment channels, the selected normalization function templates used to calculate their scores and their correspondence to basic control requirements of international cybersecurity standards.
The set of 12 indicators used in the current version of the model should be interpreted as a representative experimental subset rather than an exhaustive catalog of all possible ISO/IEC 27002:2022 or NIST SP 800-53 controls. The indicators were selected according to the following criteria: availability of measurable observations in a typical corporate network; applicability to common endpoint and server nodes; clear interpretation in the [0, 1] scale; coverage of both compliance-oriented and compromise-oriented assessment channels; relevance to CIA aspects; the possibility of mapping to widely used international cybersecurity controls. Therefore, the selected indicators are sufficient for demonstrating the operation of the proposed model, while the model itself allows the indicator set to be extended depending on organizational requirements and available telemetry.
3.5. Multi-Level Aggregation Procedure
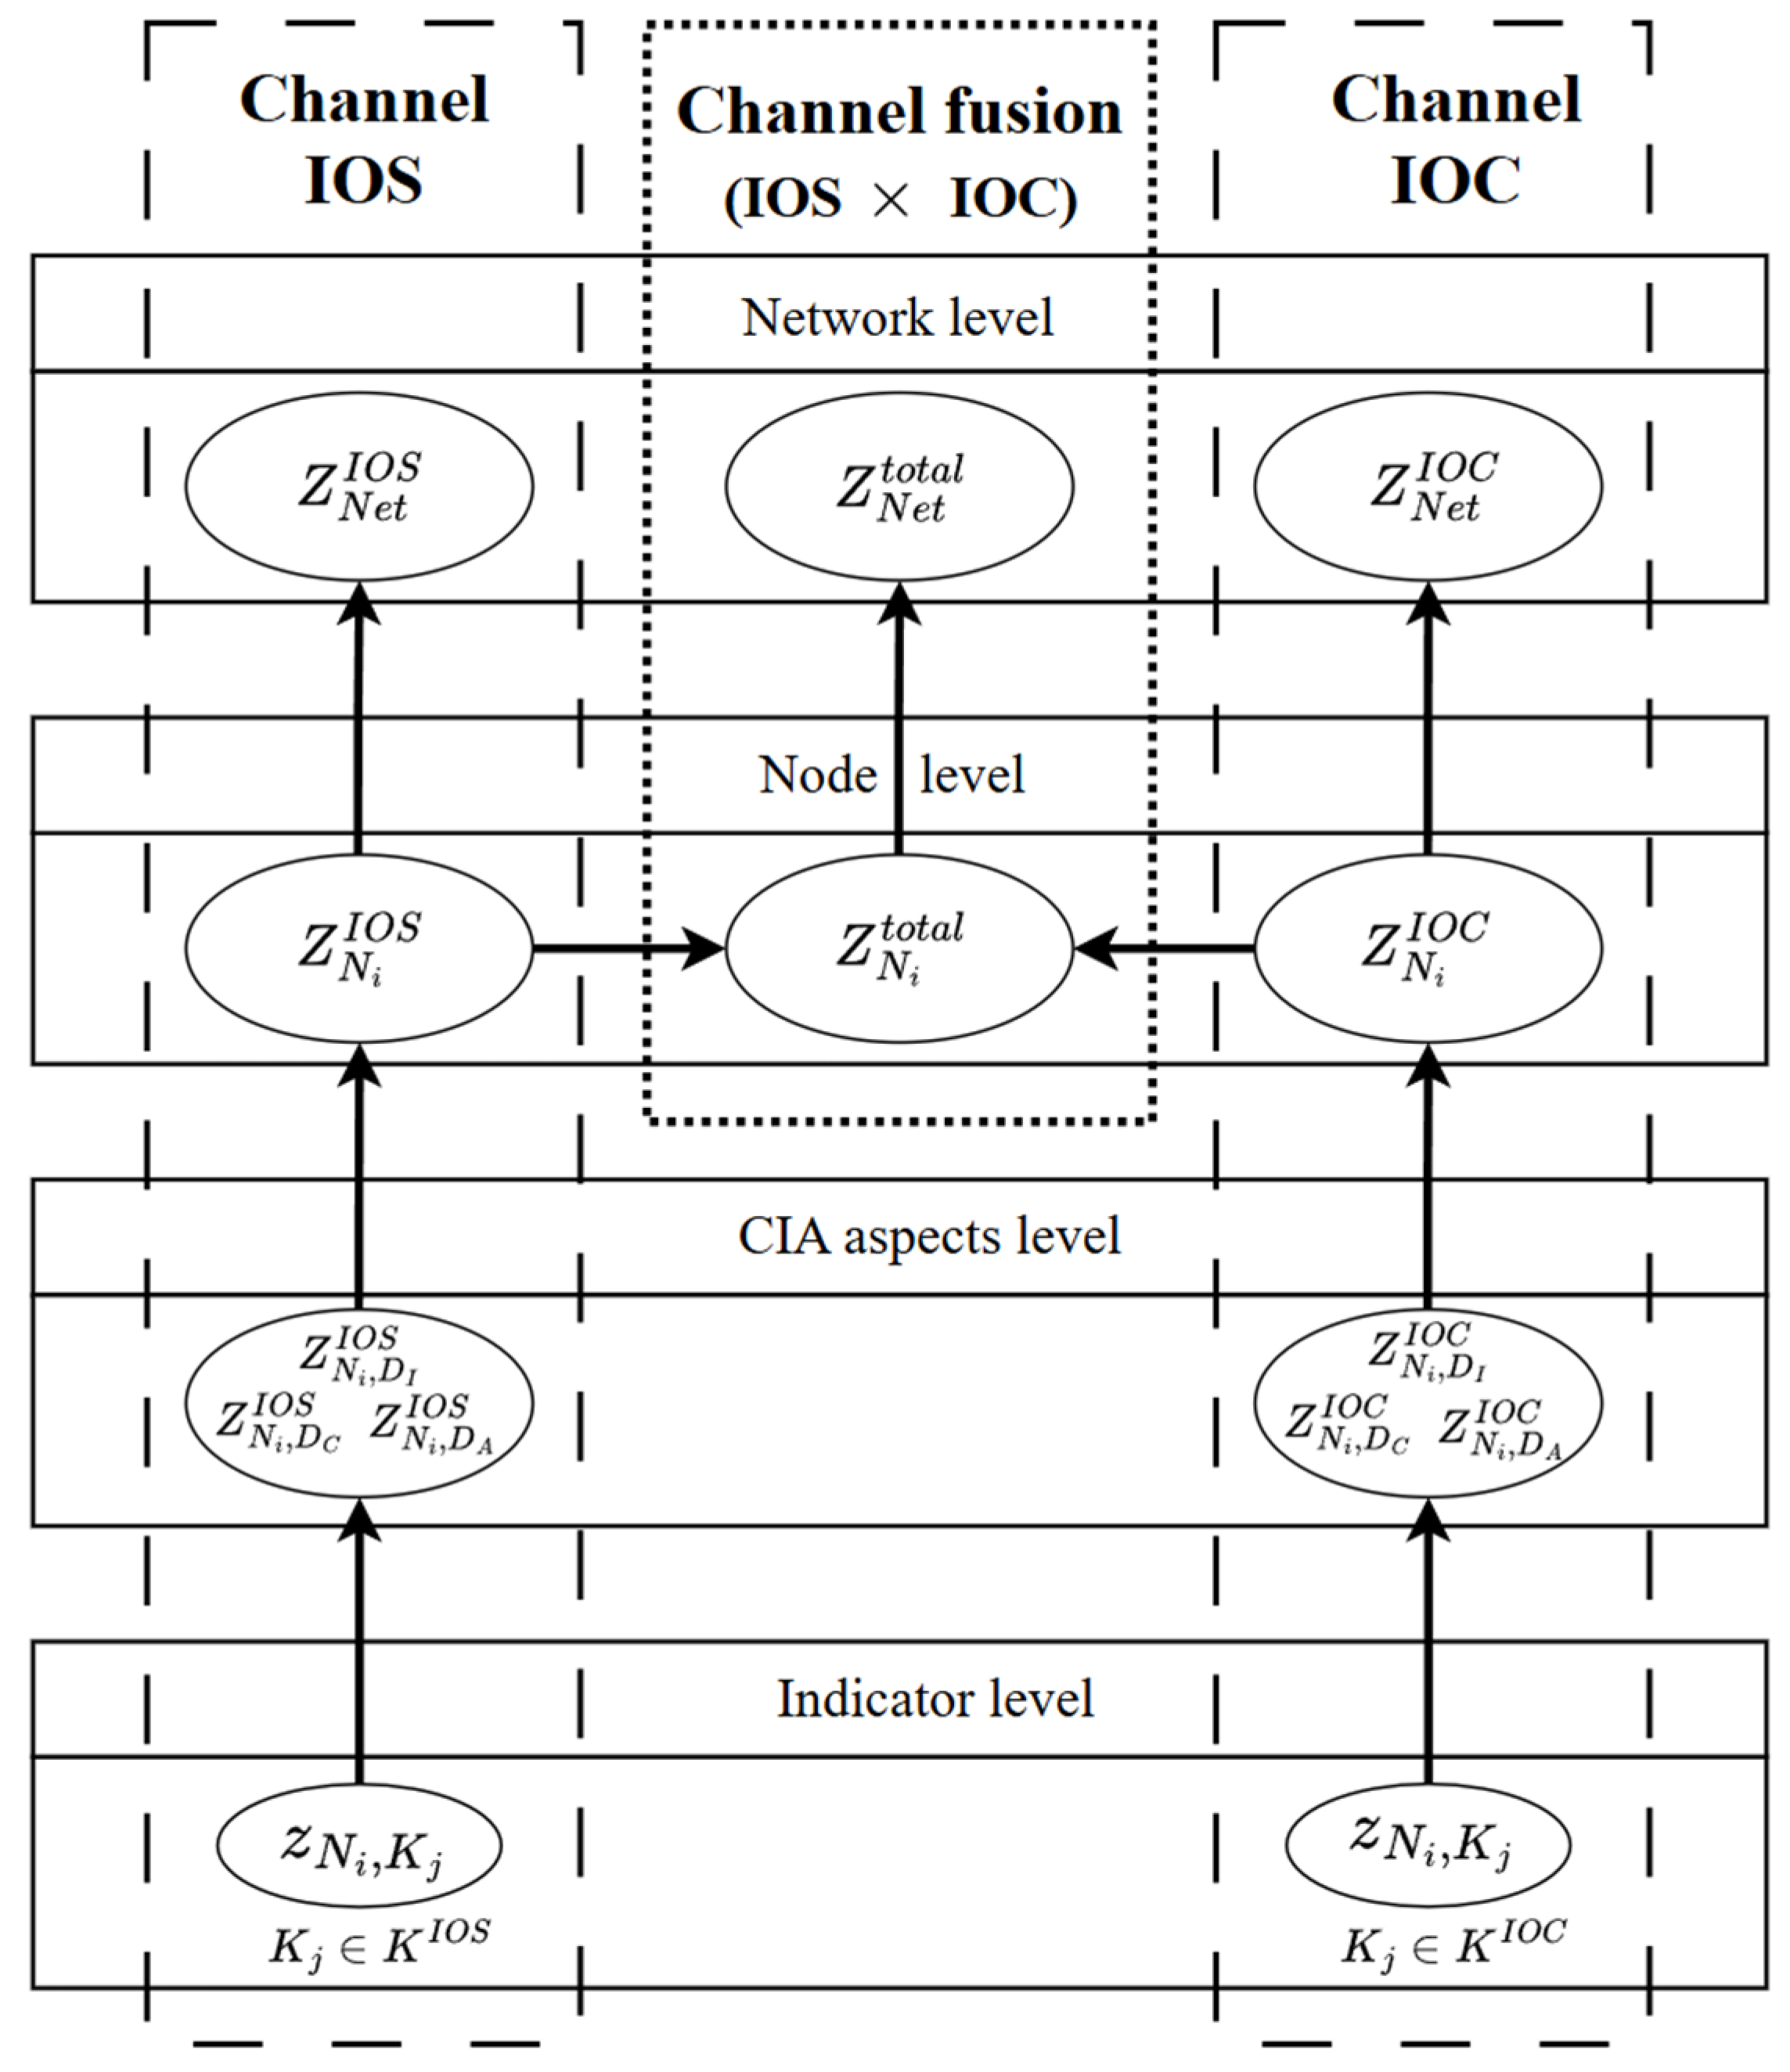
After presenting the list of selected indicators and introducing the equations for calculating all normalization functions, including (14)–(17), (20)–(21) and (22)–(25), the task arises of further generalizing these scores to the levels of nodes and the entire corporate network. For this purpose, the model uses dual-channel multi-level aggregation, which preserves the separation of two analytical channels: IOS, which reflects the level of compliance with security requirements, policies and controls, and IOC, which characterizes the absence or presence of signs of potential compromise.
Unlike the direct averaging of all indicators into a single general score, the proposed approach does not mix different semantic reasons for the degradation of the security state. The scores are first formed separately within the IOS and IOC channels and then aggregated at the level of CIA aspects, followed by aggregation at the level of individual nodes, and only after are they transferred to the network level. Such logic makes it possible not only to obtain an integral assessment of the corporate network state but also to preserve the possibility of further analytical detailing of the result down to a specific channel, node, aspect and indicator.
To keep the results understandable and suitable for interpretation, the assessment process is performed sequentially at several levels. For this purpose, a four-level assessment scheme is used, progressing from the lowest to the highest level and including the indicator level, CIA aspect level, node level and network level. This hierarchical approach enables end-to-end analytics, in which a system administrator can observe the global network score and, if it decreases, drill down to a specific node, then to the vulnerable CIA aspect, and finally identify the root cause in the form of a particular indicator. To provide a clearer visualization of the dual-channel multi-level aggregation process during assessment, the corresponding structural scheme is shown in
Figure 4.
According to
Figure 4, the model forms three groups of generalized scores: IOS channel scores, IOC channel scores and integral dual-channel scores. At the network level, these scores take into account the criticality of individual nodes using the normalized weighting coefficients (3). This makes it possible to reflect the greater influence of critical nodes on the overall state of the corporate network and to avoid a disproportionate influence of less significant nodes. Accordingly, the network-level scores
,
and
are defined as follows:
where
is the
-th normalized weighting coefficient of the importance of node
,
is the total number of nodes in the corporate network,
is the score of compliance with security requirements and policies for node
,
is the score of absence of signs of compromise on node
, and
is the integral dual-channel security score of node
.
The normalized node-criticality vector gives higher-criticality nodes proportionally greater influence on the network-level scores. However, because network-level aggregation is implemented as a weighted arithmetic mean, this weighting does not guarantee that degradation of a single critical node dominates degradation distributed across multiple nodes.
To obtain the node-level scores used in Equations (26)–(28), it is necessary to aggregate the intermediate scores across the three basic information security aspects of the CIA triad, namely confidentiality
, integrity
and availability
. At this stage, the vector of normalized weighting coefficients
is applied, reflecting the priority of each aspect according to the business model and requirements of the organization. Accordingly, the score of compliance with security requirements and policies
for node
, as well as the score of absence of signs of compromise
on node
, can be calculated using the following equations:
where
is the normalized weighting coefficient of the importance of the corresponding information security aspect
,
is the score of compliance with security requirements and policies for CIA aspect
on node
, and
is the score of absence of signs of compromise for aspect
on node
,
.
An integral dual-channel node score
is introduced separately, combining the results of the two channels. It is at the level of a specific node, where the key stage of combining the two parallel assessment channels takes place. Reliable protection of an information system requires the simultaneous fulfillment of two independent conditions: The system must be properly configured, which is reflected by the IOS channel, and at the same time, it must not be under active attack, which is reflected by the IOC channel. To implement this strict security logic, a multiplicative composition is applied using the following equation:
where
is the score of compliance with security requirements and policies for node
, and
is the score of absence of signs of compromise on node
.
This mathematical operation forms a critical property of the entire model: If a successful compromise is detected on a node and the corresponding score decreases significantly , the overall integral score of this node also immediately decreases or, in the limiting case, becomes zero. At the same time, if the security configuration is insufficient or security policies are violated, the low score also reduces the final node-level score. Thus, the multiplicative combination prevents one high channel score from compensating for a critical degradation in the other channel.
The basic level of aggregation consists of forming aspect-level scores for each node in the IOS and IOC channels. The calculation procedure is performed in parallel for the two channels and separately for the two subsets of indicators,
and
. Accordingly, the aspect-level scores for compliance with security requirements and policies and for the absence of signs of compromise for a specific information security aspect are obtained as follows:
where
is the weighting coefficient of the influence of a security indicator
on a specific information security aspect on node
,
is the weighting coefficient of the influence of a compromise indicator
on a specific information security aspect on node
, and
is the score of indicator
on node
,
.
A separate case must also be considered when, for a certain node, none of the applicable indicators has an influence on a specific CIA information security aspect or when there are no applicable indicators for this aspect. In this situation, the denominator in the normalization Equation (8) becomes zero and therefore the weighting coefficients
or
cannot be determined. To preserve the computability of the model and avoid changing the aggregation structure, the aspect-level score in this case is set equal to one as a neutral value. Therefore, the next condition is true:
where
is the
-th aspect-level score for channel
on node
, and
is the impact score of indicator
on information security aspect
,
.
To avoid confusing a computational neutral value with confirmed security evidence, the model should additionally report assessment coverage. For each node
, channel
and aspect
, let the binary coverage indicator
be defined as
The overall channel coverage
for node
and channel
can be expressed as
The value means that at least one applicable indicator with non-zero impact is available for the corresponding aspect and channel, while means that the aspect is not covered by applicable indicators. The value characterizes the assessment coverage of channel for node , taking into account the CIA aspect weights .
Thus, the value assigned in Equation (34) should not be interpreted independently from the coverage value. A node or aspect with missing applicable indicators must be reported as having limited assessment coverage, even if the computational aggregation requires a neutral placeholder. This makes it possible to distinguish between a truly high score supported by monitoring evidence and a high score obtained because a corresponding aspect was not assessed.
By substituting the developed score Equations (29)–(33) into (26), an expanded form of the integral dual-channel security assessment of the corporate network
can be obtained:
The obtained formalized expression (37) summarizes the proposed assessment logic and shows that the procedure is not only computationally feasible but also convenient for practical analysis of the security state in a corporate network.
4. Experimental Results
4.1. Experimental Design and Simulation Setup
To evaluate the internal logic and analytical applicability of the proposed model, a series of computational experiments was conducted in a simulation environment. This choice is appropriate for the current stage of the research because this paper proposes a quantitative assessment model rather than a fully implemented agent-oriented distributed monitoring system. Therefore, the main purpose of the experiment is not to measure deployment performance in a real infrastructure but to verify whether the model correctly transforms heterogeneous indicator values into multi-level security-state scores and whether it preserves the distinction between compliance-related degradation and compromise-related degradation.
The simulation environment was selected because it allows the type, localization, duration and intensity of security degradation to be controlled while keeping the same initial conditions for all assessment calculations. This is important for validating the model structure, since real enterprise environments may contain uncontrolled external factors, incomplete telemetry, overlapping incidents, and differences in logging quality. In this sense, the experiment should be interpreted as a controlled proof-of-concept validation of the model’s assessment logic before its integration into a practical agent-oriented monitoring architecture.
Within the experiment, a corporate network consisting of 50 nodes of different types was simulated, including workstations, file servers, database servers, and one critical database node with the highest weighting coefficient of importance. The assessment was performed using the 12 indicators summarized in
Table 2. The selected network configuration and scenario are intended to reproduce a heterogeneous corporate environment in a compact but analytically traceable form, sufficient for demonstrating network-level aggregation, node-level localization, CIA aspect-level detailing and indicator-level root-cause analysis.
To determine the weighting coefficients used in the experiment, the procedure involving three scenario-defined scoring profiles was applied. On this basis, normalized weighting coefficients of node importance, global weighting coefficients of CIA aspects and normalized weighting coefficients of the influence of indicators on confidentiality, integrity and availability were obtained. The generalized characteristics of the simulated corporate network structure are presented in
Table 3, a fragment of data on individual nodes and their importance weighting coefficients is shown in
Table 4, and the normalized weighting coefficients of the influence of indicators on CIA aspects are presented in
Table 5.
The duration of the experiment was 14 days. The entire period was divided into four consecutive phases, each representing a specific state of corporate network operation. In the first phase, the network remains in a stable normal state. The second phase simulates controlled degradation of IOS channel indicators for a subset of nodes, corresponding to a scenario of accumulated configuration deviations that directly affect protective mechanisms and overall compliance with security policies. The third phase reflects partial recovery after this degradation. The fourth phase simulates active compromise of the critical database node
, resulting in a significant deterioration of IOC channel scores. A generalized description of the experimental phases is presented in
Table 6.
As noted above, the baseline experiment was constructed as a sequential 14-day scenario in which four phases of corporate network operation were simulated. Such an experimental setup makes it possible to verify whether the proposed model is capable not only of detecting degradation in the overall network state but also of distinguishing the nature of this degradation depending on whether it is caused by a low level of configured protective mechanisms and non-compliance with general security policies or by signs of compromise.
In the present experimental configuration, all 12 indicators were treated as applicable to all 50 simulated nodes, and each CIA aspect in both IOS and IOC channels was covered by at least one indicator with a non-zero impact weight. Therefore, and throughout the experiment, and the neutral-value rule in (34) is not triggered. The coverage formalization remains necessary for future deployments with heterogeneous indicator applicability.
4.2. Network-Level Assessment Results
At the first stage, the analysis is performed at the level of the entire network. For this purpose, based on node-level scores and taking into account the weighting coefficients of node importance, three global time series are calculated: the network-level score of the security requirements compliance channel
, the network-level score of the absence of signs of compromise channel
, and the integral dual-channel network-level score
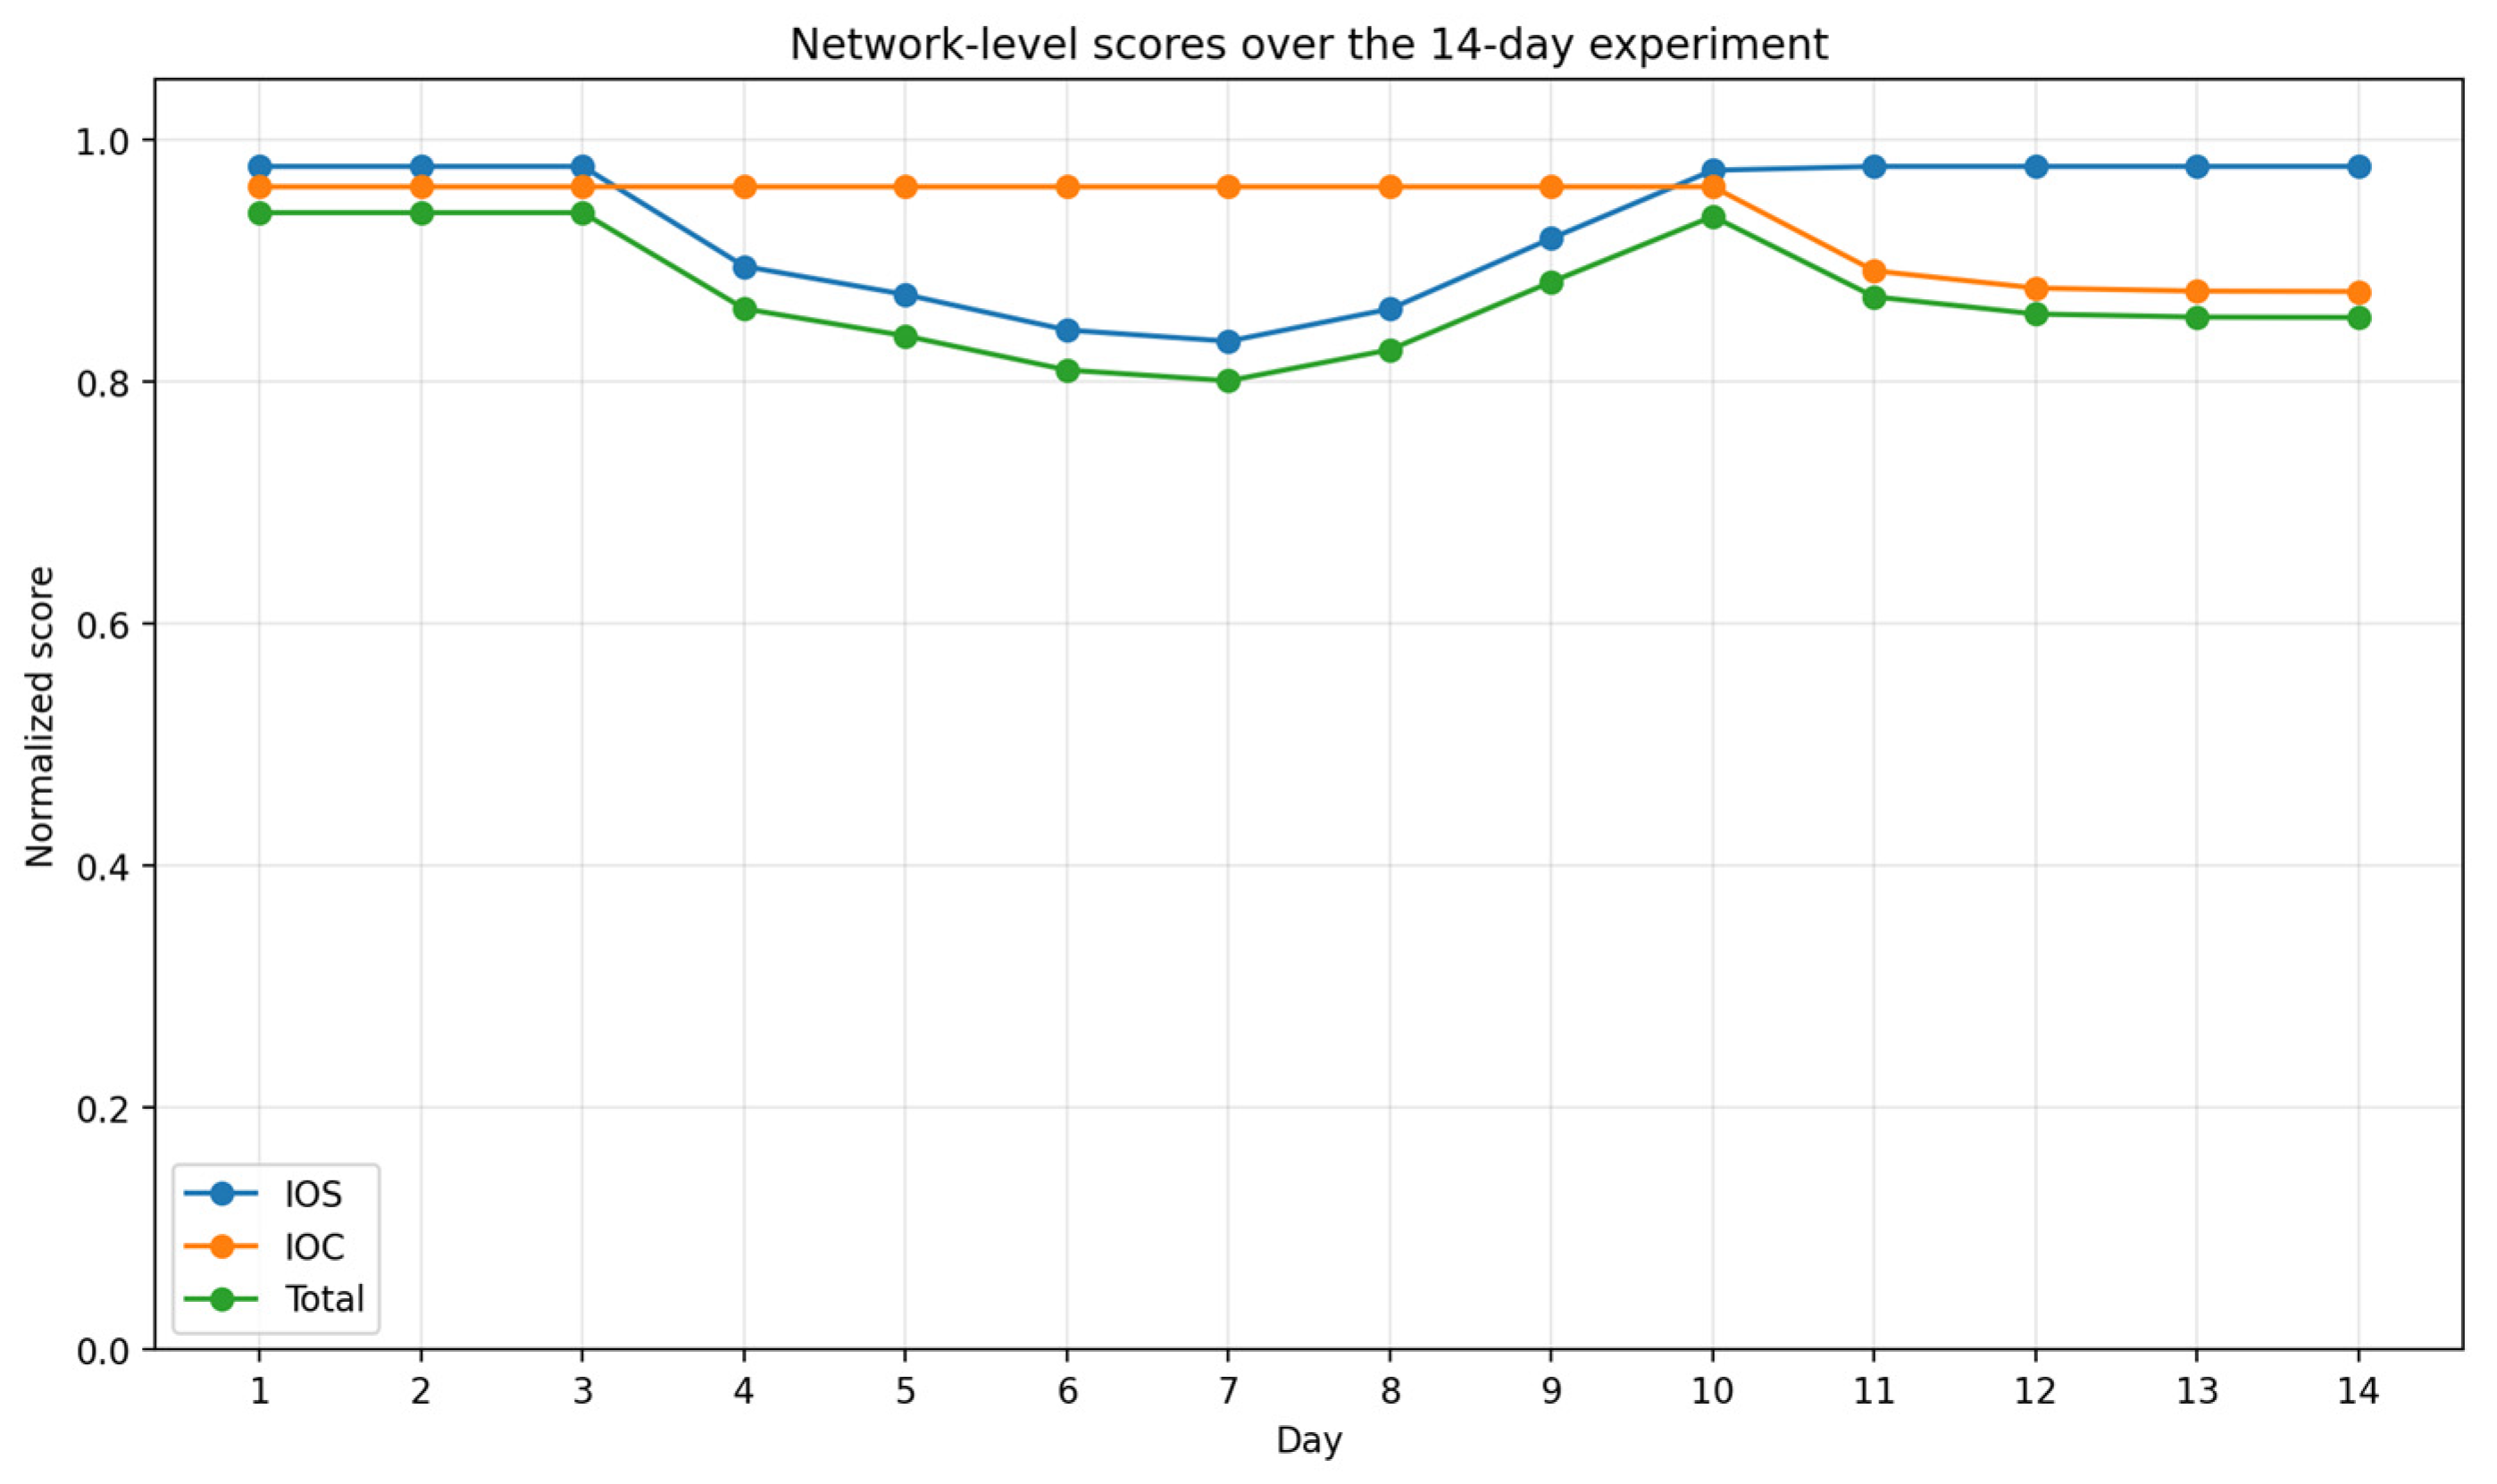
. The results of this assessment over the entire 14-day period are shown in
Figure 5.
In the first phase of the experiment, all three curves remain stable, which corresponds to the normal operating mode of the simulated corporate network. In particular, during days 1–3, the network-level IOS score remains at approximately 0.9776, the network-level IOC score remains at approximately 0.9608, and the integral dual-channel network-level score (Total) remains at approximately 0.9394. This indicates that, in the initial state, the network is characterized by a high level of security, while the slight deviation from the maximum possible value is explained by the presence of individual local non-ideal indicator scores on some nodes.
In the second phase, which covers days 4–7, a targeted deterioration of the IOS channel is observed. In
Figure 5, this is reflected by a clear decrease in the IOS curve while the IOC curve remains almost unchanged. By the end of this phase, the network-level IOS score decreases to approximately 0.8332, whereas the network-level IOC score remains at about 0.9608. As a result, the integral dual-channel network-level score (Total) also decreases and reaches approximately 0.8005 on day 7. This behavior confirms that the model is sensitive specifically to the accumulation of violations in the security channel and, at the same time, does not interpret them as signs of compromise.
In the third phase, corresponding to days 8–10, partial recovery after the previous degradation is simulated. In
Figure 5, this is manifested by an increase in the IOS curve, while the IOC curve remains almost unchanged. By day 10, the network-level IOS score recovers to approximately 0.9744, and the integral dual-channel score increases to approximately 0.9363. This demonstrates that the proposed model correctly responds not only to degradation but also to the gradual improvement of the network state after part of the violations has been eliminated.
The fourth phase, covering days 11–14, simulates active compromise of the critical database node. Unlike the second phase, here, the IOS curve remains stable, while the IOC curve decreases significantly. By the end of the experiment, the network-level IOC score decreases to approximately 0.8743, and the integral dual-channel network-level score decreases to approximately 0.8528.
The weighted integral network-level score should not be interpreted in isolation from the two channel-specific network-level scores. In the proposed dual-channel model, the network-level output is a three-component analytical result consisting of the network-level IOS score (IOS), the network-level IOC score (IOC) and the integral dual-channel network-level score (Total). Therefore, the values obtained on day 7 and day 14 should not be compared only by the integral dual-channel network-level score (Total). On day 7, the decrease in the total score is driven mainly by the IOS channel, which reflects accumulated configuration and compliance-related degradation across several nodes. On day 14, the decrease is driven mainly by the IOC channel and is localized at the critical database node. Thus, the purpose of the network-level output is not only to rank phases by a single scalar value but also to identify the nature of degradation through the separate IOS and IOC components and then localize it through node-level drill-down.
Accordingly, the fact that the integral dual-channel network-level score (Total) on day 14 is numerically higher than the weighted total score on day 7 does not mean that the active compromise scenario is less important operationally. It means that the weighted average impact of the localized IOC degradation differs from the distributed IOS degradation. The severity of the fourth phase is revealed by the IOC channel and by the node-level localization of the critical database node, not by the integral dual-channel network-level score (Total) alone.
The results shown in
Figure 5 confirm that the proposed model provides a correct dual-channel representation of the corporate network state at the global level.
4.3. Node-Level Localization Results
The next step of the analysis consists of moving from the network level to the node level. For this purpose, two representative time slices of the experimental scenario were selected: day 7 and day 14. Day 7 corresponds to the end of the controlled degradation phase of the IOS channel, during which the scores of indicators related to compliance with security requirements, policies and protective mechanisms decrease. Day 14 corresponds to the end of the active compromise phase of the critical database node, during which the main degradation is reflected in the IOC channel. Therefore, these two time slices are not arbitrary but are used to demonstrate two different types of deterioration in the security state of the corporate network.
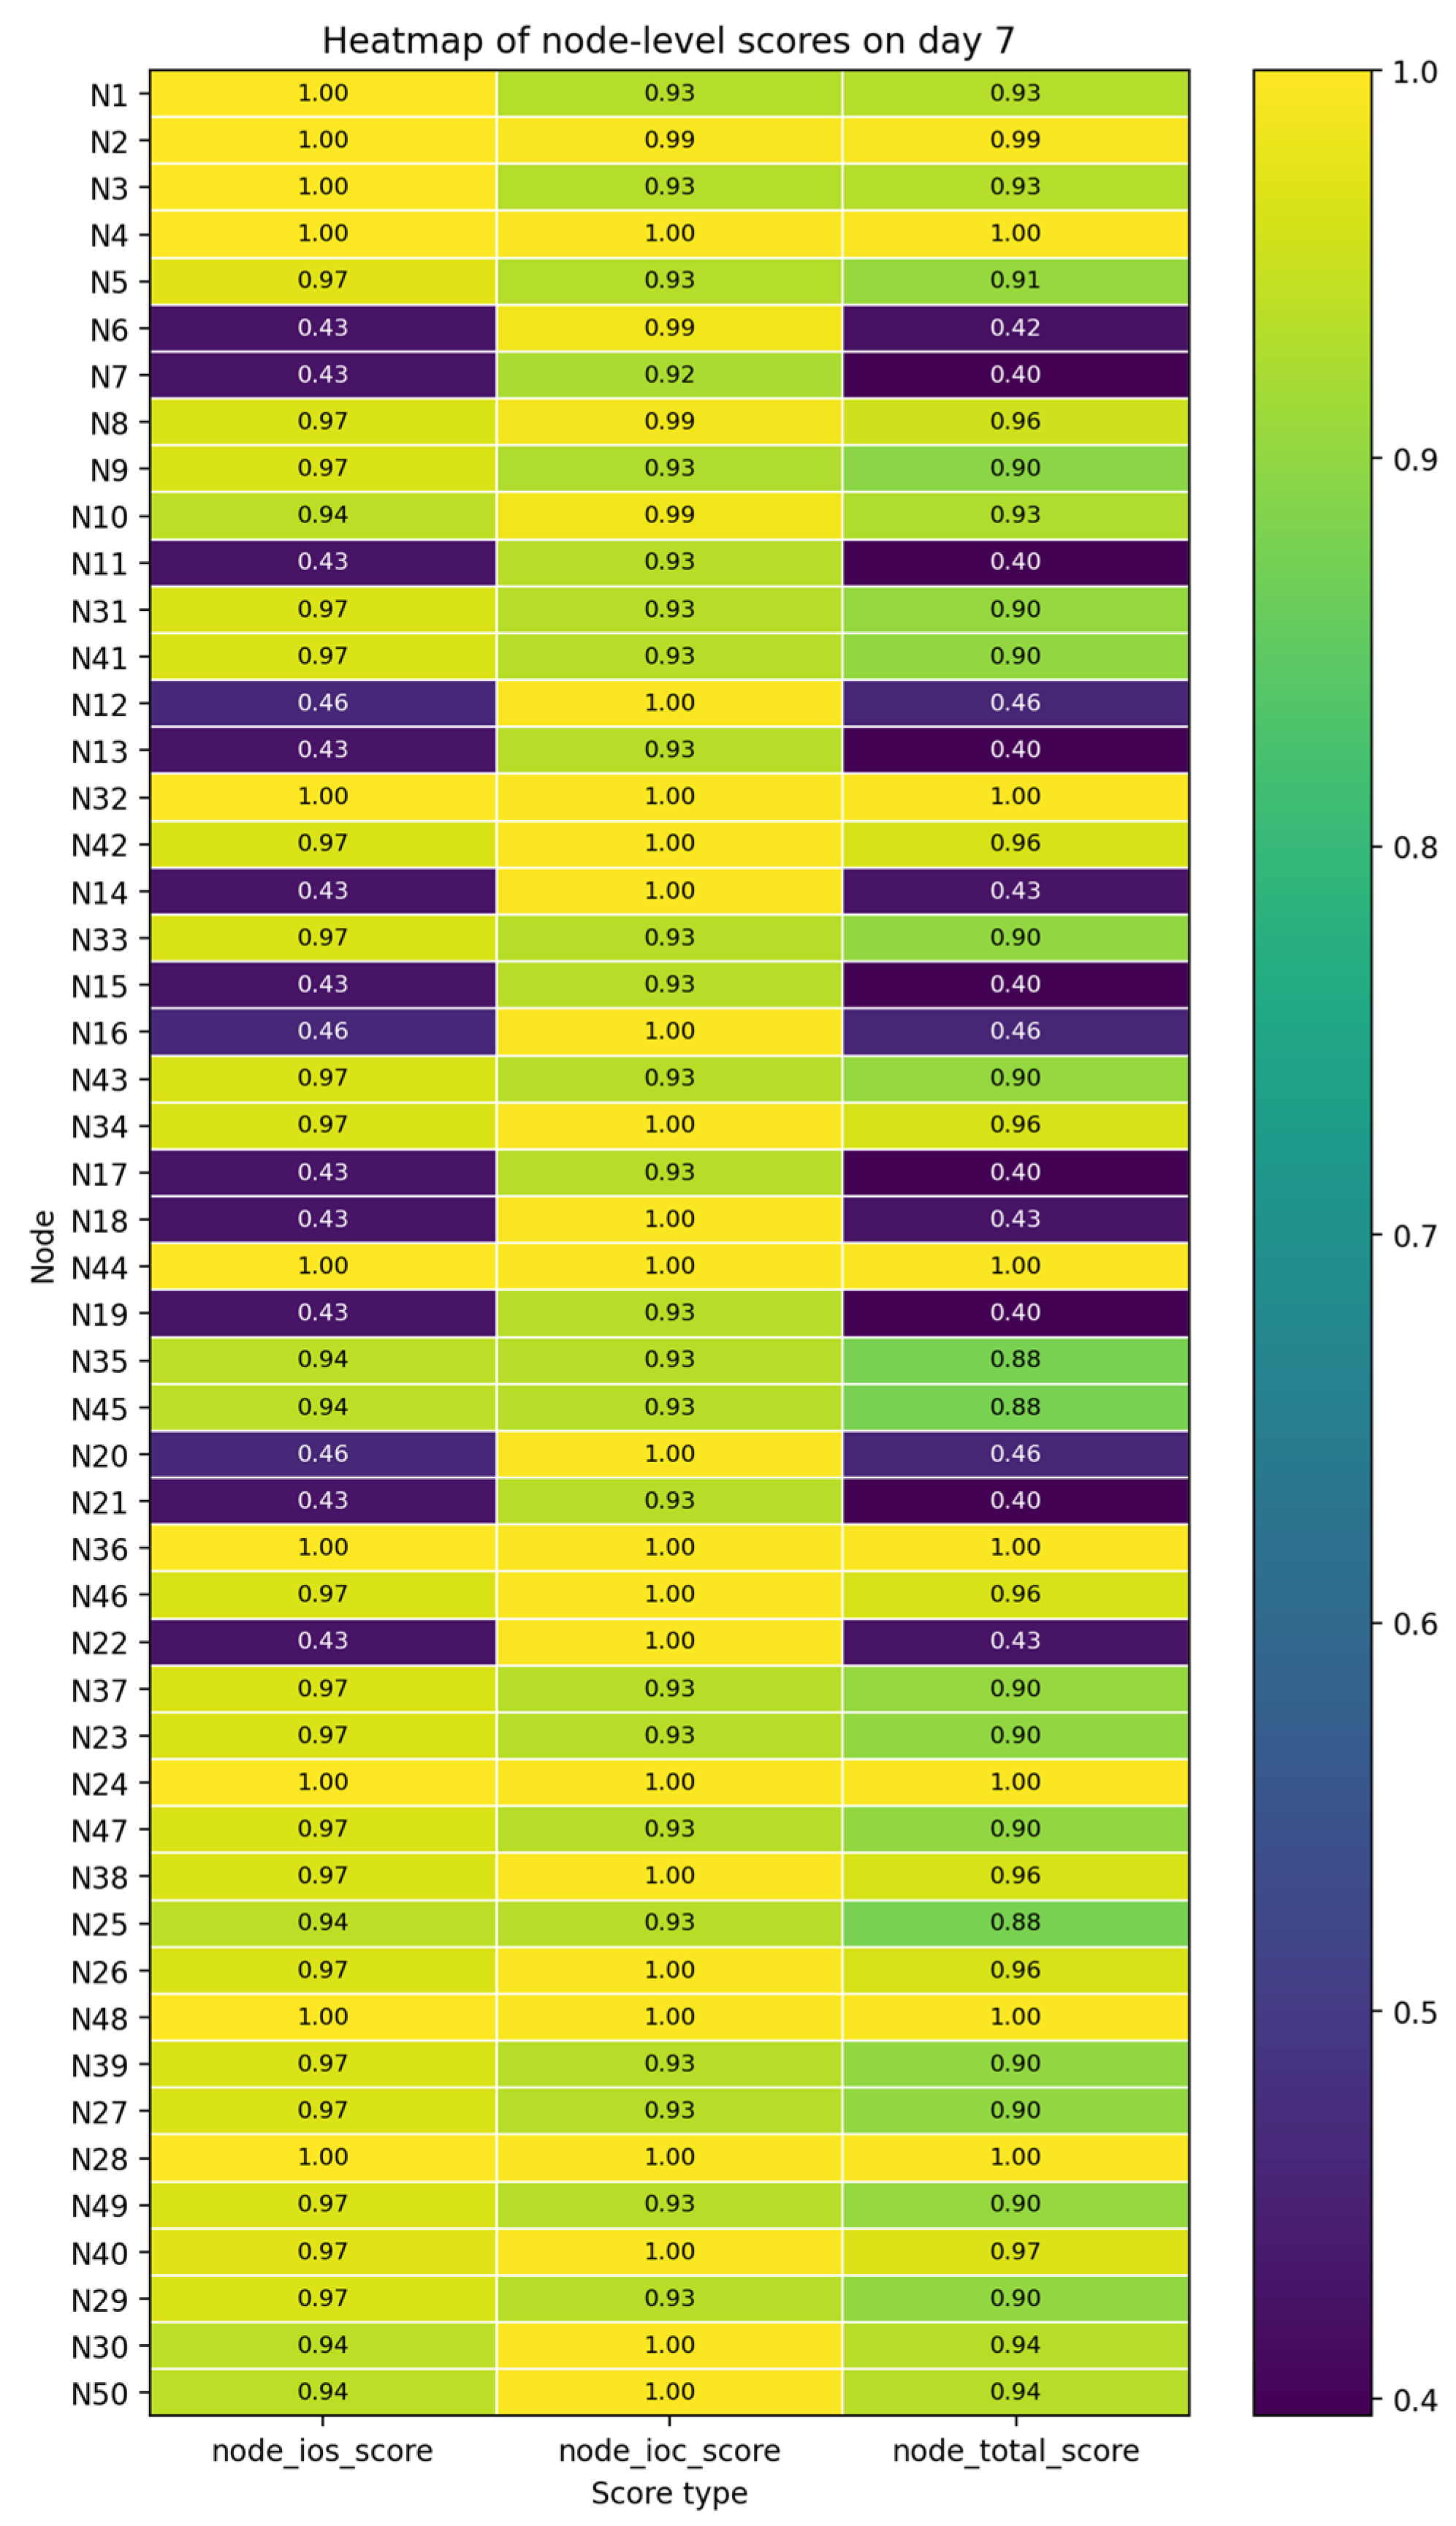
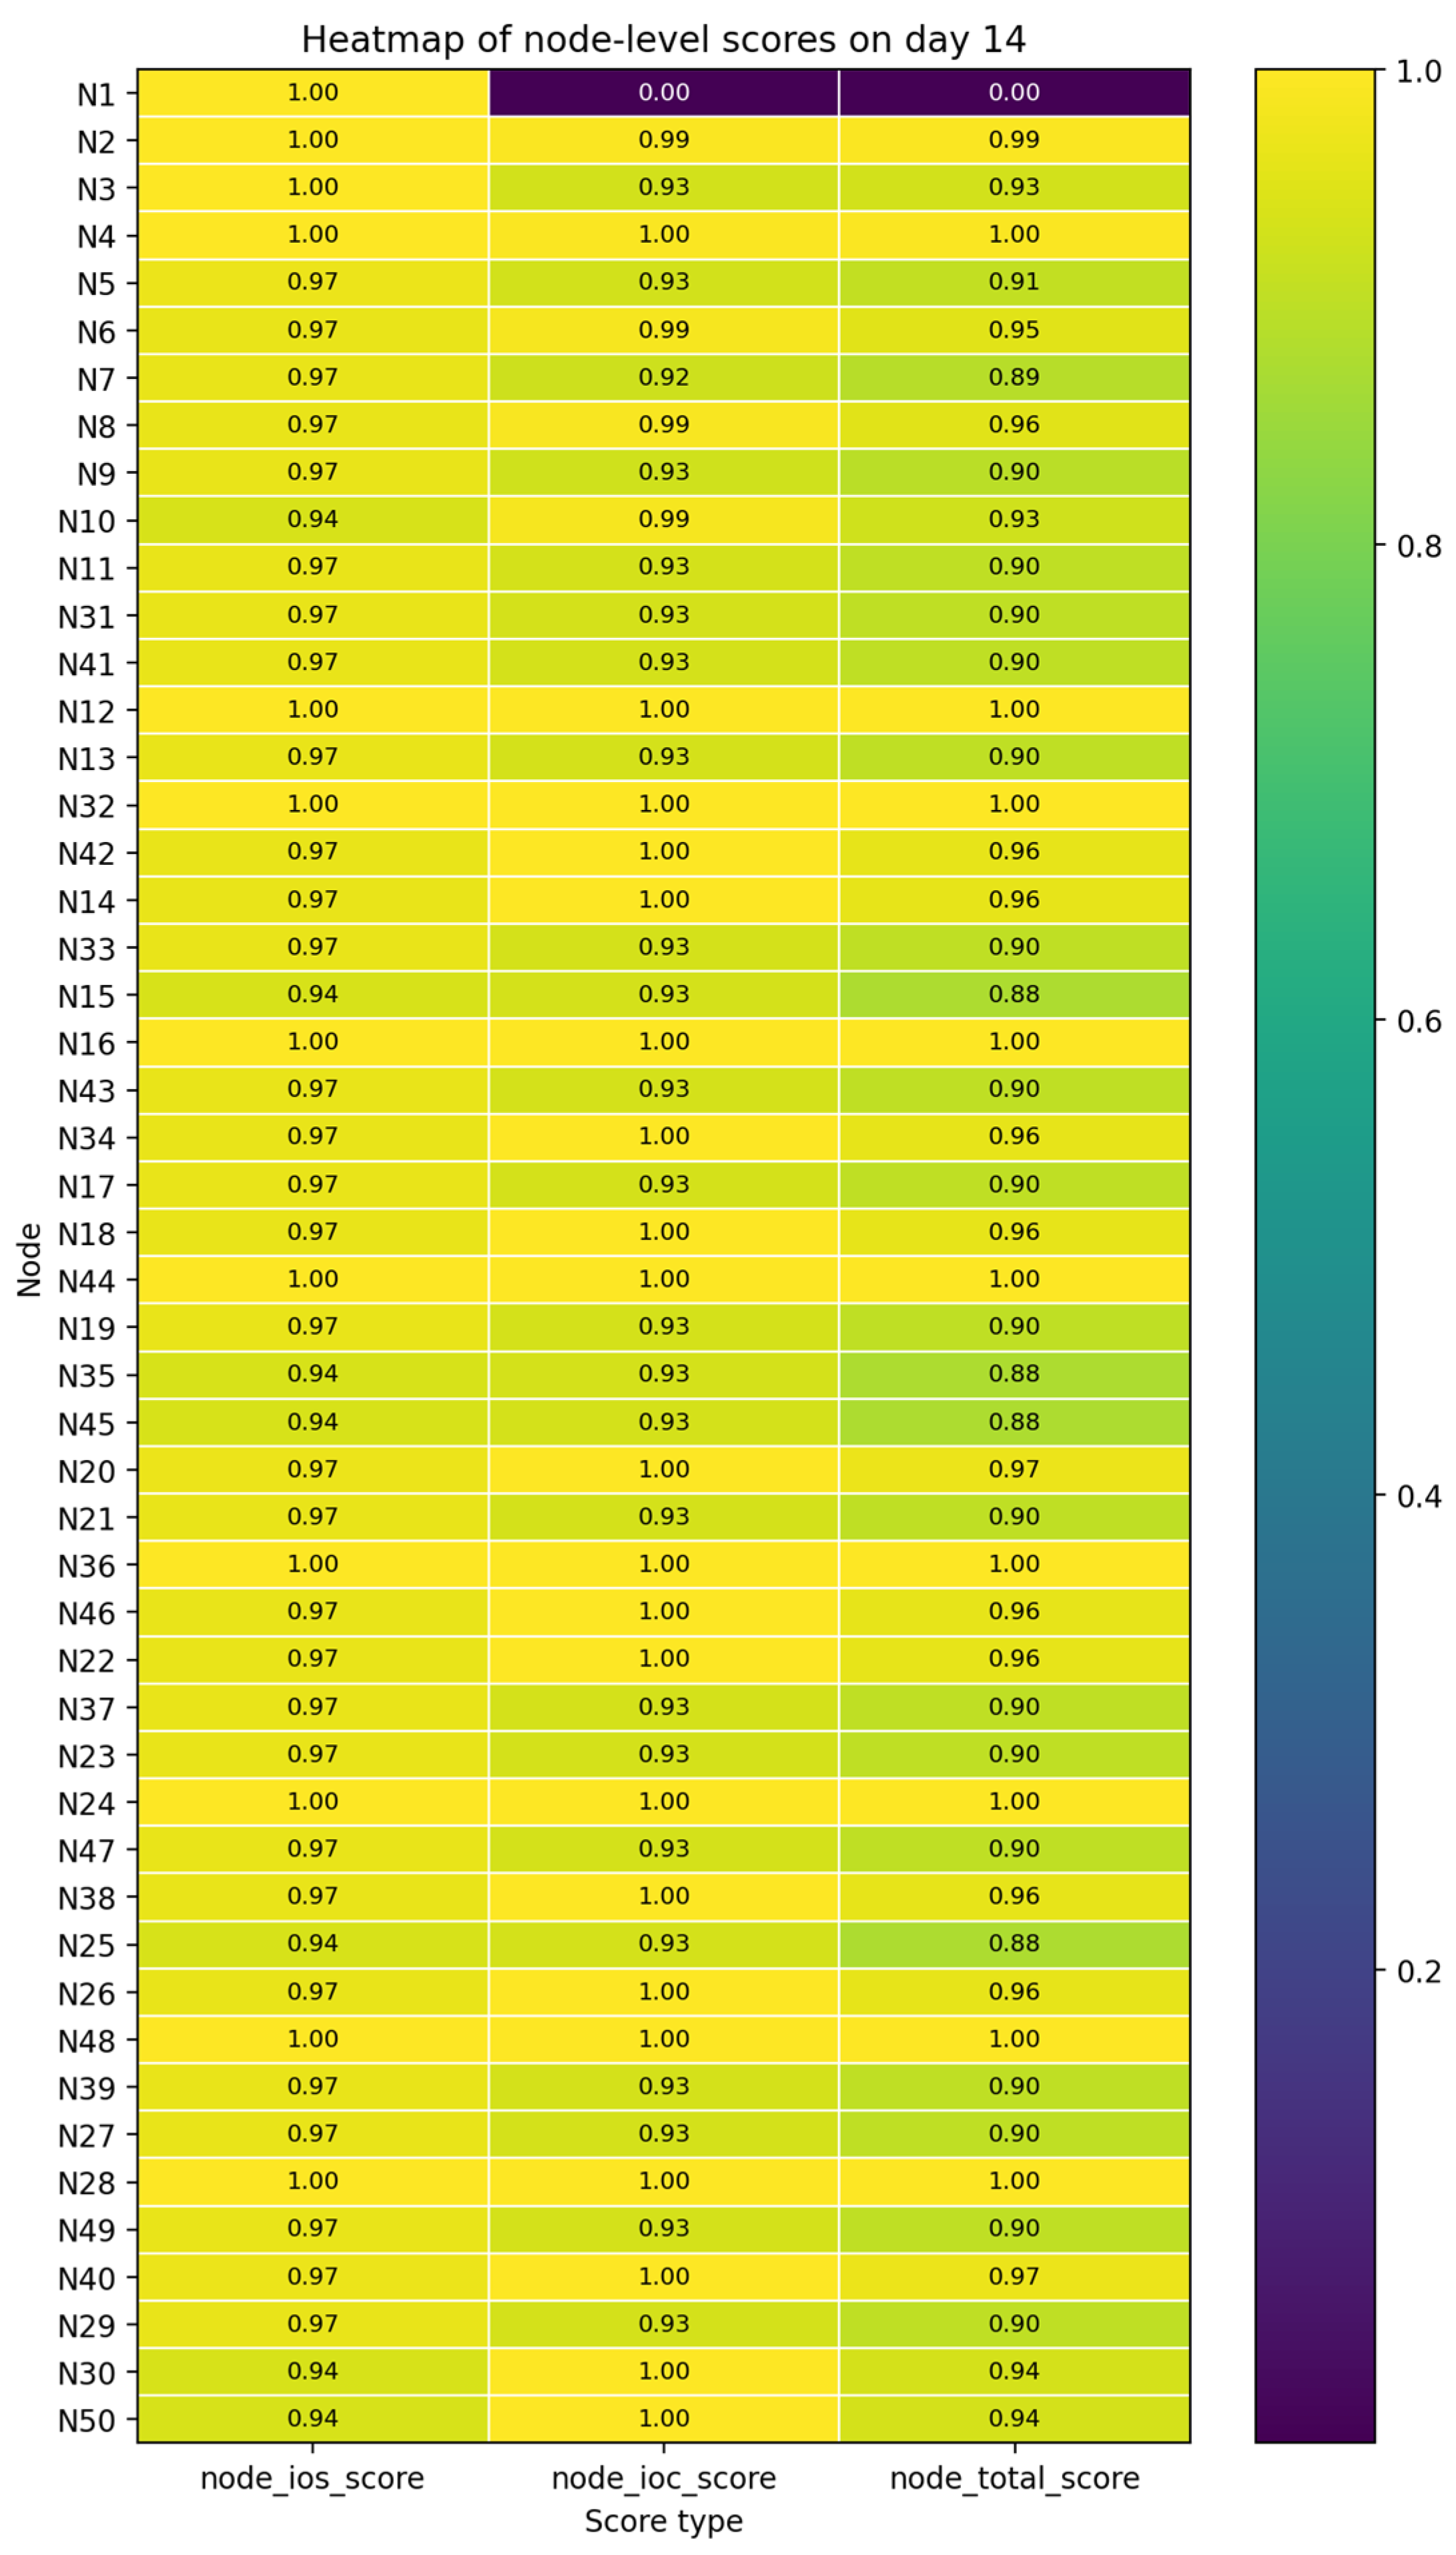
For node-level visualization, heatmaps were constructed. In each heatmap, three node-level scores are shown for all 50 nodes: “node_ios_score” corresponding to , “node_ioc_score” corresponding to , and “node_total_score” related to . The nodes are ordered according to their importance weighting coefficients so that the upper part of the figure corresponds to the most critical elements of the network. This form of presentation is practically useful because it allows an administrator not only to detect the fact of score degradation but also to relate it to the importance of the corresponding nodes for the operation of the corporate network.
Figure 6 shows the heatmap of node-level scores for day 7, the moment when the controlled degradation phase of the IOS channel reaches its most pronounced state.
The figure shows that the decrease in scores is not distributed uniformly across the entire network but is concentrated in a clearly defined group of nodes included in the scenario of the second experimental phase. The most characteristic feature is that the “node_ios_score” values decrease, whereas the “node_ioc_score” scores for the same nodes remain relatively stable. For example, node belongs to the file server group. For this node, on day 7, a noticeable decrease in the node-level IOS score is observed, while the node-level IOC score remains high. As a result, the integral dual-channel score also decreases, but the nature of this decrease clearly indicates the dominant influence of a low security compliance level rather than compromise.
Figure 7 shows the heatmap of node-level scores for day 14, i.e., the end of the active compromise phase of the critical database node. Unlike the previous case, the main anomaly here is concentrated around node
, which has the highest importance weighting coefficient in the entire network and is used as the target node in the fourth experimental phase. For this node, a substantial decrease in the “node_ioc_score” score is observed, whereas the “node_ios_score” score remains relatively high.
This distribution is fundamentally important because it demonstrates a different nature of degradation compared with the second phase. While, in
Figure 6, the problem is manifested primarily through the IOS channel, in
Figure 7, the main source of degradation is the IOC channel, which corresponds to the active compromise scenario. The integral score also decreases significantly. However, the dual-channel structure of the model makes it possible to preserve information indicating that the cause is the presence of compromise-related signs rather than the accumulation of security policy violations. It is also important that the influence of this node on the global network-level scores is more noticeable than a similar degradation on a less critical node, since its high importance weighting coefficient is taken into account during network-level aggregation. This confirms the feasibility of considering node criticality in the proposed model and strengthens its practical value for response prioritization tasks.
The results shown in
Figure 6 and
Figure 7 demonstrate that the transition from the network level to the node level makes it possible not only to localize problematic elements of the corporate network but also to preserve information about the nature of score degradation for each of them. In the first case, the model identifies a group of nodes with dominant IOS channel degradation, whereas, in the second case, it identifies a single critical node with a sharp deterioration of the IOC channel. This creates the basis for further transition to a more detailed analysis at the CIA aspect level.
4.4. Aspect-Level and Indicator-Level Analysis
After localizing the problematic nodes at the previous stage, it is appropriate to proceed to a more detailed analysis at the level of confidentiality, integrity and availability aspects. This level makes it possible to determine which CIA aspect is primarily responsible for the deterioration of the security state of a particular node. In the proposed model, aspect-level scores are formed separately for the IOS and IOC channels for each node, which makes it possible to analyze how different groups of indicators affect information security aspects during different phases of the experiment.
For the baseline scenario, two representative nodes were selected. The first node
participates in the second-phase scenario. The second node is the critical database node, which is the target node in the fourth phase, where active compromise and deterioration of the IOC channel are simulated. Separate graphs of aspect-level scores were constructed for these two nodes.
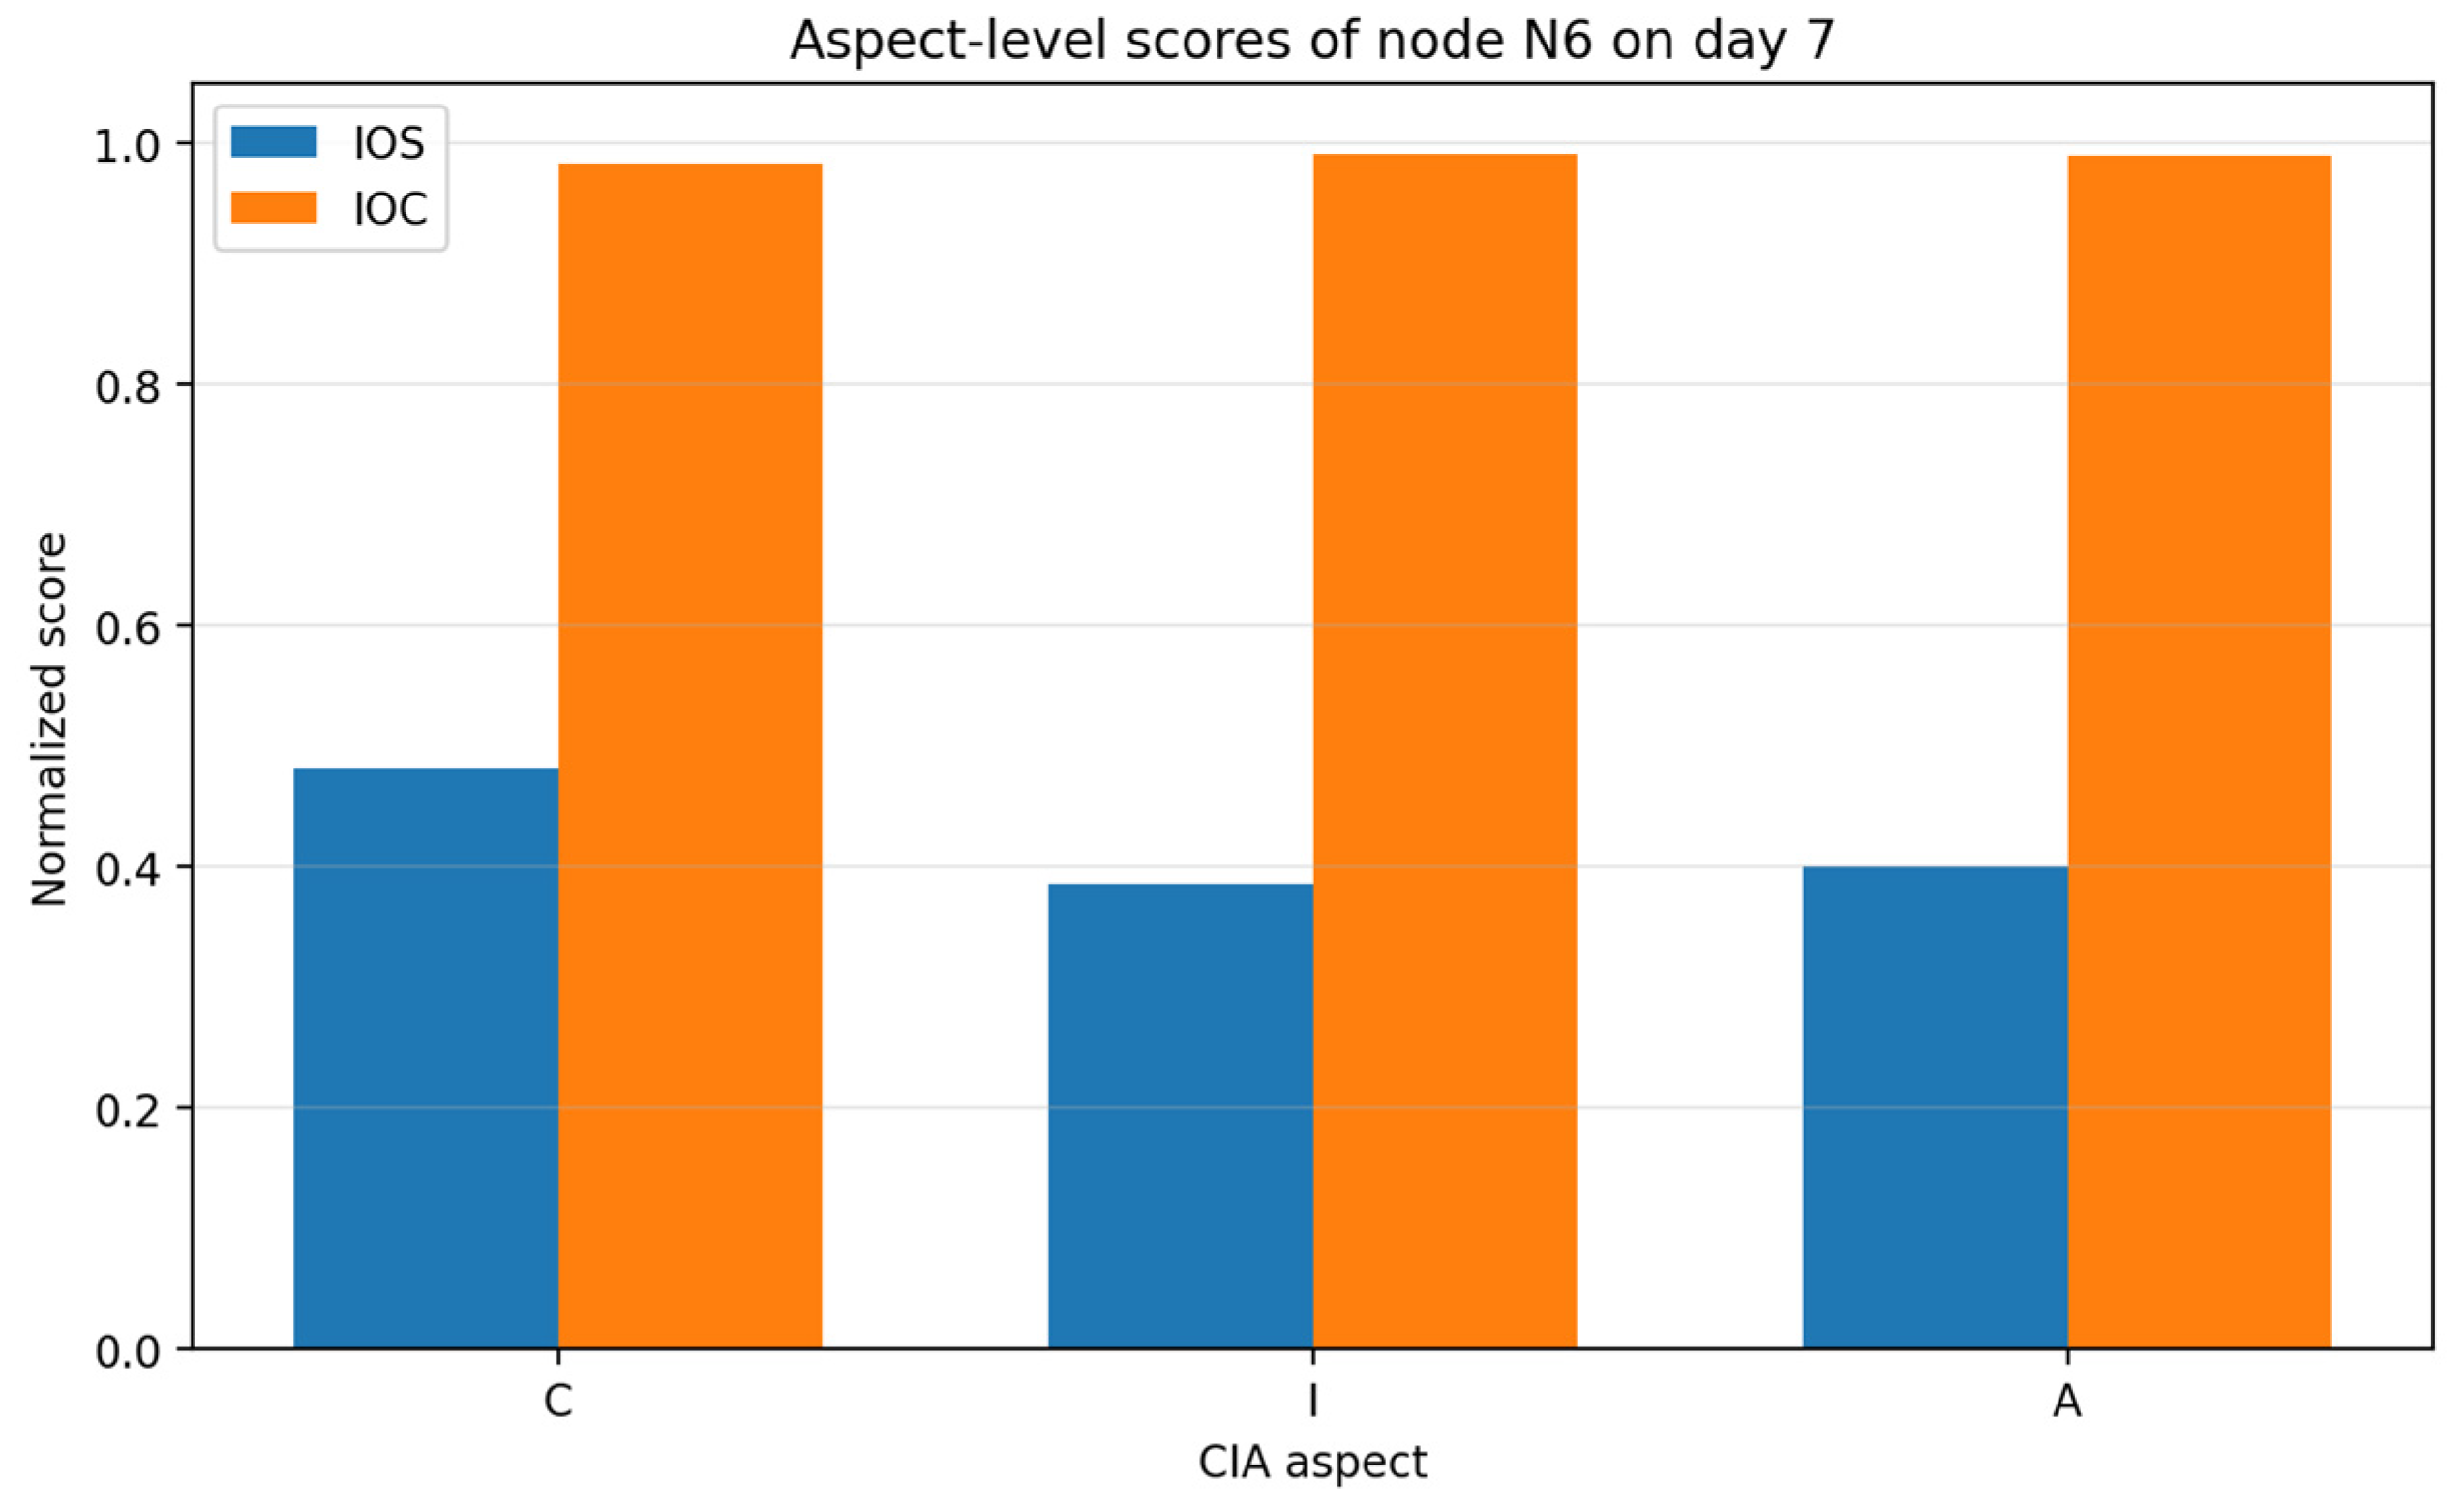
Figure 8 presents the aspect-level scores of the selected node
on day 7.
The graph shows that, for this node, a significant deterioration is observed, specifically in the IOS channel scores, whereas the corresponding IOC channel scores remain considerably more stable. This means that the decrease in the integral node-level score is primarily caused by the accumulation of configuration and policy deviations, rather than by signs of active compromise.
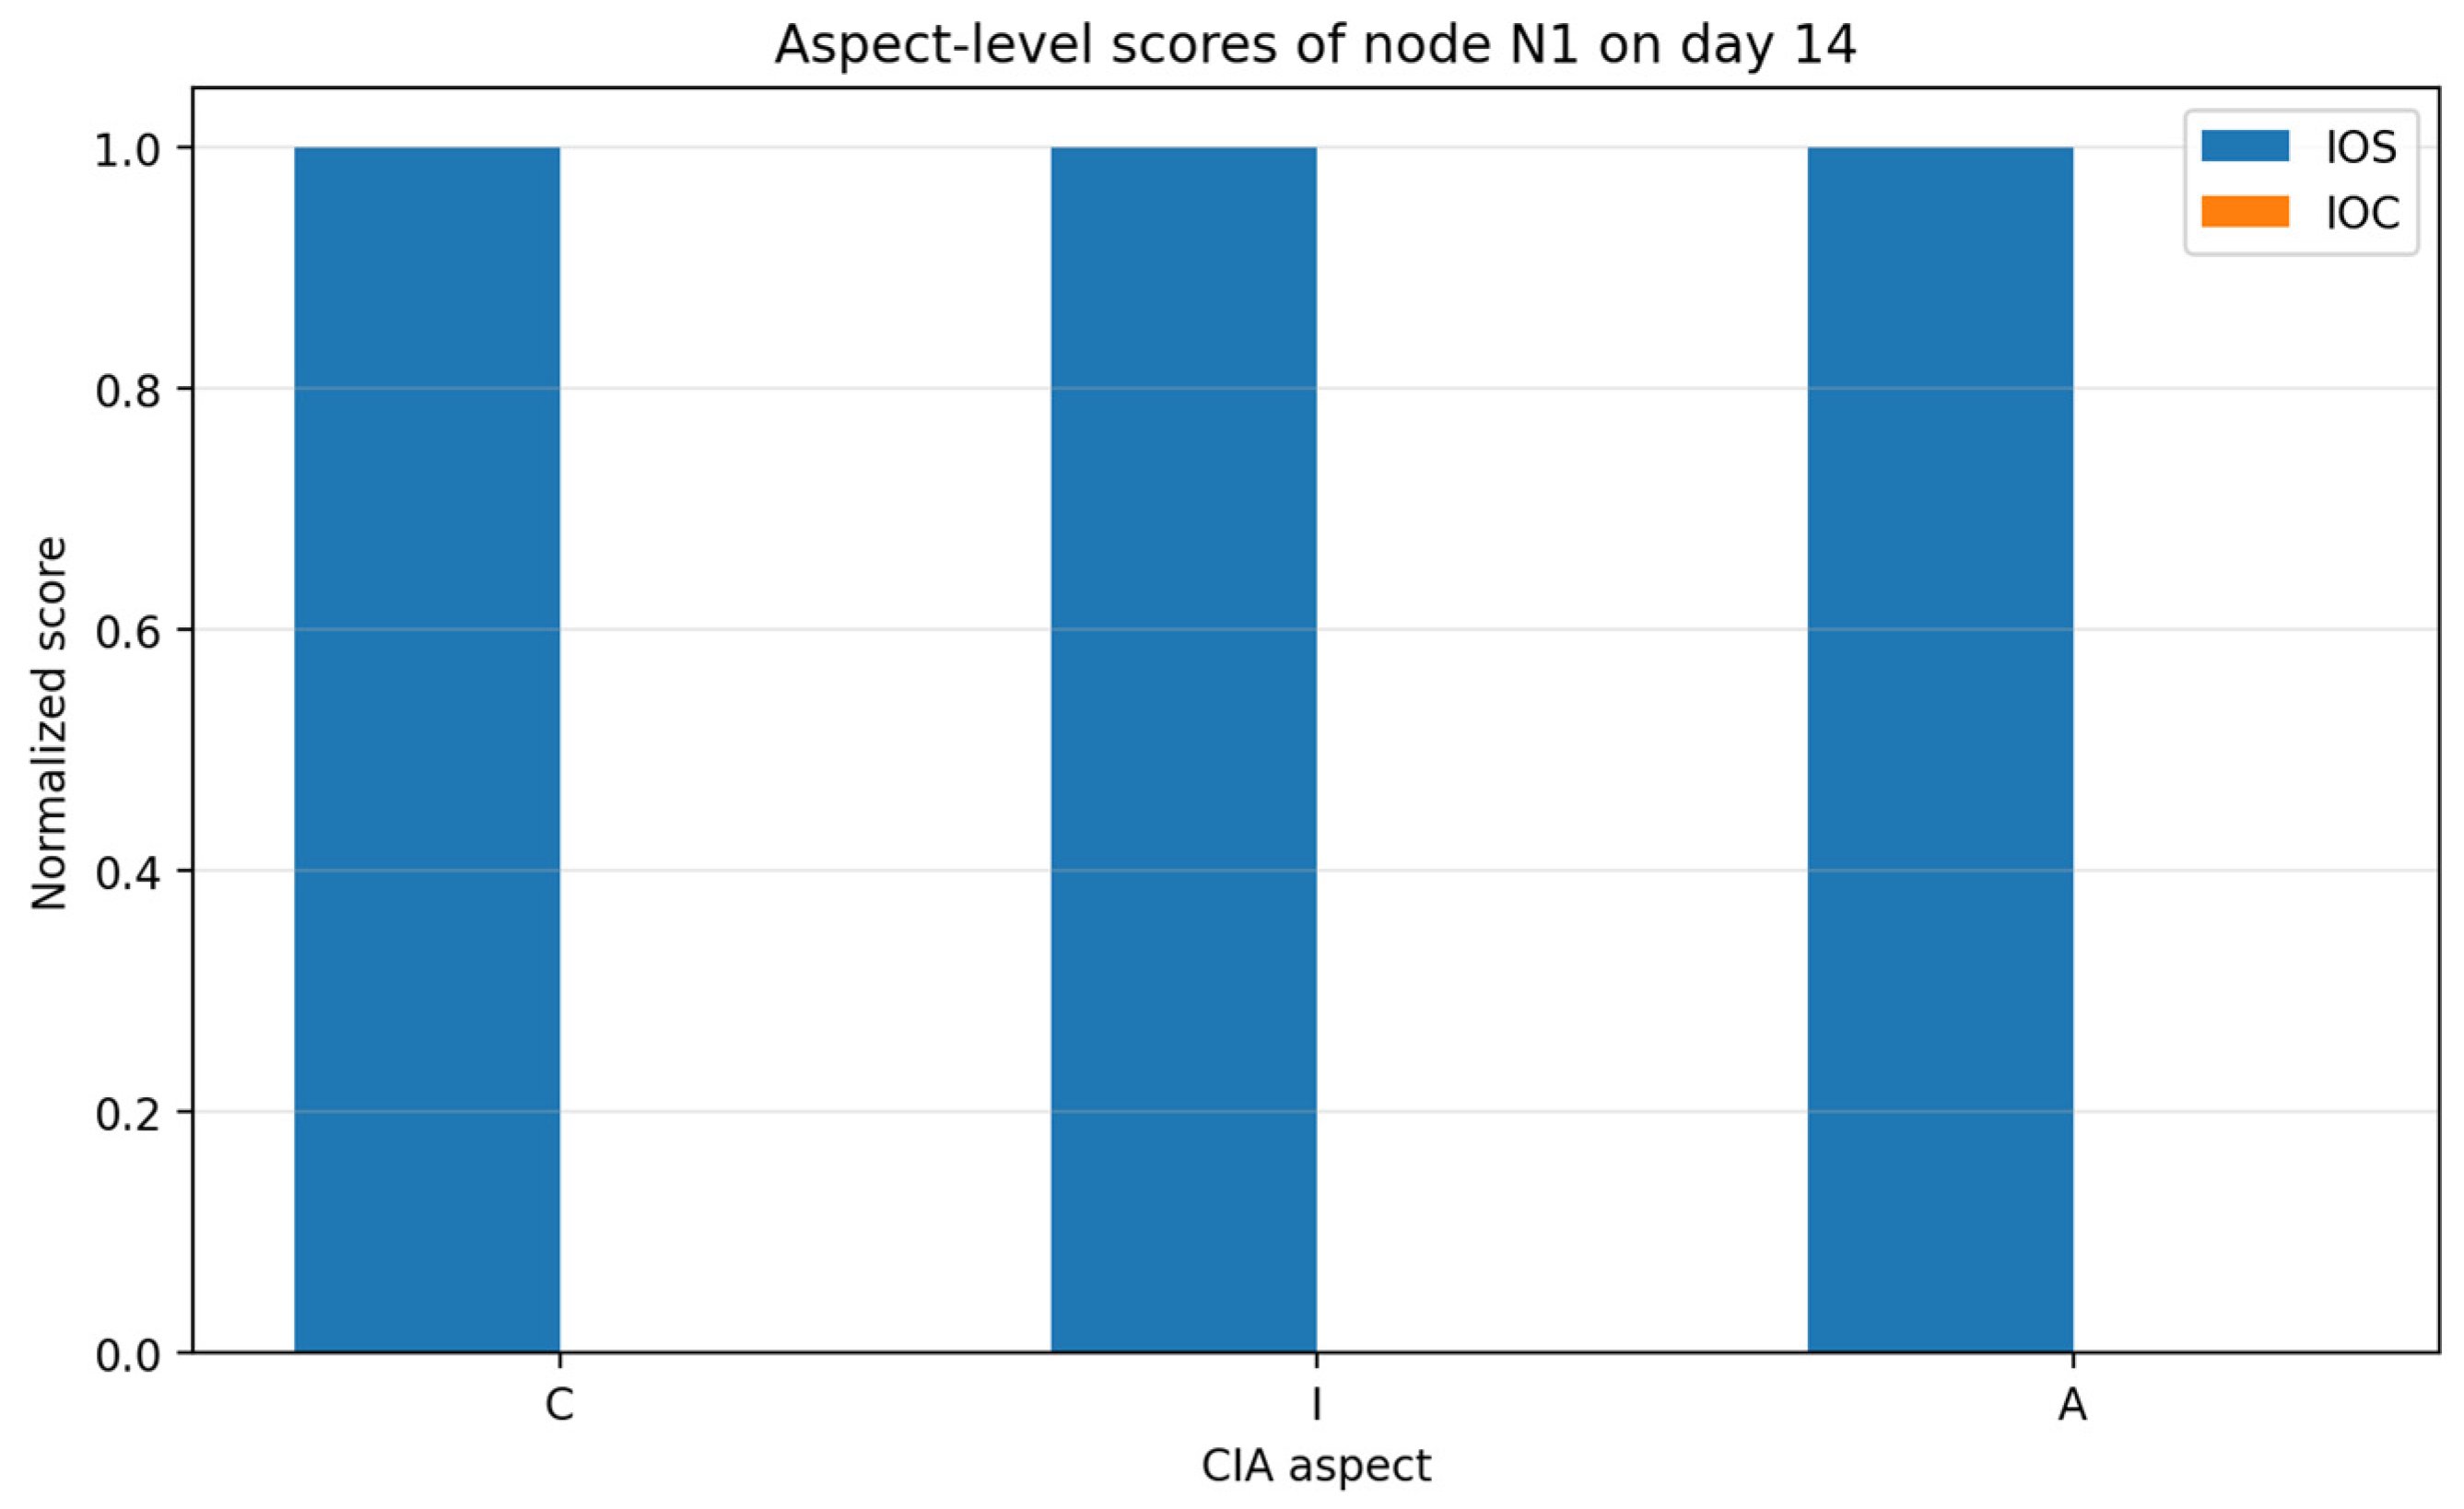
Figure 9 presents the aspect-level scores of the critical database node
on day 14, that is, at the end of the active compromise phase.
Unlike the previous case, the dominant deterioration here is observed in the IOC channel, while the IOS aspect-level scores for this node remain high. This is consistent with the logic of the fourth-phase scenario, in which substantial degradation of all five compromise indicators is simulated for the critical database node.
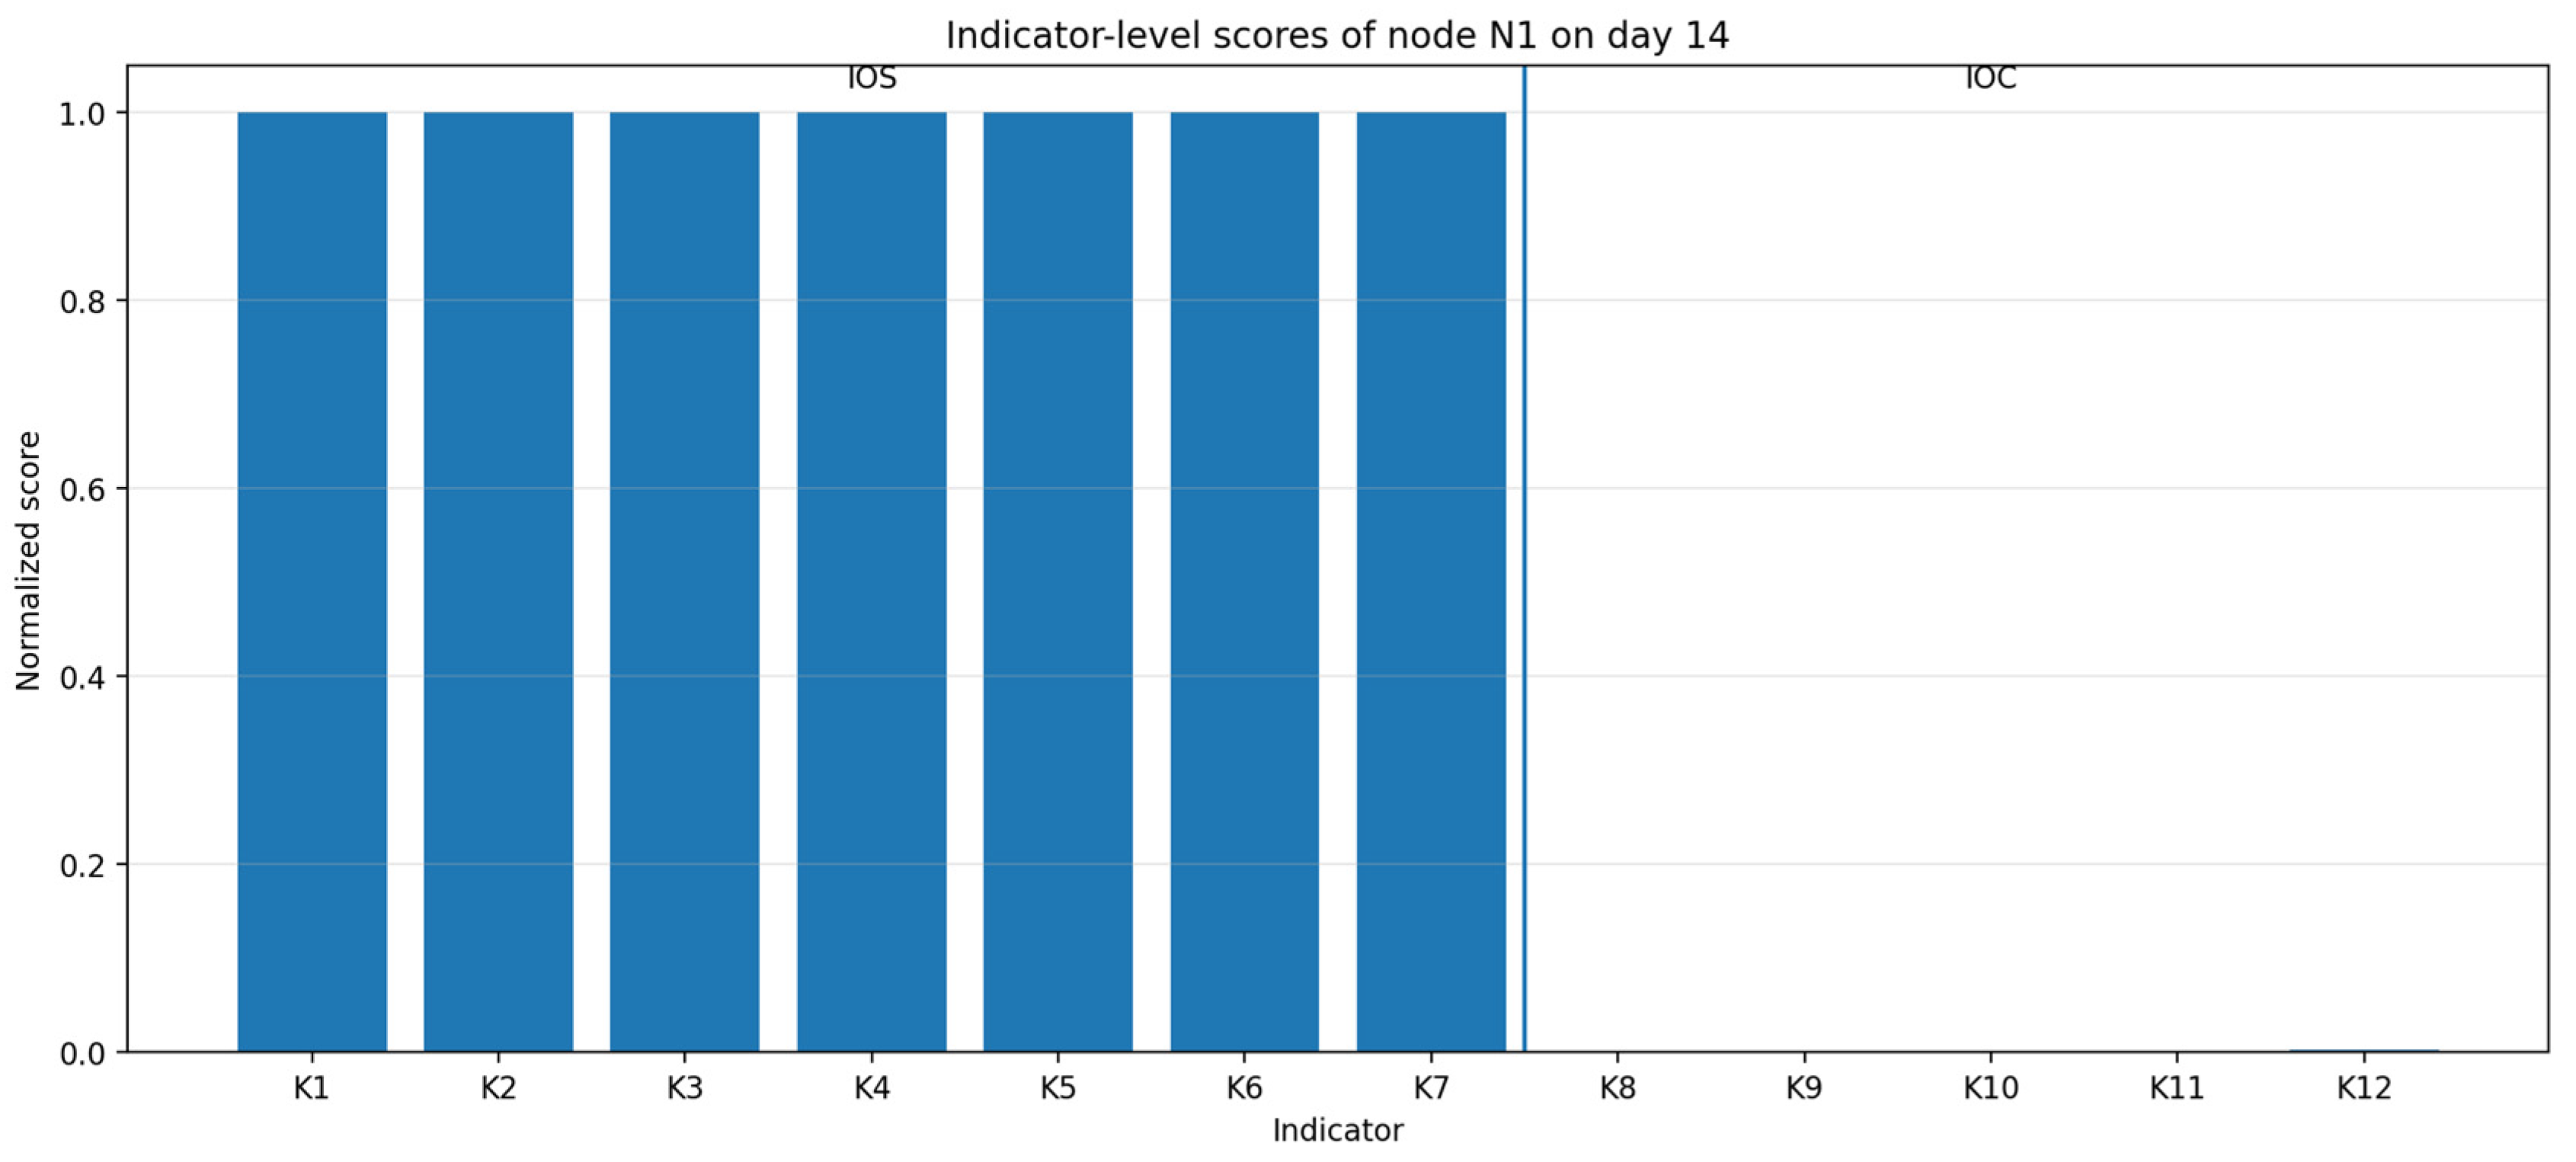
The final level of detailing within the baseline experiment is the level of individual indicators. This level makes it possible to move from the general conclusion about the deterioration of node-level and aspect-level scores to identifying the specific causes of such deterioration. In practical terms, this is the level of analysis that is closest to the tasks of an administrator, because it directly shows which characteristics of the node state require correction, verification, or immediate response.
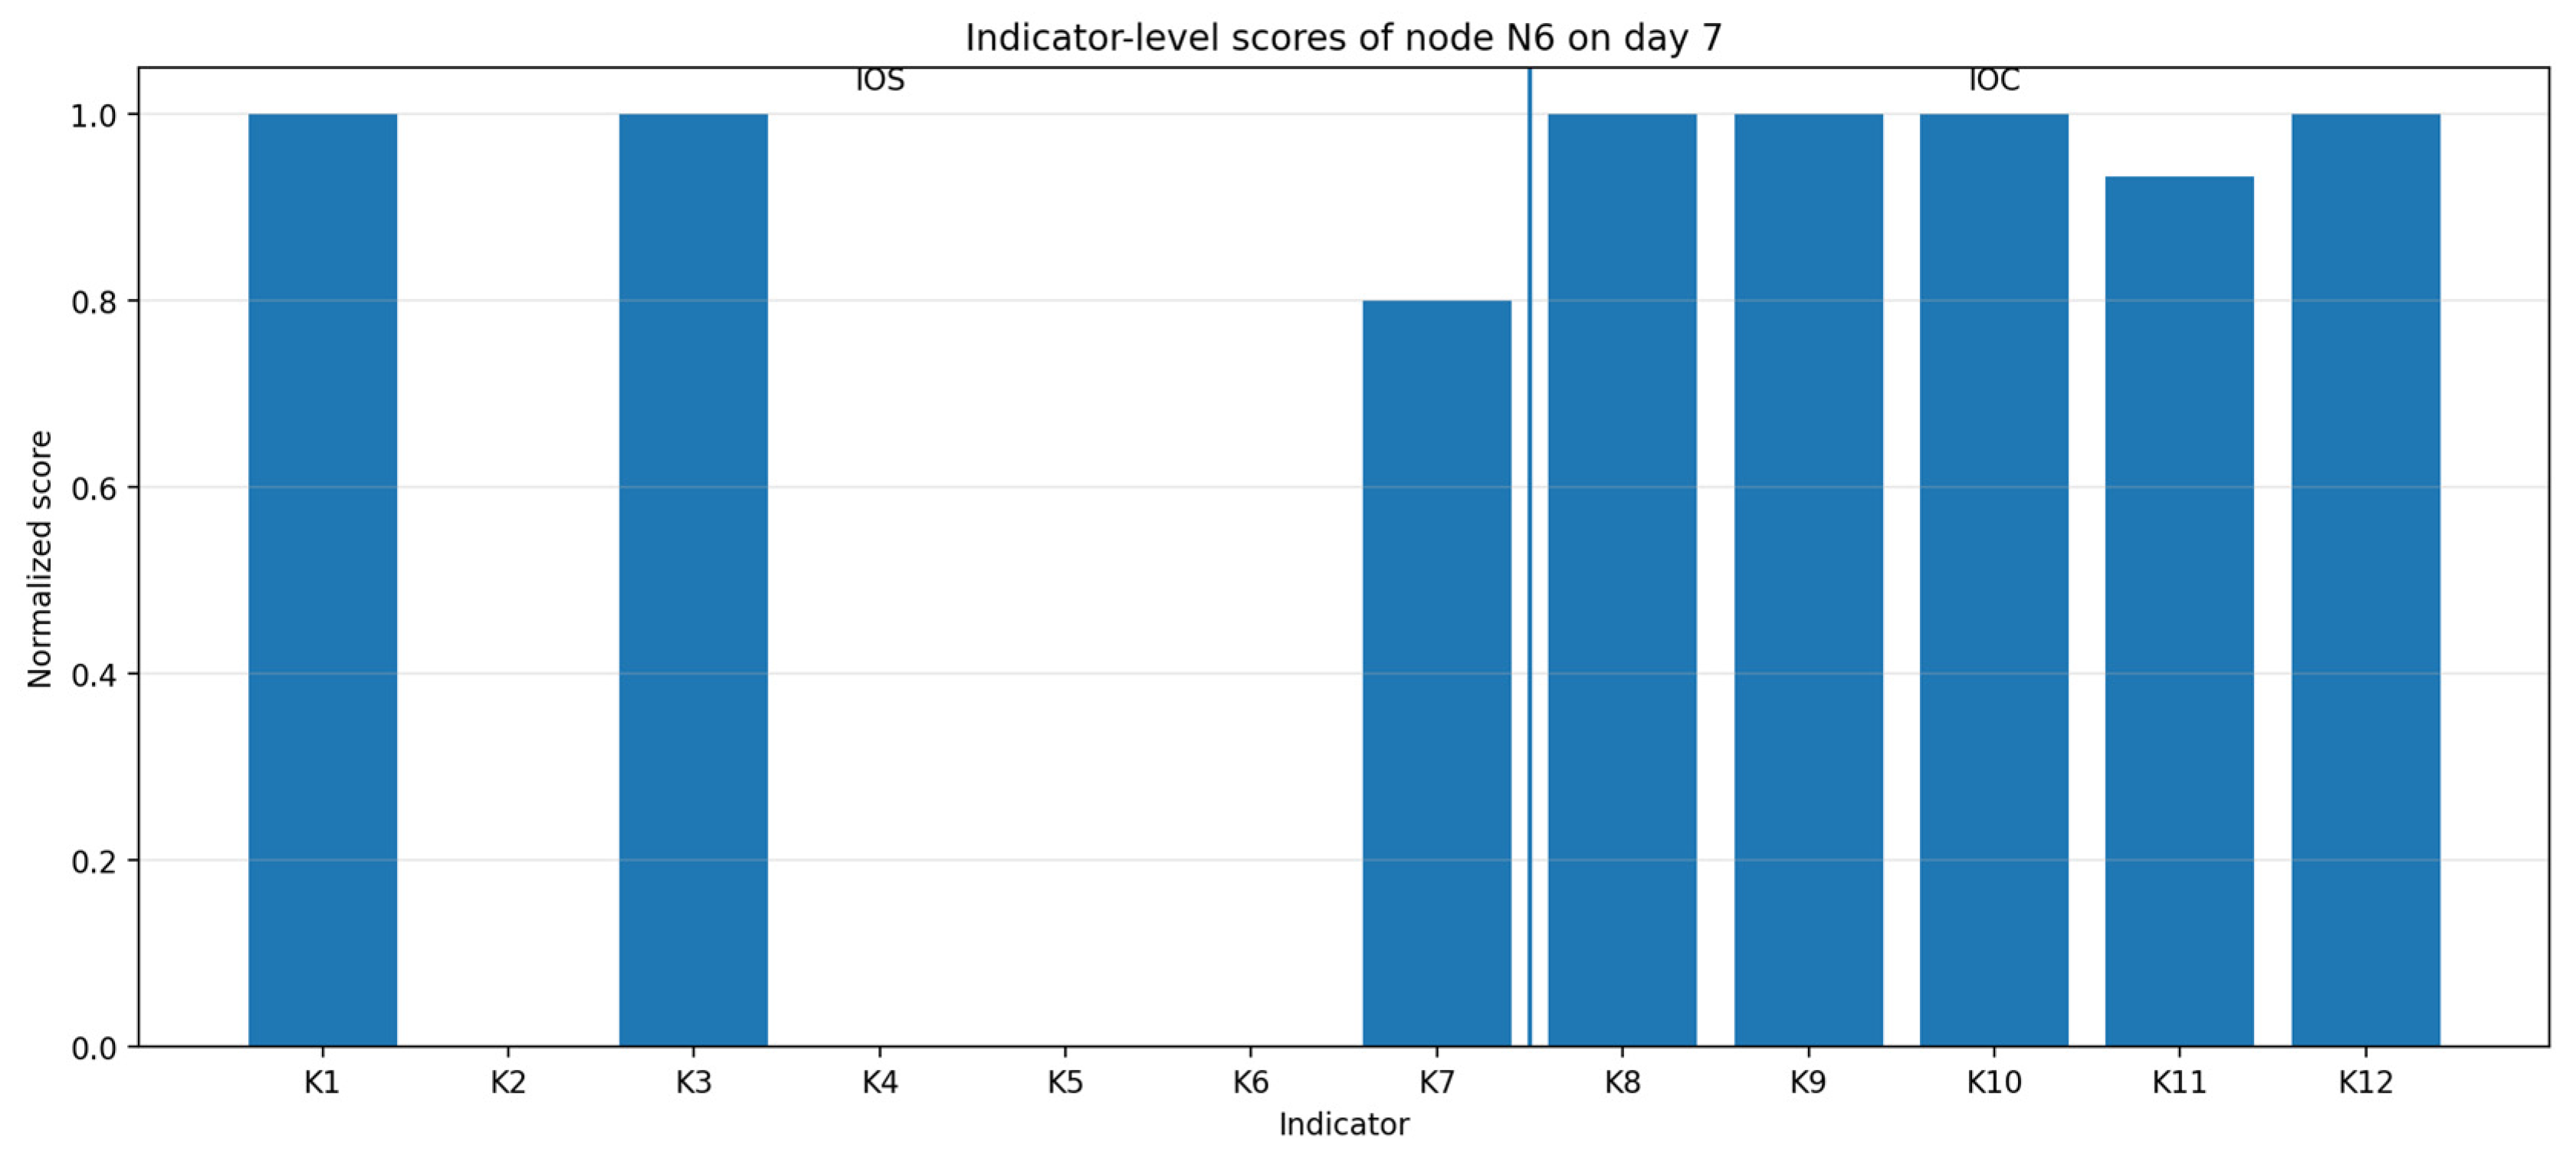
Figure 10 presents the indicator-level scores of the node
on day 7.
The graph shows that the main decrease in the score is associated specifically with IOS channel indicators, whereas the IOC channel indicators for this node remain at a relatively high level. This result is fully consistent with the design of the second phase of the experiment, within which the indicators
,
,
, and
were deliberately degraded for the group of nodes to which the selected node belongs. At the same time, indicators
,
, and
remain at a high level, and the IOC channel indicators do not demonstrate significant deterioration. This makes it possible to unambiguously conclude that the problem of this node in the second phase is not related to compromise but to the accumulation of problems associated with the general level of security. Based on the results shown in
Figure 10, the administrator can directly focus corrective actions on installing critical updates, reviewing automatic screen lock parameters, checking time synchronization and adjusting the compromised-password list update frequency policy.
Figure 11 presents indicator-level scores of the critical database node
on day 14.
Unlike the previous case, the main decrease is observed not in the IOS channel indicators but specifically in the IOC channel indicators. This is consistent with the logic of the fourth phase of the experiment, in which signs of active compromise were simulated for all indicators in the IOC channel on the critical database node, while the IOS channel indicators remained relatively stable. Thus, at the indicator level, the model again correctly reflects the nature of the problem. In this case, the issue is not the gradual accumulation of security policy violations but signs of potential active compromise of a critical node.
4.5. Baseline Comparison and Masking Effect Analysis
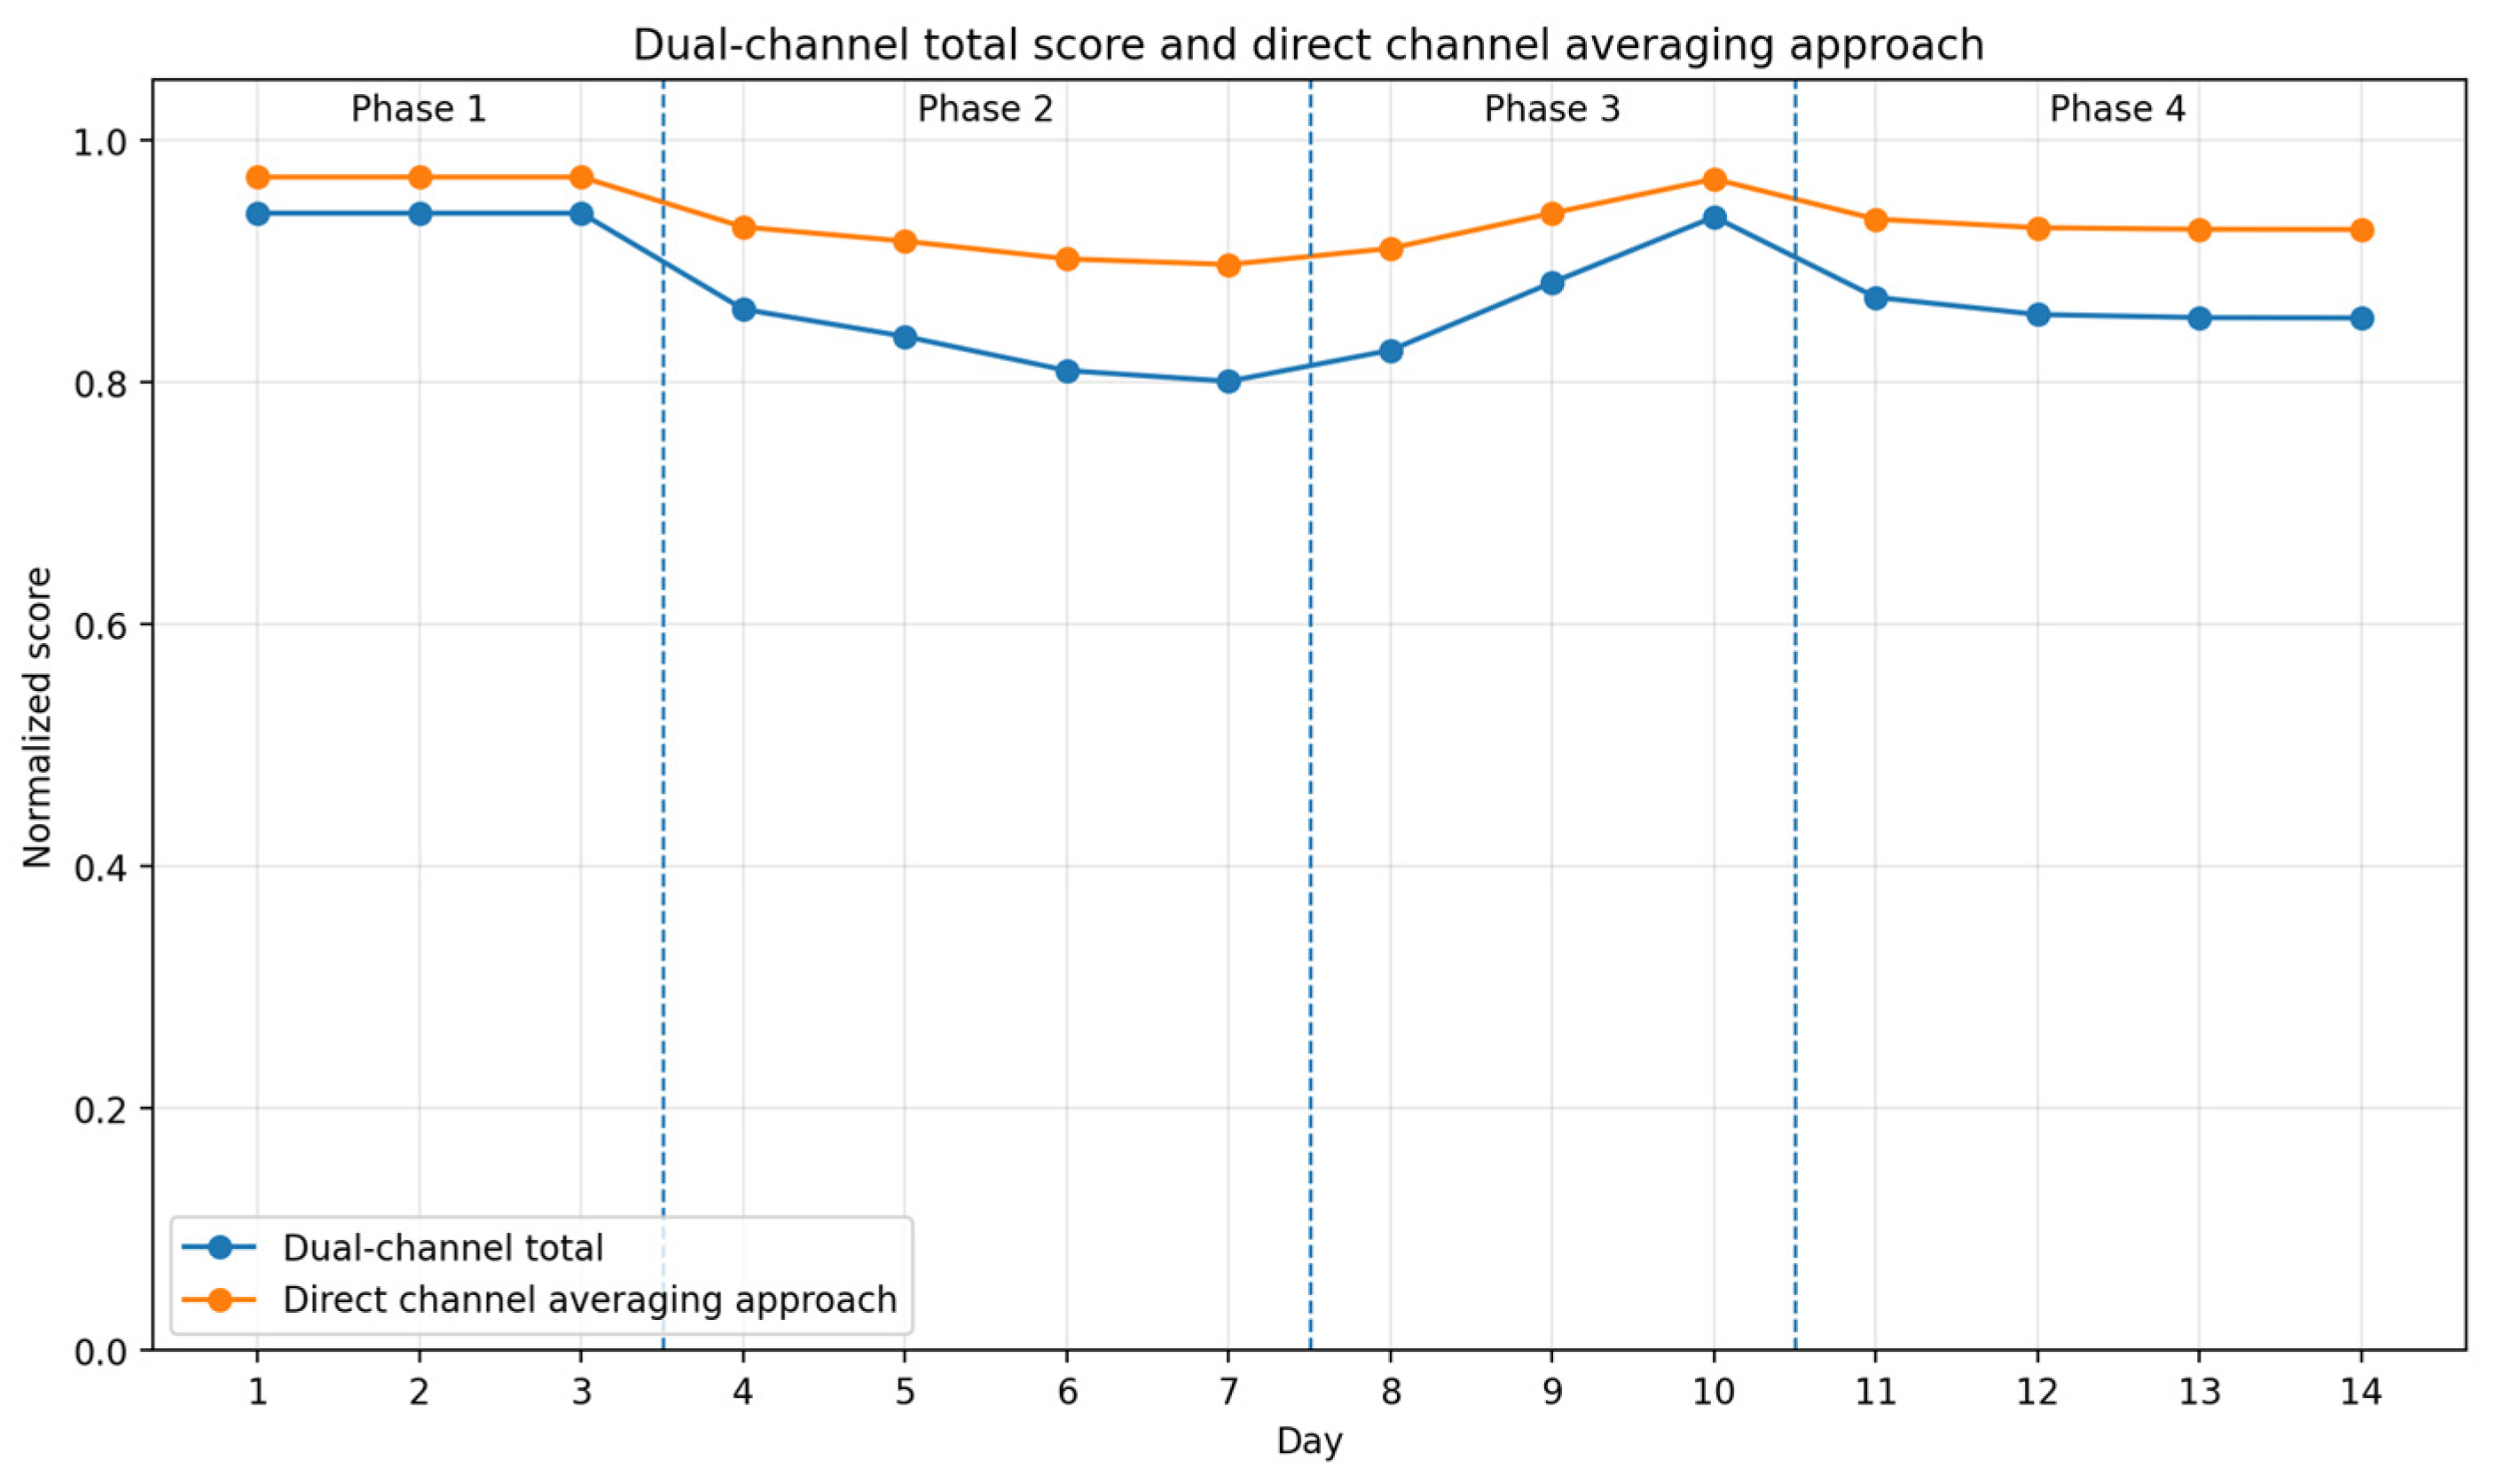
To additionally demonstrate the feasibility of the dual-channel structure of the proposed model, a comparison with a direct arithmetic channel averaging approach was performed. This approach is used only to show how the result changes when, instead of multiplicative integration of the two channels, their direct arithmetic averaging is applied.
Within this approach, for each node, a simple average of the node-level channel scores was used instead of the integral dual-channel score:
After that, the obtained node-level values, similarly to the main approach, were aggregated at the network level, taking into account the weighting coefficients of node importance:
In the case of direct averaging, high values of one channel may partially compensate for low values of the other channel. As a result, the final score becomes less sensitive to local critical degradations. Therefore, the direct arithmetic channel averaging approach is useful for illustrating the masking effect at the node-level.
Figure 12 presents a comparison of the time series of the integral dual-channel network-level score and the direct arithmetic averaging score at the network level.
As shown in
Figure 12, during all experimental phases, the values produced by the direct arithmetic averaging approach are higher than those produced by the standard dual-channel integral score. This means that direct arithmetic averaging systematically smooths signs of degradation and forms a less strict final assessment of the network state. The generalized phase-level results of this comparison are presented in
Table 7.
As can be seen from
Table 7, the smallest difference between the approaches is observed in the first phase, when the network is in a relatively stable state and both channels have high values. In this situation, the masking effect at the node level is minimal because neither IOS nor IOC demonstrates pronounced degradation. In contrast, in the second and fourth phases, the difference increases substantially, since one of the channels deteriorates much more strongly than the other. The largest relative deviation is recorded in the second phase and is approximately 10.13%, which indicates the most pronounced smoothing effect in the case of direct channel averaging.
The compensatory effect considered in this comparison occurs at the node-level channel-integration stage where direct arithmetic averaging allows a high IOS score to partially compensate for a low IOC score or vice versa. The multiplicative operator removes this cross-channel compensation for each individual node.
The relative difference
was calculated with respect to the proposed dual-channel score, because the direct averaging approach is interpreted as producing an overestimated value relative to the proposed model:
where
is the mean dual-channel score, and
is the mean direct averaging score.
It is important to emphasize that the obtained difference is not limited to a formal discrepancy between two numerical scores. The methodological significance of this result lies in the fact that simplified direct arithmetic averaging allows a low value in one channel to be compensated by a high value in the other channel. As a result, local critical degradations may be partially masked in the integral assessment. In contrast, the proposed multiplicative integration of channels preserves analytical sensitivity to such situations and provides a more transparent representation of channel-specific degradation. This is one of the key differences and practically significant properties of the proposed model.
This comparison should be interpreted as an analytical baseline rather than as an independent empirical proof of superiority over external cybersecurity assessment frameworks. Since, for values in the interval [0, 1], the arithmetic mean of two channel scores is generally not lower than their product, the direct averaging baseline is expected to produce higher values than multiplicative integration. Therefore, the purpose of this comparison is not to prove this mathematical ordering but to illustrate the compensatory behavior of direct averaging under identical input data, indicators, weights, and scenario conditions. A broader empirical comparison would require scale-matched baseline models, independent ground-truth labels, and metrics such as detection latency, relative score drop under injected degradation, ranking accuracy of affected nodes, and false-positive or false-negative behavior.
The experimental results represent a controlled numerical proof of concept of the proposed assessment procedure rather than a complete operational validation. The experiment verifies the internal consistency of the model in three aspects. First, channel consistency is checked by observing whether degradation of security indicators mainly affects the IOS channel, whereas degradation of compromise indicators mainly affects the IOC channel. Second, localization consistency is checked by verifying whether degradation introduced into selected nodes can be traced from the network level to the node level, CIA aspects, and individual indicators. Third, aggregation consistency is checked by observing whether changes in normalized indicator scores propagate through the defined aspect-level, node-level, and network-level aggregation rules. These claims are narrower than empirical validation against independent ground truth, but they define the precise scope of what the simulation demonstrates.
4.6. Sensitivity Analysis of Model Parameters
To additionally evaluate the stability of the obtained results with respect to parameter uncertainty, a sensitivity analysis was performed. The analysis focused on the main parameter groups that directly affect the aggregation results: node criticality weights, CIA aspect priority weights, indicator impact weights, and normalization parameters. For each perturbation setting, 1000 Monte Carlo runs were performed. In each run, the selected parameter group was randomly perturbed within ±10%. Weight vectors were subsequently renormalized in order to preserve the required sum-to-one constraints.
For a weight vector w, the perturbed value was calculated as
where
is the perturbed and renormalized value of the
-th weight in the
-th Monte Carlo run,
is its baseline value for
-th weight vector,
is an independently generated relative perturbation coefficient,
is a summation index used for renormalization,
is the number of components in the vector,
= 1, …, 1000, and
denotes the Monte Carlo run.
The same perturbation principle was applied to the node criticality weights, CIA aspect priority weights and indicator impact weights. For normalization parameters, the threshold values, boundary values, decay parameters, and sigmoid parameters used by the corresponding normalization functions were perturbed within the same ±10% interval while preserving admissible parameter ordering where necessary.
To quantify the effect of parameter perturbations on the resulting assessment, the sensitivity analysis was performed at two complementary levels. First, the overall deviation of the integral dual-channel network-level total score from the baseline trajectory was evaluated over the complete 14-day experimental period. For each Monte Carlo run, the absolute deviation between the perturbed and baseline network-level total scores was calculated for every day. The mean and maximum absolute deviations were then summarized for each perturbed parameter group. The results are presented in
Table 8.
The results in
Table 8 show that moderate perturbations of the weighting coefficients produce relatively small changes in the network-level total score. The smallest deviations are observed for the CIA priority weights, followed by the indicator impact weights and node criticality weights. In contrast, perturbations of the normalization parameters have a substantially stronger effect on the resulting score. The largest overall sensitivity is observed when all parameter groups are perturbed simultaneously. These results indicate that the absolute numerical value of the network-level total is influenced primarily by the calibration of normalization parameters rather than by moderate variations in the aggregation weights.
A second analysis was performed specifically for days 7 and 14, since these two time points represent different degradation patterns and constitute an important network-level comparison in the experimental scenario. Day 7 corresponds to the end of the distributed IOS-oriented degradation phase, whereas day 14 corresponds to the localized active-compromise phase of the critical database node. To evaluate the stability of their relative ordering, for each Monte Carlo run
, the paired difference was calculated as
A positive value of
indicates that the ordering
is preserved in the corresponding run. For each perturbation setting, the proportion of runs preserving this ordering and the mean, minimum and maximum paired differences were calculated. The results are presented in
Table 9.
As shown in
Table 9, the ordering
was preserved in 100% of the 1000 Monte Carlo runs for every perturbation setting. The mean difference between the day 14 and day 7 total scores remains close to 0.052 for all perturbation groups, which indicates that the average separation between the two states is comparatively stable. The narrowest range is observed when only CIA priority weights are perturbed, where
varies from 0.051099 to 0.053347. Indicator-impact and normalization-parameter perturbations also preserve a positive separation in every run. The greatest variability in the paired difference occurs when node criticality weights or all parameter groups are perturbed. Under simultaneous perturbation of all parameter groups,
ranges from 0.036581 to 0.069120. Nevertheless, even its minimum value remains positive. Therefore, within the considered ±10% perturbation range, none of the tested Monte Carlo realizations reverses the day 7 versus day 14 ordering. This indicates that the relative relationship between these two network states is considerably more stable than might be inferred from the variation of their absolute total scores considered independently.
An important additional observation concerns the magnitude of parameter-induced uncertainty relative to the score change represented in the baseline experimental scenario. Using the rounded values mentioned previously, the network-level total decreases from 0.9394 in the stable state to 0.8528 on day 14, corresponding to a decrease of 0.0866. By comparison, the maximum absolute deviation obtained when all parameter groups were perturbed simultaneously was 0.094903, which slightly exceeds this baseline-to-day-14 change. The sensitivity is dominated by the normalization parameters, so their maximum absolute deviation was 0.092918, approximately 9.28 times the deviation caused by perturbing node criticality weights 0.010015. Thus, the sensitivity analysis reveals two complementary properties of the model. On the one hand, the absolute magnitude of the scalar network-level total can be sensitive to parameter calibration, particularly to the parameters of the normalization functions. On the other hand, the paired day 7 and day 14 analysis shows that the relative ordering of these two network states remains stable throughout all tested ±10% perturbations. Consequently, small longitudinal differences in the integral dual-channel network-level total score should be interpreted with regard to the active parameter configuration, whereas the identified ordering between substantially different network states appears more robust within the investigated perturbation range. In practical deployment, careful calibration of normalization thresholds and nonlinear parameters is therefore particularly important, and the dual-channel network-level total score should be interpreted together with the separate IOS and IOC scores and the model’s drill-down outputs.
5. Discussion
The obtained results confirm the applicability of the proposed model for the quantitative assessment of data security in a corporate network and demonstrate its ability to provide consistent multi-level analysis of the security state. Within the baseline 14-day scenario, the model correctly reflected both the stable initial state of the network and two different types of degradation: degradation associated with a decrease in the level of implemented protective mechanisms and degradation caused by signs of active compromise of a critical node. This indicates that the proposed approach is sensitive not only to the fact that the security state changes but also to the nature of this change.
An important feature of the obtained results is that the dual-channel structure of the model makes it possible to distinguish the nature of the decrease in the integral network score depending on which channel is primarily affected. The proposed approach preserves the semantic difference between deviations in the state of protective mechanisms and manifestations of potential compromise. This has practical significance because it allows the model to be used not only as a tool for formal assessment but also as a means of analytical decision support for system administrators or security analysts.
It is equally important that the model provides a consistent transition from the global network level to lower levels of detail. The network-level analysis makes it possible to detect the general deterioration of the corporate network state, while the node-level analysis localizes the problematic network elements. The node-level helps quickly identify problematic nodes. Further transition to the CIA aspect level makes it possible to determine whether confidentiality, integrity or availability is affected most significantly. Finally, the indicator-level analysis makes it possible to identify the specific security characteristics or compromise-related signs responsible for the decline in the final score. Thus, the multi-level structure of the model supports a top–down analytical workflow from general situational awareness to root-cause localization.
The separate comparison with the simplified direct arithmetic channel averaging approach showed that this approach systematically produces higher final scores than the proposed dual-channel model. This indicates the presence of a partial masking effect at the node-level in the case of direct channel integration and confirms the feasibility of multiplicative channel combination at the node-level for stricter and more informative assessment of the security state. At the node level, multiplicative IOS and IOC channel integration prevents a high score in one channel from compensating for substantial degradation in the other channel. This masking-resistance property is not extended to network-level aggregation across nodes, where the resulting scores remain weighted situational summaries determined by the normalized node-criticality coefficients.
At the same time, strict multiplicative integration should be interpreted carefully in operational environments where IOC indicators may include transient false positives or low-confidence alerts. If such events are used directly, a temporary decrease in the IOC channel may disproportionately reduce the integral node score and contribute to alert fatigue. To mitigate this issue in practical deployment, IOC scores may be calculated using additional confidence weighting, time-window smoothing, event persistence checks or dampening mechanisms before being included in the multiplicative integration. This does not change the core mathematical logic of the proposed model but provides an operational layer that makes the model more robust to noisy or short-lived compromise indicators.
The conducted experiments confirmed that the proposed model effectively combines dual-channel representation and multi-level aggregation. This makes it suitable for use as a decision-support tool in the tasks of monitoring, analysis and assessment of data security in corporate networks.
At the same time, the obtained results should be interpreted with regard to certain limitations of the proposed model. First, the model was evaluated in a simulation environment using synthetically generated data, which made it possible to reproduce different phases of corporate network operation in a controlled way but does not fully reflect the complexity of real network environments. Second, the current study used a limited set of 12 indicators, which is sufficient to demonstrate the operability of the model but does not cover the entire range of possible characteristics of the security state. Third, the weighting coefficients in the model are formed on the basis of controlled scoring profiles, which requires additional assessments based on real expert judgments. Despite these limitations, the obtained results confirm the analytical suitability of the model as a formalized tool for assessing data security in corporate networks.
It should also be noted that the network-level score in the current version of the model should be interpreted as a weighted situational assessment of the overall corporate network state. Since network-level aggregation uses normalized node criticality weights, the complete degradation of a single highly critical node affects the final score proportionally to its assigned weight. Therefore, this score is useful for representing the average weighted state of the network, but it should not be treated as a complete operational severity index by itself. In practical deployment, the proposed model should be complemented by critical-node alerts, threshold-based rules or criticality-gated decision logic that prevents the degradation of a high-importance asset from being overlooked. In this sense, the multi-level drill-down mechanism remains essential, because it allows the administrator to identify whether a moderate decrease in the global score is caused by a local failure of a highly critical node or by distributed degradation across multiple less critical nodes.
From the computational point of view, the proposed model is lightweight because it relies mainly on normalization functions, weighted summation and multiplicative channel integration. For each assessment cycle, the computational cost grows linearly with the number of nodes and applicable indicators, while the number of CIA aspects is fixed. Therefore, the dominant factor in practical deployment is expected to be not the aggregation procedure itself, but the collection, synchronization and preprocessing of observations from heterogeneous enterprise data sources. In real-time or near-real-time environments, the model can be implemented as a periodic assessment layer integrated with SIEM or monitoring pipelines, where normalized indicators are recalculated according to the required update interval. A detailed empirical evaluation of processing latency, data ingestion overhead, and integration costs with SIEM/SOAR platforms remains a separate direction for future work.
The 14-day experimental scenario should be interpreted as a controlled proof-of-concept validation rather than a complete operational validation of the model. Its purpose was to demonstrate the internal logic of the proposed assessment procedure, the separation of IOS and IOC degradation, and the possibility of multi-level analytical drill-down. However, the use of synthetic data limits the generalizability of the obtained results. Real corporate environments may include incomplete telemetry, noisy event streams, delayed observations, heterogeneous logging formats, and multi-stage attack patterns. Therefore, future validation should involve real enterprise telemetry, SIEM logs, endpoint monitoring data, or established cybersecurity benchmark datasets containing complex multi-stage attack scenarios, including APT-like behavior.
The experimental scenario verifies whether the proposed aggregation procedure consistently reflects injected degradation at the channel, node, CIA aspect, and indicator levels. However, because the experiment is based on synthetic data and predefined degradation phases, it does not evaluate independent detection accuracy, false-positive rates, false-negative rates, operational latency, or robustness under noisy real-world telemetry. These aspects require additional experiments using real enterprise data or established cybersecurity benchmark datasets and are considered a separate direction for future work.
It is important to emphasize that the obtained scores are directly comparable across time only when the same weighting parameters and normalization settings are used. If node criticality weights, CIA priority weights, indicator impact weights or normalization parameters are revised, the resulting scores should be interpreted as belonging to a new assessment configuration. In such cases, historical scores should be recalculated using the updated configuration if longitudinal comparability is required.
In the present proof-of-concept experiment, the weighting parameters were not obtained through a human-subject expert elicitation study. Instead, three scenario-defined scoring profiles were used to construct a controlled and reproducible simulation configuration. These profiles were designed to reflect small variations around predefined node criticality classes, CIA aspect priorities, and indicator impact assumptions. The values from the three profiles were averaged and then normalized according to the corresponding equations of the model. Therefore, the reported weights should be interpreted as controlled scenario parameters used for numerical demonstration, not as empirical evidence of inter-rater agreement among independent experts. In future empirical validation, these parameters should be obtained from real expert panels, and the agreement among experts should be assessed using Kendall’s coefficient of concordance or another appropriate inter-rater agreement statistic.
Further development of this research should be associated with expanding the set of indicators and testing the behavior of the model in more complex scenarios of corporate network operation. Of particular interest is the possibility of using the model as an analytical core for distributed agent-oriented monitoring systems capable of combining observation collection, normalization and multi-level aggregation of results within a unified assessment process. This will make it possible to move from simulation-based validation of the model to its practical implementation in real corporate environments. Future work should include broader comparative validation against selected quantitative cybersecurity assessment frameworks and benchmark datasets, provided that their outputs can be mapped to comparable security-state assessment metrics.




 ,
,