Article

Surface EMG Amplitude and Countermovement Jump Height Dissociate in the Minutes Following a Conditioning Activity in Youth Soccer Players

Department of Coaching Education, Faculty of Sport Sciences, Pamukkale University, 20160 Denizli, Türkiye
Appl. Sci. 2026, 16(18), 9084; https://doi.org/10.3390/app16189084 (registering DOI)
Submission received: 7 July 2026 / Revised: 9 September 2026 / Accepted: 10 September 2026 / Published: 13 September 2026
(This article belongs to the Special Issue Biomechanics and Human Movement Analysis in Sport)

Featured Application

Time-resolved surface-electromyography monitoring alongside jump testing during the minutes following a conditioning activity may reveal athletes who sustain mechanical output while surface EMG amplitude rises disproportionately, a pattern that a jump test alone cannot detect.

Abstract

Post-activation performance enhancement (PAPE) is often attributed to elevated neural drive, yet neuromuscular and mechanical responses are rarely tracked concurrently. This study examined whether the two scale proportionally over the 1–4 min following a conditioning activity, with a maximal countermovement jump (CMJ) at each minute. Twenty-two male youth soccer players performed a baseline CMJ, a conditioning activity, then a CMJ at each minute to 4 min, with bilateral vastus lateralis and semitendinosus EMG (fixed 300 ms pre-take-off window) and jump height recorded simultaneously. Jump height varied across time, owing to a transient decrease at 1 min (−1.41 cm); from 2 min onward, it was equivalent to baseline (TOST, ±1.5 cm, all p ≤ 0.005). The composite EMG index instead rose almost exclusively at 4 min (dz = 3.22), as did each channel individually, producing a signal × time interaction (F(3, 63) = 108.85, p < 0.001) and a decoupling index of +120.4%; the within-participant association between the two measures was weak (rrm = 0.11). Surface EMG amplitude can therefore rise sharply where mechanical output is equivalent to baseline within ±1.5 cm, and cannot be assumed to index a proportional mechanical gain. With no control condition, the observed time course reflects the conditioning activity together with the intervening maximal jumps.

1. Introduction

The acute enhancement of voluntary force and power that can follow a bout of high-intensity muscular activity is commonly termed post-activation performance enhancement (PAPE), to distinguish it from the twitch-level post-activation potentiation (PAP) that arises from myosin regulatory light-chain phosphorylation [1]. Whereas PAP has a short half-life and is tightly coupled to phosphorylation, the slower voluntary enhancement captured by PAPE has been attributed to a broader set of mechanisms, including elevated muscle temperature, altered muscle and cellular water content, and increased neural drive [1,2]. Within this framework, the net performance observed at any given recovery time point is generally interpreted as the momentary balance between a potentiating process and a coexisting fatigue process that dissipates over time [3,4].
The distinction between PAP and PAPE is more than terminological, because the two phenomena follow different time courses and do not reliably co-occur. Phosphorylation of the myosin regulatory light chains increases the calcium sensitivity of the actin–myosin interaction and augments the electrically evoked twitch, but this state is established rapidly and decays over the first minutes after the conditioning contraction, so that twitch potentiation is typically greatest immediately after the conditioning activity and is already dissipating over the interval in which voluntary performance is usually tested [1,3]. When the literature is restricted to studies that verified potentiation with an evoked response at the moment voluntary performance was measured, voluntary enhancement is observed in the absence of twitch potentiation and fails to appear when twitch potentiation is present, indicating that the mechanisms underlying PAPE are at least partly distinct from those underlying PAP [5]. The mechanisms that plausibly operate over the longer voluntary time scale are correspondingly slower. Muscle temperature rises with a conditioning activity, and short-duration performance improves by approximately 2–5% per degree Celsius increase in muscle temperature through effects on conduction velocity, excitation–contraction coupling and cross-bridge kinetics, although this relation reverses once core temperature rises into hyperthermia [6]. Fluid shifts alter muscle and cellular water content and thereby the architecture of the contracting muscle, and neural drive may increase [1,2]. Because these processes have dissimilar latencies and are superimposed on a fatigue process that is itself dissipating, the mechanical output measured at any single recovery minute is an aggregate whose composition changes from minute to minute [3,4].
The magnitude of the voluntary response is further conditioned by characteristics of the athlete and of the prescription. Fiber-type distribution is one such characteristic: in the human knee extensors, twitch potentiation is inversely related to twitch time to peak torque, and the participants showing the largest potentiation carried a substantially greater proportion of type II fibers than those showing the smallest [7]; the interplay between potentiation and fatigue during repeated maximal contractions differs correspondingly between fiber-type groups [8]. Training status is a second: meta-analytic estimates of the effect on muscular power are appreciably larger in athletes (0.81) than in trained (0.29) or untrained (0.14) participants [9]. Prescription matters at least as much. The same meta-analysis reported larger effects for multiple than for single sets (0.66 versus 0.24), for moderate (60–84% of one-repetition maximum) than for heavy (>85%) conditioning intensities (1.06 versus 0.31), and for rest intervals of 7–10 min than for shorter or considerably longer intervals [9]. A single heavy set performed at 85% of one-repetition maximum and followed by a rest interval of a few minutes (the configuration typical of complex and contrast sets as they are actually deployed in team-sport practice) therefore falls in the region of this parameter space in which the expected mechanical benefit is smallest.
Consistent with that expectation, the applied literature contains many null and negative findings, soccer included. Heavy conditioning at 90% of one-repetition maximum, whether specific (half back squat) or non-specific (bench press), left sprint and countermovement jump performance unchanged in national-level female players [10], and a short, repetitive isometric conditioning protocol transiently impaired jump height rather than enhancing it in national-level young male players [11]. Such outcomes are difficult to interpret mechanistically, because in nearly every case, the only variable recorded is the mechanical one. A null mechanical result cannot distinguish a neuromuscular state that has returned to baseline from one that has changed substantially but whose consequences cancel at the level of jump height, and that distinction requires the neuromuscular side of the balance to be measured directly.
The aggregate mechanical benefit of a conditioning activity is, accordingly, modest and strongly time-dependent. Meta-analyses report only small pooled effects of conditioning activities on jumping and other ballistic tasks [12,13,14], with the response depending heavily on the rest interval: jumping performance is often unchanged overall, is impaired at very short intervals (0–1 min), and becomes favorable mainly at approximately 4–7 min [15]. This variability is pronounced in youth soccer players, a population that nonetheless responds positively to strength, plyometric, and complex training over the longer term [16,17,18]. Despite the centrality of enhanced neural drive to the PAPE rationale, the neuromuscular side of this balance is seldom measured directly across the recovery window: most studies report only the mechanical outcome, and when surface electromyography (EMG) is recorded, it is typically examined at one or two discrete time points rather than tracked as a trajectory alongside performance [19,20]. Even in complex-contrast training, where PAPE is the assumed working mechanism, neural or potentiation indices are rarely quantified during the training sessions themselves [21].
Whether surface EMG amplitude and mechanical output change in proportion in the minutes following a conditioning activity is not a trivial question. If the two scale together, EMG conveys little information beyond the performance test itself. If instead, EMG amplitude escalates while mechanical output remains stable, the result is an EMG–mechanical output dissociation. Such a pattern would be consistent with compensation by the central nervous system for residual peripheral limitations, through increased motor-unit recruitment or firing rate without a proportional mechanical return, although it would not by itself demonstrate it. We use neuromechanical decoupling here as an operational, descriptive term for this within-window amplitude–output dissociation rather than as a claim of a novel physiological mechanism; the phenomenon the present design can establish is a dissociation between the amplitude of the recorded surface EMG signals and flight-time-derived jump height, and the term is used in that restricted sense throughout. Conceptually, it is continuous with the EMG–force dissociation long described under fatigue, and its novelty in the present context is methodological, resolving both signals with repeated, time-resolved measurements within this brief window. Such an amplitude–output dissociation is well documented in the fatigue literature, in which surface EMG amplitude commonly rises to sustain a given force as contractions are repeated [4,22], although the ambiguity of surface EMG amplitude as an index of neural drive warrants cautious interpretation [23,24,25]. Whether this dissociation also emerges within the brief, metabolically distinct window that follows a conditioning activity, where potentiation and fatigue coexist, has not been established with repeated within-participant measurements.
Therefore, the present study simultaneously tracked surface EMG amplitude (a composite bilateral EMG index of the knee extensors and flexors) and mechanical output (countermovement jump height) across the 1–4 min period following a conditioning activity in youth soccer players, during which a maximal CMJ was performed at each minute, using a linear mixed-effects framework that respects the repeated-measures structure of the data. The aim was to determine whether surface EMG amplitude scales proportionally with jump performance across this period or, instead, diverges from it. Three hypotheses were tested. Jump height would show little to no change across the observation period, consistent with a small and, at most, late-emerging PAPE effect. The composite EMG index would increase across the observation period. And the increase in EMG would significantly exceed the change in jump height, producing a measurable amplitude–output dissociation evidenced by a signal × time interaction and a positive within-participant decoupling index. By resolving the full neuromuscular and mechanical trajectories simultaneously, rather than sampling EMG at isolated time points, this design provides, to our knowledge, the first per-minute account of whether surface EMG amplitude and mechanical output remain coupled across the first four minutes following a conditioning activity.

2. Materials and Methods

2.1. Participants

Twenty-two male youth soccer players (mean ± SD; age 17.0 ± 0.6 years; height 175.0 ± 3.5 cm; body mass 67.0 ± 5.4 kg; one-repetition maximum (1RM) back squat 132.1 ± 12.9 kg, range 108–159 kg) volunteered to participate. All athletes were members of a competitive academy and had at least 3 years of systematic resistance and field-based training. Participants were free from lower-extremity injury within the previous 6 months, had no history of neuromuscular disorders, and were not using medications known to affect muscle function.
An a priori power analysis was conducted in G*Power 3.1 [26] for a within-participant repeated-measures analysis of variance (F tests → ANOVA: repeated measures, within factors) with one group and five measurements, assuming a large effect (Cohen’s f = 0.59, equivalent to f2 = 0.35), α = 0.05, power = 0.80, a correlation among repeated measures of 0.50 and a nonsphericity correction of ε = 1.0. The composite EMG amplitude index (an ad hoc summary index, defined and qualified in Section 2.2.5) was designated the primary endpoint for this calculation, because the study was powered to detect the time course of activation rather than a mechanical gain. The minimum required total sample size under these assumptions was six participants; 22 were recruited to preserve power in the presence of the sphericity violations anticipated for the EMG outcomes. Because the calculation was anchored to a large effect, it establishes sensitivity to effects of that magnitude only; smaller but potentially meaningful changes in jump height are therefore addressed by the equivalence analysis described in Section 2.3 rather than inferred from a non-significant omnibus test. All participants and their legal guardians provided written informed consent prior to participation. The study was conducted in accordance with the Declaration of Helsinki and was approved by the Non-Interventional Clinical Research Ethics Committee of Pamukkale University (Protocol No.: E-60116787-020-804599; decision no. 23 of the meeting of 16 December 2025).

2.2. Data Collection

2.2.1. Experimental Design

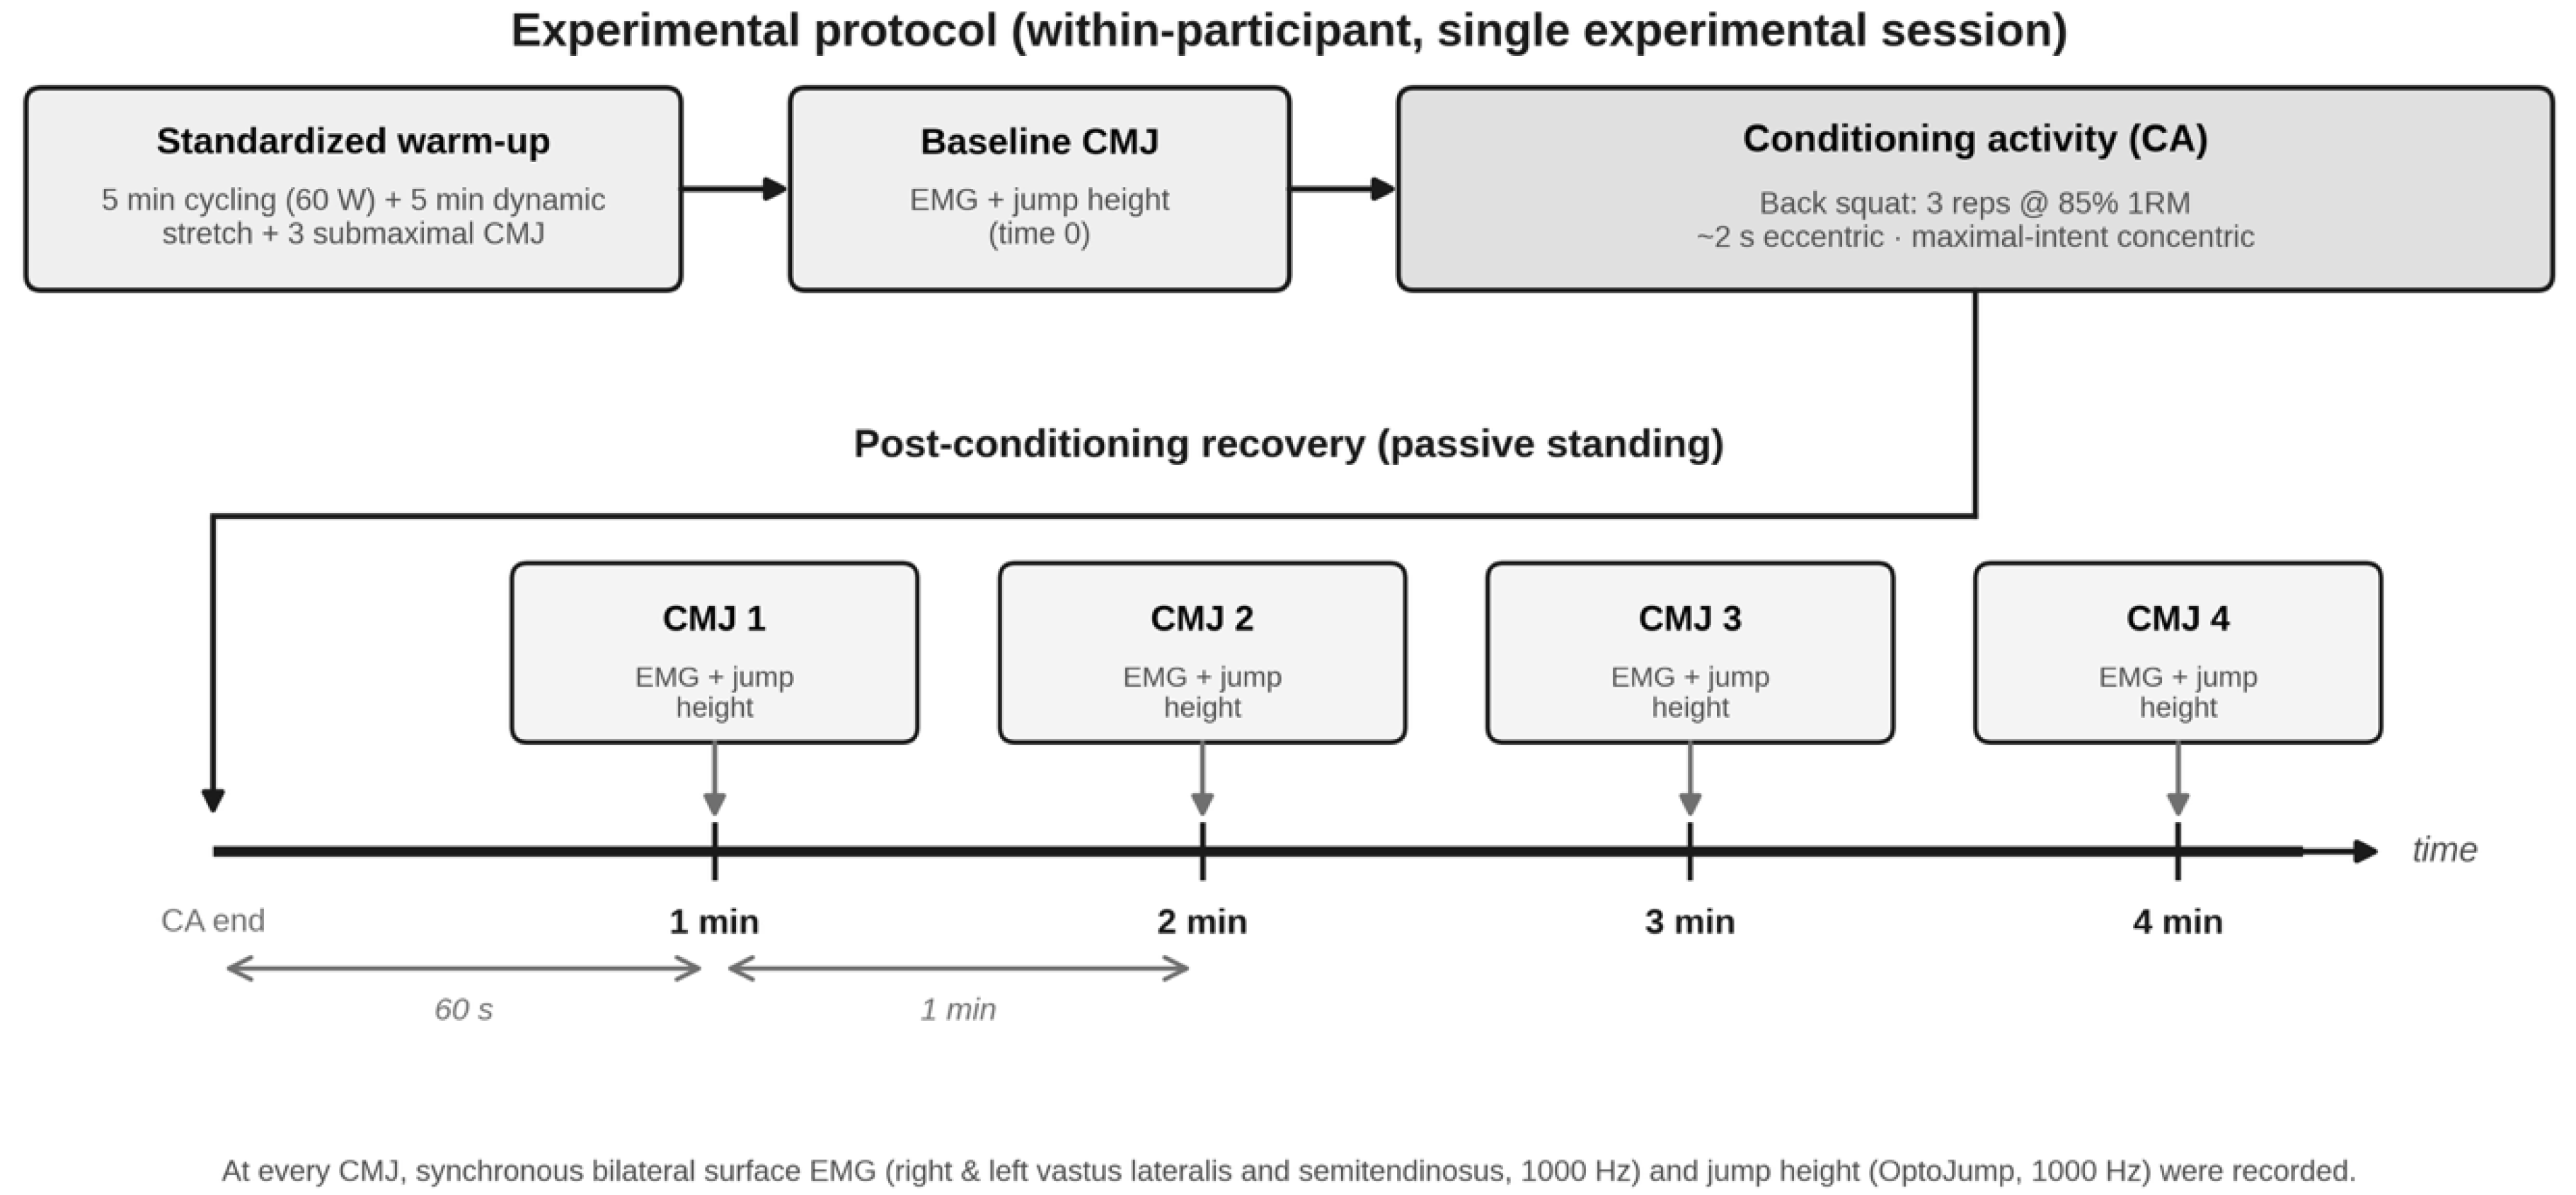
A within-participant, repeated-measures design was used. Participants attended two laboratory sessions separated by at least 72 h. The first session served as a familiarization to the testing procedures and included the determination of the one-repetition maximum (1RM). On the experimental day, participants completed a standardized warm-up consisting of 5 min of cycling on a stationary ergometer at 60 W, followed by 5 min of dynamic lower-limb stretching and three submaximal CMJs at progressively increasing intensities (approx. 50%, 75%, and 90% of perceived maximum effort), after which a baseline countermovement jump (CMJ) was recorded. A conditioning activity was then performed, and CMJs were repeated at 1, 2, 3, and 4 min after the conditioning activity. Surface electromyography (EMG) and jump height were recorded simultaneously during every CMJ, yielding five measurements per participant (baseline and four post-conditioning time points). The overall experimental protocol is summarized in Figure 1.

2.2.2. Maximal Strength (1RM) Assessment

Lower-limb maximal strength was determined as the 1RM in the back squat using a standardized incremental loading protocol following established procedures [27]. Briefly, participants performed a specific warm-up consisting of 5–10 repetitions at 50% of their estimated 1RM, followed by 3–5 repetitions at 75%, and 1 repetition at 90%. Thereafter, the load was increased by 2.5–5.0 kg until the participant failed to complete a repetition with proper technique. A maximum of five attempts was allowed to determine the 1RM, with 3–5 min of passive rest between attempts. A successful trial required the participant to descend until the inguinal crease was below the superior border of the patella (parallel squat). The 1RM was used to prescribe the load of the conditioning activity and was not entered as a covariate in any statistical model; it is reported here as a descriptive characteristic of the sample.

2.2.3. Conditioning Activity

The conditioning activity consisted of 3 repetitions of the back squat at 85% of the participant’s 1RM [9,12]. The repetitions were performed with a controlled eccentric phase (approx. 2 s) and a maximal intended concentric velocity. A standard Olympic barbell and power rack were used. Following the completion of the final repetition of the conditioning activity, participants rested passively in a standing position. Exactly 60 s after racking the barbell, the first post-conditioning CMJ was initiated, with subsequent jumps strictly timed at the 2, 3, and 4 min marks.

2.2.4. Countermovement Jump

Jump height was derived from flight time recorded with an optical measurement system (OptoJump Next, Microgate, Bolzano, Italy) sampling at 1000 Hz, using the flight-time equation h = g · tf2/8, where tf is flight time and g = 9.81 m·s−2. Participants performed CMJs with hands placed strictly on the hips (akimbo) to eliminate the contribution of arm swing. Participants were instructed to descend to a self-selected depth and immediately jump as high as possible. A single maximal effort was performed at each designated time point to adhere to the strict testing timeline. A single trial per time point was used deliberately to preserve the strict minute-by-minute schedule and to avoid the additional fatigue or potentiation that repeated maximal jumps would introduce at each time point; flight-time-derived jump height from this optical system is highly reliable at the single-trial level [28].

2.2.5. Surface Electromyography

EMG was recorded bilaterally from the vastus lateralis (VL) and semitendinosus (ST) with a wireless surface EMG system (FREEEMG 1000, BTS Bioengineering, Milan, Italy) at a sampling rate of 1000 Hz. After standard skin preparation (shaving, light abrasion, and cleansing), bipolar electrodes were positioned over each muscle in accordance with SENIAM recommendations [29]. The raw signal was band-pass filtered (fourth-order Butterworth, 20–450 Hz), full-wave rectified, and converted to a linear envelope using a root-mean-square (RMS) moving window (window length, 100 ms). The optical system was synchronized with the EMG system and delivered a TTL trigger pulse at the instant of take-off, that is, at the loss of contact. Because an optical system records contact and flight but does not identify movement onset or the lowest countermovement position, the analysis window was defined by backward extrapolation from this trigger as a fixed 300 ms interval immediately preceding take-off, hereafter the pre-take-off window. Because neither the onset of propulsion nor the lowest countermovement position was identified kinematically or kinetically, this interval is not a biomechanically defined propulsive phase and cannot be assumed to represent an equivalent portion of the movement across participants or across time points; the outcome is therefore reported throughout as EMG amplitude within a fixed 300 ms pre-take-off window. The quantity extracted from this window was the mean RMS amplitude across it, expressed relative to the peak RMS within the corresponding window of the baseline jump (see below). Prior to normalization, a residual amplitude offset was subtracted from the RMS envelope of each channel, computed as the mean RMS of the middle 1 s of a 3 s quiet period recorded during passive standing immediately before the baseline jump, to remove the electrical noise floor of the recording system together with resting muscle tone. All pre-take-off-window traces (22 participants × 5 time points × 4 channels = 440 traces) were inspected visually for baseline shift, signal clipping, 50/60 Hz power-line interference, and flatlines indicative of sensor detachment or wireless drop-out, following best-practice recommendations for surface EMG detection, conditioning and pre-processing [30]. Traces displaying any of these features were re-examined against the corresponding full-trial recording. Exclusion was reserved a priori for traces confirmed as technical failures. No trace met this criterion, and consequently no trial, channel or participant was excluded from any analysis; the dataset analyzed is therefore complete (110 observations with no missing values, Section 2.3). No automated artifact-rejection algorithm was applied, because the fixed 300 ms pre-take-off window contains no quiescent period against which an amplitude-threshold criterion could be calibrated. Signal acquisition and pre-processing are reported here in accordance with the CEDE-Check recommendations for reporting studies that use EMG [31]. Because the offset subtraction is applied uniformly, a genuinely near-silent signal can yield a normalized value at or marginally below zero whenever activation falls below the resting noise floor that was subtracted. Three pre-take-off-window values in the right ST channel fell in this range and were retained on the same basis: visual inspection showed clean baselines, without the flatlines or erratic traces that indicate hardware failure, and their influence was quantified by a leave-one-participant-out sensitivity analysis rather than by exclusion. For each muscle and side, the mean RMS amplitude within the 300 ms pre-take-off window was normalized to the peak RMS recorded within the corresponding 300 ms pre-take-off window of that participant’s baseline CMJ and expressed as a percentage, in line with consensus recommendations for task-specific EMG amplitude normalization [32]. Restricting both the reference and the reported value to the pre-take-off window prevents the large amplitude transients of the braking and landing phases, which in the hamstrings can exceed activity during propulsion, from setting the reference. Because the numerator is a mean across the window and the denominator an instantaneous maximum within that same window, normalized baseline values are necessarily well below 100% by construction: baseline channel means ranged from 21.40% to 25.10%. The index is therefore a mean-to-peak ratio and is sensitive both to the amplitude of activation and to how sustained it is across the window; at the channel level, a value approaching 100% indicates that mean activation across the window had risen to approximately the level of the instantaneous baseline peak. A composite EMG amplitude index was then computed as the bilateral mean of the summed VL and ST activity: composite index = (right VL + right ST + left VL + left ST)/2. The index is presented strictly as an ad hoc summary index (an arithmetic summary of the four recorded channels) and not as a validated measure of total activation or of the overall neuromuscular demand of the jump: the two recorded muscles have different biomechanical functions during jumping, and equal weighting of their normalized amplitudes does not constitute an established physiological construct. The index is formed in two steps: the two recorded muscles are first summed within each limb (right VL + right ST; left VL + left ST), and the two limb totals are then averaged, which is why the divisor is 2 rather than 4. The index therefore expresses the average summed amplitude of one limb rather than a per-channel mean; dividing by 4 would yield a per-channel average that halves every value without altering the time course or any inferential result. Because the two channels of each limb are summed before the limbs are averaged, a composite value of approximately 100% corresponds to a per-channel mean of approximately 50% of the baseline pre-take-off-window peak; the composite scale should therefore not be read as a channel-level percentage. A representative recording, showing the raw signal, the RMS envelope, the 300 ms pre-take-off window, the quiet-standing epoch used for the offset correction and the resulting normalized values, is provided in Figure S1. It is used here as a single, global numerical overview of the four recorded channels, robust to single-channel noise, and was never intended to replace muscle-specific analysis; all four channels were also modeled individually, and the muscle-specific results carry the primary interpretative weight. The principal result does not depend on the composite: the 4 min increase was significant in each of the four channels analyzed separately (Section 3.2, Supplementary Table S1), so the composite serves only to summarize a pattern that is present channel by channel. The ST, although a knee flexor, is a biarticular muscle that contributes to hip extension during jump propulsion and was therefore treated as a propulsive contributor rather than a pure antagonist.

2.3. Data Analysis

Analyses were performed in Python 3.12 using the statsmodels (v0.14), pingouin (v0.6), SciPy (v1.12.0), and scikit-learn (v1.4.1) packages. Data are presented as mean ± SD unless otherwise stated, and the alpha level was set at 0.05. The dataset comprised 110 observations (22 participants × 5 time points) with no missing values. The analyses reported here were produced by a complete re-execution of the analysis pipeline undertaken during peer review, following an audit prompted by a reviewer’s observation of an internal inconsistency in the channel-level supplementary table. The audit identified two errors in the originally submitted analysis. In the first, the model-based standard error of the intercept had been applied to every time contrast in place of the contrast-specific standard error, which deflated the corresponding test statistics. In the second, a shift introduced while the analysis dataset was assembled from the individual device records had misaligned observations with participants. Because a shift of that kind moves values between rows without altering them, the distribution of every variable at each time point remained exactly as recorded, whereas every quantity that depends on the pairing of observations to participants was affected, among them the variance components, the within-participant effect sizes and the omnibus tests, including the effect of time on jump height. The dataset was therefore rebuilt from the raw optical- and EMG-system exports, participant by participant and time point by time point, with participant identity taken from the device record itself; the 110 observations analyzed here are those originally recorded, and no value was added, removed or edited. The entire pipeline (normalization, model fitting, contrasts, effect sizes, and the equivalence, random-slope, window-length, agonist-only and repeated-measures-correlation analyses reported below) was then re-executed from the rebuilt dataset by a single script that reads the raw data and generates every table, figure and reported value, so that no result reported here is transcribed by hand.
The time course of each outcome (jump height, the composite EMG index, and each of the four EMG channels) was modeled with a linear mixed-effects model fitted by restricted maximum likelihood. Time point (baseline, 1, 2, 3, and 4 min) was entered as a categorical fixed effect with baseline as the reference category, and a by-participant random intercept was included to account for the repeated-measures structure. The omnibus effect of time was assessed with a likelihood-ratio test comparing the full model against an intercept-only model fitted by maximum likelihood; because the design was balanced and complete, this test was corroborated by a one-way repeated-measures analysis of variance (ANOVA). Because a random-intercept-only structure implies compound symmetry (the same assumption that underlies the repeated-measures ANOVA), the adequacy of this specification was examined by refitting each primary model with an additional by-participant random slope for time, coded as a continuous linear trend, and comparing the nested models by likelihood-ratio test (Section 3.4). Sphericity (Mauchly’s test) and residual normality (Shapiro–Wilk) were examined. Mauchly’s W and the Greenhouse–Geisser epsilon are reported for every repeated-measures test, and Greenhouse–Geisser-corrected probabilities are reported throughout, irrespective of whether the sphericity assumption was violated, so that corrected and uncorrected inferences can be compared directly. The intraclass correlation coefficient (ICC) and the marginal and conditional R2 [33] were derived from the model variance components. Pairwise contrasts against baseline were obtained from the fixed-effect estimates and corrected for multiple comparisons across the four post-baseline time points using the Holm procedure [34], and the channel-level contrasts obtained in this way are reported in Supplementary Table S1; within-participant standardized effect sizes are reported as Cohen’s dz, computed as the mean of the paired differences divided by the standard deviation of those differences. A non-significant omnibus test cannot by itself establish invariance. The jump-height contrasts were therefore submitted to two one-sided tests (TOST) of equivalence [35] against a margin of ±1.5 cm. This equivalence analysis was not part of the original analysis plan: it was added during revision, in response to peer review, and the margin was specified before the equivalence tests were run but after the jump-height contrasts had been inspected. It is therefore reported here as a post hoc analysis. The margin is anchored to the resolution of the measurement system and not to a judgement of practical importance. It was taken from the device-specific smallest worthwhile change reported for Optojump-derived countermovement jump height (1.44 cm), which exceeds the corresponding typical error of measurement (1.04 cm) [36], so a difference smaller than the margin cannot be reliably distinguished from measurement noise with this system. It does not follow that a difference of up to 1.5 cm is practically negligible in this population or in this experimental context; that is a separate substantive judgement, which the present data cannot support. Equivalence was concluded when the 90% confidence interval of the mean difference lay entirely within the margin, and every equivalence conclusion reported below is conditional on that choice of bound. A stricter secondary margin of 0.2 × the between-participant baseline SD (0.62 cm) was examined for transparency, although it falls below the typical error of the system. The three near-zero pre-take-off-window values recorded in the right ST channel (Section 2.2.5) were evaluated by a leave-one-participant-out sensitivity analysis, run once with the three participants concerned excluded and once with only the single lowest value excluded.
The EMG–mechanical output dissociation was tested directly with a 2 (signal: EMG vs. jump height) × 4 (time: 1–4 min) repeated-measures ANOVA on baseline-referenced percentage change, in which a significant signal × time interaction indicates divergent trajectories of the two signals. In addition, a within-participant decoupling index (DI = %ΔEMG − %ΔJump) was computed at each post-baseline time point and tested against zero using one-sample t-tests, with the four tests corrected for multiplicity using the Holm procedure; 95% confidence intervals for the index were obtained by bias-corrected bootstrap resampling of participants (10,000 iterations). The decoupling index is an ad hoc difference between two percentage changes rather than an established physiological measure, and it is interpreted throughout as a descriptive summary of the divergence between the two signals; where jump height is close to baseline, the index necessarily approximates the percentage change in EMG amplitude. Because a fixed analysis window would capture a different proportion of the concentric burst if the duration or timing of propulsion shifted across the observation period, the complete normalization and modeling pipeline was additionally re-executed with 200 ms and 400 ms pre-take-off windows, with the normalization reference recomputed for each window (Table S2). This analysis tests whether the result depends on the length of the window; it does not establish that the duration or timing of propulsion remained invariant, which the present measurements cannot determine. As a further sensitivity analysis, the signal × time interaction and the decoupling index were recomputed with an agonist-only composite restricted to the bilateral VL, to confirm that the dissociation did not depend on the inclusion of antagonist/synergist activity. Within-participant EMG–jump associations were quantified with a repeated-measures correlation [37], which estimates the common within-participant slope between the two measures while allowing each participant a separate intercept, and which is therefore appropriate for repeated observations that violate the independence assumption of an ordinary Pearson correlation. The coefficient was computed across all five time points and, as a sensitivity analysis, across the four post-conditioning points alone, for the composite index and for each channel.

3. Results

All 22 participants completed the full protocol, and no data were missing (110 observations; 22 participants × 5 time points). Descriptive statistics are presented in Table 1. Normality of model residuals and sphericity were examined for each outcome; Greenhouse–Geisser–corrected probabilities are reported for every repeated-measures test alongside the corresponding Mauchly’s W and epsilon (Table 2). The fixed-effect estimates are reported in Table 3.

3.1. Jump Height

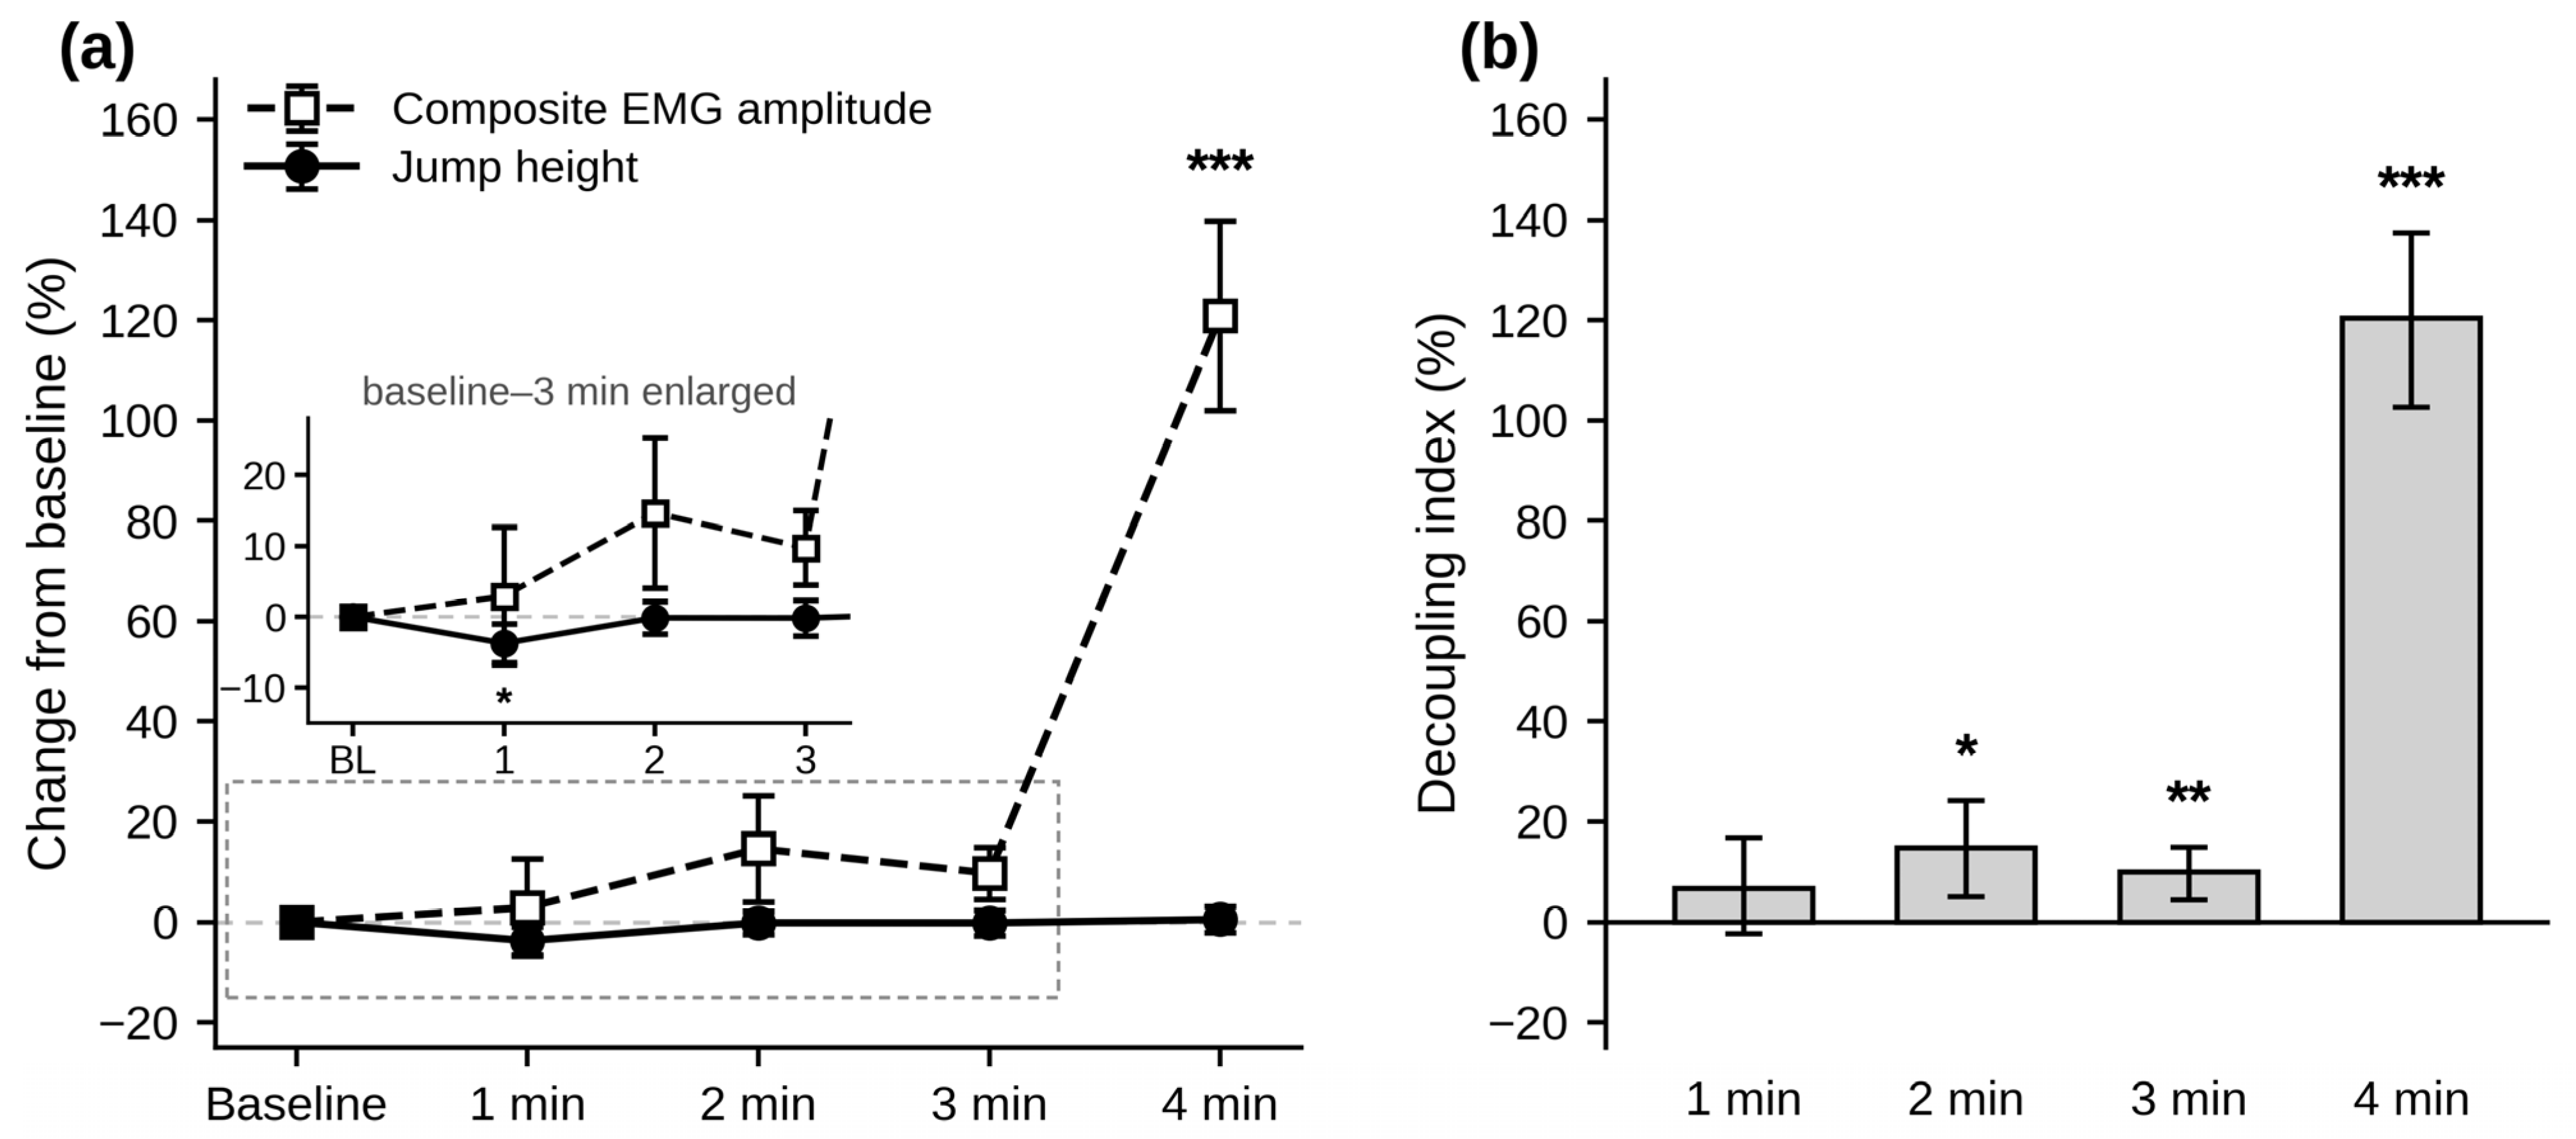
Countermovement jump height changed significantly across the observation period. The omnibus effect of time was significant in both the linear mixed-effects model (likelihood-ratio χ2(4) = 12.74, p = 0.013) and the equivalent repeated-measures analysis of variance (F(4, 84) = 3.27, p = 0.015; Greenhouse–Geisser-corrected p = 0.017, ε = 0.96; η2G = 0.029). The effect was localized to a single time point. Jump height was reduced at 1 min (b = −1.41 cm, SE = 0.50, 95% CI [−2.39, −0.43], z = −2.83, Holm-corrected p = 0.018, dz = −0.60) and did not differ from baseline at 2, 3, or 4 min (all |b| ≤ 0.18 cm, all Holm-corrected p = 1.00; Table 3, Figure 2a). Between-participant differences accounted for the majority of the total variance (ICC = 0.76), whereas time point explained little additional variance (marginal R2 = 0.03, conditional R2 = 0.77), indicating that jump height was governed principally by stable inter-individual differences, not by the time course of the protocol.
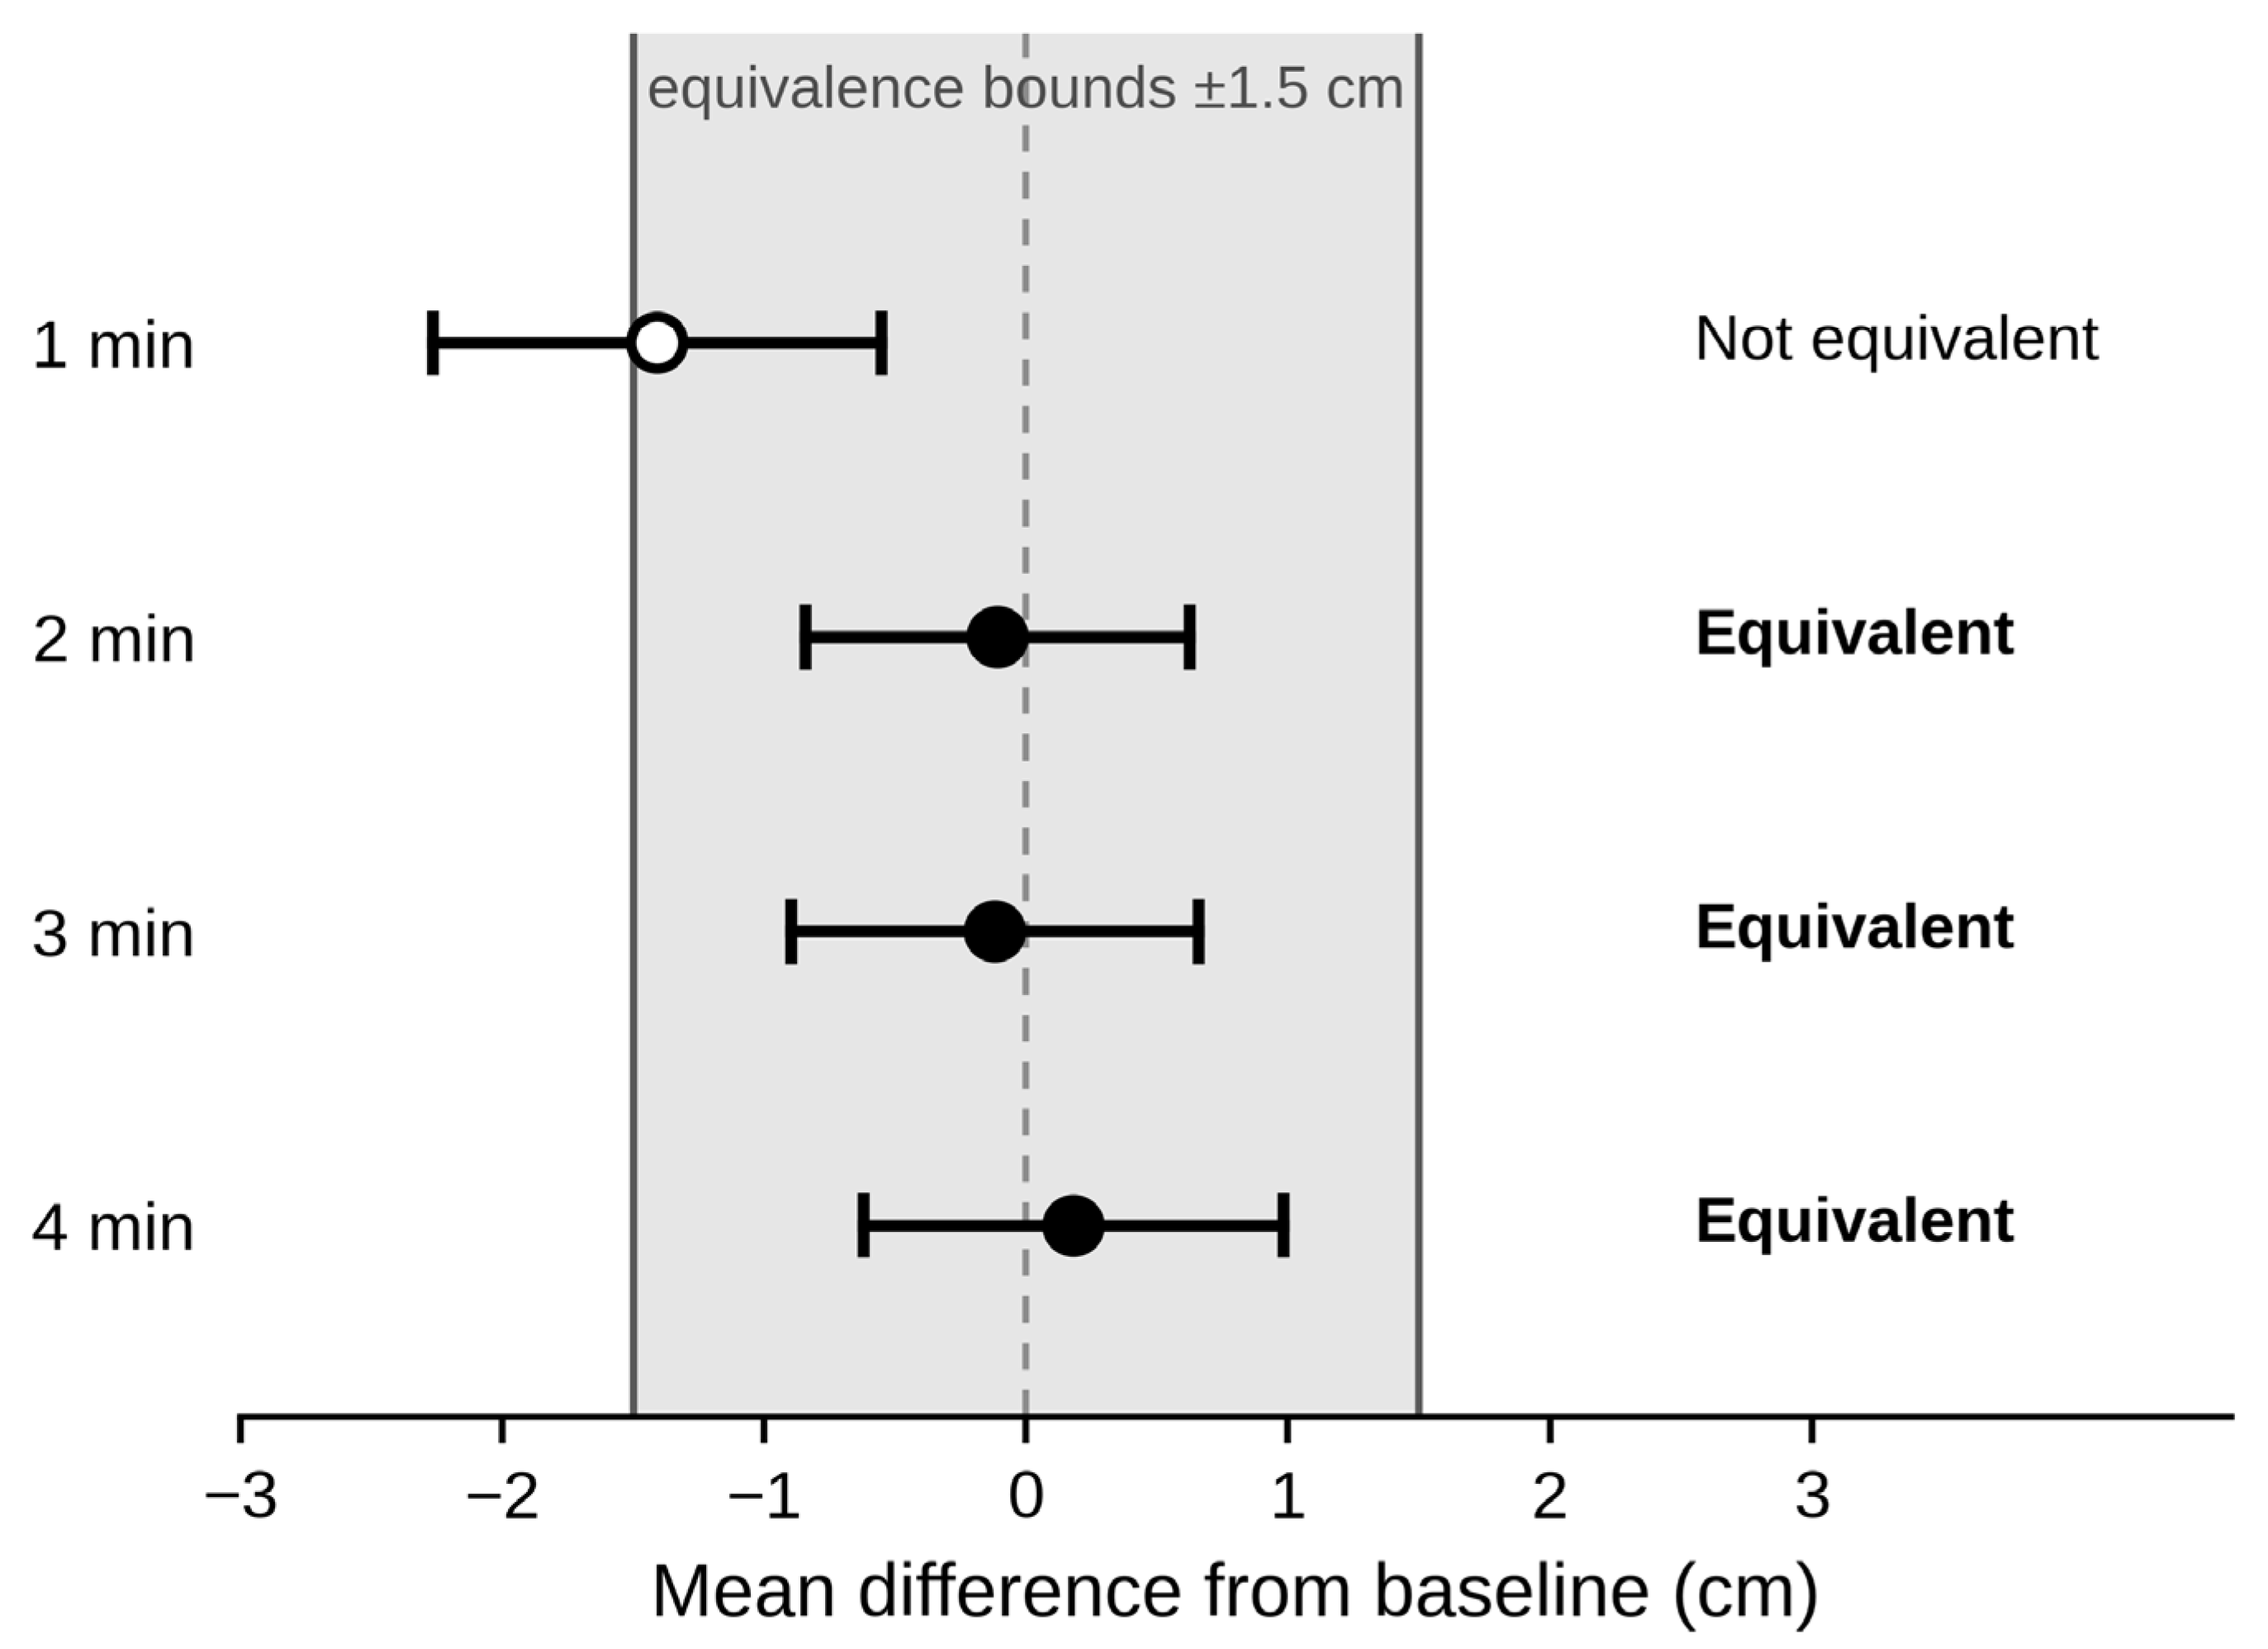
Because the absence of a difference from baseline at 2–4 min is central to the interpretation of the present data, these three contrasts were additionally evaluated with two one-sided tests (TOST) against a post hoc equivalence margin of ±1.5 cm, anchored to the smallest worthwhile change reported for this optical jump-measurement system and exceeding its typical error [36] (Section 2.3). Jump height was statistically equivalent to baseline within this margin at 2 min (mean difference −0.11 cm, 90% CI [−0.84, 0.62], p = 0.002), at 3 min (−0.12 cm, [−0.90, 0.66], p = 0.003) and at 4 min (+0.18 cm, [−0.62, 0.98], p = 0.005). Equivalence was not established at 1 min (p = 0.429), consistent with the significant reduction observed at that time point. Under a more stringent margin of 0.2 × baseline SD (±0.62 cm), which lies below the typical error of the measurement system, equivalence was not established at any time point (all p ≥ 0.121); the ±1.5 cm margin is therefore retained as the primary criterion, and the equivalence claim is bounded accordingly. Equivalence here should be read as equivalence within ±1.5 cm, that is, within the resolution of the measurement system, and not as evidence of practical invariance established independently of that bound (Table 4, Figure 3).

3.2. Composite EMG Amplitude

In contrast, the composite EMG amplitude index increased markedly across the observation period (χ2(4) = 188.14, p < 0.001; F(4, 84) = 135.09, p < 0.001, η2G = 0.811). This effect was driven almost exclusively by the 4 min time point, at which the index rose from a baseline mean of 46.28% to 100.81% (b = 54.53, SE = 2.83, 95% CI [48.99, 60.07], z = 19.28, p < 0.001, dz = 3.22); the 1, 2, and 3 min values did not differ from baseline after Holm correction (all p ≥ 0.08). The low intraclass correlation (ICC = 0.16) together with the high marginal R2 (0.81) indicate that, unlike jump height, the variance in EMG amplitude was governed predominantly by the within-participant time course, and not by stable between-participant differences.
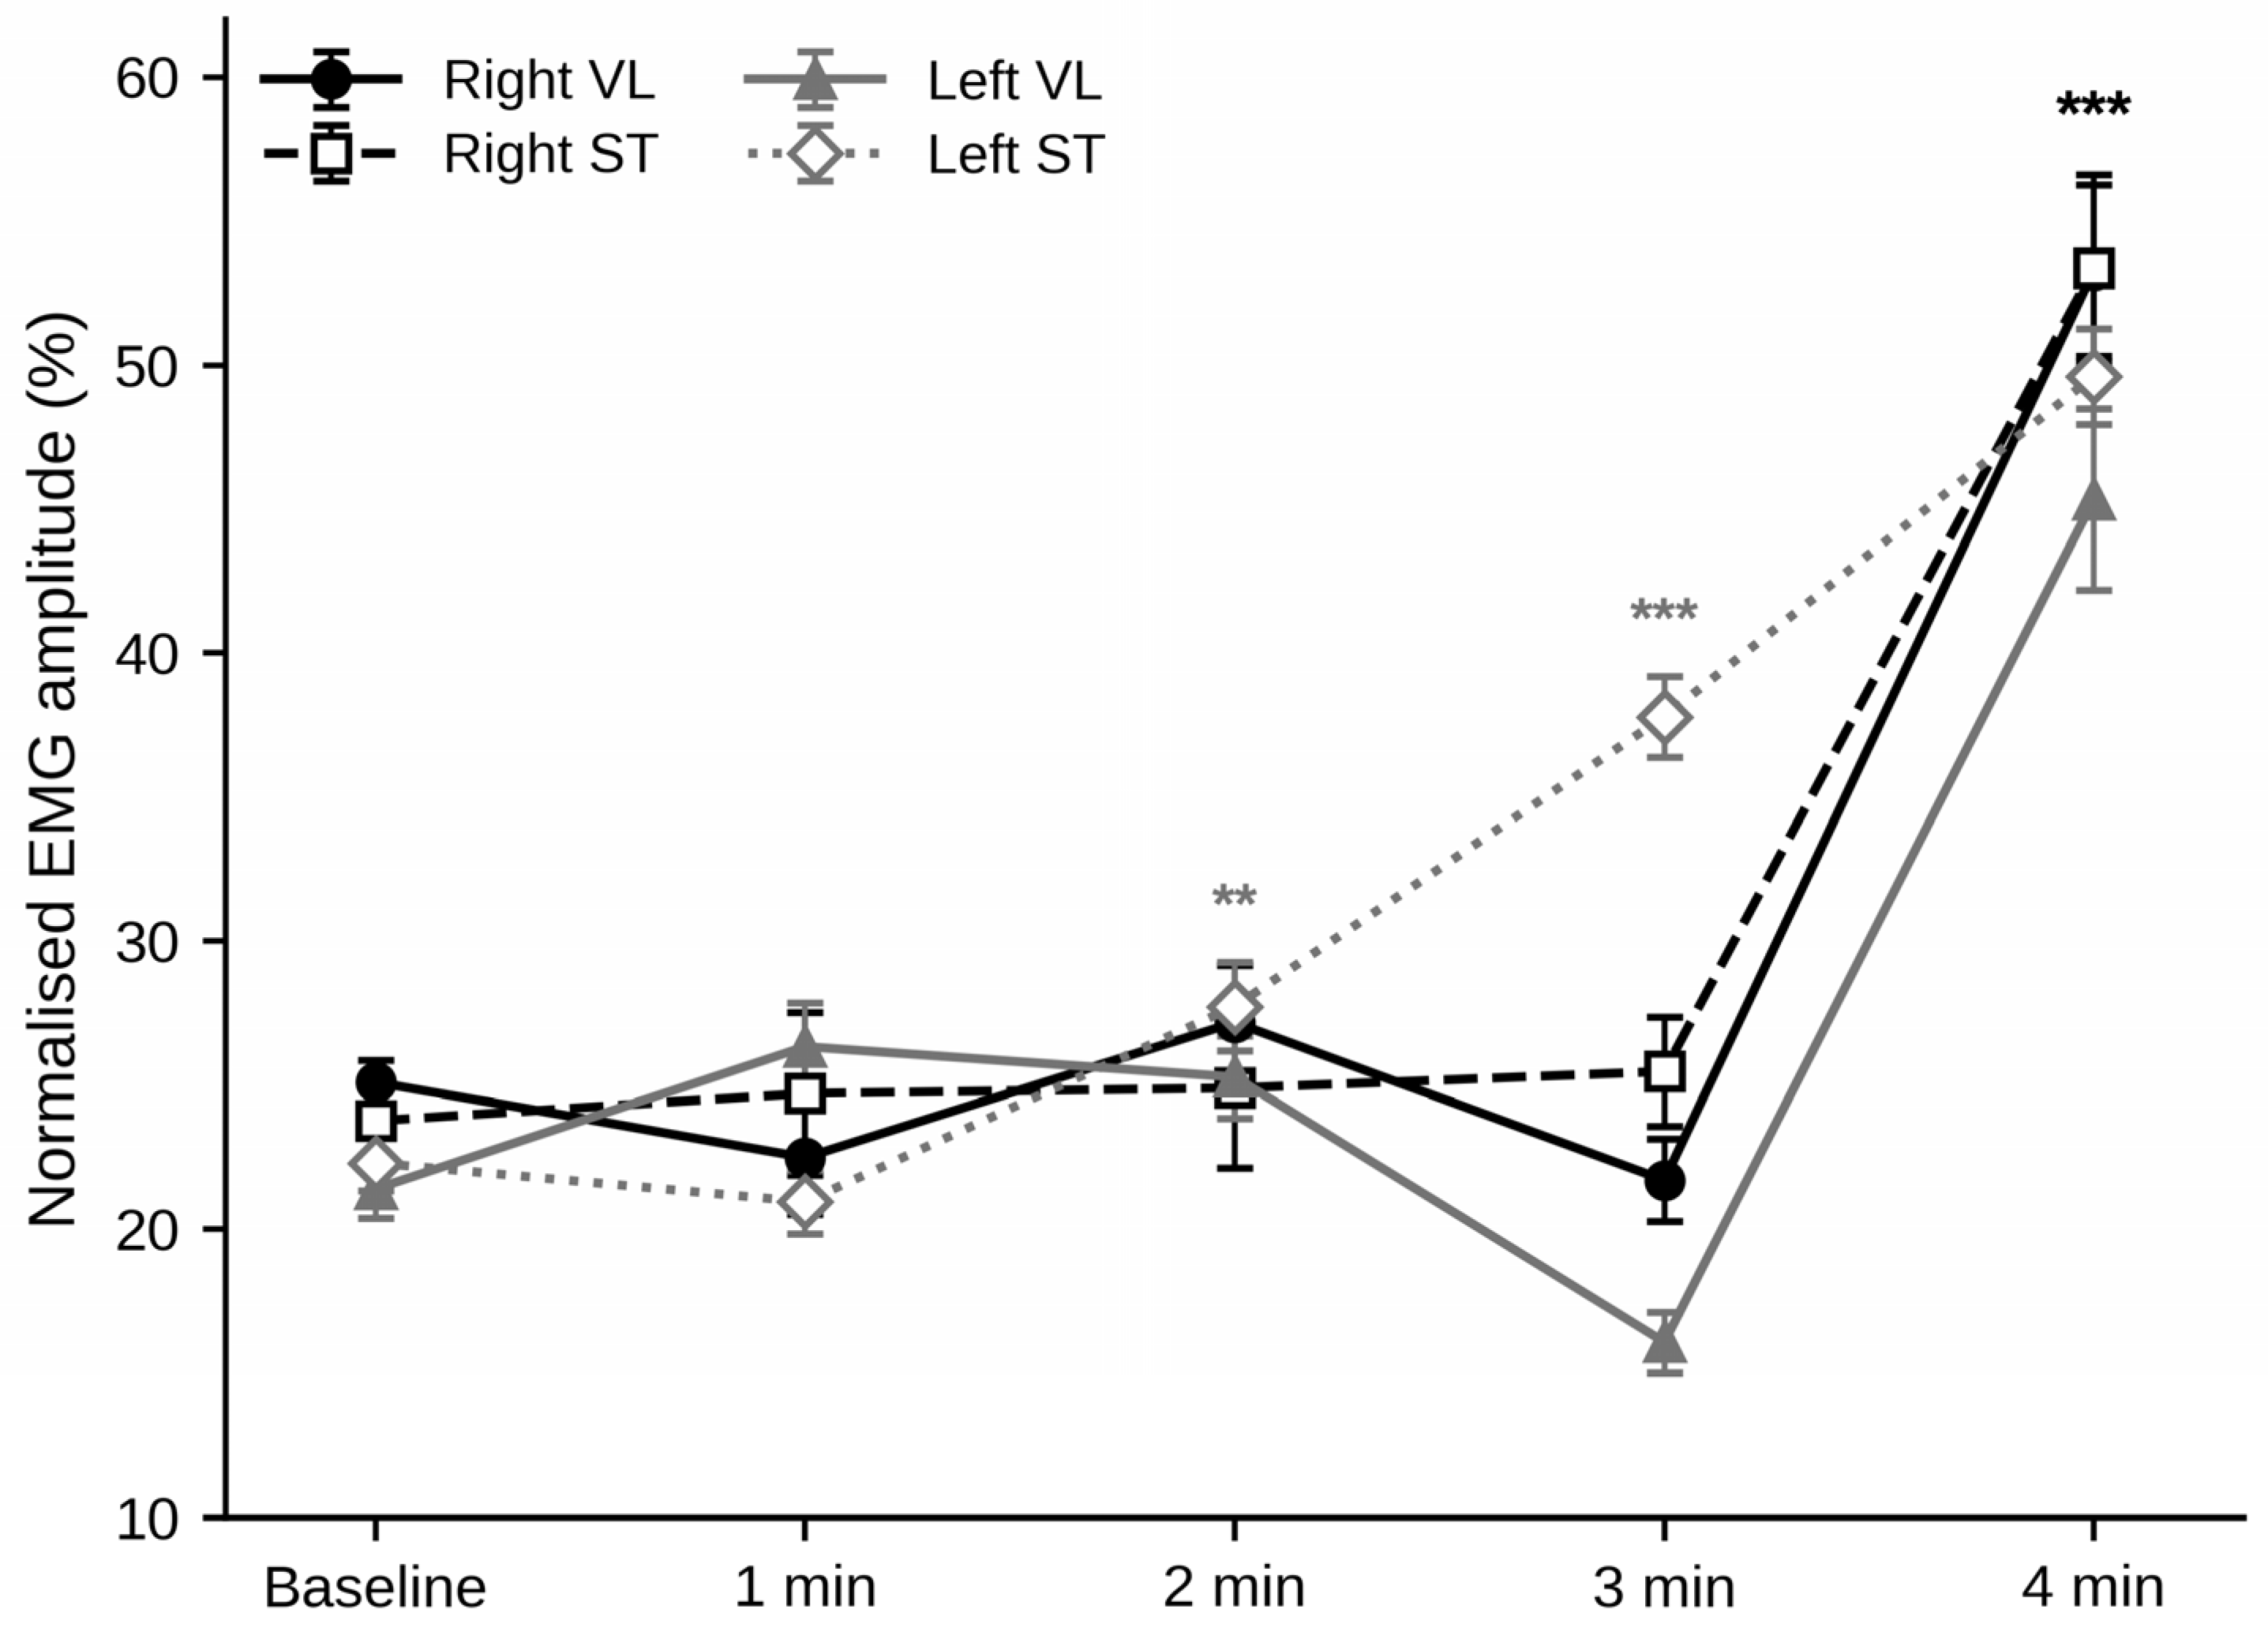
The large 4 min increase was present in all four muscles (right VL, dz = 1.97; right ST, dz = 1.82; left VL, dz = 1.65; left ST, dz = 2.73; all Holm-corrected p < 0.001), and every channel showed a highly significant omnibus time effect (all χ2(4) ≥ 76.6, p < 0.001; Table 2). The earlier part of the observation period, however, was muscle-specific (Supplementary Table S1, Figure 4). The right VL and right ST did not differ from baseline before 4 min, whereas the two left-limb muscles changed earlier. Left ST rose progressively from 2 min (2 min, b = +5.43, Holm-corrected p = 0.009, dz = 0.72; 3 min, b = +15.49, Holm-corrected p < 0.001, dz = 2.01). Left VL instead followed a non-monotonic course: an increase at 1–2 min (b = +4.93 and +3.88) followed by a decrease at 3 min (b = −5.33, dz = −0.70). None of these left VL contrasts survived Holm correction (all Holm-corrected p ≥ 0.058), so the profile is described here but not interpreted as a reliable biphasic response. Three pre-take-off-window values in the right ST channel fell close to zero (0.13% at 1 min, and 1.56% and −2.53% at 2 min), a consequence of the offset correction applied to near-silent signals, not of sensor failure (Section 2.2.5), and they inflated the early variability of that channel. Excluding the three participants concerned left the omnibus effect unchanged in direction and magnitude (F(4, 72) = 28.77, p < 0.001, η2G = 0.561, vs. 0.501 for the full sample); excluding only the single lowest value gave the same conclusion (F(4, 80) = 25.11, p < 0.001, η2G = 0.489), indicating that the result was robust to these observations.

3.3. EMG–Mechanical Output Dissociation

The dissociation between surface EMG amplitude and mechanical output was confirmed directly by a significant signal × time interaction on baseline-referenced percentage change (F(3, 63) = 108.85, p < 0.001, η2G = 0.603). Mauchly’s test did not indicate a violation of sphericity for this interaction (W = 0.618, χ2(5) = 9.50, p = 0.091), and the conclusion was unchanged under Greenhouse–Geisser correction (ε = 0.770; F(2.31, 48.53) = 108.85, p < 0.001); uncorrected degrees of freedom are therefore reported. The within-participant decoupling index (DI = %ΔEMG − %ΔJump) was distinguishable from zero at 2 and 3 min and rose abruptly at 4 min (2 min: DI = 14.8%, t(21) = 2.88, Holm-corrected p = 0.018, dz = 0.61; 3 min: DI = 9.9%, t(21) = 3.70, Holm-corrected p = 0.004, dz = 0.79), reaching +120.4% at 4 min (95% CI [102.6, 137.4], t(21) = 13.11, p < 0.001, dz = 2.80; Table 5, Figure 2b). At the 4 min point, the within-participant increase in composite EMG amplitude (+120.9%) vastly exceeded the negligible change in jump height (+0.5%). The decoupling index at the later time points was numerically almost identical to the EMG change itself, because jump height had returned to a value statistically equivalent to baseline, within the ±1.5 cm margin, from 2 min onward; at 1 min, by contrast, the small positive index reflected the transient reduction in jump height (−3.7%) rather than a rise in EMG amplitude (+2.9%), and it did not differ from zero (p = 0.202). Consistent with the overall dissociation, the within-participant association between composite EMG amplitude and jump height was weak. A repeated-measures correlation, which estimates the common within-participant slope while allowing each participant their own intercept, was not significant across the five time points (rrm = 0.11, df = 87, p = 0.301, 95% CI [−0.10, 0.31]) and remained so when restricted to the four post-conditioning points (rrm = 0.15, df = 65, p = 0.226, 95% CI [−0.09, 0.38]). At the channel level, the association was likewise weak, exceeding zero only for the left ST (rrm = 0.21, df = 87, p = 0.047), which would not survive correction across the four channels. The confidence intervals are wide, so these analyses establish the absence of a strong coupling, not the presence of none. The dissociation did not depend on the inclusion of hamstring activity: when the composite was restricted to the bilateral VL, the signal × time interaction remained large and significant (F(3, 63) = 83.81, p < 0.001, η2G = 0.555; Mauchly’s W = 0.620, χ2(5) = 9.43, p = 0.093; Greenhouse–Geisser ε = 0.766), and the 4 min decoupling index remained of comparable magnitude (DI = +113.8%, 95% CI [94.4, 134.2], t(21) = 10.97, p < 0.001, dz = 2.34). The dissociation was likewise insensitive to the length of the analysis window: re-executing the complete normalization and modeling pipeline with a 200 ms window gave a 4 min composite contrast of b = +60.26 (95% CI [+54.11, +66.41], p < 0.001) and a decoupling index of +117.9%, and with a 400 ms window, a contrast of b = +47.77 (95% CI [+42.75, +52.79], p < 0.001) and a decoupling index of +122.1% (Table S2).

3.4. Sensitivity of the Random-Effects Specification

Because a random-intercept-only structure implies compound symmetry, and sphericity was violated for several outcomes, each primary model was refitted with a by-participant random slope for time coded as a continuous linear trend. The slope variance was negligible for jump height (0.0001) and small for composite EMG (4.35), likelihood-ratio tests against the nested random-intercept models were non-significant (χ2(2) = 0.01, p = 0.995 and χ2(2) = 5.51, p = 0.064, respectively), and the 4 min fixed-effect contrasts were unchanged to three decimal places (Table 6). The random-intercept specification was therefore retained.

4. Discussion

The principal finding of this study was a pronounced dissociation between surface EMG amplitude and mechanical output. Participants performed a conditioning activity and then a maximal CMJ at each minute from 1 to 4 min. Across that period, the ad hoc composite EMG index more than doubled by the fourth minute (a within-participant increase of approximately 121%), and the rise was present in each of the four recorded channels individually. CMJ height, by contrast, fell transiently by 1.41 cm at 1 min and then returned to a value statistically equivalent to baseline, within the ±1.5 cm margin, from 2 min onward. This dissociation was confirmed by a large signal × time interaction and by a within-participant decoupling index of +120.4% at 4 min. The critical observation is one of timing: the EMG surge occurred precisely at the time point at which mechanical output had returned to a value equivalent to baseline within ±1.5 cm, so that the largest surface EMG amplitude coincided with a mechanical outcome at that level rather than with a mechanical gain. To our knowledge, this is the first study to sample EMG amplitude and mechanical output simultaneously at every minute of the 1–4 min period following a conditioning activity, and it shows that the two do not scale proportionally.
The absence of a jump-height improvement is consistent with the lower bound of the PAPE literature. Meta-analytic evidence indicates that conditioning activities produce, on average, only small effects on jumping [12,14], that stronger and more experienced athletes potentiate more readily [9,12], and that the response is detrimental at very short intervals and beneficial mainly at approximately 4–7 min [15]; the present window may therefore have captured only the ascending limb before any mechanical potentiation emerged. A closely comparable protocol supports this reading: three back-squat repetitions at 85% of one-repetition maximum, performed after a comprehensive task-specific warm-up and followed by CMJs with simultaneous EMG and kinematically identified concentric phases, produced no change in jump height or in any kinetic or kinematic variable [38]. The significant reduction observed at 1 min accords directly with the early-interval impairment described in that literature, and it had resolved by the second minute. Residual fatigue following the conditioning activity is the most consistent reading of that literature, but the present design cannot attribute the decrement to the conditioning activity specifically, since no condition was run in which the same jump sequence was performed without it. Its practical magnitude, however, should not be overstated. The reduction of 1.41 cm corresponds to a moderate standardized effect (dz = −0.60) but falls marginally below the smallest worthwhile change of 1.44 cm reported for this measurement system and is only slightly larger than its typical error of 1.04 cm [36]. For a practitioner, a decrement of this size at 1 min is detectable in a group mean but lies at the threshold of what can be distinguished from measurement noise in an individual athlete, and it had fully resolved by the second minute. The contrast with the EMG response carries more practical weight. At 4 min, the change in surface EMG amplitude (dz = 3.22) exceeds the 1 min mechanical change by a factor of five in standardized units. The two signals therefore differ not only in direction but in the reliability with which each can be detected. The well-documented inter-individual variability of PAPE [1] further reduces the likelihood of a uniform group-level jump gain in a modest sample. The substantial between-participant variance in jump height (ICC = 0.76) contrasted sharply with the strongly within-participant, time-driven variance in EMG (ICC = 0.16), indicating that the two signals were governed by fundamentally different sources of variance: a structural prerequisite for dissociation.
A reasonable question is whether these observations are better described as an EMG–mechanical output dissociation or simply as a manifestation of generalized neuromuscular fatigue. The two accounts are not mutually exclusive, and the present design cannot separate them definitively, but three features of the data bear on the distinction. First, the classical fatigue pattern is a rise in surface EMG amplitude accompanying a decline in, or the effortful maintenance of, mechanical output; here, mechanical output did not decline at the time of the EMG rise but had returned to a value statistically equivalent to baseline within the ±1.5 cm margin. Second, the timing is inverted relative to a fatigue account: the mechanical decrement occurred at 1 min, when EMG amplitude was still at baseline, whereas the EMG rise occurred at 4 min, after jump height had returned to a value equivalent to baseline within the ±1.5 cm margin. A single fatigue process dissipating over time would be expected to produce the two effects in the opposite order. This ordering, however, is a property of the sequence as administered (a conditioning activity followed by a maximal jump at each minute) and does not by itself isolate the contribution of the conditioning activity from that of the intervening jumps. Third, the magnitude of the EMG change is disproportionate to any residual mechanical cost. The data establish only that the two signals followed different trajectories within this window; whether the underlying process is best labeled fatigue, potentiation, or a change in activation strategy cannot be resolved without measures of voluntary activation and contractile function, and the term dissociation is used here in that deliberately descriptive sense.
Because no direct measures of central activation, motor-unit behavior, or peripheral fatigue were obtained, the following mechanistic accounts are offered as hypotheses to be tested rather than as established mechanisms. The marked rise in EMG amplitude, concentrated at 4 min, may reflect increased motor-unit recruitment and/or firing rate, the same neural mechanisms that govern the early, rapid phase of force production [39]. Because this escalation in EMG amplitude was not accompanied by a proportional change in jump height, it resembles the amplitude–output dissociation repeatedly reported under fatigue, in which surface EMG amplitude increases to sustain force as contractions are repeated [4,22]. Competitive soccer is known to induce substantial central (reduced voluntary activation) fatigue and peripheral (reduced twitch force) fatigue that recover along different time courses [40,41], and neuromuscular responses of this kind are also observed after intense intermittent efforts in soccer players [42]; within the much shorter post-conditioning window studied here, one plausible but untested reading is that heightened central drive offsets residual peripheral limitations just sufficiently to preserve mechanical output. Because voluntary activation, motor-unit behavior and contractile function were not measured, this account cannot be distinguished here from alternatives such as a change in propulsive strategy or a broadening of the activation burst without a rise in peak amplitude. This interpretation must remain cautious, because surface EMG amplitude is an ambiguous proxy for neural drive, being influenced by amplitude cancellation, muscle temperature, and electrode–fiber geometry [23,25].
The channel-level analysis showed that the 4 min surge was global, but its earlier time course was muscle-specific: the left ST rose from 2 min onward, the left VL displayed a non-monotonic profile that did not survive correction for multiple comparisons and is therefore reported descriptively, and the right-limb muscles changed only at 4 min. Within the left limb, the two channels moved in opposite directions at 3 min, the ST rising while the VL fell. A redistribution of activation across the limb would produce that pattern, and the absence of kinematic recording leaves the possibility untested (Section 4.1). Because the composite index is an arithmetic summary of the four channels rather than a validated physiological construct, these muscle-specific results, which are tied directly to the recorded signals, carry the greater interpretative weight: the 4 min rise was present in every channel with large within-participant effects (dz = 1.65–2.73), whereas the left ST was the only channel to change before that point, rising from the second minute onward. This heterogeneity indicates that the aggregate composite index can mask limb- and muscle-specific activation dynamics, including antagonist/synergist hamstring involvement of the kind captured only by multi-muscle recordings and EMG-informed models [43], and it is consistent with the eccentric loading to which the hamstrings are exposed during stretch–shortening-cycle actions such as jumping, which is the basis of their responsiveness to eccentric training [44]. The present data also help reconcile mixed prior reports in which EMG was sampled at only one or two points during PAPE: some studies observed activation increases alongside jump gains [20], whereas others found neither consistent EMG nor performance change [19]. By resolving the full trajectory, our results show that a rise in EMG amplitude need not translate into a proportional performance change, cautioning against inferring mechanical benefit from surface EMG amplitude alone. Because neural or potentiation indices are seldom quantified during applied conditioning protocols [21], time-resolved EMG monitoring may expose changes in the amplitude of the recorded EMG signals that a jump test alone cannot detect, complementing established countermovement-jump and force-plate approaches to neuromuscular monitoring [45,46].

4.1. Limitations

Several limitations qualify these findings. First, the sample comprised 22 male youth soccer players drawn from a single competitive academy, all with at least 3 years of systematic resistance and field-based training. Generalization is therefore constrained in several directions at once. Women are not represented, and sex differences in fatigue resistance and in the time course of potentiation are well described. Nor are adults: the maturational status of youth athletes plausibly affects both the magnitude and the latency of the response. Athletes from sports with different neuromuscular demands are absent as well. All participants trained within one academy under a common program, so the findings may reflect that training background as much as youth soccer in general. Competitive level is a further constraint: the PAPE literature indicates that stronger and more experienced athletes potentiate more readily [9,12], so both the mechanical and the activation responses reported here may differ at higher or lower levels of competition. The sample size also constrains the precision of within-participant estimates.
Second, and most consequentially for interpretation, the design included no control condition. Participants performed maximal CMJs at 1, 2 and 3 min before the 4 min measurement, and each of those jumps is itself a neuromuscular stimulus. The 4 min observation therefore reflects the cumulative state produced by the conditioning activity together with three intervening maximal efforts, and the present data cannot apportion the observed time course between these two sources. Isolating the response to the conditioning activity alone would require either a control condition in which the same sequence of CMJs is performed without the conditioning activity, or independent sessions in which each time point is tested without preceding jumps. The single-session design was chosen deliberately for the opposite property. Testing each time point in a separate session would have introduced day-to-day biological variability into precisely the within-participant comparisons that the study was built to resolve. It would also have sacrificed the dense per-minute sampling that makes the divergence visible. This is a genuine trade-off rather than an oversight, but it is a trade-off that constrains what may be concluded. The observed pattern was flat from 1 to 3 min (+0.96, +6.26 and +4.24 percentage points) and then rose abruptly at 4 min (+54.53). This shape is not evidence against a contribution of the intervening jumps: the neuromuscular response to repeated maximal efforts need not accumulate progressively over time, and a threshold-like or delayed response would produce the same step. The interval between the conditioning activity and the 4 min measurement is also the interval over which three jumps accumulated, so the two accounts are confounded by construction and cannot be separated by the shape of the trajectory alone. Accordingly, the findings are presented throughout as the time course observed under this protocol rather than as an effect attributable to the conditioning activity alone.
Third, surface EMG amplitude is an imperfect index of neural drive; corroboration with spectral measures such as median-frequency or wavelet analysis [47], high-density decomposition, or the interpolated-twitch technique, which reliably quantifies voluntary activation of the knee extensors [48], would strengthen the neural interpretation [23]. Fourth, the composite index summed agonist and antagonist/synergist activity with equal weighting. Because the recorded muscles have different biomechanical functions during jumping, this equal weighting does not create a validated physiological construct of total activation; the composite is strictly an ad hoc numerical summary, and it conflates neural drive with co-contraction [43]. Greater interpretative weight should therefore be placed on the muscle-specific findings, which are tied directly to the recorded signals. Normalizing to the baseline task rather than a maximal reference further constrains between-muscle amplitude comparisons [32]. Fifth, jump height was derived from flight time, which systematically differs from, and tends to underestimate jump height relative to, force-platform impulse–momentum methods [46,49], and no kinetic variables (peak force, rate of force development, power) were available to characterize the mechanical side more sensitively. Nor was movement strategy measured. Countermovement depth was self-selected, as is standard for this test, and no kinematic recording was made of depth, movement duration, joint configuration or the timing of the propulsive phase. A participant can, in principle, produce a comparable jump height with a materially different activation pattern, so a change in jumping strategy across the observation period cannot be excluded as a contributor to the observed EMG trajectory. This is especially pertinent because the analysis window was a fixed 300 ms interval preceding take-off: if the duration or timing of the propulsive action shifted across time points, the proportion of the concentric burst captured within that window would shift with it. Three observations bear on this account, but none of them excludes it. First, a strategy change large enough to raise pre-take-off amplitude in all four channels bilaterally, without altering jump height, would itself represent a substantial reorganization of the movement. Second, restricting the composite to the bilateral VL, which removes the hamstring contribution through which a co-contraction or stabilization strategy would most plausibly act, left the 4 min dissociation of comparable magnitude. Third, repeating the entire normalization and modeling pipeline with 200 ms and 400 ms analysis windows, with the normalization reference recomputed for each, preserved the direction, statistical significance and approximate magnitude of the 4 min contrast and of the decoupling index (Table S2). The second and third of these establish only that the result does not depend on the muscles included or on the particular window length chosen; neither shows that movement strategy, countermovement depth or the duration of propulsion remained invariant across time points, which only kinematic or kinetic recording could establish. A change in countermovement strategy or in the timing of propulsion therefore remains a viable contributor to the observed EMG trajectory, and the finding is accordingly reported as a change in EMG amplitude within a fixed pre-take-off window rather than as a change in the activation of an identified movement phase. Future replications should record countermovement depth and propulsive-phase duration alongside EMG. Sixth, a single jump was recorded at each time point. This precludes estimation of within-time-point biological variability, and it gives the baseline trial a dual role. Its pre-take-off-window peak serves as the normalization reference for every observation of that participant, while its normalized value serves as the reference category for the model contrasts and as the denominator of the percentage changes underlying the decoupling index. Measurement error at baseline therefore enters the analysis more than once. Two considerations limit its consequences without removing them. Provided that this error is unbiased across participants, it propagates principally as increased between-participant and residual variance, that is, as wider confidence intervals, rather than as systematic distortion of the group-level time course. The by-participant random intercept additionally absorbs the stable component of between-participant differences in level. Empirically, adding a by-participant random slope for time did not improve model fit and yielded a negligible slope variance (Table 6), indicating that participant-specific distortion of the trajectory was not detectable in these data. Neither consideration corrects a mis-estimated denominator, however, because normalization precedes model fitting: the model averages over normalized values but cannot recover the amplitude that the reference trial should have had. Replication with multiple trials per time point, or with a normalization reference derived from a separate and repeated maximal task, remains necessary to quantify this source of uncertainty directly. Seventh, the observation period extended only to 4 min, whereas the optimal PAPE window for heavy conditioning activities frequently lies between 4 and 7 min or later [15], so both the full ascending limb and any later mechanical potentiation may have been missed. The 1–4 min window with dense per-minute sampling was, however, chosen a priori to resolve the early minutes following a conditioning activity, in which the potentiation–fatigue balance is most dynamic and has rarely been tracked with time-resolved EMG; the pronounced 4 min rise in EMG amplitude may itself represent the neural antecedent of a mechanical potentiation emerging beyond the window studied here. Finally, the effect was concentrated almost entirely at the 4 min point, and its magnitude exceeds what has been reported in comparable protocols, in which increases in vastus lateralis amplitude of the order of 30% have accompanied, rather than replaced, gains in jump height [38]. Independent replication with complementary neural measures is therefore required before the EMG–mechanical output dissociation is accepted as a robust physiological phenomenon.

4.2. Practical Applications

Three practical points follow from these data. First, in this squad of youth players, a heavy conditioning activity of three back squats at 85% of 1RM did not improve jump height at any point within 4 min and produced a small decrement at 1 min. A coach prescribing a complex or contrast set on this template should not expect a mechanical benefit inside the first minute in this population and at this load. Second, because jump height had returned to a value statistically equivalent to baseline within the ±1.5 cm margin from the second minute onward and remained so thereafter, a jump test performed at any point from 2 min onward would have shown nothing remarkable. Yet surface EMG amplitude at 4 min was more than double its baseline value. A performance test alone therefore cannot indicate whether the amplitude of the recorded EMG signals has returned to its baseline level, which is the practical case for adding a second signal where the equipment allows. Third, for squads with access to portable EMG, the montage in which the present pattern was detected comprised the bilateral VL together with a hamstring site. The study does not establish that this or any other montage is adequate for applied decision-making. The hamstring site nevertheless mattered here: the left ST changed earlier than any quadriceps channel, so a single quadriceps electrode would have missed the earliest activation change. Where EMG is not available, which is the majority of applied settings, the defensible inference from these data is narrower but still useful: a normal jump during a rest interval is not evidence that the neuromuscular system has returned to its baseline state. Whether a longer rest interval would translate into any measurable benefit was not tested here, and that question is therefore left to future work rather than offered as a recommendation. These observations apply to trained male youth players performing this specific conditioning protocol and require confirmation before they are transferred to other populations or loads. The present study does not establish that EMG-guided monitoring improves recovery prescription, that a particular EMG montage is sufficient for applied decision-making, or that a specific rest interval can be recommended beyond the exact conditions tested here. The points above should therefore be read as hypotheses for future applied work rather than as recommendations supported by the present experiment.


5. Conclusions

In youth soccer players who performed a conditioning activity and then a maximal CMJ at each minute from 1 to 4 min, composite EMG amplitude increased sharply and almost exclusively at 4 min. CMJ height showed only a transient reduction at 1 min and was thereafter statistically equivalent to baseline within a ±1.5 cm margin specified post hoc (Section 2.3). The two signals therefore did not move together, and the EMG–mechanical output dissociation was large (decoupling index, an operational summary of the divergence between the two signals, +120.4%; signal × time interaction, F(3, 63) = 108.85, p < 0.001). Surface EMG amplitude and mechanical output therefore did not scale proportionally across this period, indicating that a rise in EMG amplitude cannot be assumed to translate into performance gains. Because no direct measures of central activation were obtained, the proposition that the central nervous system compensates for peripheral limitations remains a hypothesis to be tested rather than a conclusion of the present study. Future work should extend the observation period, incorporate force-platform kinetics and spectral EMG, and replicate the finding in larger and more diverse samples.

Supplementary Materials

The following supporting information can be downloaded at: https://www.mdpi.com/article/10.3390/app16189084/s1, Figure S1: Representative surface EMG recording illustrating the pre-take-off-window analysis; Table S1: Channel-level linear mixed-effects contrasts against baseline for each recorded muscle; Table S2: Sensitivity of the 4 min composite EMG contrast and the decoupling index to the length of the pre-take-off analysis window.

Funding

This research received no external funding.

Institutional Review Board Statement

The study was conducted in accordance with the Declaration of Helsinki and approved by the Non-Interventional Clinical Research Ethics Committee of Pamukkale University (protocol code E-60116787-020-804599; decision no. 23 of the meeting of 16 December 2025).

Informed Consent Statement

Informed consent was obtained from all participants and their legal guardians involved in the study.

Data Availability Statement

The data presented in this study, and the analysis code from which all reported results were generated, are available from the corresponding author on request.

Conflicts of Interest

The author declares no conflicts of interest.

Abbreviations

The following abbreviations are used in this manuscript:
PAPEPost-activation performance enhancement
PAPPost-activation potentiation
CMJCountermovement jump
EMGElectromyography
VLVastus lateralis
STSemitendinosus
1RMOne-repetition maximum
ANOVAAnalysis of variance
ICCIntraclass correlation coefficient
DIDecoupling index
SDStandard deviation
RMSRoot mean square
TTLTransistor–transistor logic
GGGreenhouse–Geisser
CIConfidence interval
TOSTTwo one-sided tests

References

  1. Blazevich, A.J.; Babault, N. Post-activation potentiation versus post-activation performance enhancement in humans: Historical perspective, underlying mechanisms, and current issues. Front. Physiol. 2019, 10, 1359. [Google Scholar] [CrossRef] [Scilit] [PubMed]
  2. Cuenca-Fernández, F.; Boullosa, D.; López-Belmonte, Ó.; Gay, A.; Ruiz-Navarro, J.J.; Arellano, R. Swimming warm-up and beyond: Dryland protocols and their related mechanisms—A scoping review. Sports Med. Open 2022, 8, 120. [Google Scholar] [CrossRef] [Scilit] [PubMed]
  3. Tillin, N.A.; Bishop, D. Factors modulating post-activation potentiation and its effect on performance of subsequent explosive activities. Sports Med. 2009, 39, 147–166. [Google Scholar] [CrossRef] [Scilit] [PubMed]
  4. Enoka, R.M.; Duchateau, J. Translating fatigue to human performance. Med. Sci. Sports Exerc. 2016, 48, 2228–2238. [Google Scholar] [CrossRef] [Scilit] [PubMed]
  5. Zimmermann, H.B.; MacIntosh, B.R.; Dal Pupo, J. Does postactivation potentiation (PAP) increase voluntary performance? Appl. Physiol. Nutr. Metab. 2020, 45, 349–356. [Google Scholar] [CrossRef] [Scilit] [PubMed]
  6. Racinais, S.; Oksa, J. Temperature and neuromuscular function. Scand. J. Med. Sci. Sports 2010, 20, 1–18. [Google Scholar] [CrossRef] [Scilit] [PubMed]
  7. Hamada, T.; Sale, D.G.; MacDougall, J.D.; Tarnopolsky, M.A. Postactivation potentiation, fiber type, and twitch contraction time in human knee extensor muscles. J. Appl. Physiol. 2000, 88, 2131–2137. [Google Scholar] [CrossRef] [Scilit] [PubMed]
  8. Hamada, T.; Sale, D.G.; MacDougall, J.D.; Tarnopolsky, M.A. Interaction of fibre type, potentiation and fatigue in human knee extensor muscles. Acta Physiol. Scand. 2003, 178, 165–173. [Google Scholar] [CrossRef] [Scilit] [PubMed]
  9. Wilson, J.M.; Duncan, N.M.; Marin, P.J.; Brown, L.E.; Loenneke, J.P.; Wilson, S.M.C.; Jo, E.; Lowery, R.P.; Ugrinowitsch, C. Meta-analysis of postactivation potentiation and power: Effects of conditioning activity, volume, gender, rest periods, and training status. J. Strength Cond. Res. 2013, 27, 854–859. [Google Scholar] [CrossRef] [Scilit] [PubMed]
  10. Santos da Silva, V.; Nakamura, F.Y.; Gantois, P.; Nogueira Gouveia, J.N.; Peña, J.; Beato, M.; Abade, E. Effects of upper-body and lower-body conditioning activities on postactivation performance enhancement during sprinting and jumping tasks in female soccer players. J. Strength Cond. Res. 2024, 38, 342–349. [Google Scholar] [CrossRef] [Scilit] [PubMed]
  11. Grzyb, W.; Jarosz, J. Acute effects of rapid versus sustained isometric contraction durations on countermovement jump performance in national level young male soccer players. Sci. Rep. 2025, 15, 33147. [Google Scholar] [CrossRef] [Scilit] [PubMed]
  12. Seitz, L.B.; Haff, G.G. Factors modulating post-activation potentiation of jump, sprint, throw, and upper-body ballistic performances: A systematic review with meta-analysis. Sports Med. 2016, 46, 231–240. [Google Scholar] [CrossRef] [Scilit] [PubMed]
  13. Krzysztofik, M.; Wilk, M.; Stastny, P.; Golas, A. Post-activation performance enhancement in the bench press throw: A systematic review and meta-analysis. Front. Physiol. 2021, 11, 598628. [Google Scholar] [CrossRef] [Scilit] [PubMed]
  14. Terbalyan, A.; Skotniczny, K.; Krzysztofik, M.; Chycki, J.; Kasparov, V.; Roczniok, R. Effect of post-activation performance enhancement in combat sports: A systematic review and meta-analysis—Part I: General performance indicators. J. Funct. Morphol. Kinesiol. 2025, 10, 88. [Google Scholar] [CrossRef] [Scilit] [PubMed]
  15. Chen, Y.; Su, Q.; Yang, J.; Li, G.; Zhang, S.; Lv, Y.; Yu, L. Effects of rest interval and training intensity on jumping performance: A systematic review and meta-analysis investigating post-activation performance enhancement. Front. Physiol. 2023, 14, 1202789. [Google Scholar] [CrossRef] [Scilit] [PubMed]
  16. Ramirez-Campillo, R.; Castillo, D.; Raya-González, J.; Moran, J.; Sáez de Villarreal, E. Effects of plyometric jump training on jump and sprint performance in young male soccer players: A systematic review and meta-analysis. Sports Med. 2020, 50, 2125–2143. [Google Scholar] [CrossRef] [Scilit] [PubMed]
  17. Thapa, R.K.; Lum, D.; Moran, J.; Ramirez-Campillo, R. Effects of complex training on sprint, jump, and change of direction ability of soccer players: A systematic review and meta-analysis. Front. Psychol. 2021, 11, 627869. [Google Scholar] [CrossRef] [Scilit] [PubMed]
  18. Oliver, J.L.; Ramachandran, A.K.; Singh, U.; Ramirez-Campillo, R.; Lloyd, R.S. The effects of strength, plyometric and combined training on strength, power and speed characteristics in high-level, highly trained male youth soccer players: A systematic review and meta-analysis. Sports Med. 2024, 54, 623–643. [Google Scholar] [CrossRef] [Scilit] [PubMed]
  19. Power, G.M.J.; Colwell, E.; Saeterbakken, A.H.; Drinkwater, E.J.; Behm, D.G. Lack of evidence for non-local muscle fatigue and performance enhancement in young adults. J. Sports Sci. Med. 2021, 20, 339–348. [Google Scholar] [CrossRef] [Scilit] [PubMed]
  20. Sun, D.; Yang, T. Semi-squat exercises with varying levels of arterial occlusion pressure during blood flow restriction training induce a post-activation performance enhancement and improve vertical height jump in female football players. J. Sports Sci. Med. 2023, 22, 212–225. [Google Scholar] [CrossRef] [Scilit] [PubMed]
  21. Thapa, R.K.; Weldon, A.; Freitas, T.T.; Boullosa, D.; Afonso, J.; Granacher, U.; Ramirez-Campillo, R. What do we know about complex-contrast training? A systematic scoping review. Sports Med. Open 2024, 10, 104. [Google Scholar] [CrossRef] [Scilit] [PubMed]
  22. Jeon, S.; Sontag, S.A.; Herda, T.J.; Trevino, M.A. Chronic training status affects muscle excitation of the vastus lateralis during repeated contractions. Sports Med. Health Sci. 2023, 5, 42–49. [Google Scholar] [CrossRef] [Scilit] [PubMed]
  23. De Luca, C.J. The use of surface electromyography in biomechanics. J. Appl. Biomech. 1997, 13, 135–163. [Google Scholar] [CrossRef] [Scilit]
  24. Farina, D.; Merletti, R.; Enoka, R.M. The extraction of neural strategies from the surface EMG. J. Appl. Physiol. 2004, 96, 1486–1495. [Google Scholar] [CrossRef] [Scilit] [PubMed]
  25. Vigotsky, A.D.; Halperin, I.; Lehman, G.J.; Trajano, G.S.; Vieira, T.M. Interpreting signal amplitudes in surface electromyography studies in sport and rehabilitation sciences. Front. Physiol. 2018, 8, 985. [Google Scholar] [CrossRef] [Scilit] [PubMed]
  26. Faul, F.; Erdfelder, E.; Lang, A.-G.; Buchner, A. G*Power 3: A flexible statistical power analysis program for the social, behavioral, and biomedical sciences. Behav. Res. Methods 2007, 39, 175–191. [Google Scholar] [CrossRef] [Scilit] [PubMed]
  27. Comfort, P.; McMahon, J.J. Reliability of maximal back squat and power clean performances in inexperienced athletes. J. Strength Cond. Res. 2015, 29, 3089–3096. [Google Scholar] [CrossRef] [Scilit] [PubMed]
  28. Glatthorn, J.F.; Gouge, S.; Nussbaumer, S.; Stauffacher, S.; Impellizzeri, F.M.; Maffiuletti, N.A. Validity and reliability of Optojump photoelectric cells for estimating vertical jump height. J. Strength Cond. Res. 2011, 25, 556–560. [Google Scholar] [CrossRef] [Scilit] [PubMed]
  29. Hermens, H.J.; Freriks, B.; Disselhorst-Klug, C.; Rau, G. Development of recommendations for SEMG sensors and sensor placement procedures. J. Electromyogr. Kinesiol. 2000, 10, 361–374. [Google Scholar] [CrossRef] [Scilit] [PubMed]
  30. Merletti, R.; Cerone, G.L. Tutorial. Surface EMG detection, conditioning and pre-processing: Best practices. J. Electromyogr. Kinesiol. 2020, 54, 102440. [Google Scholar] [CrossRef] [Scilit] [PubMed]
  31. Besomi, M.; Devecchi, V.; Falla, D.; McGill, K.; Kiernan, M.C.; Merletti, R.; van Dieën, J.H.; Tucker, K.; Clancy, E.A.; Søgaard, K.; et al. Consensus for experimental design in electromyography (CEDE) project: Checklist for reporting and critically appraising studies using EMG (CEDE-Check). J. Electromyogr. Kinesiol. 2024, 76, 102874. [Google Scholar] [CrossRef] [Scilit] [PubMed]
  32. Besomi, M.; Hodges, P.W.; Clancy, E.A.; Van Dieën, J.; Hug, F.; Lowery, M.; Merletti, R.; Søgaard, K.; Wrigley, T.; Besier, T.; et al. Consensus for experimental design in electromyography (CEDE) project: Amplitude normalization matrix. J. Electromyogr. Kinesiol. 2020, 53, 102438. [Google Scholar] [CrossRef] [Scilit] [PubMed]
  33. Nakagawa, S.; Schielzeth, H. A general and simple method for obtaining R2 from generalized linear mixed-effects models. Methods Ecol. Evol. 2013, 4, 133–142. [Google Scholar] [CrossRef] [Scilit]
  34. Holm, S. A simple sequentially rejective multiple test procedure. Scand. J. Stat. 1979, 6, 65–70. [Google Scholar]
  35. Lakens, D. Equivalence tests: A practical primer for t tests, correlations, and meta-analyses. Soc. Psychol. Personal. Sci. 2017, 8, 355–362. [Google Scholar] [CrossRef] [Scilit] [PubMed]
  36. Comyns, T.M.; Murphy, J.; O’Leary, D. Reliability, usefulness, and validity of field-based vertical jump measuring devices. J. Strength Cond. Res. 2023, 37, 1594–1599. [Google Scholar] [CrossRef] [Scilit] [PubMed]
  37. Bakdash, J.Z.; Marusich, L.R. Repeated measures correlation. Front. Psychol. 2017, 8, 456. [Google Scholar] [CrossRef] [Scilit] [PubMed]
  38. Mina, M.A.; Blazevich, A.J.; Tsatalas, T.; Giakas, G.; Seitz, L.B.; Kay, A.D. Variable, but not free-weight, resistance back squat exercise potentiates jump performance following a comprehensive task-specific warm-up. Scand. J. Med. Sci. Sports 2019, 29, 380–392. [Google Scholar] [CrossRef] [Scilit] [PubMed]
  39. Maffiuletti, N.A.; Aagaard, P.; Blazevich, A.J.; Folland, J.; Tillin, N.; Duchateau, J. Rate of force development: Physiological and methodological considerations. Eur. J. Appl. Physiol. 2016, 116, 1091–1116. [Google Scholar] [CrossRef] [Scilit] [PubMed]
  40. Brownstein, C.G.; Dent, J.P.; Parker, P.; Hicks, K.M.; Howatson, G.; Goodall, S.; Thomas, K. Etiology and recovery of neuromuscular fatigue following competitive soccer match-play. Front. Physiol. 2017, 8, 831. [Google Scholar] [CrossRef] [Scilit] [PubMed]
  41. Bouchiba, M.; Bragazzi, N.L.; Zarzissi, S.; Turki, M.; Zghal, F.; Grati, M.A.; Daab, W.; Ayadi, F.; Rebai, H.; Ibn Hadj Amor, H.; et al. Cold water immersion improves the recovery of both central and peripheral fatigue following simulated soccer match-play. Front. Physiol. 2022, 13, 860709. [Google Scholar] [CrossRef] [Scilit] [PubMed]
  42. Raeder, C.; Kämper, M.; Praetorius, A.; Tennler, J.-S.; Schoepp, C. Metabolic, cognitive and neuromuscular responses to different multidirectional agility-like sprint protocols in elite female soccer players—A randomised crossover study. BMC Sports Sci. Med. Rehabil. 2024, 16, 64. [Google Scholar] [CrossRef] [Scilit] [PubMed]
  43. Navacchia, A.; Ueno, R.; Ford, K.R.; DiCesare, C.A.; Myer, G.D.; Hewett, T.E. EMG-informed musculoskeletal modeling to estimate realistic knee anterior shear force during drop vertical jump in female athletes. Ann. Biomed. Eng. 2019, 47, 2416–2430. [Google Scholar] [CrossRef] [Scilit] [PubMed]
  44. Douglas, J.; Pearson, S.; Ross, A.; McGuigan, M. Chronic adaptations to eccentric training: A systematic review. Sports Med. 2017, 47, 917–941. [Google Scholar] [CrossRef] [Scilit] [PubMed]
  45. Claudino, J.G.; Cronin, J.; Mezêncio, B.; McMaster, D.T.; McGuigan, M.; Tricoli, V.; Amadio, A.C.; Serrão, J.C. The countermovement jump to monitor neuromuscular status: A meta-analysis. J. Sci. Med. Sport 2017, 20, 397–402. [Google Scholar] [CrossRef] [Scilit] [PubMed]
  46. Merrigan, J.J.; Stone, J.D.; Thompson, A.G.; Hornsby, W.G.; Hagen, J.A. Monitoring neuromuscular performance in military personnel. Int. J. Environ. Res. Public Health 2020, 17, 9147. [Google Scholar] [CrossRef] [Scilit] [PubMed]
  47. Daniel, N.; Małachowski, J.; Sybilski, K.; Siemiaszko, D. Quantitative assessment of muscle fatigue during rowing ergometer exercise using wavelet analysis of surface electromyography (sEMG). Front. Bioeng. Biotechnol. 2024, 12, 1344239. [Google Scholar] [CrossRef] [Scilit] [PubMed]
  48. Behrens, M.; Husmann, F.; Gube, M.; Felser, S.; Weippert, M.; Bruhn, S.; Zschorlich, V.; Mau-Moeller, A. Intersession reliability of the interpolated twitch technique applied during isometric, concentric, and eccentric actions of the human knee extensor muscles. Muscle Nerve 2017, 56, 324–327. [Google Scholar] [CrossRef] [Scilit] [PubMed]
  49. Pérez-Castilla, A.; McMahon, J.J.; Comfort, P.; García-Ramos, A. Assessment of loaded squat jump height with a free-weight barbell and Smith machine: Comparison of the takeoff velocity and flight time procedures. J. Strength Cond. Res. 2020, 34, 671–677. [Google Scholar] [CrossRef] [Scilit] [PubMed]
Figure 1. Schematic of the experimental protocol. Within-participant design. After a standardized warm-up and a baseline countermovement jump (CMJ), participants performed the conditioning activity (three back-squat repetitions at 85% of one-repetition maximum). The first post-conditioning CMJ was initiated 60 s after racking the barbell, and further CMJs followed at the 2, 3, and 4 min marks. Bilateral surface EMG (right and left vastus lateralis and semitendinosus) and jump height were recorded synchronously at every CMJ.
Applsci 16 09084 g001
Figure 2. Time course of surface EMG amplitude and mechanical output during the 1–4 min period following the conditioning activity. (a) Percentage change from baseline in the composite EMG index (open squares, dashed line) and countermovement jump height (filled circles, solid line) at each minute of that period; the dashed rectangle marks the window reproduced at larger scale in the inset, where the transient reduction in jump height at 1 min is visible. (b) Decoupling index, defined as the percentage change in composite EMG amplitude minus the percentage change in jump height. Error bars denote 95% confidence intervals; those in panel (b) are derived from 10,000 bootstrap resamples. Asterisks indicate Holm-corrected contrasts against baseline in panel (a) and Holm-corrected one-sample tests against zero in panel (b): * p < 0.05, ** p < 0.01, *** p < 0.001. n = 22.
Applsci 16 09084 g002
Figure 3. Equivalence testing of countermovement jump height against baseline. Horizontal bars show the 90% confidence interval of the mean difference from baseline at each time point; the shaded band marks the equivalence region of ±1.5 cm, specified post hoc (Section 2.3) and set from the device-specific smallest worthwhile change reported for Optojump-derived countermovement jump height (1.44 cm), which exceeds the corresponding typical error of measurement (1.04 cm). Equivalence is concluded when the interval lies entirely within this band, indicated by filled markers. Jump height was statistically equivalent to baseline, within this margin, at 2, 3 and 4 min, but not at 1 min, where a genuine transient reduction occurred. n = 22.
Applsci 16 09084 g003
Figure 4. Channel-level time course of normalized surface EMG amplitude for the bilateral vastus lateralis (VL) and semitendinosus (ST). Amplitudes are expressed as a percentage of the peak RMS recorded for the same muscle during the baseline countermovement jump. Error bars denote the standard error of the mean. Asterisks indicate Holm-corrected contrasts against baseline within each muscle; the shared marker at 4 min denotes that all four channels differed from baseline at p < 0.001. ** p < 0.01, *** p < 0.001. n = 22.
Applsci 16 09084 g004
Table 1. Descriptive statistics (mean ± SD) for jump height and surface EMG amplitude across the 1–4 min period following the conditioning activity (n = 22).
VariableBaseline1 min2 min3 min4 min
Jump height (cm)38.14 ± 3.1136.73 ± 3.9838.03 ± 3.0638.02 ± 3.1438.32 ± 3.61
Composite EMG (%) 146.28 ± 5.7747.24 ± 9.6952.54 ± 10.3350.51 ± 6.18100.81 ± 15.95
Right VL (%)25.10 ± 3.6122.49 ± 9.2627.17 ± 9.3621.70 ± 6.7053.29 ± 13.97
Right ST (%)23.76 ± 5.9024.71 ± 13.2724.90 ± 12.9625.47 ± 8.8753.37 ± 15.17
Left VL (%)21.40 ± 4.7226.33 ± 7.1525.28 ± 6.7416.07 ± 4.9145.34 ± 14.78
Left ST (%)22.30 ± 4.4920.95 ± 5.1927.73 ± 7.2237.79 ± 6.5749.62 ± 7.79
Jump height in cm. All EMG variables are the mean RMS amplitude within a fixed 300 ms pre-take-off window, normalized to the peak RMS recorded within the corresponding window of the baseline countermovement jump and expressed as a percentage of that value. The window was defined by backward extrapolation from take-off and does not correspond to a biomechanically identified propulsive phase. Because a mean across the window is compared with an instantaneous maximum within the same window, baseline values are necessarily well below 100%. VL, vastus lateralis; ST, semitendinosus. 1 Composite index = (right VL + right ST + left VL + left ST)/2, that is, the bilateral mean of the within-limb summed activity.
Table 2. Omnibus tests of the effect of time point, with sphericity diagnostics and variance components.
Variableχ2(4)pF(4, 84)pWεGG dfp (GG) 1η2GICCR2mR2c
Jump height (cm)12.740.0133.270.0150.9040.9563.82, 80.270.017 *0.0290.760.030.77
Composite EMG (%)188.14<0.001135.09<0.0010.1340.5952.38, 50.02<0.001 ***0.8110.160.810.84
Right VL (%)110.03<0.00145.25<0.0010.2720.6562.62, 55.08<0.001 ***0.6320.000.620.62
Right ST (%)76.55<0.00127.01<0.0010.3980.7653.06, 64.29<0.001 ***0.5010.020.490.50
Left VL (%)104.59<0.00147.21<0.0010.2970.5722.29, 48.02<0.001 ***0.5870.210.580.67
Left ST (%)151.99<0.00178.98<0.0010.4760.7923.17, 66.52<0.001 ***0.7490.010.740.74
χ2(4), likelihood-ratio test of the fixed effect of time from the linear mixed-effects model (maximum-likelihood fits); F(4, 84), one-way repeated-measures ANOVA; W, Mauchly’s test of sphericity; ε, Greenhouse–Geisser epsilon; p (GG), Greenhouse–Geisser corrected probability, reported for every outcome irrespective of whether the sphericity assumption was violated; η2G, generalized eta squared; ICC, intraclass correlation from the random-intercept model; R2m and R2c, marginal and conditional variance explained (Nakagawa). 1 Asterisks mark a Greenhouse–Geisser corrected effect of time: * p < 0.05, *** p < 0.001.
Table 3. Linear mixed-effects contrasts against baseline for the primary outcomes.
ParameterbSE95% CIzpp (Holm) 1dz
Jump height (cm)
Intercept (baseline)38.140.72[36.72, 39.56]
1 min vs. baseline−1.410.50[−2.39, −0.43]−2.830.0050.018 *−0.60
2 min vs. baseline−0.110.50[−1.08, +0.87]−0.220.8271.000−0.05
3 min vs. baseline−0.120.50[−1.10, +0.86]−0.240.8101.000−0.06
4 min vs. baseline+0.180.50[−0.79, +1.16]+0.360.7161.000+0.08
Composite EMG (%)
Intercept (baseline)46.282.19[41.99, 50.57]
1 min vs. baseline+0.962.83[−4.58, +6.50]+0.340.7340.734+0.10
2 min vs. baseline+6.262.83[+0.72, +11.80]+2.210.0270.080+0.58
3 min vs. baseline+4.242.83[−1.31, +9.78]+1.500.1340.268+0.80
4 min vs. baseline+54.532.83[+48.99, +60.07]+19.28<0.001<0.001 ***+3.22
b, change from baseline in the units of the outcome; SE, model-based standard error of the contrast; CI, Wald confidence interval (b ± 1.96 SE); p (Holm), Holm–Bonferroni adjustment across the four post-baseline contrasts within each outcome; dz, within-participant Cohen’s dz, computed as the mean of the paired differences divided by the standard deviation of those differences. Because dz is computed on the standard deviation of the paired differences, whereas p derives from the pooled residual standard error of the mixed model, the two quantities need not rank the contrasts identically when the between-time-point variances are heterogeneous. For the composite index, the standard deviation of the paired differences was 9.62, 10.78, 5.26 and 16.93 percentage points at 1, 2, 3 and 4 min, respectively, which is why dz at 3 min exceeds that at 2 min despite the smaller contrast. 1 Asterisks mark Holm-corrected contrasts that differ from baseline: * p < 0.05, *** p < 0.001.
Table 4. Two one-sided tests (TOST) of equivalence for jump height against baseline.
TimeMean Difference (cm)90% CITOST pConclusion
Equivalence margin ± 1.50 cm (1.5 cm) 1
1 min−1.41[−2.27, −0.55]0.429Not equivalent
2 min−0.11[−0.84, +0.62]0.002Equivalent
3 min−0.12[−0.90, +0.66]0.003Equivalent
4 min+0.18[−0.62, +0.98]0.005Equivalent
Equivalence margin ± 0.62 cm (0.2× baseline SD)
1 min−1.41[−2.27, −0.55]0.936Not equivalent
2 min−0.11[−0.84, +0.62]0.121Not equivalent
3 min−0.12[−0.90, +0.66]0.140Not equivalent
4 min+0.18[−0.62, +0.98]0.177Not equivalent
Equivalence is concluded when the 90% confidence interval of the mean difference lies entirely within the equivalence margin. A non-significant omnibus test does not by itself establish invariance; these tests provide the positive evidence of equivalence that the omnibus test cannot. 1 The primary margin of ±1.5 cm was set post hoc, during revision, from the device-specific smallest worthwhile change reported for Optojump-derived countermovement jump height (1.44 cm), which exceeds the corresponding typical error of measurement (1.04 cm) [36]; a margin of this size therefore cannot be satisfied by measurement noise alone. Consistent with this, the test–retest coefficient of variation of 2.7% reported for the Optojump system [28] corresponds to a typical error of approximately 1.0 cm at the present baseline mean of 38.14 cm. The secondary margin of 0.2× the between-participant baseline SD (0.62 cm) falls below this measurement error and is reported only for transparency. The equivalence conclusions are conditional on the bound selected.
Table 5. Decoupling index across the 1–4 min period following the conditioning activity.
TimeΔ EMG (%)Δ Jump Height (%)DI (%)95% CIt(21)pp (Holm) 1dz
1 min+2.89 ± 21.95−3.74 ± 6.21+6.63[−2.40, +16.87]+1.320.2020.202+0.28
2 min+14.63 ± 23.85−0.15 ± 5.17+14.78[+4.97, +24.21]+2.880.0090.018 *+0.61
3 min+9.74 ± 11.75−0.17 ± 5.71+9.91[+4.43, +14.86]+3.700.0010.004 **+0.79
4 min+120.87 ± 42.60+0.52 ± 5.79+120.35[+102.57, +137.44]+13.11<0.001<0.001 ***+2.80
Decoupling index (DI) = percentage change in composite EMG amplitude from baseline minus percentage change in jump height from baseline; a positive value indicates that EMG amplitude rose more than mechanical output. Confidence intervals from 10,000 bootstrap resamples; one-sample t tests against zero; p (Holm), Holm–Bonferroni adjustment across the four post-baseline time points. 1 Asterisks mark Holm-corrected tests that differ from zero: * p < 0.05, ** p < 0.01, *** p < 0.001.
Table 6. Comparison of random-intercept and random-intercept-plus-random-slope specifications.
Outcomeb (RI)SE (RI)b (RI + Slope)SE (RI + Slope)Slope Varianceχ2(2)pConclusion
Jump height (cm)+0.1810.498+0.1810.4980.00010.0090.995Random slope not required
Composite EMG (%)+54.5302.828+54.5303.2154.35385.5120.064Random slope not required
Both specifications include time point as a categorical fixed effect. The extended model adds a by-participant random slope for time coded as a continuous linear trend (0–4). Likelihood-ratio tests compare the nested models fitted by maximum likelihood (2 df). RI, random intercept. A random-intercept-only structure implies compound symmetry; these comparisons show that relaxing that assumption does not improve fit and leaves the fixed-effect contrasts unchanged.
Disclaimer/Publisher’s Note: The statements, opinions and data contained in all publications are solely those of the individual author(s) and contributor(s) and not of MDPI and/or the editor(s). MDPI and/or the editor(s) disclaim responsibility for any injury to people or property resulting from any ideas, methods, instructions or products referred to in the content.