Article

A Lightweight Rail Tread Extraction Framework for Ballastless Track LiDAR Point Clouds Using Multi-Stage Filtering and Curvature-Guided Region Growing

1
School of Transportation Engineering, East China Jiaotong University, Nanchang 330013, China
2
Fujian Institute of Scientific and Technological Information, Fuzhou 350001, China
3
Fujian Provincial Key Laboratory of Information and Network, Fuzhou 350001, China
*
Author to whom correspondence should be addressed.
Appl. Sci. 2026, 16(17), 8791; https://doi.org/10.3390/app16178791
Submission received: 27 May 2026 / Revised: 3 July 2026 / Accepted: 13 July 2026 / Published: 4 September 2026

Abstract

Urban rail transit infrastructure inspection increasingly relies on Light Detection and Ranging (LiDAR) due to its capability for efficient and high-precision 3D data acquisition. However, robust rail tread segmentation in ballastless metro environments remains challenging due to boundary leakage, interference from geometrically similar structures, and the heavy dependence of existing methods on Red-Green-Blue (RGB) imagery, trajectory priors, or template matching. To address these limitations, this study proposes a lightweight rail tread extraction framework for ballastless track LiDAR point clouds based on multi-stage filtering and curvature-guided region growing. First, intensity thresholding and cloth simulation filtering are leveraged to prune tunnel walls, track beds, and other large-scale non-target structures, thereby reducing computational overhead. Subsequently, local normal vectors and curvature features are estimated via Principal Component Analysis (PCA). A curvature-ranked seed selection strategy and a dual-constrained region growing mechanism, integrating normal consistency and curvature thresholds, are then introduced to suppress excessive growth near rail boundaries and enhance regional homogeneity. Experimental results on field data collected from Shanghai Metro Line 10 demonstrate that the proposed method achieves a recall of 92.23%, a precision of 95.32%, and an F1-score of 93.7%, outperforming conventional Euclidean clustering and standard region growing algorithms. Compared with deep learning approaches, the proposed framework requires no large-scale annotated training data and is independent of RGB information or trajectory priors, making it better suited for lightweight engineering deployment in practical urban rail transit maintenance.

1. Introduction

Urban rail transit systems require accurate and efficient infrastructure inspection to ensure operational safety and support intelligent maintenance. Among various railway components, the rail tread is particularly critical because it directly interacts with train wheels and significantly influences running stability, vibration performance, and operational reliability. Traditional rail inspection methods mainly rely on manual measurements and conventional surveying instruments, which are labor-intensive, inefficient, and difficult to deploy under operational metro conditions [1,2,3,4].
With the rapid development of three-dimensional sensing technologies, Light Detection and Ranging (LiDAR) has become an important tool for railway infrastructure inspection due to its capability for high-density, high-precision, and large-scale point cloud acquisition [5,6,7,8,9]. In recent years, LiDAR point clouds have been widely applied in railway scene reconstruction, facility recognition, and rail extraction tasks. Existing approaches mainly include image projection-based methods, deep learning-based methods, and geometry-driven segmentation methods.
However, accurate rail tread extraction in ballastless metro environments remains challenging. Unlike conventional ballasted railway scenes, ballastless tracks contain concrete beds, metallic expansion joints, and rail-side transition regions with geometric and intensity characteristics similar to those of the rail tread. These structures easily cause boundary leakage and excessive region growth during segmentation. In addition, many existing approaches rely heavily on RGB imagery, trajectory priors, template matching, or large-scale annotated datasets, which limits their robustness and deployment efficiency in low-illumination metro environments.
To address these limitations, this study proposes a lightweight rail tread extraction framework for ballastless track LiDAR point clouds based on multi-stage filtering and curvature-guided region growing. The proposed framework integrates intensity filtering, cloth simulation filtering, normal vector estimation, and curvature-constrained clustering to achieve robust rail tread segmentation under complex metro conditions. The main contributions of this study are summarized as follows:
  • A curvature-ranked seed selection strategy is proposed to replace conventional random initialization in region growing, thereby improving clustering stability and suppressing boundary leakage near rail-side transition areas.
  • A dual-constrained region growing mechanism integrating normal vector consistency and curvature thresholds is developed to improve segmentation homogeneity while reducing excessive growth caused by geometrically similar structures.
  • A lightweight and training-free extraction framework is established for ballastless metro environments. The proposed method does not depend on RGB imagery, trajectory priors, or template matching, making it suitable for practical engineering deployment in complex rail transit scenarios.

2. Related Work

In metro systems, the rail head is one of the most critical components of railway infrastructure. As the primary contact interface between the rail and the wheel, it is continuously subjected to cyclic train loads and environmental effects, making it prone to defects such as cracks and deformation, which directly affect operational safety and passenger comfort [10].
LiDAR-based scanning of key metro regions enables the acquisition of large-scale point cloud data, which typically contain rich geometric, color, and intensity attributes. Extracting relevant structural information from such high-density point clouds is essential for achieving automated inspection of railway infrastructure.
In recent years, methods for the identification and extraction of railway facilities from point cloud data can be broadly categorized into three groups: methods based on point attributes and image processing, deep learning-based methods, and methods based on geometric features and spatial relationships [6].

2.1. Methods Based on Point Attributes and Image Processing

Methods in this category typically project point clouds onto two-dimensional images and apply conventional image processing techniques, such as edge detection and threshold-based segmentation, to extract target contours.
Beger et al. [11] combined point cloud data with imagery to achieve rail extraction. Zhu et al. [12] converted point clouds into binary images and classified railway facilities using image processing techniques. Zhong et al. [13] projected point clouds onto a two-dimensional plane and employed convolutional neural networks (CNNs) for feature detection to identify components of electrified railway catenary systems. Li. [14] generated intensity raster images by projecting point clouds onto the XOY plane, and achieved automatic rail extraction by integrating Canny edge detection, Hough transform-based line detection, and gauge constraints. However, these methods exhibit two main limitations. First, metro environments are typically enclosed, and data acquisition often occurs under low-light conditions, making RGB information from point clouds and images highly sensitive to illumination variations, which may degrade robustness and accuracy in low-light metro environments. Second, the projection of three-dimensional point clouds onto two-dimensional images inevitably leads to the loss of spatial information, thereby reducing the reliability of fine feature extraction and segmentation.

2.2. Methods Based on Deep Learning

Deep learning methods have advanced rapidly in recent years and offer broad application prospects [15]. Xu et al.constructed a deep learning network incorporating multi-scale feature fusion and an attention mechanism to achieve automatic extraction of catenary wires in electrified railways. Grandio et al. [16,17] employed neural networks for semantic segmentation of railway point clouds, accomplishing the extraction of all relevant infrastructure components. Recent works such as TripletA-Net [18] and RSP-Net [19] have further advanced rail extraction and semantic segmentation tasks through attention mechanisms and multi-view feature fusion. Nevertheless, these methods require substantial time, human resources, and computational power during dataset preparation and model training, posing significant challenges for practical engineering deployment [6].

2.3. Traditional Geometry-Driven Rail Extraction Methods

Geometric feature-based methods leverage local point cloud attributes—such as elevation, normal vectors, intensity, and curvature—to extract rail infrastructure without requiring extensive training data or RGB imagery. A prevalent strategy involves analyzing elevation variations within local neighborhoods to identify trackbed candidates. For instance, Yang et al. [20] and Arastounia et al. [21] detected rails by identifying abrupt elevation changes and histogram extrema, while Lou et al. characterized rail cross-sections by their distinctive “peak-like” morphology. To improve robustness in complex terrains and low-density UAV point clouds, Ren et al. [22] and Wang et al. [23] incorporated local geometric descriptors, including density and normal vector constraints. Zhao et al. [24] combined elevation statistics with mean intensity values and rasterized classification to efficiently separate rail and non-rail points.
Intensity information is frequently employed as a supplementary cue. Studies such as Chen et al. [25], Zou et al. [26], and Amodio et al. [27] assigned higher weights to rail feature points based on reflectance intensity or used intensity thresholds to coarsely localize regions of interest before applying RANSAC or region growing. However, intensity alone cannot reliably distinguish materials with similar reflectance properties, limiting its utility to coarse filtering. Template matching and model-driven approaches have also been explored. Stein et al. [28] constructed parametric rail models based on depth and width features, while subsequent research combined elevation histograms with grid fitting and template-based filtering to refine extraction results. Region growing algorithms guided by geometric relationships, such as those proposed by Cheng et al. [29] and Zou et al. [26], have demonstrated promise for rail vectorization. Additionally, several works have integrated trajectory information from Mobile Mapping Systems to constrain search spaces and optimize clustering outcomes [30,31].
Despite their effectiveness, these methods exhibit notable limitations in the context of ballastless metro tracks. Template matching [4,28] achieves high precision but depends heavily on prior knowledge and incurs high computational complexity [21]. Elevation- and histogram-based techniques perform well on flat terrain but exhibit degraded reliability in areas with steep or varying gradients—a common characteristic of urban metro alignments. Moreover, the majority of existing algorithms have been validated on ballasted track scenarios, where the geometric contrast between rail and ballast facilitates segmentation. Ballastless tracks, by contrast, feature a continuous concrete base and metallic expansion joints that introduce interference points with planar properties and intensity values similar to the rail tread itself [32].
Motivated by these limitations, this study focuses on ballastless metro tracks and proposes a lightweight framework that integrates intensity filtering, normal consistency, and curvature-guided region growing for rail tread extraction.

3. Case Study

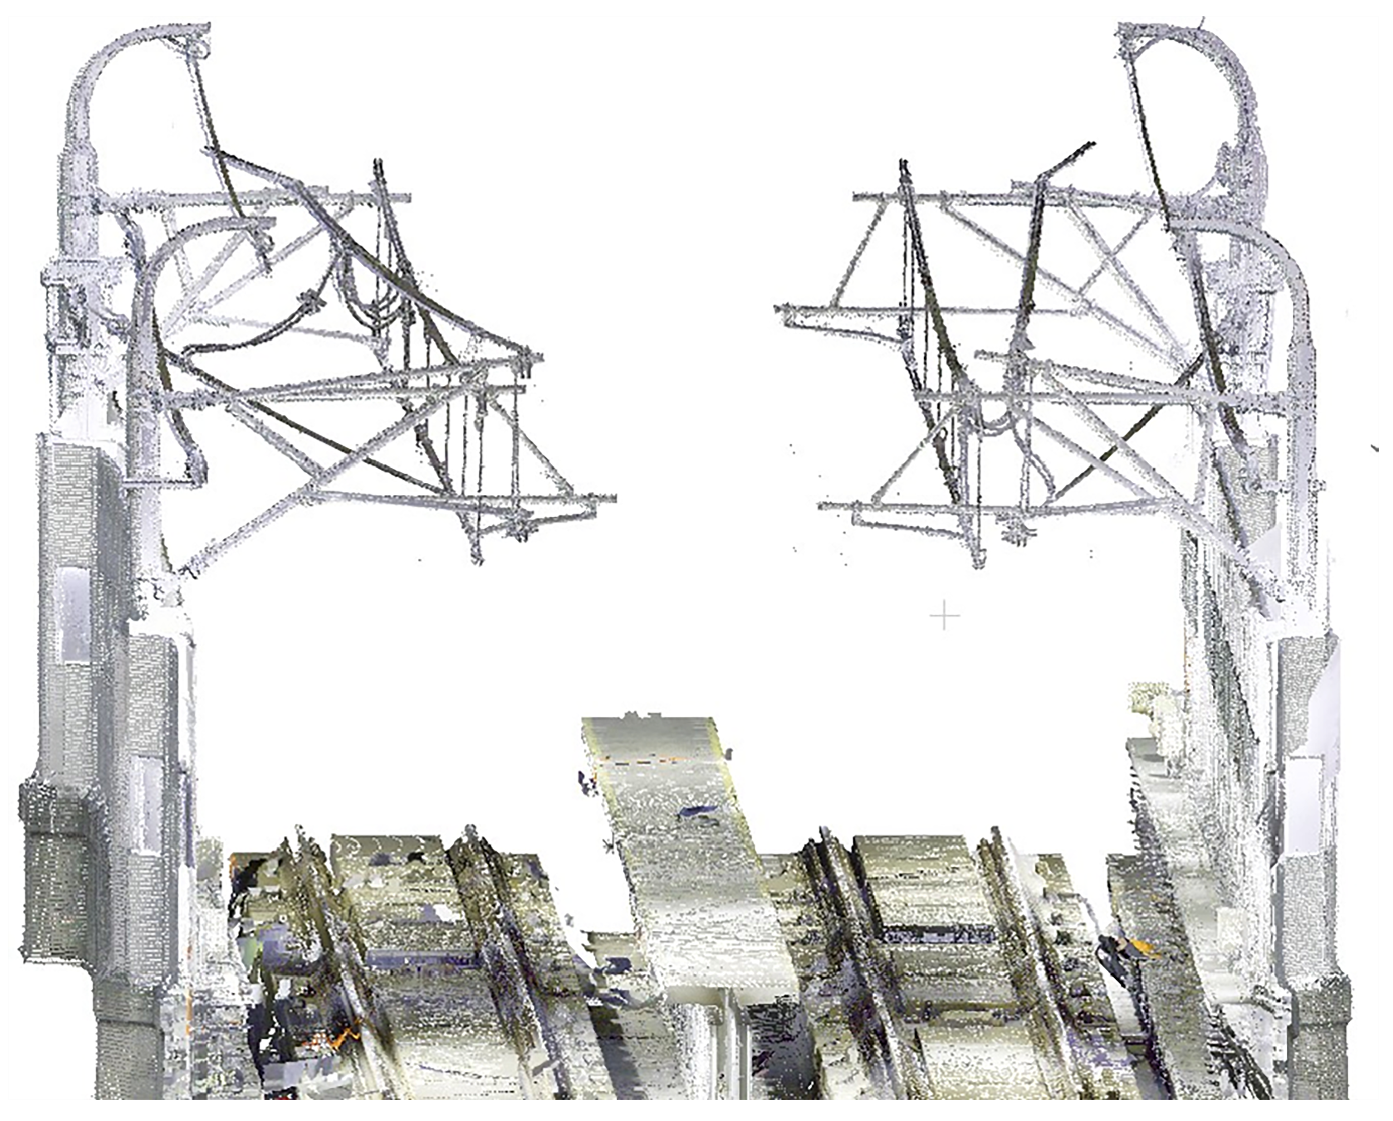
Metro lines typically comprise underground tunnels, elevated sections, and ground-level segments [33]. In this study, we selected a partial elevated section of Shanghai Metro Line 10 for experimentation. The selected segment is characterized by the presence of sound barriers on both sides of the track, which effectively shielded the scanning process from external interference caused by surrounding buildings and vegetation. Point cloud data were acquired using a Leica P40 Terrestrial Laser Scanner (TLS; Leica Geosystems AG, Heerbrugg, Switzerland). Multi-station data registration and the removal of anthropogenic noise points were performed using Leica Cyclone software (version 9.0, Leica Geosystems AG, Heerbrugg, Switzerland; available online: https://leica-geosystems.com). A 50-m-long point cloud dataset was collected along the track direction. This dataset encompasses typical objects found in electrified metro systems—including rails, fasteners, concrete trackbed, overhead catenary components, and sound barriers—and is therefore considered representative of the operational environment. The dataset contains 58,893,153 points covering an area of approximately 620 m 2 , corresponding to an average point density of approximately 9.5 × 10 4 points / m 2 . The ground truth (GT) was generated through manual annotation of the rail tread region from the original point cloud data by experienced operators. The collected point cloud data of the elevated section on Shanghai Metro Line 10 is illustrated in Figure 1.

4. Methodology

Whether in the area with slope or in the area where the slope changes, the rail tread is approximately a plane in the local range, so the normal vector of a non-edge point in the rail tread point cloud is relatively close to the normal vector direction of its adjacent point. Therefore, the complete rail tread can be extracted by setting a smoothing threshold to cluster points with a close direction to the normal vector through the improved regional growth algorithm. However, before that, it is necessary to filter out the plane that will form interference in some scenes to reduce a large number of non-essential calculations and avoid the formation of non-target objects and clustering that lead to extraction errors.
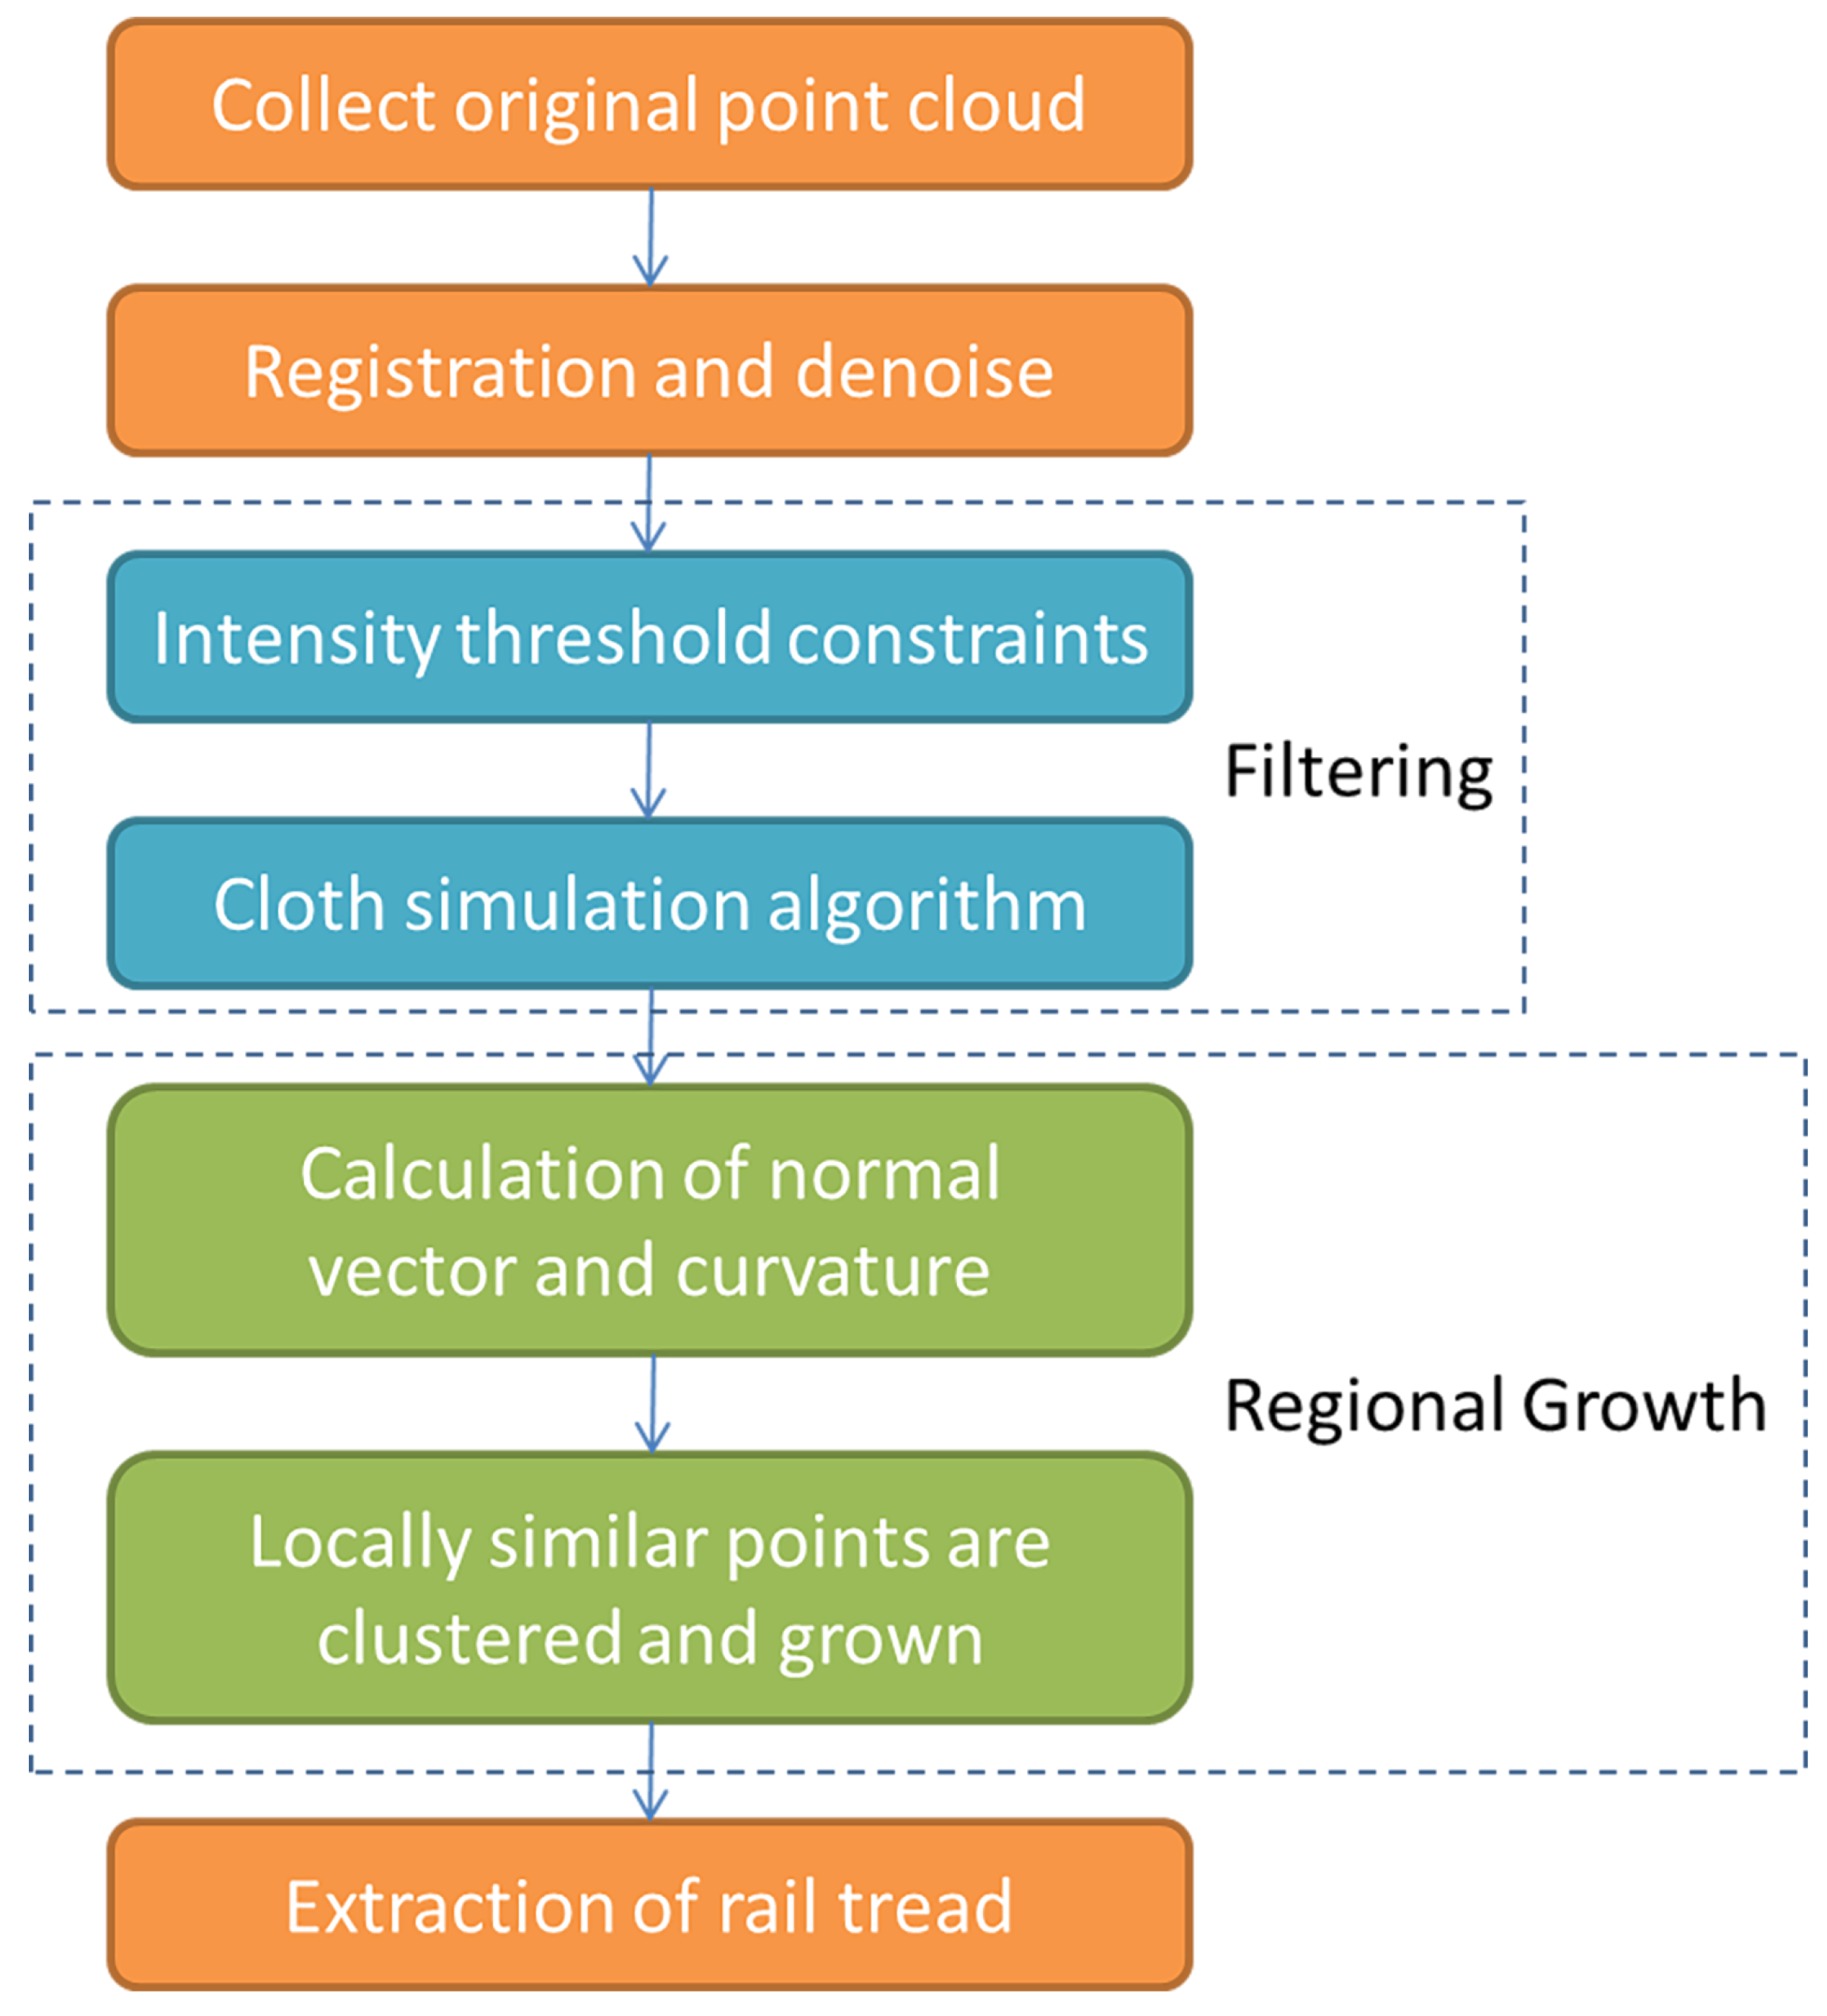
Therefore, this paper first filters out most non-metallic objects through point cloud intensity value filtering. After that, through the cloth simulation algorithm implemented in CloudCompare (version 2.12, available online: https://www.cloudcompare.org), the objects in the subgrade area are filtered, and finally, the normal vector and curvature of the point cloud are calculated, and the complete rail surface is extracted through the improved regional growth algorithm. Figure 2 intuitively illustrates the specific workflow of this paper.

4.1. Intensity Threshold Filtering

In addition to three-dimensional coordinate information, point cloud data usually contains reflection Intensity information, which is used to record the reflection intensity of different measured objects. The more common value ranges from 0 to 255. The intensity depends not only on the material and roughness of the measured object but also on the scanner model, incident angle, and weather conditions [34,35]. However, in the point cloud data obtained by the same instrument, the intensity of the measured object of a similar material is relatively close [36].
The scene can be divided into three areas: the track subgrade area, and the noise barrier area and the contact network area. Table 1 lists the typical intensity ranges of some major objects within the scene, derived from the statistical histogram distribution of the datasets.
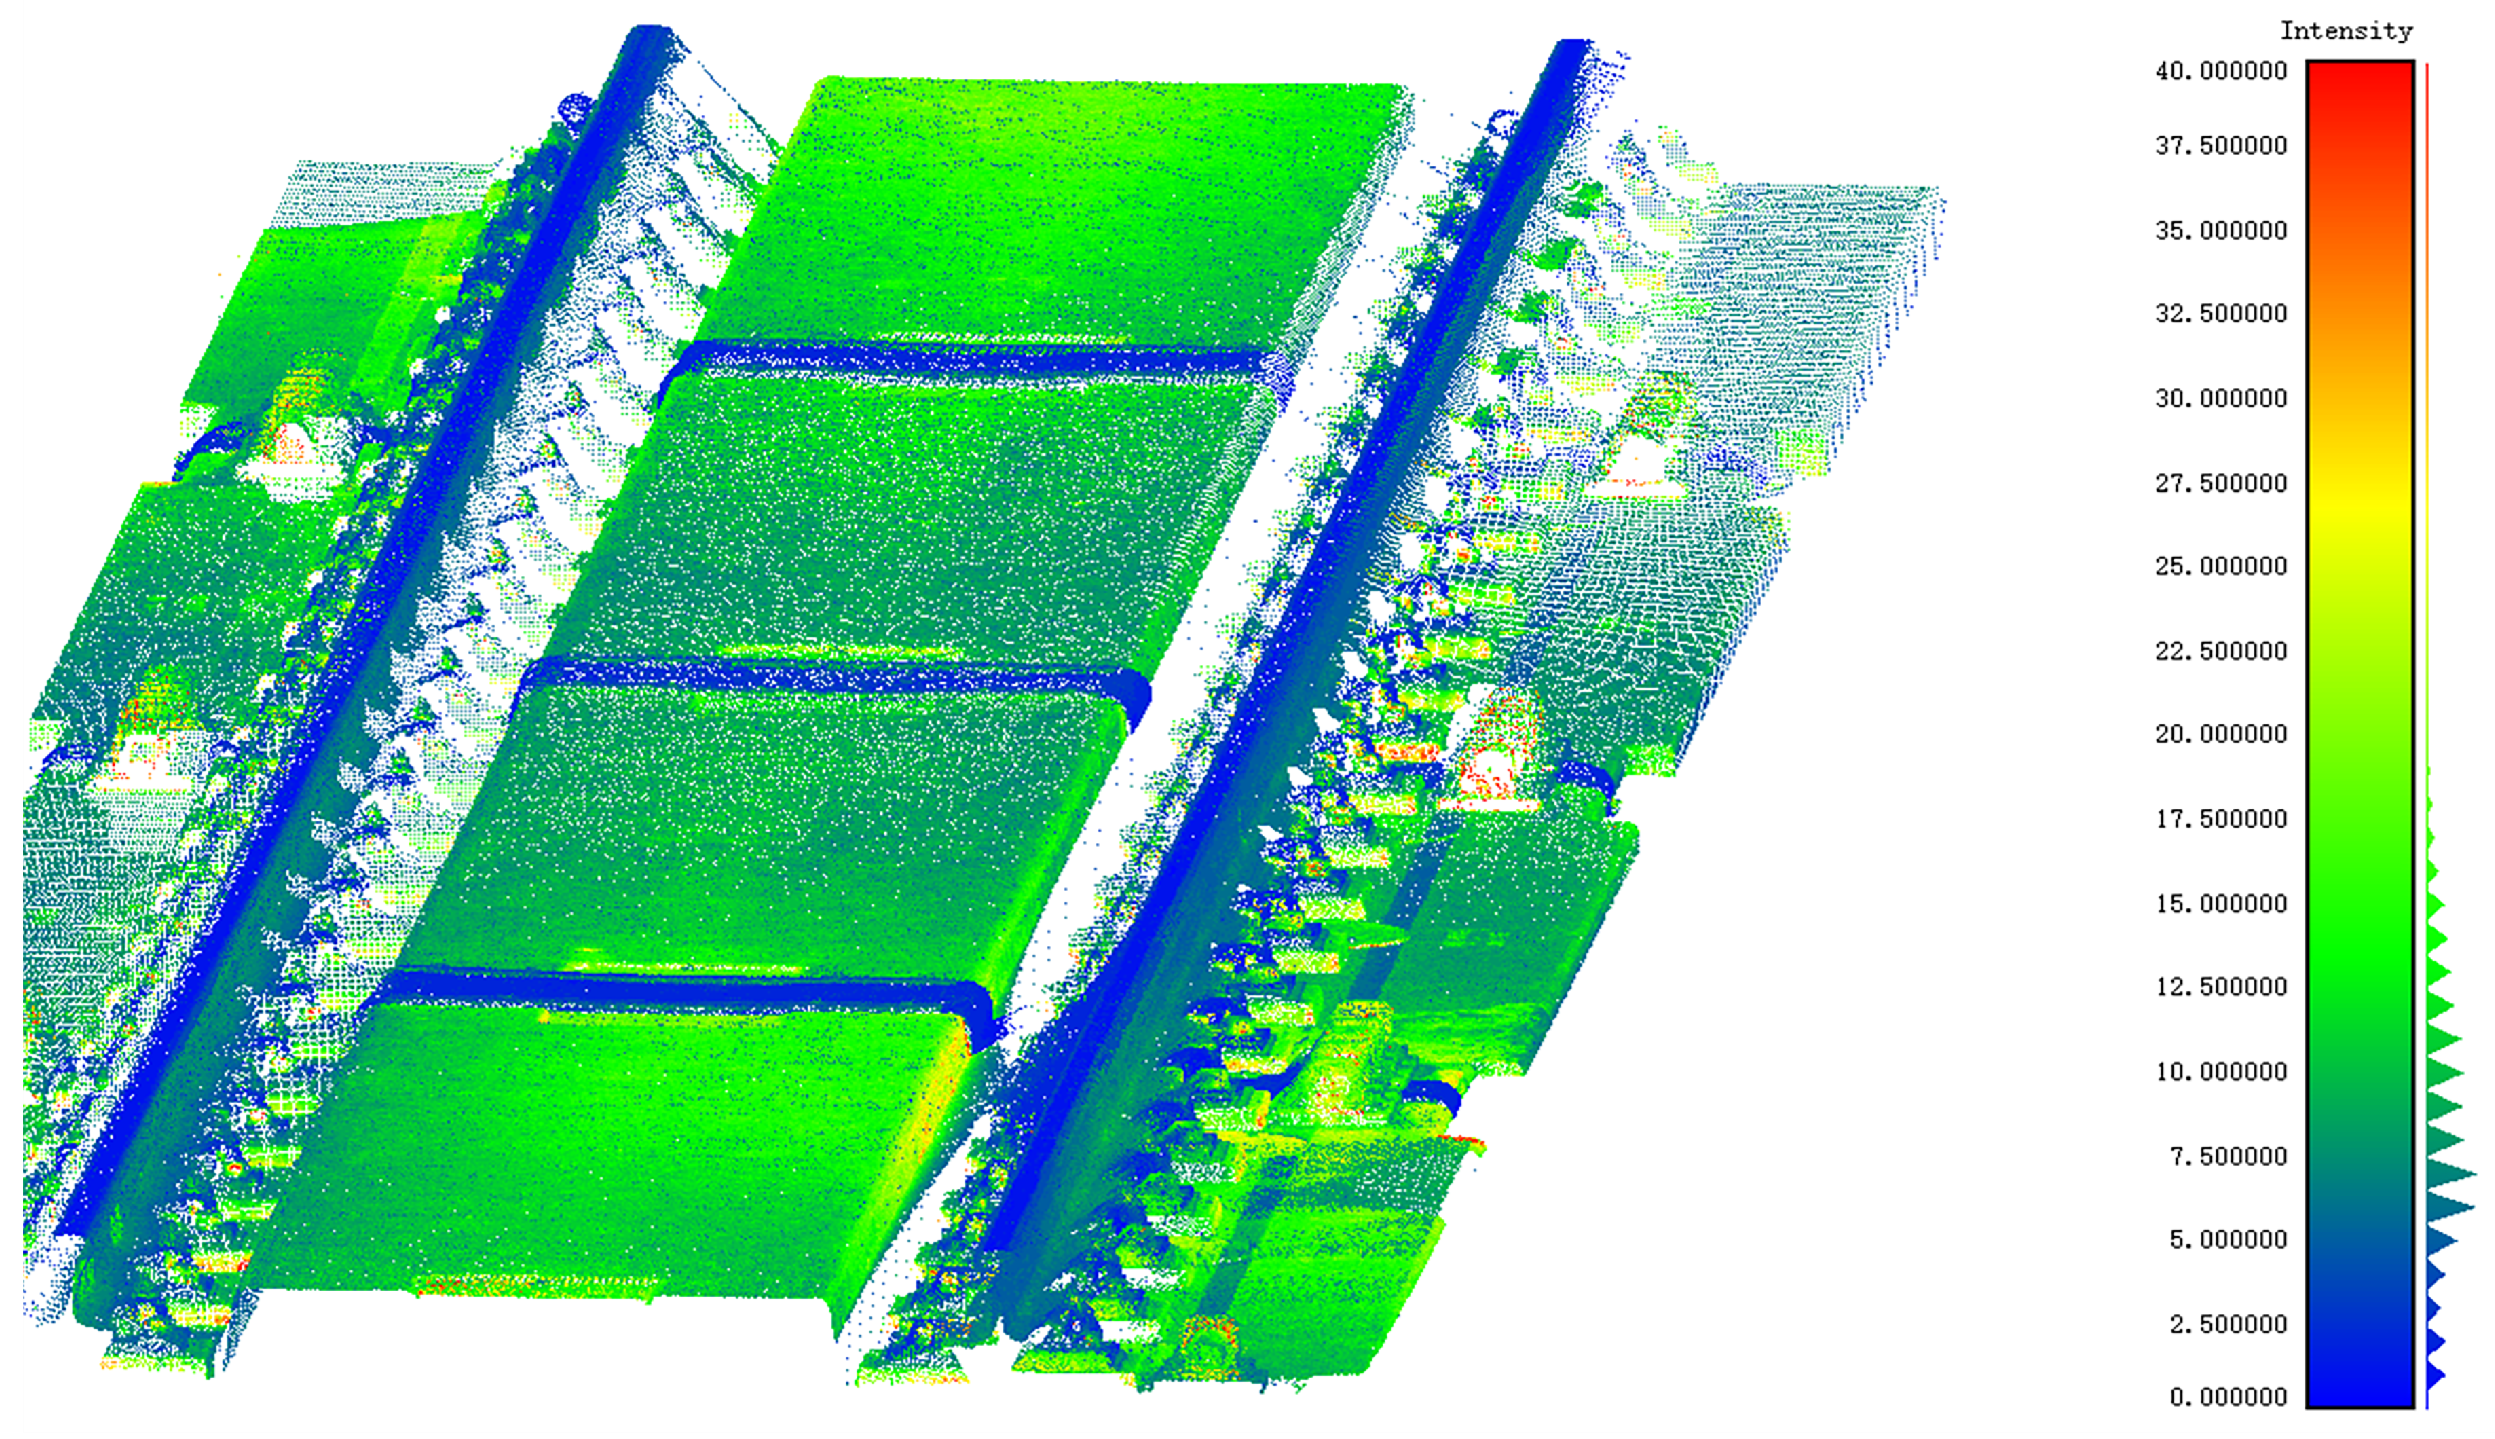
The overall area of the track subgrade is shown in Figure 3. The bottom end is the roadbed, that is, the ground under the rail, and the main material is concrete. Because the line adopts a ballastless track, there is no ballast and wooden sleeper. To avoid the deformation of the roadbed caused by temperature, humidity, and vibration during the operation of the train, an expansion joint will be set up on the roadbed every distance to improve the buffer. To prevent rainwater and other debris from entering the structure of the channel bed line through the expansion joint and affecting the stability and durability of the channel bed, the expansion joint of the ballastless track will be closed with a layer of sheet iron. In addition, the roadbed is mainly paved with rails and rail fasteners.
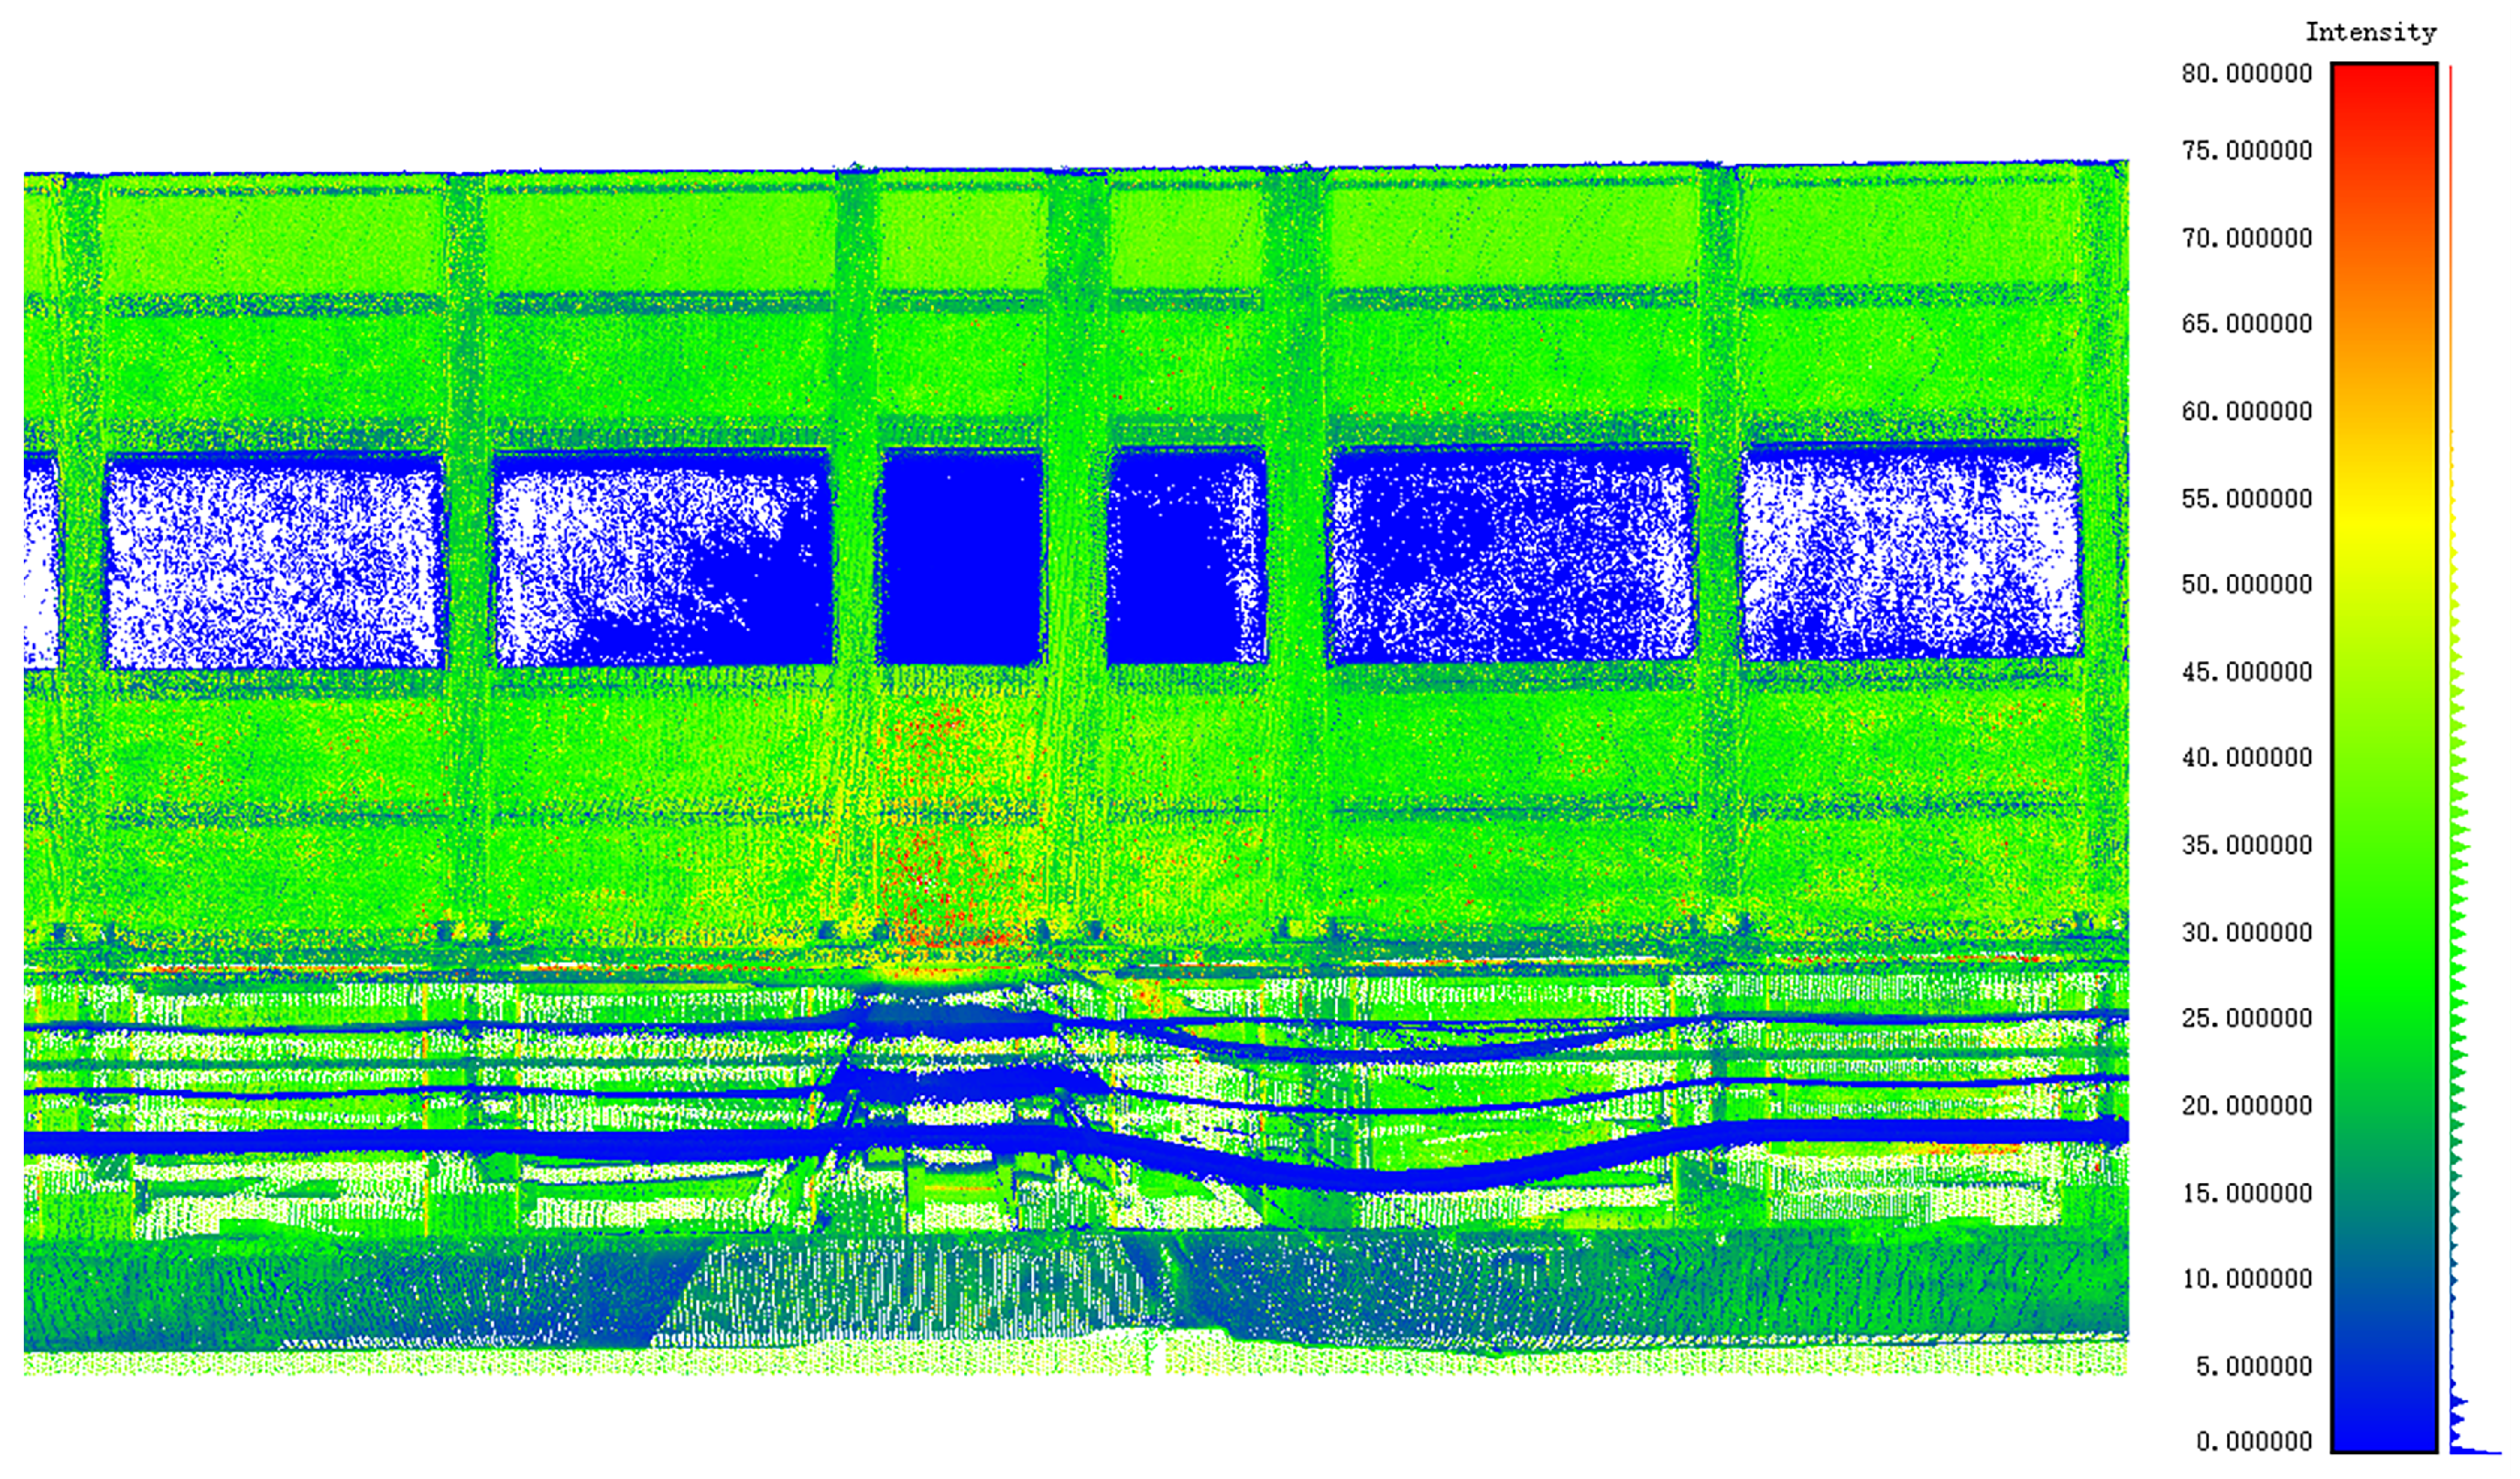
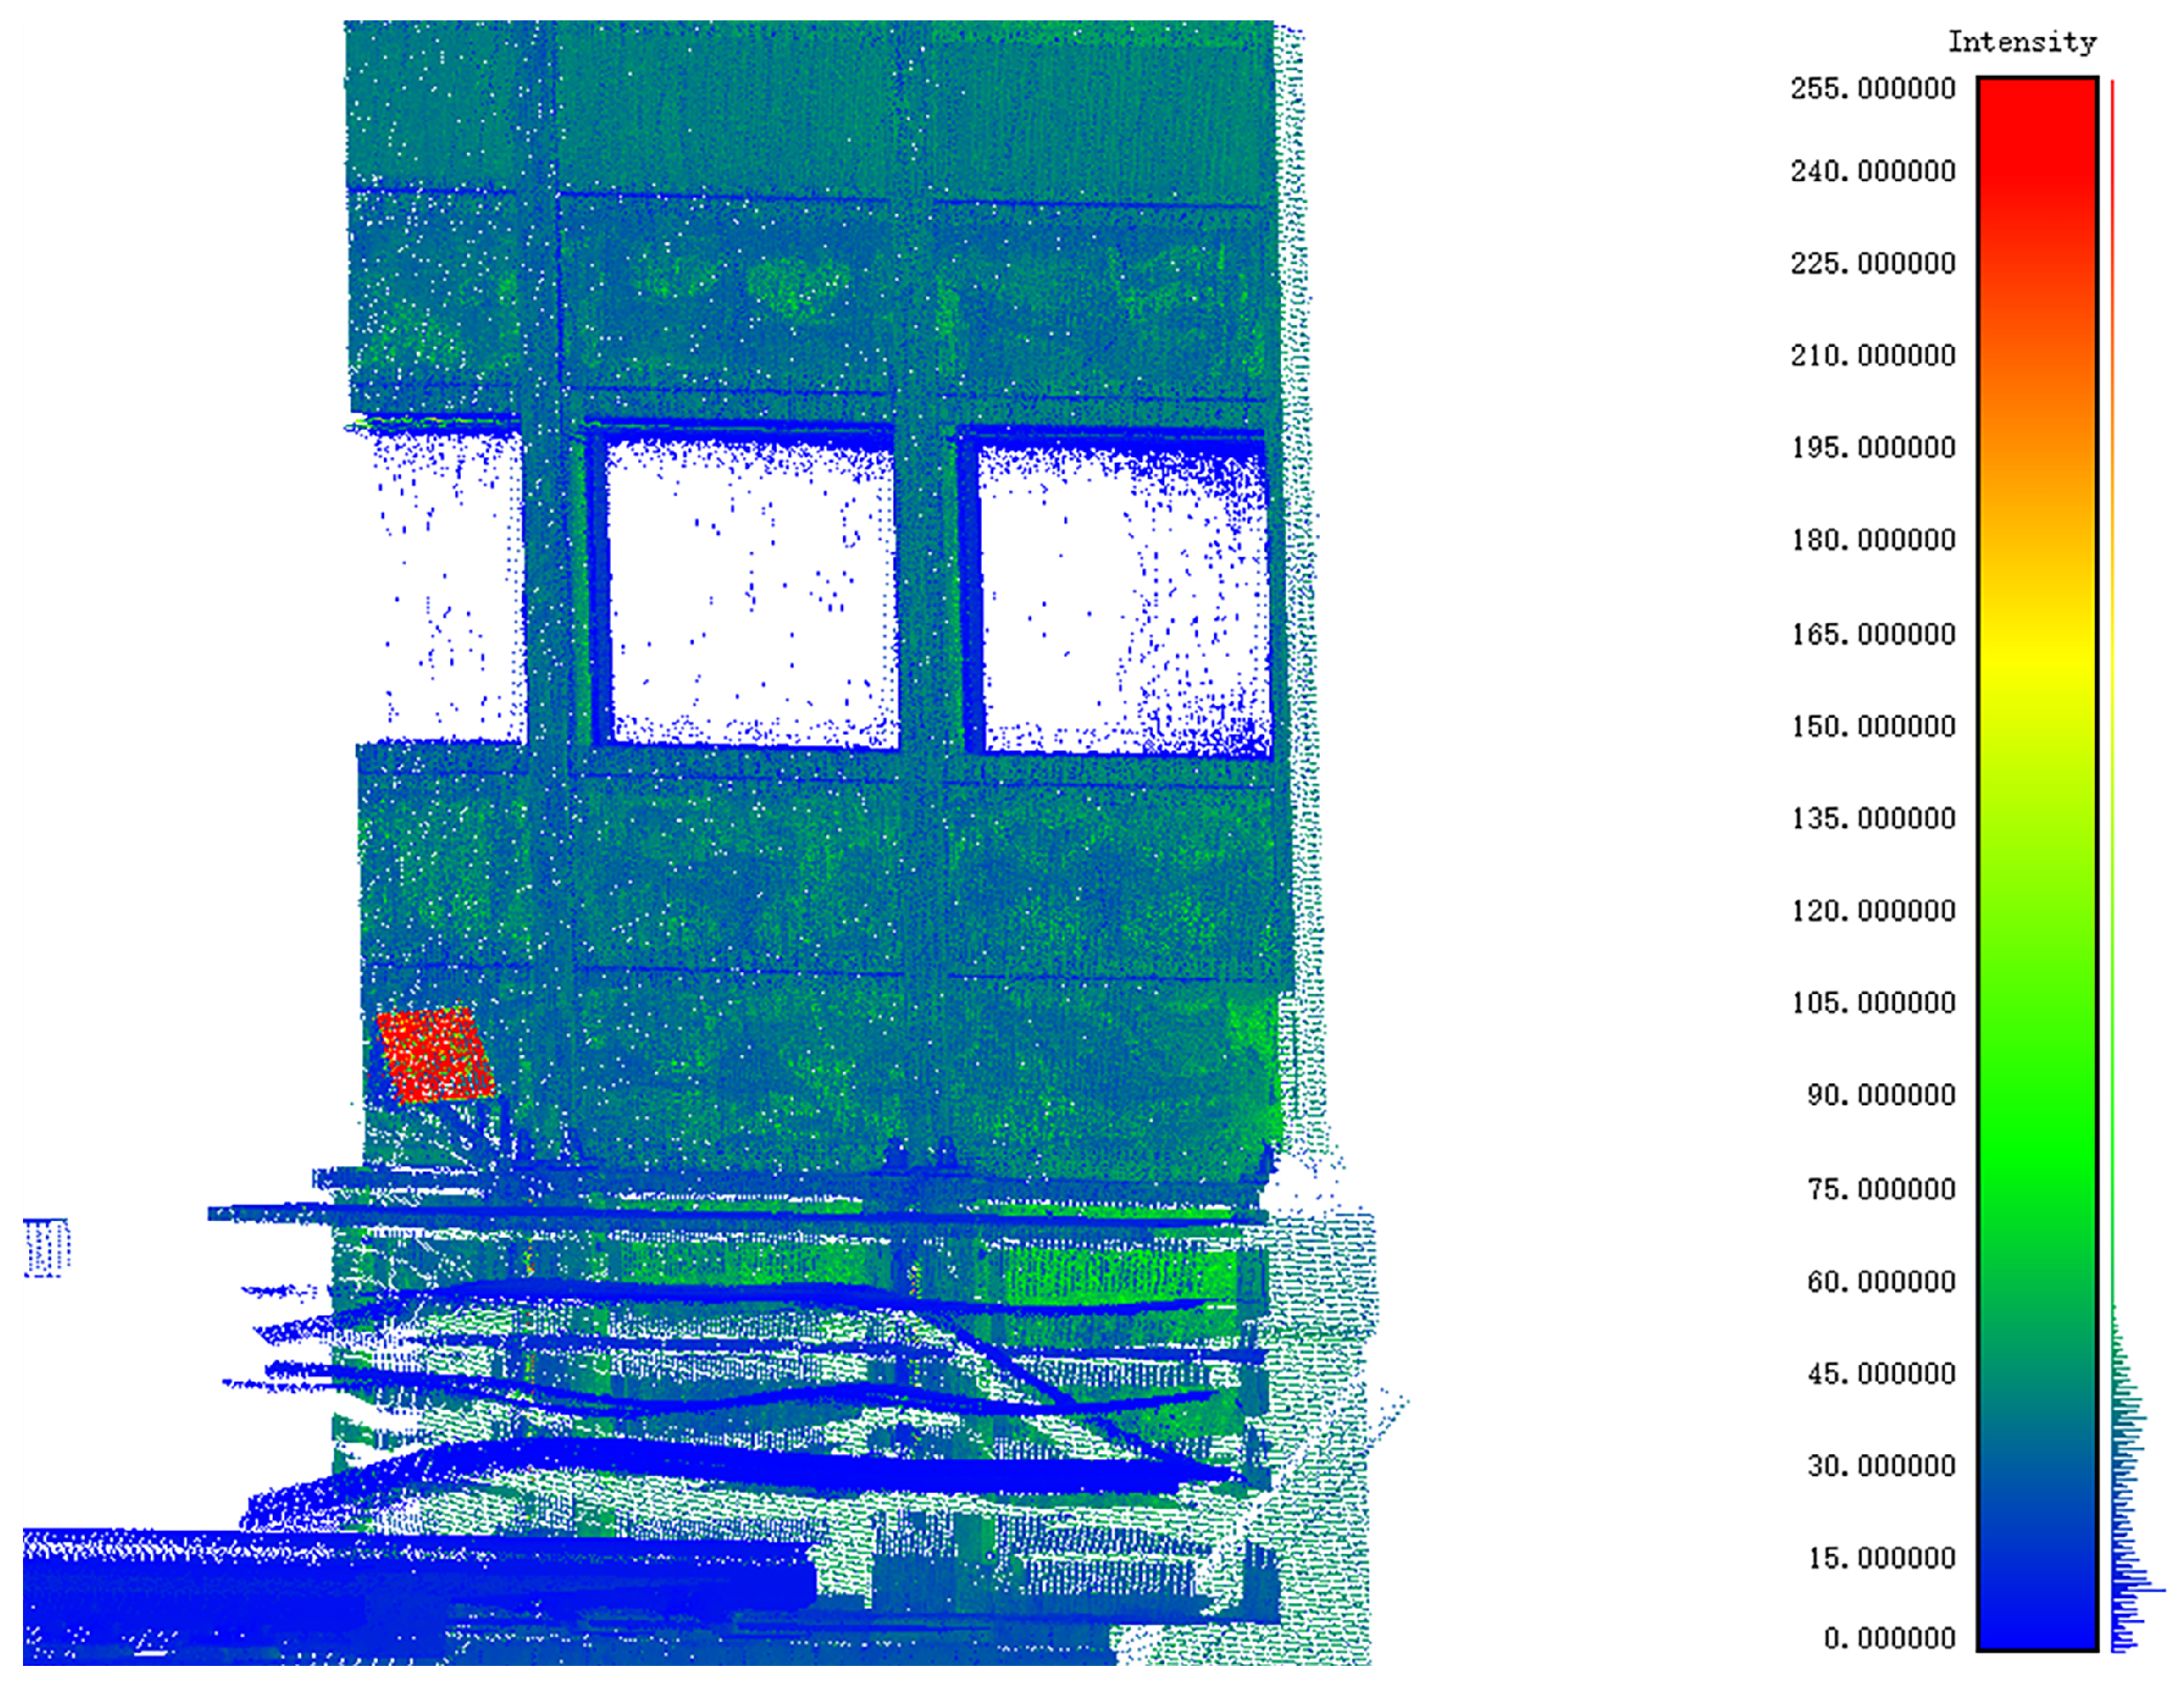
This section is set on the viaduct. To reduce the impact of noise pollution on the surrounding residents, noise barriers are set on both sides of the section, as shown in Figure 4. The main material of the noise barrier is a metal composite material, and there is a special transparent plastic board on it. In addition, the transmission line is attached to the noise barrier.
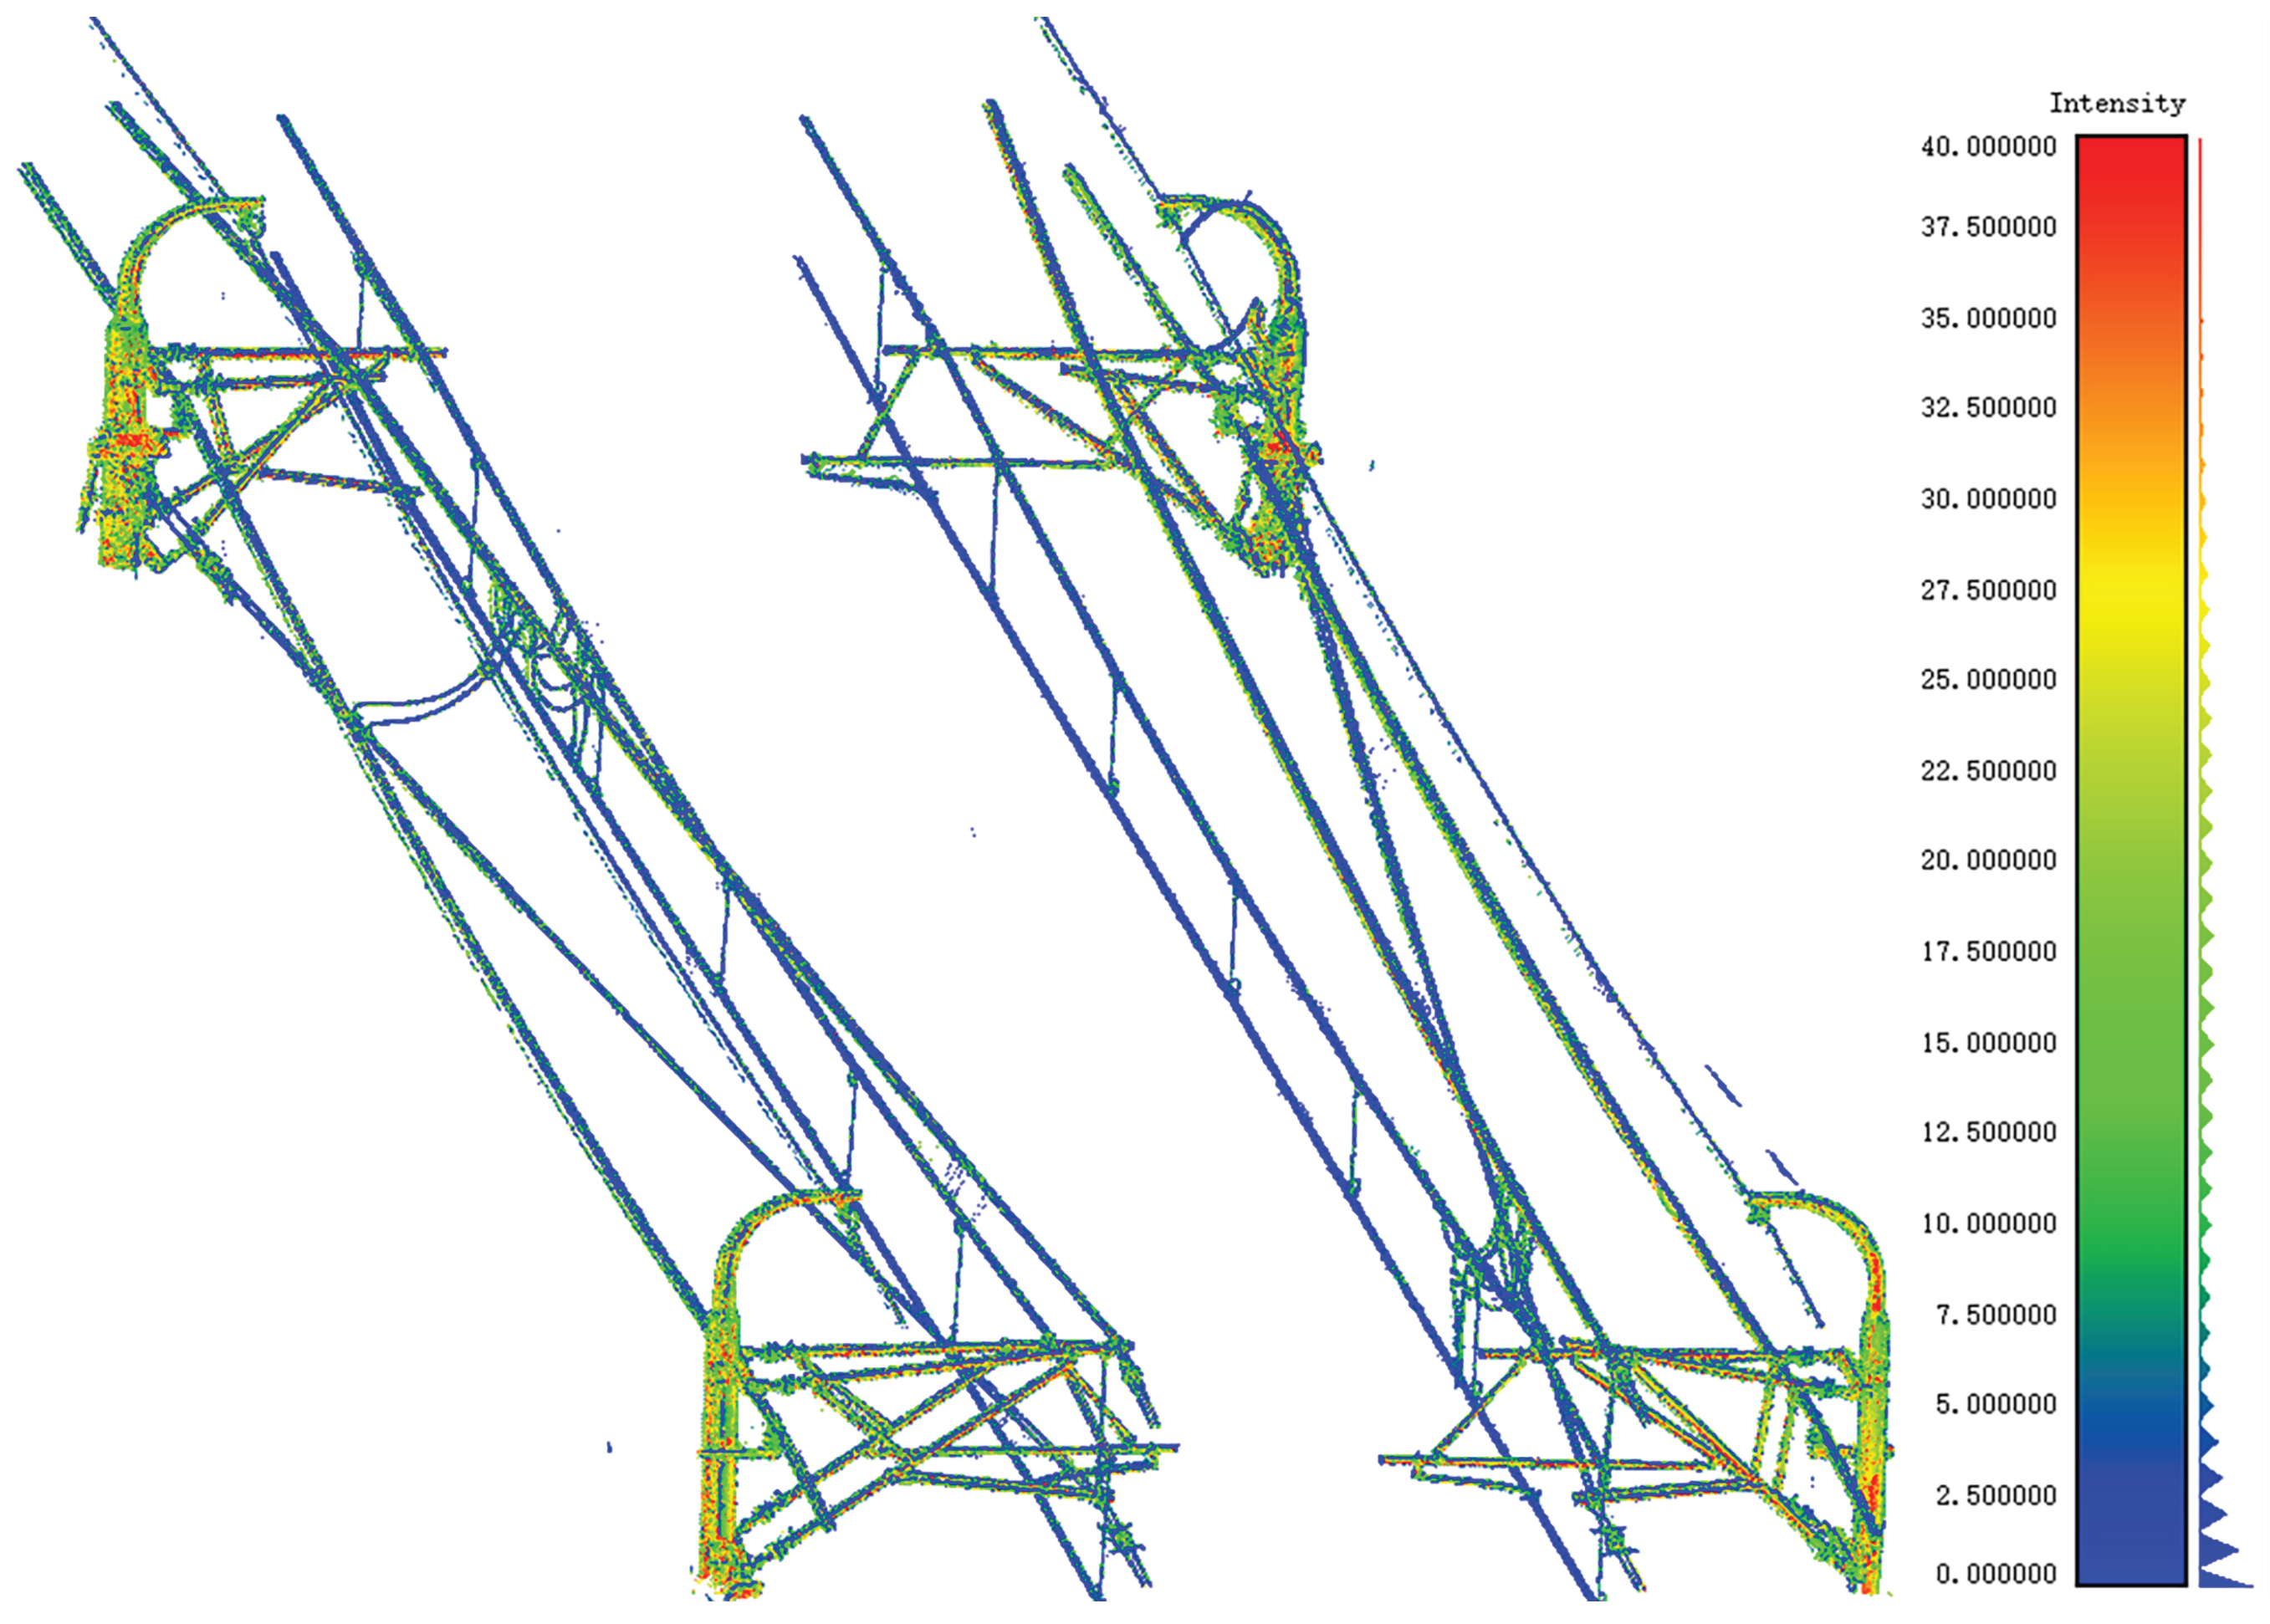
The contact network area as a whole is shown in Figure 5. It mainly includes overhead power cables, mast and cantilevers. Overhead power cables mainly transmit electricity to electric trains in electrified subways. The mast is used to support overhead power cables. Cantilevers are used to connect masts and overhead power cables and fix overhead power cables.
Figure 4. Noise barrier area and its intensity distribution.
Applsci 16 08791 g004
Figure 5. Contact network area and its intensity distribution.
Applsci 16 08791 g005
Additionally, various trackside signs are present in the scene, including mileage and prohibition signs, which primarily serve as visual indicators for the train crew and line maintenance personnel. To ensure sufficient visibility, these signs are generally highly reflective and exhibit high intensity values in the point cloud, as shown in Figure 6.
Based on the statistical analysis of the intensity distributions presented in Table 1, the reflective intensity of the metallic rail tread consistently concentrates within a distinct narrow range of 1 to 4. In contrast, the concrete subgrade exhibits slightly higher reflectance (7–14), while trackside mileage signs and sheet iron patches display drastically higher intensity values. Consequently, setting an empirical intensity threshold of 1–4 serves as an optimal descriptor to separate the rail tread from the complex background. This initial filtering stage effectively reduces the computational search space for the follow-up algorithms while mitigating potential segmentation errors.
Figure 6. Intensity distribution of reflective signs in the metro scene.
Applsci 16 08791 g006

4.2. Cloth Simulation Filtering

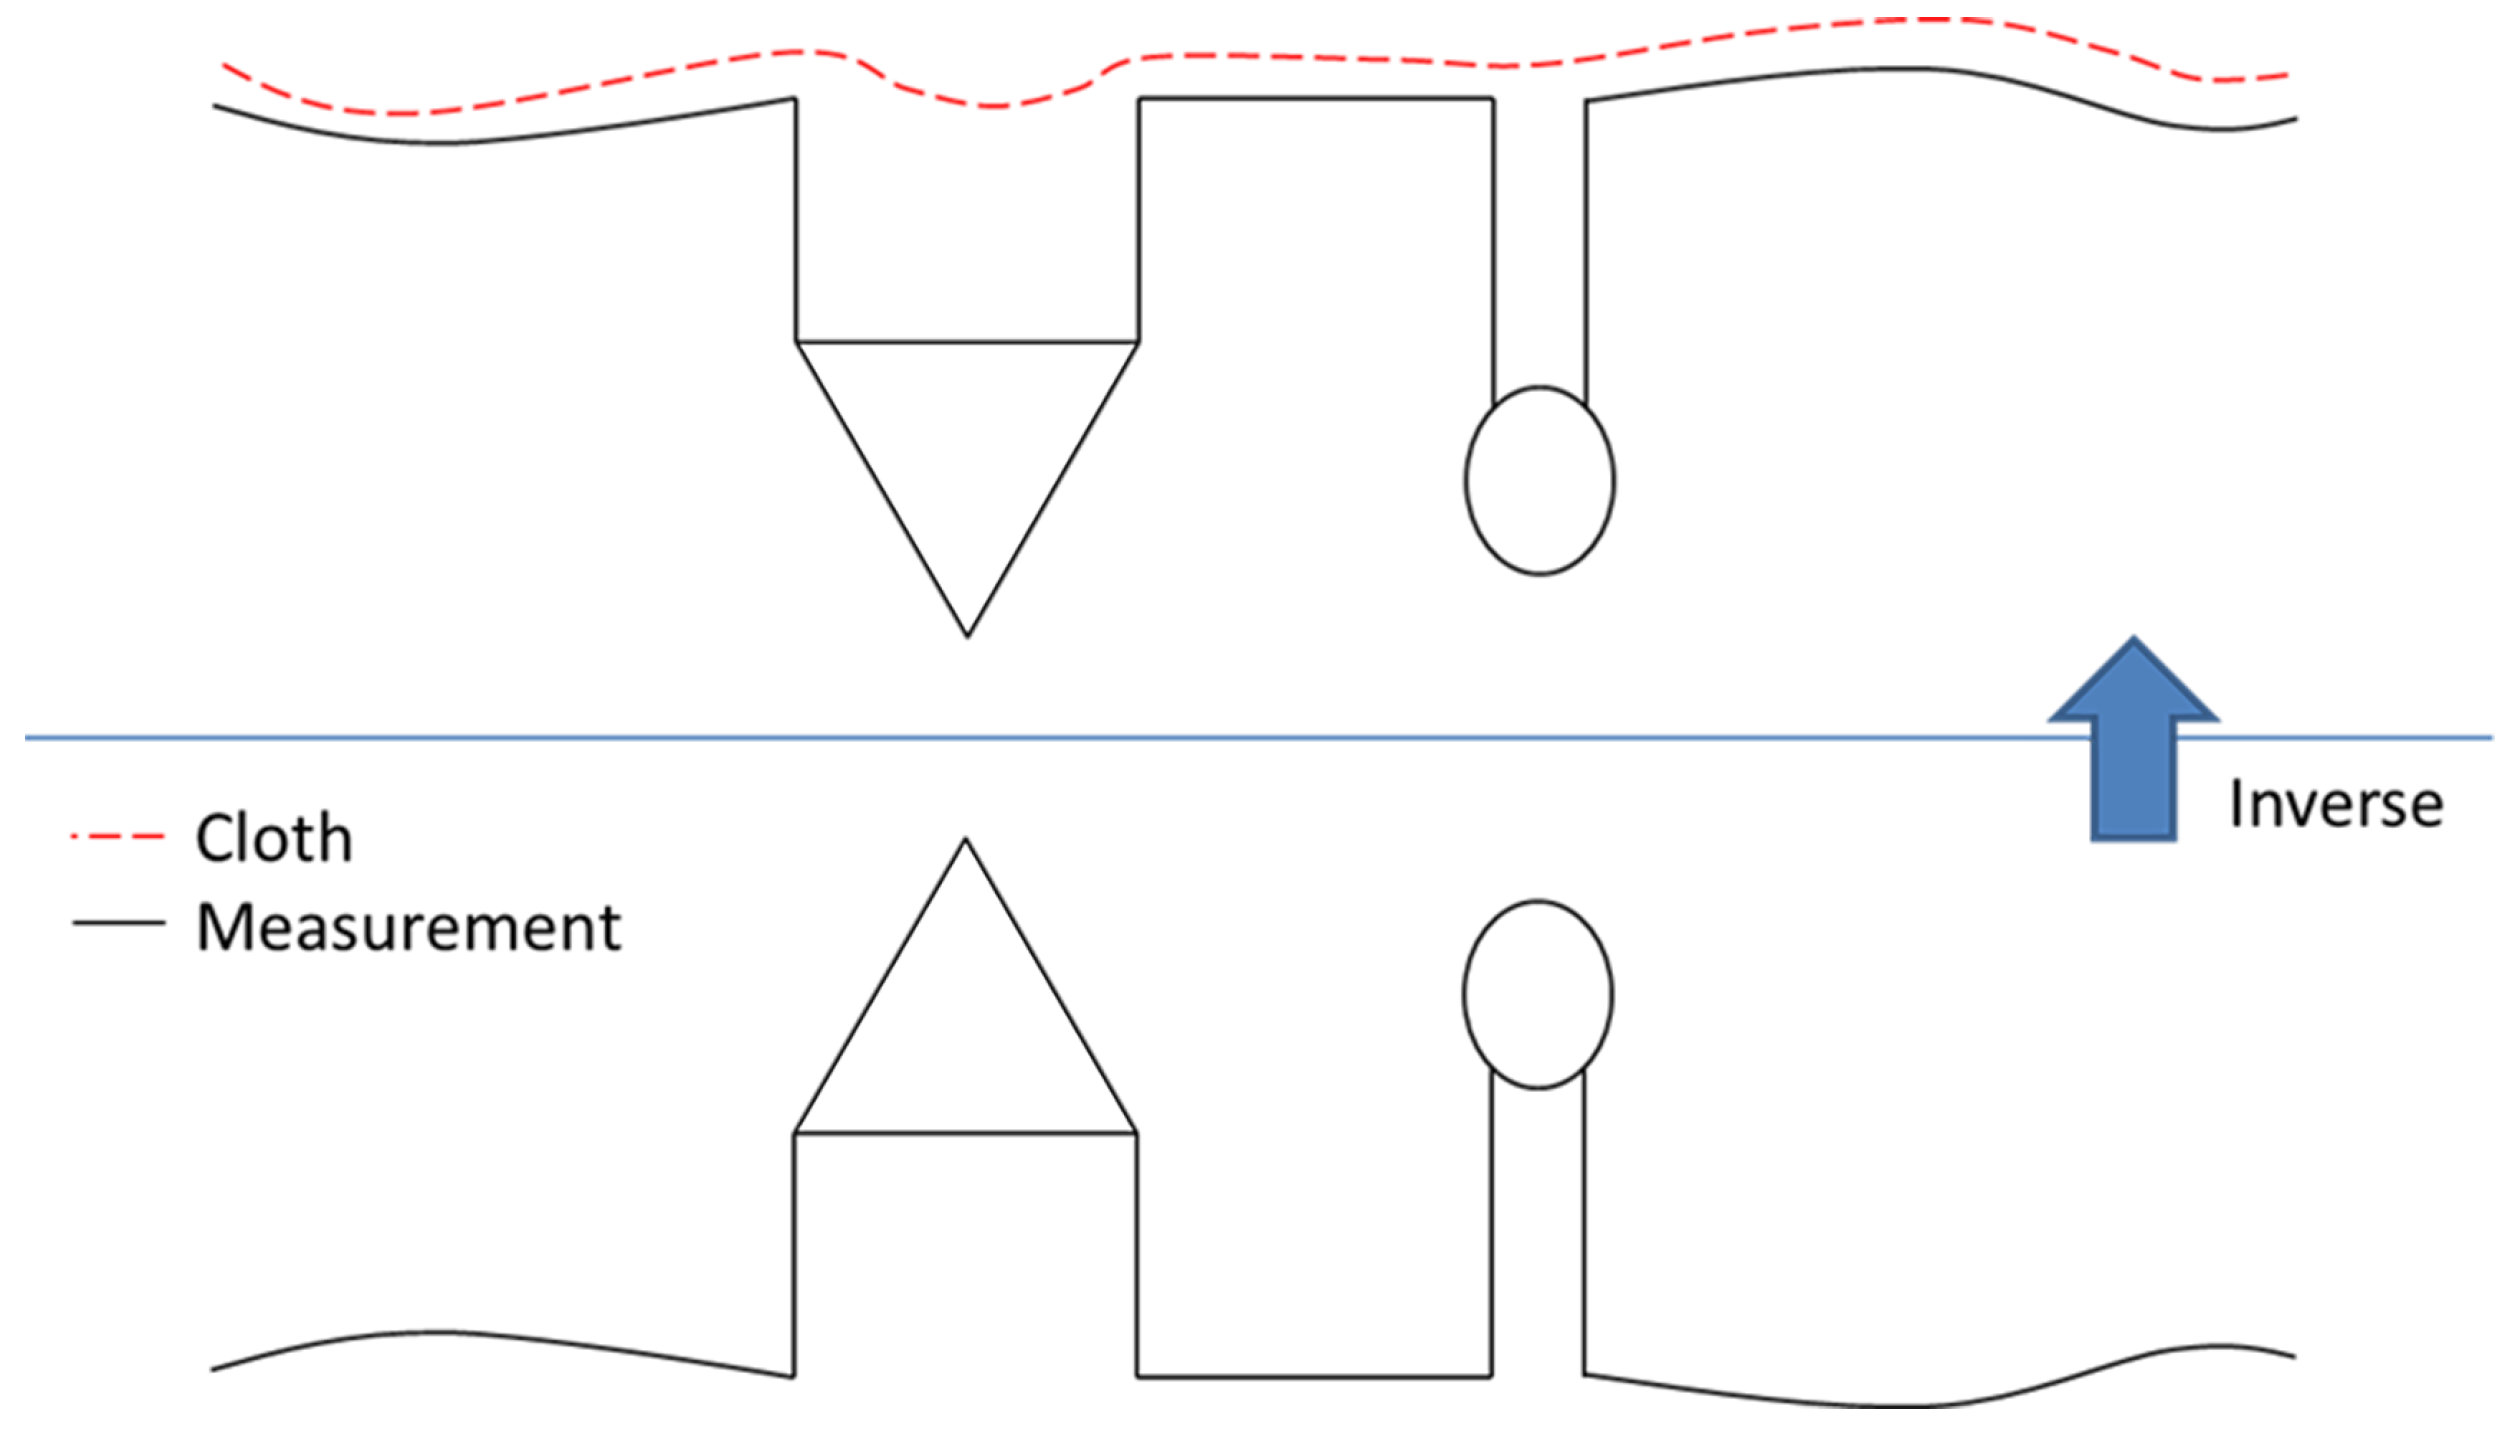
This paper adopts the filtering algorithm based on cloth simulation proposed by Zhang [37], which has the advantages of high accuracy, strong stability, and fast calculation speed [38]. The general idea of the algorithm is to invert the original point cloud, and then a piece of cloth falls from above to the inverted surface. By analyzing the interaction between the nodes of the cloth and the corresponding LIDAR points, the final shape of the cloth can be determined and used to classify the original points as ground and non-ground. The principle of the algorithm is shown in Figure 7.
Through the cloth simulation filtering algorithm, the track subgrade part can be completely retained, and the transmission wires, noise barriers, and some attachments on the noise barrier can be filtered, which can not only reduce the complexity of the subsequent algorithm, but also avoid the impact of the overhead power cables forming a cluster on subsequent experiments.

4.3. Calculation of Normal Vector and Curvature of Point Cloud

In this section, the normal vector and curvature of the point cloud extracted in Section 3.2 are calculated to prepare for the subsequent region growing-based clustering. Currently, the most widely used method for point cloud normal vector estimation is the classical Principal Component Analysis (PCA) proposed by Hoppe et al. [39], which defines the normal of a point as the eigenvector corresponding to the minimum eigenvalue of its neighborhood covariance matrix. This algorithm is characterized by its computational simplicity, robustness, and high efficiency [40]. The steps for estimating point cloud normal vectors using PCA in this study are as follows:
  • Establish a KD-tree to build a topological relationship for disordered and scattered point clouds. The KD-tree can divide the data in the k-dimensional space and then retrieve it in the divided interval.
  • Based on the KD-tree local neighborhood search, a point set P is constructed with each data point p i as the center. The point set P is shown in Equation (1). In the formula, n represents the total number of points, and ( x i , y i , z i ) are the three-dimensional coordinates of the point p i .
    P = { p 1 , p 2 , , p n } , p i = ( x i , y i , z i ) T R 3 , i = 1 , 2 , , n
    Based on each point P i , a point set M is constructed with a neighborhood radius of r, where the distance between any point P j M and P i is less than r. The point set M is defined in Equation (2), where r denotes the neighborhood radius.
    M = { p j   p j p i < r , p j P }
    where n represents the total number of points in the dataset, and p i is the three-dimensional coordinate vector of the i-th point.
  • According to the principle of least squares of distance, the Locally fitted plane K of the data set M is calculated. The plane K is shown in the function in Equation (3). In the formula, e is the normal vector of the plane K, d is the distance from the sampling point to the plane K, and arg   min is the variable value of the minimum value of the function.
    K ( e , d ) = arg   min e , d j = 1 k ( e · p j d ) 2
    In the process of fitting the local plane, the center of mass of k near-neighbor points is located on the plane K, and e is the unit vector, satisfying e = 1 . Therefore, the solution point cloud normal vector problem is converted into the covariance matrix C eigenvalue decomposition problem of k near neighbors. The eigenvector corresponding to the minimum eigenvalue of the obtained covariance matrix C is the normal vector of the sampled point. Where the covariance matrix C is shown in Formulas (4) and (5), k in the formula is the total number of neighbor points. Number, p ¯ is the center of mass of k nearest neighbors, λ i is the eigenvalue of the covariance matrix, and v i is the eigenvector corresponding to λ i .
    C = 1 k j = 1 k ( p j p ¯ ) ( p j p ¯ ) T
    C v i = λ i v i , i { 0 , 1 , 2 }
    At each sampling point in the point cloud, there is a curved surface approaching the neighborhood point cloud, and the curvature at a point can be represented by the local surface curvature of the point and its neighborhood point. At present, the more common method is to find the curvature of a certain point by fitting a quadratic surface, but since the least square method has been used above to find the normal vector of the sampling point, in which the eigenvalue λ i represents the degree of change of the sampling point p i in three directions, so the curvature of the point p i is close. The likelihood estimation method is shown in Equation (6):
    σ ( p i ) = λ 0 λ 0 + λ 1 + λ 2

4.4. Rail Tread Extraction Based on Regional Growth Algorithm

The regional growth algorithm of point clouds is about to gather similar point clouds to form a region. First, a point in the point cloud data is randomly selected as the seed point, and the point in the field of the point with the same or similar properties (RGB value, elevation value, intensity value and normal vector value, etc.) is judged to be in the same region as the point. After that, the new point continues to grow around as a seed point until the point that does not meet the conditions can be added to the area, and then one area is divided. Repeat the above steps until all the points are traversed.
The regional growth algorithm based on the point cloud extracts the rail tread. In essence, it compares the normal vector angle between the neighborhood points in a certain range with the set angle threshold, and limits the growth through the setting of the curvature threshold, to form a continuous and large number of point cloud clusters on the rail tread, while other objects in the scene (for example, there is a certain distance between the iron sheet of the more regular expansion joint on each surface, and the number of point clusters formed by the iron sheet of a single expansion joint is small and fixed. Irregular objects such as rail fasteners will form a large number of different clusters, and the number of midpoints in each cluster is very small), which is easy to filter out, to achieve the purpose of extracting the rail tread surface.
The traditional regional growth algorithm of the point cloud is random in the selection of seed points. The constraints on the seed point of growth are limited, and the efficiency and accuracy are low. In this paper, an improved regional growth algorithm is proposed for the problem of rail tread extraction. The specific steps are as follows:
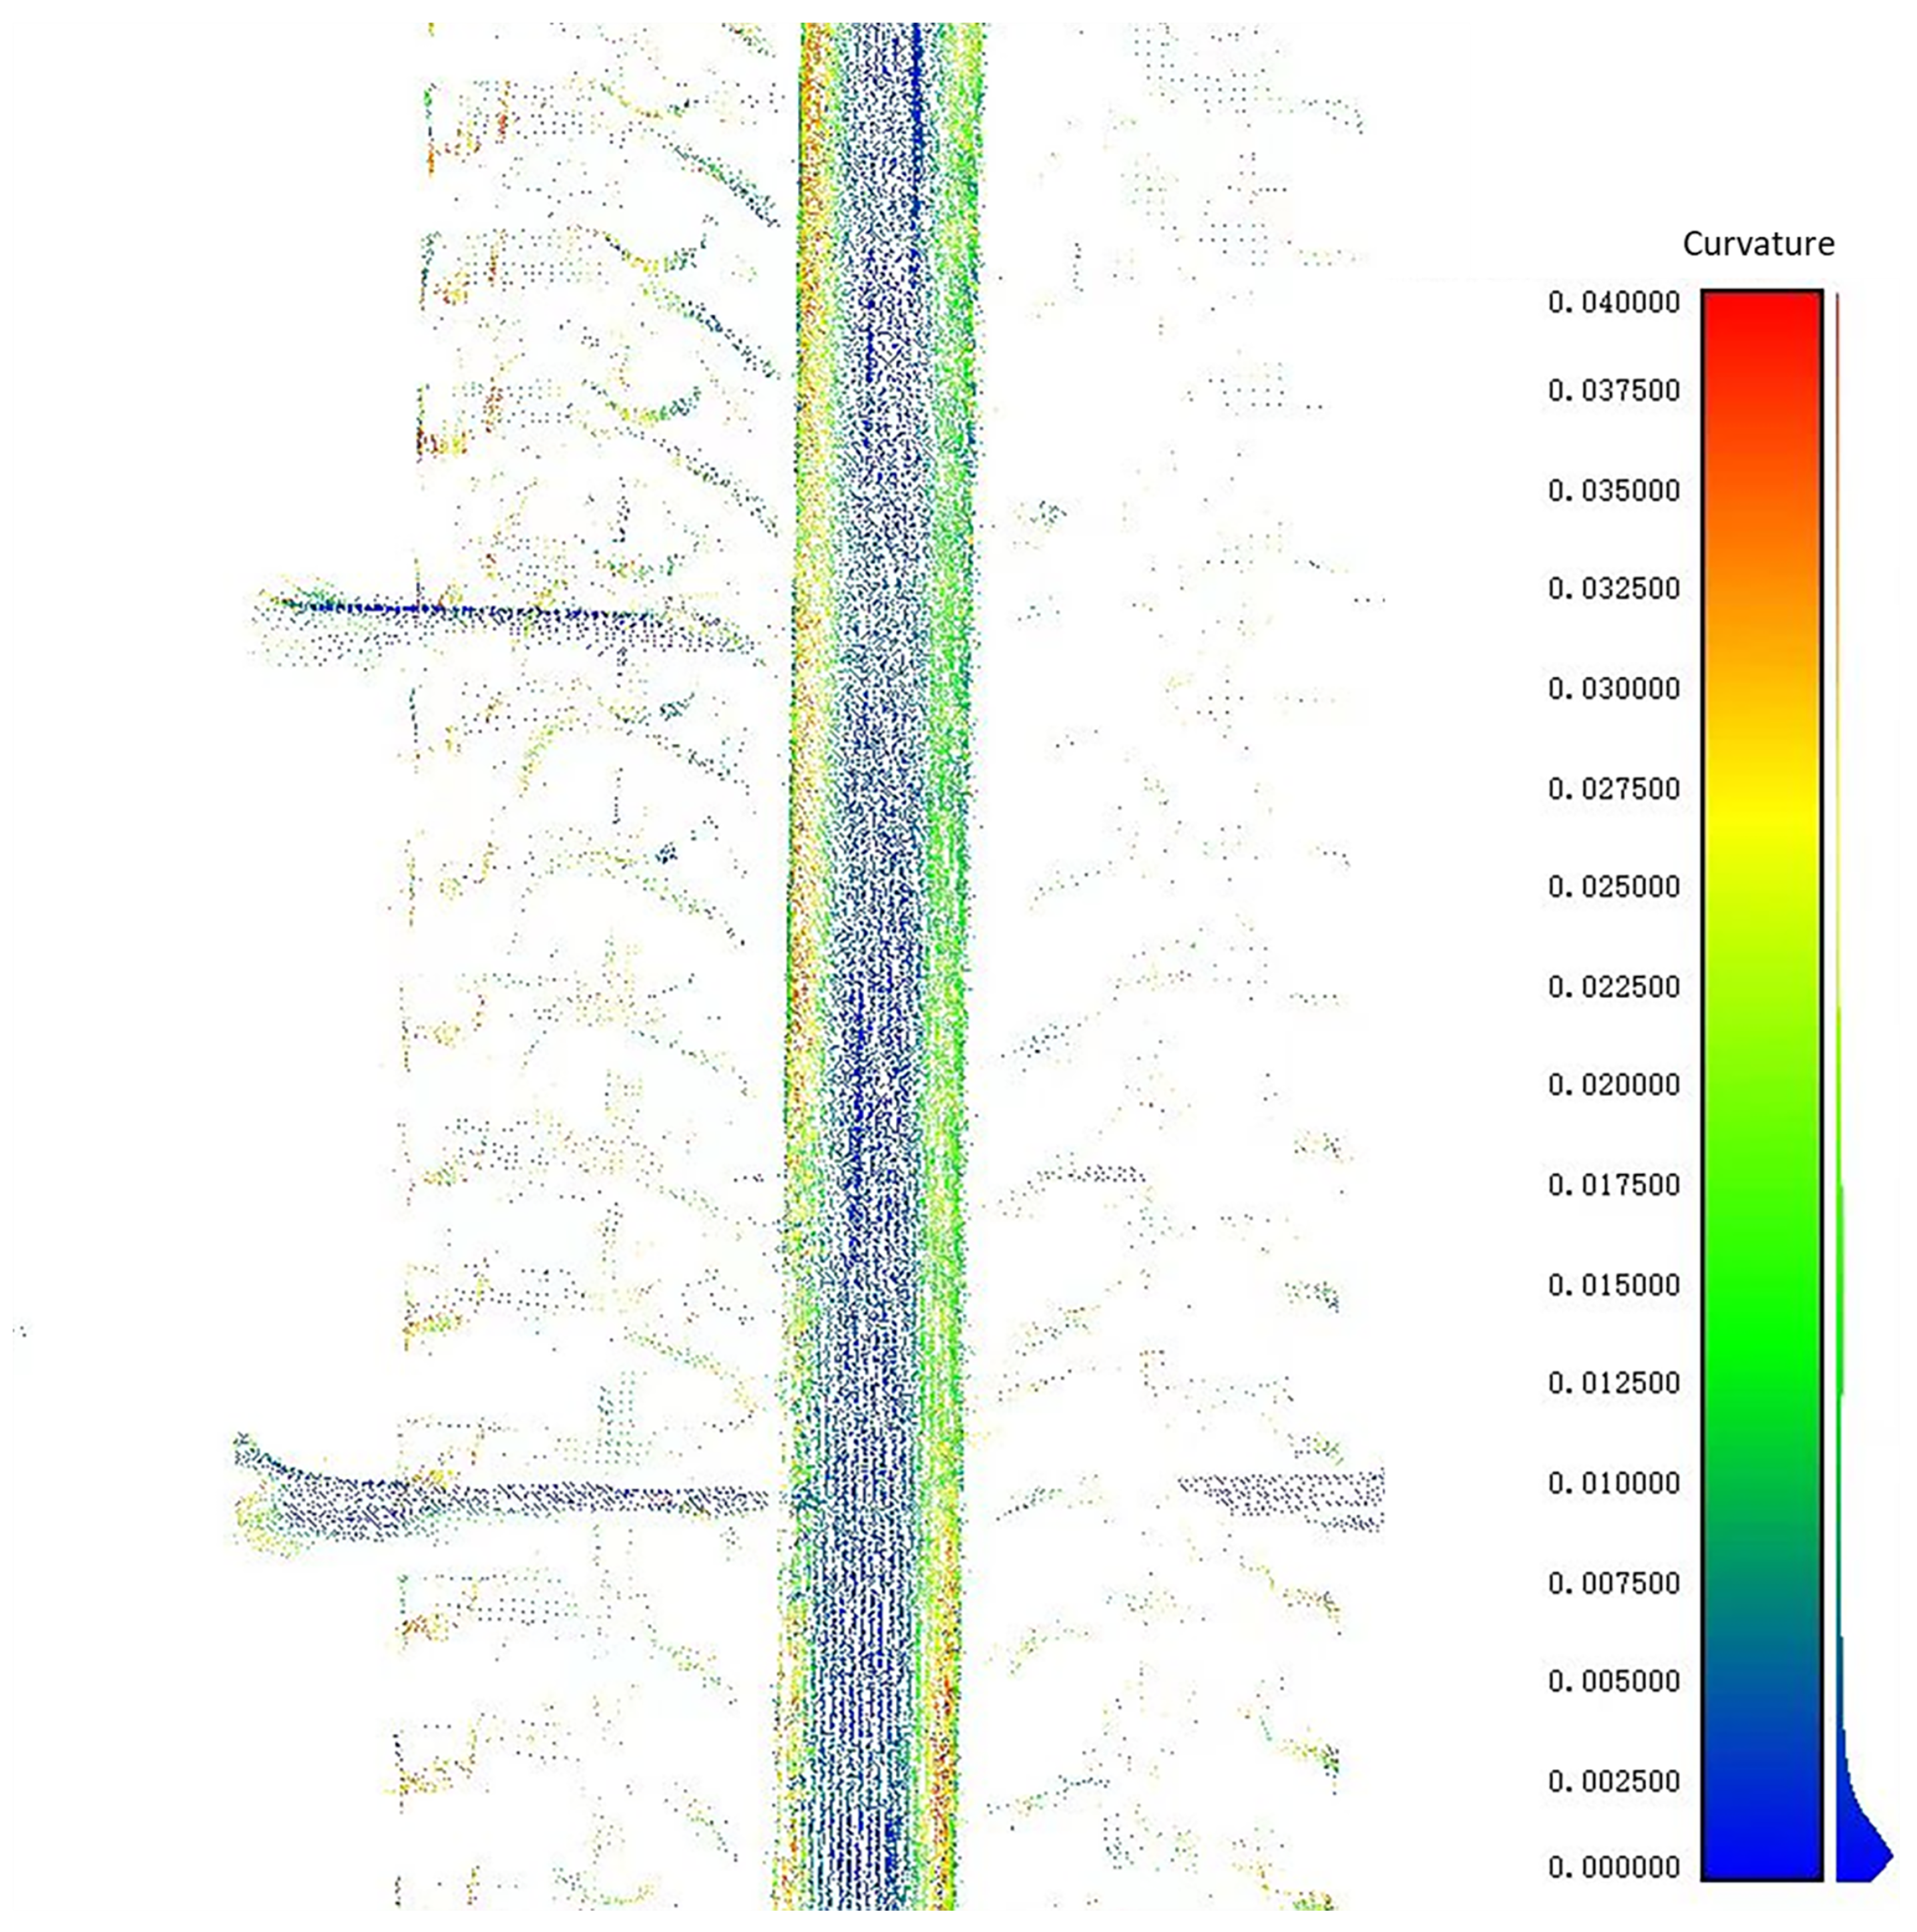
  • The KD-tree paired with Principal Component Analysis (PCA) is utilized to estimate the local surface normal vector for each point, from which the corresponding curvature is subsequently derived. As illustrated in Figure 8, the central region of the rail tread exhibits low curvature values, whereas the transition zone toward the rail edge is characterized by high curvature. Consequently, all points are sorted in ascending order according to their curvature magnitudes. The unassigned point with the minimum curvature is selected as the initial seed point, ensuring each point is evaluated as a seed point candidate only once.
  • The k-nearest neighbors (KNN) algorithm is employed to retrieve the neighborhood of the current seed point. The orientation deviation is evaluated by calculating the angle S i between the normal vector of each neighboring point and that of the seed point. If S i < S θ (where S θ denotes the smoothing angle threshold), the neighboring point is deemed geometrically compliant with the seed point and is assigned to the same region.
  • As demonstrated in Figure 8, the central surface of the rail tread is relatively planar with a minimal curvature profile, whereas the geometric transition at the rail edge consistently reaches 0.02 and above. To prevent the growing boundary from crossing the sharp edge into the rail side—which would trigger severe over-segmentation and leakage—a stringent curvature threshold is required. Through an empirical sensitivity analysis, the curvature constraint was established at K i < 0.02 for seed point propagation. A higher threshold (e.g., >0.02) risks introducing high-frequency geometric noise from the concrete base into the seed queue, whereas a lower threshold restricts growth prematurely, leaving the rail tread fragmented. Therefore, only points satisfying K i < 0.02 within the identical region are appended to the seed queue as new seeds.
  • If the seed point queue is not empty, a new seed point is sequentially retrieved from it to repeat steps (2) through (4).
  • Once the current seed queue is exhausted, the localized cluster sharing homogenous geometric attributes is finalized and assigned a distinct random color. Steps (1) to (5) are iteratively executed until all points in the workspace have been given regional attributes, concluding the region-growing process.
  • Owing to structural complexity or spatial discontinuity in the subway scene, non-target background objects typically form heavily fragmented clusters with limited point counts. Consequently, a minimum cluster size threshold M is implemented to efficiently filter out these residual outliers containing fewer than M points, thereby successfully isolating the continuous, intact rail tracks.
Figure 8. Curvature distribution of the rail tread surface.
Applsci 16 08791 g008

5. Results

Figure 9 is the rail tread extracted by the regional growth algorithm after multiple filtering. The extracted point cloud data and the original data can be superimposed to show the experimental results more intuitively. The importance of each processing step and the parameter selection are discussed in detail in Section 4.4.

5.1. Parameter Analysis

In this paper, some parameters will be involved in the three-to-point processing steps of intensity threshold filtering, cloth simulation filtering, and regional growth algorithm to extract rails, which will affect the final result.
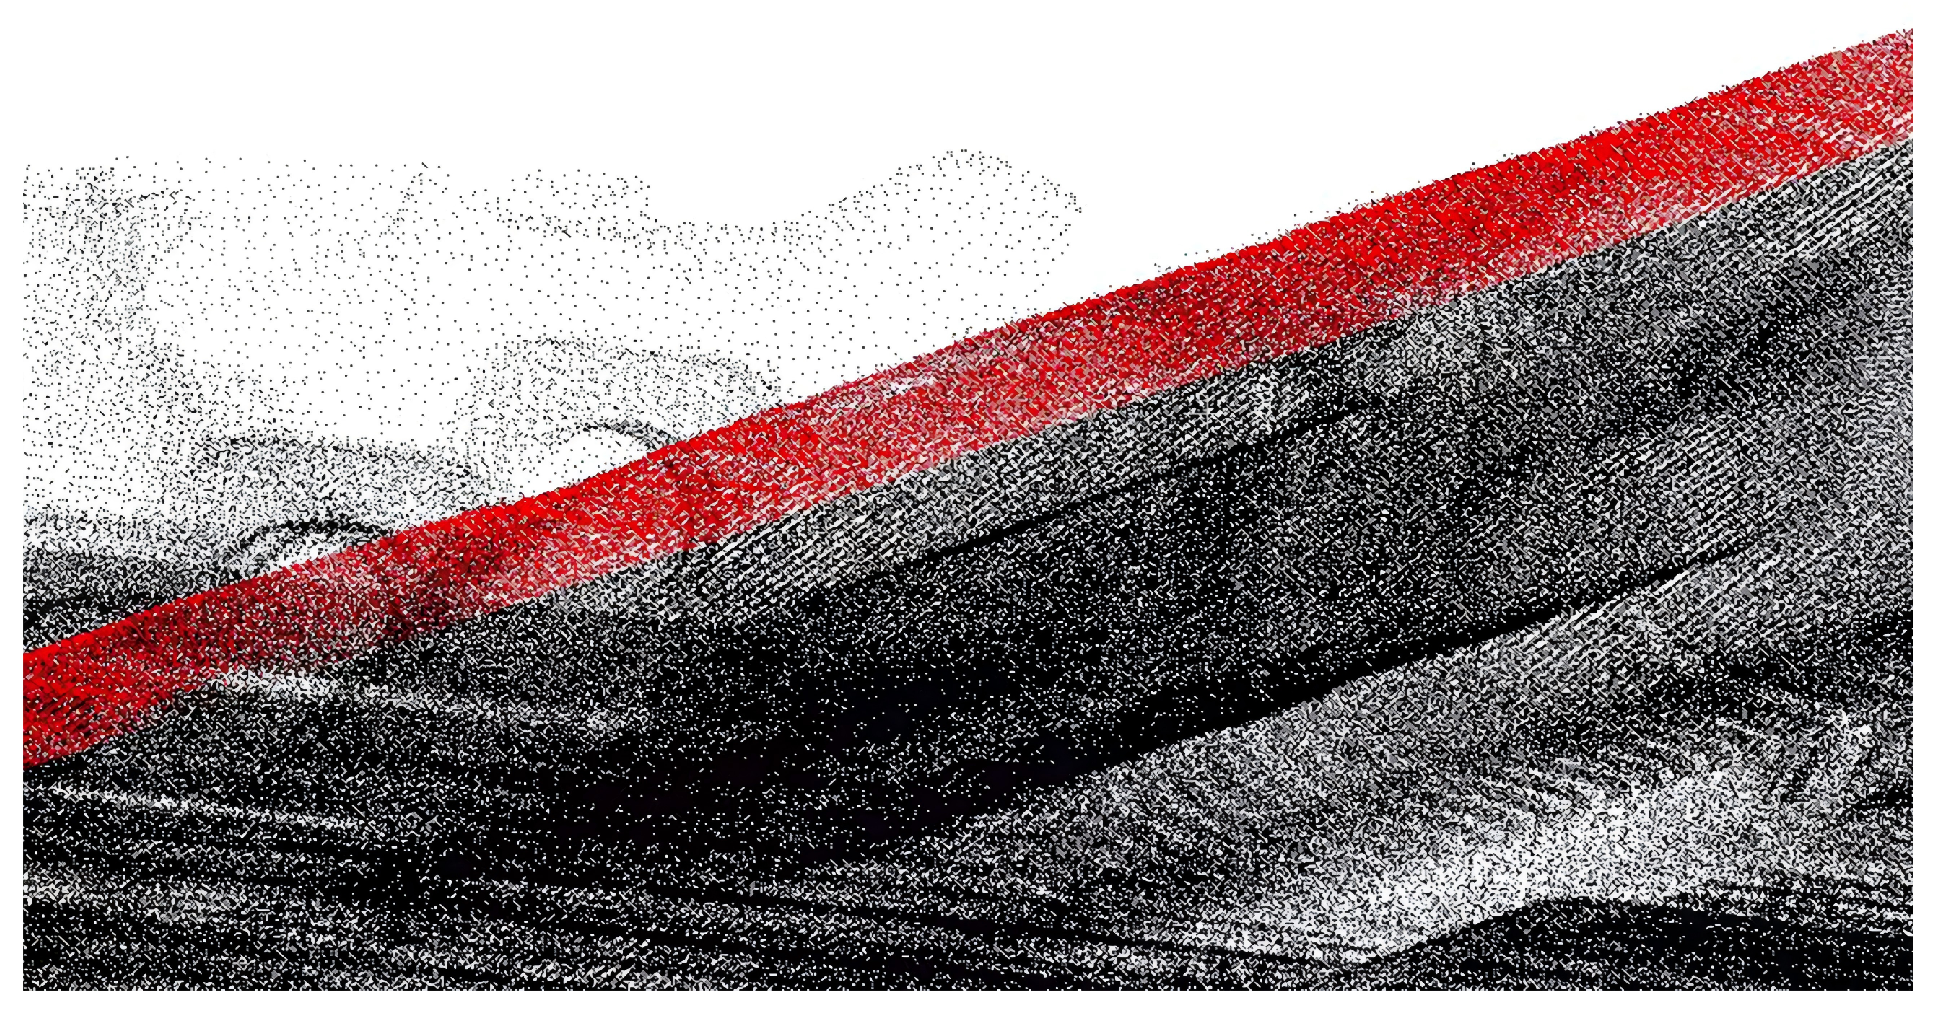
Figure 9. Detailed extraction result of the rail tread point cloud in a local test segment.The extracted rail tread is shown in red, and the other sections are displayed in black.
Applsci 16 08791 g009

5.1.1. Selection of Intensity Threshold

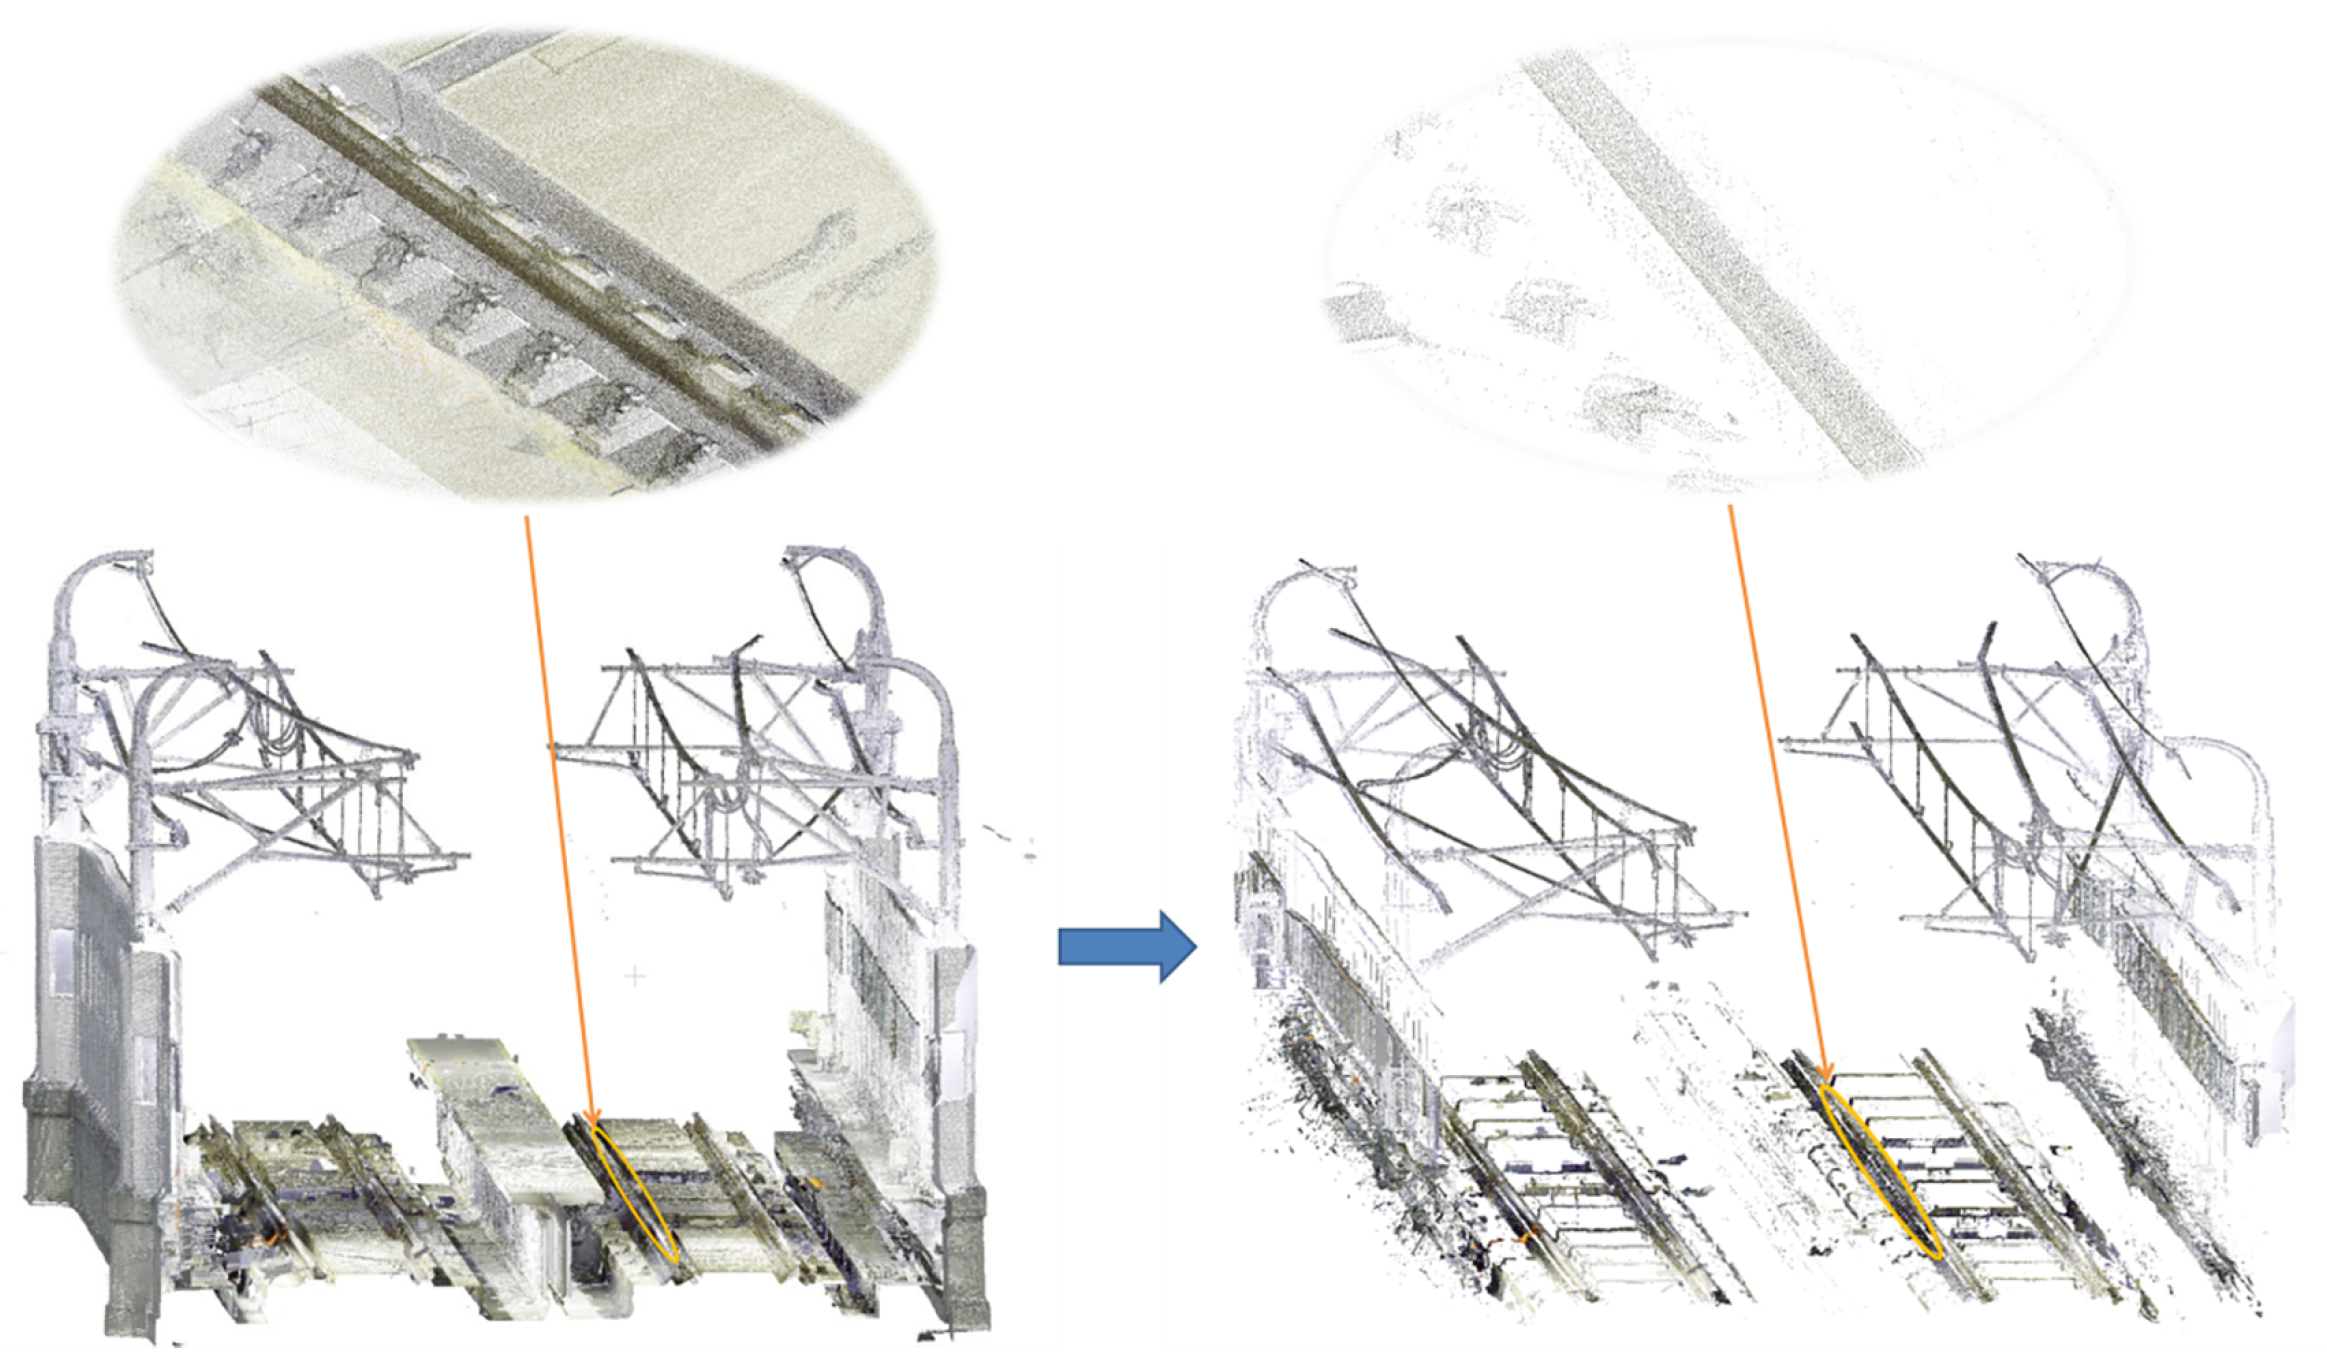
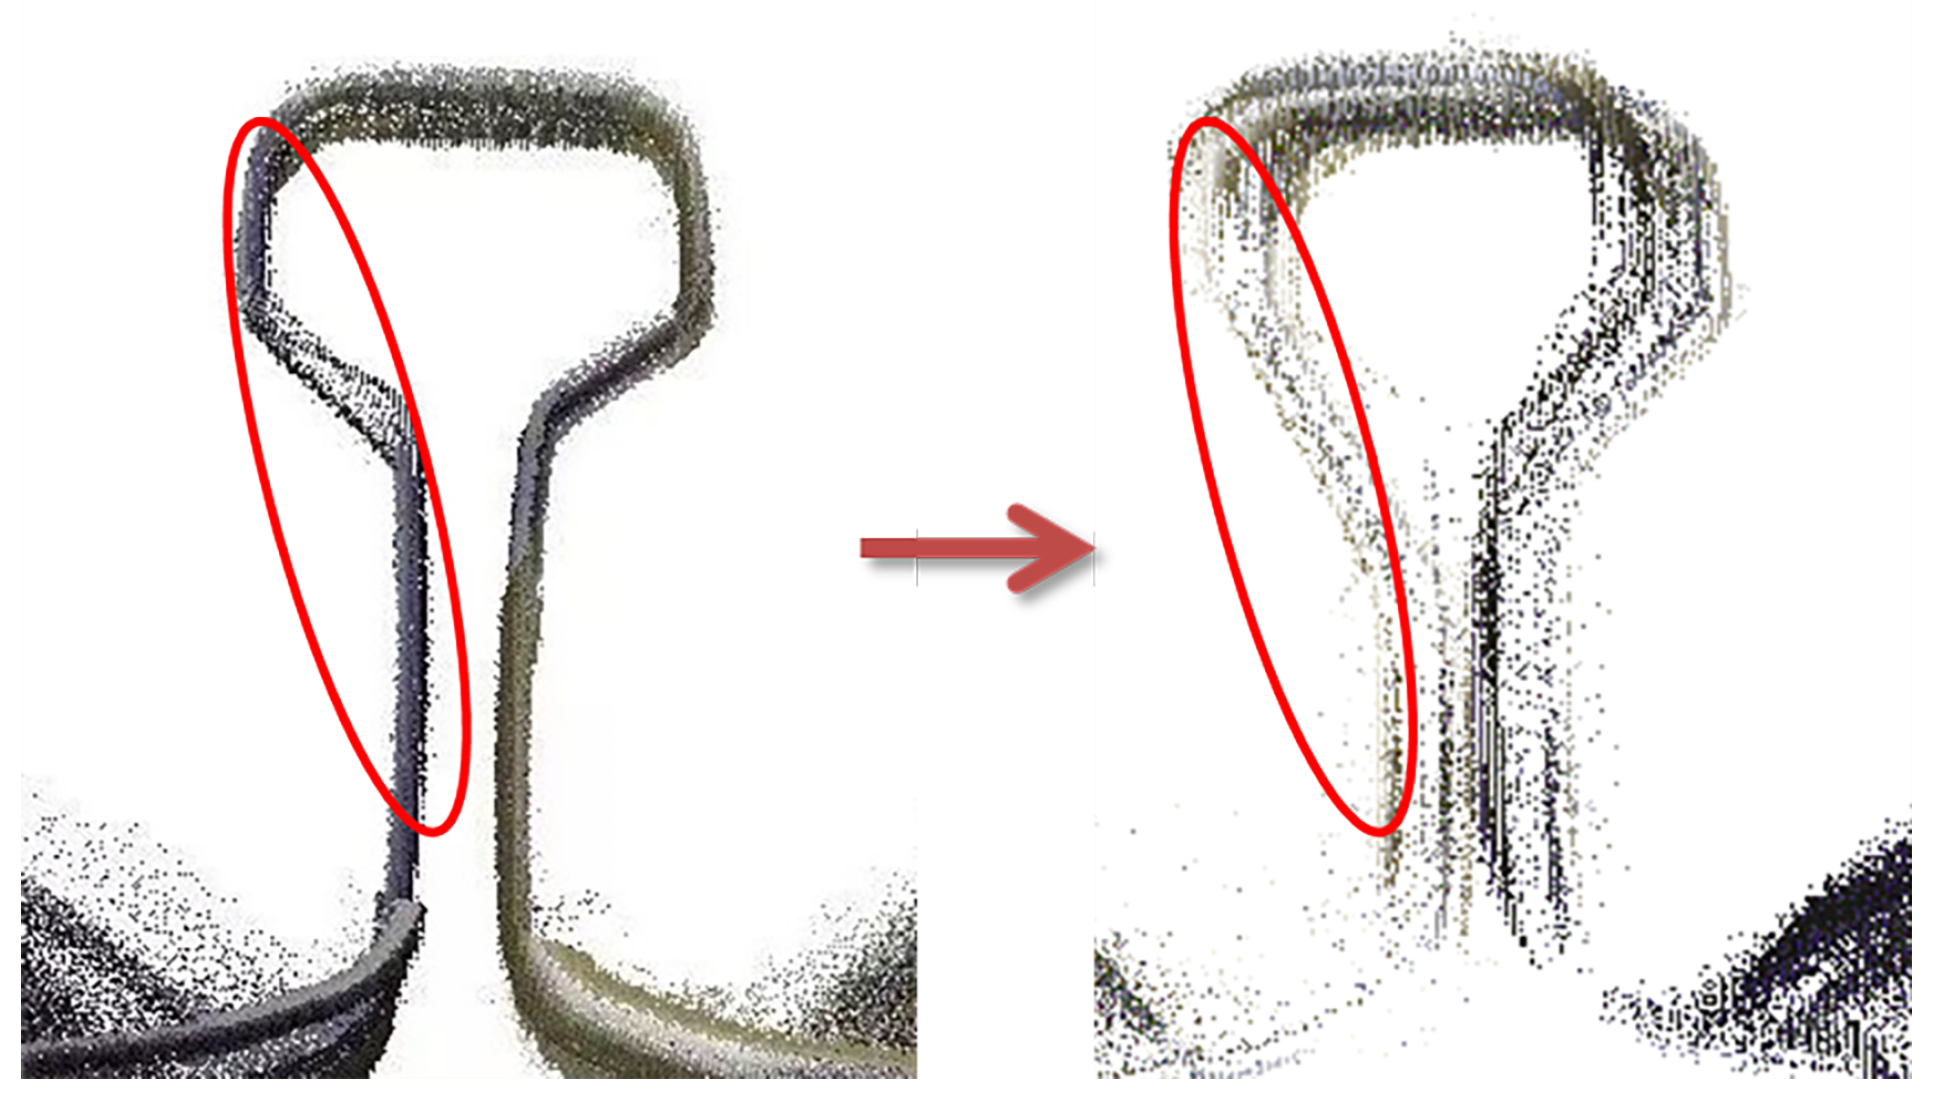
Through the Intensity value statistics, it is found that the typical intensity value of the rail tread in this experiment is between 1 and 4. Therefore, filtering out point clouds whose intensity values are not in the range of 1 to 4 can filter out a large number of non-metallic materials (such as concrete, and plastic) and other objects, and can also filter out most of the points of the target (such as the rail side) with a large difference in incident angle from the rail tread, as shown in Figure 10.
This step can reduce a large number of non-target point clouds and reduce the number of original point clouds from 58,893,153 to 4,412,356. In addition, because most of the points on the rail side are filtered out, as shown in Figure 11, this can avoid the clustering of points of this type and the points on the rail tread as the same type of points to a certain extent.

5.1.2. Cloth Simulation Algorithm Filter

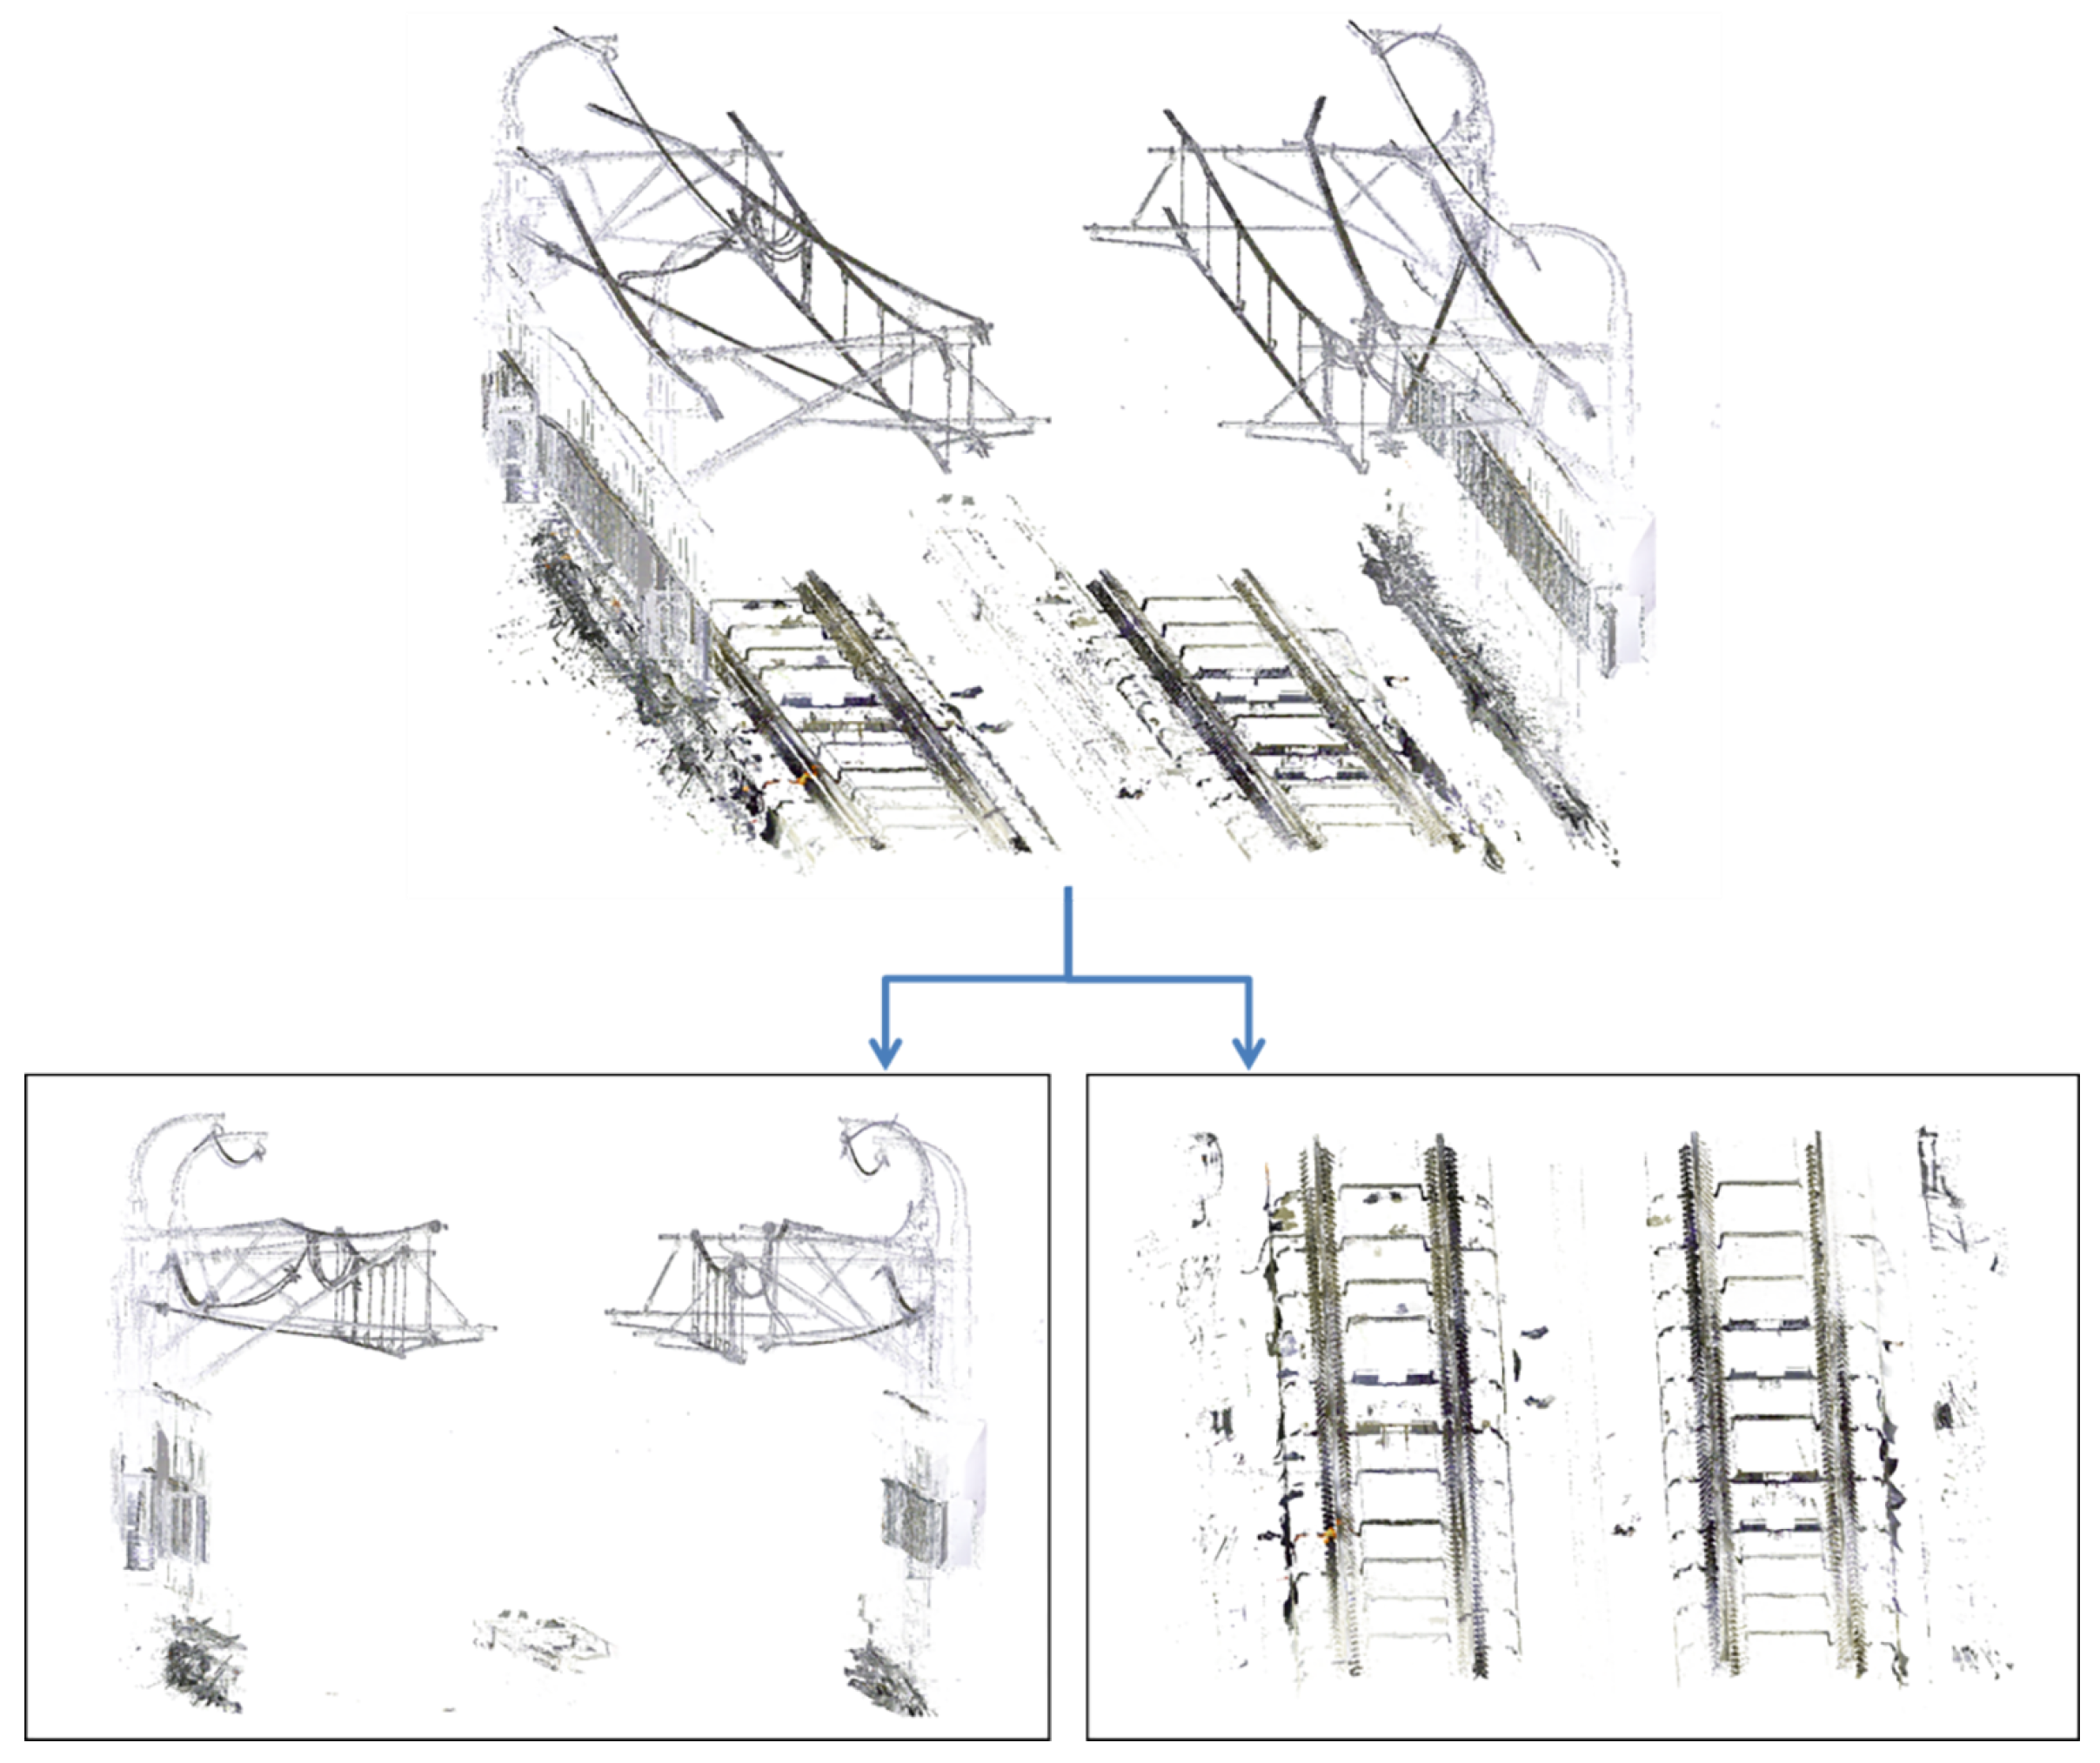
The track subgrade area filtered by the intensity threshold has been simplified a lot, and the area can be regarded as a road surface with a certain degree of ruggedness. Through the cloth simulation algorithm, the scene can be divided into ground area and non-ground area. Some important parameters in the cloth simulation filter include: Cloth resolution refers to the grid size of the cloth used to cover the terrain. The larger the Cloth resolution, the more suitable it is for rough areas. Max iterations refer to the maximum number of iterations of terrain simulation. Classification threshold refers to the threshold of dividing the point cloud into ground and non-ground parts according to the distance between the point and the simulated terrain. After many experiments, the Cloth resolution is set to 2.5 , the Max iterations are set to 500, and the Classification threshold is set to 0.7 , which can completely divide the scene into ground areas. With the non-ground area, to achieve the purpose of filtering non-ground points, as shown in Figure 12.
This step can also reduce a large number of non-target point clouds and reduce the number of point clouds filtered by the intensity threshold from 4,412,356 to 1,876,460. Moreover, because objects such as metal noise barriers also have low intensity values and similar neighborhood normal vectors, filtering them can avoid being clustered in large numbers.

5.1.3. Regional Growth Algorithm

In the process of extracting the rail tread using the regional growth algorithm based on normal vector and curvature, the smoothing threshold S θ between the normal vector is an important parameter, and the size of the parameter value will directly affect the extraction quality of the rail tread.
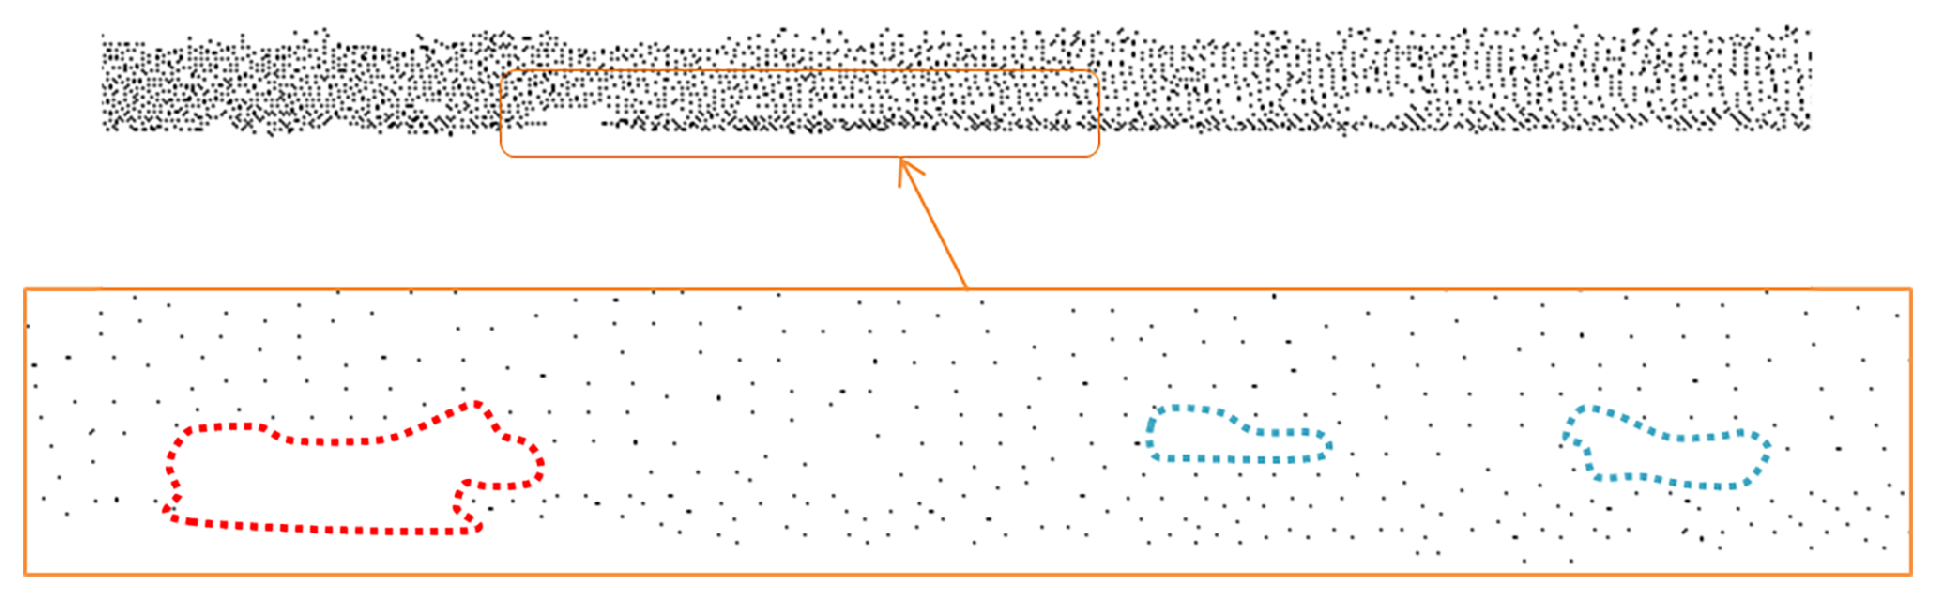
When the value of S θ is too small, it will cause some target points not to be clustered with the rail tread, resulting in the missing and emptiness of the extracted rail tread, so that the complete rate of the extraction is reduced, as shown in Figure 13. The reason is that when S θ is too small, the normal vector angle between the target point and the surrounding points on some rail pedals will be less than the set threshold, and a complete cluster cannot be formed.
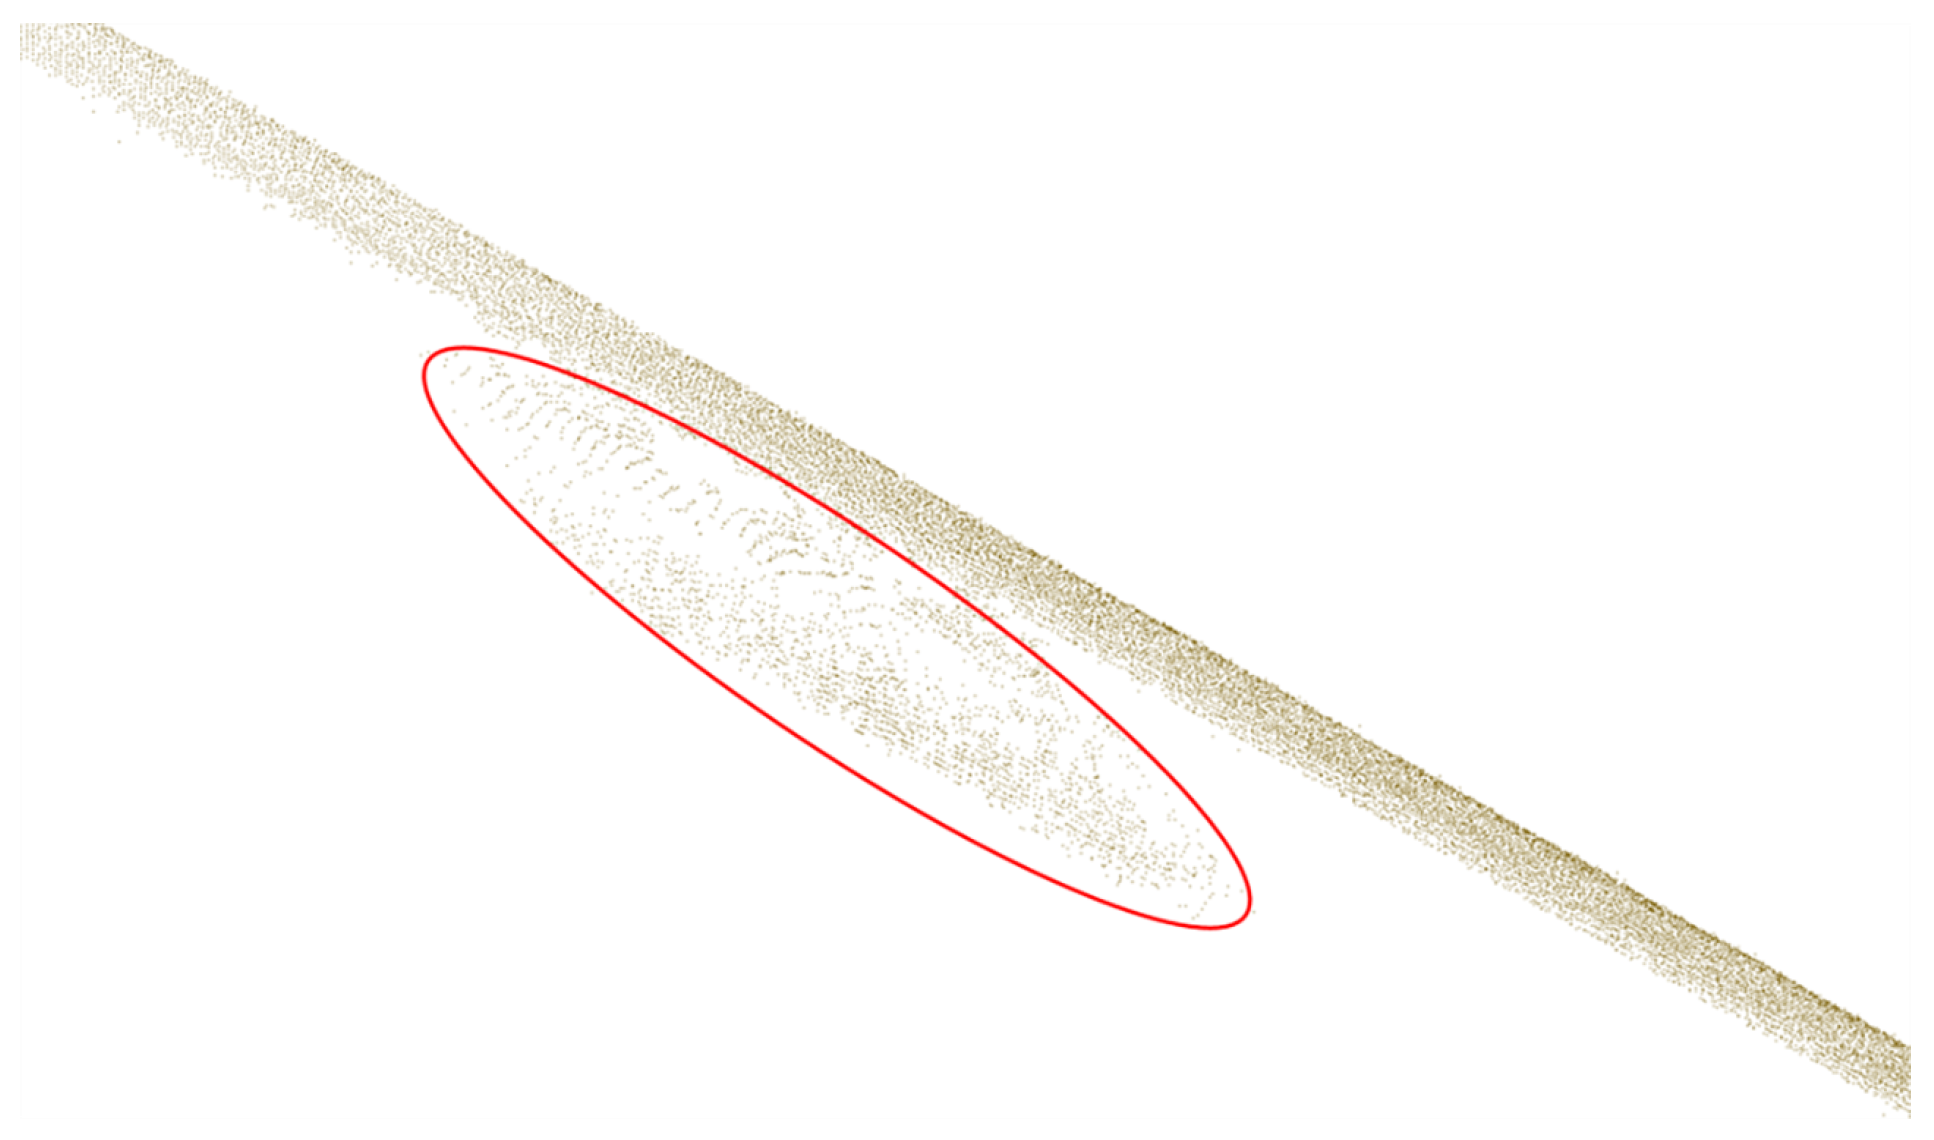
When value of S θ is too large, it will cause the rail tread to form the same cluster with some surrounding objects, which reduces the accuracy of extraction. The reason is that when S θ is too large, it is impossible to separate the point on the rail tread from some points on the side of the track, especially the connection between the two, as shown in Figure 14.
After a comprehensive experiment, when S θ is set to 5°, the sensitivity and precision of the cluster formed by the rail tread is high enough. Part 5.2 of this paper will compare the experimental results under different parameter settings through indicators.
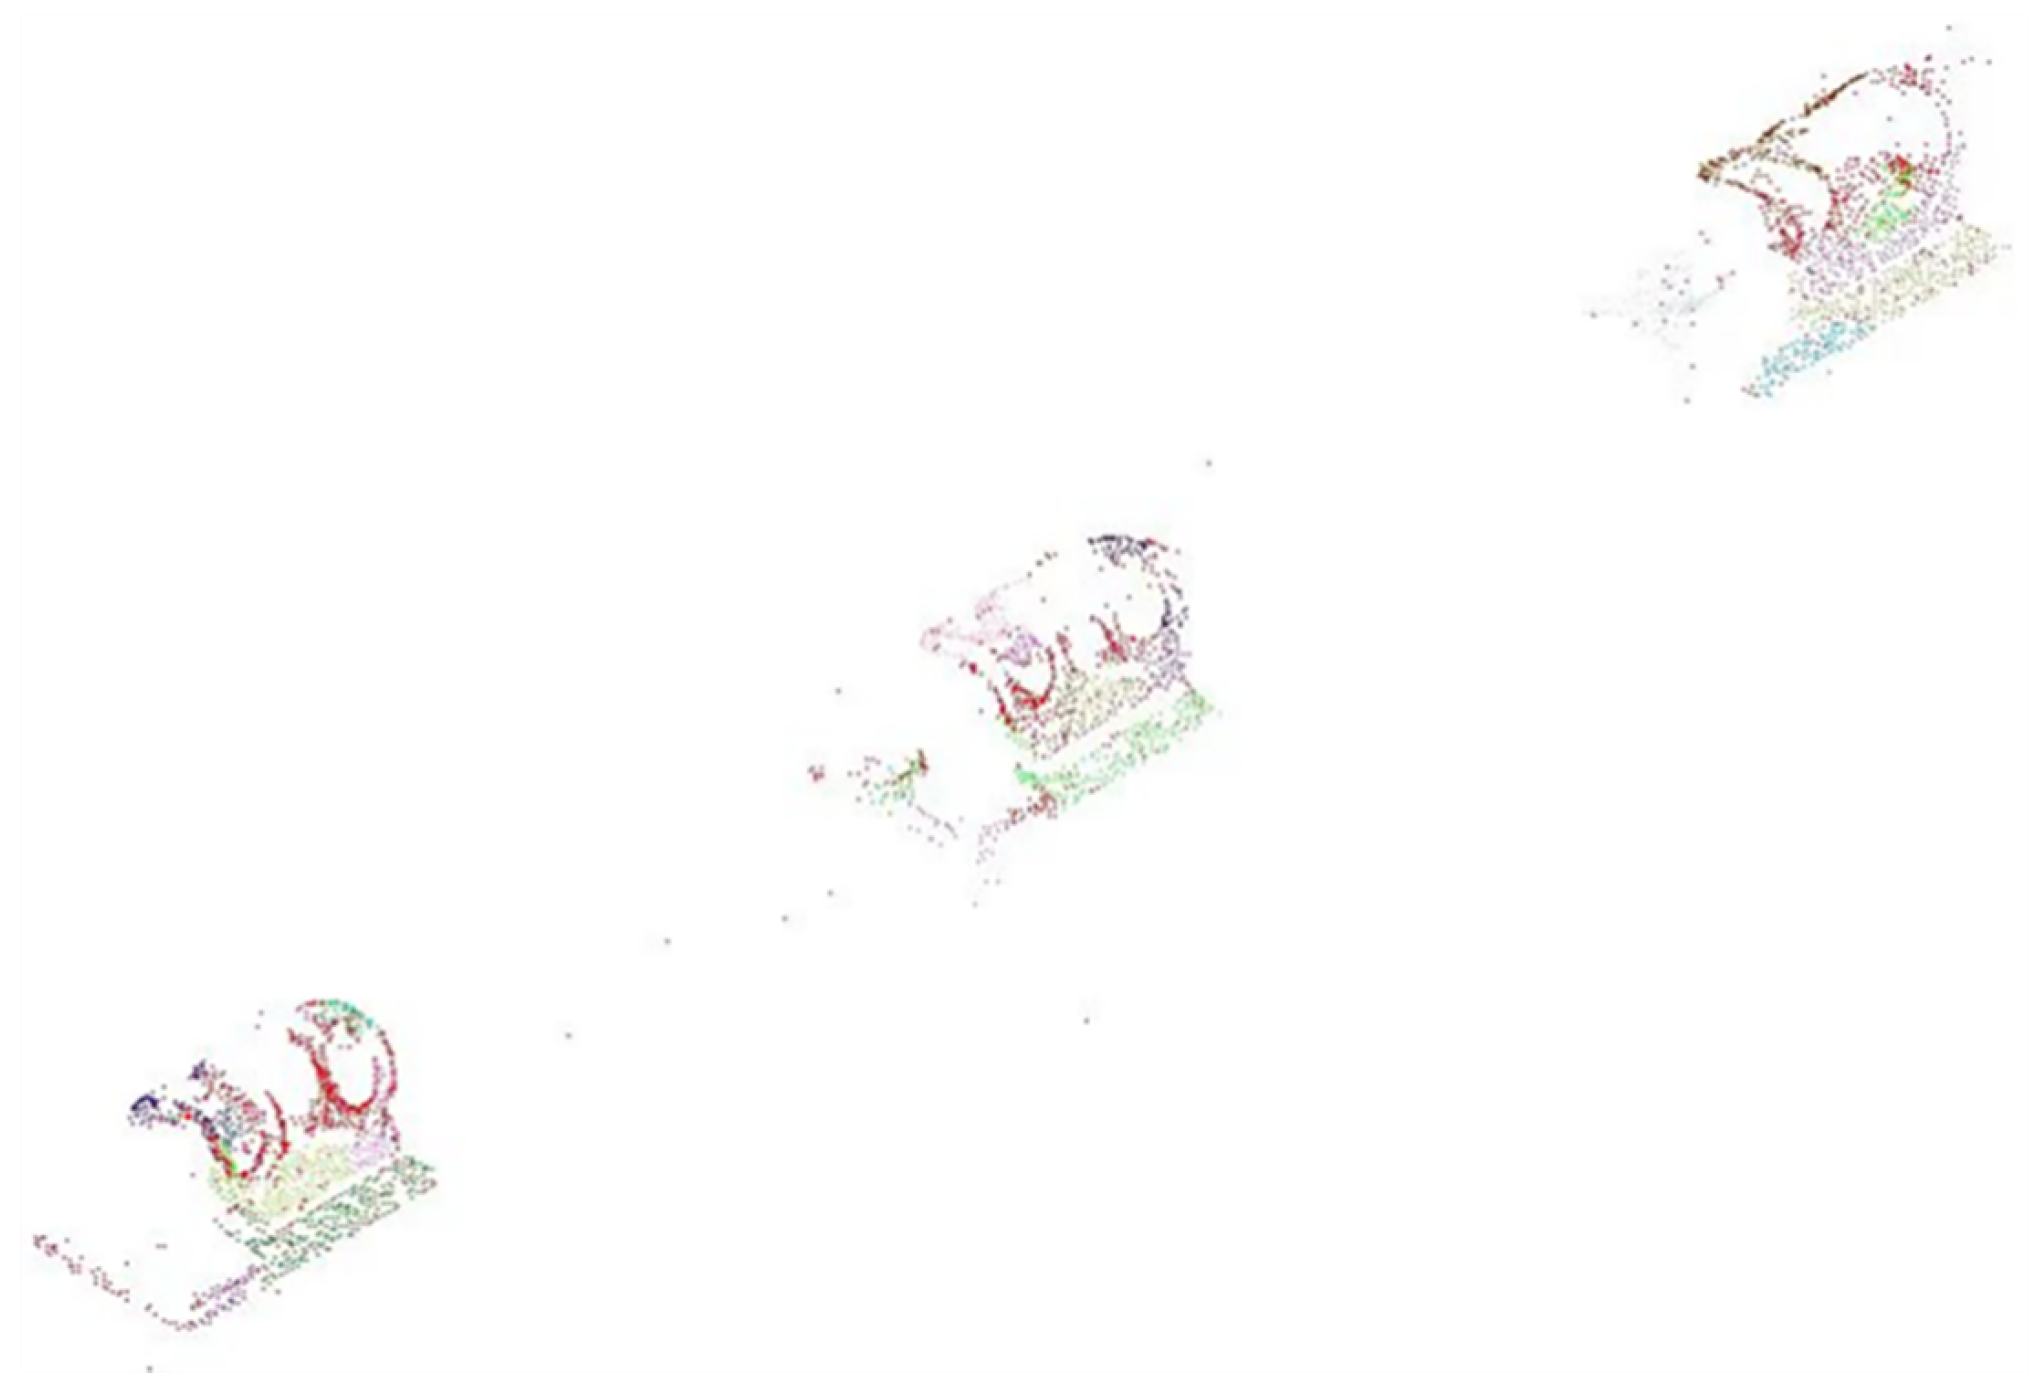
In addition, because the rail tread is a continuous approximate plane, the number of clustered midpoints is extremely large. In this scene, for irregular objects such as rail fasteners, a single object will form multiple clusters, and each cluster has fewer points, as shown in Figure 15. Although the expansion joint iron sheet is relatively regular, it is not continuous, and the number of points of a single object is less than 10,000 . Therefore, a threshold is set. When the number of midpoints of a cluster is less than 20,000 , the cluster is not formed. In the end, there are only four rail treads in the extraction results.

5.2. Quantitative Evaluation

The final extraction results are analyzed from the target level and the point cloud level respectively.
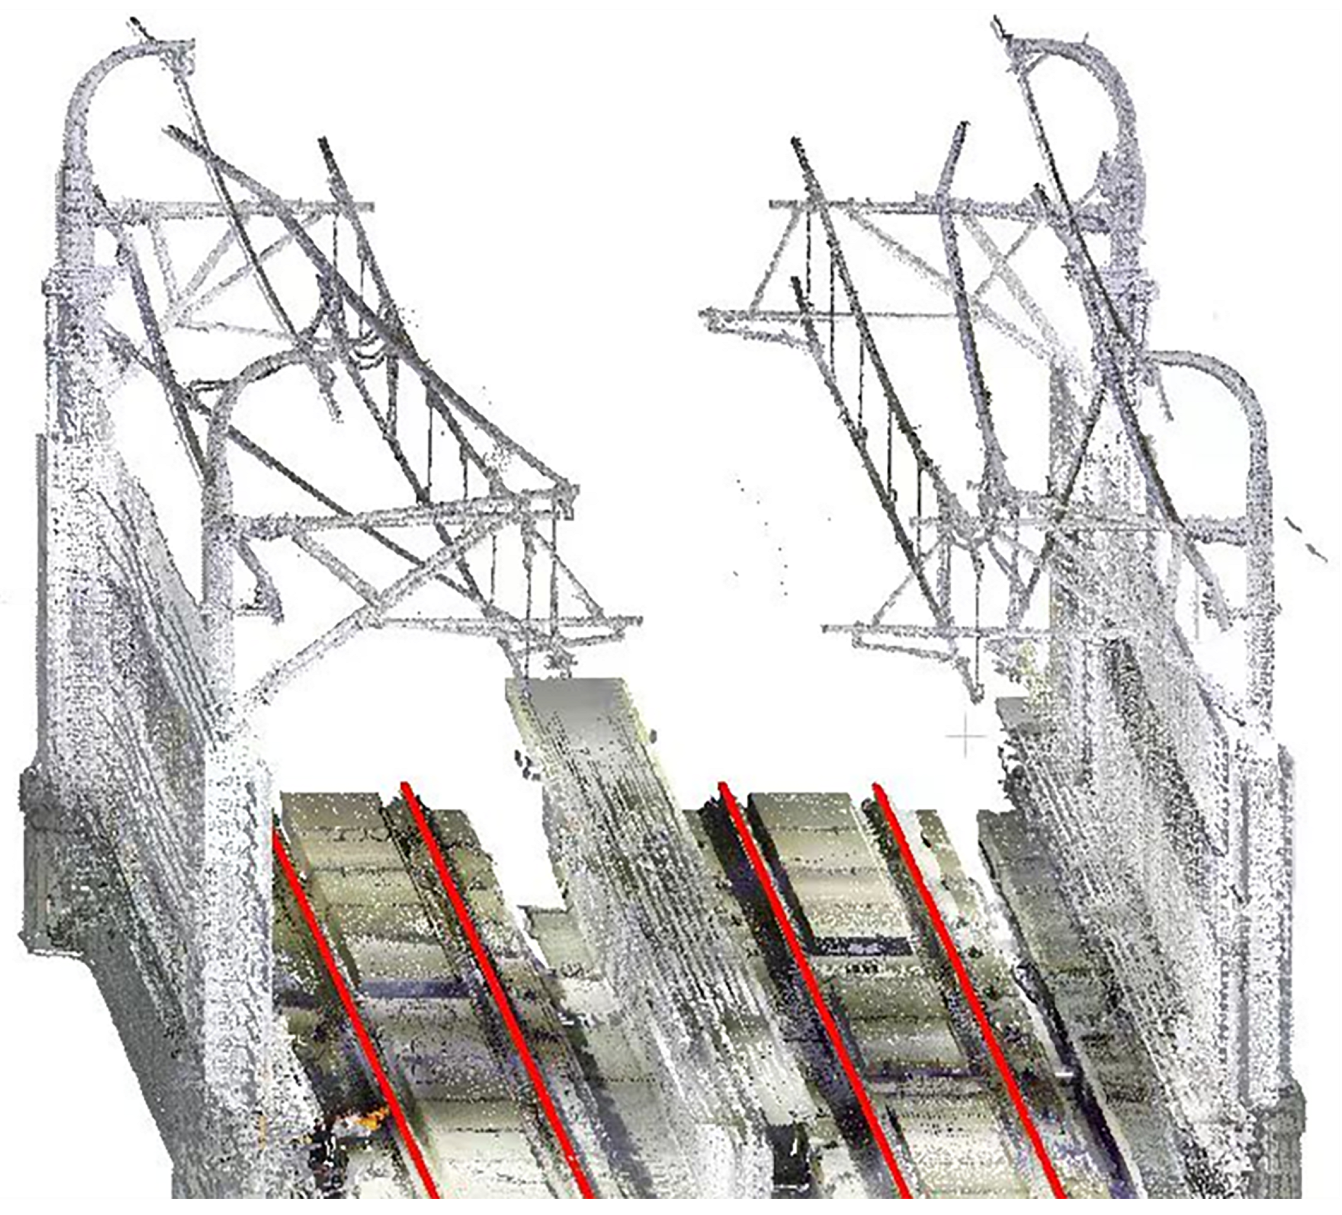
First of all, analyze it from the target level. From a macro perspective, this method successfully extracted four rail treads, and filtered out non-target objects such as rail fasteners, contact nets, and noise barriers, with an accuracy rate of 100 % . In terms of details, the center position of the rail tread can be extracted almost completely. Some target points will be filtered out from the connection position between the rail tread and the rail side, but they can also meet the basic visual requirements, as shown in Figure 16.
Quantitative analysis is carried out from the point cloud level, and the manually extracted rail tread point cloud is used as the verification standard. Set the two indicators of Sensitivity and Precision for objective evaluation of extraction accuracy. The formula is defined as Formula (7) and Formula (8) respectively. In the formula, T P is the accurate number of rail treads extracted by this method, that is, the intersection of points extracted by manual extraction and method; F N is by this paper. The number of rail treads extracted by the method is the point that exists in manual extraction and does not exist in the method extraction; F P is the number of non-rail treads extracted by this method, that is, the point that does not exist in manual extraction but exists in method extraction.
Sensitivity = T P T P + F N × 100 %
Precision = T P T P + F P × 100 %
Table 2 lists the Sensitivity and Precision of the target point cloud extracted by different algorithms under S θ . When S θ is equal to and less than 3°, the extracted rail tread will be more obviously void and missing. As shown in Figure 14, the sensitivity is low. When S θ is greater than or equal to 6°, the side of some rails will form the same cluster as the rail tread. As shown in Figure 15, the Precision is lower. When S θ is 4° or 5°, the extracted rail tread is less missing and can filter out most of the rail sides. Therefore, set S θ to 5°.

5.3. Comparative Experiments

5.3.1. Comparison Methods and Baseline Setup

To verify the effectiveness of the proposed method for ballastless track surface extraction, two classic prior-trajectory-independent point cloud segmentation methods are selected as baselines:
  • Euclidean distance-based clustering (Method A): Segmentation using only spatial distance thresholds, representing pure geometric position-based segmentation.
  • Traditional region growing algorithm (Method B): Region growing with random seed points based on normal vectors and curvature (the standard PCL implementation), representing conventional unimproved geometric segmentation.
To ensure fairness, all comparison methods use the same preprocessed data as the proposed method (i.e., Input_PointCloud after intensity filtering and cloth simulation filtering), and their parameters are manually tuned to achieve optimal performance on this dataset.

5.3.2. Quantitative Evaluation Metrics

Since track surface extraction is essentially a binary semantic segmentation task, this section employs the same evaluation metrics as those used in Section 5.2, namely Precision, Recall (Sensitivity), and F1-score.
The manually refined annotated track surface point set GT is taken as the ground truth.
The evaluation focuses on examining whether the algorithm can effectively retain the complete geometric morphology of the rail tread while accurately eliminating interference points from rail fasteners, metal sheets, and rail sides.

5.3.3. Quantitative Result Analysis Table

As shown in the Table 3, although the standard region growing algorithm recovers 95% of the rail tread points (high Recall), its Precision is relatively low (72.3%). This is because it cannot suppress leakage into the low-curvature transition region of the rail side (i.e., the boundary leakage mentioned in this paper), resulting in numerous noise points from the rail jaw and fastener bases being included in the extraction results.
While maintaining a high Recall rate of over 90%, the proposed method improves the Precision to 95.3%, indicating that the curvature-ranked seed point strategy effectively suppresses undesired growth from the tread edge to the rail side.

5.3.4. Qualitative Results Visualization Comparison

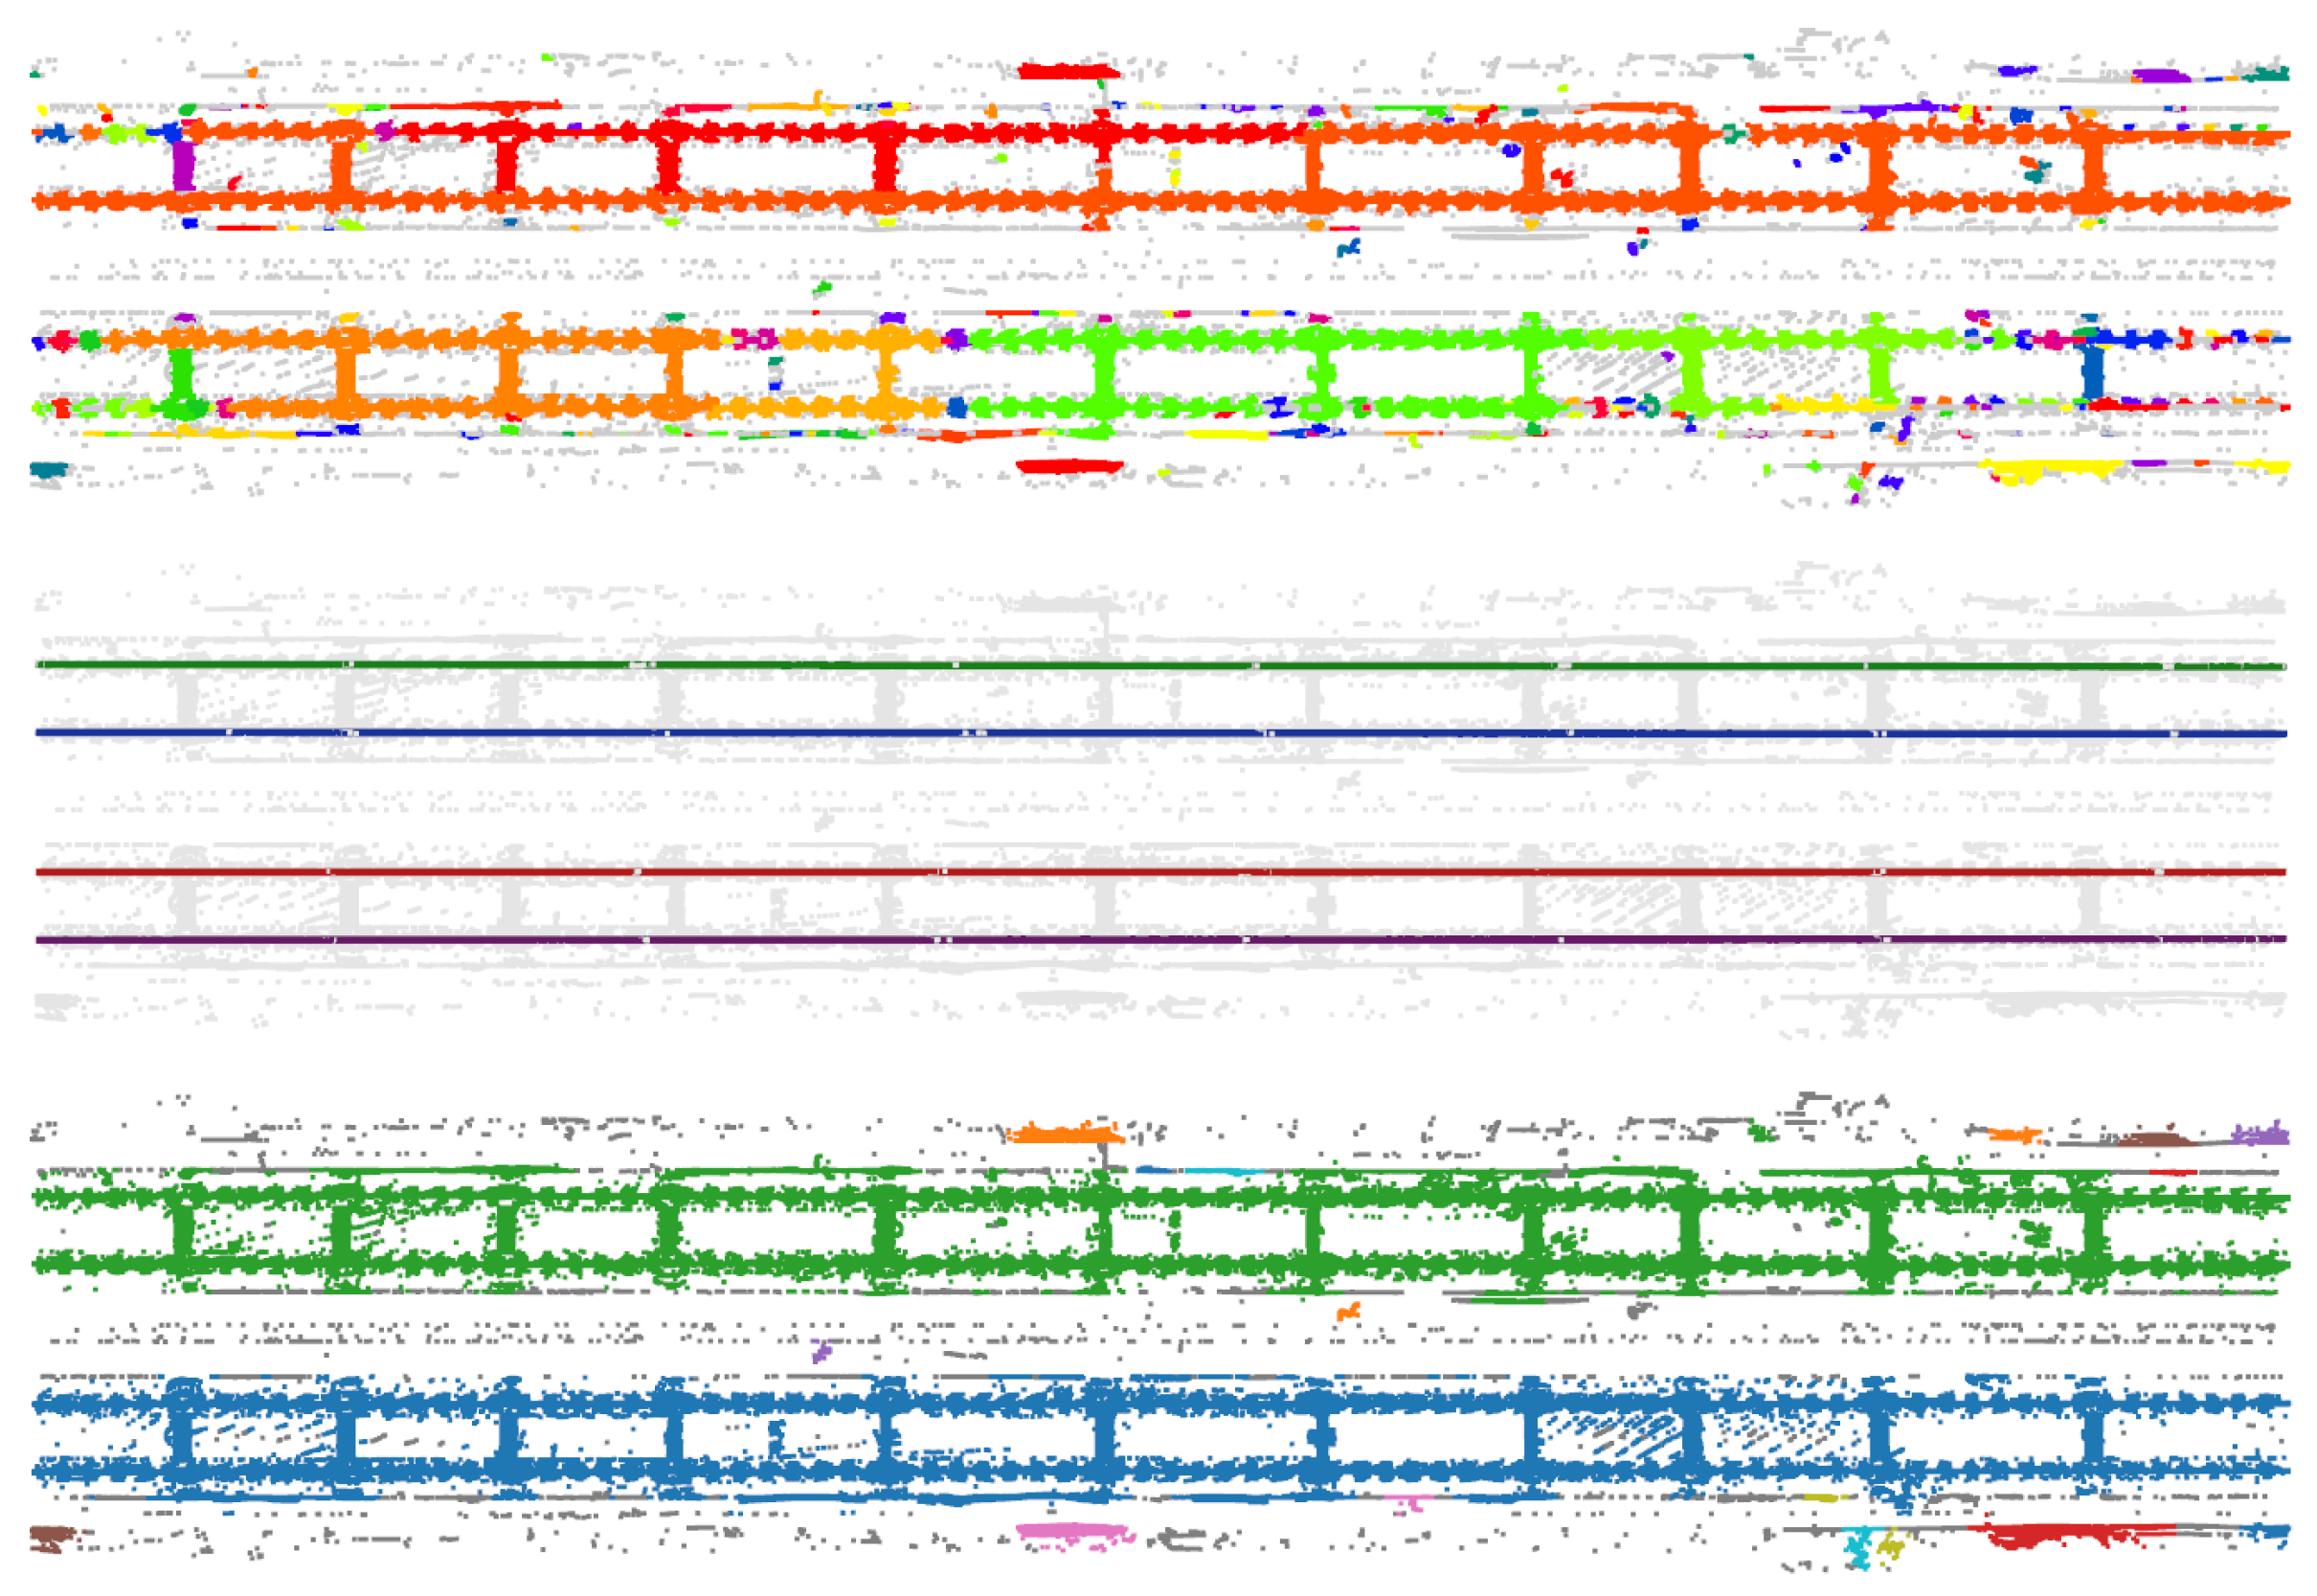
Figure 17 intuitively shows the differences between various methods. Euclidean clustering (top) is limited by uneven point spacing, resulting in fractured patches on the rail tread.
Table 3. Results Comparison.
MethodPrecision (%)Recall (%)F1-Score (%)Point Count
Euclidean Clustering78.545.257.432,410
Standard Region Growing72.395.182.174,280
Ours ( S θ = 5 ° )95.392.293.765,821
Figure 17. Qualitative comparison of three segmentation methods.The different colors represent different clusters for visualization purposes.
Applsci 16 08791 g017
Standard region growing (bottom) produces “false connections” toward the rail side at fastener gaps, leading to obvious trailing artifacts at the tread edge.
In contrast, the rail tread extracted by the proposed method (middle) exhibits complete morphology and clear boundaries, with the highest consistency with the manual ground truth.

6. Conclusions

This study addresses the problem of rail tread extraction from ballastless railway LiDAR point clouds in complex electrified subway environments. A lightweight framework is proposed by integrating intensity-based filtering, cloth simulation filtering, and geometry-aware region growing constrained by normal vectors and curvature information.
Experimental results demonstrate that the proposed method can effectively extract rail treads from large-scale point clouds, achieving consistent performance at both object-level and point-level evaluations. The framework does not rely on RGB information or prior trajectory knowledge, making it robust to illumination variations and applicable to general subway environments.
However, several limitations remain. The proposed method has not yet been validated in complex railway configurations such as turnout regions, multi-track tunnel sections, and tunnel entrance or exit areas. In these scenarios, multiple rail treads appear in close proximity, and complex occlusion and structural variations may affect intensity-based filtering and geometric clustering. In addition, the computational cost of normal estimation and region growing remains relatively high, which limits real-time performance and full automation.
Future work will focus on extending the method to complex railway scenes, including multi-rail environments, and developing adaptive zoning strategies and topology-aware segmentation techniques to improve robustness and efficiency.

Author Contributions

Conceptualization, G.H.; Methodology, Y.Z.; Software, R.Z.; Validation, R.Z.; Data curation, Y.Z.; Writing—original draft, R.Z.; Writing—review & editing, G.H., R.Z. and Y.Z.; Visualization, R.Z.; Supervision, G.H.; Project administration, G.H.; Funding acquisition, G.H. All authors have read and agreed to the published version of the manuscript.

Funding

This research was funded by East China Jiaotong University through the “Comprehensive Analysis Project for Power Equipment Inspection and Fault Data” (Grant No. 2004525475).

Institutional Review Board Statement

Not applicable.

Informed Consent Statement

Not applicable.

Data Availability Statement

The data presented in this study are available on request from the corresponding author. The data are not publicly available due to privacy restrictions.

Conflicts of Interest

The authors declare no conflict of interest.

References

  1. Ahrén, J.; Olofsson, T. Future urban rail transit systems: Trends and challenges for smart and sustainable cities. Sustainability 2023, 15, 1882. [Google Scholar]
  2. Ahn, K.; Jang, H.; Song, Y. Economic impacts of being close to subway networks: A case study of Korean metropolitan areas. Res. Transp. Econ. 2020, 83, 100900. [Google Scholar] [CrossRef] [Scilit]
  3. Song, J.; Abuduwayiti, A.; Gou, Z. The role of subway network in urban spatial structure optimization—Wuhan city as an example. Tunn. Undergr. Space Technol. 2023, 131, 104842. [Google Scholar] [CrossRef] [Scilit]
  4. Arastounia, M.; Oude Elberink, S. Application of template matching for improving classification of urban railroad point clouds. Sensors 2016, 16, 2112. [Google Scholar] [CrossRef] [Scilit] [PubMed]
  5. Qi, Z.; Tian, Y.; Shi, Y. Efficient railway tracks detection and turnouts recognition method using HOG features. Neural Comput. Appl. 2013, 23, 245–254. [Google Scholar]
  6. Lou, Y.; Zhang, T.; Tang, J.; Song, W.; Zhang, Y.; Chen, L. A fast algorithm for rail extraction using mobile laser scanning data. Remote Sens. 2018, 10, 1998. [Google Scholar] [CrossRef] [Scilit]
  7. Kumar, S.S.J.; Titus, T.J.; Ganesh, V.; Devi, V.S. Automotive crack detection for railway track using ultrasonic sensors. Int. J. Eng. Technol. Comput. Res. 2016, 4, 34–37. [Google Scholar]
  8. Soilán, M.; Sánchez-Rodríguez, A.; del Río-Barral, P.; Perez-Collazo, C.; Arias, P.; Riveiro, B. Review of laser scanning technologies and their applications for road and railway infrastructure monitoring. Infrastructures 2019, 4, 58. [Google Scholar] [CrossRef] [Scilit]
  9. Che, E.; Jung, J.; Olsen, M.J. Object recognition, segmentation, and classification of mobile laser scanning point clouds: A state of the art review. Sensors 2019, 19, 810. [Google Scholar] [CrossRef] [Scilit] [PubMed]
  10. Trilla, A.; Bob-Manuel, J.; Lamoureux, B.; Vilasis-Cardona, X. Integrated Multiple-Defect Detection and Evaluation of Rail Wheel Tread Images using Convolutional Neural Networks. Int. J. Prognit. Health Manag. 2021, 12, 1–10. [Google Scholar] [CrossRef] [Scilit]
  11. Beger, R.; Gedrange, C.; Hecht, R.; Neubert, M. Data fusion of extremely high resolution aerial imagery and LiDAR data for automated railroad centre line reconstruction. ISPRS J. Photogramm. Remote Sens. 2011, 66, S40–S51. [Google Scholar] [CrossRef] [Scilit]
  12. Zhu, L.; Hyyppä, J. The use of airborne and mobile laser scanning for modeling railway environments in 3D. Remote Sens. 2014, 6, 3075–3100. [Google Scholar] [CrossRef] [Scilit]
  13. Zhong, J.; Liu, Z.; Han, Z.; Han, Y.; Zhang, W. A CNN-based defect inspection method for catenary split pins in high-speed railway. IEEE Trans. Instrum. Meas. 2018, 68, 2849–2860. [Google Scholar]
  14. Li, J.; Chen, H.; Liu, Z. Automated Rail Extraction Using ntensity and Raster Image Processing. IEEE J. Sel. Top. Appl. Earth Obs. Remote Sens. 2024, 17, 8921–8935. [Google Scholar]
  15. Xu, L.; Zheng, S.; Na, J.; Yang, Y.; Mu, C.; Shi, D. A Vehicle-Borne Mobile Mapping System Based Framework for Semantic Segmentation and Modeling on Overhead Catenary System Using Deep Learning. Remote Sens. 2021, 13, 4939. [Google Scholar] [CrossRef] [Scilit]
  16. Grandio, J.; Riveiro, B.; Soilán, M.; Arias, P. Point cloud semantic segmentation of complex railway environments using deep learning. Autom. Constr. 2022, 141, 104425. [Google Scholar] [CrossRef] [Scilit]
  17. Grandio, J.; Riveiro, B.; Lamas, D.; Arias, P. Multimodal deep learning for point cloud panoptic segmentation of railway environments. Autom. Constr. 2023, 150, 104854. [Google Scholar] [CrossRef] [Scilit]
  18. Zhang, R.; Ding, Q.; Ng, A.H.-M.; Wang, D.; Deng, J.; Xu, M.; Hou, Y. TripletA-Net: A deep learning model for automatic railway track extraction from airborne LiDAR point clouds. IEEE J. Sel. Top. Appl. Earth Obs. Remote Sens. 2025, 18, 9195–9210. [Google Scholar] [CrossRef] [Scilit]
  19. Sun, N.; Li, K.; Liu, J.; Chai, L.; Wu, C. Learning and fusing the rasterized and serialized point cloud for 3D semantic segmentation in railway scenes. Expert Syst. Appl. 2025, 295, 128897. [Google Scholar] [CrossRef] [Scilit]
  20. Yang, B.; Fang, L. Automated Extraction of 3-D Railway Tracks from Mobile Laser Scanning Point Clouds. IEEE J. Sel. Top. Appl. Earth Obs. Remote Sens. 2014, 7, 4750–4761. [Google Scholar] [CrossRef] [Scilit]
  21. Arastounia, M. Automated recognition of railroad infrastructure in rural areas from LiDAR data. Remote Sens. 2015, 7, 14916–14938. [Google Scholar] [CrossRef] [Scilit]
  22. Ren, Y.; Lu, P.; Ai, C. Hybrid Local-Feature-Based Approach for Automated Rail Extraction from Lidar Data. Transp. Res. Rec. 2025, 2679, 53–71. [Google Scholar] [CrossRef] [Scilit]
  23. Wang, H.; Li, M.; Zhang, Q. Rail Point Cloud Extraction via Elevation Slice and Image Morphology. Remote Sens. 2023, 15, 3012. [Google Scholar]
  24. Zhao, L.; Chen, G.; Wang, H. Grid-Based Classification of Rails Using Height and Intensity Features. Remote Sens. 2021, 13, 3876. [Google Scholar]
  25. Chen, Y.; Zhang, X.; Li, C. Intensity-Guided RANSAC and Image Projection for Rail Extraction. ISPRS Ann. Photogramm. Remote Sens. Spat. Inf. Sci. 2022, 5, 345–352. [Google Scholar]
  26. Zou, R.; Fan, X.; Qian, C.; Ye, W.; Zhao, P.; Tang, J.; Liu, H. An efficient and accurate method for different configurations railway extraction based on mobile laser scanning. Remote Sens. 2019, 11, 2929. [Google Scholar] [CrossRef] [Scilit]
  27. Amodio, P.; De Giosa, M.; Iavernaro, F.; La Scala, R.; Labianca, A.; Lazzo, M.; Mazzia, F.; Pisani, L. Detection of anomalies in the proximity of a railway line: A case study. J. Comput. Math. Data Sci. 2022, 4, 100052. [Google Scholar] [CrossRef] [Scilit]
  28. Stein, D.; Spindler, M.; Lauer, M. Model-based rail detection in mobile laser scanning data. In Proceedings of the 2016 IEEE Intelligent Vehicles Symposium, Gothenberg, Sweden, 19–22 June 2016; IEEE: New York, NY, USA, 2016; pp. 654–661. [Google Scholar]
  29. Cheng, Y.-J.; Qiu, W.-G.; Duan, D.-Y. Automatic creation of as-is building information model from single-track railway tunnel point clouds. Autom. Constr. 2019, 106, 102911. [Google Scholar] [CrossRef] [Scilit]
  30. Lamas, D.; Soilán, M.; Grandío, J.; Riveiro, B. Automatic point cloud semantic segmentation of complex railway environments. Remote Sens. 2021, 13, 2332. [Google Scholar] [CrossRef] [Scilit]
  31. Pastucha, E. Catenary system detection, localization and classification using mobile scanning data. Remote Sens. 2016, 8, 801. [Google Scholar] [CrossRef] [Scilit]
  32. Song, L.; Liu, H.; Xu, L.; Hou, J.; Yu, Z. Dynamic performance of CRTS III ballastless track structure under train load and temperature. In Structures; Elsevier: Amsterdam, The Netherlands, 2023; Volume 53, pp. 408–420. [Google Scholar]
  33. Xu, S.; Wang, H.; Tian, X.; Wang, T.; Tanikawa, H. From efficiency to equity: Changing patterns of China’s regional transportation systems from an in-use steel stocks perspective. J. Ind. Ecol. 2022, 26, 548–561. [Google Scholar]
  34. Kaasalainen, S.; Jaakkola, A.; Kaasalainen, M.; Krooks, A.; Kukko, A. Analysis of incidence angle and distance effects on terrestrial laser scanner intensity: Search for correction methods. Remote Sens. 2011, 3, 2207–2221. [Google Scholar] [CrossRef] [Scilit]
  35. Soudarissanane, S.; Lindenbergh, R.; Menenti, M.; Teunissen, P. Scanning geometry: Influencing factor on the quality of terrestrial laser scanning points. ISPRS J. Photogramm. Remote Sens. 2011, 66, 389–399. [Google Scholar] [CrossRef] [Scilit]
  36. Song, J.H.; Han, S.H.; Yu, K.Y.; Kim, Y.I. Assessing the possibility of land-cover classification using LiDAR intensity data. Int. Arch. Photogramm. Remote Sens. Spat. Inf. Sci. 2002, 34, 259–262. [Google Scholar]
  37. Zhang, W.; Qi, J.; Wan, P.; Wang, H.; Xie, D.; Wang, X.; Yan, G. An easy-to-use airborne LiDAR data filtering method based on cloth simulation. Remote Sens. 2016, 8, 501. [Google Scholar] [CrossRef] [Scilit]
  38. Cai, S.; Zhang, W.; Qi, J.; Wan, P.; Shao, J.; Shen, A. Applicability analysis of cloth simulation filtering algorithm for mobile LiDAR point cloud. Int. Arch. Photogramm. Remote Sens. Spat. Inf. Sci. 2018, 42, 107–111. [Google Scholar] [CrossRef] [Scilit]
  39. Hoppe, H.; DeRose, T.; Duchamp, T.; McDonald, J.; Stuetzle, W. Surface reconstruction from unorganized points. In Proceedings of the 19th Annual Conference on Computer Graphics and Interactive Techniques, Chicago, IL, USA, 26–31 July 1992; Association for Computing Machinery (ACM): New York, NY, USA, 1992; pp. 71–78. [Google Scholar]
  40. Zhang, J.; Cao, J.; Liu, X.; Wang, J.; Liu, J.; Shi, X. Point cloud normal estimation via low-rank subspace clustering. Comput. Graph. 2013, 37, 697–706. [Google Scholar] [CrossRef] [Scilit]
Figure 1. Experimental site on the elevated section of Shanghai Metro Line 10.
Applsci 16 08791 g001
Figure 2. Workflow of the proposed rail tread extraction method.
Applsci 16 08791 g002
Figure 3. Overview of the track subgrade area.
Applsci 16 08791 g003
Figure 7. Principle of the cloth simulation filtering algorithm.
Applsci 16 08791 g007
Figure 10. Effect of intensity threshold filtering.
Applsci 16 08791 g010
Figure 11. Effect of intensity filtering on rail side points.The red circles indicate the comparison of rail side points before and after the filtering process.
Applsci 16 08791 g011
Figure 12. Segmentation result of ground and non-ground points.
Applsci 16 08791 g012
Figure 13. Extraction results under small smoothing thresholds.The red and blue dashed circles indicate the missing extraction regions that are left empty.
Applsci 16 08791 g013
Figure 14. Extraction results under large smoothing thresholds.The red circles indicate the over-extracted regions with redundant points.
Applsci 16 08791 g014
Figure 15. Clustering characteristics of rail fasteners.The different colors indicate the variations in point cloud density for visualization purposes.
Applsci 16 08791 g015
Figure 16. Overall rail tread extraction results in a large-scale, continuous point cloud scene.The red color represents the extracted rail tracks.
Applsci 16 08791 g016
Table 1. Typical reflection intensity ranges of objects in rail transit scene.
RegionObjectIntensity
Track subgradeConcrete subgrade7–14
Rail tread1–4
Rail side4–7
Rail fastener1–10
Noise barriersMetal noise barriers1–9
Sheet iron10–60
Transparent plastic board0
Railway catenary systemTransmission line1–7
Overhead power cable0–6
Mast10–40
Cantilevers0–40
SignMileage sign254–255
Table 2. Extraction sensitivity and precision under different smoothing thresholds ( S θ ).
S θ ( ° ) Sensitivity (%)Precision (%)
386.8998.29
491.5396.49
592.2395.32
692.8182.76
Disclaimer/Publisher’s Note: The statements, opinions and data contained in all publications are solely those of the individual author(s) and contributor(s) and not of MDPI and/or the editor(s). MDPI and/or the editor(s) disclaim responsibility for any injury to people or property resulting from any ideas, methods, instructions or products referred to in the content.