1. Introduction
Plants continue to serve as a fundamental source of bioactive compounds for healthcare and modern drug discovery [
1,
2,
3]. Their secondary metabolites exhibit significant structural diversity and are used in a wide range of therapeutic, disease-preventive, nutraceutical, and cosmetic applications [
4]. In contrast to single purified compounds, botanical extracts represent complex chemical matrices in which coexisting metabolites collectively influence biological activity through additive or synergistic mechanisms [
5]. Although this complexity is a notable advantage, it also presents substantial challenges for characterisation, quality control, and industrial scale-up. Among the numerous medicinal plant species investigated for their phytochemical richness,
Psidium guajava L. (Mirtaceae) has attracted increasing scientific interest owing to its abundance of phenolic compounds and flavonoids [
6].
Despite the growing scientific interest in
P. guajava, many of the studies currently available have focused primarily on describing the phytochemical composition of leaf extracts or investigating their biological properties, particularly their antioxidant, antimicrobial, anti-inflammatory, and antidiabetic activities [
7,
8,
9]. While these investigations have considerably expanded knowledge of the bioactive potential of
P. guajava leaves, comparatively little attention has been devoted to the development of integrated, reproducible, and technologically scalable processes for producing standardised extracts. Notably, limited research has integrated extraction optimisation, analytical standardisation using selected chemical markers, purification and enrichment strategies, and subsequent biological validation into a unified workflow. The integrated approach is essential for minimising the intrinsic variability of botanical matrices, enhancing batch-to-batch reproducibility, and facilitating the translation of laboratory-scale procedures into processes suitable for industrial application [
10]. According to this perspective, the implementation of Design of Experiments (DoE) methodologies for extraction optimisation is a valuable strategy for identifying the most influential process variables while limiting experimental effort and maximising extraction efficiency [
11]. Likewise, the quantitative determination of characteristic flavonoid markers by HPLC-DAD (high-performance liquid chromatography coupled with diode-array detection) provides a solid analytical method for quality control, enabling the establishment of standardised specifications based on individual bioactive constituents rather than solely on global parameters such as total polyphenol or total flavonoid content [
12]. Furthermore, the use of macroporous resins in adsorption chromatography offers an effective downstream purification approach for selectively concentrating flavonoid-rich fractions, thereby improving the extract’s phytochemical profile and potential biological activity [
13]. Finally, stabilising enriched extracts on suitable solid carriers may further help obtain reproducible botanical ingredients with improved handling, storage stability, and suitability for subsequent formulation and industrial applications [
14].
Previous optimisation studies have already established that extraction conditions strongly affect the recovery of
P. guajava phenolics and flavonoids. Liu et al. optimised ultrasound-assisted extraction for total phenols and antihyperglycemic activity, whereas Li et al. and Zeng et al. used response surface designs for the aqueous ultrasound-assisted recovery of total flavonoids or polyphenols [
15,
16,
17]. More recently, Kavhale et al. optimised an intensified ultrasound-assisted hydro-methanolic extraction (methanol/water 60:40), achieving a 38.7% extraction yield at 40 °C after 45 min with an ultrasonic input power of 173.2 W [
18]. These studies demonstrate the feasibility of process optimisation, but they rely on dedicated ultrasound equipment and predominantly optimise global responses such as TPC, TFC, or bioactivity rather than a defined set of chemical markers. Consistently, comparative work using Soxhlet extraction, maceration, and ultrasound-assisted extraction showed marked method-dependent differences in phenolic yield, chromatographic profile, and antioxidant activity, indicating that extraction efficiency alone does not ensure compositional comparability [
19]. Analytical profiling by HPLC-DAD-QTOF-MS has further revealed the high complexity of the guava-leaf phenolic fraction, supporting the need for marker-oriented quality control [
20]. Downstream purification has also been investigated independently: macroporous resin enrichment of an ethanolic guava-leaf extract increased total phenolic/flavonoid content and in vitro antioxidant activity [
21]. However, these studies addressed extraction, characterisation, or enrichment as largely separate operations rather than as a single marker-driven production-and-validation workflow.
Taking these considerations into account, the present study aimed to develop a standardised flavonoid-enriched extract from P. guajava leaves, obtained from a pilot cultivation established in south-eastern Sicily, where the progressive adaptation of subtropical species may offer a promising opportunity for agricultural diversification and valorisation of unconventional plant resources. For this study, we hypothesised that coupling a simple aqueous extraction with marker-oriented analytical standardisation and selective resin enrichment could overcome the fragmentation inherent in previous approaches and yield a chemically defined, flavonoid-enriched ingredient suitable for biological validation. The novelty of the present study therefore lies not in DoE-based extraction or resin purification individually, but in their integration with quantitative monitoring of hyperoside, guaijaverin, and avicularin, followed by formulation and biological assessment, without using ultrasound- or microwave-assisted extraction equipment. This integrated strategy aims to unify process optimisation, compositional control, and functional evaluation within a single workflow.
Overall, this integrated workflow provides a reproducible strategy for transforming a complex botanical matrix into a chemically characterised and standardised natural ingredient with possible uses in nutraceutical, phytopharmaceutical, and cosmetic sectors.
2. Materials and Methods
2.1. Chemicals and Reagents
Chemical reagents, including 2,2-diphenyl-1-picrylhydrazyl (DPPH), 2′,7′-dichlorofluorescein diacetate (DCFH-DA), and dimethyl sulfoxide (DMSO), were procured from VWR (Milan, Italy). HPLC-grade methanol, water, dimethylformamide, acetonitrile, and phosphoric acid, along with analytical-grade ethanol, Folin–Ciocalteu reagent, sodium carbonate, and aluminium chloride, were purchased from Carlo Erba Reagents (Milan, Italy). Reverse osmosis (RO) water was used for aqueous extraction and washing. High-purity analytical standards of avicularin (96%), hyperoside (94%), guaijaverin (91%), gallic acid (92%), and catechin (90%) were obtained from PhytoLab GmbH & Co. (Vestenbergsgreuth, Germany). Unless otherwise stated, all remaining chemical compounds were supplied by Sigma–Aldrich (Milan, Italy). Cell culture media and associated consumables were purchased from ThermoFisher Scientific (Monza, Italy).
2.2. Plant Material
P. guajava leaves were collected in September 2024 from a pilot cultivation in the province of Syracuse, south-eastern Sicily, Italy. To provide a representative and homogeneous sample, leaves were collected at different growth stages from several plants, closely replicating the material typically obtained during standard pruning operations. The taxonomic identification of the plant material was confirmed by the pharmaceutical botanist Prof. Giuseppe A. Malfa (Department of Drug and Health Sciences, University of Catania, Italy). A voucher specimen (No. 09/24) was deposited at the same department. Following collection, leaves were uniformly distributed on a raised mesh tray and air-dried for 3 days under forced ventilation inside an Asem-180 fume hood (Asem, Treviso, Italy). Once dried, the plant material (45.8% w/w) was ground into a coarse powder (comminuted herbal drug) using a DD6578 blade mill (Moulinex, Milan, Italy), subsequently vacuum-packed and stored at room temperature, protected from light, until use in the extraction experiments.
2.3. Exhaustive Hydroalcoholic Extraction for Preliminary Phytochemical Characterisation
An exhaustive hydroalcoholic extraction was performed to obtain a comprehensive phytochemical profile of P. guajava leaves and to verify the homogeneity of the plant material prior to optimisation of the aqueous extraction process.
Briefly, 3.0 g of dried and powdered leaves were placed in a cellulose extraction thimble and extracted using a SER 148 automatic solvent extractor (VELP Scientifica, Monza and Brianza, Italy). A hydroalcoholic ethanol/water solution (70:30, v/v) was used as the extraction solvent. A total volume of 150 mL was prepared and equally distributed between the two extraction vessels (75 mL each). The extraction consisted of a 10 min immersion phase, followed by a 2 h washing phase under continuous solvent reflux. The temperature was maintained at 250 °C throughout the procedure, in accordance with the instrument operating conditions. After extraction, the solutions were cooled to room temperature and filtered through Whatman No. 4-filter paper.
2.4. Determination of the Dry Residue Content
Dry residue content was determined according to the European Pharmacopoeia (Ph. Eur. 10.0, method 2.8.16) [
22]. Briefly, 2.0 g of each liquid extract was transferred into a pre-weighed flat-bottom dish and evaporated to dryness in a water bath. The residue was then dried in a ventilated oven (FED 56, BINDER GmbH, Tuttlingen, Germany) at 105 °C for 3 h, cooled to room temperature in a desiccator, and weighed. The dry residue content was calculated as the percentage (
w/
w) of the initial sample mass.
2.5. Determination of the Total Polyphenol Content (TPC) and the Total Flavonoid Content (TFC)
The TPC and TFC of the different extracts were quantified using the Folin–Ciocalteu and aluminium chloride assays, respectively, as reported by Bianchi et al. [
23]. For TPC, 40 µL of Folin–Ciocalteu reagent was mixed with 400 µL of the aqueous extract solution and incubated for 5 min. Then, 400 µL of a Na
2CO
3 solution (7%
w/
v) was added and a final volume of 1 mL was reached with water. The mixture was incubated in the dark for 90 min, and the final absorbance at λ = 765 nm by a Hitachi UV 2000 spectrophotometer (Hitachi, Tokyo, Japan). For TFC, 30 µL of NaNO
2 solution (5%
w/
v) was mixed with 500 µL of the aqueous extract and incubated for 5 min. Then, 30 µL of AlCl
3 solution (10%
w/
v) and, after a 1 min incubation, 200 µL of NaOH (1 M) were added, and the final volume of 1 mL was reached with water. The mixture was incubated in the dark for 10 min and the final absorbance was measured at λ = 510 nm. Phenol and flavonoid amounts were calculated using standard calibration curves generated with known concentrations of gallic acid or catechin, respectively. TPC and TFC values are expressed as milligrams of gallic acid equivalents per gram of extract (mg GAE g
−1 extract) and milligrams of catechin equivalents per gram of extract (mg GAE g
−1 extract), respectively. Data are reported as mean ± S.D. of three independent experiments performed in triplicate.
2.6. HPLC-DAD Analysis
The phytochemical profile of the extracts was investigated by HPLC-DAD. The solid samples were dissolved in a dimethylformamide/water (9:1) solution with a final concentration of 1.8 mg/mL. Analyses were performed using a Shimadzu LC-20 chromatographic system (Shimadzu, Kyoto, Japan) equipped with a diode-array detector and an Ascentis Express C18 analytical column (150 × 4.6 mm, 2.7 μm; Supelco, Darmstadt, Germany). The mobile phase consisted of solvent A (water/phosphoric acid, 99:1, v/v) and solvent B (methanol/acetonitrile/phosphoric acid, 49.5:49.5:1, v/v/v). Chromatographic separation was achieved using the following gradient elution programme: 95% A to 77% A over 34 min, maintained at 77% for 3 min, then decreased to 74% at 60 min, 60% at 85 min, 20% at 90 min, and 0% at 92 min, for a total analysis time of 105 min. The flow rate was set to 1.0 mL min−1, the column temperature to 25 °C, and the injection volume to 5 μL. Prior to subsequent injections, the column was conditioned with the initial mobile phase for 10 min to guarantee reproducible retention times. UV–Vis spectra were acquired over the wavelength range of 190–500 nm, while chromatograms were recorded at λ = 280 and λ = 330 nm (±2 nm). Compound identification was achieved by comparing retention times and UV–Vis spectral characteristics with those of authenticated reference standards available in an in-house spectral library.
2.7. Optimisation of the Aqueous Extraction by DoE
The aqueous extraction of polyphenolic and flavonoid compounds from P. guajava leaves was optimised using a DoE approach implemented in MODDE Pro 12.1 software (Sartorius Data Analytics AB, Umeå, Sweden). A three-level design model was used to identify the optimal extraction conditions. Extraction temperature and time were selected as independent variables, while the drug-to-solvent ratio was maintained constant at 1:30 (w/v). For each run, 50 g of dried and ground leaves were extracted with 1.5 L of RO water under continuous stirring. At the end of each extraction, the extract was filtered through a 300 μm stainless-steel mesh, followed by Whatman No. 4-filter paper.
The optimised responses were TPC and TFC. The experimental matrices were generated according to the expression:
where
L is the number of factor levels,
v the number of variables, and
c the number of centre points. Three centre points were included in each design to estimate experimental reproducibility and model pure error. The three-level full factorial design consisted of twelve experimental runs, performed according to the randomised order generated by the software (
Table S1).
2.8. Comparative Screening of Macroporous Resins for Flavonoid Enrichment
A preliminary screening was conducted to select the most suitable resin for enriching flavonoid markers from the optimised aqueous extract of P. guajava. Two adsorbent resins, referred to as Resin A (110 Å pore size, 800 m2/g surface area, polystyrene-based) (PAD500, Purolite™ Resins, Ecolab, King of Prussia, PA, USA) and Resin B (70 Å pore size, 930 m2/g surface area, styrene–divinylbenzene copolymer) (Sepabeads™ SP825L, Mitsubishi Chemical Corp., Tokyo, Japan), were tested under the same experimental conditions.
For each test, 20 mL of resin was activated in 98%
v/
v ethanol for 24 h and then washed with RO water to remove residual ethanol. The activated resin was placed in contact with 400 mL of optimised aqueous extract in a 500 mL flask. Adsorption was performed at room temperature under mild and constant agitation. During adsorption, aliquots were collected after 20, 60, 120, and 180 min. and analysed by HPLC-DAD to monitor the residual concentration of hyperoside, guaijaverin, avicularin, and guaijaverin derivatives. The residual marker percentage and adsorption percentage were calculated as follows:
where
C0 is the initial marker concentration,
Ct is the concentration at each sampling time, and
Ct180 is the concentration after 180 min.
After adsorption, the residual extract was removed, and the resin was washed with 40 mL of RO water at 4 °C for 20 min. The washing fraction was collected and analysed by HPLC-DAD. The adsorbed compounds were then desorbed using four consecutive extraction steps with EtOH/H
2O 70/30
v/
v, each lasting 24 h. The hydroalcoholic desorption fractions were collected separately and analysed by HPLC-DAD. Desorption recovery was calculated with respect to the amount effectively retained by the resin after the washing step. Resin selection was based on adsorption efficiency, desorption recovery, and overall recovery of the selected flavonoid markers.
2.9. Flavonoid Enrichment Using Macroporous Resin
Flavonoid enrichment was performed by adsorption chromatography using a glass column (20 cm × 2.3 cm i.d.) packed with 50 mL of Sepabeads™ SP825L macroporous polymeric resin (Mitsubishi Chemical Corp., Tokyo, Japan). Prior to use, the resin was conditioned according to the manufacturer’s instructions. The optimised aqueous extract was loaded onto the column at a flow rate of 1 bed volume (BV) h−1 until the resin’s adsorption capacity was reached. The column was then rinsed with cold RO water (4 °C) at 2 BV h−1 for 1 h to remove non-adsorbed residual matrix components. Flavonoid-rich compounds retained on the resin were subsequently recovered by elution with an ethanol/water mixture (70:30, v/v), with the resin left in contact with the eluent at room temperature for 24 h to ensure complete desorption. The desorption cycle was repeated four times to maximise flavonoid recovery.
2.10. Preparation of the Maltodextrin-Supported Enriched Extract
The hydroalcoholic eluates obtained from the adsorption chromatography were pooled (167.41 g; dry residue: 3.22%; TFC: 11.07%) and concentrated under reduced pressure using a rotary evaporator to remove ethanol, yielding a concentrated aqueous extract.
Maltodextrin (2.30 g, corresponding to 30% w/w of the total hydroalcoholic eluate dry residue) was added to the concentrated aqueous extract as a carrier. The mixture was stirred for approximately 1 h to ensure complete dissolution and homogeneous dispersion of the carrier. The resulting suspension was transferred to a drying dish and dried in a laboratory oven (FED 56, BINDER GmbH, Tuttlingen, Germany) at 57 °C for 4 days.
After drying, the solid material was gently ground using a mortar and pestle to obtain a homogeneous powder. The final P. guajava maltodextrin-supported flavonoid-enriched extract (PGE) was characterised by HPLC-DAD and stored in airtight amber glass containers at room temperature, protected from light, until further use.
2.11. In Vitro Antioxidant and Scavenging Activity Assays
The antioxidant and radical scavenging capacities of PGE were evaluated through DPPH
•, superoxide anion (SOD-like), and hydrogen peroxide (catalase-like) scavenging assays using a UV-Vis spectrophotometer. For the DPPH
• assay, different concentrations of PGE were incubated with an 86 μM DPPH
• ethanolic solution at room temperature in the dark for 10 min, and the absorbance was measured at λ = 517 nm. The SOD-like activity was assessed using a cell-free, non-enzymatic method for generating superoxide anion, following the protocol described by Tomasello [
24]. Briefly, various extract concentrations were mixed with 100 mM triethanolamine–diethanolamine buffer (pH 7.4), 3 mM NADH, 25 mM EDTA/12.5 mM MnCl
2, and 10 mM β-mercaptoethanol. After a 20 min incubation at room temperature in the dark, NADH oxidation inhibition was monitored by reading the absorbance at λ = 340 nm for 5 min. The catalase-like activity was determined as reported by Bianchi [
16]; PGE samples were mixed with 24 mM H
2O
2 in a potassium phosphate buffer (pH 7.4) to a final volume of 1 mL, incubated for 10 min. at room temperature in the dark, and measured at λ = 240 nm. For all assays, results were calculated as the percentage of scavenging or inhibition relative to the control and expressed as IC
50 values (mean ± S.D.) obtained from three independent experiments performed in triplicate.
2.12. Cell Culture
RAW 264.7 cells (murine macrophages, ATCC TIB-71TM) were maintained in Dulbecco’s Modified Eagle Medium (DMEM, Gibco 41966-029, Thermo Fisher Scientific, Paisley, Scotland) high glucose (4.5 g/L) containing 1 mM pyruvate, 4 mM Glutamine, 100 U mL−1 penicillin, 100 μg mL−1 streptomycin, and 10% Foetal Bovine Serum (FBS, Gibco A5256701, Thermo Fisher Scientific) in a cell culture incubator, at 37 °C, with 5% CO2 and a humidified atmosphere. The culture medium was changed every 2/3 days. Cells were mechanically harvested twice a week, when ~80% confluence was reached, using a sterile cellular scraper and centrifuged at 300× g for 5 min. The cell pellet was resuspended in fresh medium and either expanded in a flask or seeded in multiwell plates to perform the following experiments.
2.13. MTT Assay
To perform the assay, 1·10
4 RAW 264.7 cells per well were seeded in 96-well plates. Cells were treated 48h after seeding with increasing concentrations of PGE (5, 10, 25, 50 μg CE mL
−1) for 24 h. Then, cells were incubated with an MTT at 0.5 mg mL
−1 solution in DMEM HG for 1 h in a cell culture incubator. Subsequently, the MTT solution was removed, and the formazan crystals were solubilised with 100 μL/well of DMSO [
25]. Then, absorbance was measured spectrophotometrically at λ = 570 nm using a microplate reader (Sinergy HT, Biotek, Winooski, VT, USA). Results are expressed as a percentage of cell viability vs. untreated control cells and reported as the mean ± S.D. of four independent experiments performed in triplicate.
2.14. •NO Release Assay
The quantification of
•NO was carried out by applying the Griess-Ilosvay reaction [
26]. Briefly, 5·10
4 RAW 264.7 cells per well were seeded in 96-well plates. Cells were pre-treated, 48 h after seeding, for 6 h with different concentrations of PGE (5, 10, 25, 50 μg CE mL
−1) and then activated with LPS (1 μg mL
−1) for 18 h. Then, the amount of nitrite derived from
•NO oxidation was measured by mixing 100 µL of culture medium with 100 µL of Griess-Ilosvay. Following 15 min of incubation, the absorbance of the solution at λ = 546 nm was measured by a microplate reader (Sinergy HT, Biotek). Results are expressed as a percentage of
•NO release vs. LPS-activated cells and reported as the mean ± S.D. of four independent experiments performed in triplicate.
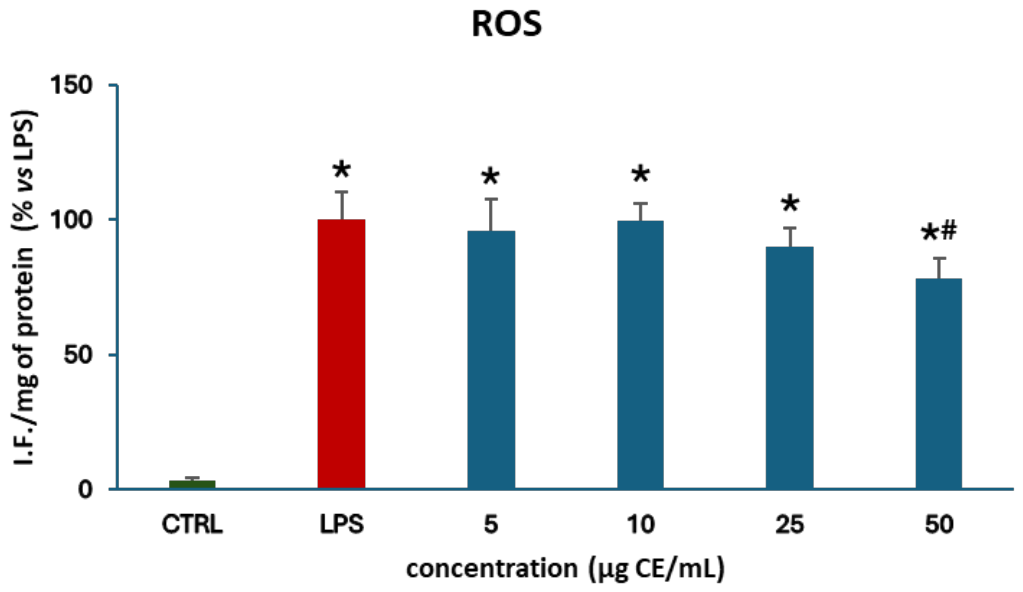
2.15. Intracellular ROS Quantification
Intracellular ROS production was evaluated using the probe 2′,7′-dichlorodihydrofluorescein diacetate (DCFH-DA), as reported by Bianchi [
16]. Briefly, 3·10
5 RAW 264.7 cells per well were seeded in 24-well plates. After 24 h, cells were pre-treated with different concentrations of PGE (5, 10, 25, 50 μg CE mL
−1) and then activated with LPS (1 μg mL
−1) for 18 h. After incubation, DCFH-DA (5 μM) was added to the culture medium and incubated for 30 min. Then, cells were rinsed twice with ice-cold PBS (250 μL/well) and lysed with a 2.5 mg mL
−1 digitonin solution (250 μL/well) for 1 h at 4 °C in the dark. Cell lysates were subsequently centrifuged at 13,000×
g for 10 min, and fluorescence intensity was measured in 100 μL of supernatant at λex = 488 nm and λem = 525 nm using a microplate reader (Sinergy HT, Biotek). Results are expressed as a percentage of intensity of fluorescence (I.F.) normalised per mg of protein (I.F./mg of protein) vs. LPS-activated cells and reported as the mean ± S.D. of four independent experiments performed in triplicate.
2.16. Statistical Analysis
DoE data were analysed using multiple linear regression (MLR) and analysis of variance (ANOVA). Model adequacy and performance were evaluated based on the determination coefficient (R2), cross-validated prediction coefficient (Q2), model validity, reproducibility, lack-of-fit, and residual distribution analysis. Models were considered acceptable when characterised by high R2 and Q2 values, a minimal discrepancy between these two parameters, and a non-significant lack-of-fit relative to the pure error estimated from the centre points.
For all other assays, statistical comparisons were performed using one-way ANOVA coupled with Tukey’s multiple comparison test. For all statistical tests, a p-value less than 0.05 (p < 0.05) was considered statistically significant.
3. Results
3.1. Preliminary Phytochemical Characterisation of P. guajava Leaves
The exhaustive hydroalcoholic extraction provided a preliminary phytochemical characterisation of
P. guajava leaves and served as a reference for the successive optimisation of the aqueous extraction process. The analytical results obtained from two independent exhaustive extractions are summarised in
Table 1.
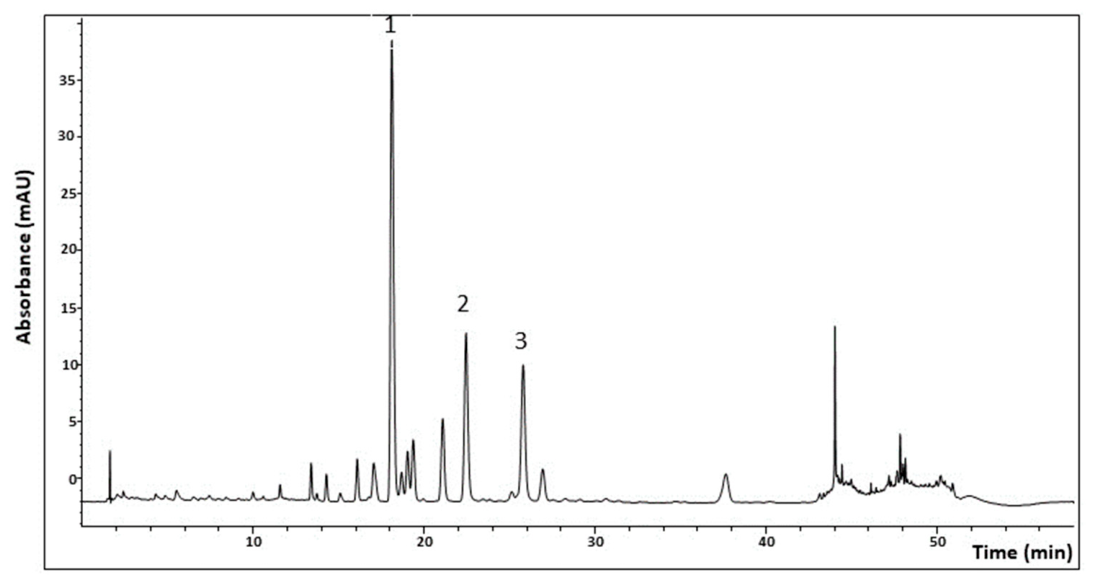
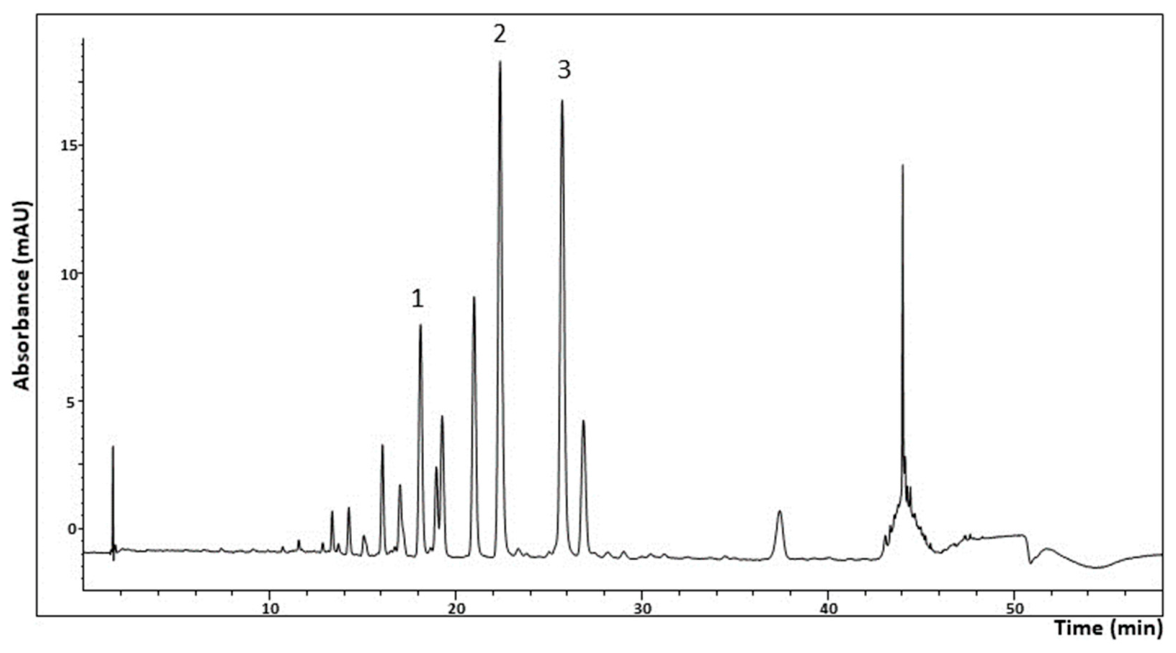
The two extraction replicates showed a high degree of consistency, confirming the homogeneity of the plant material. The mean dry residue was 1.04 ± 0.021%, while the average TPC and TFC were 0.35 ± 0.028% and 0.077 ± 0.006%, respectively. HPLC-DAD analysis showed the presence of the characteristic flavonoid glycosides hyperoside, guaijaverin, and avicularin, with mean concentrations of 0.0184 ± 0.0022%, 0.0078 ± 0.0007%, and 0.0074 ± 0.0005%, respectively (
Figure 1,
Table 2).
In addition, the overall content of guaijaverin and structurally related derivatives reached 0.0444%, highlighting this class of compounds as a major component of the flavonoid fraction.
The chromatographic analysis enabled the qualitative identification of the principal flavonoid markers by their retention times and UV–Vis spectral characteristics. As reported in
Table 2, hyperoside, guaijaverin, and avicularin were eluted at retention times of 18.1, 22.4, and 25.8 min, respectively. The representative HPLC-DAD chromatogram shown in
Figure 1 illustrates the phytochemical profile of the hydroalcoholic extract and the satisfactory chromatographic resolution of the selected marker compounds. Overall, the exhaustive hydroalcoholic extraction confirmed the presence of the principal flavonoid markers in
P. guajava leaves and established the reference phytochemical profile, which was subsequently used to evaluate the efficiency of the optimised aqueous extraction and the enrichment process.
3.2. Optimisation of the Aqueous Extraction by Design of Experiments
The aqueous extraction process was optimised through a sequential Design of Experiments (DoE), with total polyphenol content (TPC) and total flavonoid content (TFC) as target response variables. Extraction temperature and time were evaluated as independent variables, while the drug-to-solvent ratio was maintained constant at 1:30 (
w/
v). A three-level factorial design was used to define the experimental domain and determine the optimal operating conditions (
Table S1). Second-order polynomial models were fitted to the experimental data by multiple linear regression. The diagnostic plots obtained for the TPC model are shown in
Figure S5.
The model showed a high goodness of fit (R
2 = 0.995) and satisfactory predictive ability (Q
2 = 0.974) (
Table S2). The reproducibility value was 1. Model validity was not calculable because the pure error among centre-point replicates was negligible. The coefficient plot indicated that extraction temperature exhibited the largest positive coefficient, while extraction time contributed a smaller positive effect. Negative quadratic and interaction coefficients indicated curvature in the response surface. Residuals were approximately normally distributed and remained within the diagnostic limits.
A comparable statistical evaluation was performed for the TFC model (
Figure S6). The centre-point responses demonstrated satisfactory agreement, indicating strong repeatability. The model exhibited a high goodness of fit (R
2 = 0.985) and satisfactory predictive performance (Q
2 = 0.871) (
Table S2). Model validity and reproducibility were 0.478 and 0.990, respectively. The lack-of-fit test was non-significant (
p = 0.125).
Temperature exhibited the largest positive coefficient for TFC, whereas extraction time contributed minimally. Negative quadratic and interaction coefficients indicated response curvature and a plateau at higher temperatures. Residuals showed no significant deviation from normality and remained within diagnostic limits.
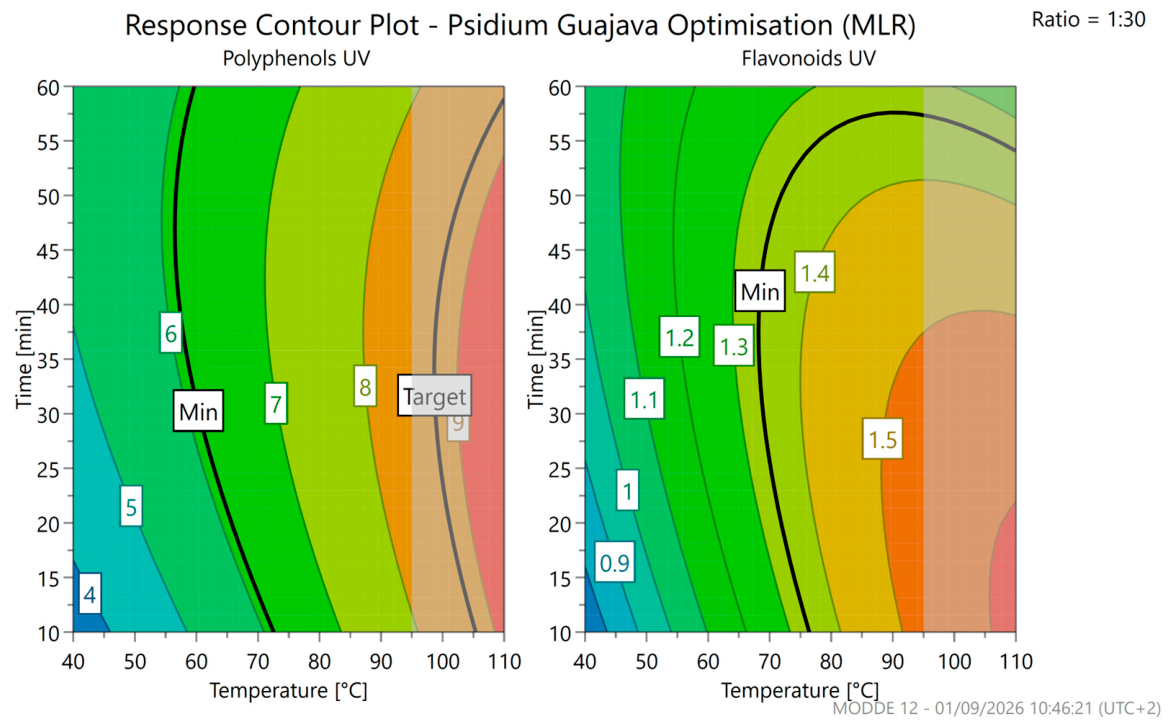
The predicted response surfaces for TPC and TFC are shown in
Figure 2. Within the investigated experimental domain, both responses increased primarily with temperature, whereas extraction time had a less pronounced influence. The highest predicted values were observed at high temperatures and intermediate extraction times. Extrapolated regions were excluded from optimisation, with 95 °C retained as the upper experimental limit.
The local robustness of the selected operating conditions was evaluated using design-space analysis based on the TFC response.
Figure S7 shows that 95 °C and 24 min fall within the green acceptance region, corresponding to a predicted probability of process failure below 1%. This supports the operational robustness of the selected conditions within the investigated laboratory-scale domain.
Overall, the combined evaluation of model performance, regression diagnostics, predicted response surfaces, and design-space analysis supported the selection of a drug-to-solvent ratio of 1:30 (
w/
v), an extraction temperature of 95 °C, and an extraction time of 24 min (
Table 3) as the optimum within the investigated experimental domain.
Experimental verification under the selected conditions yielded a TPC of 76 mg GAE g−1 v.m. and a TFC of 15.6 mg CE g−1 v.m. The differences between predicted and experimentally observed TPC and TFC values were 9.52% and +1.30%, respectively, supporting the predictive adequacy of the models.
3.3. Comparative Screening of Macroporous Resins
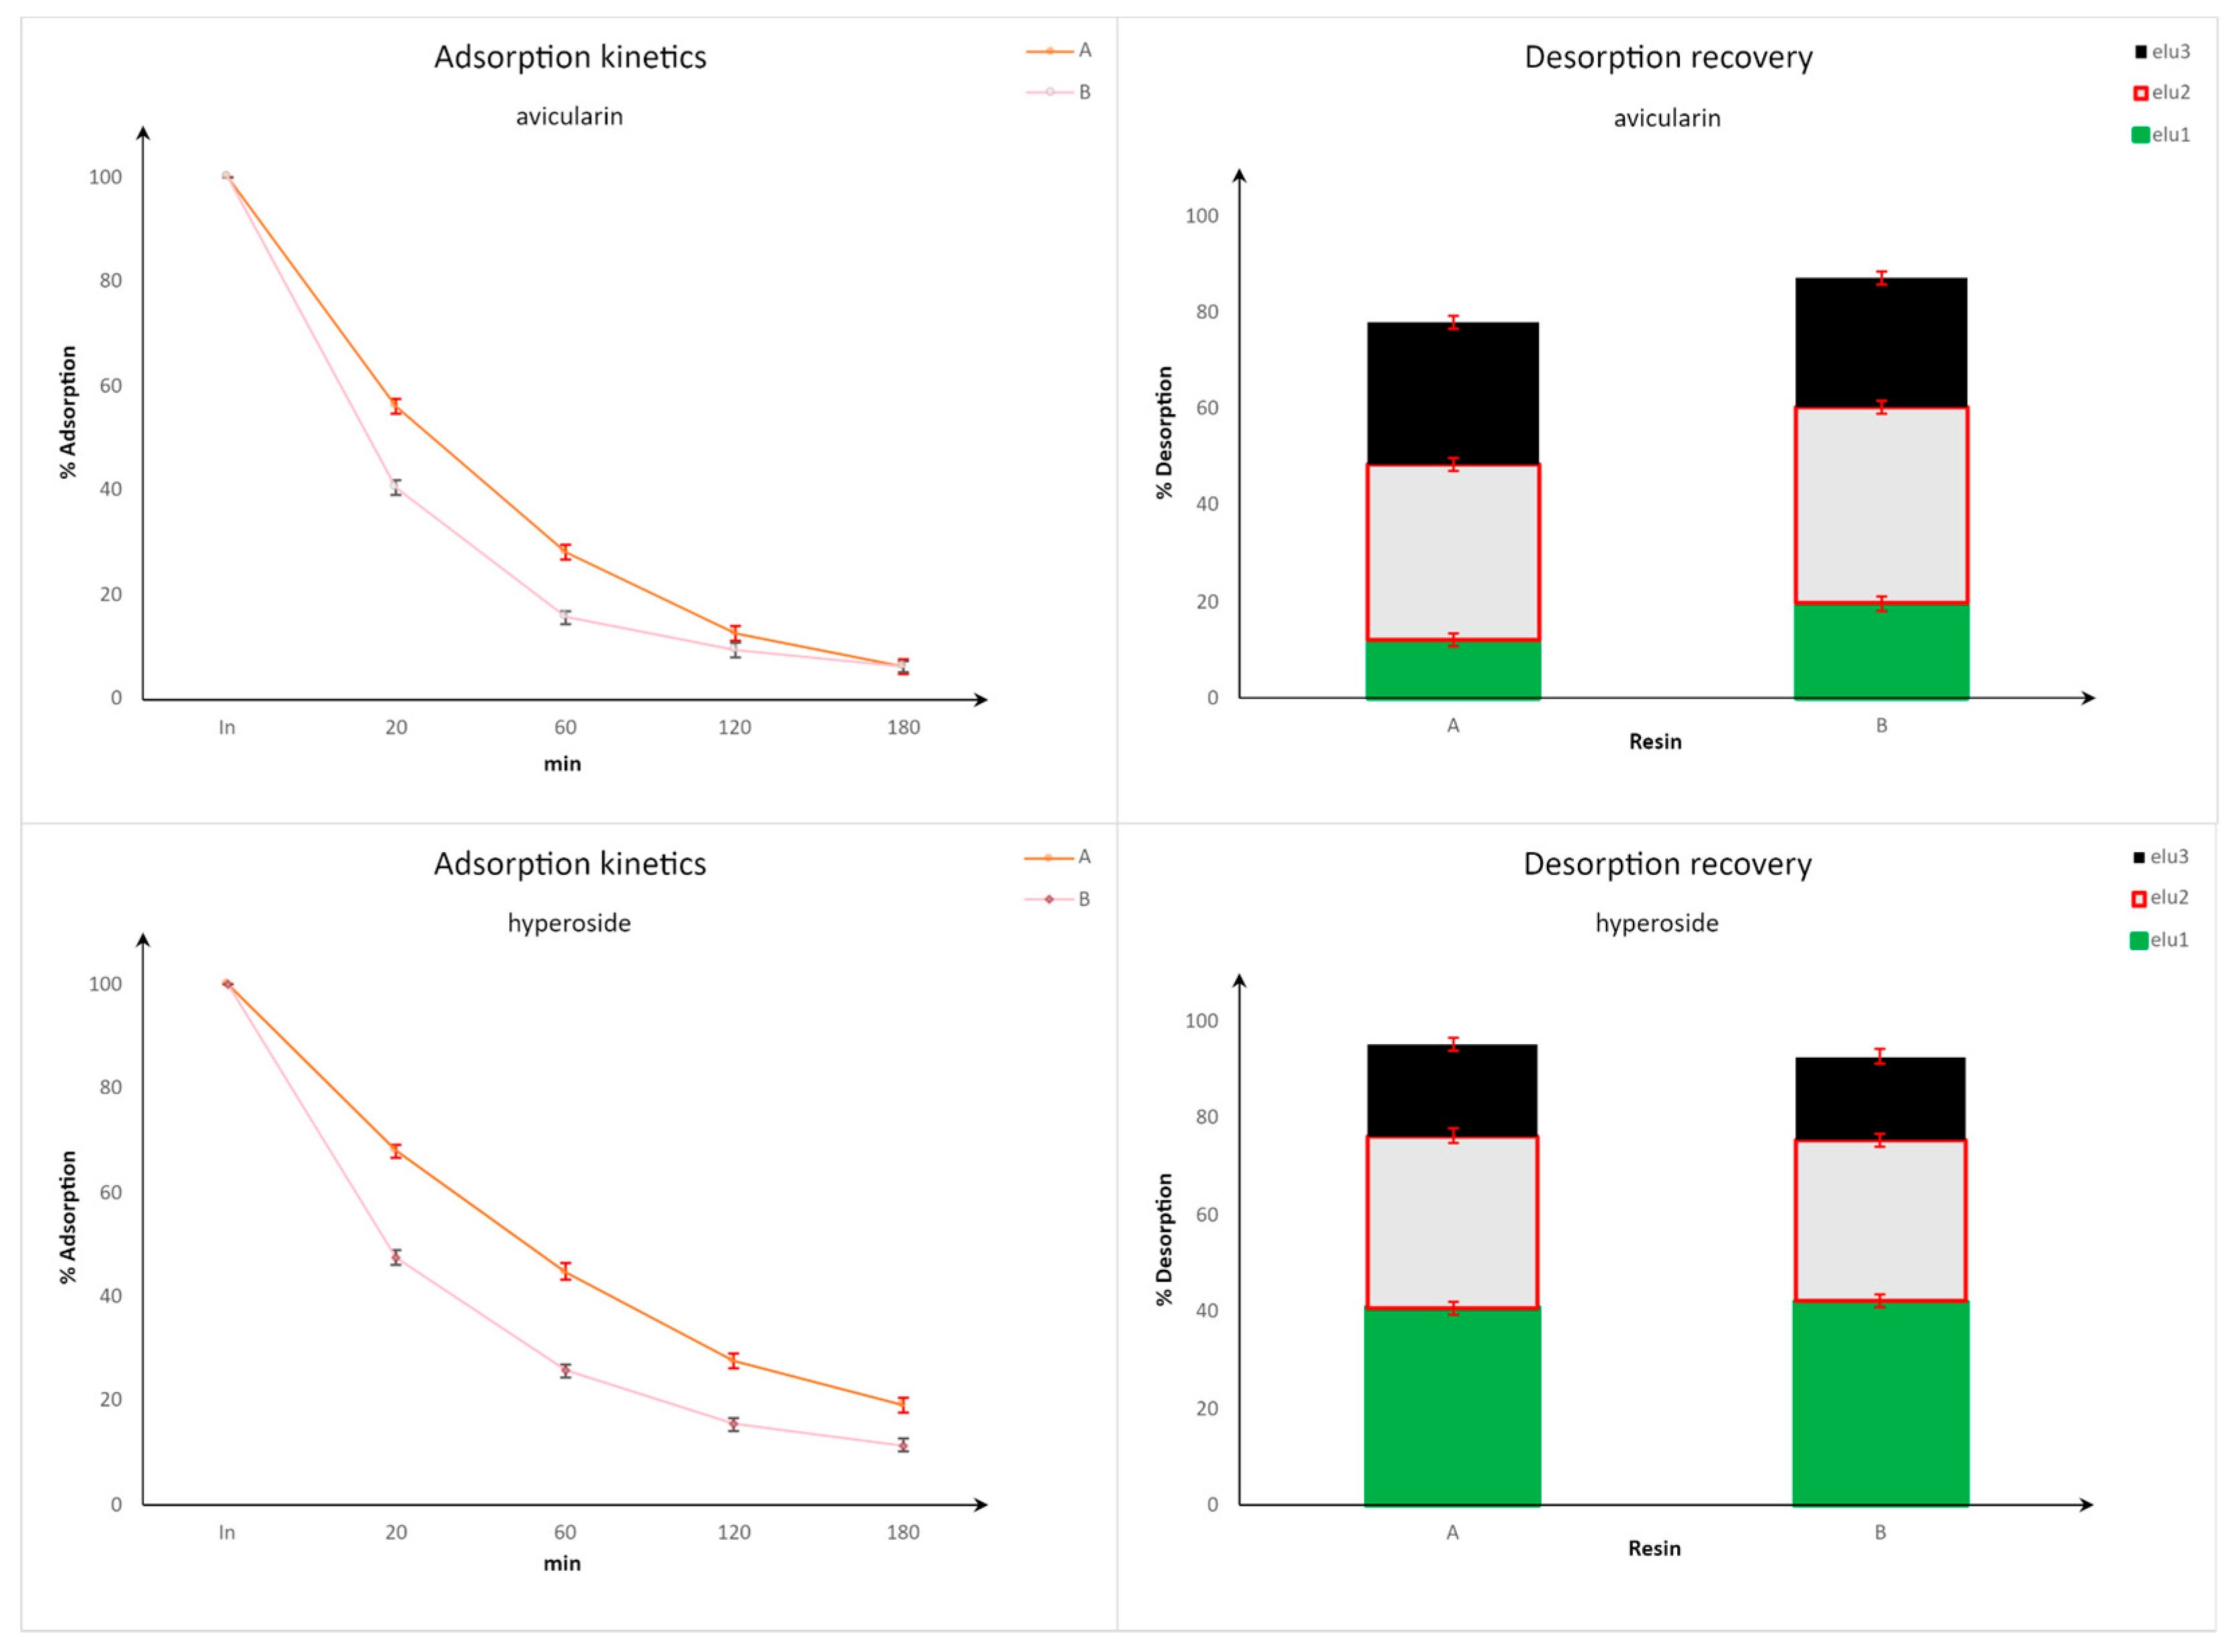
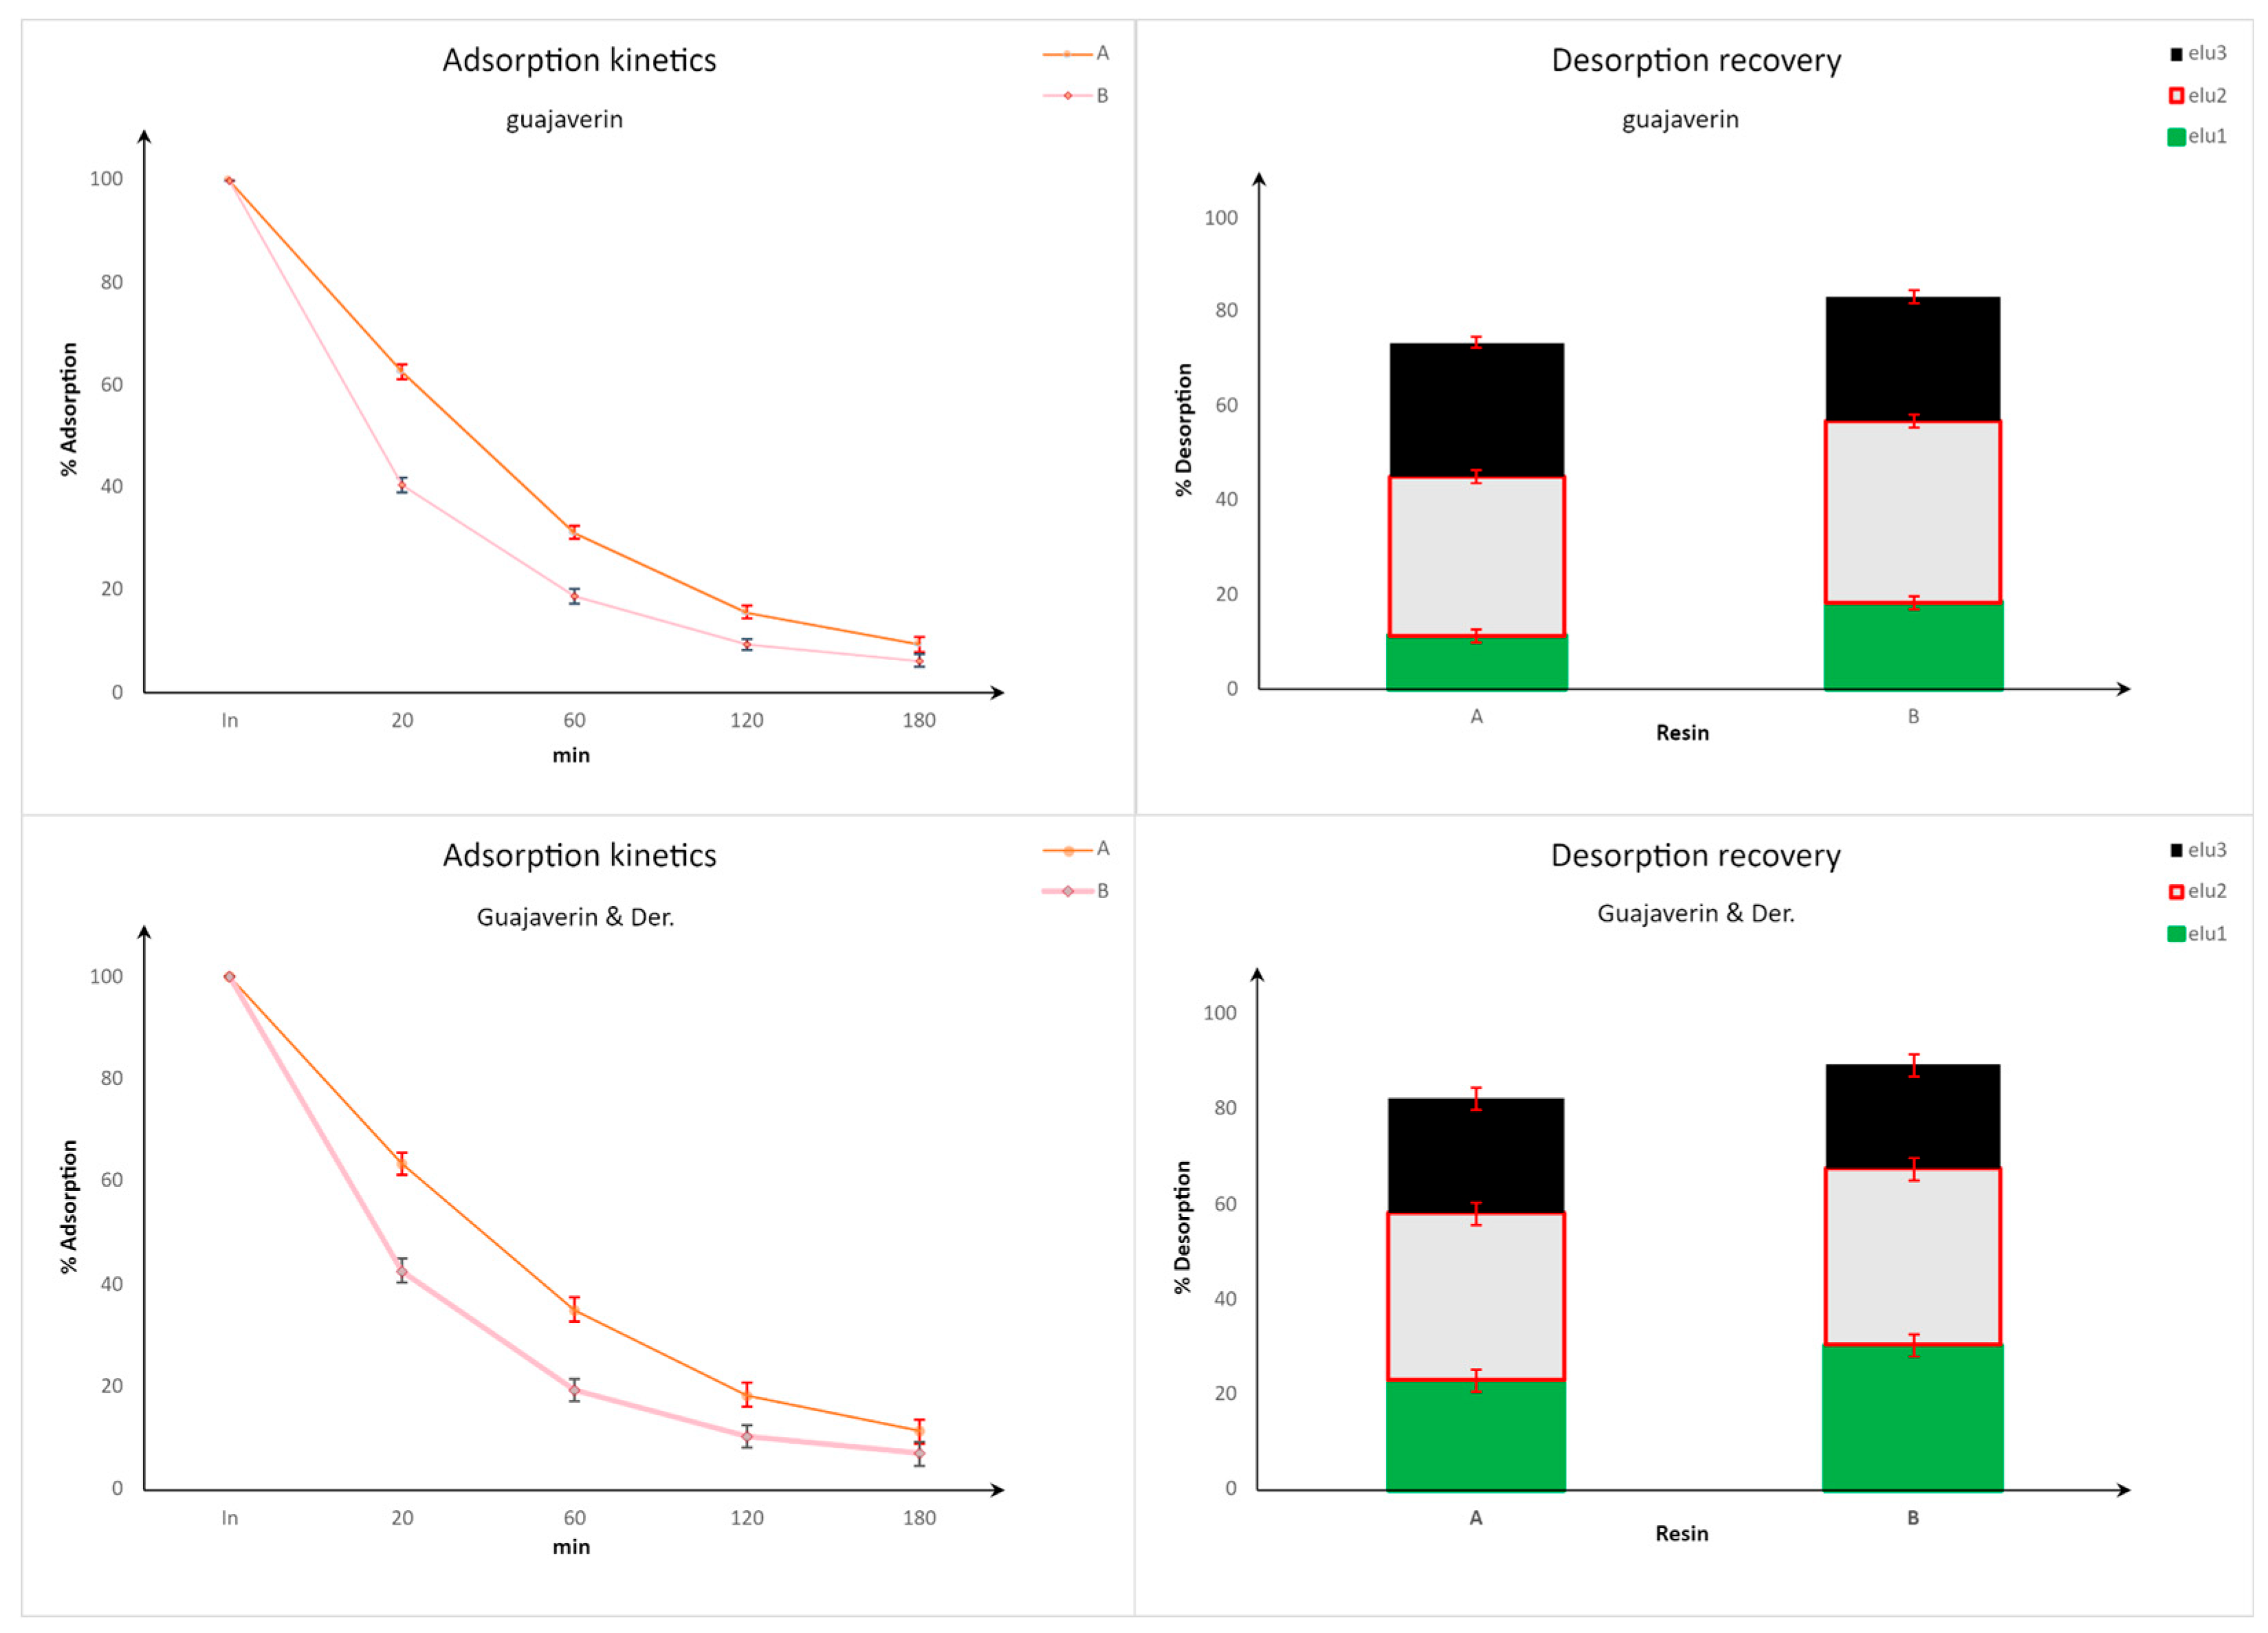
To determine the optimal stationary phase for the enrichment and purification process, the static adsorption kinetics and subsequent desorption efficiencies of two macroporous resins (Resin A and Resin B) were systematically compared using avicularin, hyperoside, guaijaverin, and guaijaverin derivatives as target reference flavonoids. The static adsorption profiles revealed a time-dependent decrease in the concentration of all target analytes for both polymeric matrices. Although both resins exhibited a comparable kinetic trend, Resin B demonstrated a faster uptake rate per unit time than Resin A. As illustrated in the kinetic curves (
Figure 3 and
Figure 4), Resin B achieved a more pronounced depletion of the target compounds within the initial 0–60 min interval.
The downstream recovery performance further corroborated the operational superiority of Resin B. The fractional desorption profiles across consecutive elution steps (elu1, elu2, and elu3) highlight a highly efficient elutropic displacement from the resins. Specifically, Resin B yielded a cumulative recovery rate of 89.4% for the reference flavonoids. In contrast, Resin A exhibited a significantly lower total desorption efficiency, recovering only 82.2% of the bound analytes under identical conditions. Consequently, Resin B was selected as the optimal matrix for the enrichment process.
3.4. Column Enrichment on Resin B
Following the selection of Resin B (Sepabeads™ SP825L, Mitsubishi Chemical Corporation, Tokyo, Japan) as the most suitable adsorbent resin, the optimised aqueous extract (6.15 L) was subjected to column enrichment under the selected operating conditions. The recovery of the principal flavonoid markers was evaluated by HPLC-DAD analysis, and the results are summarised in
Figure 5.
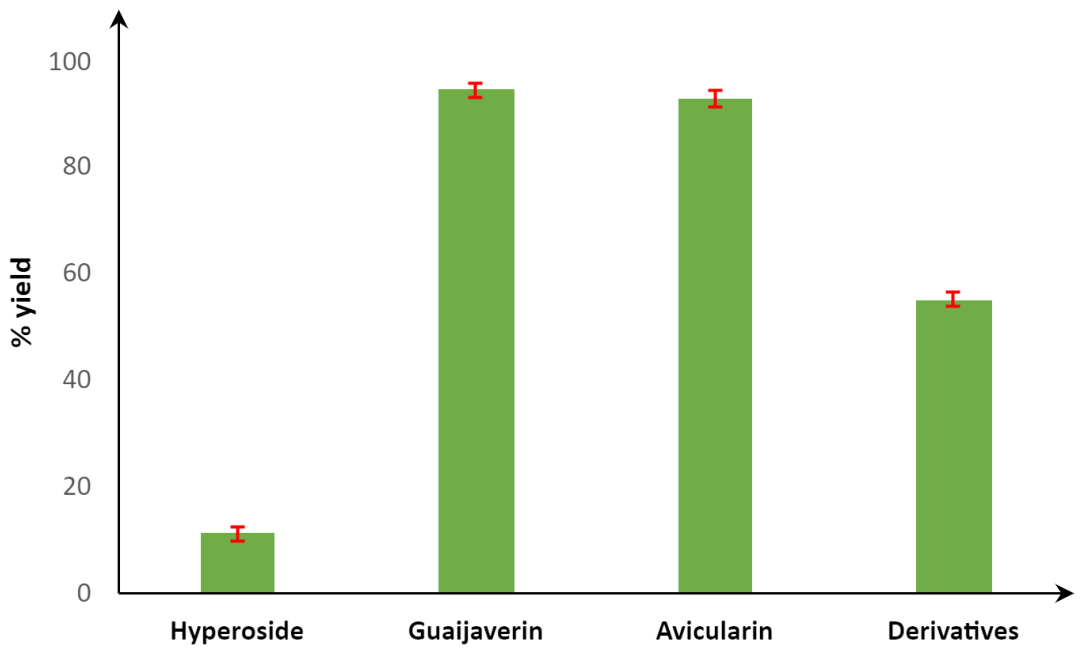
The enrichment procedure showed high recovery efficiencies for avicularin and guaijaverin, reaching 93.8% and 95.2%, respectively. In contrast, hyperoside exhibited a substantially lower recovery (11.5%), which consequently reduced the overall recovery of guaijaverin and related derivatives to 56% (
Figure 5). The chromatographic profile of the enriched extract was subsequently compared with that of the crude hydroalcoholic extract. As shown in
Figure 6, the overall chromatographic fingerprint remained comparable to that of the original extract (
Figure 1), while a selective increase in the relative abundance of the target flavonoid markers was observed.
No qualitative changes or additional peaks were detected after the enrichment process, indicating that the adsorption–desorption procedure preserved the extract’s phytochemical composition while increasing the concentrations of the selected flavonoid markers. These results demonstrate that the resin-based enrichment process effectively increased the concentration of the principal flavonoid markers without altering the overall chromatographic fingerprint of the P. guajava leaf extract.
3.5. Preparation of the Maltodextrin-Supported Enriched Extract (PGE)
The flavonoid-enriched eluates obtained after resin chromatography were successfully concentrated under reduced pressure to yield a concentrated aqueous extract. The addition of maltodextrin (30% w/w of the extract dry residue) followed by controlled drying produced a homogeneous free-flowing powder, hereafter referred to as PGE (Psidium guajava enriched extract).
HPLC-DAD analysis confirmed that the drying and formulation processes did not alter the chromatographic fingerprint of the enriched extract. The final formulation maintained the characteristic profile of P. guajava flavonoids, allowing the quantitative determination of the selected marker compounds. The PGE contained 2.113% avicularin, 1.991% guaijaverin, and 0.837% hyperoside, corresponding to a total content of 7.749% flavonoid markers and related derivatives. The resulting standardised powder was subsequently used for the in vitro antioxidant and anti-inflammatory assays.
3.6. Antioxidant Characterisation of PGE
PGE antioxidant activity was evaluated against three reactive species: DPPH
• radical via the DPPH
• test, superoxide anion (
) via the SOD-like activity assay, and hydrogen peroxide (H
2O
2) via the Catalase-like activity assay. Ascorbic acid (AA) was used as a reference compound to provide a quantitative basis for interpreting the antioxidant activity of PGE. The results, expressed as IC
50 values and reported in
Table 4, showed potent antioxidant activity of PGE on both radical (DPPH
•: 1.22 ± 0.013 μg CE mL
−1;
: 0.043 ± 0.0067 μg CE mL
−1) and non-radical (H
2O
2: 9.51 ± 0.15 μg CE mL
−1) reactive molecules.
3.7. Anti-Inflammatory Activity
3.7.1. Safety Assessment
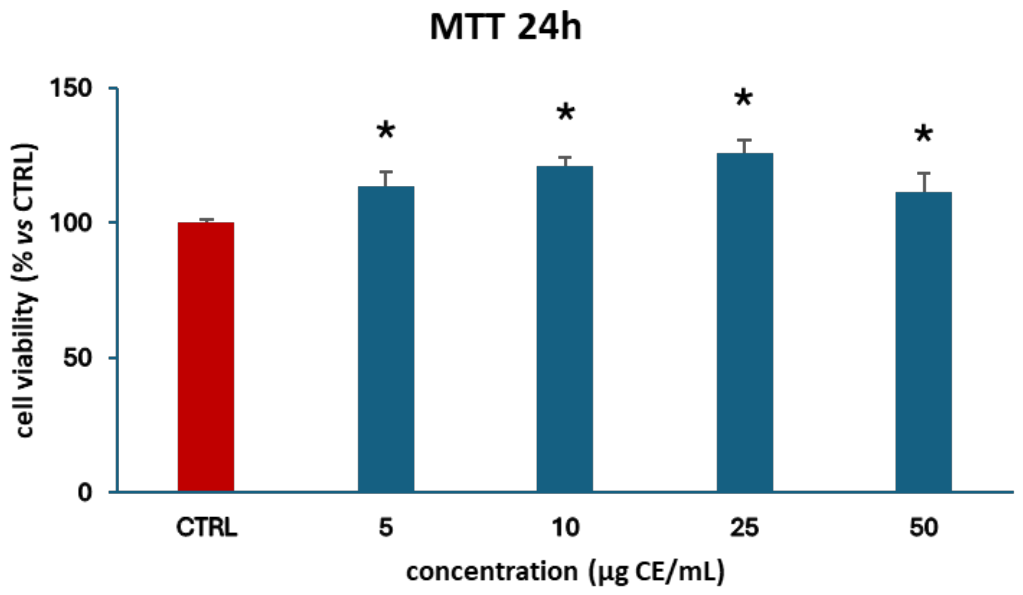
PGE safety on RAW 264.7 macrophages was assessed by an MTT test performed after an exposure time of 24 h to different extract concentrations (5–10–25–50 μg CE mL
−1). As evident from
Figure 7, none of the tested concentrations affected cell viability.
3.7.2. Anti-Inflammatory Activity on LPS-Activated RAW 264.7 Cells
PGE anti-inflammatory activity was evaluated by measuring the release of
•NO in RAW 264.7 cells activated with LPS (1 μg mL
−1) for 18 h, following a pre-treatment with different extract concentrations (5–10–25–50 μg CE mL
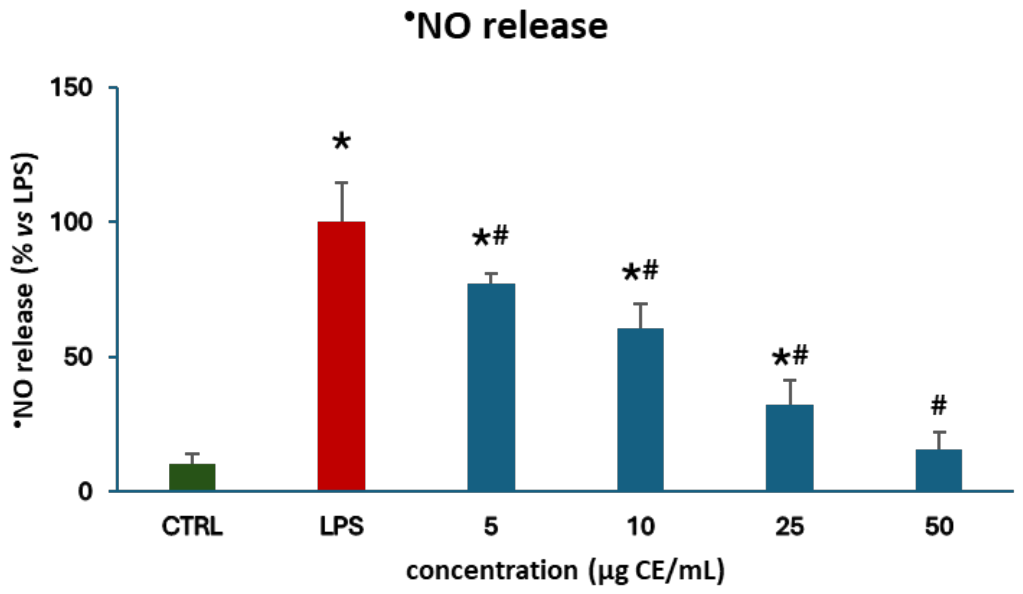
−1) for 6 h. Results, presented in
Figure 8, showed marked anti-inflammatory activity of PGE, with a dose-dependent reduction of
•NO release, consisting of 77.3% (5 μg CE mL
−1;
p = 0.0158), 60.7% (10 μg CE mL
−1;
p < 0.0001), 32.2% (25 μg CE mL
−1;
p < 0.0001), and 15.8% (50 μg CE mL
−1;
p < 0.0001) of
•NO released vs. the LPS-activated group. Moreover, the highest concentration (50 μg CE mL
−1) led to a complete recovery from LPS stress, as the %
•NO release did not differ statistically from the untreated control group (
p = 0.944).
3.7.3. ROS Quantification on LPS-Activated RAW 264.7 Cells
Potential antioxidant activity of PGE possibly linked with the found anti-inflammatory properties was evaluated by applying the same experimental model and measuring intracellular ROS production by the DCFH-DA method. Although the extract showed a strong radical scavenger and antioxidant activity in in vitro cell-free models, the results, reported in
Figure 7, showed no significant activity of the extract in reducing ROS production in LPS-activated macrophages except for the highest concentration of 50 µg CE mL
−1 (
Figure 9).
4. Discussion
The present study was designed to address a central limitation in the development of botanical ingredients: the difficulty of translating a chemically complex and naturally variable plant matrix into a reproducible, analytically defined, and biologically active botanical ingredient.
P. guajava leaves provide a valuable source of phytochemicals, particularly flavonoid glycosides, which have been associated with several biological activities [
27,
28]. Previous studies have mainly addressed individual aspects of
P. guajava valorisation, including phytochemical characterisation, biological evaluation, or optimisation of extraction efficiency. In particular, intensified extraction strategies, such as ultrasound-assisted extraction using hydro-organic solvents, have recently been shown to enhance the recovery of phytoconstituents from
P. guajava leaves [
18]. However, these approaches have generally focused on the extraction step itself, without integrating subsequent marker-oriented standardisation, selective enrichment, formulation, and biological validation into a single workflow. The present work was therefore conceived to bridge this gap by combining a simple aqueous extraction process, design of experiments (DoE)-based process optimisation, marker-oriented HPLC-DAD characterisation, macroporous resin enrichment, and biological validation within a single sequential workflow. The main contribution of this study lies not in any single methodological step, but in the integration of these steps into a strategy aimed at obtaining a chemically controlled and functionally characterised
P. guajava leaf ingredient.
The preliminary hydroalcoholic extraction confirmed the presence of hyperoside, guaijaverin, avicularin, and related derivatives, supporting the suitability of these compounds as analytical markers for the selected plant material [
29]. This is consistent with previous phytochemical investigations describing guava leaves as a rich source of quercetin-derived flavonol glycosides and other phenolic compounds [
6,
9,
30,
31]. From a quality-control perspective, the choice of individual flavonoid markers is particularly relevant. Total polyphenol and total flavonoid assays provide useful screening information, but they cannot fully describe the compositional identity of a botanical extract [
32]. Conversely, HPLC-DAD quantification of characteristic compounds enables a more robust definition of the extract. It provides a practical basis for monitoring the efficiency of extraction, enrichment, and drying steps. This approach is in line with current quality-control strategies for botanical products, where chromatographic fingerprints and selected marker compounds are increasingly used to support batch-to-batch consistency [
10,
12].
The DoE-based extraction study revealed that temperature was the most influential process parameter on the recovery of phenolic and flavonoid compounds. In contrast, extraction time had a minor effect within the tested range. This result is in line with the principles of extractive chemistry as applied to plant matrices. Increased temperature positively affects solvent diffusivity and viscosity, accelerating cell permeability by altering cell wall structures and thereby increasing metabolite mass transfer [
33,
34]. In addition, a short extraction time at controlled high temperatures can limit unnecessary thermal exposure and degradation, thereby reducing processing time. The use of water as the extraction solvent also offers sustainability benefits in line with green extraction principles [
35,
36]. The optimised aqueous extraction method therefore achieves a balance between extraction efficiency, operational simplicity, and suitability for food-grade or nutraceutical applications.
An important element of the proposed workflow is the transition from a crude aqueous extract to a flavonoid-enriched fraction using a macroporous adsorption resin. The comparative screening showed that Resin B exhibited a more favourable adsorption/desorption behaviour than Resin A, with faster uptake of the target compounds and higher cumulative recovery. The performance of Resin B may be explained by a better affinity between the physicochemical properties of the resin and those of the selected flavonoid glycosides. The adsorption process in macroporous resins is generally guided by a combination of various factors, including hydrophobic interactions, π–π interactions, hydrogen bonding, pore accessibility, and the balance between molecular polarity and resin surface chemistry [
37,
38].
The different recoveries observed among the target flavonoids, specifically the lower recovery of hyperoside compared with avicularin and guaijaverin, may reflect differences in sugar moiety, polarity, spatial arrangement, and binding/desorption strength [
39]. This result indicates that the enrichment process is not merely quantitative but also selective, and that the resin can significantly influence the extract’s final phytochemical profile [
40]. However, based on the comparative resin screening, hyperoside recovery could be improved by implementing a two-column enrichment strategy rather than a single-column process. In this configuration, the fraction of hyperoside not adsorbed in the first column could pass through a second resin bed, where the lower concentration of competing phytochemicals may favour its retention and recovery. This strategy may therefore enhance the recovery of hyperoside while preserving the selective enrichment of avicularin and guaijaverin.
The chromatographic comparison between the crude and enriched extracts showed that the resin-based process increased the relative abundance of the selected markers without introducing evident qualitative changes in the HPLC-DAD fingerprint. This is an important outcome for the development of standardised botanical ingredients. Unlike purification strategies directed at isolating single compounds, the process preserved the phytochemical identity of the native leaf extract while concentrating a defined flavonoid fraction. Such an approach is particularly suitable for botanicals, where the biological activity may depend not only on individual constituents but also on additive or synergistic interactions among coexisting metabolites [
5]. In this sense, the enriched extract can be considered a refined phytocomplex rather than a purified single-molecule preparation.
The use of the enriched extract in maltodextrin further enhances the technological relevance of the proposed process. Liquid or semi-solid botanical extracts are often difficult to handle, dose, store, and incorporate into final formulations [
41].
The conversion of the enriched fraction into a homogeneous powder improves practical applicability and supports future development into oral solid dosage forms, functional ingredients, or nutraceutical formulations. Although the addition of a carrier inevitably dilutes the concentration of the active fraction, the final PGE retained a defined flavonoid content and preserved the characteristic chromatographic profile of
P. guajava. This confirms that the drying conditions and the selected carrier did not substantially alter the targeted phytochemical composition. Future stability studies under accelerated and long-term storage conditions will be necessary to confirm the suitability of this formulation strategy over time [
14].
The biological findings demonstrate the functional significance of phytochemical enrichment. PGE exhibited pronounced antioxidant activity in cell-free assays. The substantial activity observed against DPPH
•, superoxide anion, and hydrogen peroxide aligns with the presence of flavonol glycosides, whose phenolic hydroxyl groups facilitate electron or hydrogen transfer reactions and contribute to the neutralisation of reactive species [
42]. Nevertheless, the interpretation of these results should extend beyond direct chemical scavenging. In complex extracts such as PGE, the antioxidant activity may result from the collective action of multiple phenolic constituents, including minor compounds that were not individually quantified in this study [
43].
No significant cytotoxicity was observed in RAW 264.7 cells following PGE treatment at the tested concentrations, supporting the suitability of these concentrations for the subsequent biological assays. Macrophages are strongly activated by LPS stimulation, which induces
•NO production by upregulating inducible nitric oxide synthase (iNOS) [
44]. In this experimental model,
•NO release levels serve as a marker of inflammatory activation. Results clearly showed that PGE reduced
•NO production in a dose-dependent manner, restoring values close to those of unstimulated control cells at the highest concentration. These findings are consistent with previous studies demonstrating that guava leaf extracts and guava flavonoid fractions attenuate LPS-induced inflammatory responses by reducing nitric oxide production and modulating iNOS, COX-2, NF-κB, and MAPK-related pathways [
45,
46,
47]. The presence of avicularin in the enriched extract is particularly relevant, since this flavonoid has been reported to inhibit LPS-induced
•NO and PGE production in RAW 264.7 macrophages through suppression of ERK phosphorylation [
46,
48].
Interestingly, the intracellular ROS assay showed a significant reduction only at the highest tested concentration. This apparent discrepancy with the results obtained in in vitro cell-free systems can be explained by considering the different reactive species involved in inflammation-related oxidative stress, such as peroxynitrite (ONOO
−), a highly reactive oxidant nitrogen species (RNS) [
49], which has not been tested in our models. Also, the diverse redox environment between cellular and acellular models must be taken into account. In fact, LPS-activated macrophages have been found to increase their labile iron pool [
50]. High levels of labile transition metals may promote the pro-oxidant activity of certain polyphenols, potentially counterbalancing their reactive species-scavenging properties [
51,
52]. Moreover, reduced bioavailability of certain components in our in vitro model cannot be excluded, influencing the exerted antioxidant activity of PGE. Overall, this result suggests that a generalised intracellular ROS-scavenging activity across all concentrations cannot explain the anti-inflammatory effect of PGE. Rather, the reduction of
•NO may involve more specific modulation of inflammatory signalling pathways, including iNOS expression, NF-κB activation, or MAPK phosphorylation. This interpretation is coherent with the literature on flavonoid-rich guava extracts and avicularin [
45,
46,
53]. However, these effects remain to be experimentally confirmed in the present model.



 ,
,