Article

Applicability of HR-ICP-OES in the Pharmacopoeial Assessment of the Uniformity of Elemental Dosages in Food Products for Medical Use


Department of Analytical Chemistry, Medical University of Lublin, 20-093 Lublin, Poland
*
Author to whom correspondence should be addressed.
Appl. Sci. 2026, 16(17), 8715; https://doi.org/10.3390/app16178715
Submission received: 2 July 2026 / Revised: 26 August 2026 / Accepted: 29 August 2026 / Published: 2 September 2026

Abstract

Unlike medicinal products (MPs), dietary supplements (DSs), foods for special medical purposes (FSMPs) and fortified foods (FFs) available on the Polish market are not required to meet pharmacopoeial quality standards. Dose uniformity testing, a pharmacopoeial requirement for MPs, confirms both the accuracy of the declared dose and consistency between individual doses. As consumption of DSs, FSMPs, and FFs continues to increase, particularly among vulnerable populations, ensuring consistent intake of essential nutrients becomes increasingly important. Therefore, adapting pharmacopoeial dose uniformity criteria to elemental analysis may provide an additional quality assessment tool beyond the percentage of the label claim. Accordingly, this study aimed to (1) validate a multi-element High-Resolution Inductively Coupled Plasma Optical Emission Spectrometry (HR-ICP-OES) method for assessing dose uniformity and (2) evaluate the uniformity of elemental doses in one DS and four FSMPs according to pharmacopoeial guidelines, with MPs included as reference materials. To achieve this, the key parameters of the HR-ICP-OES measurement methodology were defined to ensure reliable results, and the uniformity of the doses of the seven preparations was determined by establishing a pharmacopoeial acceptance value. Although HR-ICP-OES is useful for multi-element analysis of products, limitations have been identified relating to chemical and spectral interference, and to the analysis of selenium at low levels. Of the DSs and FSMPs analysed, none complied with the pharmacopoeial requirements for uniformity.

1. Introduction

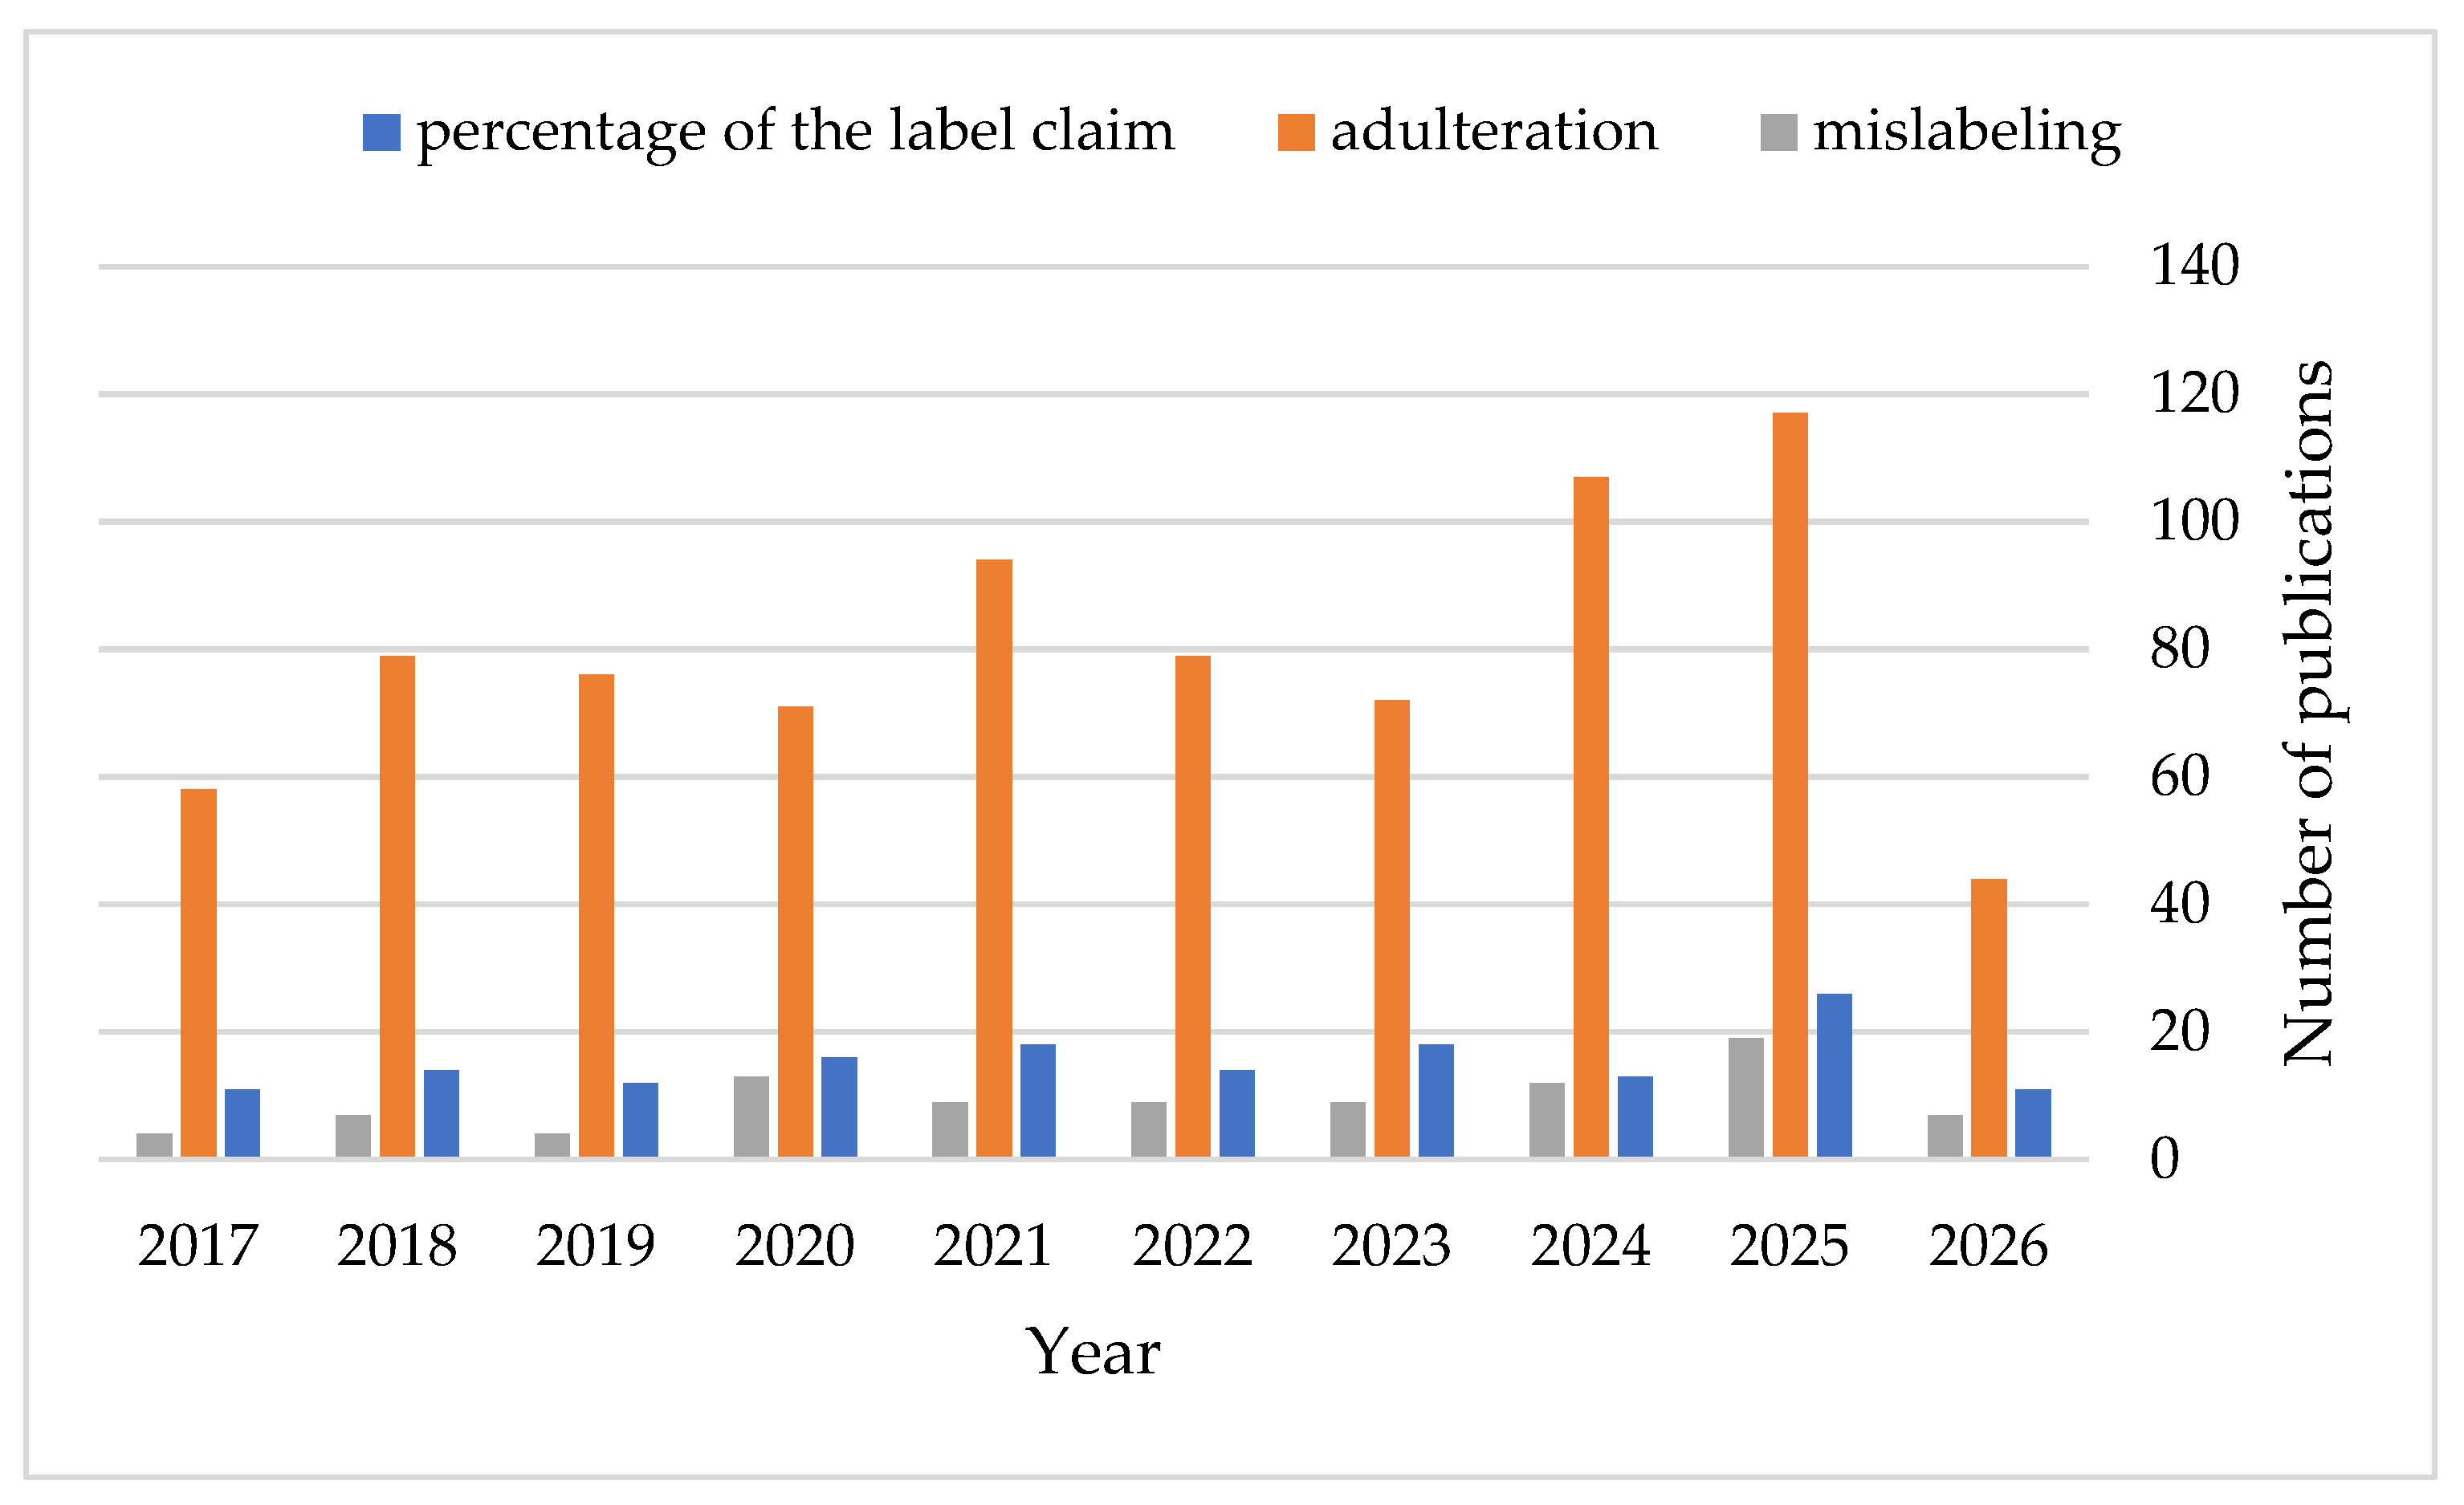
There are many food products on the Polish market that do not qualify as medicinal products (MPs) in the pharmacopoeial sense [1,2]. These include, among others, dietary supplements (DSs), foods for special medical purposes (FSMPs) and fortified foods (FFs) [3]. The market for such health-promoting products is constantly expanding, providing consumers with an increasing variety of options [3]. Unlike MPs, these products are not required to comply with pharmacopoeial quality standards or similarly stringent regulatory requirements [2]. Therefore, consumers are interested in the safety of these products and whether the quantities of substances declared match the actual amounts present [4,5]. This is confirmed by the growing number of publications on the percentage of the label claim, the presence of toxic compounds and elements, product adulteration, and mislabelling over the past ten years (Figure 1). The largest number of publications concerns the potential toxicity of these products—over 6800 have been published over the past ten years. The search queries used to retrieve the data for Figure 1 are provided in the Supplementary Materials.
The publications most relevant to the topic of this paper are those focusing on elemental analysis. A range of different analytical techniques are applied for this purpose: Inductively Coupled Plasma Optical Emission Spectrometry (ICP-OES) [6,7], Microwave Induced Plasma Optical Emission Spectrometry (MIP-OES) [8], Inductively Coupled Plasma Mass Spectrometry (ICP-MS) [9,10,11,12,13,14,15,16], Atomic Absorption Spectrometry (AAS) [7,8,17,18,19,20,21,22,23,24], X-ray Fluorescence Spectrometry (XRF) [25], Ion Chromatography and Ion-Selective Electrode potentiometry (IC-ISE) [26]. In addition to analyses of micro and macronutrients, some of the studies also present results relating to analyses of toxic elements [8,9,10,11,12,13,14,15]. However, only the selected manuscripts, as listed in Table S1, additionally present the percentage of the label claim [6,7,17,18,21,22,24,25,26,27].
The data presented in Table S1 and Figure 1 reveal that numerous studies have investigated the presence of toxic compounds and elements, product adulteration, and mislabelling, while also reporting the percentage of the label claim. Some of the studies also describe the consistency between the levels of measured and reference daily intake (RDI), compare them against old and new guidelines, and assess exposure to heavy metals resulting from consumption [28,29]. Setting this aside, it is important to note that, in order for a food product intended for medical purposes to have the desired effect (e.g., supplementing the diet or supporting treatment), it is essential to ensure not only an appropriate percentage of the label claim and compliance with the RDI or other guidelines, but also uniform dosages [2,30]. The uniformity of dosage units is a quality requirement for (MPs) that ensures that each unit contains an active pharmaceutical ingredient (API) in an amount that deviates only slightly from the declared dose [31]. It is worth noting that compliance with the uniformity-of-dosage-units requirement does not simply mean that the API content of each dosage unit falls, for example, within the range of 85–115% of the declared amount. A MP may still fail to meet the pharmacopoeial acceptance criteria because the variation between individual dosage units is sufficiently large. Therefore, in addition to the API content matching the declared dose, it is also important that this content is consistent across all doses [31]. This is essential for ensuring predictable drug exposure and maintaining plasma concentrations within the therapeutic window during treatment. For this reason, pharmacopoeias require MPs to undergo uniform dose testing, ensuring that the quantity of the active ingredient matches the declared amount and is consistent across doses [31,32], whereas such testing is not routinely required for DSs or FSMPs [2].
At the same time, consumer interest in these products is constantly growing, particularly in products intended for populations with specific nutritional needs, such as older adults, individuals with chronic illnesses, newborns, and infants [3]. Consuming the recommended doses of these products with a uniform content of active substances ensures a consistent intake of nutrients that support treatment or dietary management [30,33]. Adapting the pharmacopoeial uniformity of dosage units test may provide an additional quality assessment tool to complement conventional percentage-of-the-label-claim testing [30,33].
Only four studies assessing the uniformity of dosage units have been identified in the literature over the past ten years, and none were published before 2021. They relate to the levels of melatonin [34], isoflavones [35], polyphenols [36] and raspberry ketone [37] in DSs. Considering the increasing consumption of these products, the limited consumer awareness regarding the products used, and the focus of scientific publications on reporting the percentage of the label claim, mislabelling, adulteration, or toxicity, this study addresses a gap in the literature.
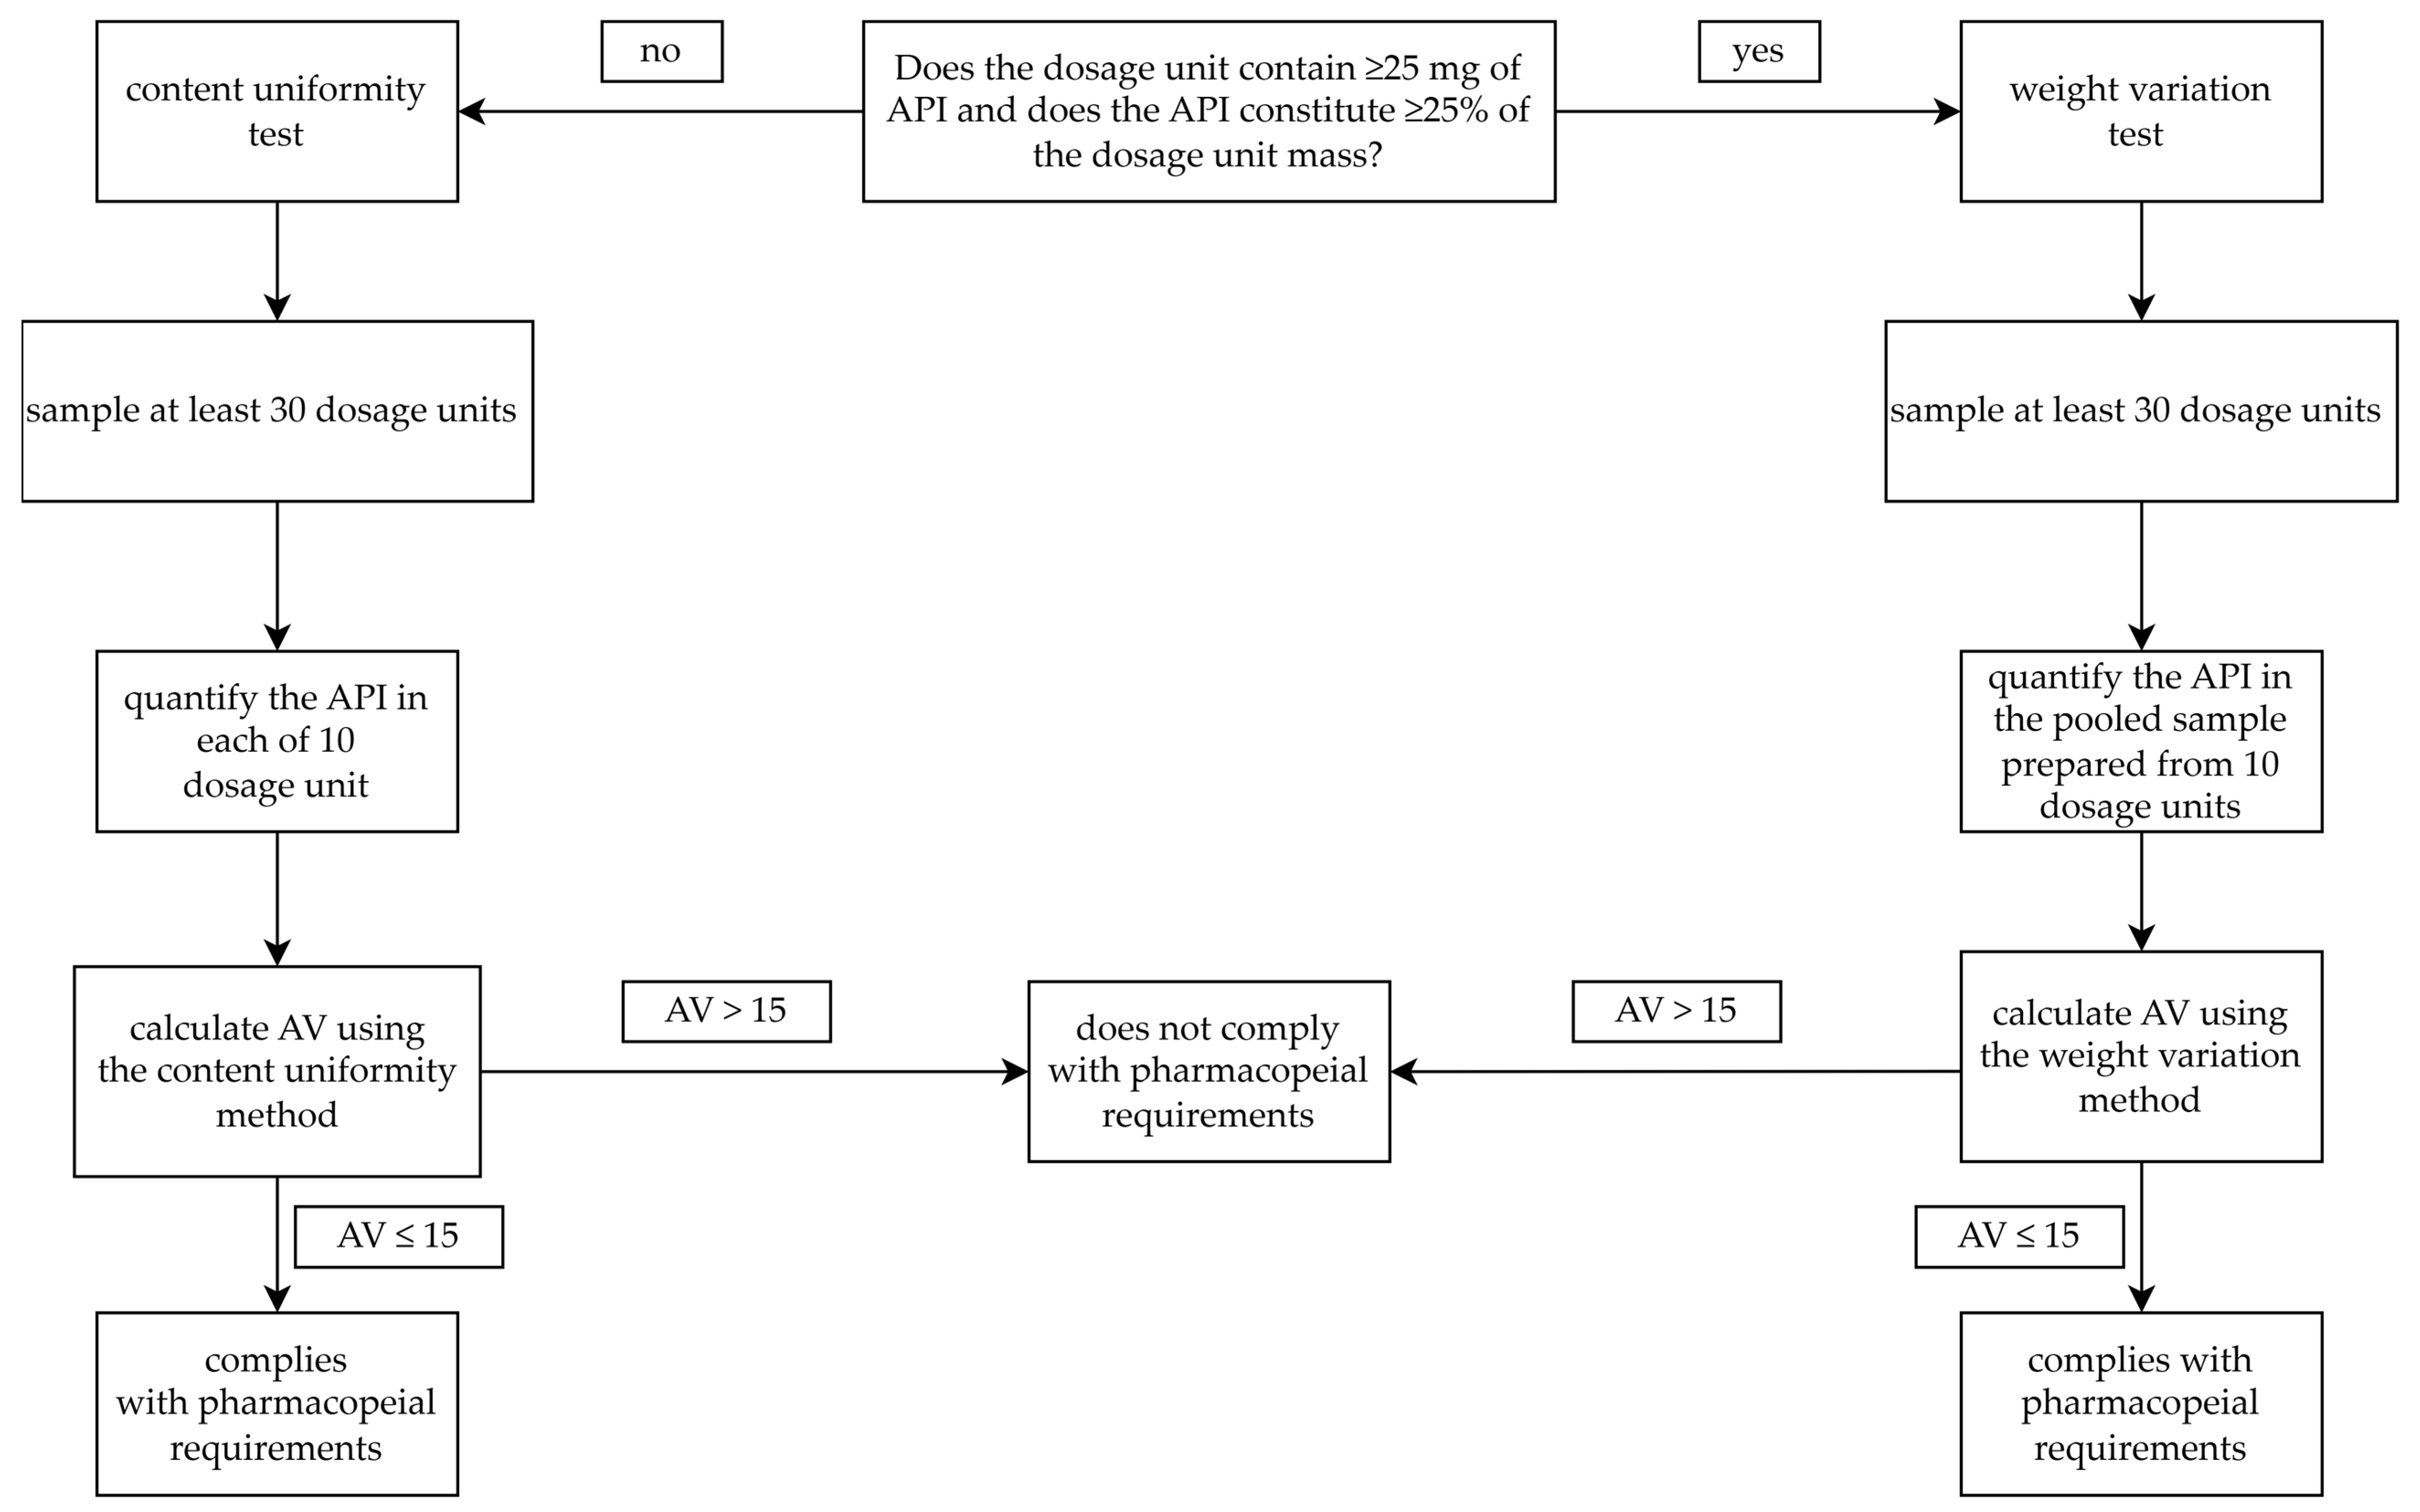
One of the aims of this study was to assess the uniformity of dosages in accordance with pharmacopoeial guidelines for DSs and FSMPs [31]. According to general chapter 2.9.40 of the European Pharmacopoeia, the uniformity of dosage units can be assessed using either the content uniformity or the weight variation test [31,32] (Figure 2).
The weight variation test applies to the following dosage forms:
  • solutions in single-dose containers (or soft capsules),
  • solid dosage forms in single-dose containers,
  • hard capsules, uncoated or coated tablets containing at least 25 mg of API constituting at least 25% of the dosage unit’s weight [31].
It is important to note that the weight variation test assumes uniformity of the API content relative to the mass of the dosage units [31]. The content uniformity test is required in cases that do not meet the conditions specified above and is therefore more broadly applicable [31]. Accordingly, the content uniformity approach was used in this study. Although both testing methods involve sampling at least 30 dosage units and quantifying the API in 10 of them, there are important differences between the two procedures [31]. In the content uniformity test, the amount of API in each of the ten dosage units is quantified individually [31]. The mean content, expressed as a percentage of the declared dose ( X ¯ ), and the standard deviation (s) are then calculated [31]. The Acceptance Value (AV) is subsequently calculated based on these parameters [31]. The detailed procedure for calculating the AV for the content uniformity test is presented in the Materials and Methods Section. In the weight variation test, the total API content (A) of 10 dosage units is determined [31]. The API content of each dosage unit (xi) is then calculated based on the mean weight of the dosage units ( W ¯ ) and the mass of each individual dosage unit (wi), according to Equation (1) [31]:
x i =   w i   ·   A W ¯
The X ¯ and s values are calculated based on the ten xi values obtained. The AV is then calculated in the same way as for the content uniformity test. In both cases, if the calculated AV does not exceed the L1 acceptance limit (15), the product is considered to meet the requirements [31]. Otherwise, a further 20 dosage units must be analysed [31]. However, the conformity assessment becomes more complex at this stage.
The primary objective of this study was to examine the uniformity of the dosages of Cr, Cu, Fe, K, Mg, Mn, Mo, Na, P, Se and Zn in five preparations, including one DS and four FSMPs.
The Pharmacopoeia clearly states that an appropriate analytical method must be employed to assess the content of active ingredients in dosage units [31]. Therefore, another objective of this study was to determine the suitability of High-Resolution Inductively Coupled Plasma Optical Emission Spectrometry (HR-ICP-OES) for the elemental analysis of both macro- and microelements in the investigated products. In contrast to conventional simultaneous ICP-OES, measurement by HR-ICP-OES is sequential, which provides better resolution of the analytes’ signals [38,39]. To date, the literature has demonstrated a certain analytical advantage of high-resolution instruments in the analysis of Pu, where the standard resolution of conventional instruments (10–20 pm) is insufficient [40]. This advantage has also been demonstrated for the analysis of Pu in the presence of large concentrations of U, where high resolution allowed the issue of spectral interference to be resolved [41]. A further example is the determination of Nd using HR-ICP-OES, whereas the conventional ICP-MS method required prior HPLC separation due to strong interference [38]. It is worth noting that the HR-ICP-OES results were comparable with those obtained using sector field ICP-MS [38]. HR-ICP-OES has also been applied to the analysis of Zn, Cd, Cr and U in environmental samples with high concentrations of Fe in the matrix [39]. In this case, the authors emphasised that spectral interference and background noise were significantly lower for the HR spectrometer than for medium-resolution ICP-OES [39]. At the same time, they concluded that conventional ICP-OES would be unsuitable for the analysis of Zn, Cd, Cr and U in iron-rich environmental samples [39].
Literature reports confirm that high resolution reduces spectral interference, though not entirely, and certainly does not imply that the method is suitable or yields reliable results [39]. Therefore, this study focuses on determining the selectivity, repeatability, trueness, measurement ranges, and detection and quantification limits (including their verification) of this technique in the analysis of Ca, Cr, Cu, Fe, K, Mg, Mn, Mo, P, Se, and Zn in powdered DS and FSMPs. Two MPs containing Mg and Fe were also analysed as reference products.

2. Materials and Methods

2.1. Analysed Products

A total of seven products were selected for analysis: one DS, containing Ca, Cr, Cu, Fe, K, Mg, Mn, Mo, P, Se, and Zn; four products registered as FSMPs (FSMP 1–4), containing Ca, Cr, Cu, Fe, K, Mg, Mn, Mo, Na, P, Se, and Zn; and two MPs, one containing Mg (MP Mg) and the other containing Fe (MP Fe). FSMPs 1–3 were different flavour variants of the same product with identical elemental compositions, whereas FSMP 4 had a different elemental composition. As all products were in powder form, the pharmacopoeial weight variation method was not applicable. Therefore, the uniformity of dosage units was assessed using the content uniformity method. Of the four FSMPs, three were different flavour variants of a product with the same composition, while the fourth had a different composition. All FSMPs were manufactured by a single manufacturer and are among the most popular dietary management products for patients with specific nutritional needs arising from a disease, disorder or medical condition. They are available in Polish pharmacies. In contrast, the DS was manufactured by a different manufacturer. It is a meal replacement designed primarily to aid weight management and encourage healthy eating habits in healthy individuals. It is available for purchase online. All analysed FSMPs, the DS, and the MPs originated from different production batches (lot numbers) and were analysed before their expiration dates. In accordance with the procedure described in the European Pharmacopoeia, the amounts of each element in ten independently prepared samples of each product were determined [31].

2.2. Sample Digestion

A comprehensive analysis was conducted on five distinct products, including one DS and four FSMPs, three of which shared identical elemental compositions and differed only in flavour. Approximately 0.5 g of each sample (n = 10) was weighed into a DigiTube (SCP SCIENCEBaie-D’Urfé, QC, Canada), pre-moistened with water, and subsequently mixed with 5 mL of 65% HNO3 Supapur® (Merck, Darmstadt, Germany) and 2 mL of 36% HCl Supapur® (Merck). The tube was then capped and placed in a DigiPREP heating block (SCP SCIENCE) at 120 °C for 120 min. Subsequently, 200 µL of a 100 mg/L Y solution (SCP SCIENCE) was added to each sample as an internal standard, followed by filtration and dilution to 50 mL with deionised water. Samples of MPs containing Mg and Fe in tablet form and the matrix-certified reference material, skimmed milk powder ERM-BD151 (European Commission, Joint Research Centre, Geel, Belgium), were prepared using the same procedure.

2.3. HR-ICP-OES Analysis Conditions

All measurements were carried out using a PlasmaQuant PQ 9000 Elite HR-ICP-OES (Analytik Jena, Jena, Germany) equipped with ASpect PQ software (version 1.2.3.0). The analytical emission lines used for element determination were as follows: Y 371.030 nm (internal standard), Se 196.028 nm, Mo 202.030 nm, Cr 205.552 nm, Zn 206.200 nm, P 213.618 nm, Mn 257.610 nm, Fe 259.940 nm, Cr 267.716 nm, Mg 285.213 nm, Ca 315.887 nm, Cu 327.396 nm, Na 589.592 nm, and K 766.491 nm. The signal integration time was set to 3 s for all elements, except selenium, for which it was 6 s. The instrumental operating conditions were as follows: RF power 1300 W, plasma gas flow 12.0 L/min, auxiliary gas flow 0.50 L/min, and nebuliser gas flow 0.60 L/min. Mg and Ca signals were acquired in attenuated axial mode, Na and K in radial mode, while all other elements were measured in axial mode. Measurements were performed in triplicate for each sample, and outliers were evaluated using the Grubbs test (α = 0.05).
Internal standard calibration was carried out using a reagent blank and five calibration standards prepared by appropriate dilution of stock solutions with concentrations of 50,000 mg/L (Mg, Ca, Na, and K) and 1000 mg/L (all other elements) (SCP SCIENCE).

2.4. Acceptance Value Calculation

The AV was calculated in accordance with the pharmacopoeia based on Equation (2):
AV = | M X ¯ | + k · s
where:
  • AV—acceptance value
  • X ¯ —mean content expressed as a percentage of the label claim [%]
  • k—acceptance constant (for 10 samples k = 2.4)
  • s—standard deviation of the individual contents expressed as a percentage of the label claim [%]
  • M—reference value
Depending on the value of X ¯ , the value of M is defined as follows: if 98.5% ≤ X ¯ ≤ 101.5%, then M = X ¯  (AV = ks); if X ¯ ≤ 98.5%, then M = 98.5% (AV = 98.5 − X ¯ + ks); if X ¯ > 101.5%, then M = 101.5% (AV = X ¯ − 101.5 + ks). Products with an AV value of less than 15 are considered to meet the dosage uniformity requirements. According to the European Pharmacopoeia, the AV value is dimensionless [31].

3. Results

3.1. HR-ICP-OES Method Validation

The selection of appropriate wavelengths for elemental analysis requires consideration of two fundamental factors: the analytical sensitivity of the emission line and potential matrix-induced spectral interferences. The background equivalent concentration (BEC) was used as a criterion for evaluating the suitability of analytical lines. Potential spectral interferences were identified using the NIST Atomic Spectra Database Lines. Wavelengths corresponding to the lowest BEC values were selected, and a spectral window of ±0.1 nm around each wavelength was subsequently evaluated using the NIST database. Potential spectral interferents were identified based on the emission line type (atomic and ionic, denoted as I and II, respectively), the sample matrix composition, and their relative intensities. Results are presented in Table 1.
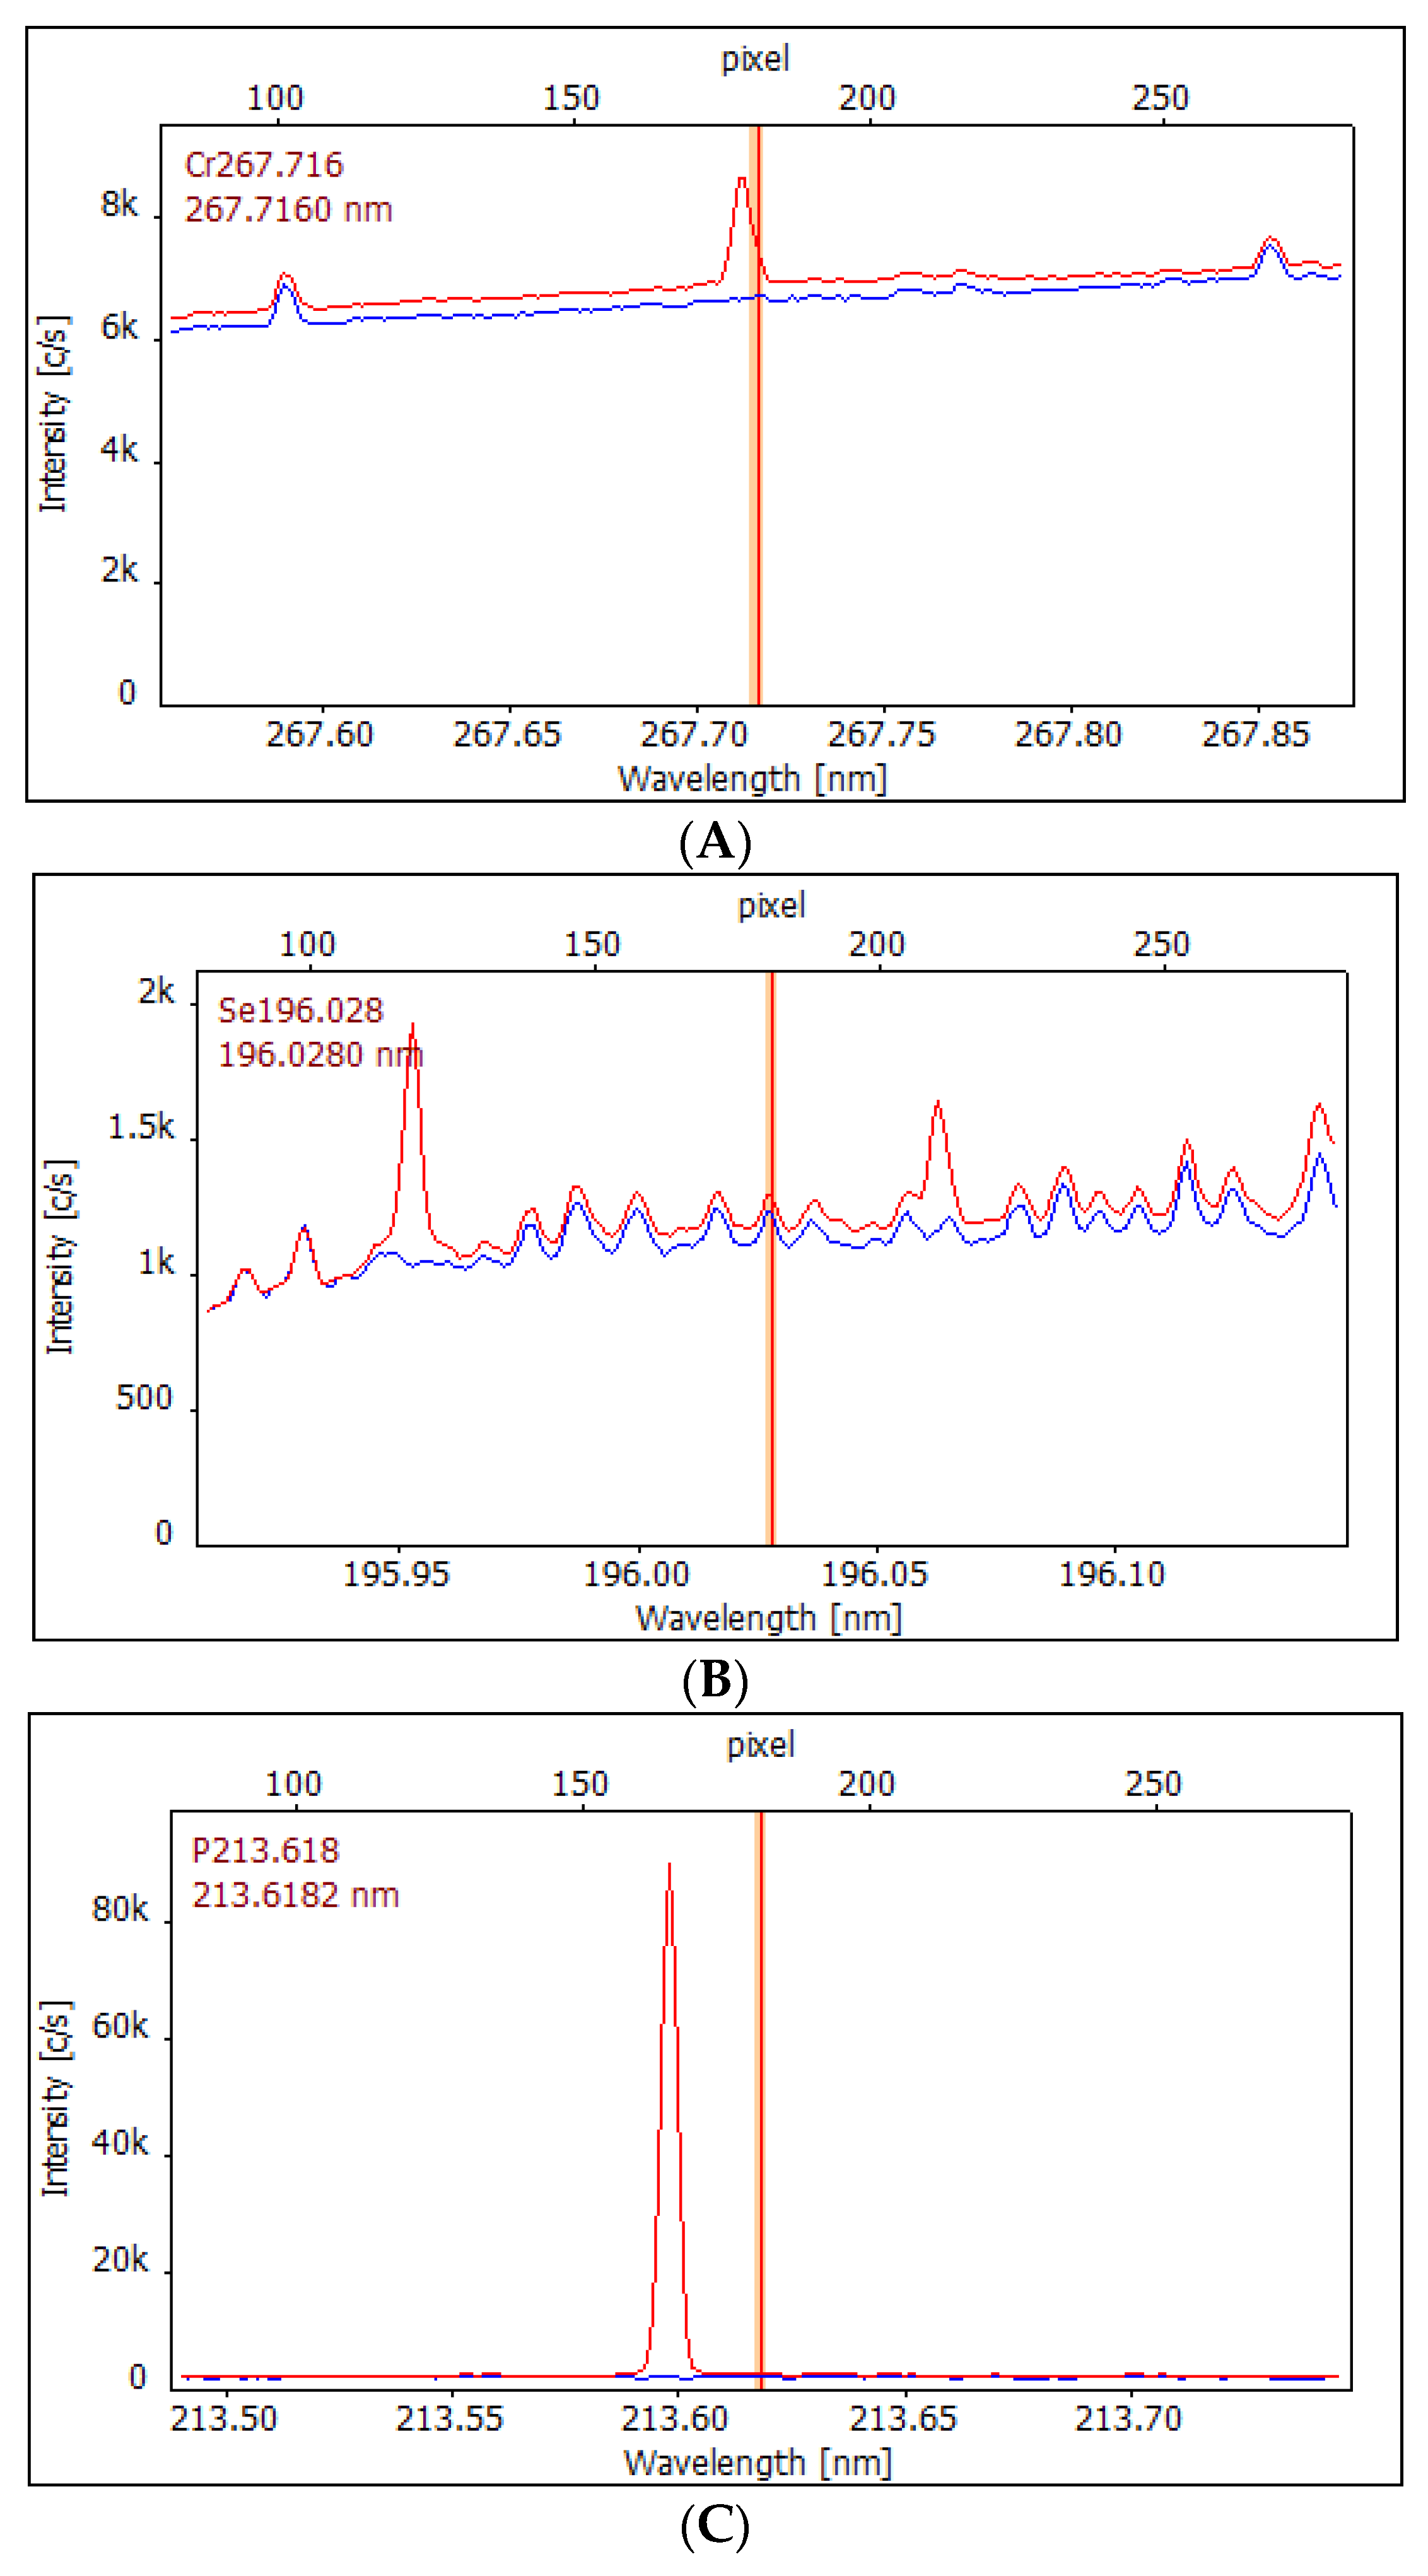
For Na 589.592 nm and K 766.491 nm, no significant spectral interferences were identified. To assess the potential influence of individual interferents, solutions containing the interferent at its highest concentration, corresponding to the highest point of the calibration curve, were measured at the selected analytical wavelengths. Considering the difference between the analytical wavelength and that of the potential interferent, the three most critical combinations were Cr 267.716 nm–P 267.711 nm, Se 196.028 nm–Fe 196.0141 nm, and P 213.618 nm–Cu 213.5981 nm. The recorded spectra are shown in Figure 3.
According to Figure 3, the determination of chromium at 267.716 nm in the analysed samples would be subject to significant spectral interference from the sample matrix, leading to an overestimation of the results. Therefore, chromium was determined at 205.552 nm. At the same time, potential interference from iron at the analytical wavelength of selenium was not detectable, while interference from copper at the analytical wavelength of phosphorus was sufficiently separated from the analyte signal. In addition, it should be noted that the copper content in the analysed products was three orders of magnitude lower than that of phosphorus (µg/g vs. mg/g). The other potential spectral interferences listed in Table 1 were sufficiently separated from the analyte signal integration regions. Potential interferences from carbon and oxygen (digestion matrix) or argon (plasma source) were excluded based on the analysis of blank samples from the digestion process. Differences in viscosity between the calibration solutions and the samples after digestion, as well as chemical interferences caused by easily ionisable matrix components (sodium, potassium, and calcium), were compensated for by the use of an internal standard. These effects were significant, with the recovery of the internal standard averaging 90.32%, ranging from 76.19% to 95.89% across all analysed samples. The upper measurement range was set to cover the concentrations of the analytes in the samples after digestion. At the same time, the following observations indicated the necessity of applying an appropriate weighted regression model:
  • significant heteroscedasticity of the analytical response,
  • unacceptable results for the blank samples, which biased the results at low concentrations,
  • excessively wide relative confidence intervals at low concentrations,
  • statistically significant results of the lack-of-fit test for the linear models.
The application of weighted regression eliminated the statistical significance of the lack-of-fit test and reduced the relative confidence intervals at low concentrations. It also stabilised the blank sample responses at a level that was not significantly different from zero. The lower and upper measurement ranges were verified by estimating the combined standard uncertainty based on measurements performed under intermediate precision conditions, in accordance with the procedure described in a previous publication [42]. The results were considered reliable when the combined standard uncertainty, calculated using Equation (3), was below 10%.
u c = | δ x | 2 + C V 2
where:
  • δ x —relative error [%]
  •   CV —intermediate precision expressed as coefficient of variation [%]
The detailed data used for the uc calculations are presented in Table S2. The data on measurement ranges and regression are presented in Table 2.
The accuracy of the determined linearity was verified by analysing the multi-component standard ISO Tuning Solution A (SPC Science) at three evenly distributed points across the measurement range, using an acceptance criterion similar to that applied to the measurement ranges.
Trueness of the measurements was assessed by analysing skimmed milk powder (ERM-BD151) according to ISO Guide 33 [43]. The measured values were compared with the certified values using Equation (4):
δ x   <   2   ·   u x , % 2 +   u cert , % 2
where:
  • ∣δx∣—relative error [%],
  •   u x , % —relative standard combined uncertainty of the measurement [%],
  •   u c e r t , % —relative standard combined uncertainty of the certified value [%].
The detailed calculations for ERM-BD151 are presented in Table S3. Due to the heterogeneity of the material analysed, it was not possible to assess intermediate precision including the sampling procedure. Nevertheless, the intermediate precision of the HR-ICP-OES measurements was evaluated by repeatedly analysing selected samples after digestion; no analyte exceeded a coefficient of variation of 5%.

3.2. Evaluation of Content Uniformity in the Analysed Products

The AV values were calculated for seven distinct products, including one DS, four FSMPs (FSMP 1–4), and two MPs (MP Fe and MP Mg), based on the mean content expressed as a percentage of the label claim ( X ¯ ), standard deviation of the individual contents, expressed as a percentage of the label claim (s), according to Equation (2). For MP Mg, the following values were obtained: X ¯ = 105.1%; s = 2.509%, and AV = 9.615, while for MP Fe, X ¯ = 105.7%; s = 2.632%, and AV = 10.55. The compliance of both MPs with the pharmacopoeial AV criterion supports the applicability of the proposed HR-ICP-OES procedure for content uniformity assessment. The results for the FSMPs and DS, expressed as X ¯ and s for ten dosage units, together with the corresponding AVs, are presented in Table 3.
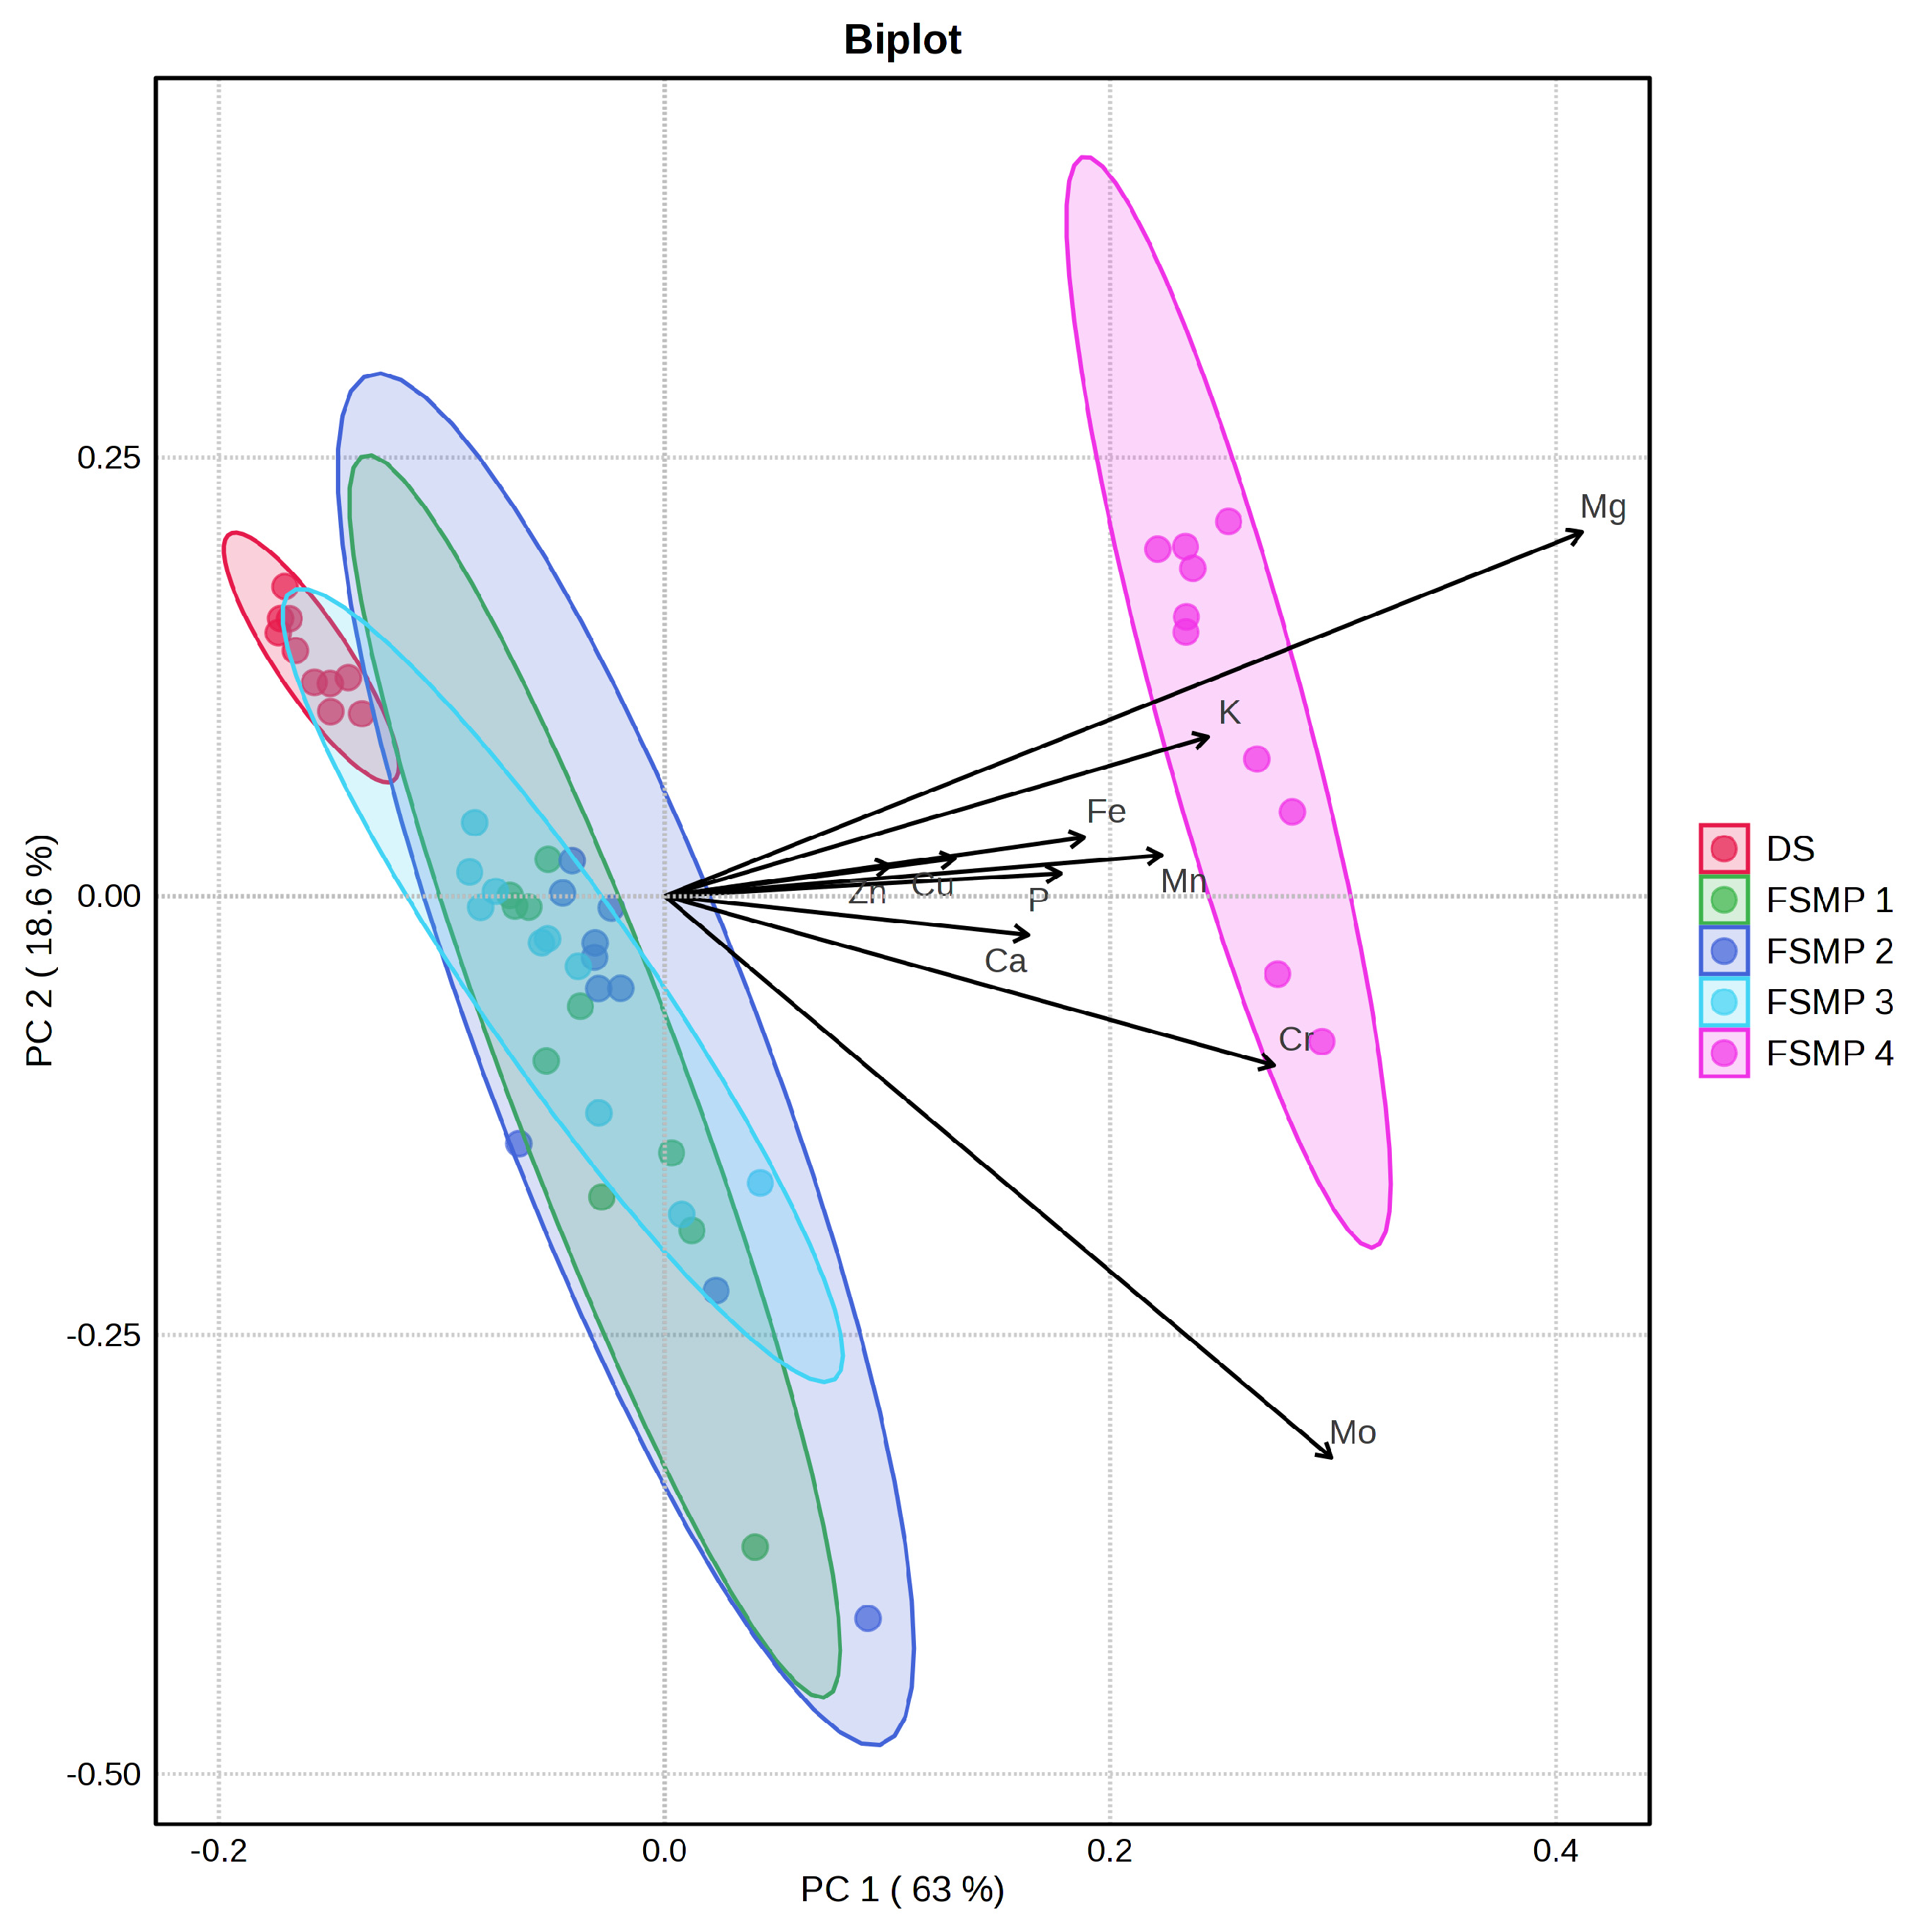
Among the analysed products, the DS exhibited the lowest AVs for most quantified elements and therefore showed the highest degree of dosage uniformity. Values above 15 (shown in bold) were observed for only five of the eleven analysed elements (Ca, Cr, Mn, Se, and Zn). At the same time, selenium levels were above the lower measurement range only in this product. In the other products, some samples had selenium levels below the measurement range, making it impossible to calculate the AV. Unacceptable results were found for the products registered as FSMPs. FSMPs 1–3 represent different flavour variants of the same product. As shown in Table 3, the AV was below 15 only for selected elements. In the case of FSMP 4, the AV exceeded 15 for every analysed element, with the measured mean contents ranging from 1.2 to 5.3 times the declared concentrations. All FSMPs were characterised by high variability in molybdenum content, as indicated by the high values of s, which may suggest limitations in the determination of this element at low concentrations. However, this is inconsistent with the high degree of uniformity observed for molybdenum in the DS. Significantly lower, but still elevated, s values were also observed for manganese in the FSMPs. At the same time, the calcium and copper contents were uniform in all FSMPs, while the elevated AV values were associated with high mean contents of these elements. For FSMPs 1–3, similar percentages of the label claim were observed for the macronutrients Ca, Fe, P, Na, and Mg. The most significant factors distinguishing the food products under analysis were identified using principal component analysis (PCA). Sodium was excluded from the analysis because no value was declared in the nutrition facts for the DS. No sample normalisation was applied prior to PCA because all variables were already expressed on the same scale, as percentages of the label claim. A log10 transformation was applied to reduce data skewness and minimise the influence of elements with markedly elevated percentages of the label claim (e.g., Mo). Finally, auto-scaling (mean-centring and division by the standard deviation) was applied to account for the wide differences in variability among the analysed elements, ensuring that each variable contributed equally to the multivariate analysis. PCA (Figure 4) revealed that FSMPs 1–3 formed similar clusters, indicating similar elemental profiles, in contrast to the DS and FSMP 4, which formed separate clusters. This confirms the highly similar compositional profiles of FSMPs 1–3 and the lack of a clear distinction between the flavour variants. Cross-validation indicated the highest predictive performance for the five-component model (Q2 ≈ 0.73), while the two-component model was retained for visualisation and interpretation. The first two principal components explained 81.6% of the total variance, indicating that differences in relative elemental concentrations and sample-to-sample variability were major contributors to product discrimination.
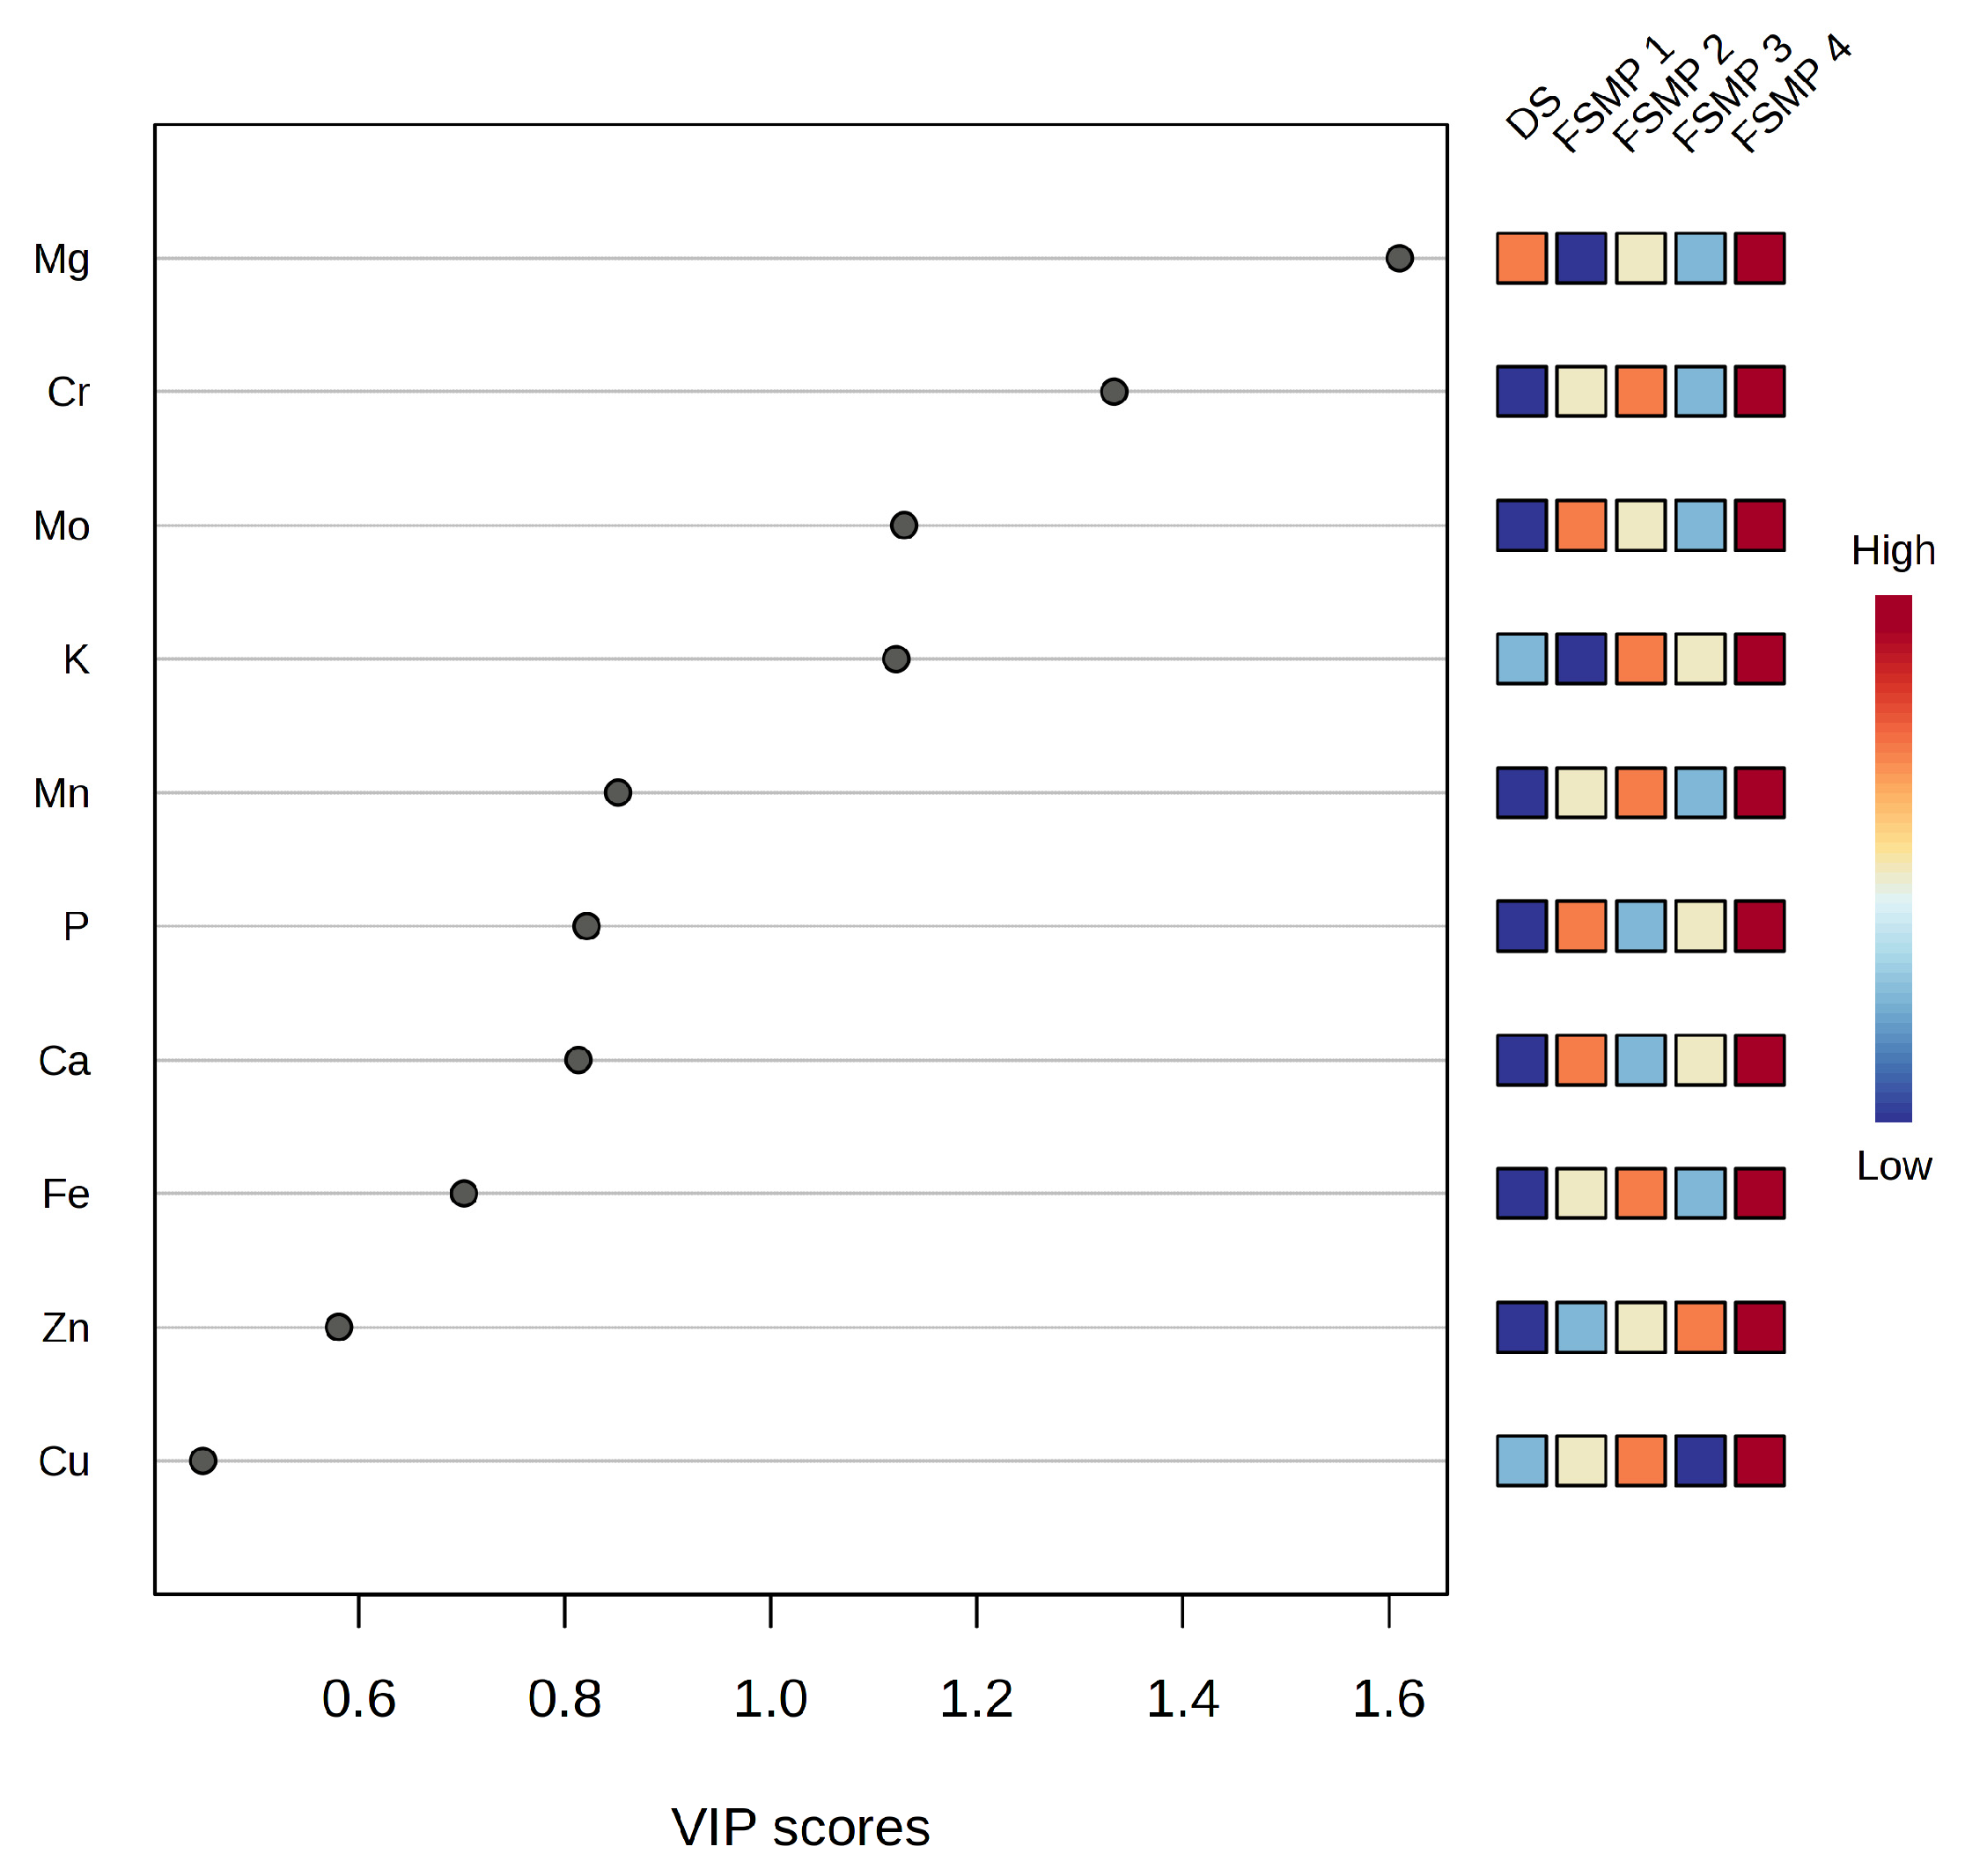
The biplot (Figure 4) and the Variable Importance in Projection (VIP) analysis (Figure 5) identified Mg (VIP = 1.60), Cr (VIP = 1.35), Mo (VIP = 1.12), and K (VIP = 1.12) as the main distinguishing components of the analysed products. At the same time, the heatmap confirms the general findings regarding elevated concentrations and substantial heterogeneity in FSMP 4, in contrast to the DS.
The Shapiro–Wilk test revealed significant deviations from normality. Therefore, group differences were assessed using the Kruskal–Wallis test (Table 4), followed by Dunn’s post hoc test with Bonferroni correction (Table S4) [44,45].
While the multivariate analysis revealed that Mg, Cr, Mo, and K were the most discriminating factors between the groups, the greatest differences in the univariate analysis were observed for Ca, P, Fe, Cr, and Cu. Consequently, the discriminatory importance of elements such as Mg and Mo may reflect their relationships with other elements within the multivariate structure rather than the magnitude of their individual differences between groups. Chromium was identified as an important discriminating element in both approaches. Dunn’s post hoc test demonstrated that certain findings were consistent across the two analyses. FSMP 4 was the most distinct product for most elements, with the greatest differences generally observed between FSMP 4 and the DS. For most elements, no statistically significant differences were observed between FSMPs 1 and 3.
In view of this study’s objective of applying HR-ICP-OES to the elemental analysis of food products for medical use, particular attention should be paid to chromium, as it was identified as one of the most important discriminating elements in both univariate and multivariate analyses. The remaining discriminating elements differed between the two approaches and covered a wide concentration range, including major constituents (>100 mg/100 g; K, Ca, P, and Mg), elements present at intermediate concentrations (0.5–10 mg/100 g; Zn, Fe, and Cu), and trace elements (<0.5 mg/100 g; Mn, Cr, and Mo). Although the determination of chromium by HR-ICP-OES may be susceptible to spectral interference, this can be minimised by selecting an appropriate analytical wavelength and using internal standard calibration. Verification of the lower measurement range (LMR) using combined standard uncertainty, together with the application of weighted regression, further supports the reliability of the analytical results. Consequently, reliable results were obtained for both trace elements and elements present at major and intermediate concentrations. The fact that the univariate and multivariate analyses consistently identified differences between the products, despite highlighting different elements, suggests that the observed patterns primarily reflect genuine differences in elemental profiles between the investigated products rather than limitations of the analytical method. This interpretation is further supported by the unacceptable pharmacopoeial AVs obtained for the analysed DS and FSMPs.

4. Discussion

4.1. Dose Uniformity in Relation to the Percentage of the Label Claim

The literature contains a number of studies reporting the measured dose as a percentage of the label claim. However, the important issue of dose uniformity is rarely addressed. The declared dosage is not the only factor that should be considered when assessing product quality. Therefore, the results demonstrate that an evaluation based solely on the average content of a mineral can overlook significant quality deficiencies and provide an incomplete picture of product quality. From a legislative standpoint, the purpose of these products is to supplement the normal diet with substances that have a nutritional or physiological effect [46]. FSMPs may also be intended for the exclusive or partial dietary management of patients (including infants) who have a limited, impaired, or disrupted ability to ingest, digest, absorb, metabolise, or excrete ordinary food or certain nutrients [47]. For such products, consistent dosing is an important aspect of ensuring a reproducible intake of essential nutrients and supporting the intended dietary management. Of the one DS and four FSMPs analysed in this study, none met the European Pharmacopoeia requirements for the uniformity of dosage units with respect to the dosages of Cr, Cu, Fe, K, Mg, Mn, Mo, Na, P, Se, and Zn. It is important to emphasise that this conclusion applies only to the products analysed in this study and cannot be generalised to all similar products. Nevertheless, other studies using ICP-OES to assess the percentage of the label claim for elements in FSMPs and DSs have reported significant discrepancies between measured and declared contents (Table 5).

4.2. Comparison with Published Data on the Percentage of the Label Claim

As can be seen from the data presented (Table 5), the results for Ca, Fe, Cu, Mg and Zn are most consistent with the literature. Previously published studies reported deviations from the label claim for these elements generally ranging from approximately −30% to +50%, whereas in the products analysed in this study, similar deviations were noted in the case of DS. On the other hand, significantly greater deviations were observed for some FSMPs, particularly FSMP 4. The greatest discrepancies compared with data reported in the literature were observed for K, Mo, Mn, and P. In particular, the K content in FSMP 4 differed substantially from that reported in other studies. Furthermore, the analysis of P in modified infant formula revealed substantial deviations from the declared content. Such pronounced deviations were not observed in this study or in studies investigating nutritional drinks, vitamins, and mineral supplements. Menezes et al. analysed macronutrients and toxic elements in enteral and parenteral nutrition formulas using Graphite Furnace Atomic Absorption Spectrometry (GF-AAS) and ICP-OES and found that 62% of the determined concentrations in enteral nutrition samples differed from the declared values [48]. Furthermore, their analysis of toxic elements revealed excessive levels of lead, as well as potential risks associated with excessive exposure to chromium and manganese [48]. The authors reached similar conclusions regarding the need for strict monitoring of these products, given that they are often the patients’ sole source of nutrition [48].

4.3. Application of the Pharmacopoeial Acceptance Value Criterion

AV is the pharmacopoeial measure of dose uniformity, and one of its key components is the mean content expressed as a percentage of the label claim. Therefore, published data showing substantial deviations of measured elemental contents from the label claim raise reasonable concerns as to whether the preparations analysed in those studies would meet the pharmacopoeial requirements for uniformity of dosage units. Mesko et al. used microwave-induced combustion (MIC) combined with ion chromatography (IC) and ion-selective electrode potentiometry (ISE) for iodine determination in mineral DSs [26]. However, rather than calculating the AV, the authors adopted the assumption of the United States Pharmacopeia (USP) that the ingredient content should fall within 90–110% of the declared value [26]. Ośko et al. evaluated physicochemical parameters, including weight uniformity, breaking force and friability, and disintegration time, of DSs containing green tea with reference to the requirements of the USP (USP 43–NF 38) [5]. It is worth noting that, in this study, uniformity referred to the dosage forms themselves rather than to the content of active ingredients. In addition, the authors analysed the following elements using Flame Atomic Absorption Spectrometry (F-AAS): Na, K, Ca, Mg, Mn, Fe, Zn, Cr, Cu, Cd, and Pb. However, their assessment of compliance with the manufacturer’s declaration was limited to Cr content [5]. Langaro et al. also investigated DSs containing melatonin using the AV criterion [34]. The authors concluded that none of the products met the pharmacopoeial requirements for uniformity [34]. Mikulić et al. used a weight variation test to evaluate the uniformity of six doses of isoflavone-containing supplements [35]. Half of the analysed products met the pharmacopoeial requirements for uniformity [35]. Both Langaro et al. and Mikulić et al. stated that the lack of uniformity could consequently lead to significant differences in the daily intake of active ingredients [34,35]. Lyu et al., like Ośko et al., used a mass uniformity test to assess capsule weight and expressed the trans-resveratrol content as a percentage of the declared dose [36]. Although the authors did not calculate the AV, the combination of uniform capsule masses and the reported percentage of the declared dose suggests that the preparations may have met the pharmacopoeial requirements [36].
Table 5. Reported percentage deviations between measured and declared elemental contents in dietary supplements (DSs) and foods for special medical purposes.
ProductKCaMgFeZnCuPMnNaMoCrReference
modified infant formula+30–+60%+1600–+2900%+10–+1980%nsd [29]
nutritional drinks −17.2–+28.9%−11.5–+29.5%−12.1–+19.0%−31.4–+7.8%−39.4–+1.9%−10.3–+19.4%−19.8–+30.3% +54.2–+220%−86–+20%[49]
vitamin and mineral DSs0–+10%−64–+50%0–+50%−55–+90%−28–+20%−35–0%−74–+70%−61–+30%nsd−87–−15% [28]
children’s multivitamin and mineral supplements −8.51–+199% [6]
vitamin and mineral DSs −8–+4%−17–+2%−22–+13%−22–+0%−23–+2% −28–+0% [7]
nsd—no significant differences.

4.4. Dissolution Tests and Alternative Elemental Analysis Approaches

Poniedziałek et al., in addition to analysing essential elements (Ca, Co, Cr, Cu, Fe, K, Mg, Mn, Na, and Zn) and toxic elements (Cd, Cr(VI), Ni, and Pb) using MIP-OES and F-AAS, also reported that most of the supplements did not dissolve in hydrochloric acid or phosphate buffer [8]. These dissolution test results indicate limited dissolution of the formulations under the conditions applied, which may affect the release of their elemental components [8]. Júnior et al. reached similar conclusions regarding the release phase using the USP 34 method [50]. Lopez et al. presented an interesting approach to the elemental analysis of DSs [51]. They used Laser Ablation Inductively Coupled Plasma Mass Spectrometry (LA-ICP-MS) to analyse As, B, Co, Cr, Cu, Mg, Ni, Na, Pb, Zn, S, and Fe and employed ICP-MS and ICP-OES for quality control of the new procedure [51]. The LA-ICP-MS results were consistent with those obtained using the other ICP-based techniques. This approach could potentially improve the quality control of such products because the technique offers higher sample throughput due to the absence of a time-consuming sample preparation step [51]. Other researchers have also used LA-ICP-MS for the screening of elemental impurities in pharmaceutical products and found the method to comply with USP requirements [52]. Marianni et al. presented a study that is particularly noteworthy in the context of the AVitself [53]. Although this study did not analyse the components of the final products, it proposed a specific method for producing homogeneous mixtures that meet the criteria for dosage uniformity [53].

4.5. Measurement Uncertainty and the Acceptance Value

When discussing AVs and measurement uncertainty, it is also important to consider the relationship between these parameters. When estimating the uncertainty associated with the AV, all of its components— X ¯ ,s and k—must be considered. While k is a constant, the uncertainty associated with X ¯  depends on the random and systematic components of the analytical method. At the same time, heterogeneity of the analysed samples contributes to the uncertainty associated with both X ¯   and s. Quantifying the uncertainty arising from sample heterogeneity is challenging when the data do not follow a normal distribution, as was the case in this study. Therefore, taking measurement uncertainty into account when interpreting the AV is important for assessing the extent to which the observed value reflects variability between dosage units versus limitations of the analytical method itself.

4.6. Analytical Techniques: Comparative Assessment and Limitations of HR-ICP-OES

In the papers under discussion, the authors employed a variety of elemental analysis techniques, including ICP-OES, GF-AAS, F-AAS, IC, ISE, MIP-OES, and LA-ICP-MS. Menezes et al. used ICP-OES to analyse Ca, Na, P, K, Al, Cu, Mn, Fe, and Zn [48]. The measurement ranges reported in their study were comparable to those established in this study [48]. To assess the trueness of the method, the authors analysed whole milk powder (SRM 8435) [48]. However, their assessment was based on recovery values alone, without considering measurement uncertainty [48]. Although the paper does not specify the intermediate precision of the measurements, the repeatability of the Certified Reference Material (CRM) measurements did not exceed a coefficient of variation of 8.1% [48]. Ośko et al. used F-AAS to analyse Na, K, Ca, Mg, Mn, Fe, Zn, Cr, Cu, Cd, and Pb [5]. This required the use of specific ionisation buffers, which varied depending on the analyte [5]. To determine the Limit of Detection (LOD) and Limit of Quantitation (LOQ) values, they used a commonly applied approach based on measuring blank samples and calculating the standard deviation of the blank response [5]. As the authors analysed green tea, they used Oriental Basma Tobacco Leaves (INCT-OBTL-5) to assess the trueness of the results. Similarly to Menezes et al., they determined recovery values, which ranged from 89 to 112%, while the repeatability of the measurements ranged from 0.02 to 10.2%, depending on the analyte [5].
The HR-ICP-OES technique may be useful for routine analysis of the elemental composition of food products for medical use. Nevertheless, several limitations were identified in this study:
  • despite the high resolution, the possibility of spectral interference must be taken into account (Cr 267.716 nm—P Cr 267.711 nm);
  • chemical interference associated with the presence of easily ionisable elements may be significant and can be compensated for by the use of an internal standard;
  • measurement ranges should be verified to ensure reliable results, particularly when analysing elements present at concentrations in the µg/g range; in this study, selenium concentrations in most of the analysed samples were below the lower measurement range.
As emphasised in the Introduction and discussed above, high spectral resolution alone does not guarantee reliable analytical results. A comprehensive assessment of the specific advantages of HR-ICP-OES over conventional ICP-OES would require a comparative study using instruments with different spectral resolutions. Such a direct experimental comparison was beyond the scope of this study and constitutes a limitation of the manuscript.
In summary, studies assessing the compliance of food products intended for medical use with pharmacopoeial requirements are beginning to emerge. It is worth emphasising that simply demonstrating agreement with the declared value is insufficient, while the number of studies examining the uniformity of dosage units remains very limited. Consequently, the application of contemporary analytical methodologies capable of providing reliable and appropriately validated results is important for the comprehensive quality assessment of these products.

Supplementary Materials

The following supporting information can be downloaded at: https://www.mdpi.com/article/10.3390/app16178715/s1, The relevant commands for retrieving data for Figure 1; Table S1. Summary of studies evaluating the agreement between labelled and measured elemental contents in foods and dietary supplements. Table S2. Relative error (|δx|), intermediate precision (CV), and combined standard uncertainty (uc) for the analysed elements at the lower measurement range concentrations; Table S3. Evaluation of measurement trueness for analysed elements in ERM-BD151 CRM based on the uncertainty approach (ISO Guide 33); Table S4. Dunn’s pairwise comparisons following the Kruskal–Wallis test. Values represent Bonferroni-adjusted p-values. Bold values indicate statistically significant differences (p < 0.05).

Author Contributions

Conceptualisation, J.S.; methodology, J.S.; software, J.S.; validation, J.S.; formal analysis, J.S.; investigation, J.S.; resources, J.S. and D.W.; data curation, J.S. and D.W.; writing—original draft preparation, J.S.; writing—review and editing, J.S.; visualisation, J.S.; supervision, J.S.; project administration, J.S.; funding acquisition, J.S. All authors have read and agreed to the published version of the manuscript.

Funding

This research received no external funding.

Institutional Review Board Statement

Not applicable.

Informed Consent Statement

Not applicable.

Data Availability Statement

The raw data supporting the conclusions of this article will be made available by the authors upon request, without undue reservation.

Acknowledgments

During the preparation of this manuscript, the authors used ChatGPT (OpenAI, GPT-5.5) to assist in developing and refining search queries for the Scopus database used to retrieve publications for the literature overview and Figure 1. The authors independently performed all database searches, verified the retrieved records, analysed the results, prepared the figure, and take full responsibility for the content of this publication.

Conflicts of Interest

The authors declare no conflicts of interest.

References

  1. Kowalska, A.; Bieniek, M.; Manning, L. Food Supplements’ Non-Conformity in Europe—Poland: A Case Study. Trends Food Sci. Technol. 2019, 93, 262–270. [Google Scholar] [CrossRef] [Scilit]
  2. Czarnek, K.; Tatarczak-Michalewska, M.; Blicharska, E. Risks Related to the Use of Dietary Supplements in the Light of Insufficient Legal Regulations and Low Public Awareness. Teka Kom. Prawniczej PAN Oddz. W Lublinie 2024, 17, 71–83. [Google Scholar] [CrossRef] [Scilit]
  3. Hys, K.; Koziarska, A. Supplementary Product Forms: Analysis of Polish Market Trends. Eur. Res. Stud. 2022, XXIV, 982–996. [Google Scholar] [CrossRef] [Scilit]
  4. Czarnowska-Kujawska, M.; Klepacka, J.; Zielińska, O.; Samaniego-Vaesken, M.d.L. Characteristics of Dietary Supplements with Folic Acid Available on the Polish Market. Nutrients 2022, 14, 3500. [Google Scholar] [CrossRef] [Scilit] [PubMed]
  5. Ośko, J.; Szewczyk, A.; Berk, P.; Prokopowicz, M.; Grembecka, M. Assessment of the Mineral Composition and the Selected Physicochemical Parameters of Dietary Supplements Containing Green Tea Extracts. Foods 2022, 11, 3580. [Google Scholar] [CrossRef] [Scilit] [PubMed]
  6. Frisbie, S.H.; Mitchell, E.J.; Hoeltge, A.; Pett, L.A.; Hoeltge, M.G. Excessive Manganese Content in Children’s Multivitamin Supplements: Potential for Neurodevelopmental Harm and Other Adverse Health Outcomes. PLoS ONE 2026, 21, e0343600. [Google Scholar] [CrossRef] [Scilit] [PubMed]
  7. Rovasi Adolfo, F.; Lopes Garcia, V.; da Rosa Schmidt, B.; balczareki Lucena, N.; Trombe do Valle, L.; Machado de Carvalho, L.; Noremberg Kunz, S. A Simple Approach Based on Extraction Induced by Emulsion Breaking for Determination of Ca, Cu, Fe, Mg, Mn and Zn in Multivitamin and Mineral Supplements by Flame Atomic Absorption Spectrometry. Anal. Lett. 2026, 59, 3160–3179. [Google Scholar] [CrossRef] [Scilit]
  8. Poniedziałek, B.; Niedzielski, P.; Kozak, L.; Rzymski, P.; Wachelka, M.; Rzymska, I.; Karczewski, J.; Rzymski, P. Monitoring of Essential and Toxic Elements in Multi-Ingredient Food Supplements Produced in European Union. J. Consum. Prot. Food Saf. 2018, 13, 41–48. [Google Scholar] [CrossRef] [Scilit]
  9. Ventura, M.; Rego, A.; Gueifão, S.; Delgado, I.; Coelho, I. Dietary Exposure to Essential and Toxic Trace Elements in the Portuguese Population: A Total Diet Study Approach. Foods 2026, 15, 838. [Google Scholar] [CrossRef] [Scilit] [PubMed]
  10. Pestalozzi, T.K.; Fascetti, A.J.; Larsen, J.A. Analysis of Essential Minerals and Heavy Metals in Canine and Feline Dietary Supplements Marketed in the United States. J. Anim. Physiol. Anim. Nutr. 2026. Online ahead of print. [Google Scholar] [CrossRef] [Scilit] [PubMed]
  11. Borgelt, L.M.; Armstrong, M.; Brindley, S.; Brown, J.M.; Reisdorph, N.; Stamm, C.A. Content of Selected Nutrients and Heavy Metals in Prenatal Multivitamins and Minerals: An Observational Study. Am. J. Clin. Nutr. 2025, 121, 1395–1402. [Google Scholar] [CrossRef] [Scilit] [PubMed]
  12. Phillips, C.A.; Theruvath, A.H.; Sreemanohar, A.; Baby, A.; Josec, S.; Phillips, M.; Philipe, T.; Mission for Ethics and Science in Healthcare (MESH). The Citizens Protein Project 2: The First Publicly Crowd-Funded Observational Study on Exhaustive Analysis of Popular Whey Protein Supplements in India Reveal Poor Quality and Deceptive Marketing Claims of Medical Pharmaceutical- Compared to Nutraceutical- Industry Powders. Medicine 2025, 104, e45970. [Google Scholar] [CrossRef] [Scilit] [PubMed]
  13. Frydrych, A.; Frankowski, M.; Jurowski, K. The Toxicological Analysis of Problematic and Sophisticated Elements (Ni, Cr, and Se) in Food for Special Medical Purposes (FSMP) Using in Pharmacotherapy and Clinical Nutrition for Oncological Patients Available in Polish Pharmacies. Food Chem. Toxicol. 2024, 192, 114930. [Google Scholar] [CrossRef] [Scilit] [PubMed]
  14. Yadav, M.; Sharma, A.; Meenu, M.; Kumari, A.; Goyal, A.; Garg, M. Exploration of Price Variation, Elemental Profile, and Fortification of Commercial Indian Edible Salts with Iodine, Potassium, Iron, Magnesium, and Calcium. Food Chem. Adv. 2023, 3, 100363. [Google Scholar] [CrossRef] [Scilit]
  15. Ring, G.; Sheehan, A.; Lehane, M.; Furey, A. Development, Validation and Application of an ICP-SFMS Method for the Determination of Metals in Protein Powder Samples, Sourced in Ireland, with Risk Assessment for Irish Consumers. Molecules 2021, 26, 4347. [Google Scholar] [CrossRef] [Scilit] [PubMed]
  16. Filippini, T.; Cilloni, S.; Malavolti, M.; Violi, F.; Malagoli, C.; Tesauro, M.; Bottecchi, I.; Ferrari, A.; Vescovi, L.; Vinceti, M. Dietary Intake of Cadmium, Chromium, Copper, Manganese, Selenium and Zinc in a Northern Italy Community. J. Trace Elem. Med. Biol. 2018, 50, 508–517. [Google Scholar] [CrossRef] [Scilit] [PubMed]
  17. Puścion-Jakubik, A.; Kolenda, K.; Socha, K.; Markiewicz-Żukowska, R. Assessment of Zinc Content in Food Supplements. Foods 2026, 15, 151. [Google Scholar] [CrossRef] [Scilit] [PubMed]
  18. Puścion-Jakubik, A.; Zimnoch, K.M.; Socha, K. Food Supplements Containing Iron—Comparison of Actual Content with Declared Content and Health Consequences. Molecules 2024, 29, 4796. [Google Scholar] [CrossRef] [Scilit] [PubMed]
  19. Rząsa-Duran, E.; Muszyńska, B.; Szewczyk, A.; Kała, K.; Sułkowska-Ziaja, K.; Piotrowska, J.; Opoka, W.; Kryczyk-Poprawa, A. Ilex Paraguariensis Extracts: A Source of Bioelements and Biologically Active Compounds for Food Supplements. Appl. Sci. 2024, 14, 7238. [Google Scholar] [CrossRef] [Scilit]
  20. Domínguez, L.; Fernández-Ruiz, V.; Cámara, M. Micronutrients in Food Supplements for Pregnant Women: European Health Claims Assessment. Nutrients 2023, 15, 4592. [Google Scholar] [CrossRef] [Scilit] [PubMed]
  21. Fischer, A.; Brodziak-Dopierała, B.; Mońka, I.; Loska, K.; Stojko, J. Dietary Supplements as Additional Sources of Zinc in the Human Organism. Farmacia 2021, 69, 325–331. [Google Scholar] [CrossRef] [Scilit]
  22. Opoka, W.ł.; Kryczyk-Poprawa, A.; Studzińska, M.; Piotrowska, J.; Muszyńska, B. The Comparison of Trace Elements Content with Labels on Dietary Supplements Used by Athletes. Acta Pol. Pharm. Drug Res. 2020, 77, 563–570. [Google Scholar] [CrossRef] [Scilit]
  23. Muszy-Ska, B.; Krakowska, A.; Lazur, J.; Szewczyk, A.; Opoka, W. Evaluation of Nutritional and Medicinal Properties of Bacopa Monnieri Biomass and Preparations. Acta Pol. Pharm. Drug Res. 2018, 75, 1353–1361. [Google Scholar] [CrossRef] [Scilit] [PubMed]
  24. Andrews, K.W.; Roseland, J.M.; Gusev, P.A.; Palachuvattil, J.; Dang, P.T.; Savarala, S.; Han, F.; Pehrsson, P.R.; Douglass, L.W.; Dwyer, J.T.; et al. Analytical Ingredient Content and Variability of Adult Multivitamin/Mineral Products: National Estimates for the Dietary Supplement Ingredient Database1,2. Am. J. Clin. Nutr. 2017, 105, 526–539. [Google Scholar] [CrossRef] [Scilit] [PubMed]
  25. Hanley, T.A.; Kubachka, K.; Taylor, A.M.; Kern, S.E. Selenium Enriched Dietary Supplement Rapid Screening Method Using XRF and DART-HRAM-MS for Label Verification. J. Anal. At. Spectrom. 2017, 32, 1196–1202. [Google Scholar] [CrossRef] [Scilit]
  26. Mesko, M.; Pereira, R.; Bielemann, N.; Rondan, F.; Novo, D. Multi-Techniques for Iodine Determination and Dose Uniformity Assays in Iodized Mineral Dietary Supplements. Braz. J. Anal. Chem. 2023, 10, 112–122. [Google Scholar] [CrossRef] [Scilit]
  27. Kubachka, K.M.; Hanley, T.; Mantha, M.; Wilson, R.A.; Falconer, T.M.; Kassa, Z.; Oliveira, A.; Landero, J.; Caruso, J. Evaluation of Selenium in Dietary Supplements Using Elemental Speciation. Food Chem. 2017, 218, 313–320. [Google Scholar] [CrossRef] [Scilit] [PubMed]
  28. Krejčová, A.; Ludvíková, I.; Černohorský, T.; Pouzar, M. Elemental Analysis of Nutritional Preparations by Inductively Coupled Plasma Mass and Optical Emission Spectrometry. Food Chem. 2012, 132, 588–596. [Google Scholar] [CrossRef] [Scilit] [PubMed]
  29. Maruszewska, A.; Żwierełło, W.; Skórka-Majewicz, M.; Baranowska-Bosiacka, I.; Wszołek, A.; Janda, K.; Kulis, D.; Kapczuk, P.; Chlubek, D.; Gutowska, I. Modified Baby Milk—Bioelements Composition and Toxic Elements Contamination. Molecules 2021, 26, 4184. [Google Scholar] [CrossRef] [Scilit] [PubMed]
  30. Vitiello, A.; Izzo, L.; Castaldo, L.; d’Angelo, I.; Ungaro, F.; Miro, A.; Ritieni, A.; Quaglia, F. The Questionable Quality Profile of Food Supplements: The Case of Red Yeast Rice Marketed Products. Foods 2023, 12, 2142. [Google Scholar] [CrossRef] [Scilit] [PubMed]
  31. European Directorate for the Quality of Medicines & HealthCare (EDQM). European Pharmacopoeia, 12th ed.; Council of Europe: Strasbourg, France, 2025. [Google Scholar]
  32. United States Pharmacopeial Convention. United States Pharmacopeia and National Formulary (USP 48–NF 43), 48th ed.; NF 43; United States Pharmacopeial Convention: Rockville, MD, USA, 2025. [Google Scholar]
  33. Rosa, A.D. Comparison of Formulation Characteristics of Drugs and Dietary Supplements Containing Alpha-Lipoic Acid Relevant to Therapeutic Efficacy. Eur. Rev. 2023, 27, 3159. [Google Scholar] [CrossRef] [Scilit] [PubMed]
  34. Langaro, E.; Rodrigues, N.d.S.; Marchi, A.C.B.d.; Bertol, C.D. Quality Assessment of Melatonin Supplements Marketed in Brazil: Alarming Discrepancies. J. Food Qual. 2026, 2026, 8894384. [Google Scholar] [CrossRef] [Scilit]
  35. Mikulić, M.; Krstonošić, M.A.; Gaćeša, B.; Vojnović, T.; Jovanović, S.; Cvejić, J. Quality Assessment and Dissolution Properties of Dietary Supplements with Isoflavones. J. Food Nutr. Res. 2023, 62, 118–128. [Google Scholar] [CrossRef] [Scilit]
  36. Lyu, W.; Rodriguez, D.; Ferruzzi, M.G.; Pasinetti, G.M.; Murrough, J.W.; Simon, J.E.; Wu, Q. Chemical, Manufacturing, and Standardization Controls of Grape Polyphenol Dietary Supplements in Support of a Clinical Study: Mass Uniformity, Polyphenol Dosage, and Profiles. Front. Nutr. 2021, 8, 780226. [Google Scholar] [CrossRef] [Scilit] [PubMed]
  37. Abdelaal, S.H.; El Azab, N.F.; Hassan, S.A.; El-Kosasy, A.M. Quality Control of Dietary Supplements: An Economic Green Spectrofluorimetric Assay of Raspberry Ketone and Its Application to Weight Variation Testing. Spectrochim. Acta Part A Mol. Biomol. Spectrosc. 2021, 261, 120032. [Google Scholar] [CrossRef] [Scilit] [PubMed]
  38. Donati, G.L.; Amais, R.S.; Williams, C.B. Recent Advances in Inductively Coupled Plasma Optical Emission Spectrometry. J. Anal. At. Spectrom. 2017, 32, 1283–1296. [Google Scholar] [CrossRef] [Scilit]
  39. Velitchkova, N.; Veleva, O.; Velichkov, S.; Daskalova, N. Possibilities of High Resolution Inductively Coupled Plasma Optical Emission Spectrometry in the Determination of Trace Elements in Environmental Materials. J. Spectrosc. 2013, 2013, 505871. [Google Scholar] [CrossRef] [Scilit]
  40. Krachler, M.; Alvarez-Sarandes, R. Capabilities of High Resolution ICP-OES for Plutonium Isotopic Analysis. Microchem. J. 2016, 125, 196–202. [Google Scholar] [CrossRef] [Scilit]
  41. Krachler, M.; Alvarez-Sarandes, R. Improved Plutonium Concentration Analysis in Specimens Originating from the Nuclear Fuel Cycle Using High Resolution ICP-OES. J. Anal. At. Spectrom. 2015, 30, 1655–1662. [Google Scholar] [CrossRef] [Scilit][Green Version]
  42. Sawicki, J.; Wójciak, M.; Dresler, S.; Torbicz, A.; Skalska-Kamińska, A.; Sowa, I. Design of Experiment Approach to Optimize High Resolution ICP-OES Method for Biomonitoring of Zn Level in Human Blood Samples. J. Elem. 2023, 28, 1353–1367. [Google Scholar] [CrossRef] [Scilit]
  43. ISO 33403:2024; Reference Materials—Requirements and Recommendations for Use. International Organization for Standardization (ISO): Geneva, Switzerland, 2024.
  44. The jamovi Project. Jamovi, version 2.7; The jamovi Project: Sydney, Australia, 2025. Available online: https://www.jamovi.org (accessed on 18 June 2026).
  45. R Core Team. R: A Language and Environment for Statistical Computing, version 4.5; R packages retrieved from CRAN snapshot 25 May 2025; R Core Team: Vienna, Austria, 2025. Available online: https://cran.r-project.org (accessed on 28 August 2026).
  46. Minister Zdrowia [Ministry of Health]. Rozporządzenie Ministra Zdrowia z Dnia 9 Października 2007 r. w Sprawie Składu Oraz Oznakowania Suplementów Diety [Regulation of the Minister of Health of 9 October 2007 on the Composition and Labeling of Dietary Supplements]; Minister Zdrowia: Warsaw, Poland, 2007. [Google Scholar]
  47. European Parliament and Council of the European Union. Regulation (EU) No 609/2013 of the European Parliament and of the Council of 12 June 2013 on Food Intended for Infants and Young Children, Food for Special Medical Purposes, and Total Diet Replacement for Weight Control; European Parliament and Council of the European Union: Strasbourg, France, 2013. [Google Scholar]
  48. Ribeiro Menezes, I.M.N.; Nascimento, P.d.A.; Peixoto, R.R.A.; Oliveira, A. Nutritional Profile and Risk Assessment of Inorganic Elements in Enteral and Parenteral Nutrition Formulas. J. Trace Elem. Med. Biol. 2024, 84, 127442. [Google Scholar] [CrossRef] [Scilit] [PubMed]
  49. Leśniewicz, A.; Kurowska, D.; Pohl, P. Mineral Constituents Profiling of Ready-To-Drink Nutritional Supplements by Inductively Coupled Plasma Optical Emission Spectrometry. Molecules 2020, 25, 851. [Google Scholar] [CrossRef] [Scilit] [PubMed]
  50. Júnior, A.d.F.S.; Sá, R.R.; Silva, L.O.B.; Magalhães, H.I.F.; Tarantino, T.B.; Korn, M.G.A. In Vitro Monitoring of Macro and Microelements in Multimineral Preparations across Dissolution Profiles by Inductively Coupled Plasma Optical Emission Spectrometry (ICP OES). J. Braz. Chem. Soc. 2017, 28, 2163–2171. [Google Scholar] [CrossRef]
  51. Martinez Lopez, C.; Carter, J.A.; Corzo, R.; Todorov, T.I. Method Development for the Quantitative Analysis of Multivitamin Supplements by Laser Ablation–Inductively Coupled Plasma–Mass Spectrometry (LA-ICP-MS). Food Anal. Methods 2022, 15, 3079–3091. [Google Scholar] [CrossRef] [Scilit]
  52. Pluháček, T.; Ručka, M.; Maier, V. A Direct LA-ICP-MS Screening of Elemental Impurities in Pharmaceutical Products in Compliance with USP and ICH-Q3D. Anal. Chim. Acta 2019, 1078, 1–7. [Google Scholar] [CrossRef] [Scilit] [PubMed]
  53. Marianni, B.; Polonini, H.; Oliveira, M.A.L. Ensuring Homogeneity in Powder Mixtures for Pharmaceuticals and Dietary Supplements: Evaluation of a 3-Axis Mixing Equipment. Pharmaceutics 2021, 13, 563. [Google Scholar] [CrossRef] [Scilit] [PubMed]
Figure 1. Number of publications on the quality of food products for medical use.
Applsci 16 08715 g001
Figure 2. Flowchart of the pharmacopoeial procedure for assessing the uniformity of dosage units. AV—acceptance value.
Applsci 16 08715 g002
Figure 3. Analyte—spectral interferent: (A): Cr 267.716 nm—P 267.7111 nm; (B): Se 196.028 nm—Fe 196.0141 nm; (C): P 213.618 nm—Cu 213.5981 nm. Red line with orange border in the centre—the analyte signal integration area; blue line—baseline; red line—signal recorded for the specified interferent solution.
Applsci 16 08715 g003
Figure 4. PCA biplot based on elemental contents expressed as percentages of declared values in DS and FSMP products.
Applsci 16 08715 g004
Figure 5. VIP scores identifying the elements contributing most strongly to the discrimination of DS and FSMP products.
Applsci 16 08715 g005
Table 1. Analytes and their potential interferences.
Analyte and Line [nm]FeMnCuNaPCrZnCa
Se 196.028196.014 1196.076 1
Mo 202.030202.075 1
Cr 205.552205.527 1 205.498
Cr 267.716267.688 1267.785 1267.607267.808267.711 1
Zn 206.200206.274 1 206.242 1 206.158 1
P 213.618213.561 1 213.598 1
Mn 257.610257.669 1
Fe 259.940 259.891260.027260.032 260.032
Cu 327.396327.349 1 327.422 1 327.467
Mg 285.213 285.281 1
Ca 315.887 315.953 1
1 Two or more potential spectral interference lines were identified.
Table 2. Measurement ranges and regression data.
ElementLower
Measurement
Range
Upper
Measurement
Range
Slope
[Ints/Conc.]
InterceptWeighing
Method
Coefficient of Determination
Cr2 µg/L1000 µg/L303.75118.661/(SD·conc)0.999980771
Cu4 µg/L1000 µg/L435.83240.721/(SD·conc)0.999971485
Fe4 µg/L5000 µg/L564.07454.381/(SD·conc)0.999999068
Mn2 µg/L1000 µg/L3988.7283.761/(SD·conc)0.999999982
Mo4 µg/L1000 µg/L150.2822.4601/(SD·conc)0.999988811
Se6 µg/L1000 µg/L25.866262.991/conc0.999661781
Zn4 µg/L2500 µg/L594.70165.871/(SD·conc)0.999999500
Ca4 mg/L100 mg/L174.126589.031/(SD·conc)0.999999807
Mg2 mg/L100 mg/L487.3032134.11/(SD·conc)0.999909117
K2 mg/L400 mg/L17.6448890.61/(SD·conc)0.999999673
Na2 mg/L200 mg/L106.53830.7631/(SD·conc)0.999998948
P2 mg/L200 mg/L30.528111.841/(SD·conc)0.999999889
Table 3. Acceptance values for elements analysed in food products for medical use.
ElementDSFSMP 1FSMP 2FSMP 3FSMP 4
X ¯ sAV X ¯ sAV X ¯ sAV X ¯ sAV X ¯ sAV
Ca87.601.95015.55145.73.51452.63131.52.73736.61140.42.62645.23199.16.178112.4
Cr78.8123.6876.52187.89.310108.7201.635.16184.4170.443.28172.8229.631.30273.2
Cu102.32.1045.799120.43.06026.24129.815.9366.48100.53.5278.465174.34.41983.38
Fe93.703.22512.54124.27.43940.52126.823.3181.25101.74.67911.39207.214.21139.8
K97.154.97613.2996.2513.9235.66121.410.8845.98118.819.2663.49269.460.03312.0
Mg108.92.05012.3498.375.87114.2297.469.18823.0999.102.1475.154530.515.74466.7
Mn105.96.47519.93122.018.6465.27123.724.2480.36147.7130.3358.9244.417.08183.9
Mo96.324.23212.34311.7273.8867.3332.5358.81079220.699.45357.8370.8227.4815.0
Nano reference value109.18.27327.49126.410.5250.15121.110.1543.98123.620.2370.60
P100.13.8799.310138.22.11141.73134.710.0557.33135.54.47344.76227.27.362143.3
Se70.7633.93109.2<LMR<LMR<LMR<LMR
Zn100.316.9540.68101.41.4363.446124.628.4191.33155.6109.1315.9167.781.40261.6
DS—dietary supplement. FSMP—foods for special medical purposes. AV—acceptance value. X ¯ —mean content expressed as a percentage of the label claim [%]. s—standard deviation of the individual contents expressed as a percentage of the label claim [%]. <LMR—below the lower measurement range. Values exceeding the maximum allowable acceptance value (AV > 15) are presented in bold.
Table 4. Results of the Kruskal–Wallis test comparing the elemental contents of the analysed products, including the test statistic (χ2), p-value and effect size (ε2).
ElementChi-Square
2)
pEpsilon Squared (ε2)
Ca46.12.31 × 10−90.942
Cr40.53.40 × 10−80.827
Cu39.94.48 × 10−80.815
Fe41.22.49 × 10−80.840
K35.43.91 × 10−70.722
Mg36.72.12 × 10−70.748
Mn23.21.18 × 10−40.472
Mo26.62.37 × 10−50.543
P41.91.78 × 10−80.854
Zn18.31.06 × 10−30.374
Disclaimer/Publisher’s Note: The statements, opinions and data contained in all publications are solely those of the individual author(s) and contributor(s) and not of MDPI and/or the editor(s). MDPI and/or the editor(s) disclaim responsibility for any injury to people or property resulting from any ideas, methods, instructions or products referred to in the content.