1. Introduction
Fine and ultrafine airborne particles are difficult to remove because their small aerodynamic diameter, low inertia, and long suspension time reduce the efficiency of conventional inertial separation. Acoustic agglomeration offers a non-contact pretreatment by promoting relative particle motion, increasing collision frequency, and shifting part of the number-size distribution toward larger agglomerates that can be more readily captured downstream [
1,
2,
3,
4].
Acoustic agglomeration results from several coupled mechanisms. In polydisperse aerosols, particle oscillation amplitude and phase vary with aerodynamic relaxation time [
5], producing orthokinetic relative motion and collisions between dissimilar particles [
6]. Hydrodynamic interactions, including acoustic wake and mutual-radiation effects, can further alter trajectories and collision probability [
7,
8]. Brownian coagulation dominates at the smallest sizes, whereas streaming, turbulence, gravity, and wall interactions become more important as particle size and acoustic intensity increase [
9,
10]. The observed response therefore depends on particle properties, concentration, residence time, pressure gradients, and chamber geometry [
11,
12].
In ducts, ultrasonic fields are generally nonuniform because radiator vibration and wall reflections create pressure nodes, antinodes, and strong energy gradients. The primary acoustic radiation force depends not only on peak sound-pressure level, but also on the gradient of the Gor’kov potential and therefore, on the spatial distributions of pressure and particle velocity. Resonant gaps, nonuniform fields, and vortex structures can locally concentrate particles and enhance collisions [
13,
14], whereas strong acoustic streaming may redistribute residence time or promote wall deposition instead of agglomeration [
9,
15].
Acoustic treatment is also sensitive to operating conditions [
16,
17]. Frequency governs particle response and wavelength, sound-pressure level controls oscillation amplitude and nonlinear flow effects, concentration determines the availability of collision partners, and gas velocity sets exposure time. Higher velocity increases convective transport but shortens the time available for acoustic migration and collision, so frequency and residence time should be evaluated together [
17,
18]. Increasing particle concentration may raise collision probability, although the response remains size dependent because small particles can act as collision partners, while larger particles serve as inertial collectors [
19,
20,
21].
Acoustic pressure source orientation has received less attention than have frequency, sound-pressure level, exposure duration, or source number. In a bounded duct, however, changing radiator orientation modifies incident-wave loading, reflections, pressure-gradient directions, and the horizontal, vertical, and axial components of the radiation force [
22]. Lateral forces may promote cross-sectional migration, vertical forces may support or oppose settling [
23], and axial forces may alter particle velocity and residence time. Consequently, orientations with similar peak sound-pressure levels can produce different trajectories and downstream size distributions.
Experimental interpretation must also distinguish agglomeration from apparent removal. Changes in downstream particle counts may reflect agglomerate growth, sedimentation, wall deposition, spatial redistribution, sampling nonuniformity, or source variability. Because integral number concentration is dominated by the smallest particles, it can obscure size-resolved redistribution, while ratios based on low upstream counts can be unstable. Repeated measurements, size-band aggregation, variability reporting, and cautious statistical inference are therefore essential [
24].
Previous studies have reported reductions in particle number concentration, increases in characteristic size, and improved downstream filtration [
18,
24,
25]. However, results vary because field topology, particle properties, flow conditions, and sampling are strongly coupled, while scale-up rules and local-force validation remain incomplete [
1].
This study addresses this gap by combining finite-element modeling of a piezoelectric ultrasonic source with aerosol experiments in a circular duct. The numerical analysis evaluates resonance, pressure distribution, radiation-force magnitude, and directional coefficients. The experiments assess size-resolved concentration changes at two airflow velocities, with and without particle dosing, and at three source orientations. The hypothesis is that source orientation modifies aerosol behavior by redistributing the directional components of the acoustic radiation-force field. The study, therefore, links calculated field topology with repeated size-resolved measurements to support the design of compact ultrasonic pretreatment systems.
2. Mathematical Background of Direction-Dependent Acoustic Radiation Forces
The purpose of this section is to establish the mathematical basis for evaluating how the orientation of an ultrasonic acoustic field affects the direction and magnitude of forces acting on suspended particles in an air duct. Since the acoustic pressure field is scalar, the directional action of the acoustic field is not obtained from separate pressure components, but from the spatial gradient of the pressure field and the corresponding Gor’kov acoustic potential. The resulting acoustic radiation force is decomposed into horizontal, vertical, and axial components in order to relate the numerical force distribution to particle migration, residence time, gravitational settling, and experimentally observed agglomeration behavior.
The acoustic field inside the air duct was represented as a harmonic pressure field. The instantaneous acoustic pressure is expressed as follows:
where
p(
r,
t) is the instantaneous acoustic pressure;
p(
r) is the complex acoustic pressure amplitude;
r is the position vector;
t is time; and
ω is the angular frequency.
In pressure acoustics, the acoustic pressure is a scalar quantity. Therefore, the acoustic field is not separated into
x-,
y-, and
z- pressure components. The directional information of the field is obtained from the spatial gradient of the acoustic pressure. The acoustic velocity of the surrounding medium can be calculated as shown below:
where
v(
r) is the complex acoustic velocity amplitude;
i is the imaginary unit; and
ρ0 is the density of the surrounding medium.
So, in Cartesian coordinates, the acoustic velocity vector is expressed as shown below:
where
vx,
vy, and
vz are the acoustic velocity components in the
x-,
y-, and
z- directions, respectively. These components are obtained from the spatial derivatives of the pressure field:
Thus, although the acoustic pressure is scalar, the pressure gradient produces vector quantities that define the directional character of the acoustic field. Furthermore, the time-averaged potential acoustic energy density can be defined as
where
c0 is the speed of sound in the surrounding medium.
Additionally, the time-averaged kinetic acoustic energy density can be defined as follows:
where the squared velocity magnitude
is
The interaction between a small spherical particle and the acoustic field can be described using the Gor’kov acoustic potential. For a spherical particle with radius
a, the particle volume is
The compressibility of the surrounding medium is defined as
Whereas the compressibility of the particle is defined as
where
ρp is the particle density;
cp is the speed of sound in the particle material.
So, the acoustic contrast factors can be defined as shown below:
and
The coefficient f1 represents the effect of the compressibility difference between the particle and the surrounding medium; f2 represents the effect of the density difference.
The Gor’kov acoustic potential is expressed as
The Gor’kov formulation is applicable in the Rayleigh scattering regime, where the particle diameter is much smaller than the acoustic wavelength. For example, for an acoustic field with a frequency of approximately 50 kHz, the acoustic wavelength in air is about 6.9 mm, which is several orders of magnitude larger than particle diameters in the range of 0.2–10 μm. Therefore, the Gor’kov approximation is appropriate for evaluating the primary acoustic radiation force.
For the investigated particle-size range, the wavelength-based Rayleigh condition remains well satisfied, even for a particle diameter of 10 μm, the particle size is much smaller than the acoustic wavelength of approximately 6.9 mm. Nevertheless, the classical Gor’kov formulation used here represents an idealized inviscid primary-radiation-force model and does not explicitly account for thermoviscous boundary-layer effects around the particles. These effects may become increasingly relevant for micrometer-scale particles in air and therefore, introduce additional uncertainty when the force estimates are extended toward the upper end of the investigated particle-size range.
The present formulation describes only the primary acoustic radiation force acting on isolated spherical particles. Secondary acoustic interactions, particle–particle collisions, adhesion, and agglomerate formation were not explicitly included in the numerical model. Therefore, the calculated radiation-force fields are used to evaluate particle-migration tendencies and spatial redistribution rather than to predict the agglomeration process directly.
The primary acoustic radiation force acting on the particle is calculated as the negative gradient of the Gor’kov potential, which is expressed as follows:
Therefore, the acoustic radiation force is directed from regions of higher Gor’kov potential toward regions of lower Gor’kov potential. In Cartesian coordinates, the force vector can be written as follows:
where
Fx,
Fy, and
Fz are the acoustic radiation force components in the
x-,
y-, and
z-directions. These components can be calculated as shown below:
So, the total magnitude of the acoustic radiation force can be expressed as follows:
Since the Gor’kov potential has units of energy, the spatial derivative of the potential has units of energy per unit length. Therefore, the acoustic radiation force obtained from the gradient of the Gor’kov potential is expressed in newtons.
In this study, the horizontal direction of the air-duct cross-section is defined as
the x-axis, while the vertical direction is defined as the
z-axis. The longitudinal direction of the duct, corresponding to the main airflow direction, is defined as the
y-axis. Therefore, the acoustic radiation force vector is expressed in Equation (17) where
Fx,
Fy, and
Fz are the horizontal, axial, and vertical force components, respectively. To correspond to the investigated source configurations, the angular position of the acoustic pressure source, denoted by
θs, is defined in the x-z plane and measured from the positive
z-axis toward the positive x-axis. Thus, the source-position vector is given by
where
R is the radial distance between the duct axis and the acoustic pressure source.
In the present study, the term “source angular position”, θs, denotes the circumferential position of the UAPS around the air-duct cross-section in the (x-z) plane. For all investigated positions, the radiator surface is directed radially inward toward the duct center. Thus, the configurations denoted as 0°, 90°, and 180° correspond to different angular positions of the same inward-directed source rather than to the rotation of the radiator relative to the local radial direction. The term “source orientation” is used hereafter to refer to these investigated angular configurations.
So, when the acoustic pressure source is directed toward the duct center, the inward normal vector of the source is defined as shown below:
The acoustic radiation force component acting along the nominal direction of acoustic excitation is then calculated as
After expansion, this force component becomes
This expression allows the force distribution to be evaluated with respect to the orientation of the acoustic pressure source in the duct cross-section. So, for the source angular position of 0°, the acoustic pressure source is located on the positive vertical side of the duct and is directed toward the duct center. In this case,
For a source angular position of 90°, the acoustic pressure source is located on the lateral side of the duct, depending on the selected coordinate orientation, and produces horizontal acoustic pressure. In this case,
For the source angular position of 180°, the acoustic pressure source is located on the negative vertical side of the duct and is directed toward the duct center. In this case,
Different directional components of the acoustic radiation force can affect particle motion in different ways. The horizontal force component Fx mainly promotes lateral particle migration across the width of the duct. This can increase the probability of particle–particle encounters in regions where particles are concentrated by the acoustic field. The vertical force component Fz supports or opposes gravitational settling, depending on its local direction. Therefore, vertical acoustic excitation can influence not only particle migration but also residence time, sedimentation, and wall deposition. The axial component Fy, acting along the airflow direction, can change the particle transport velocity through the acoustic treatment region and may therefore affect the time available for particle interaction and agglomeration.
To compare the influence of different acoustic-source orientations, the force magnitude and its directional components were evaluated in the investigated air-duct volume. The mean acoustic radiation force magnitude is defined as
where
V is the investigated volume. However, signed force components may cancel each other in standing or interference acoustic fields. Therefore, the root-mean-square force components are more suitable for evaluating direction-dependent force intensity.
To quantify the directional dominance of the force field, the directional-force coefficients are introduced as
These coefficients satisfy the condition
A high value of ηx indicates that the force field is predominantly horizontal. A high value of ηz indicates that the force field is predominantly vertical. A high value of ηy indicates that a significant part of the force acts along the airflow direction. Therefore, these coefficients define how the orientation of the acoustic pressure source changes the directional structure of the acoustic radiation force field and how these changes may influence particle motion, particle velocity, residence time, and processes relevant to acoustic agglomeration.
Therefore, the presented formulation provides a quantitative basis for comparing the influence of acoustic-source orientation on particle motion in the duct. The source-aligned force component Fn describes the direct action of the acoustic field in the cross-sectional plane, while the individual components Fx, Fy, and Fz describe horizontal migration, axial transport, and vertical motion, respectively. Therefore, different source orientations are expected to produce different particle-migration tendencies, velocity magnitudes, residence times, and settling or deposition tendencies.
3. Numerical Investigation of Direction-Dependent Ultrasonic Acoustic Radiation Forces
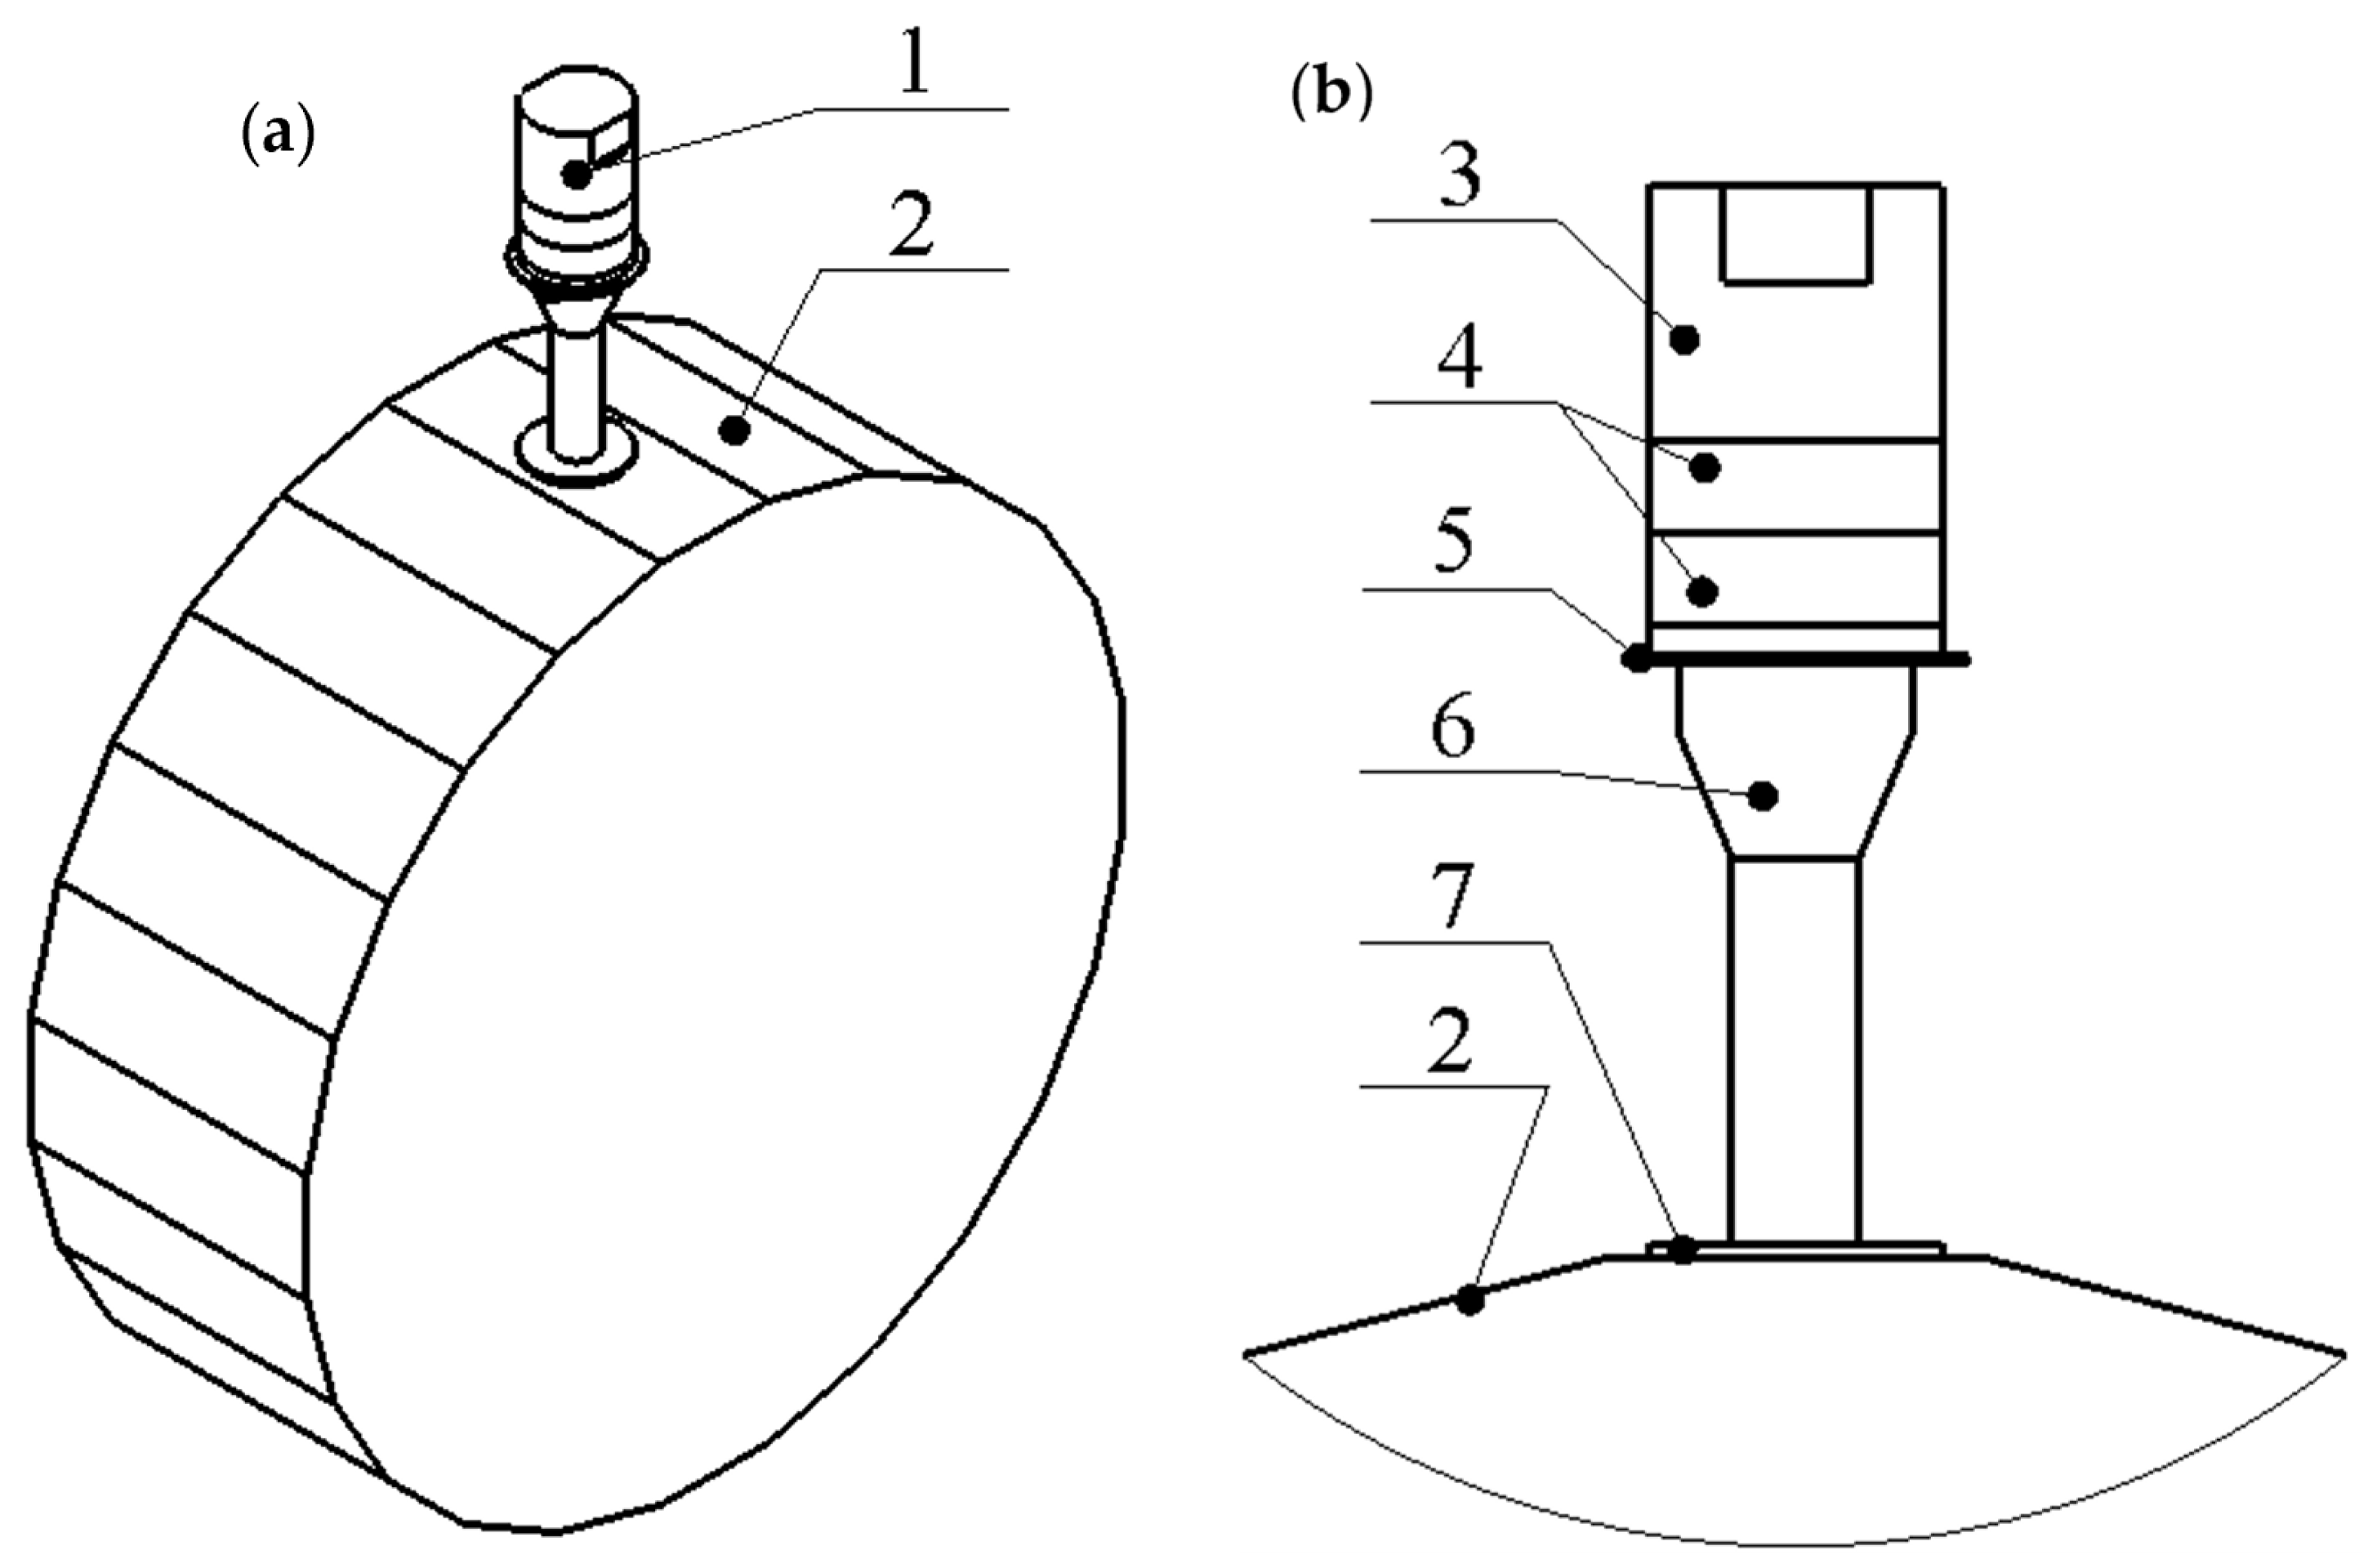
Numerical investigations were performed to determine the electromechanical characteristics of the piezoelectric ultrasonic acoustic pressure source and to evaluate the acoustic fields and radiation forces generated at different source angular positions. For this purpose, a numerical model comprising the ultrasonic acoustic pressure source (UAPS) and the air duct was developed using COMSOL Multiphysics 6.1. The UAPS consisted of a piezoelectric Langevin transducer coupled to a disc-shaped radiator rigidly attached to the free end of the transducer concentrator. The geometry of the numerical model and the UAPS is shown in
Figure 1.
The internal diameter of the air duct was set to 150 mm, and its radial walls were modeled as acoustically rigid boundaries. Perfectly matched layers (PMLs) were applied at both axial ends of the acoustic domain to suppress artificial reflections from the numerical boundaries and to represent outgoing acoustic-wave propagation along the duct. The PML regions were discretized using the same frequency-based mesh-resolution criterion as that used the acoustic domain, with at least six finite elements per acoustic wavelength at approximately 50 kHz. The air pressure and temperature in the duct were set to 1 atm and 293.15 K, respectively. The UAPS shown in
Figure 1b consists of a Langevin transducer coupled to a disc-shaped acoustic radiator. The concentrator, radiator, and transducer backend were modeled with aluminum alloy 6061-T6, whereas the piezoceramic rings were modeled using the PIC181 hard piezoceramic material. The boundary conditions for UAPS were set as follows: the outer surface of the clamping ring (
Figure 1b(5)) was set as fixed rigidly in order to simulate clamping of the UAPS, while the surface between the two piezo ceramic rings (
Figure 1,
Figure 2,
Figure 3 and
Figure 4) was set as a positive electrode to which was applied a harmonic excitation signal with an amplitude of 200 V
p-p. Other piezoceramic rings surfaces, which are in contact with body of the transducer, were set as neutral.
The structural and acoustic domains were coupled through the acoustic–structure boundary multiphysics condition at the solid–air interfaces exposed to the acoustic domain, including the surface of the disc-shaped radiator. This coupling transfers the normal structural acceleration of the vibrating UAPS to the surrounding air and simultaneously applies the acoustic pressure load to the solid boundary, thereby providing two-way coupling between the structural vibration and the generated acoustic field. In addition, materials used in numerical model are given in
Table 1.
Gravitational acceleration was applied as a body load acting in the negative z-direction of the global coordinate system. Its effect on the harmonic response was included through a prestressed frequency-domain analysis. First, a stationary structural solution was calculated using gravitational loading to establish the static stress and deformation state of the UAPS. The subsequent frequency-domain calculation was linearized for this prestressed state, thereby including the corresponding stress-stiffening contribution to the harmonic structural response. Because gravity remains fixed in the global coordinate system while the UAPS is repositioned, the static prestress state differs between the 0° and 180° configurations.
The PIC181 piezoceramic material was represented using the strain–charge form of the piezoelectric constitutive equations. Assuming the conventional transversely isotropic symmetry of the poled PZT ceramic, d31, d33 and d15 represent the independent piezoelectric charge coefficients used to define the electromechanical coupling. Therefore, piezoelectric voltage coefficients were not introduced as independent model inputs.
The numerical model was discretized using a physics-controlled finite-element mesh with the element size controlled by frequency. For the acoustic domain, a minimum resolution of six finite elements per acoustic wavelength was applied. At the operating frequency of approximately 50 kHz, corresponding to an acoustic wavelength in air of approximately 6.9 mm, this criterion gives a maximum characteristic element size of approximately 1.15 mm in the acoustically relevant regions. The complete mesh consisted of 191,624 domain elements, 10,266 boundary elements, and 848 edge elements. The electromechanical and acoustic responses were calculated using a prestressed frequency-domain analysis with the MUMPS direct solver. A stationary structural solution including gravitational loading was first obtained, after which the harmonic response was calculated for the resulting prestressed state. The UAPS frequency sweep was performed from 49.4 to 50.5 kHz, with a frequency step of 5 Hz. Mesh independence was evaluated by increasing the acoustic resolution from six to nine finite elements per wavelength. Differences in the principal calculated quantities were approximately 2–3%, indicating that the six-elements-per-wavelength mesh provided sufficient numerical convergence for the present analysis.
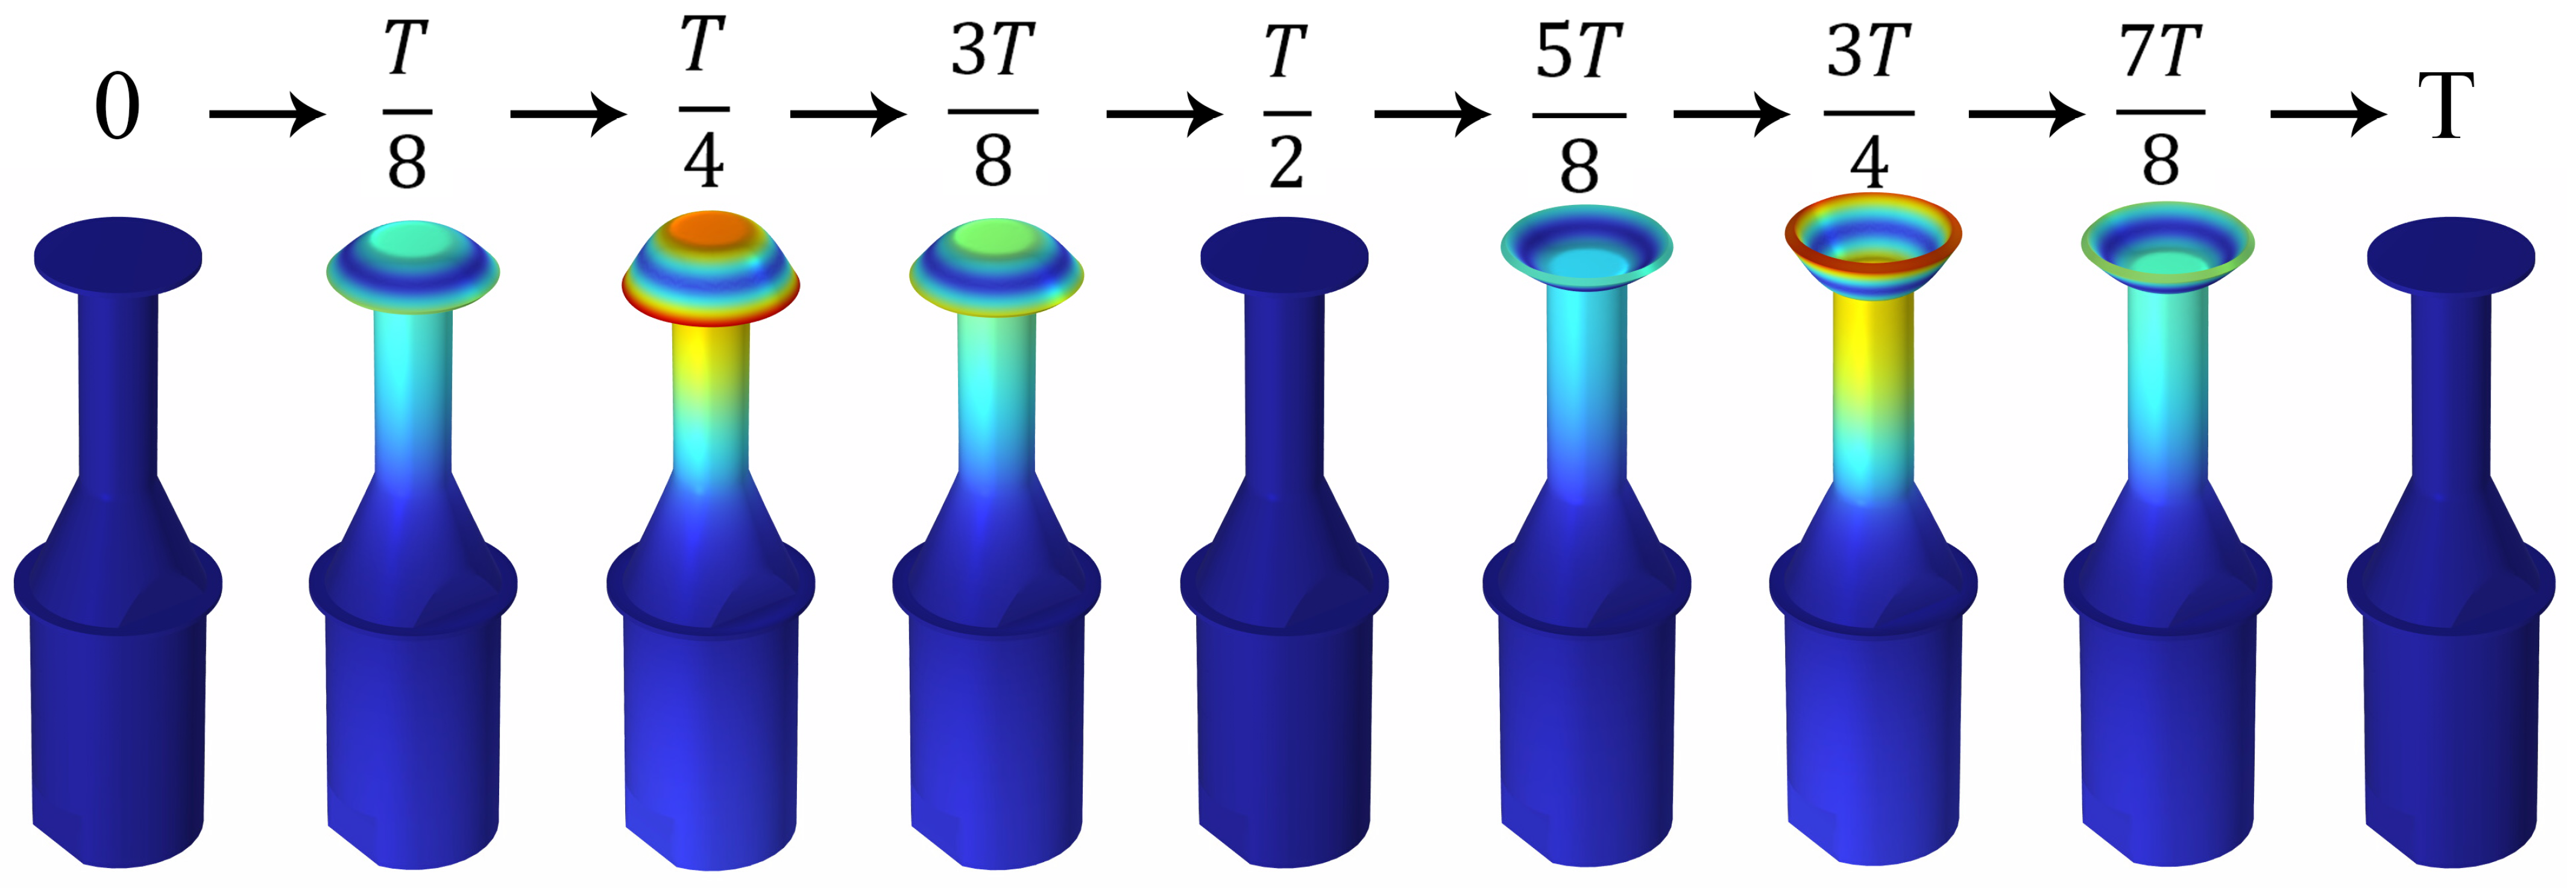
Therefore, the first stage of numerical investigation was dedicated to modal analysis of the UAPS, with the aim of identifying the natural frequency and vibration mode suitable for UAPS operation. The boundary conditions were set as described above. The calculated modal response is shown in
Figure 2.
As shown in
Figure 2, the modal response of the UAPS combines the longitudinal vibration mode of the Langevin transducer with the second bending mode of the disc-shaped radiator. The superposition of these vibration modes converts the longitudinal motion of the transducer into the bending vibration of the radiator, thereby generating acoustic pressure in the air duct. The calculated mode at 49.71 kHz was therefore selected for subsequent analysis of the generated ultrasonic acoustic field.
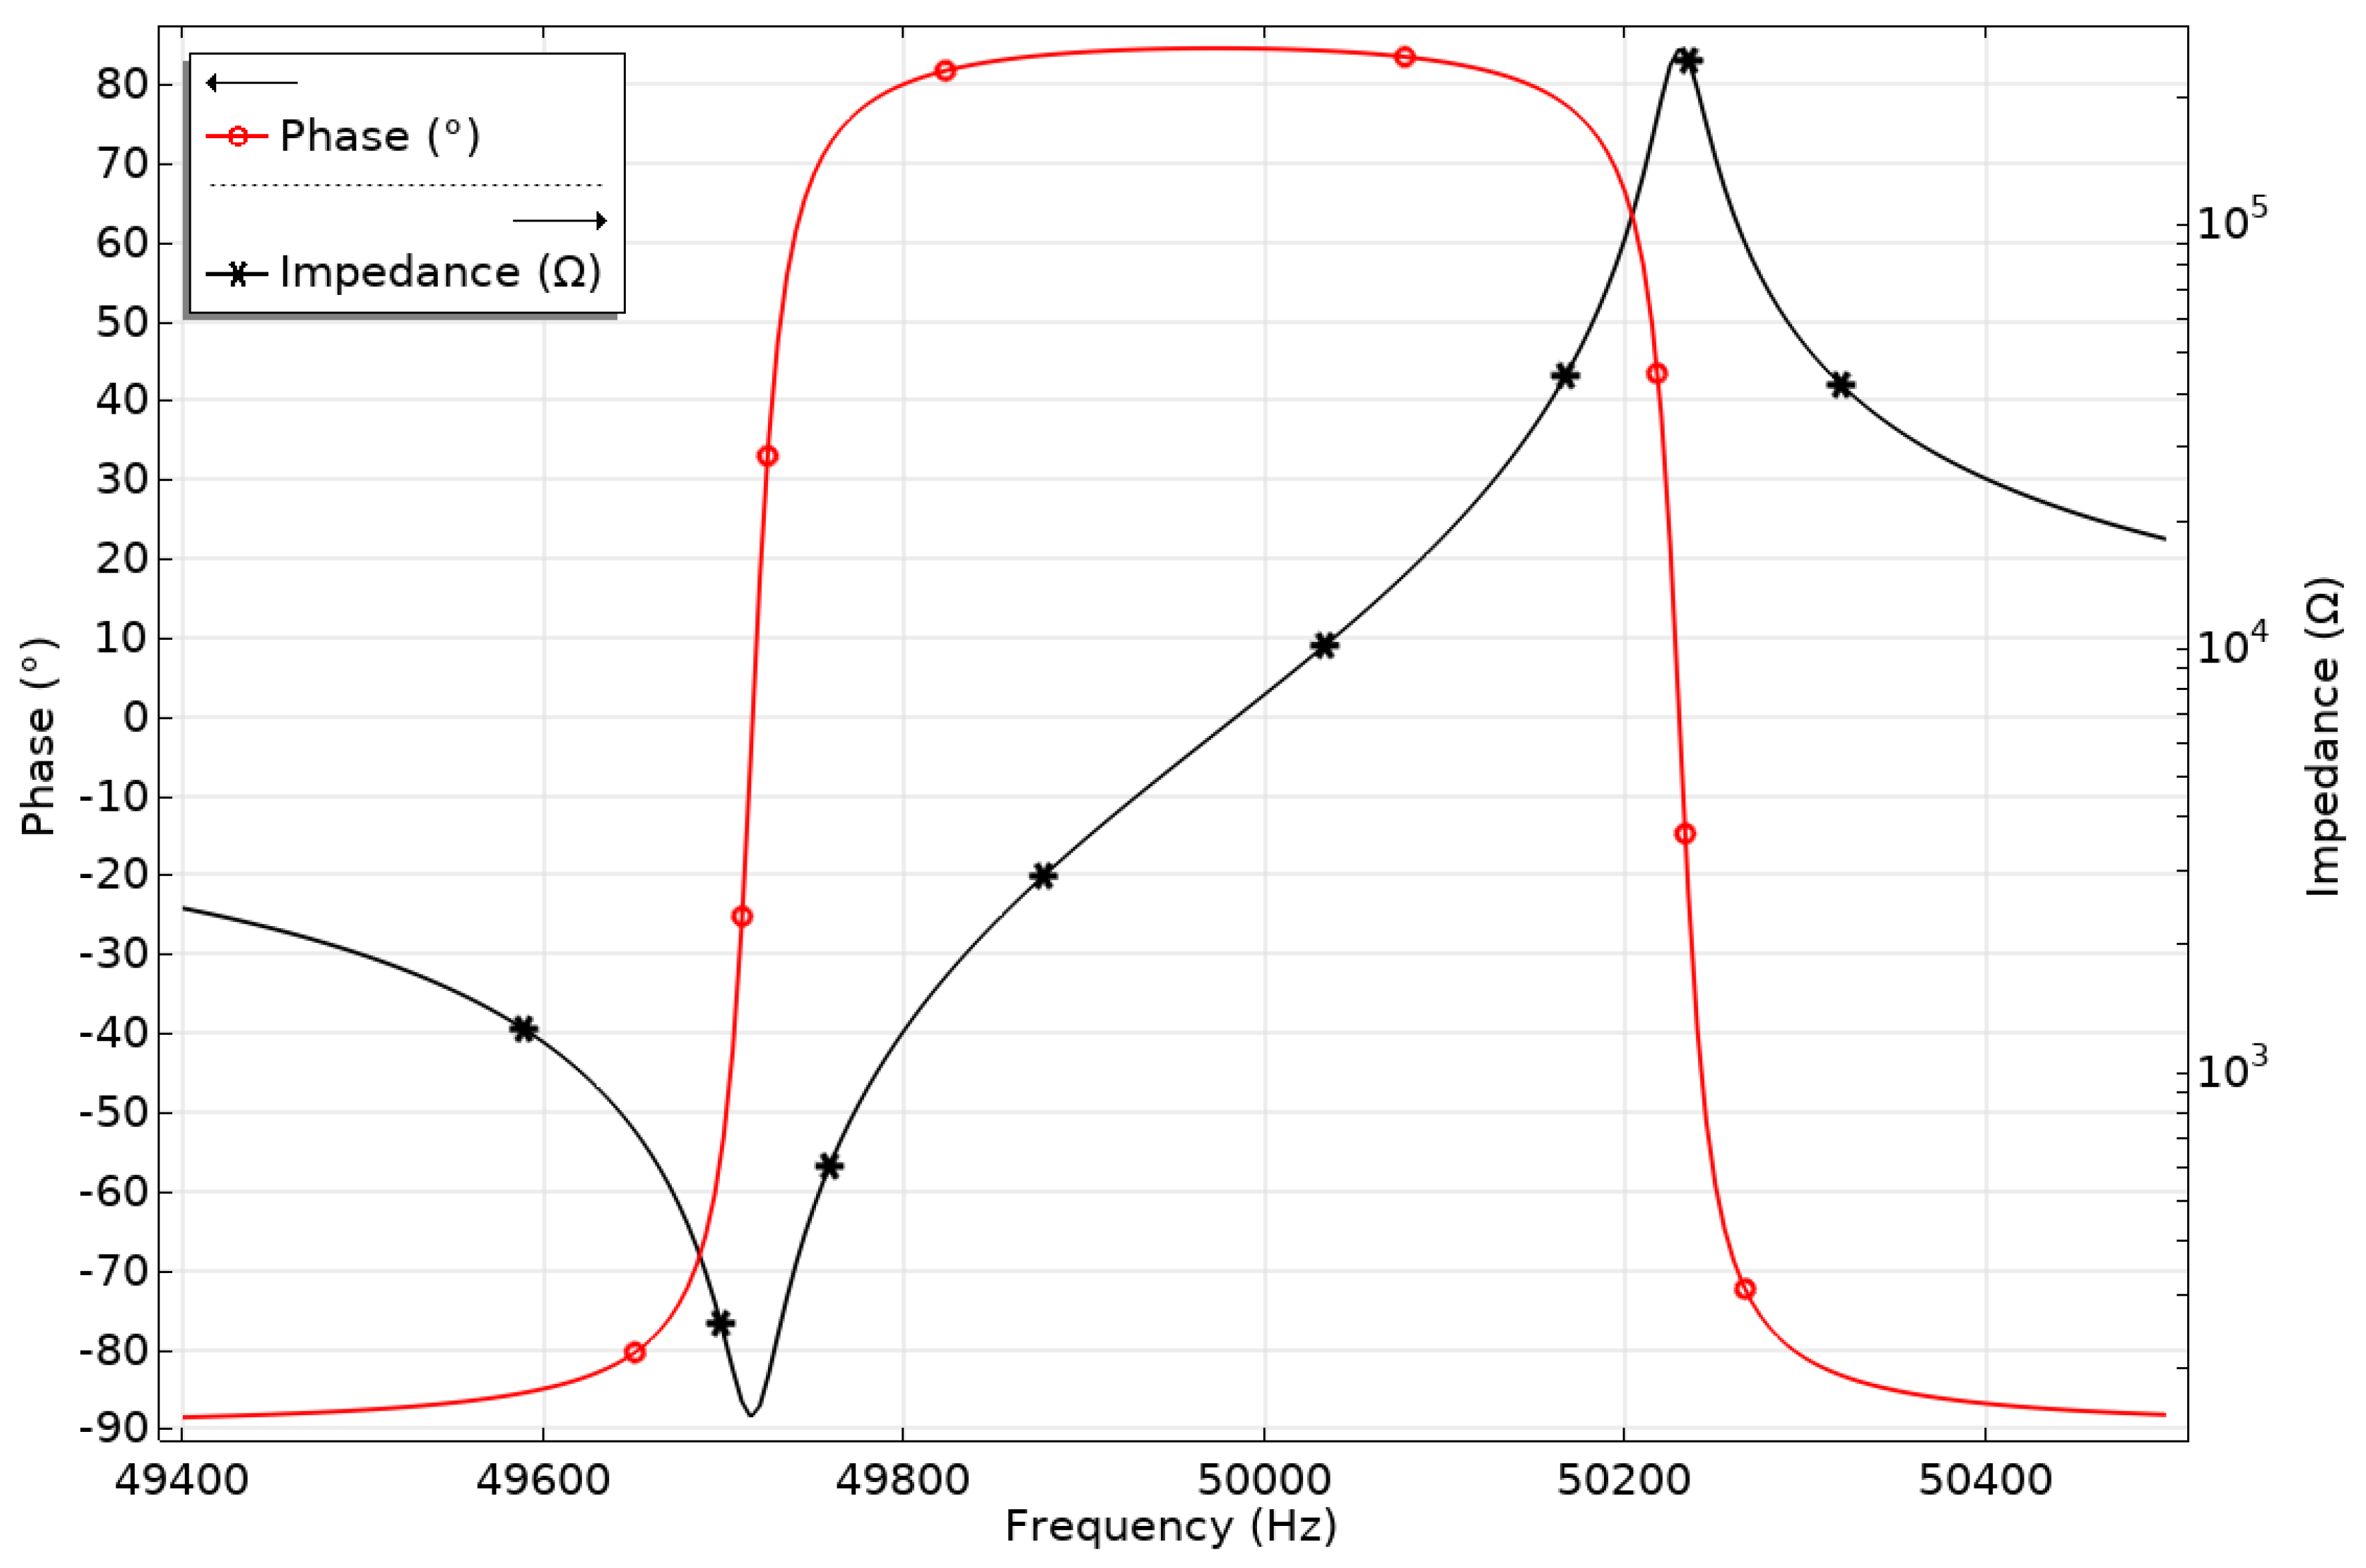
The next stage of the numerical investigation focused on calculating the impedance and phasefrequency characteristics of the UAPS to evaluate its electromechanical response. The calculations were performed in the frequency domain over the range 49.4–50.5 kHz, with a frequency step of 5 Hz. The boundary conditions were the same as those described above. The calculated results are shown in
Figure 3.
The numerically calculated impedance-phase characteristics of the piezoelectric ultrasonic acoustic pressure source (
Figure 3) show a distinct resonance–anti-resonance response. The resonance frequency, identified from the minimum impedance, is 49.71 kHz, where the impedance decreased to 152.77 Ω. These results are consistent with the modal-analysis results shown in
Figure 2. The anti-resonance frequency, corresponding to the maximum impedance, was approximately 50.23 kHz, where the impedance increased to about 259 kΩ. The large difference between resonance and anti-resonance impedance indicates strong electromechanical interaction in the investigated frequency range. Based on the resonance and anti-resonance frequencies, the effective electromechanical coupling coefficient,
keff, was calculated as and reached 0.143, corresponding to 14.3% (Equation (37)). This confirms that the UAPS operates in a well-defined resonant regime and is suitable for generating an intensive ultrasonic acoustic field.
Here,
fa is the antiresonance frequency;
fr is the resonance frequency.
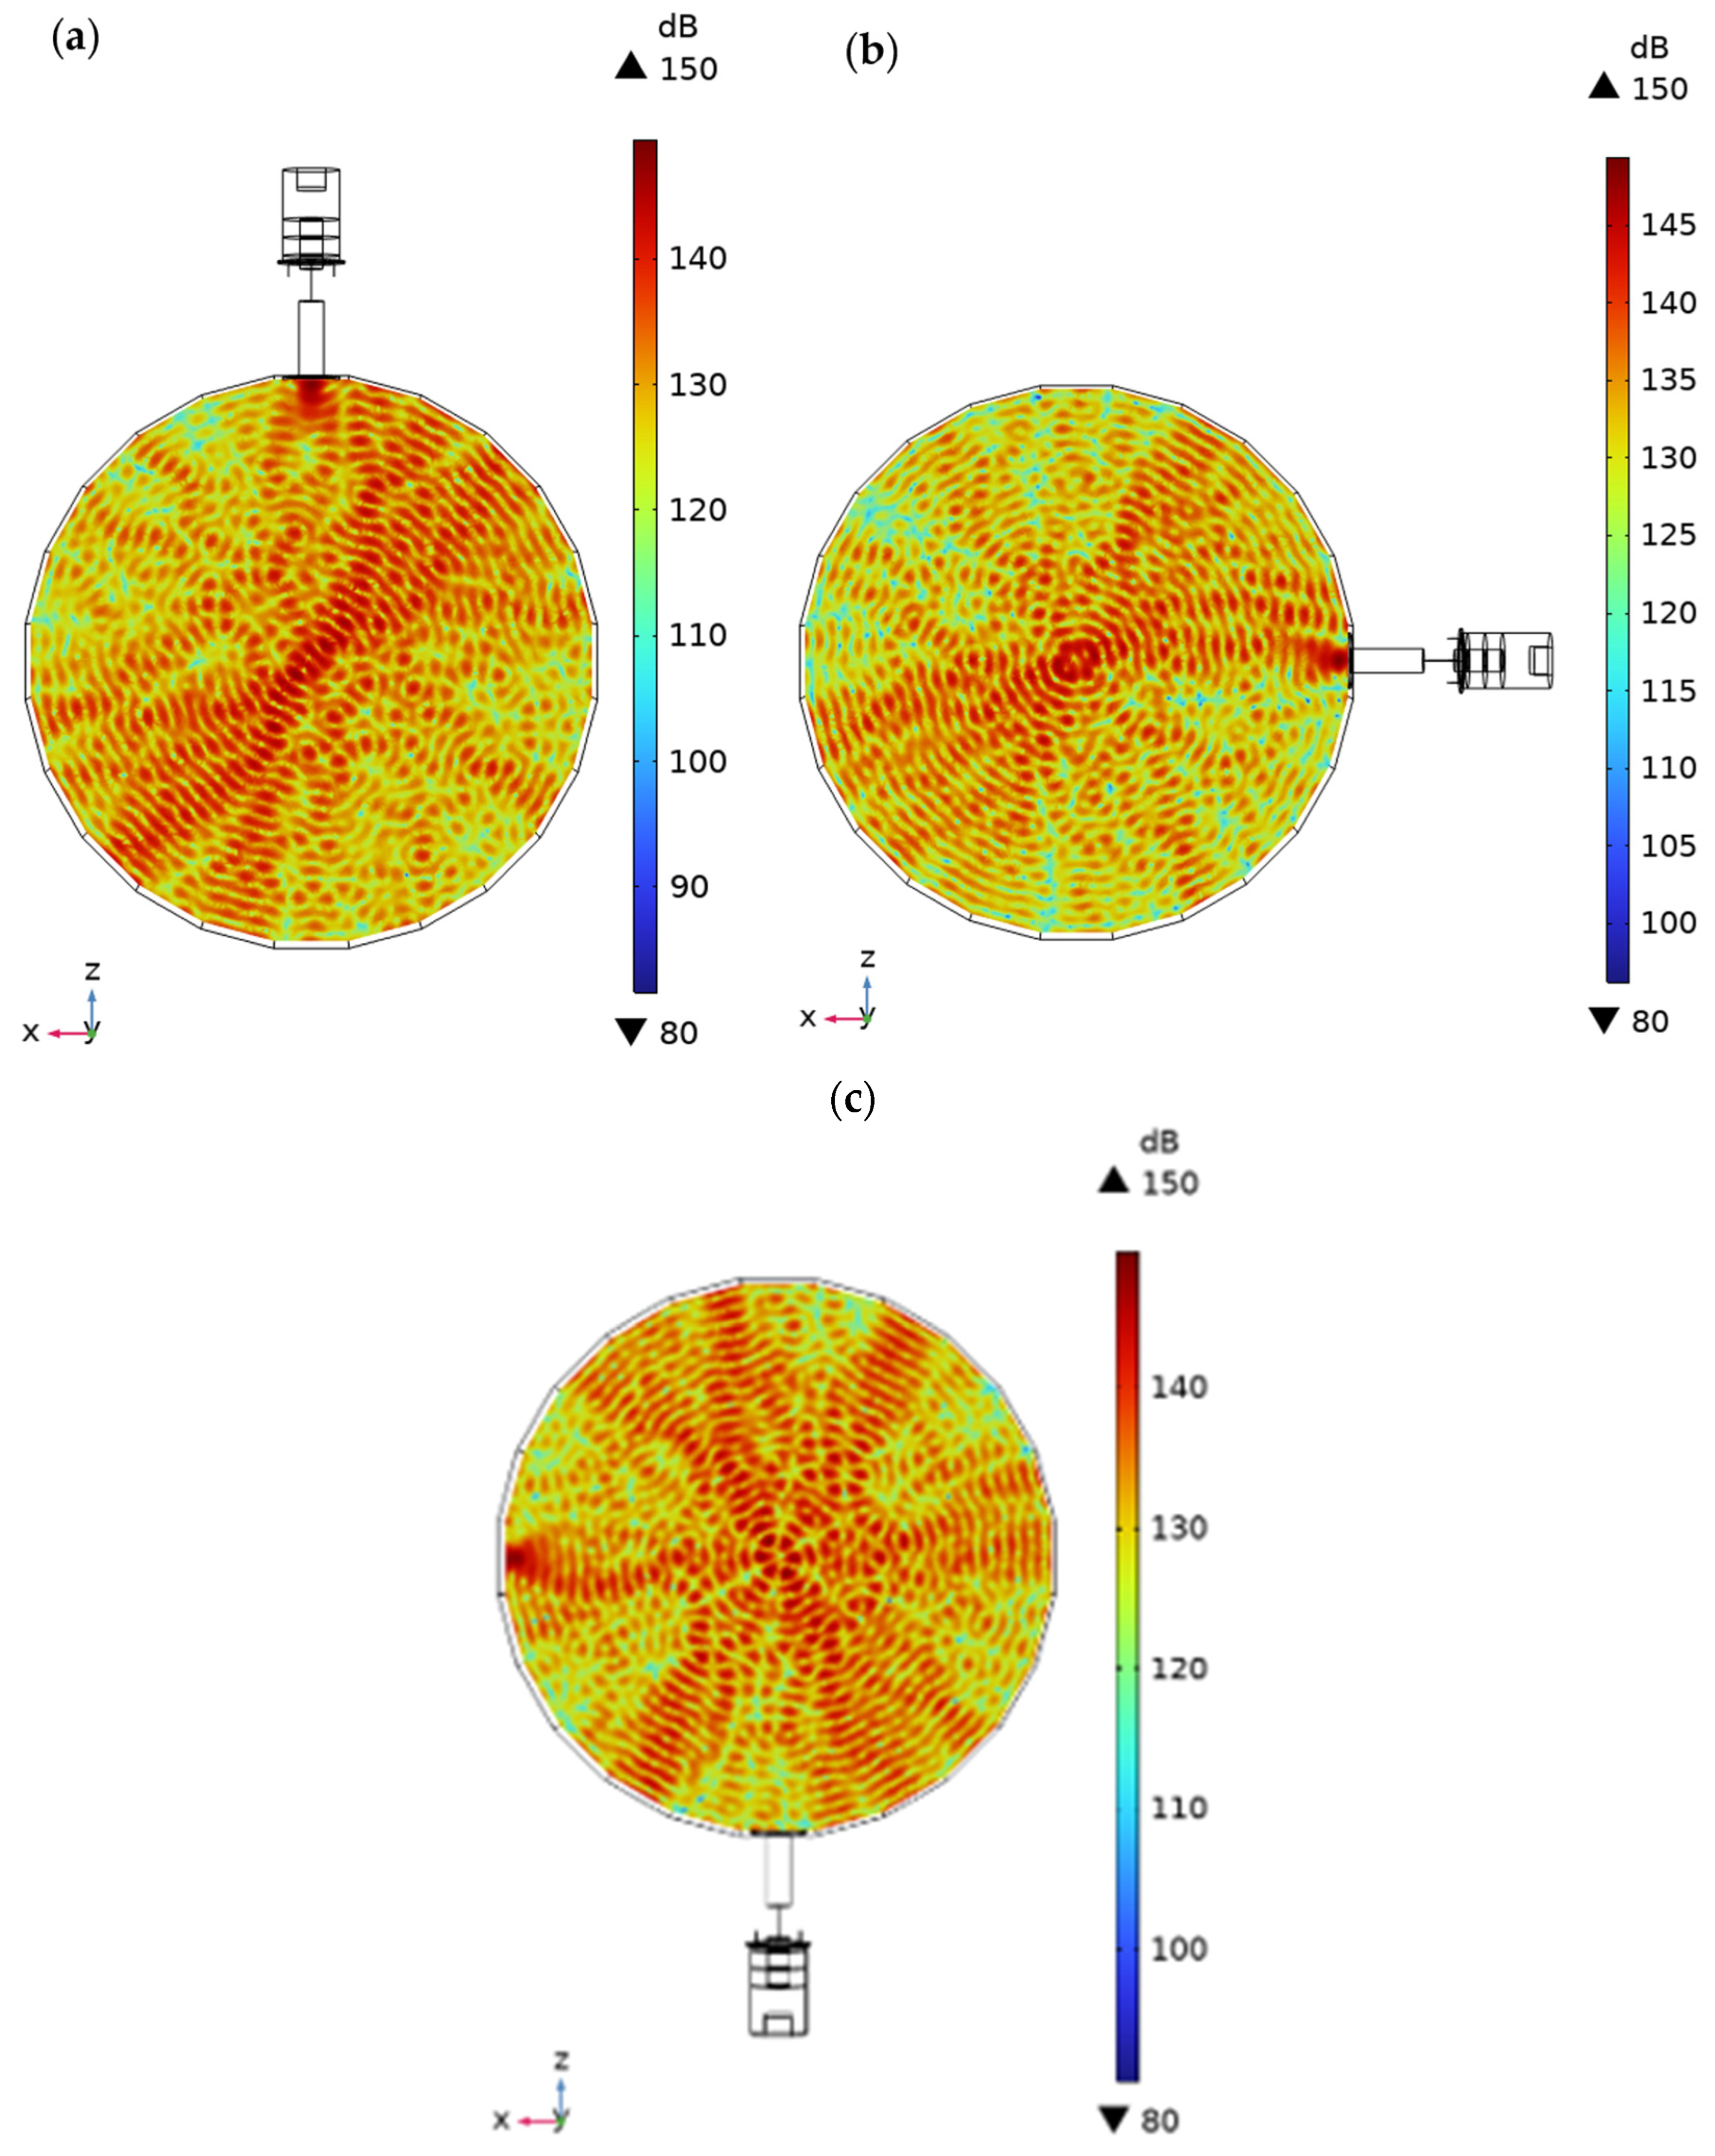
The subsequent acoustic-field and acoustic radiation-force simulations were performed at the numerically determined resonance frequency of 49.71 kHz. This frequency was selected because it corresponds to the resonance of the numerical UAPS model and therefore, represents the resonant operating condition of the simulated system. The experimentally measured resonance frequency was 49.35 kHz, corresponding to a difference of 360 Hz, or approximately 0.73%. Because the spatial acoustic-field distribution is governed by interference and pressure gradients, even this relatively small frequency difference may produce local changes in the positions and magnitudes of pressure nodes, antinodes, and high-gradient regions. Therefore, the calculated cross-sectional SPL and radiation-force distributions should be interpreted specifically as predictions at the numerical resonance frequency of 49.71 kHz rather than as exact representations of the field at the experimentally measured resonance frequency. The results of the calculations are given in
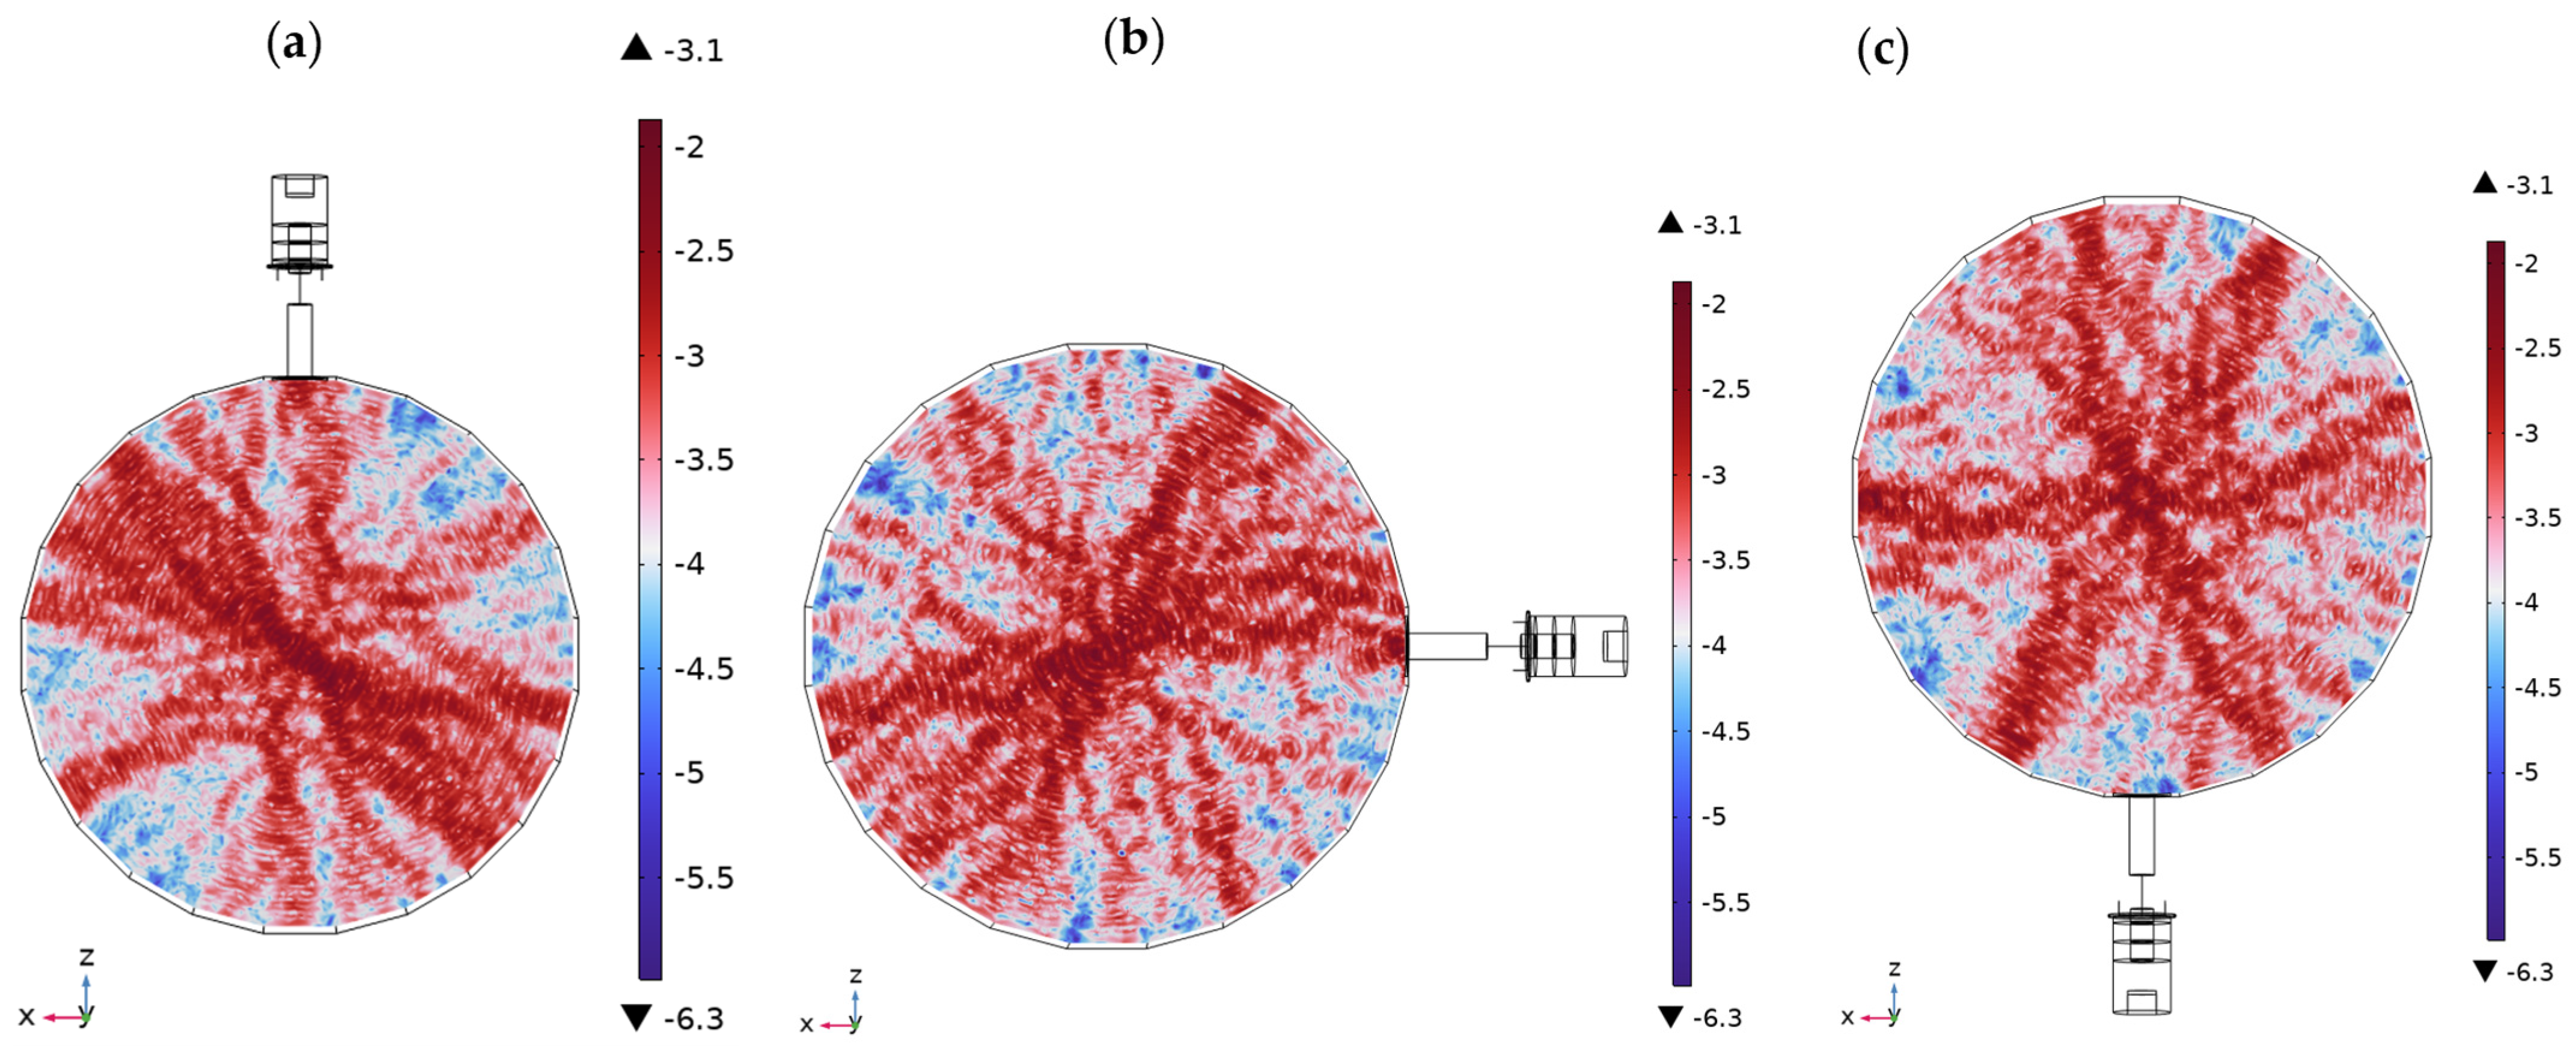
Figure 4.
The numerically calculated SPL distributions indicate that the orientation of the acoustic pressure source affects the spatial structure of the acoustic field in the 150 mm air duct. For the 0° configuration, the predicted maximum SPL reached 149 dB, while the minimum value was 81.6 dB, corresponding to a dynamic range of 67.4 dB. For the 90° and 180° configurations, the predicted maximum SPL values were 149 dB and 150 dB, respectively, whereas the corresponding minimum values were 96.2 dB and 97.1 dB. Thus, the numerical model predicts a smaller SPL variation for the 90° and 180° orientations and a larger proportion of the duct cross-section exposed to relatively high acoustic-pressure levels. The calculated spatial patterns result from interference between the incident acoustic wave and reflections from the duct walls. Because the spatial distribution of acoustic pressure determines acoustic-energy gradients, these numerical results suggest that changing the source orientation can modify the magnitude and direction of the acoustic radiation-force field and, consequently, the expected particle-migration pathways. The cross-sectional SPL distributions shown in
Figure 4 should therefore be interpreted as numerical predictions.
Although the 0° and 180° configurations are geometrically symmetric with respect to the circular duct cross-section, the complete coupled structural–acoustic model is not symmetric with respect to the applied loading because gravitational acceleration remains fixed in the global negative z-direction. Repositioning the UAPS, therefore, changes the direction of gravitational loading relative to that of the transducer and disc-shaped radiator, which can modify the vibration response and the resulting amplitude and phase distribution of the acoustic field generated by the radiator. The generated field subsequently interacts with waves reflected from the duct walls. Their superposition produces different local interference patterns, acoustic-pressure amplitudes, phase distributions, and spatial pressure gradients. Consequently, the calculated SPL distributions for the 0° and 180° configurations are not identical, despite the geometrical symmetry of the duct cross-section.
The acoustic radiation-force magnitude was subsequently calculated for each investigated source orientation. The numerical boundary conditions were unchanged from the those in the preceding analysis, and the calculated results are shown in
Figure 5.
The acoustic radiation-force distributions shown in
Figure 5 were calculated using the Gor’kov formulation for an isolated spherical particle with a diameter of
dp = 1 μm. The particle density was set to
ρp = 2650 kg/m
3, corresponding to the Arizona test dust used in the experiments, while the particle speed of sound was set to
cp = 5600 m/s. The corresponding particle compressibility, calculated by Equation (38), was 1.2 × 10
−11 Pa
−1. The surrounding medium was air at 293.15 K and atmospheric pressure. The acoustic radiation-force magnitude,
Frad, obtained from the gradient of the Gor’kov potential has units of N. For the investigated particle diameter of 1 μm, the particle radius was 0.5 μm, and the corresponding spherical particle volume was 5.236 × 10
−19 m
3. The acoustic-field calculation was performed at 49.71 kHz. The density and speed of sound of the surrounding air were evaluated at 293.15 K and atmospheric pressure using the material properties implemented in COMSOL Multiphysics.
Because the calculated force magnitude spans several orders of magnitude across the duct cross-section, a logarithmic representation was used for visualization. The dimensionless quantity plotted in
Figure 5 was defined as
where
Fref = 1 nN. Thus,
Flog = 0 corresponds to an acoustic radiation-force magnitude of 1 nN, while negative values indicate forces below 1 nN. The logarithmic transformation was used only for visualization. The dimensional acoustic radiation-force values reported below were obtained directly from the calculated
Frad field in COMSOL Multiphysics.
For the 1 μm particle shown in
Figure 5, the dimensional acoustic radiation-force values were evaluated directly from the calculated
Frad field in COMSOL Multiphysics rather than from the logarithmic color-scale limits. The maximum calculated primary acoustic radiation-force magnitudes were 5.21 × 10
−13 N (0.521 pN), 6.28 × 10
−13 N (0.628 pN), and 6.79 × 10
−13 N (0.679 pN) for the 0°, 90°, and 180° configurations, respectively. Thus, the maximum local force magnitudes were of the same order for all three source orientations, with the highest value obtained for the 180° configuration. The differences among the configurations are therefore expressed primarily through the spatial distribution and directional composition of the radiation-force field rather than through large differences in the maximum force magnitude. The difference between the 0° and 180° acoustic radiation-force distributions in the present model is attributed to the symmetry-breaking effect of the fixed-direction gravitational loading in the coupled structural–acoustic model and the resulting modification of the acoustic interference field. Because gravity remains fixed in the global coordinate system while the UAPS is repositioned, the mechanical loading relative to the transducer and disc-shaped radiator changes between the two configurations. The resulting differences in the radiator response modify the amplitude and phase distribution of the generated acoustic field, which subsequently interacts with wall-reflected waves to produce different local acoustic-energy gradients. Because the acoustic radiation force is determined by the spatial gradient of the Gor’kov potential, differences in acoustic-pressure amplitude and phase can modify both the local force magnitude and more importantly, the spatial distribution and directional composition of the calculated radiation-force field. Therefore, the numerical difference between the 0° and 180° configurations should be interpreted as a consequence of the coupled effect of fixed-direction gravitational loading and the resulting acoustic interference field rather than as an effect of the circular-duct geometry or opposite acoustic propagation direction alone.
Within the adopted Gor’kov formulation, and assuming unchanged particle material properties and acoustic field, the acoustic radiation force scales with particle volume and therefore, with the cube of particle diameter:
Here,
Vp is volume of the spherical particle;
dp is diameter of the spherical particle.
Consequently, the values for particles larger than 1 μm were not obtained from separate acoustic-field simulations but were estimated analytically from the directly evaluated 1 μm radiation-force field. Under the assumptions of the present model, a 2 μm particle experiences approximately eight times, and a 5 μm particle approximately 125 times, the primary radiation force calculated for a 1 μm particle. Using the directly evaluated 1 μm maximum-force values, the corresponding maximum-force estimates are approximately 4.17 pN and 65.1 pN for the 0° configuration, 5.02 pN and 78.5 pN for the 90° configuration, and 5.43 pN and 84.9 pN for the 180° configuration, for particle diameters of 2 μm and 5 μm, respectively. These values should be interpreted as approximate scaling estimates rather than as independently simulated force magnitudes. Although particles up to 10 μm remain well within the wavelength-based Rayleigh regime at approximately 50 kHz, the classical Gor’kov model does not explicitly include thermoviscous boundary-layer effects, particle–particle interactions, or particle-induced modification of the acoustic field. Therefore, the dp3 scaling is used here primarily to indicate the expected size dependence of the primary radiation force and should not be regarded as a quantitative prediction of the response of the experimentally measured 5–10 μm particle fraction.
In addition, the indicated force distributions are caused by spatial gradients of acoustic energy density generated by interference between the incident wave, reflected waves, and duct-wall boundary conditions. Therefore, the maximum acoustic radiation force does not necessarily coincide with the maximum SPL, but appears in regions where the Gor’kov potential changes most rapidly. These results indicate that UAPS orientation primarily affects the spatial distribution and directional composition of the acoustic radiation-force field, while the calculated maximum local force magnitudes remain of the same order for the three investigated configurations. This is important for acoustic agglomeration, because larger particles are more strongly affected by the acoustic field and may migrate more rapidly toward high-gradient regions, increasing the probability of interaction with smaller particles. Consequently, the orientation of the UAPS can influence particle trajectories, velocity magnitude, residence time in acoustically active zones, local particle concentration, and ultimately, the experimentally observed aerosol redistribution.
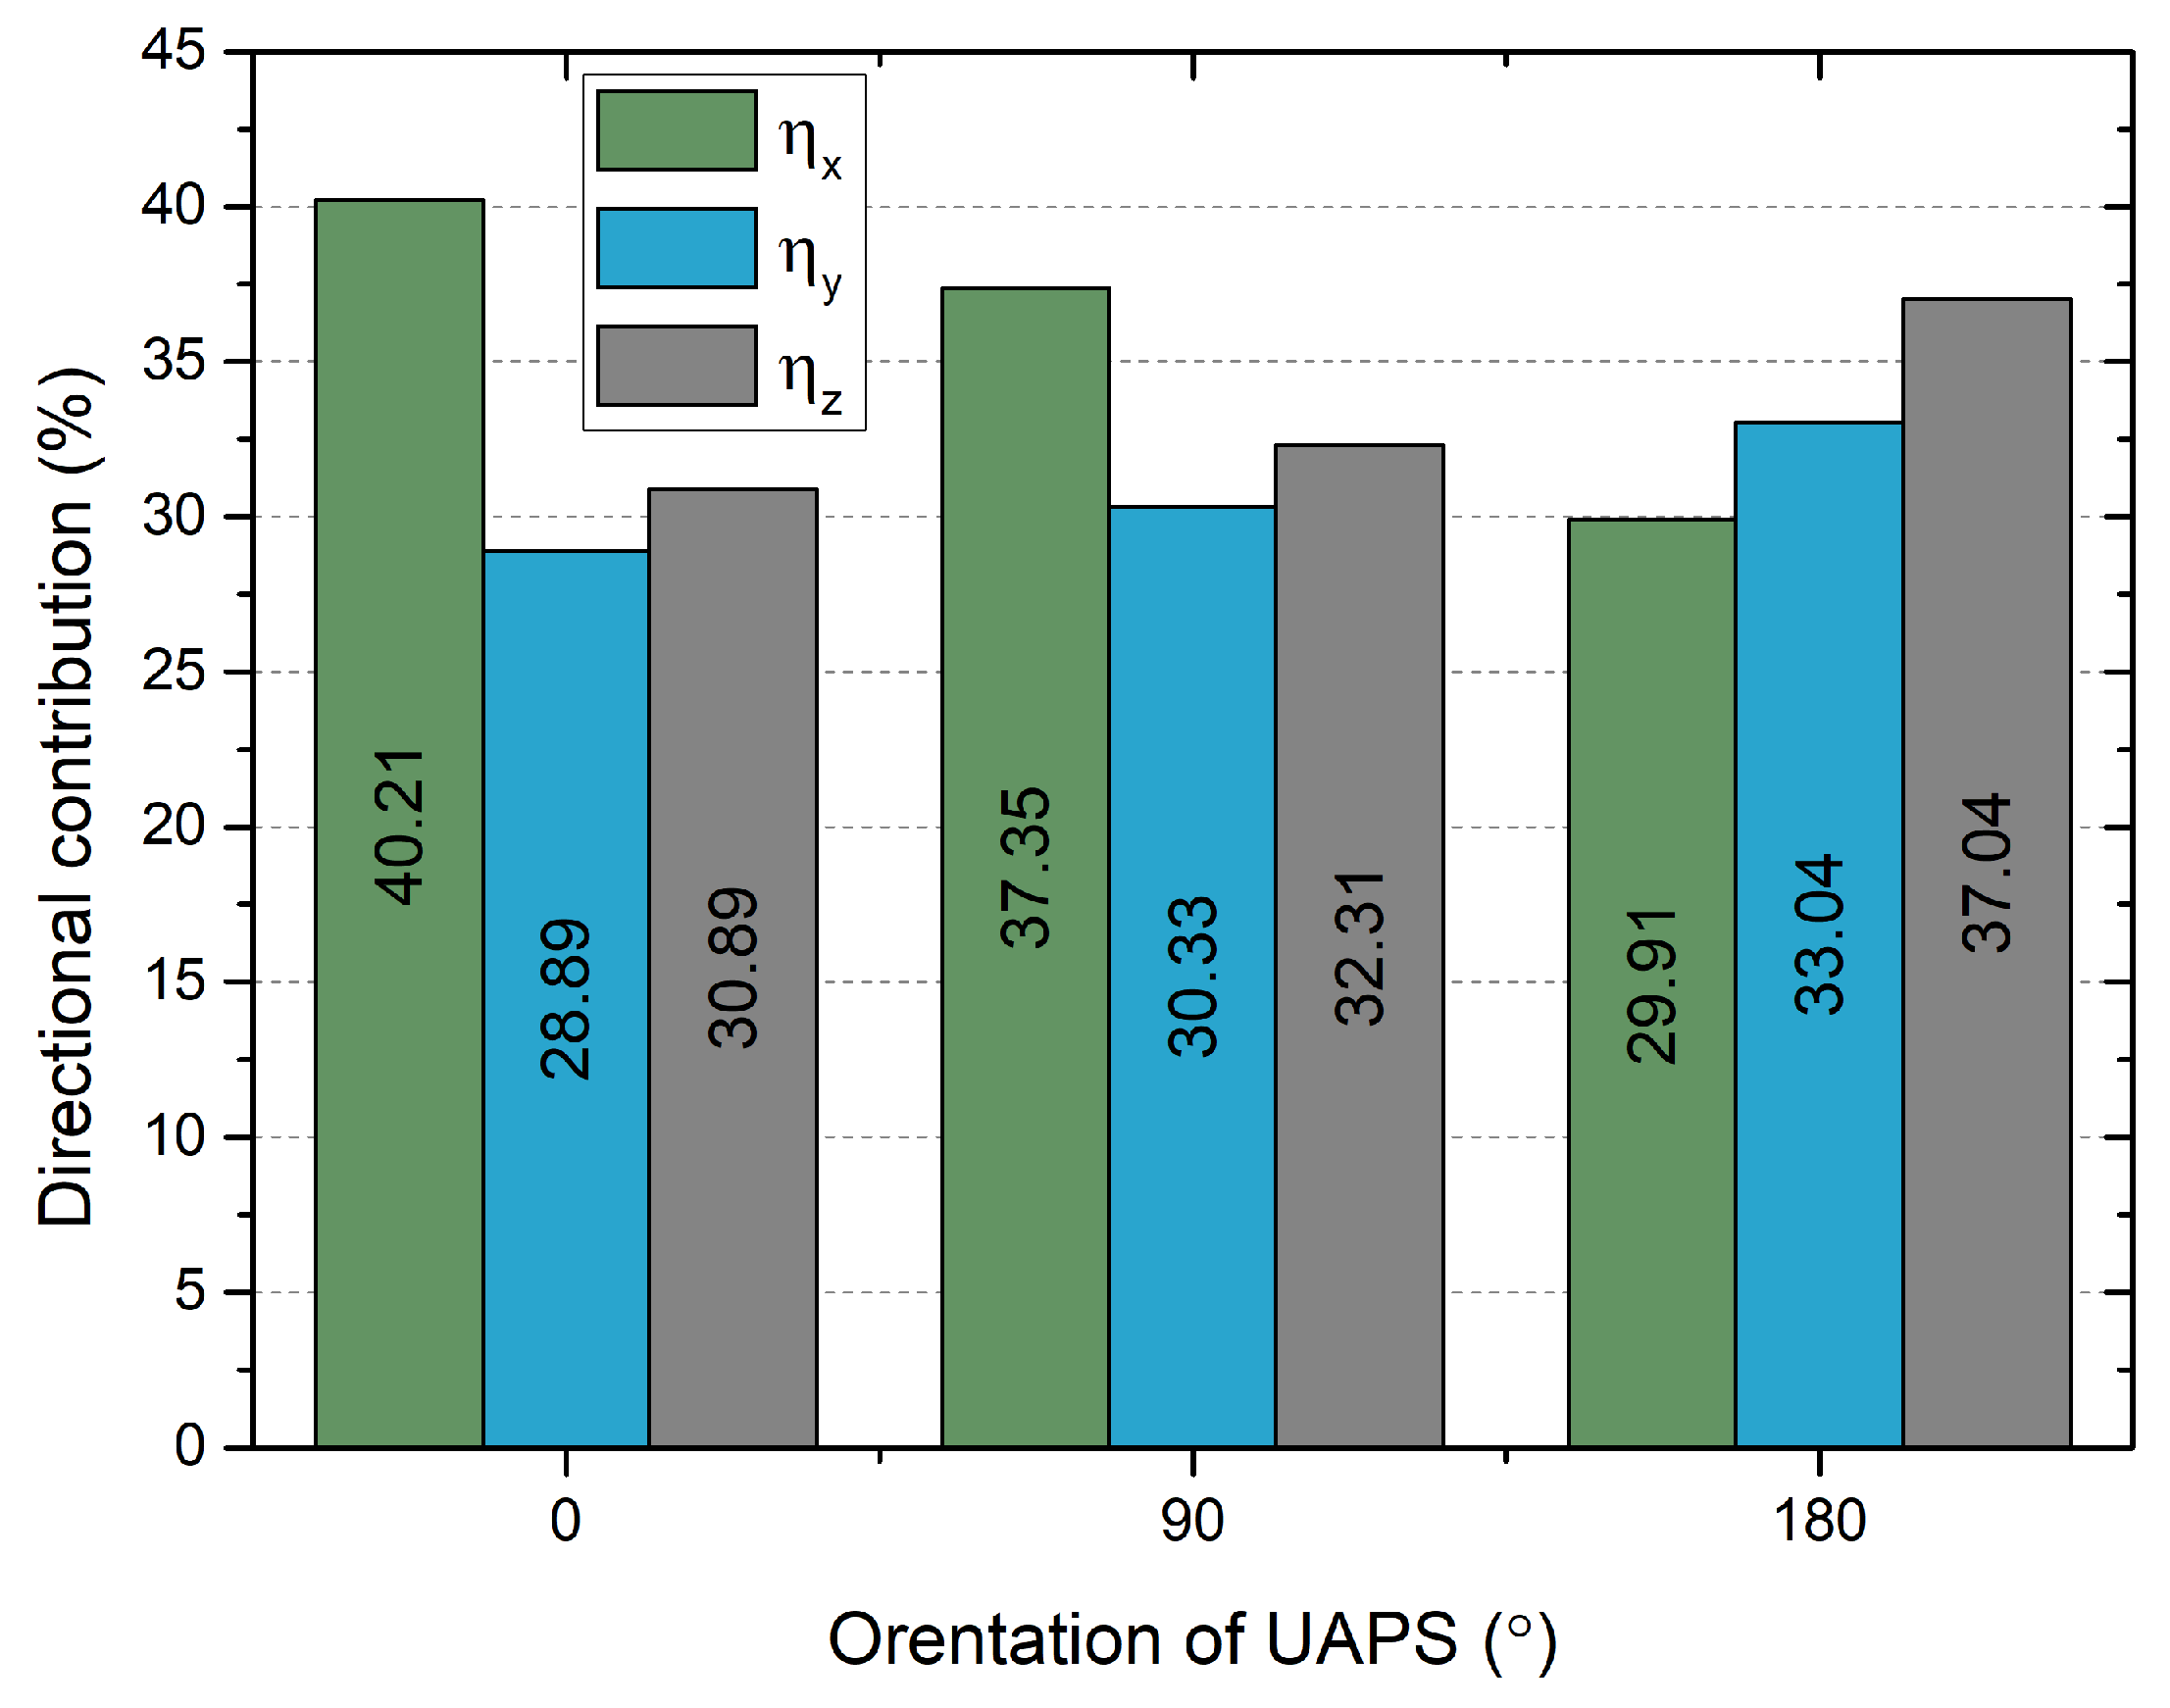
Finally, directional dominance coefficients were calculated for all three cases. For this purpose, Equations (33)–(35) were used. Results of the calculations are given in
Figure 6.
The directional dominance coefficients of the acoustic radiation-force field are presented in
Figure 6. For the 0° orientation of the UAPS, the force field was dominated by the horizontal component, with η
x of 40.21%, while the axial and vertical components were η
y of 28.89% and η
z of 30.89%, respectively. This indicates that the 0° configuration mainly promotes horizontal particle migration across the duct cross-section. For the 90° orientation, the horizontal contribution remained dominant but decreased to η
x = 37.35%, whereas the axial and vertical contributions increased to η
y of 30.33% and η
z of 32.31%, respectively. This shows that rotation of the source from 0° to 90° redistributes part of the acoustic radiation-force field from the horizontal direction toward the axial and vertical directions. The most pronounced redistribution was observed for the 180° orientation, where the horizontal contribution decreased to η
x reached 29.91%, while the axial and vertical contributions increased to η
y of 33.04% and η
z of 37.04%, respectively. In this case, the vertical component became dominant. These results demonstrate that the orientation of the UAPS changes not only the magnitude and spatial distribution of the acoustic radiation force, but also its directional composition. Since the coefficients were calculated from squared force components, positive and negative local force regions did not cancel each other, allowing the directional strength of the interference force field to be quantified. The obtained results indicate that the 0° and 90° configurations are more favorable for inducing horizontal particle migration, whereas the 180° configuration produces a stronger vertical contribution, which may influence particle settling, wall deposition, residence time, and consequently, aerosol redistribution.
The differences between the 0° and 180° directional-force coefficients are interpreted in the present model as being consistent with the symmetry-breaking effect of fixed-direction gravitational loading and the resulting modification of the coupled structural–acoustic interference field. Although the circular duct itself is geometrically symmetric, the complete set of structural loading conditions is not rotationally equivalent for the 0° and 180° source positions. The resulting differences in the generated acoustic field modify the spatial distribution of the Gor’kov-potential gradients and consequently, the directional composition of the calculated acoustic-radiation force.
4. Experimental Investigation of Size-Dependent Aerosol Particle Redistribution
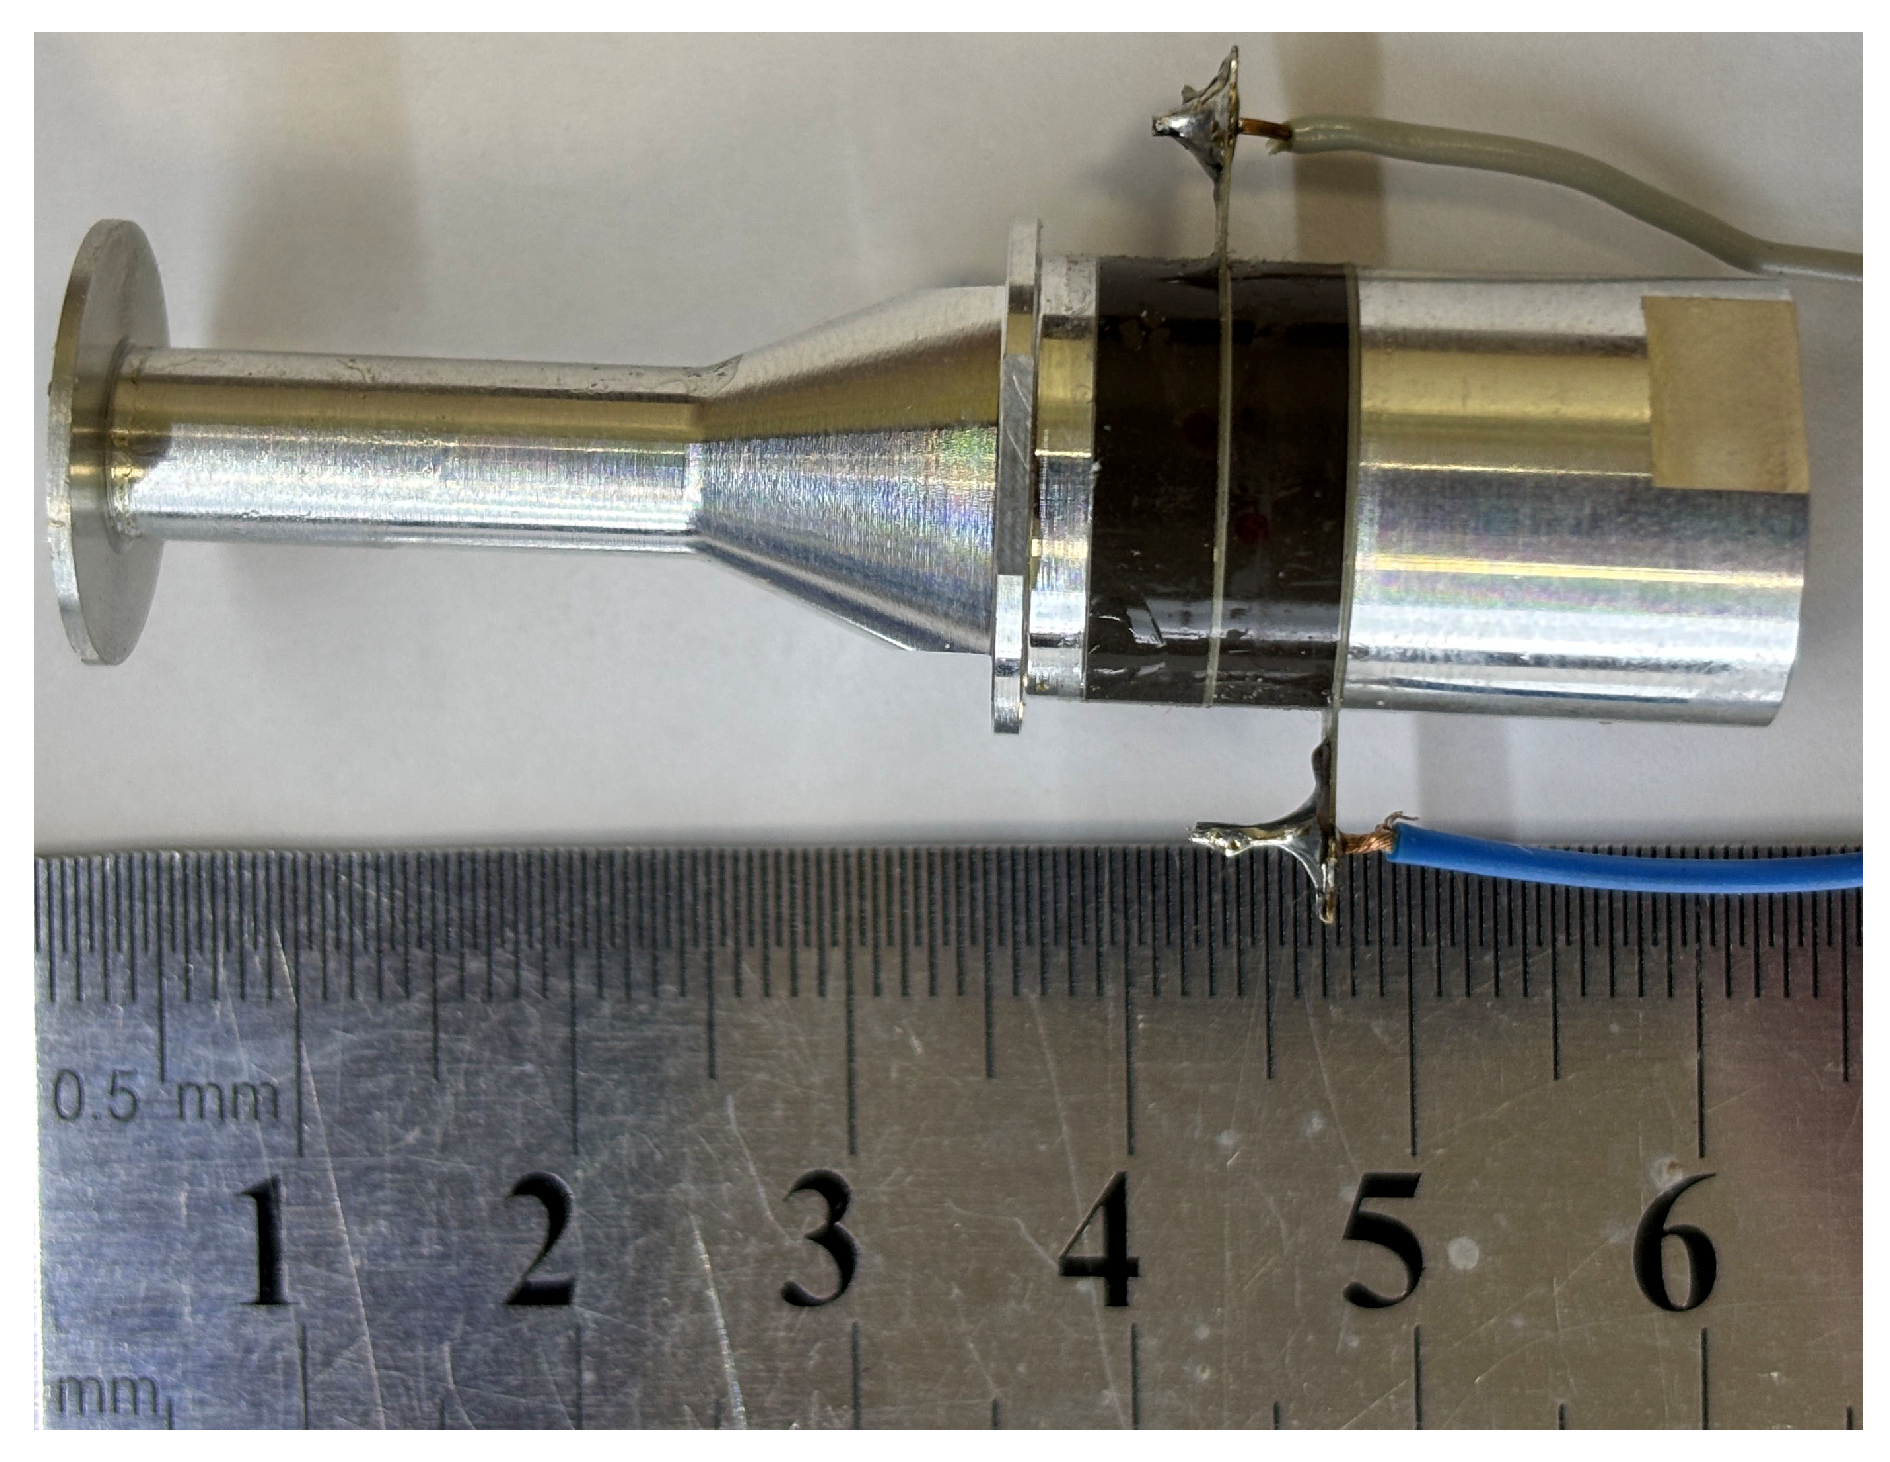
A prototype UAPS was fabricated to experimentally investigate the effect of source orientation on the aerosol response. A view of the UAPS prototype is shown in
Figure 7.
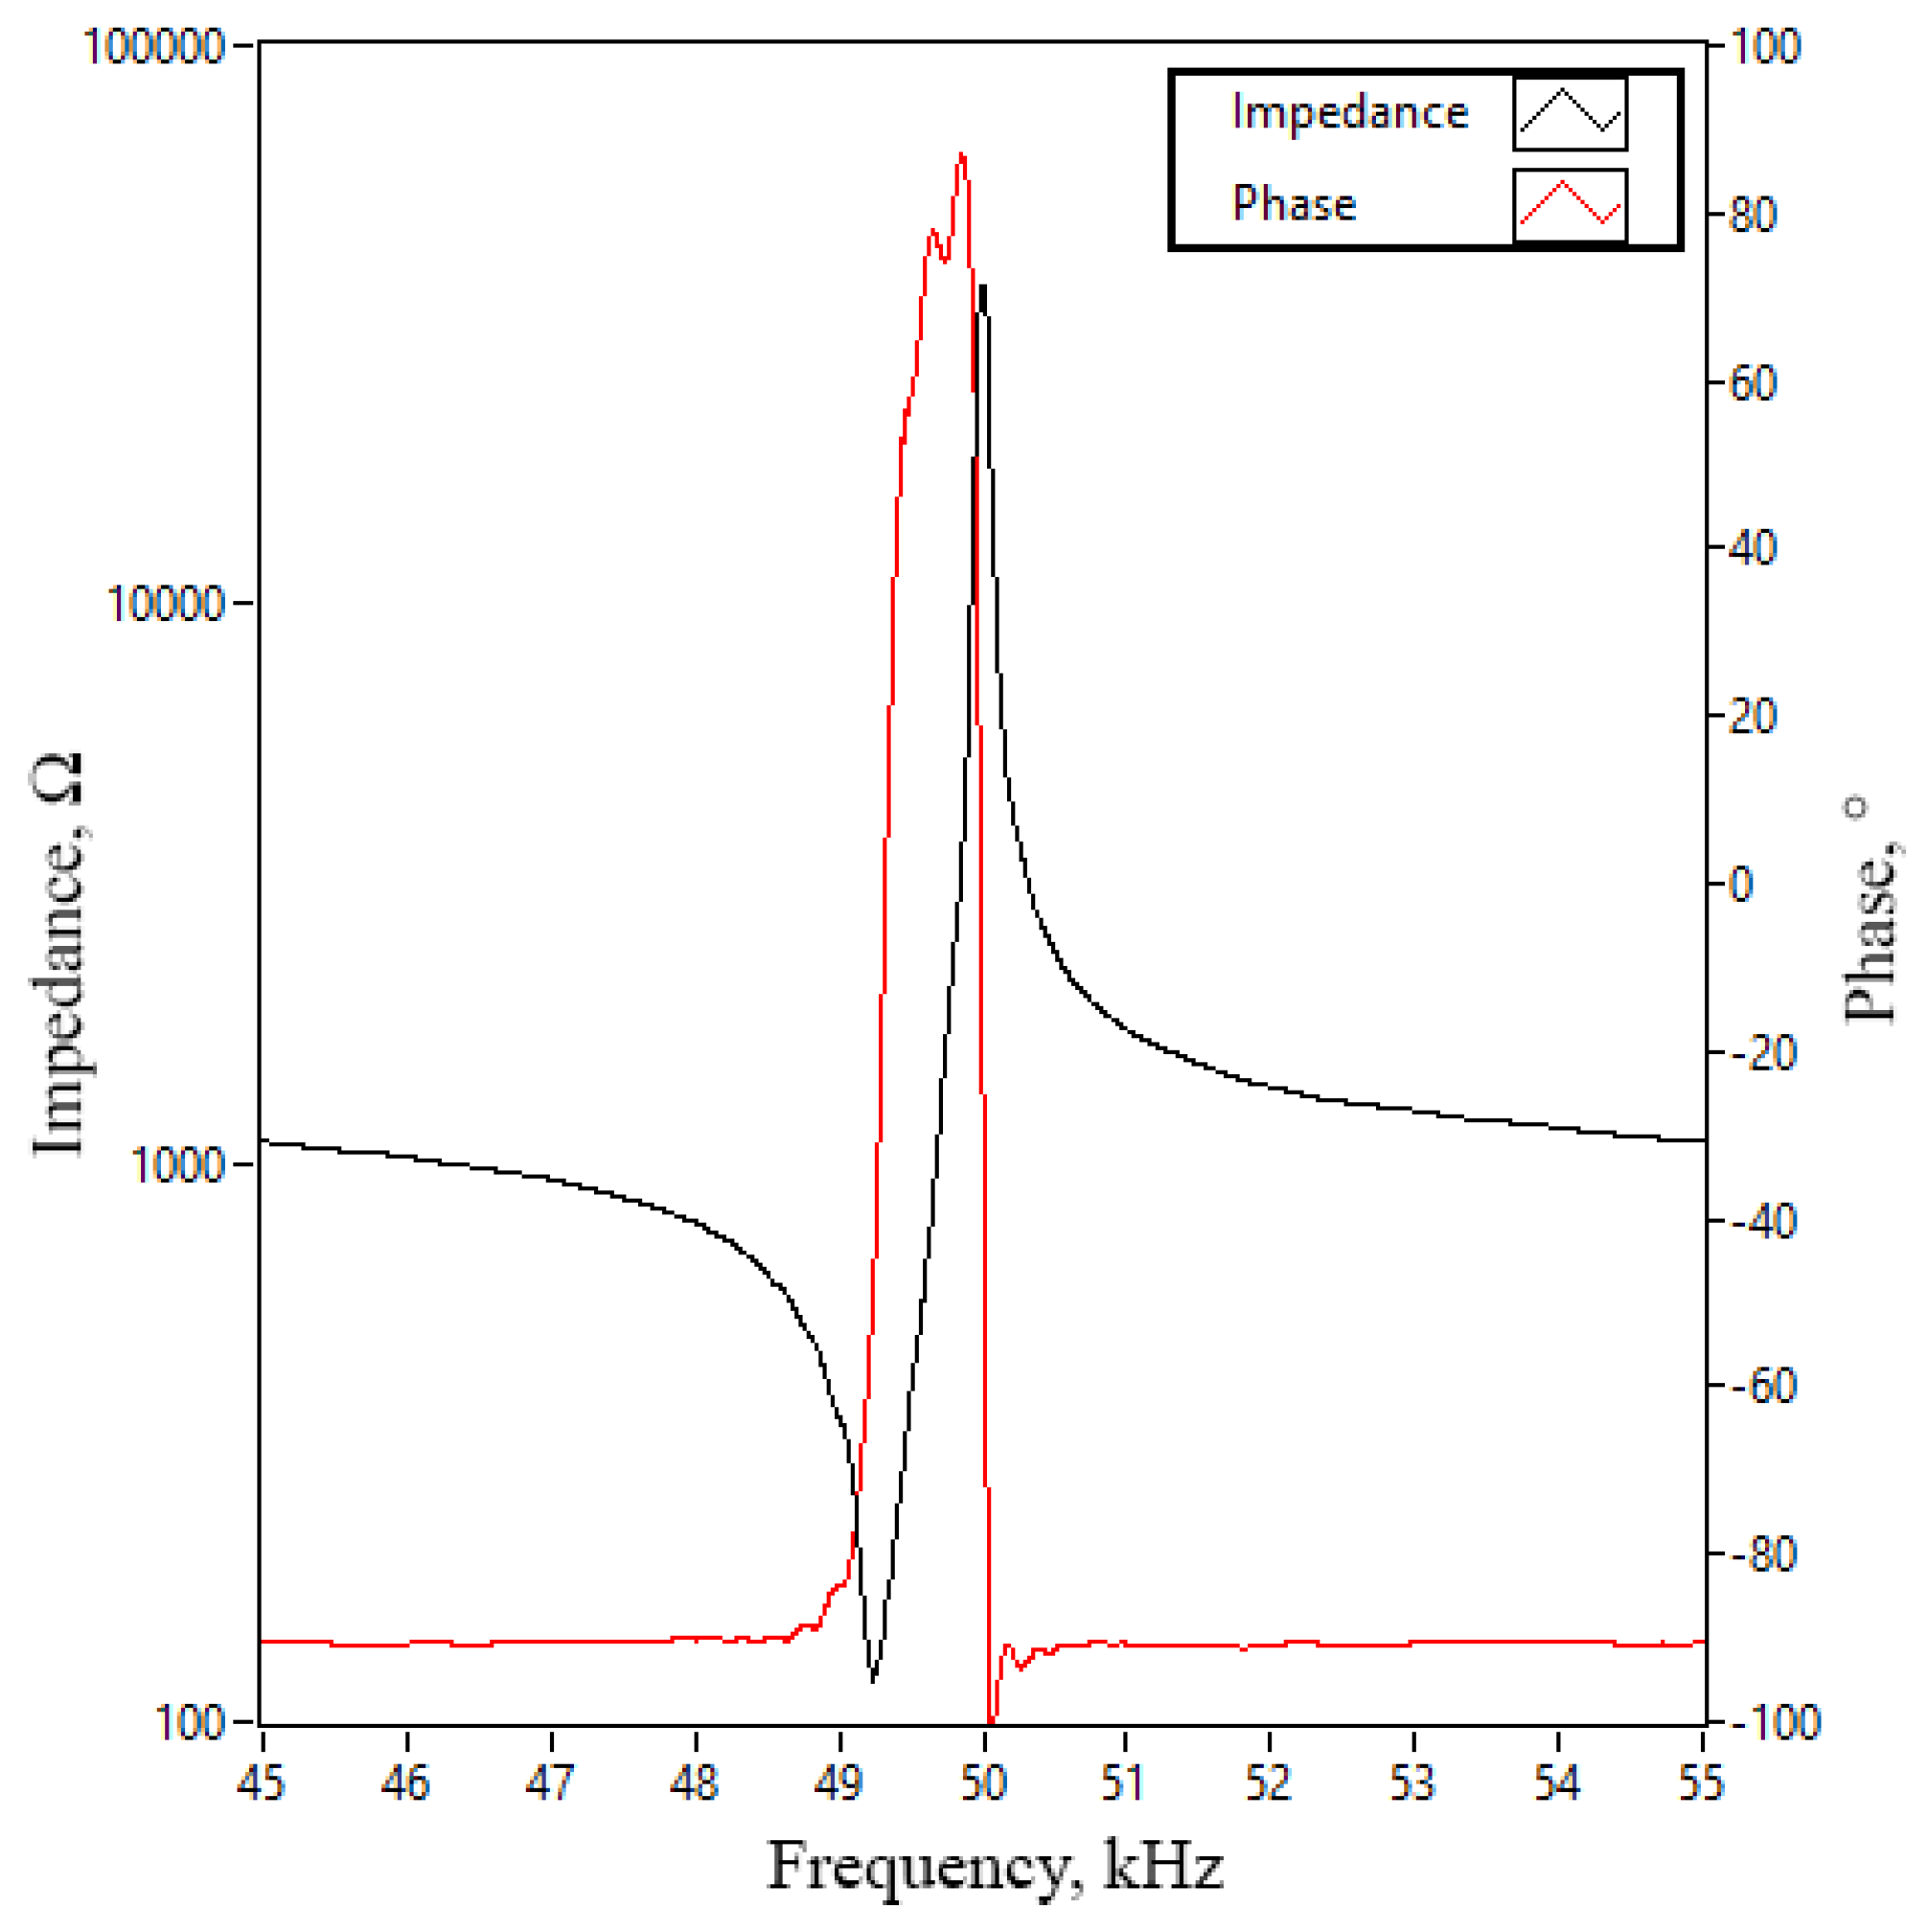
Therefore, the first experimental investigation was dedicated to measurements of impedance and phase frequency characteristics. For this purpose, the SinPhase 16777k impedance analyzer (SinePhase, Mödling, Austria) was set up to perform measurements in the range from 45 kHz to 55 kHz, with a measurement step of 5 Hz. During measurement, the UAPS was clamped rigidly via the clamping ring. The results of the measurements are shown in
Figure 8.
Analysis of
Figure 8 shows that the UAPS exhibits a resonance frequency of 49.35 kHz and an anti-resonance frequency of 50.23 kHz. The corresponding impedance values are 132.82 Ω and 36.84 kΩ, respectively. Based on the measured resonance and anti-resonance frequencies, the effective electromechanical coupling coefficient of the UAPS prototype was determined to be keff = 0.186, corresponding to 18.6%, according to Equation (37).
Comparison with the numerical results presented in
Figure 3 shows that the measured resonance frequency is 360 Hz lower than the numerically predicted value of 49.71 kHz. At resonance, the measured impedance of 132.82 Ω is approximately 19.95 Ω lower than the calculated value of 152.77 Ω. The anti-resonance frequencies show very good agreement, with both the numerical and experimental results yielding approximately 50.23 kHz. However, a substantially larger difference is observed in regards to the anti-resonance impedance, i.e., the numerical model predicts approximately 259 kΩ, whereas the measured value is 36.84 kΩ.
The considerably lower experimental anti-resonance impedance can be attributed to losses and parasitic effects that are only partially represented in the numerical model. In particular, the anti-resonance impedance magnitude is highly sensitive to mechanical and dielectric losses in the piezoceramic material, damping at the interfaces between the piezoceramic rings and metallic components, clamping and preload conditions, electrode and contact resistance, and parasitic capacitance associated with the electrical wiring and measurement system. Manufacturing and assembly tolerances may additionally modify the effective mechanical and electrical properties of the assembled transducer. These effects dissipate energy and reduce the experimentally observed anti-resonance impedance peak, whereas the numerical model represents the transducer using idealized material properties, interfaces, electrical connections, and boundary conditions.
Despite the difference in anti-resonance impedance magnitude, the close agreement of the resonance and anti-resonance frequencies indicates that the numerical model adequately predicts the principal electromechanical resonance behavior of the UAPS. The remaining discrepancy, particularly in the anti-resonance impedance amplitude, indicates that a more detailed representation of dielectric, mechanical, interface, and electrical losses would be required for quantitative prediction of the complete impedance-frequency response.
The SPL measurement was performed at the center of the air-duct cross-section and was repeated nine times. At the resonance frequency and an excitation voltage of 200 V
p−p, the measured SPL reached 147 dB, with a deviation of ±0.28 dB. This measurement provides an experimental reference for the acoustic-pressure magnitude at the duct center. However, because SPL was measured at only one spatial position, the experiment does not constitute a validation of the complete cross-sectional SPL distribution predicted by the numerical model. Consequently, the spatial patterns shown in
Figure 4 should be interpreted as numerical predictions, while the experimental measurement confirms only that the fabricated UAPS generates an acoustic-pressure magnitude at the duct center comparable to that expected from the model.
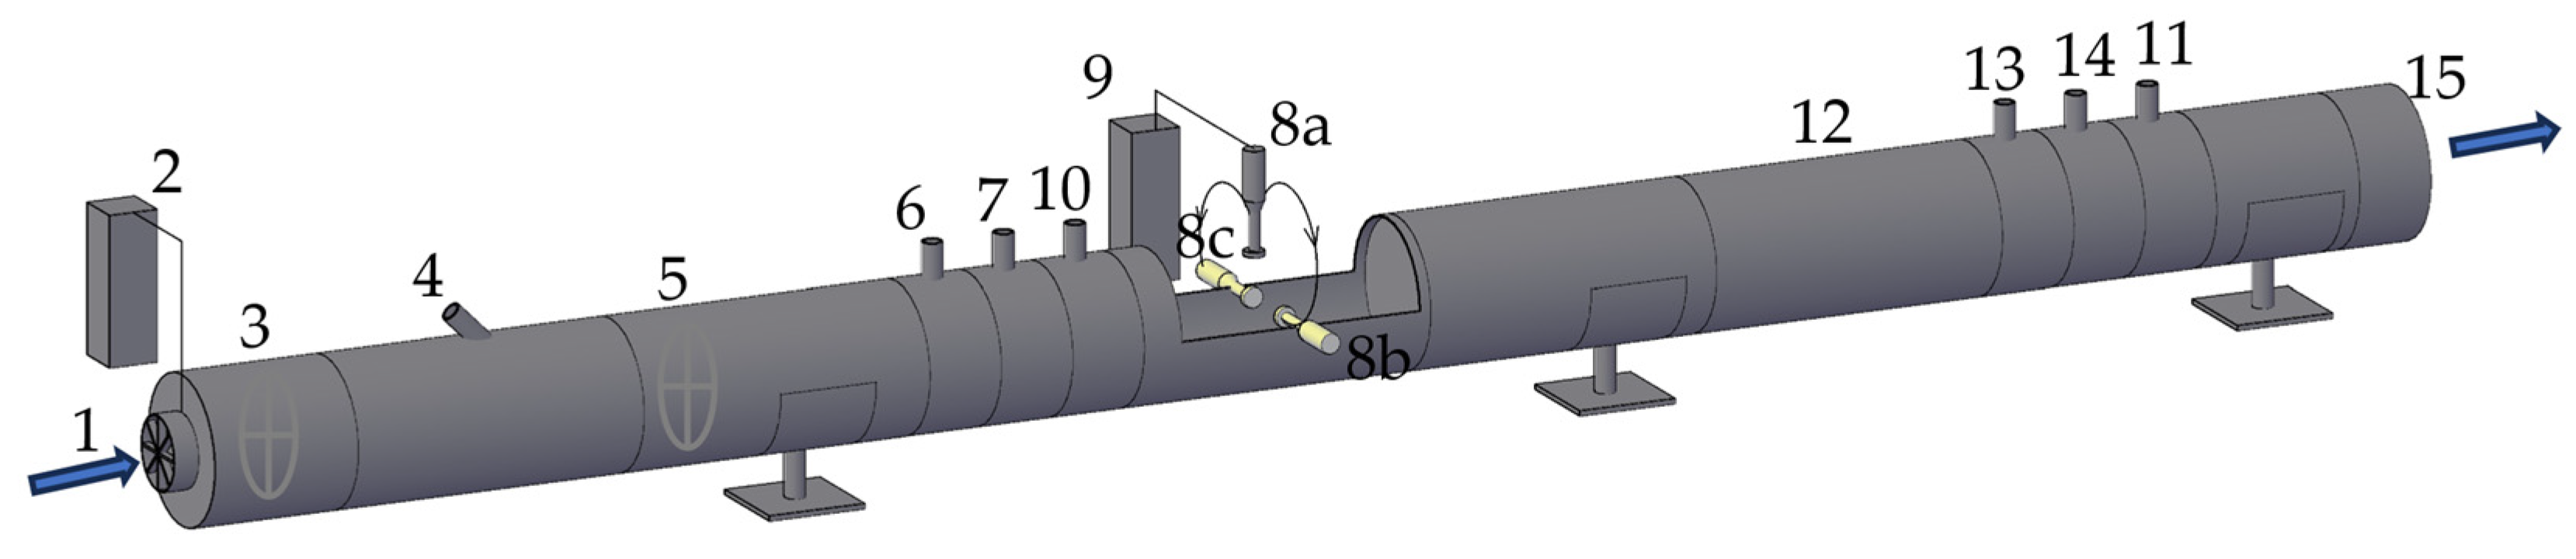
The effect of the UAPS-generated acoustic field on aerosol behavior was investigated using a specially designed test rig equipped to generate, condition, monitor, and regulate the aerosol-laden airflow (
Figure 9). The primary airflow was supplied by the first axial fan (1), whose operating conditions were controlled using a dedicated control unit (2). A honeycomb flow straightener was installed in the subsequent section (3) to reduce flow non-uniformity and suppress large-scale turbulence.
To artificially increase the particle concentration, solid particles were introduced into the airflow through an injection port (4) using a PALAS RBG 1000 solid-particle disperser (Palas GmbH, Karlsruhe, Germany). The device provided stable and repeatable particle dispersion into the airflow. The use of standardized test dust improved the repeatability and comparability of the experimental measurements. A second honeycomb flow straightener was installed in the subsequent section (5) to ensure a uniform distribution of the two-phase airflow. The following measurement sections were used to determine the upstream airflow velocity (6) and static pressure (7) immediately upstream of the ultrasonic acoustic-pressure source, installed in one of three orientations (8a–8c), together with the associated control equipment (9). The ultrasonic source was investigated in three angular orientations. Position 8a corresponded to an orientation angle of 90°. Position 8b corresponded to a rotation of 180° in the clockwise direction when viewed along the airflow direction, whereas position 8c corresponded to a rotation of 0° in the counterclockwise direction.
Particle number concentration was measured using isokinetic sampling probes installed upstream (10) and downstream (11) of the ultrasonic treatment zone. The upstream and downstream samples were collected sequentially rather than simultaneously because the measurement system used a single sampling pump. Sampling was switched between the two sensors, with an interval of approximately 10 s. Each sample was collected for 30 s at a sampling flow rate of 5 L/min, which was automatically regulated by the Palas measurement system. Isokinetic sampling was maintained by selecting the sampling-probe diameter according to the duct airflow velocity: 15 mm at 0.5 m/s and 12 mm at 1.0 m/s. The upstream and downstream sampling lines were identical, and their lengths were kept below 2 m in accordance with the instrument manufacturer’s recommendations. No additional correction for particle losses in the sampling lines was applied. Consequently, residual size-dependent sampling-line losses cannot be completely excluded. However, identical sampling-line configurations were used to minimize systematic differences between the upstream and downstream measurements. Immediately downstream of the ultrasonic source, a flow stabilization section (12) with a length of 4D was installed. Additional measurement points were subsequently provided for recording the downstream airflow velocity (13) and static pressure (14). In the final section, the air duct was connected to an exhaust pipe (15) leading to a ventilation chamber equipped with airflow rate control.
The experimental method quantifies changes in the particle-number size distribution between the upstream and downstream sampling positions. It does not directly identify particle–particle attachment or agglomerate morphology. Therefore, the measured changes are interpreted primarily as size-dependent particle migration and aerosol redistribution. Agglomeration may contribute to the observed response, but it cannot be distinguished unambiguously from migration, gravitational settling, wall deposition, or other transport mechanisms using particle-number concentration measurements alone. No matched ultrasound-OFF control was performed for each of the investigated operating conditions. Therefore, the present upstream-to-downstream measurements should not be interpreted as providing a quantitative separation of ultrasound-induced agglomeration from settling, wall deposition, cross-sectional migration, or other transport effects.
The experimental data were processed using individual repetitions obtained for each operating condition. Three independent repetitions were performed for the no-dosing experiment at an airflow velocity of 0.5 m/s, whereas five independent repetitions were performed for the no-dosing experiment at 1.0 m/s. Five independent repetitions were also performed for each experiment, with additional mechanical particle dosing. For each repetition, the overall change in particle number concentration was calculated from the integrated upstream and downstream particle number concentrations across the entire measured particle-size range.
where
Cup and
Cdown are the upstream and downstream particle number concentrations, respectively. Accordingly, positive values of Δ
C indicate a lower downstream particle number concentration, whereas negative values indicate a higher downstream concentration. The same expression was applied separately to each particle-size channel, using the corresponding upstream and downstream size-resolved concentrations.
The airflow velocity was measured using a Testo 440 dP multifunction measuring instrument (Testo SE & Co. KGaA, Titisee-Neustadt, Germany) with an accuracy of ±0.03 m/s ± 4% of the measured value.
Particle size distributions and particle number concentrations were measured upstream and downstream of the ultrasonic treatment section using a Palas welas 3000H digital aerosol spectrometer (Palas GmbH, Karlsruhe, Germany) with Palas welas 2300 (Palas GmbH, Karlsruhe, Germany) double sensors.
Arizona test dust was used throughout the experiments. The bulk density of the Arizona test dust was 500 kg/m3, and the particle density was 2650 kg/m3. Particle diameter at 50% cumulative volume was 1.082 µm.
Welch’s t-test was selected instead of the Student’s t-test because it does not require the assumption of equal variances and provides more reliable estimates for small experimental sample sizes. For each experimental condition, the arithmetic mean, standard deviation (SD), and 95% confidence interval (CI) were calculated from the repeated measurements. Pairwise comparisons between experimental conditions were performed using Welch’s two-sample t-test because of the unequal sample sizes and potential differences in variance. Differences among the three ultrasonic source orientations were additionally evaluated using one-way analysis of variance (ANOVA) and verified using the non-parametric Kruskal–Wallis test. Statistical significance was accepted at p < 0.05. Because the total particle number concentration is dominated by submicrometric particles, the integral concentration change was evaluated together with the size-resolved particle number concentration in order to distinguish overall aerosol changes from size-dependent particle redistribution induced by the ultrasonic acoustic field.
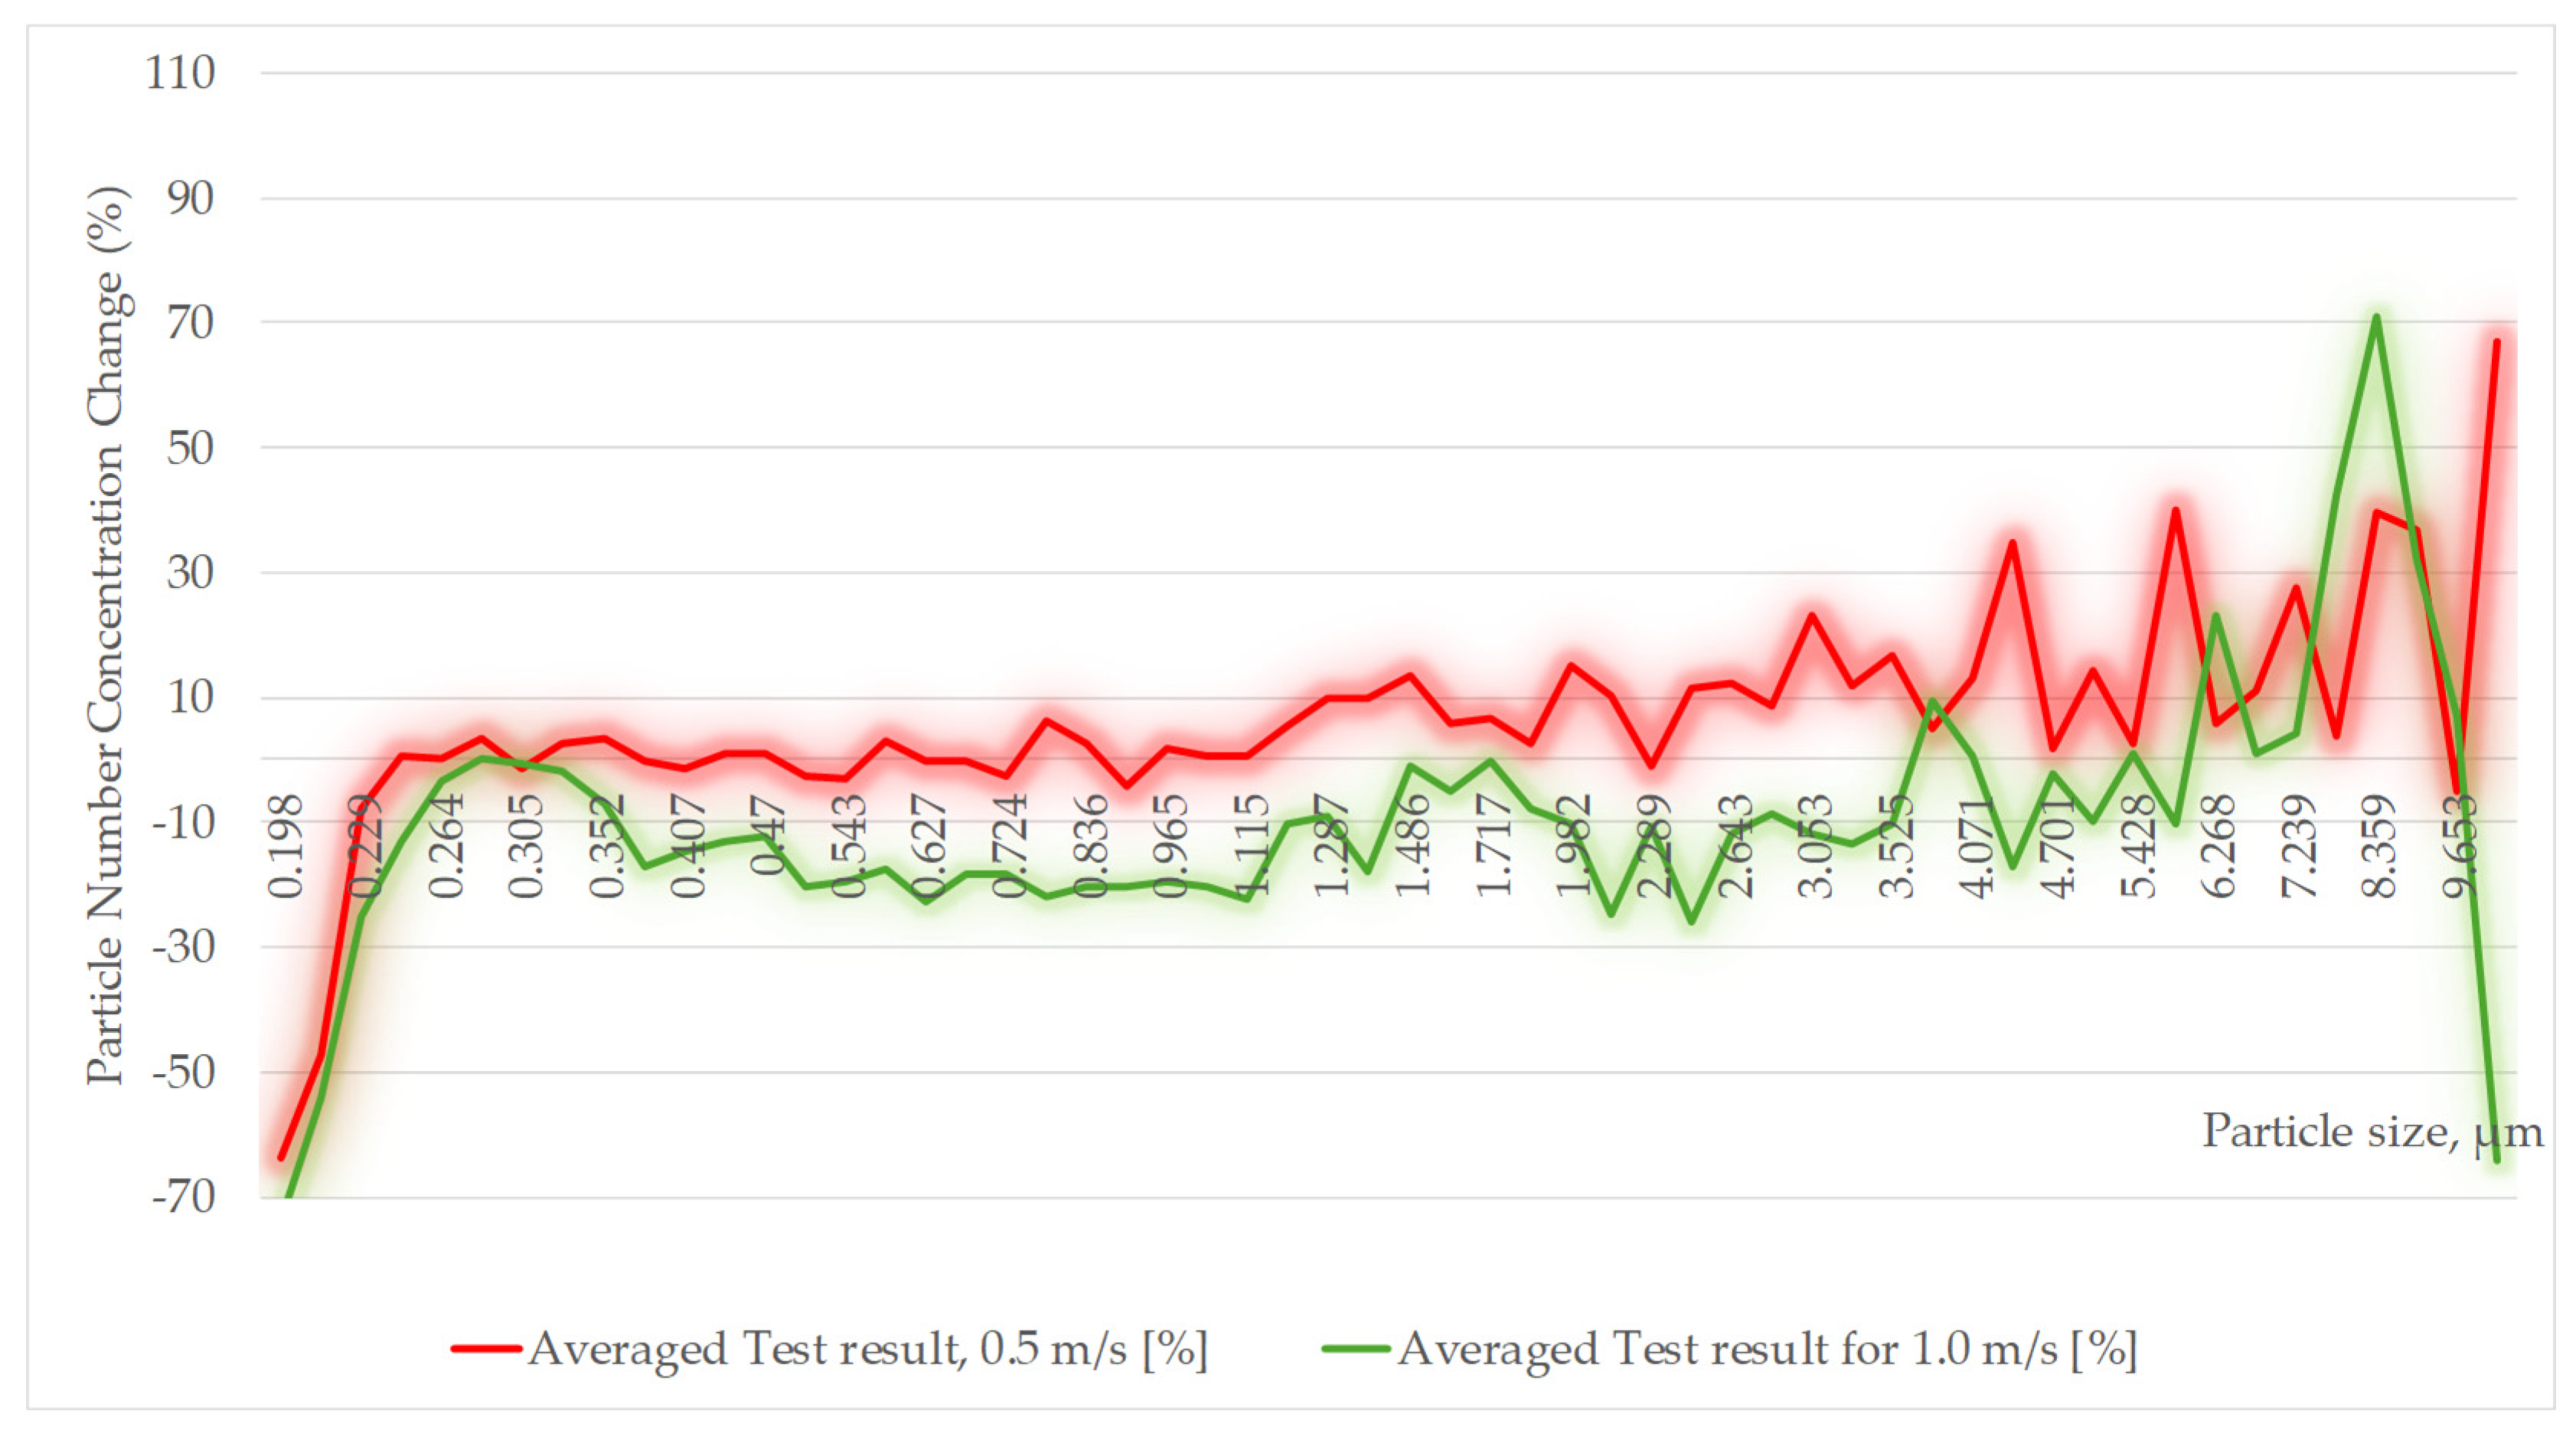
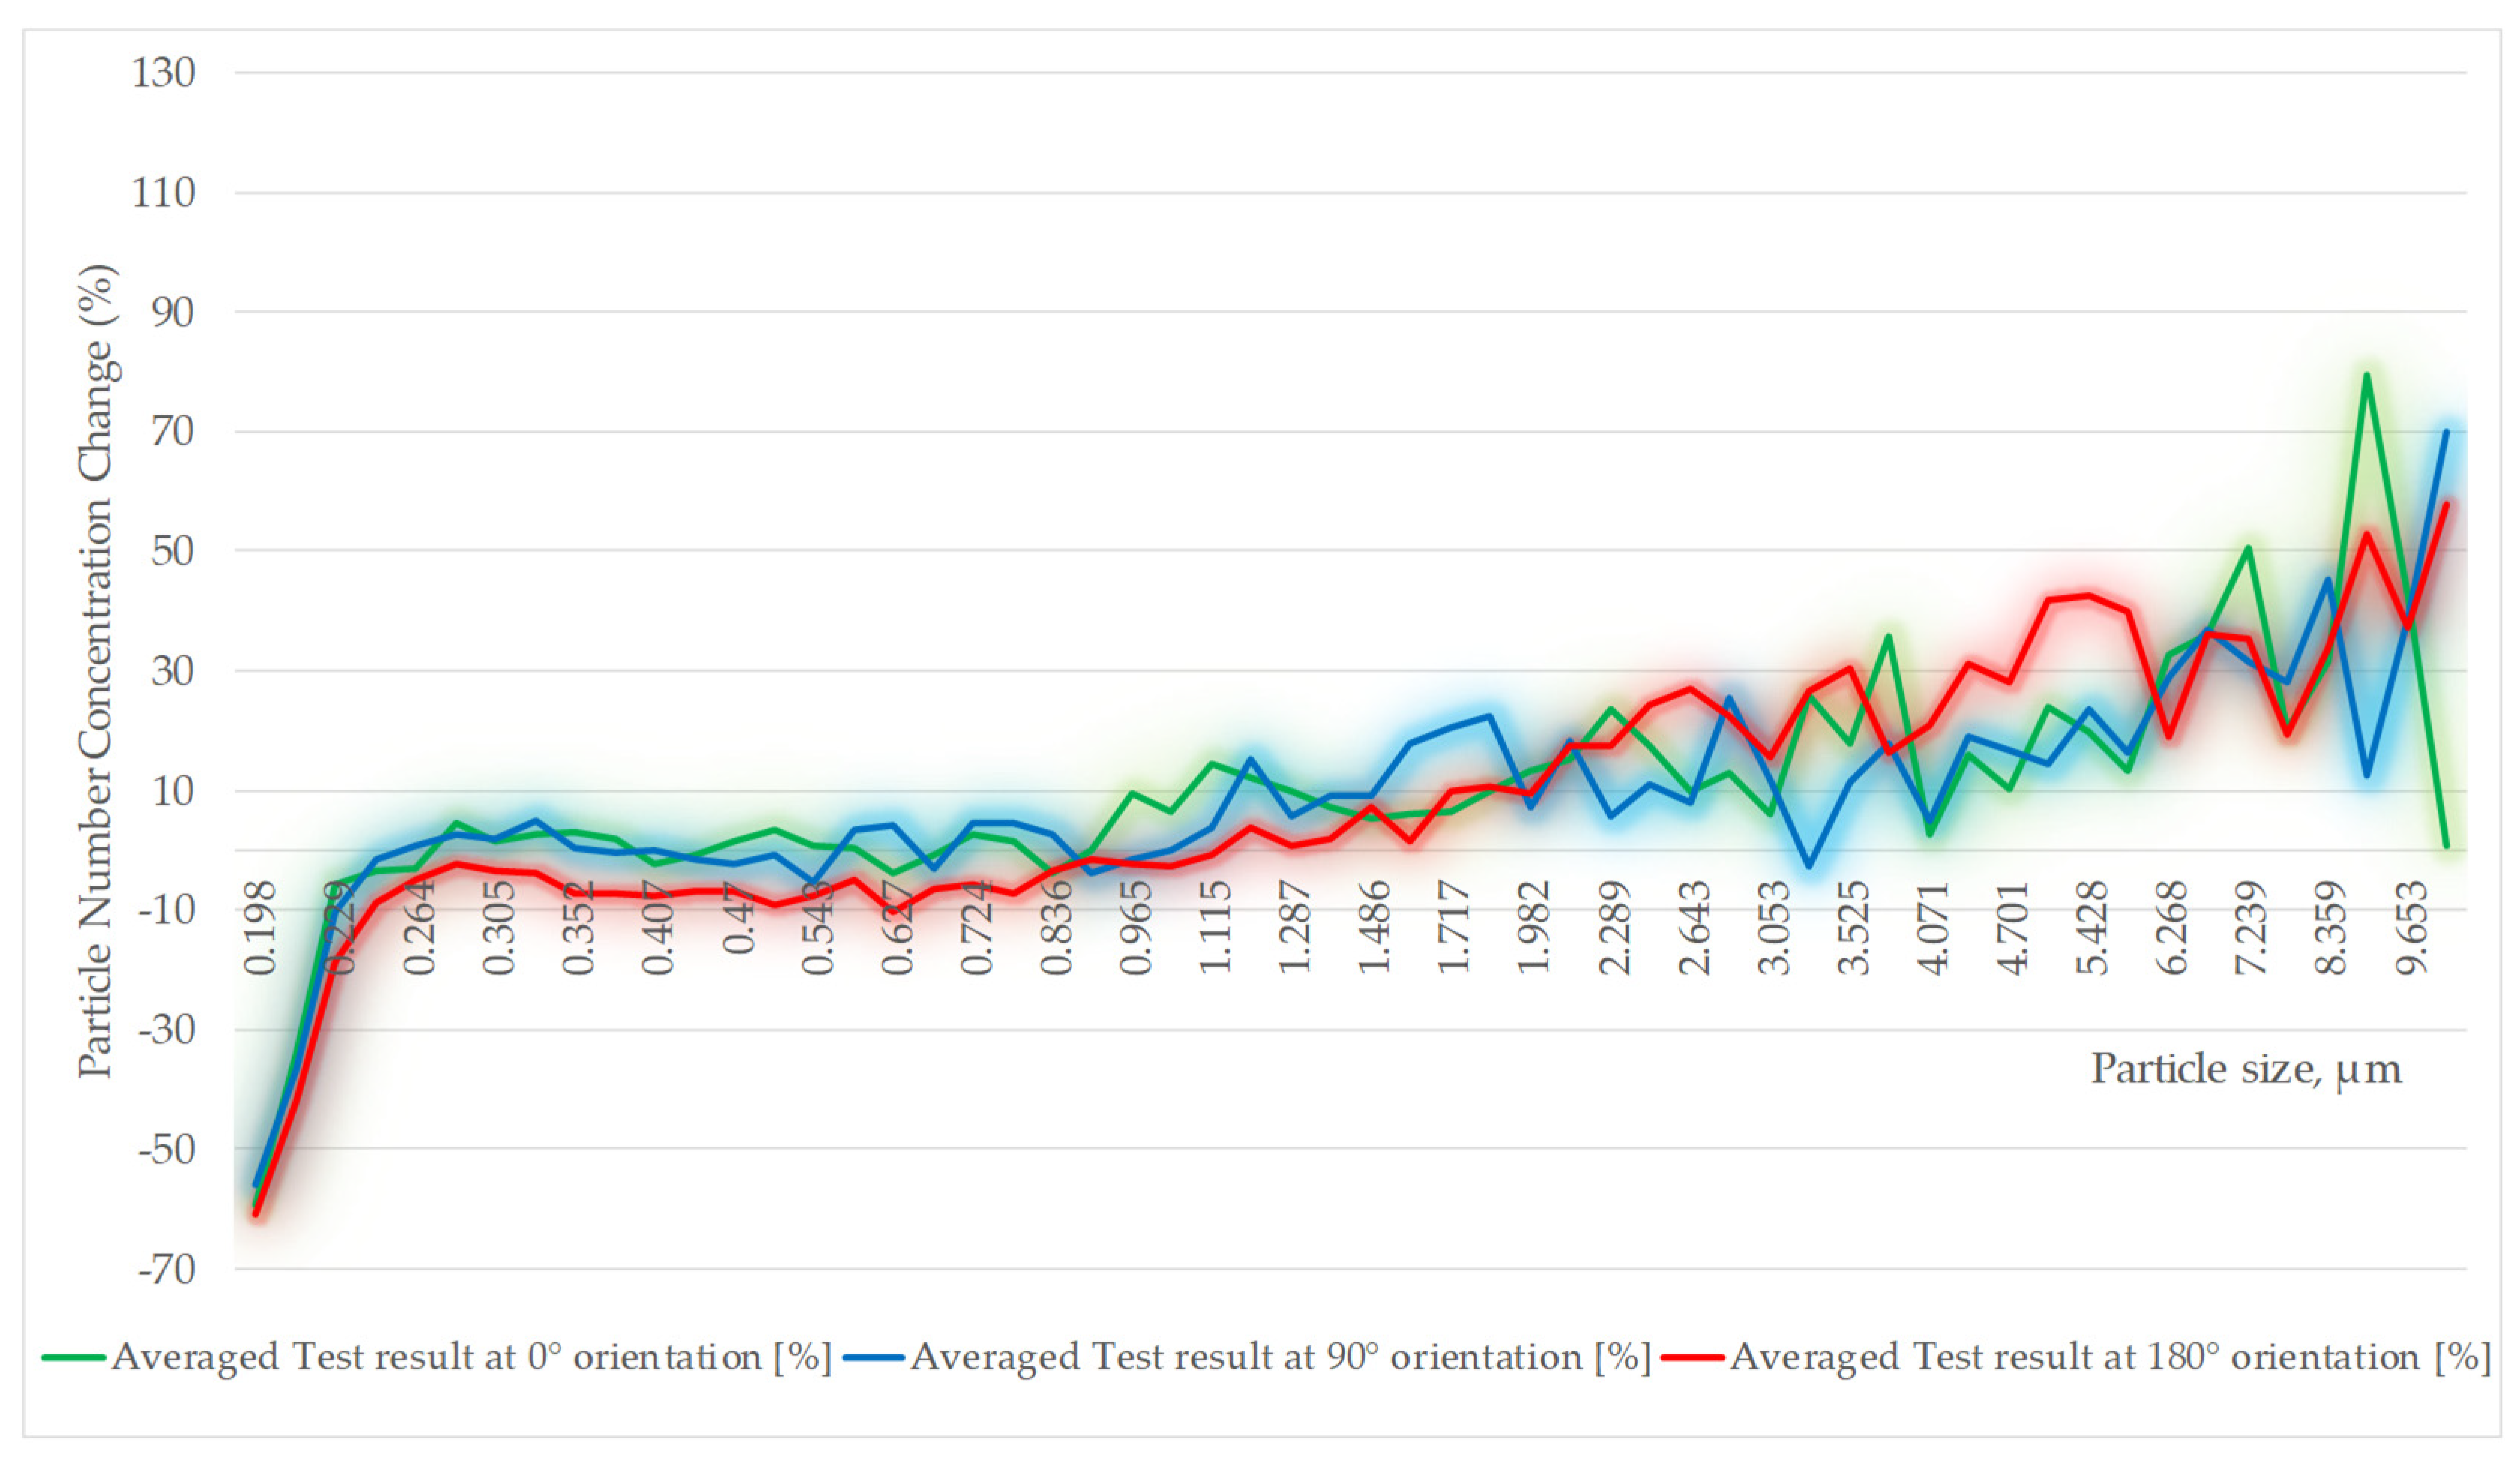
The experimental results presented in
Figure 10 and
Figure 11 were evaluated using the individual repeated measurements obtained for each experimental condition. For
Figure 10, three repetitions were performed at 0.5 m/s and five repetitions at 1.0 m/s. The experiments presented in
Figure 11 comprised five repetitions for each source orientation. For every repetition, the integral number-concentration change was calculated from the sums of the upstream and downstream differential number concentrations. To reduce the influence of unstable percentage ratios in sparsely populated coarse channels, the size-resolved data were additionally aggregated into five ranges: 0.20–0.50, 0.50–1.00, 1.00–2.50, 2.50–5.00, and 5.00–10.00 μm. These boundaries were selected to distinguish submicrometric particles from progressively larger particle fractions while maintaining sufficient particle counts within the coarser ranges for comparison across repeated measurements. The same size-range definitions were applied consistently to all experimental conditions and repetitions.
At a source orientation of 90° and a flow velocity of 0.5 m/s without additional dosing (
Figure 10), the integral concentration change was 0.35 ± 7.53% (mean ± SD,
n = 3; 95% confidence interval, −18.34 to 19.05%). The integral value was close to zero and exhibited substantial between-run variability. However, the size-band results differed from the integral result. Mean changes (±SD) were −2.02 ± 6.01% for 0.20–0.50 μm and −0.59 ± 9.96% for 0.50–1.00 μm, followed by 7.01 ± 10.96%, 15.06 ± 12.80%, and 15.86 ± 7.21% in the 1.00–2.50, 2.50–5.00, and 5.00–10.00 μm ranges, respectively. Increasing the airflow velocity from 0.5 to 1.0 m/s at the same source orientation and without additional dosing produced a mean integral change of −18.42 ± 21.13% (
n = 5; 95% confidence interval, −44.66 to 7.82%). Negative values denote a higher downstream than upstream concentration. The effect was most pronounced in the first repetition and remained variable across the series. Mean size-band changes (±SD) were −15.05 ± 16.19%, −30.58 ± 30.31%, −22.05 ± 34.40%, −22.08 ± 58.63%, and −4.28 ± 59.74%, respectively, from the smallest to the largest particle-size range.
Because of the large between-run variability and the wide 95% confidence interval spanning both negative and positive values, the no-dosing result at 1.0 m/s is considered inconclusive with respect to the direction and magnitude of the concentration change. This dataset is therefore retained for completeness but is not used as a basis for mechanistic interpretation or for drawing conclusions regarding the effect of airflow velocity.
Additional mechanical dosing at 0.128 mg/s substantially increased and stabilized the upstream particle concentration (
Figure 11), allowing the acoustic response to be evaluated under a denser aerosol loading. At 90°, 1.0 m/s, the integral change was 0.75 ± 4.45% (
n = 5; 95% confidence interval, −4.78 to 6.28%). Although the integral change remained close to zero, the mean changes differed among the particle-size ranges. The mean changes (±SD) were −1.73 ± 4.02% for 0.20–0.50 μm, 0.14 ± 5.00% for 0.50–1.00 μm, 10.68 ± 5.80% for 1.00–2.50 μm, 13.27 ± 10.11% for 2.50–5.00 μm, and 24.20 ± 20.17% for 5.00–10.00 μm. Rotation of the source to 0° with the same flow velocity and dosing rate yielded an integral change of 1.07 ± 3.91% (
n = 5; 95% confidence interval, −3.78 to 5.92%). The corresponding mean size-band changes (±SD) were −1.56 ± 2.80%, 0.82 ± 5.38%, 10.72 ± 8.16%, 16.12 ± 10.55%, and 28.08 ± 11.86%, respectively. Compared with the 90° configuration, larger positive reductions were observed in the 2.5–5.0 and 5.0–10.0 μm ranges. The 180° configuration produced the strongest coarse-fraction reduction but also the greatest run-to-run variation in the integral result. The mean integral change was −6.22 ± 12.15% (
n = 5; 95% confidence interval, −21.30 to 8.86%). Mean changes (±SD) in the five size bands were −10.04 ± 11.55%, −8.06 ± 13.07%, 5.55 ± 14.47%, 24.89 ± 11.11%, and 40.05 ± 12.05%, respectively. Three of the five repetitions exhibited a small positive integral reduction, whereas the first two showed a substantial downstream increase in the submicrometric fraction. Reductions in the 2.5–5.0 and 5.0–10.0 μm ranges were larger than those observed at 90°.
A comparison of the three dosed orientations showed no statistically significant difference in integral concentration change (one-way ANOVA p = 0.285; Kruskal–Wallis p = 0.878). Pairwise Welch tests likewise yielded p = 0.905 for 90° versus 0°, p = 0.282 for 90° versus 180°, and p = 0.259 for 0° versus 180°. The same statistical analysis was additionally applied separately to the five particle-size ranges. No statistically significant differences among the three source orientations were detected in any size range. For the 2.50–5.00 μm fraction, the mean concentration changes were 13.27 ± 10.11%, 16.12 ± 10.55%, and 24.89 ± 11.11% for the 90°, 0°, and 180° orientations, respectively (one-way ANOVA, p = 0.236; Kruskal–Wallis, p = 0.210). For the 5.00–10.00 μm fraction, the corresponding values were 24.20 ± 20.17%, 28.08 ± 11.86%, and 40.05 ± 12.05% (one-way ANOVA, p = 0.267; Kruskal–Wallis, p = 0.275). Thus, although the mean coarse-particle reduction was higher at 0° than at 90° and reached its highest value at 180°, these differences should be interpreted as experimental trends rather than as statistically established orientation effects.
5. Discussion
The results revealed a pronounced size-dependent aerosol response to ultrasonic treatment. Changes in the submicrometric fraction were generally small or negative, whereas positive reductions were predominantly observed for particles larger than approximately 1 μm.
This transition from negligible or locally negative change in the submicrometric range to a positive reduction above 1 μm is consistent with size-dependent particle inertia and acoustic-radiation-force scaling. Larger particles respond more strongly to acoustic-energy gradients and are more likely to migrate toward force-active regions, collide, settle, or deposit on duct surfaces. The absence of a large integral reduction indicates that the treatment primarily redistributed the aerosol rather than uniformly removed particles from all size classes.
Ultrasonic fragmentation is unlikely to be a dominant mechanism under the applied conditions. At the maximum calculated SPL of 150 dB, the corresponding acoustic pressure is approximately 0.63 kPa RMS, or 0.89 kPa peak, calculated from p
rms = p
010
Lp/20, where p
0 = 20 μPa. Even if the peak acoustic pressure is conservatively considered as a characteristic stress scale, it remains several orders of magnitude below the MPa-level fracture strengths typically reported for silica-based brittle particles and materials. Moreover, ultrasonic particle fractionation experiments performed at approximately 50 kHz and 150 dB with 2–22 μm glass microspheres have demonstrated size-dependent migration by acoustic radiation forces rather than particle fragmentation under comparable acoustic conditions [
26]. Therefore, although fragmentation cannot be completely excluded, it is not expected to be a dominant mechanism in the present experiments, and the observed changes are more consistently attributed to particle migration, settling, deposition, and aerosol redistribution.
At 1.0 m/s without additional particle dosing, the large between-run variability and the wide confidence interval prevent a reliable physical interpretation of the observed upstream-to-downstream concentration change. The sequential upstream and downstream sampling procedure, together with possible short-term fluctuations in aerosol concentration under the no-dosing condition, may have contributed to this variability; however, their individual contributions cannot be quantified from the present measurements. Therefore, the no-dosing 1.0 m/s dataset is treated as inconclusive and is not used to infer the effects of airflow velocity, residence time, acoustic migration, or particle collisions. For completeness, the comparison between the no-dosing and dosing conditions at 1.0 m/s yielded no statistically significant difference in the integral particle number concentration change (Welch’s t-test, p = 0.112). Given the large variability of the no-dosing dataset, this comparison is reported descriptively and is not used as a basis for mechanistic interpretation.
The monotonic increase in reduction with a reduction in particle size is consistent with the cubic dependence of the primary radiation force on particle diameter in the Rayleigh regime and with the increasing relaxation time of larger particles. This consistency provides a possible physical interpretation of the observed size-dependent response but does not demonstrate that the calculated primary radiation force resulted in particle–particle collisions or agglomerate formation. Mechanical dosing also increases the number of potential collision partners. Fine particles may act as collision partners for larger particles or pre-existing agglomerates. This collision-based explanation should be regarded as a physical interpretation of the experimental trend rather than as a direct result of the numerical model, because particle–particle collisions and agglomerate formation were not explicitly simulated. The difference in integral response between the undosed and dosed cases at 1.0 m/s did not reach statistical significance (Welch’s t-test, p = 0.112), with substantial between-run variability observed in the undosed condition. Descriptively, the dosed measurements exhibited lower between-run variability and a more consistent size-dependent pattern than did the undosed measurements. These observations are reported only as descriptive characteristics of the present dataset and should not be interpreted as statistically established effects of particle dosing.
The mean size-resolved response observed at 180° is consistent with a possible asymmetric transport pattern, in which coarse particles may be displaced from the sampled flow core, while fine particles remain more strongly coupled to the carrier gas. However, because the differences among source orientations were not statistically significant, this interpretation should be regarded as a hypothesis consistent with the numerical results rather than as an experimentally demonstrated orientation effect.
These observations are consistent with the numerical prediction that source rotation redistributes the radiation-force components and changes the spatial extent of active gradients. A laterally oriented field can promote cross-sectional particle migration without directly reinforcing gravitational settling over the entire section. Particles larger than 1 μm therefore experience enhanced convergence toward high-gradient regions and increased probability of interception or deposition, while the submicrometric population remains approximately unchanged because its acoustic migration velocity is comparatively small.
The numerical results provide a physically plausible basis for this behavior because orientation modifies not only force magnitude but also the balance of horizontal, axial, and vertical components. If the vertical component locally opposes or supplements gravity, the residence time and sampling probability can change differently for small and large particles. Thus, the 180° case showed the highest mean coarse-particle reduction in the present experiments, but the absence of statistically significant differences among orientations prevents concluding that this configuration is more effective than the 0° or 90° configurations.
The integral metric is dominated by the numerous ultrafine (submicrometric) particles and therefore masks the opposite response of fine and coarse size fractions. The more informative result is the consistent increase in mean reduction with reduced particle size under dosing, together with an observed tendency toward orientation-dependent differences above 2.5 μm. However, the size-resolved statistical analysis showed that the differences among source orientations did not reach statistical significance, including the 2.50–5.00 μm (ANOVA,
p = 0.236) and 5.00–10.00 μm (ANOVA,
p = 0.267) fractions. In particular, the mean particle number concentration changes in the 5.00–10.00 μm size fraction were 24.20 ± 20.17%, 28.08 ± 11.86%, and 40.05 ± 12.05% at the 90°, 0°, and 180° orientations, respectively. Although these differences were not statistically significant, the observed variation in the mean size-resolved response, including the highest mean coarse-particle reduction at 180°, suggests a possible orientation-dependent tendency that should be verified with a larger number of independent repetitions (
Table 2).
Overall, the experiments show a size-dependent aerosol response characterized by differences between fine and coarse particle fractions. Under mechanical dosing, the measurements exhibited lower between-run variability and larger mean responses for particles above approximately 1 μm, particularly in the 2.5–10 μm range; these observations are descriptive and should not be interpreted as statistically established effects of particle dosing. Differences in the mean size-resolved response were also observed among source orientations, but they did not reach statistical significance. The numerical model provides a physically plausible interpretation of these experimental trends by showing that source angular position redistributes the lateral, axial, and vertical components of the primary acoustic radiation force.
Although acoustic agglomeration is a possible mechanism contributing to the measured size-dependent changes, the present measurements do not provide direct evidence of agglomerate formation. In particular, a reduction in the downstream coarse-particle number concentration may also result from cross-sectional migration, gravitational settling, or wall deposition. In addition, because matched ultrasound-OFF measurements were not performed under otherwise identical operating conditions, the contribution of ultrasonic excitation cannot be isolated quantitatively from the background transport and deposition processes of the experimental system. A further experimental limitation is that the upstream and downstream particle concentrations were sampled sequentially, with an approximately 10 s interval, rather than simultaneously. Short-term temporal fluctuations in aerosol concentration may therefore contribute to the observed upstream-to-downstream differences, particularly under the more variable no-dosing conditions. Accordingly, the experimental results are interpreted as showing size-dependent particle redistribution under ultrasonic operation, while confirmation of a specifically ultrasound-induced contribution and of agglomerate formation would require matched ultrasound-ON/OFF experiments and complementary particle characterization.
A further numerical limitation is that a dedicated gravity-on/gravity-off sensitivity analysis was not performed in the present study. Although gravitational prestress was included in the structural model and provides a physically plausible symmetry-breaking mechanism between the 0° and 180° configurations, its quantitative contribution to the differences in the harmonic acoustic response has not been isolated independently. A systematic comparison of the corresponding SPL and acoustic radiation-force distributions, with and without gravitational prestress, should therefore be included in future work.
Another numerical limitation is that the acoustic-field and radiation-force calculations were performed at the numerically predicted resonance frequency of 49.71 kHz, whereas the experimentally measured resonance frequency was 49.35 kHz. Although the difference is approximately 0.73%, the interference-dominated acoustic field may exhibit local sensitivity to frequency, particularly in the positions and magnitudes of pressure nodes, antinodes, and high-gradient regions.
In addition, a limitation of the present study is that the experimental SPL characterization was performed only at the center of the duct cross-section. Therefore, the predicted cross-sectional pressure and radiation-force distributions were not spatially validated experimentally. The numerical field topology is therefore used in this study to provide a physically based interpretation of the orientation-dependent aerosol response rather than as a fully experimentally validated representation of the acoustic field. Future work should include spatial SPL mapping across the duct cross-section to validate the predicted pressure nodes, antinodes, and high-gradient regions.
6. Conclusions
This study combined numerical modeling and experimental investigation to evaluate the influence of ultrasonic acoustic-pressure-source orientation on size-dependent particle migration and aerosol redistribution in a circular air duct. The developed three-dimensional multiphysics model was used to calculate the sound-pressure distribution and the direction-dependent acoustic radiation-force field generated by the ultrasonic source. The numerical results indicate that changing the source orientation redistributes the horizontal, vertical, and axial components of the acoustic radiation force, thereby modifying the expected particle migration pathways within the duct.
The experimental results showed size-dependent changes in particle number concentration under the investigated airflow, particle-dosing, and source-orientation conditions. The undosed condition at an airflow velocity of 1.0 m/s exhibited substantial between-run variability and was therefore considered inconclusive with respect to the direction and magnitude of the concentration change. The experimental measurements nevertheless showed a size-dependent response, with larger mean reductions generally observed in the coarser particle fractions under mechanical dosing. Under mechanical particle dosing, the mean particle number concentration changes in the 5–10 μm size fraction were 24.20 ± 20.17%, 28.08 ± 11.86%, and 40.05 ± 12.05% at the 90°, 0°, and 180° orientations, respectively. Although these differences did not reach statistical significance, the higher mean coarse-particle reduction observed at 180° represents a potentially relevant orientation-dependent trend that warrants confirmation with a larger number of independent repetitions.
The size-resolved analysis showed differences in the mean coarse-particle response among source orientations, particularly for particles larger than 1 μm; however, these differences did not reach statistical significance. These size-dependent trends were more pronounced than were the corresponding changes in the integral particle number concentration, highlighting the importance of evaluating particle-size distributions, in addition to integral metrics.
The combined results suggest that source orientation may influence the size-resolved aerosol response, although the observed experimental differences require confirmation with a larger number of independent repetitions. The numerical model provides a physically plausible interpretation of this trend by predicting orientation-dependent redistribution of the directional acoustic radiation-force components. Because experimental SPL measurements were limited to the duct center, the detailed cross-sectional acoustic-field topology remains a numerical prediction that should be spatially validated in future investigations.