Article

Investigation on Effect of Unilateral Train Load on Lining Structure and Inverted Arch Trestle Bridge in Double-Arch Tunnel Under Construction


1
Tianjin Key Laboratory of Civil Structure Protection and Reinforcement, Tianjin Chengjian University, Tianjin 300384, China
2
China Construction Sixth Engineering Bureau Co., Ltd., Tianjin 300171, China
3
School of Civil and Transportation Engineering, Qinghai Minzu University, Xining 810000, China
4
School of Civil Engineering, Tianjin University, Tianjin 300350, China
*
Author to whom correspondence should be addressed.
Appl. Sci. 2026, 16(17), 8639; https://doi.org/10.3390/app16178639 (registering DOI)
Submission received: 16 July 2026 / Revised: 20 August 2026 / Accepted: 27 August 2026 / Published: 30 August 2026
(This article belongs to the Special Issue Advanced Tunnel and Underground Engineering Technology)

Abstract

Previous studies of train-induced tunnel responses have mainly focused on completed tunnels or symmetric loading conditions, while the dynamic behavior of unfinished double-arch tunnels subjected to unilateral train loading through temporary trestles remains insufficiently understood. To address this gap, this study investigates the asymmetric load-transfer mechanism and short-term structural response of an unfinished double-arch tunnel–trestle system and identifies critical locations for construction-stage monitoring and speed control. A three-dimensional ABAQUS model was established for train speeds of 10–70 km/h and validated using a 63-day field-monitoring program comprising 15 train passages at speeds of approximately 9.4–56.2 km/h. Both numerical and monitoring results show that stress and deformation increase with train speed and are concentrated at the loaded-side invert, lower middle partition wall, and trestle wheel-load region. At 70 km/h, the calculated maximum lining compressive stress and trestle stress reached 6.353 and approximately 172 MPa, respectively, while the maximum horizontal deformations of the loaded and unloaded tunnel bores were 1.110 and 0.565 mm. At the maximum monitored speed of 56.2 km/h, the measured peak compressive stress of the middle partition wall was 5.95 MPa. The mean monitoring-to-simulation ratios for the evaluated responses were approximately 0.94–0.97, demonstrating satisfactory agreement and a slightly conservative numerical prediction. The results clarify the asymmetric coupling response of the tunnel–trestle system and support the identification of sensitive monitoring locations. Based on the combined numerical and field evidence, approximately 30 km/h is recommended as a conservative, project-specific construction-stage operational-control value. This study provides a quantitative basis for monitoring and risk control in similar temporary rail-transport projects, although further verification under different geological, structural, and loading conditions is required.

1. Introduction

To alleviate increasingly serious urban traffic congestion, rail transit systems, particularly metro networks, have developed rapidly in recent years. Metro operation inevitably generates vibration loads that are transmitted through the track, tunnel structure, and surrounding ground, exerting non-negligible effects on tunnel structures, adjacent strata, and nearby buildings [1,2,3]. These effects may contribute to ground settlement, tunnel deformation, lining cracking, spalling, and water leakage [4,5,6,7]. Meanwhile, initial defects cannot be completely avoided during tunnel construction, and defects such as cracking and leakage may further develop during subsequent service. Under repeated train loading, such deterioration may adversely affect the structural performance and durability of tunnel systems. Therefore, understanding the structural response of tunnels subjected to train-induced loading is important for construction-stage risk control as well as subsequent operation and maintenance.
Extensive studies have investigated train-induced tunnel responses through theoretical analysis, numerical simulation, model testing, field-monitoring, and damage-identification methods. Hu and Bian [8] combined experimental and numerical approaches to investigate the dynamic responses of tunnels and surrounding soils under train loading, whereas Ding et al. [9] examined the influence of lining cracks and demonstrated that local defects can alter structural dynamic characteristics and amplify vibration responses. Guo et al. [10] investigated the influence of internal structural configurations on vibration propagation in composite tunnels, while Zhang et al. [11] experimentally examined the dynamic response of rock tunnels subjected to moving train loads. From the perspective of structural deterioration, Li et al. [12] showed that lining stiffness degradation, train type, axle load, and operating speed affect structural stress responses and dynamic amplification, whereas Liu et al. [13] indicated that existing lining cracks may be susceptible to further propagation under dynamic loading. Studies on double-arch, stacked, and shield tunnels have further demonstrated that tunnel configuration, surrounding-soil conditions, structural damage, and loading characteristics can substantially influence tunnel and ground responses [14,15,16,17,18,19].
International studies have also progressively developed more comprehensive frameworks for analyzing railway-induced vibration by considering interactions among the vehicle, track, tunnel, and surrounding ground. Three-dimensional analytical and numerical models have demonstrated that tunnel geometry, soil properties, structural configuration, and load-transfer characteristics can significantly affect the generation and propagation of railway-induced vibration [20,21,22]. International railway-vibration assessment frameworks further emphasize that the response of an underground railway system depends on the combined characteristics of the vibration source, supporting infrastructure, propagation medium, and receiving structures [23,24]. These developments indicate that train-induced tunnel response is governed by a coupled system rather than by train speed or vehicle loading alone.
Collectively, previous studies have established several broadly recognized characteristics of train-induced tunnel responses. In general, increasing train speed tends to enhance structural dynamic responses and their influence on the surrounding environment [25,26], while the tunnel invert has frequently been identified as one of the regions particularly sensitive to train loading [27,28]. Nevertheless, these general findings have been obtained predominantly from conventional operating conditions or structurally completed tunnel systems. Their direct applicability to tunnels under temporary and incomplete construction conditions therefore remains uncertain, because structural stiffness, load-transfer paths, boundary conditions, and interactions among temporary and permanent structural components may differ substantially from those of completed tunnels.
More specifically, the train-induced response of an unfinished double-arch mined tunnel coupled with a temporary trestle under unilateral construction-train operation remains insufficiently understood. In this condition, the secondary lining is incomplete, the trestle is supported directly by the primary tunnel structure, and train loading acts on only one bore. The load is therefore transferred eccentrically through the rail and trestle into an incompletely constructed system, while the two bores remain mechanically coupled through the middle partition wall. Consequently, the primary support, partition wall, adjacent bore, and trestle behave as an integrated system, potentially inducing asymmetric stress redistribution and deformation that cannot be adequately inferred from conventional single-bore or fully completed tunnels. This coupled and asymmetric construction condition constitutes the specific research gap addressed in this study.
From the perspective of sustainable infrastructure development, reliable construction-stage transportation and risk control are also relevant to the broader objective of developing resilient urban infrastructure. The United Nations Sustainable Development Goal 9 emphasizes the development of reliable, sustainable, and resilient infrastructure, whereas Sustainable Development Goal 11 highlights safe, accessible, and sustainable urban transport systems [29,30]. In this context, identifying unfavorable structural responses during temporary construction-train operation and establishing appropriate monitoring and operational-control measures can contribute to reducing construction risks and unnecessary structural intervention while supporting the resilient development of urban rail infrastructure.
To address the above research gap, this study investigates the short-term structural response of an unfinished double-arch mined tunnel–trestle system under unilateral construction-train loading. A three-dimensional ABAQUS model, validated against in situ monitoring data, is used to evaluate the stress and deformation responses of the primary support, middle partition wall, and temporary trestle at different train speeds. Particular attention is given to response differences between the loaded and unloaded bores, critical behavior of the tunnel invert and partition wall, trestle response, and speed-dependent variations.
The principal contribution is the characterization of asymmetric load transfer and structural response in a partially completed double-arch tunnel–trestle system under unilateral train loading through combined numerical and field investigations. Response-sensitive regions and their evolution with train speed are further identified, providing a basis for a project-specific construction-stage speed recommendation. Because the allowable speed depends on tunnel geometry, geological conditions, construction stage, trestle configuration, train loading, and deformation-control criteria, the proposed threshold should not be regarded as universally applicable. The broader significance of this study therefore lies in revealing the asymmetric response mechanism and establishing a numerical–monitoring framework for assessing construction-stage train operation.

2. Methodology

2.1. Project Overview

2.1.1. Double-Arch Tunnel and Inverted Arch Trestle Bridge

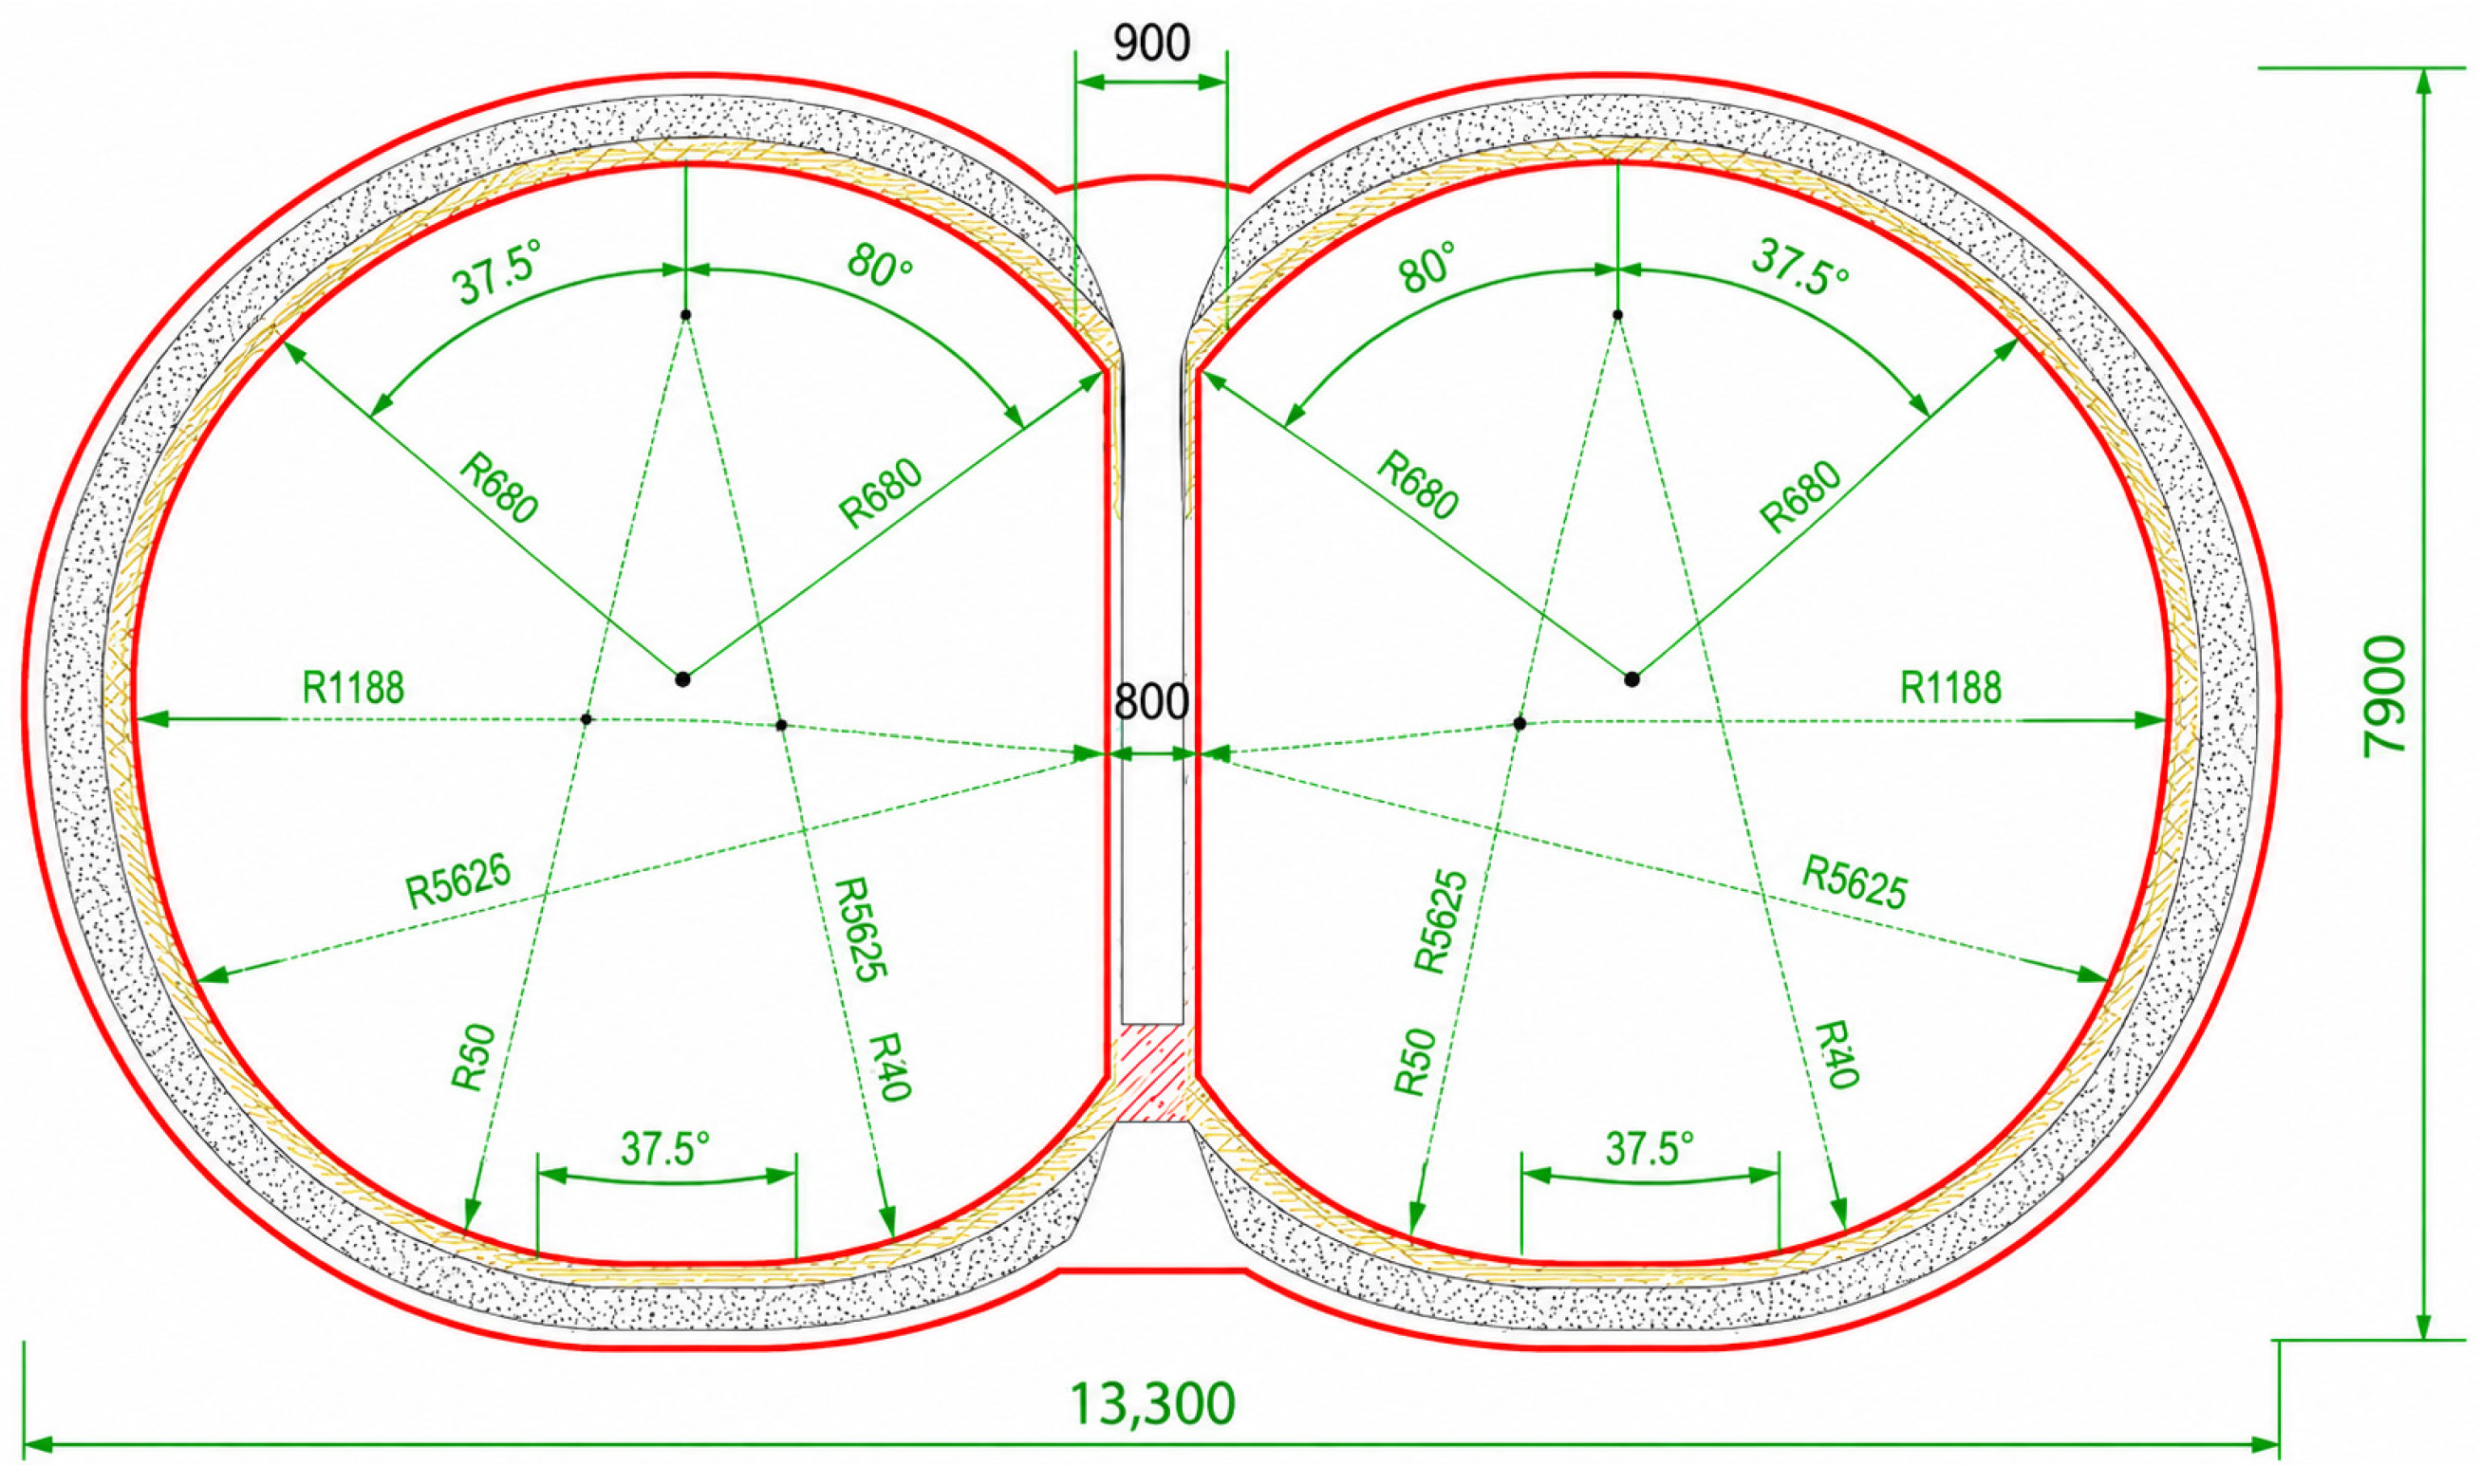
A double-arch tunnel with two openings has a span of about 12 m and is constructed using the mined bench method. Small-pipe grouting is used to reinforce the ground around the tunnel crown. The designed tunnel cross-section is shown in Figure 1. The tunnel is divided into the left tunnel and the right tunnel by a middle partition wall. After the primary support of the mined tunnel is completed, the construction of the invert, secondary lining, and trestle is carried out. The primary support is made of cast-in-place reinforced concrete, with a thickness of 30 cm. The trestle bridge is made of welded steel-frame supports with steel plates laid on the top, and rails are laid on the steel plates. The top plate of the trestle is 3 m wide and 1.2 m high.
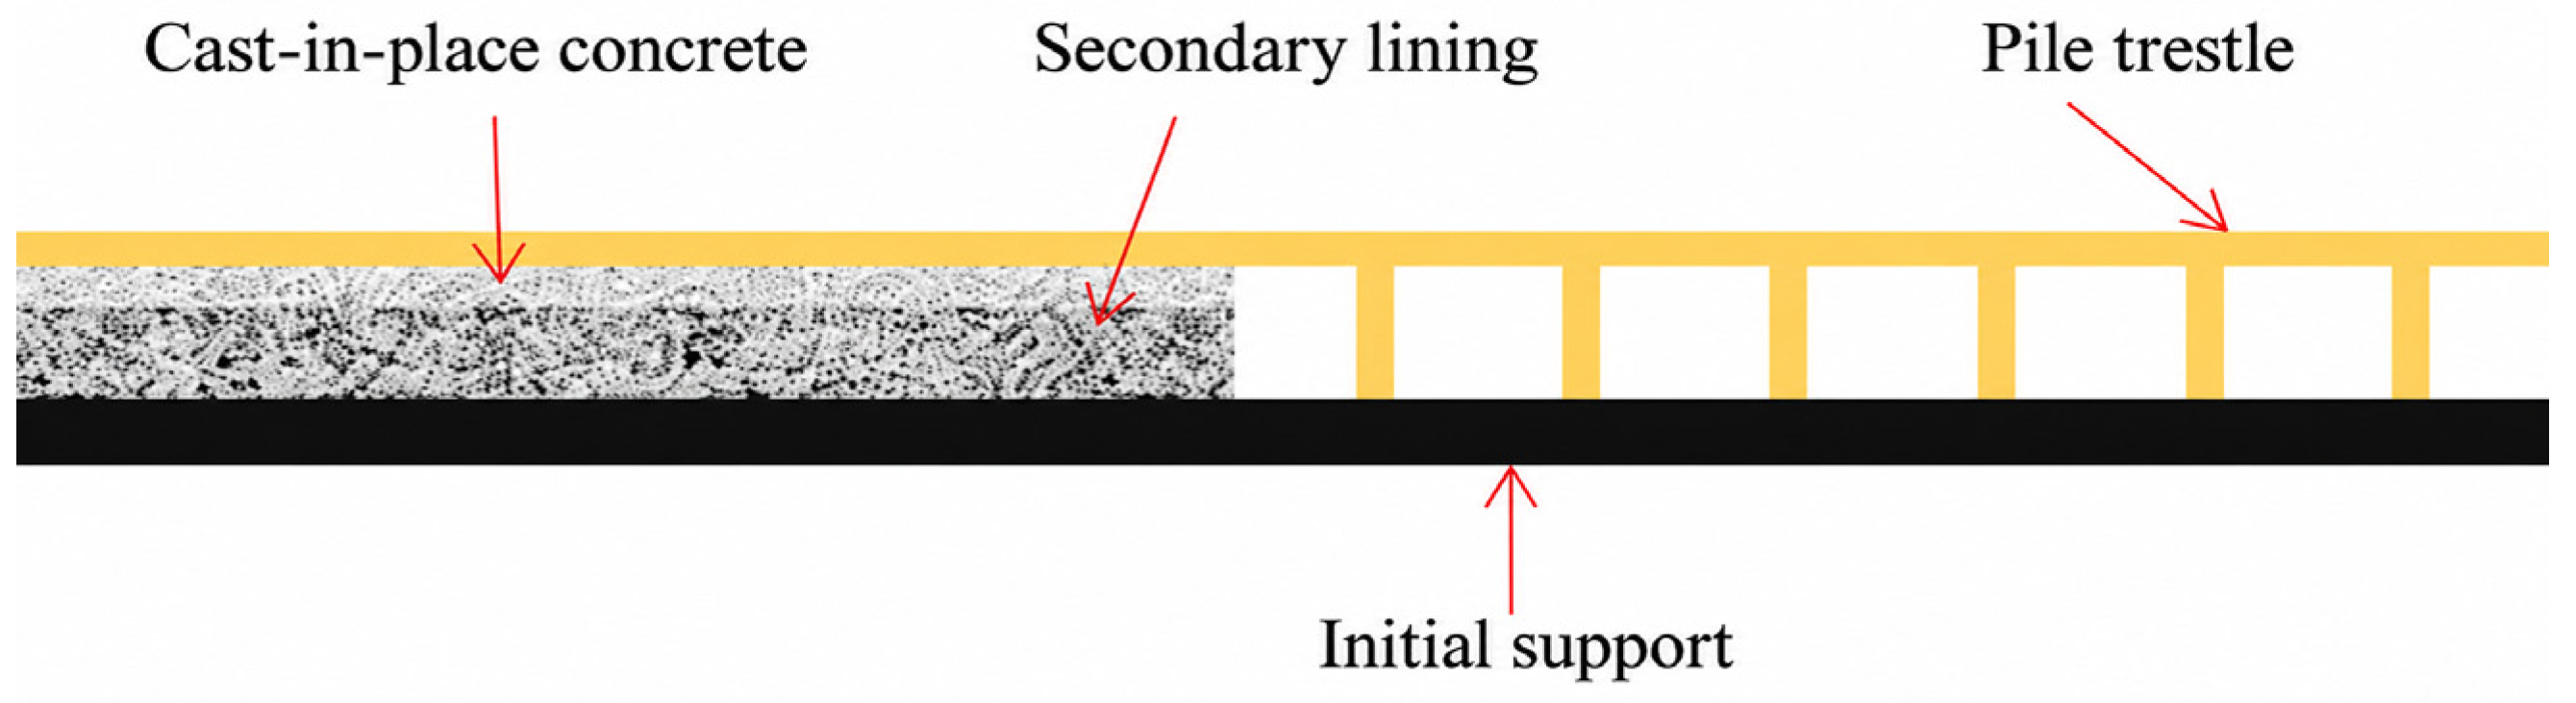
As shown in Figure 2, due to the delayed construction progress, the secondary lining of the mined tunnel cannot be fully completed before rail laying begins. It is expected that the secondary lining within the remaining 50 m section will not be completed in time. To ensure the smooth passage of rail laying equipment and avoid affecting the subsequent operation of rail vehicles, a trestle will be directly constructed on the completed primary support within this 50 m tunnel section, followed by rail laying. After the rails are installed, trains and flatbed cars can run on them, with a total length of about 36 m.

2.1.2. Geological Condition

The upper part of the mined tunnel is located in strongly weathered sandstone, while the lower part is located in moderately weathered sandstone. A fill layer with a relatively uniform thickness is present near the ground surface. Below it are, in sequence, a pebble soil layer and a loess layer. The geological investigation results show that there is little groundwater in the strata around the mined tunnel of the entrance and exit line. The physical and mechanical parameters of the soil are listed in Table 1.

2.2. Numerical Model

2.2.1. Numerical Model and Mesh

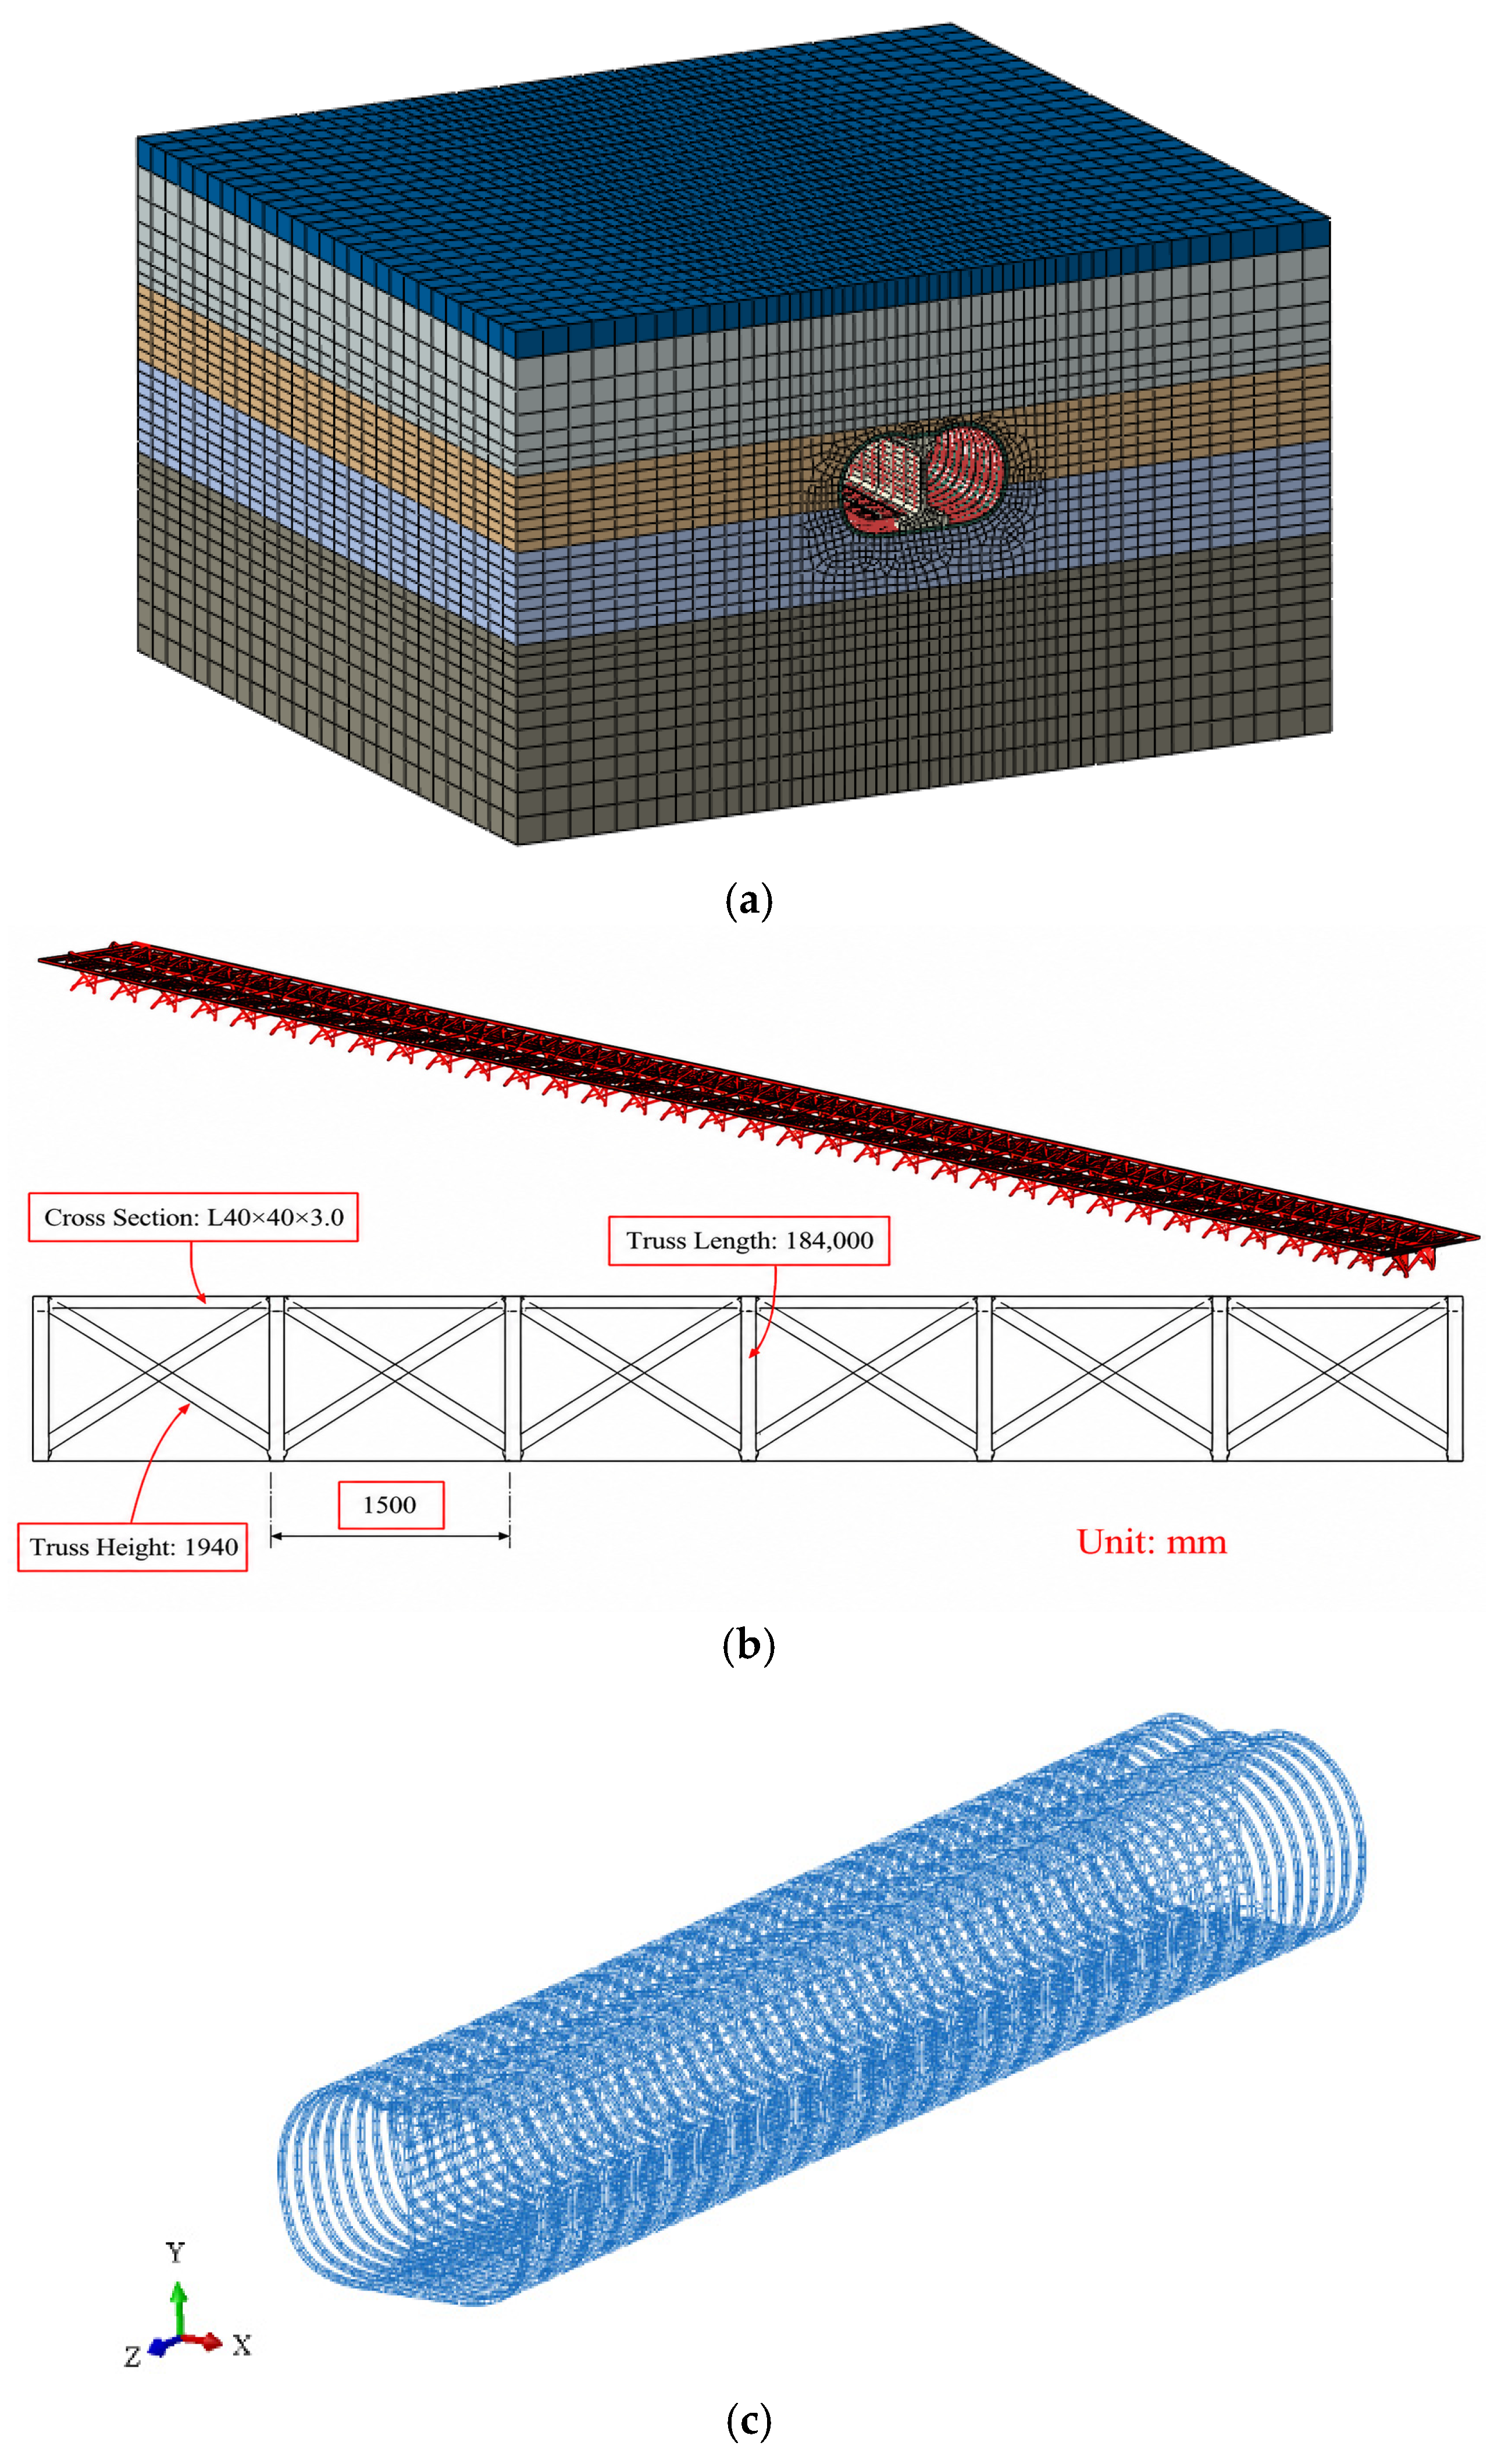
A three-dimensional numerical model including the soil layers, double-arch tunnel, and trestle was established using ABAQUS 2023. The overall model size was 60 m × 40 m × 60 m in length, height, and width, respectively. The domain dimensions were selected so that the lateral and bottom boundaries were sufficiently far from the tunnel to reduce artificial boundary effects on the structural response in the region of interest. The bottom boundary was fixed in all translational directions, while the lateral boundaries were constrained in the normal direction and allowed to move tangentially; the ground surface was free. The soil, tunnel, and rails were modeled using C3D8 solid elements. The top plate of the trestle was simulated using S4 shell elements, while the remaining support frames and tunnel reinforcement were simulated using B31 beam elements. The whole model contained 29,642 elements.
Viscoelastic artificial boundaries were applied to the lateral sides and bottom of the soil domain, as commonly adopted in dynamic soil–tunnel interaction analyzes. By absorbing outward-propagating waves induced by train vibration, these boundaries represent the radiation damping of the far-field semi-infinite soil and minimize spurious wave reflections from the truncated model boundaries. The ground surface was specified as a traction-free boundary, consistent with the actual site conditions.
The three-dimensional numerical model is shown in Figure 3. A locally refined mesh was adopted around the tunnel, middle partition wall, and trestle, where relatively large stress and deformation gradients were expected, while a coarser mesh was used toward the outer soil boundaries. A mesh-convergence check was also conducted using coarse, medium, and fine meshes. Contact interaction was adopted between the tunnel and the surrounding soil. The reinforcement was integrated into the tunnel lining using the embedded region constraint, and tie constraints were applied between different components of the trestle to simulate the actual welding effects.
To quantify this local refinement, component-specific mesh sizes were adopted according to the geometric characteristics and expected response gradients to balance computational accuracy and efficiency. The reinforced-concrete primary support and middle partition wall were discretized using elements with sizes ranging from 0.2 to 0.5 m. Within the soil domain, the mesh was progressively coarsened with increasing distance from the tunnel, with element sizes ranging from 0.5 m near the tunnel to 2.0 m in the far field. All element dimensions satisfied the one-eighth-wavelength criterion for dynamic analysis, thereby ensuring adequate resolution of the principal vibration-frequency components.
Rayleigh damping, consisting of mass- and stiffness-proportional components, was assigned to both the surrounding ground and tunnel structure in the dynamic time-history analysis. The Rayleigh coefficients were calculated using the first two natural frequencies of the coupled soil–tunnel system. A damping ratio of 3% was adopted for the reinforced-concrete primary support and middle partition wall, and a ratio of 4% for the surrounding ground. The former is commonly adopted for underground reinforced-concrete structures, whereas the latter lies within the conventional range used for comparable soil layers and is consistent with relevant design specifications and published studies.
The dynamic equations were integrated using the implicit Newmark-β average-acceleration scheme, with γ = 0.5 and β = 0.25. Because the principal frequency content of train-induced tunnel vibration was concentrated within 0–50 Hz, a constant time step of 0.002 s was adopted. This provided ten time increments per cycle at 50 Hz and satisfied the Nyquist sampling requirement, thereby resolving the high-frequency components of the response. The total simulation duration covered the complete passage of a single train and the subsequent free-vibration decay period, capturing the full temporal evolution of the dynamic response.
Mesh adequacy and overall model reliability were evaluated using a combination of the mesh-convergence check, the theoretical wavelength criterion, and field measurements. After confirming compliance with the dynamic wavelength requirement, the numerical results were compared directly with the field-monitoring data. Detailed comparisons of the corresponding key dynamic-response indicators are presented in Section 3.2. The close agreement between the numerical and measured results supports the adequacy of the adopted mesh configuration and the reliability of the numerical model for the present analysis.

2.2.2. Material Parameters

The Mohr–Coulomb constitutive model was adopted for the surrounding ground. This model was selected because the present study focuses primarily on the short-term overall stress redistribution and deformation response of the tunnel–ground system during construction-train passage, rather than on the detailed cyclic or strain-dependent behavior of the ground. In addition, the principal parameters required to characterize the strength and stiffness of the surrounding strata, including stiffness, cohesion, and friction angle, are available from the geotechnical investigation of the project, as summarized in Table 1. Therefore, the Mohr–Coulomb model provides a practical engineering representation of the surrounding ground for the scope of the present analysis.
A linear elastic constitutive model was adopted for the C25 concrete primary support and C45 concrete middle partition wall. This assumption is consistent with the specific objective of the present numerical analysis, which is to evaluate the short-term stress and deformation responses within the elastic-response range during individual construction-train passages, rather than to simulate progressive cracking, material damage, or long-term deterioration of the concrete. The reinforcement of the primary support and middle partition wall was modeled using a bilinear ideal elastoplastic constitutive relationship, while the Q235 steel components of the rail and trestle were modeled using the material parameters listed in Table 2.
For the short-term stress assessment, the calculated stresses were compared with the corresponding material design strengths specified in the applicable project design standards. For the Q235 steel trestle, the stress-utilization ratio was defined as η s = σ v m , m a x / f d , where f d is the design strength determined according to the member thickness. For the C25 primary support and C45 middle partition wall, the maximum compressive stresses were compared separately with their corresponding concrete compressive design strengths. A utilization ratio not exceeding unity was adopted as the material-level acceptance criterion. These checks do not constitute complete structural safety verification because global stability, buckling, connection capacity, concrete cracking, and fatigue are outside the scope of the present analysis.
It should be emphasized that the linear elastic representation of concrete does not account for tensile cracking, nonlinear stress redistribution after cracking, stiffness degradation, or accumulated damage under repeated loading. Similarly, the Mohr–Coulomb model does not explicitly represent stress-dependent stiffness or cyclic degradation of the surrounding ground. The implications of these simplifications are further discussed in the Section 4.

2.2.3. Simulation Cases and Methodology

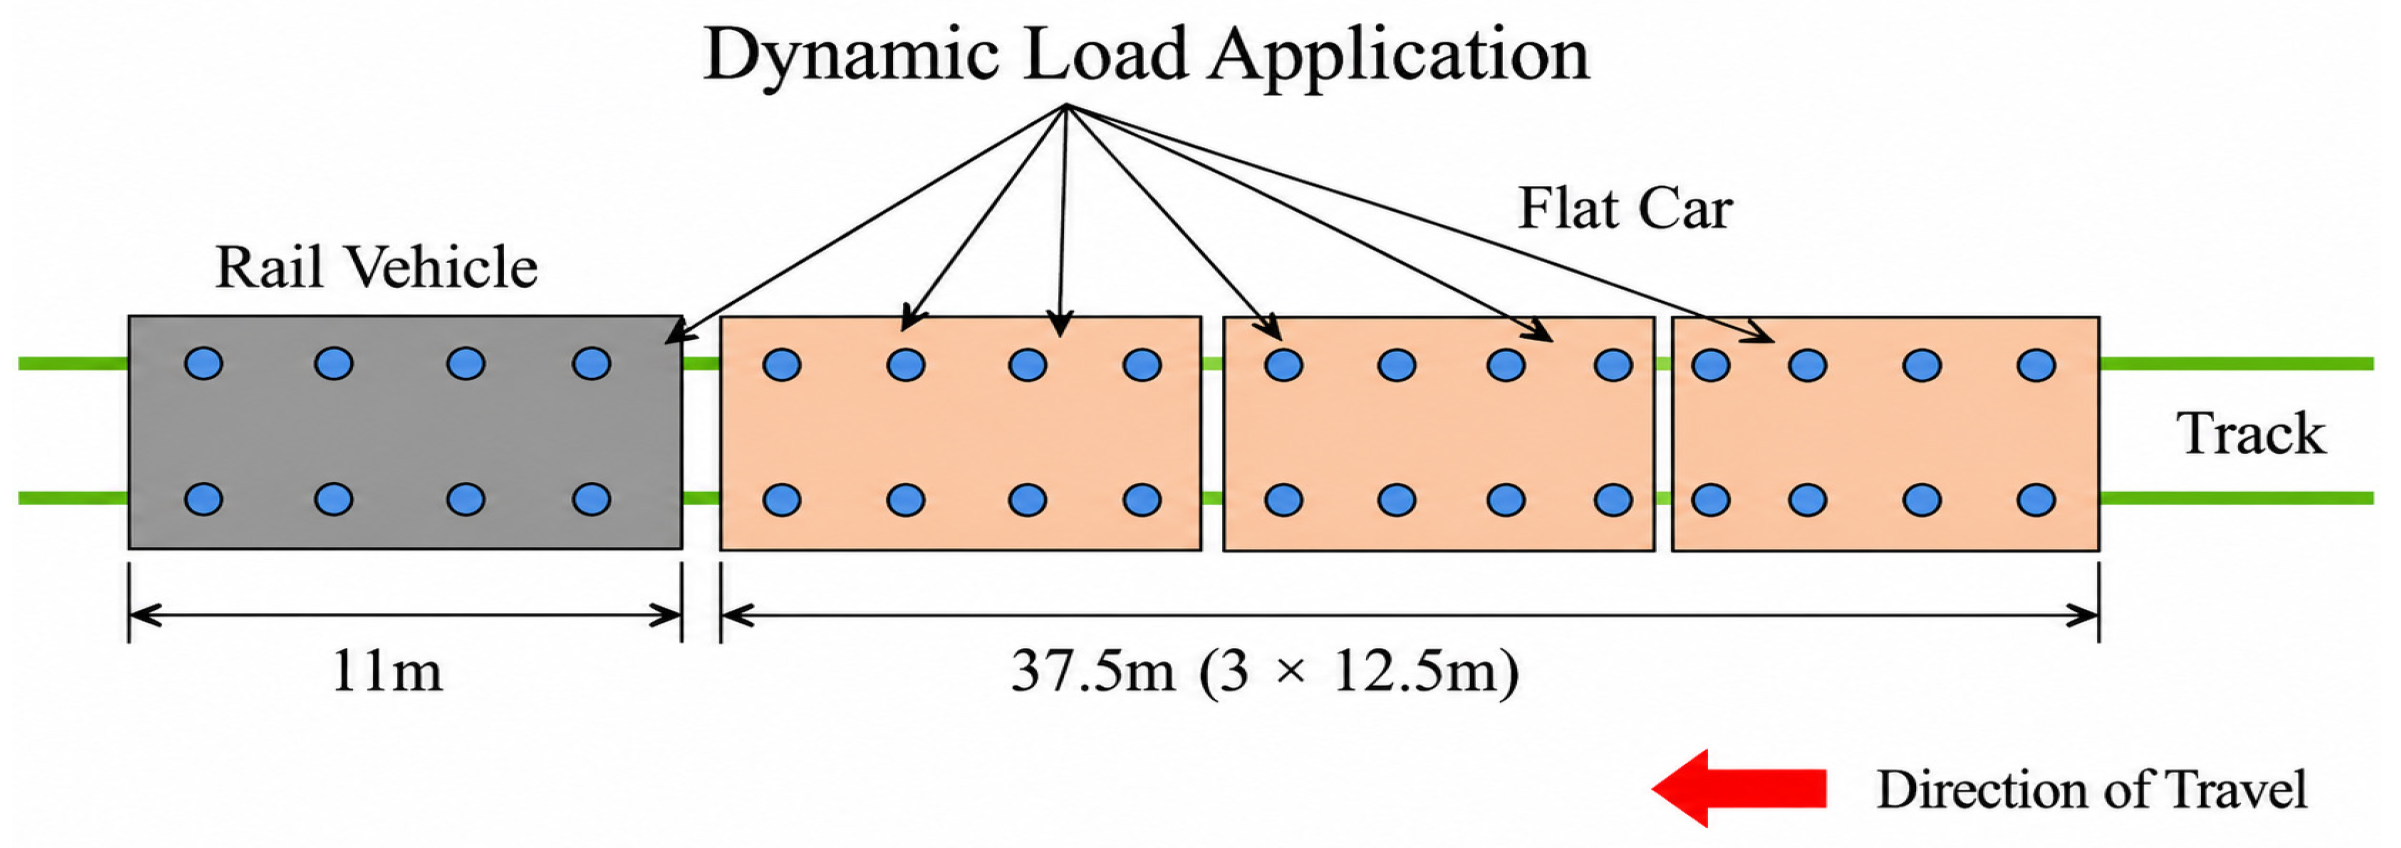
A rail-mounted vehicle operates on the trestle bridge in a consist comprising one traction unit followed by two flatbed cars, with each vehicle equipped with eight wheels. The tare weight of the traction unit is 25 t, while each flatbed car has a tare weight of 13 t and a maximum payload of 15 t. The numerical speed range of 10–70 km/h was selected as a parametric range to characterize the speed-dependent response and provide an upper response envelope for the tunnel–trestle system; it should not be interpreted as an allowable operating-speed range. The approximately 30 km/h control speed discussed later was subsequently derived from the combined numerical and field-monitoring results.
An excitation-force-function approach was used to represent train-induced dynamic loading by combining static wheel loads with speed-dependent harmonic components. The moving loads were applied directly to the rail, while the vehicle and wheel–rail interaction were not explicitly modeled. Thus, the method captures the main speed-dependent response rather than full vehicle–track–trestle–tunnel coupling. The specific expression for the train-induced vibration load is given as follows:
F t = P 0 + P 1 s i n ( ω 1 t ) + P 2 s i n ( ω 2 t ) + P 3 s i n ( ω 3 t )
where t denotes time; P 0 is the static load acting on the wheel, which is mainly related to the vehicle body weight; P 1 , P 2 , and P 3 represent the amplitudes of the vehicle-induced vibration loads under different operating conditions; and ω i denotes the circular frequency corresponding to the vibration wavelength associated with track irregularities during vehicle operation, which can be calculated as follows:
ω 1 = 2 π v / L i
where L i is the representative wavelength, and v denotes the train operating speed.
The amplitudes of the train-induced vibration loads under different operating conditions can be obtained as follows:
P i = M 0 α i ω i 2
where M 0 denotes the unstrung mass corresponding to the vehicle, and α i represents the characteristic versing.
The vehicle is not explicitly modeled; instead, time-dependent wheel loads are applied directly to the rails as moving external excitations. This approach reduces computational complexity and is suitable for short-term response analysis, but does not account for feedback from track vibration to vehicle dynamics or fully coupled vehicle–track interaction. Therefore, the train operational loads are directly applied to the rails in the form of dynamic loads, as shown in Figure 4.

3. Results and Analysis

3.1. Selections

3.1.1. Simulation Scenarios

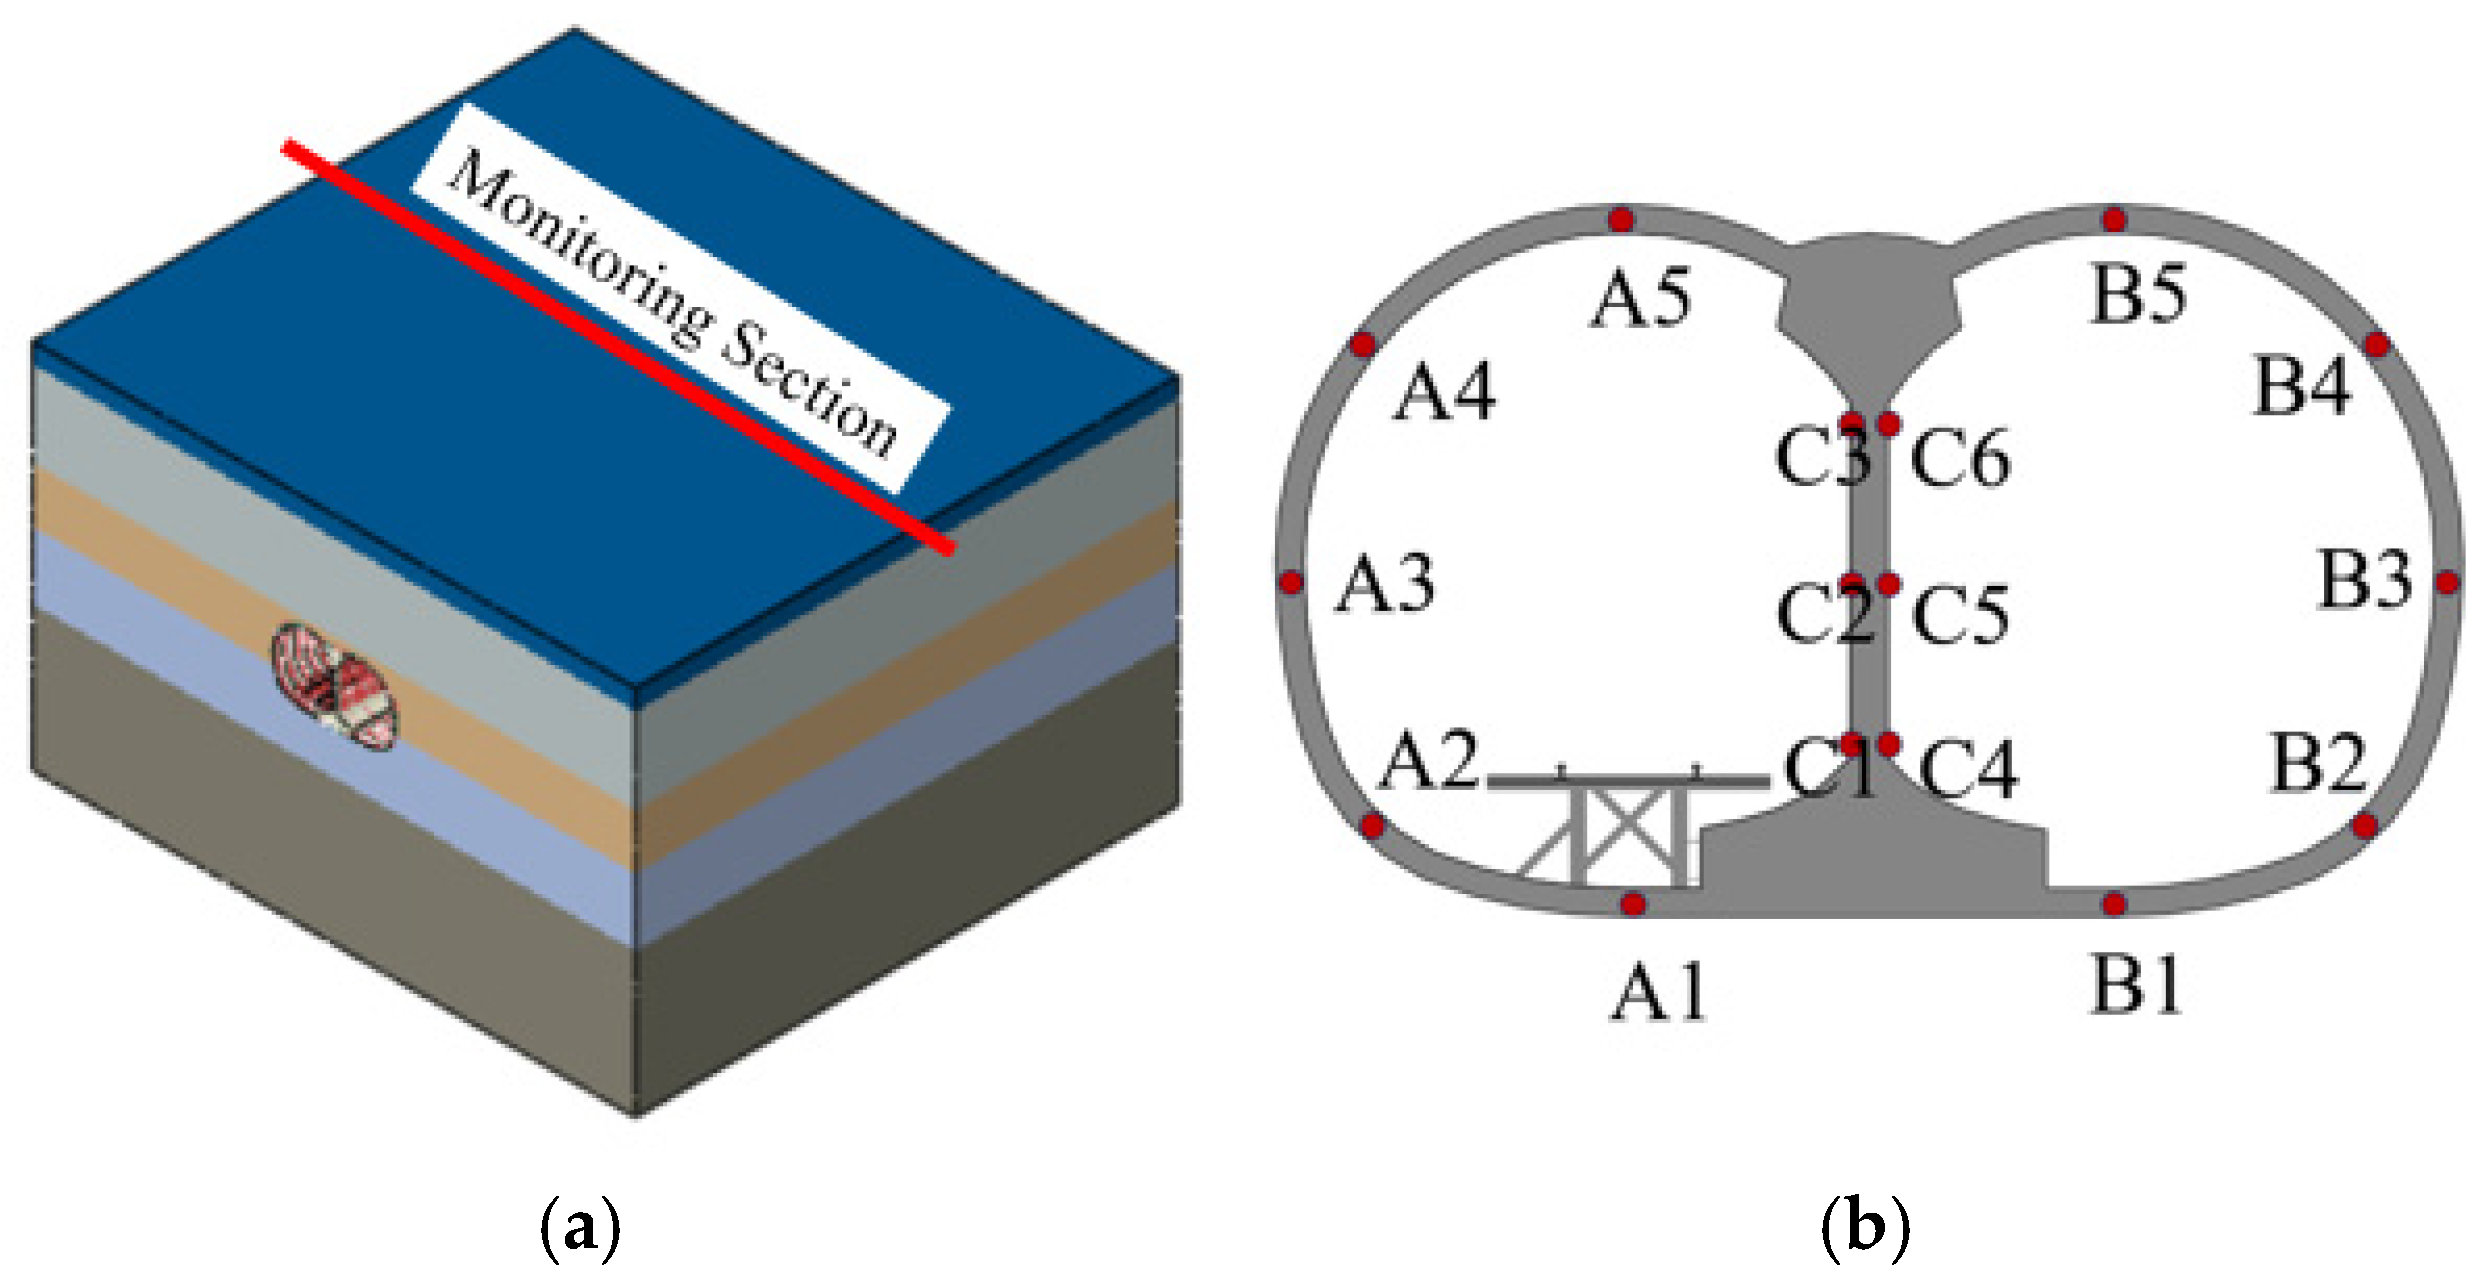
For the stress and deformation analysis of the tunnel structure and trestle under train loading, the middle cross-section was selected as the representative monitoring section. Key monitoring points were arranged on the primary tunnel support and the middle partition wall, including the vault, arch shoulder, arch waist, invert, and different elevations along the middle partition wall, as shown in Figure 5.

3.1.2. Stress Response Analysis of the Tunnel Lining Structure

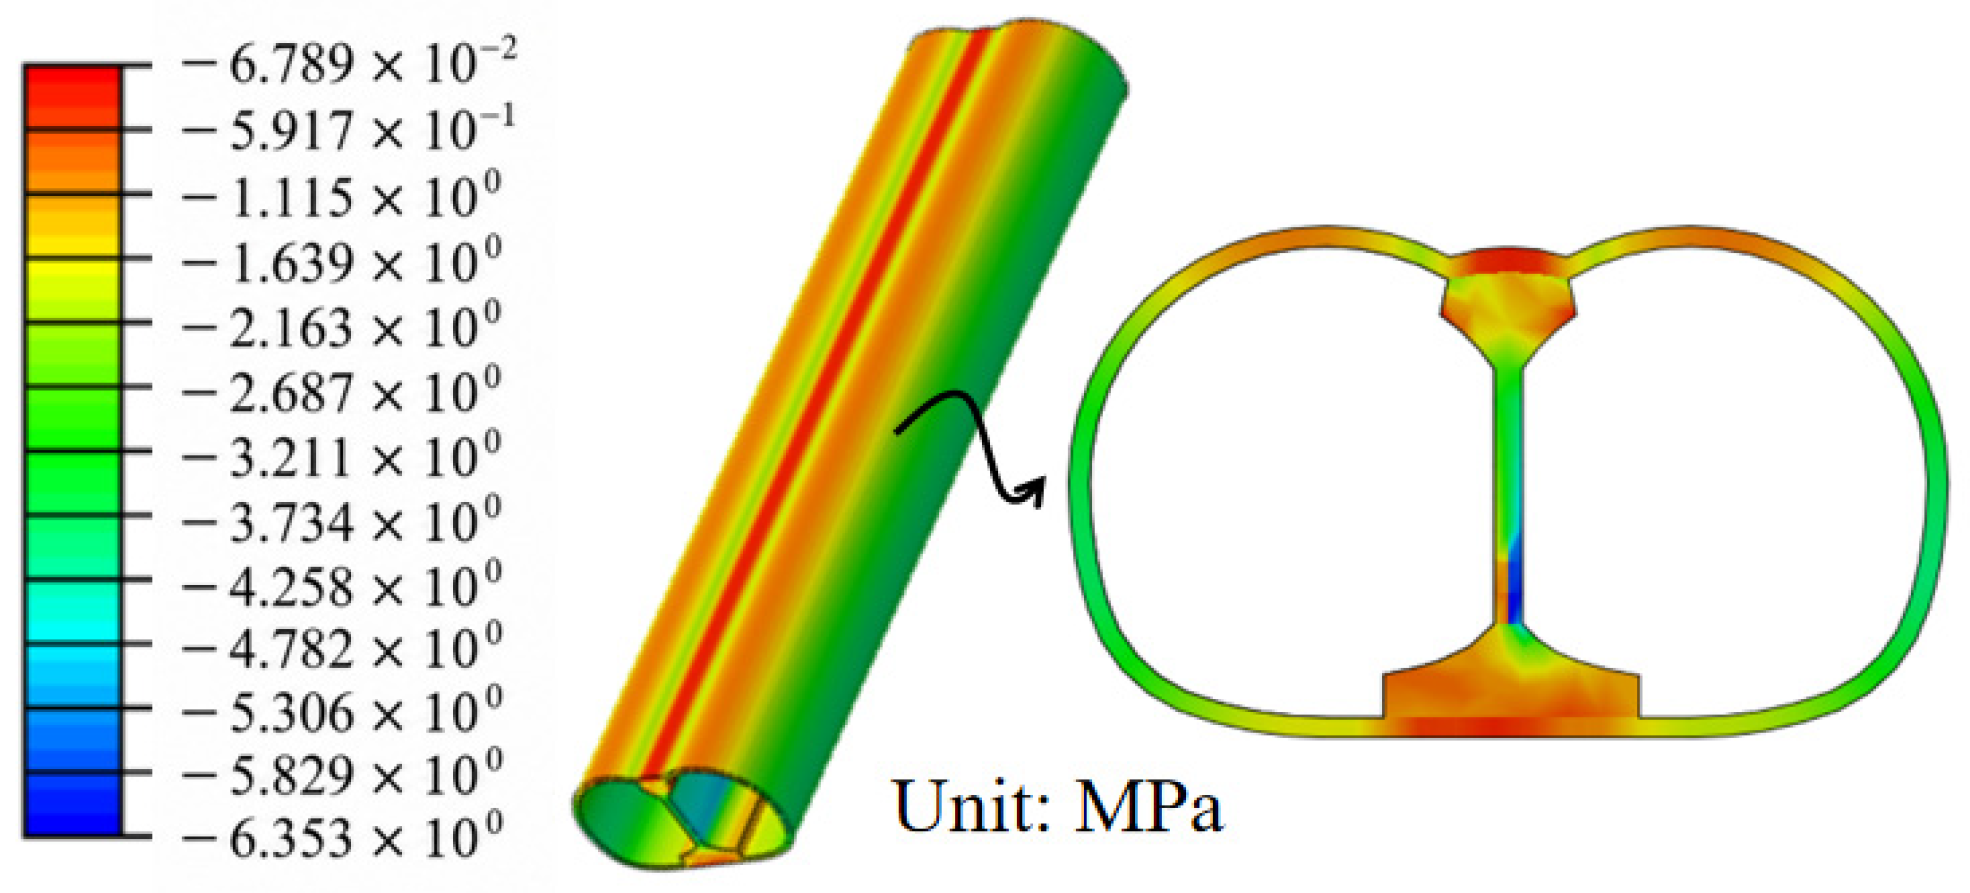
As the stress distribution characteristics of the tunnel structure are similar under different train operating speeds, the stress contour plots of the tunnel lining structure at 70 km/h were selected as representative results for analysis, as shown in Figure 6. When the train reaches the monitoring section, the maximum compressive stress in the tunnel lining is approximately 6.35 MPa, occurring at the bottom of the right side of the middle partition wall. Overall, the compressive stress at the bottom of the middle partition wall is greater than that in its upper part, and a significant difference in compressive stress is observed between the left and right sides at the bottom. The asymmetric stress response of the lower middle partition wall results from the eccentric load-transfer path induced by unilateral train loading, which transfers the load primarily through the loaded-side invert and lower partition wall before redistribution to the adjacent tunnel bore.
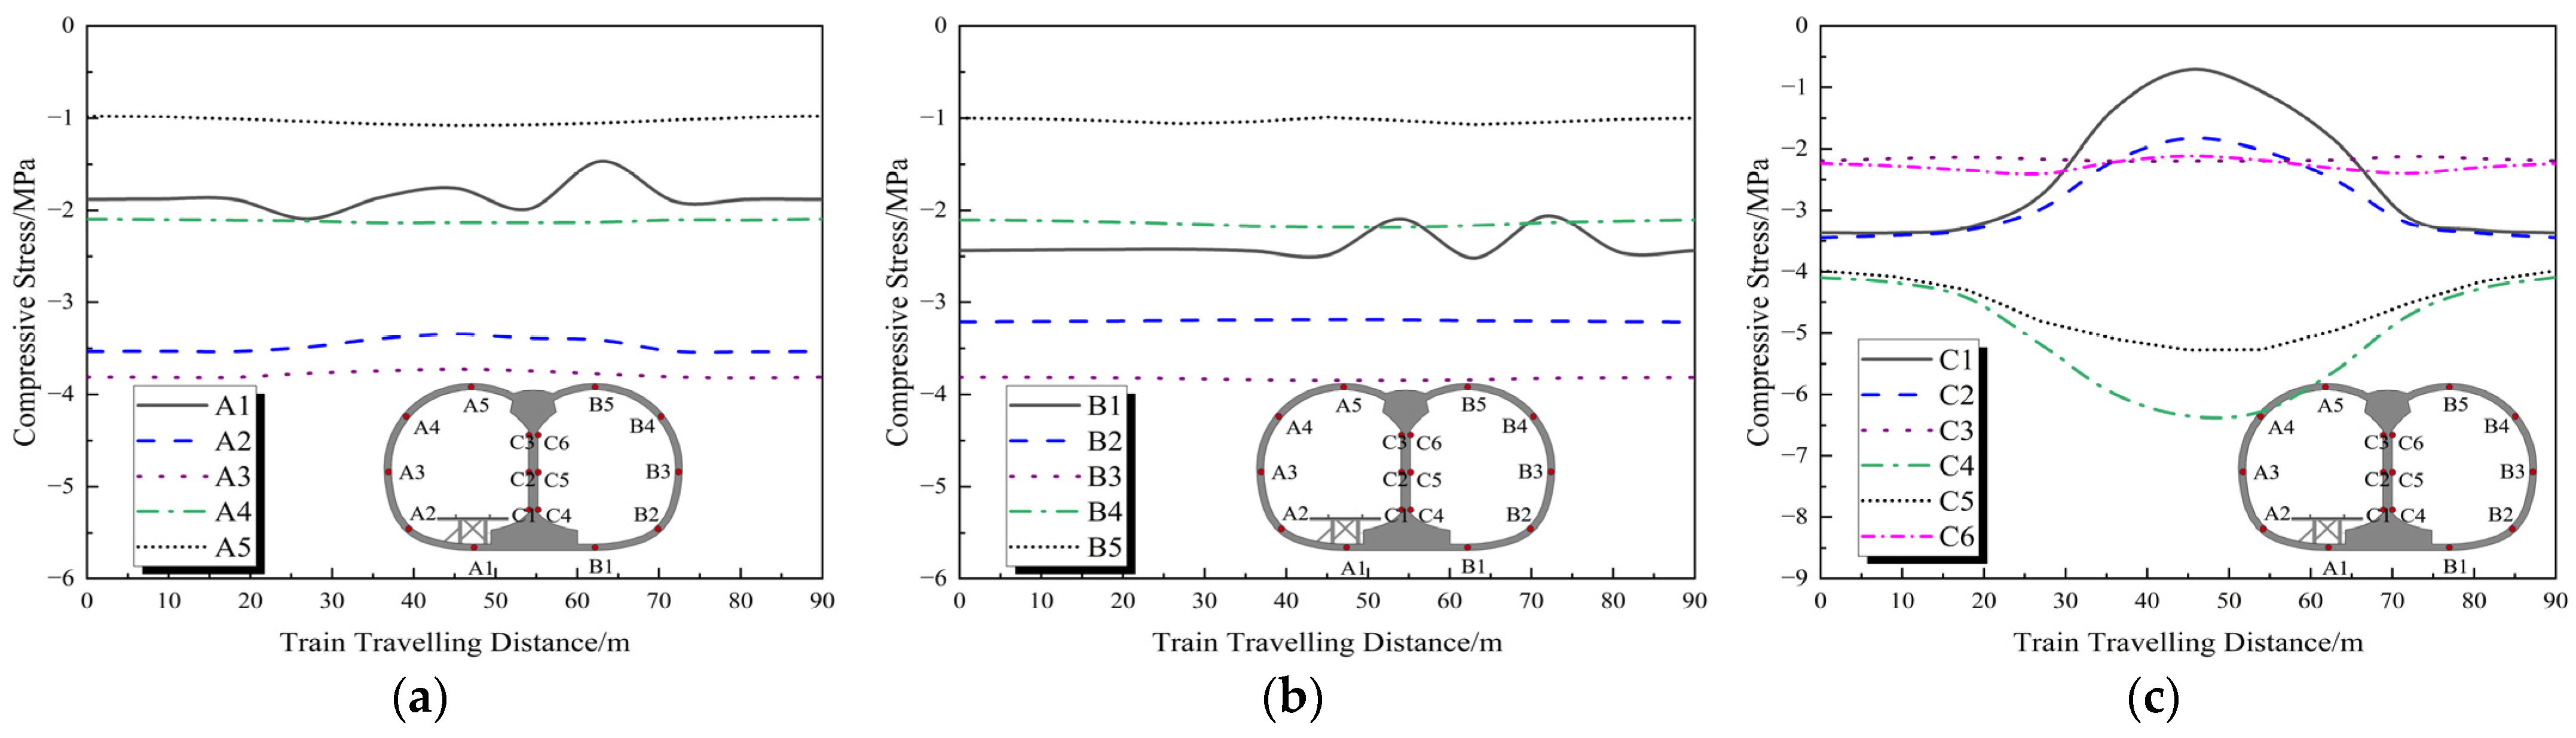
The stress variations at the monitoring points in the left tunnel, right tunnel, and middle partition wall at different time instants were further summarized, as shown in Figure 7. By comparing the dynamic variations in compressive stress at different monitoring points, it can be observed that the influence of train loading on different positions of the lining structure varies considerably. For the left and right tunnel bores, train loading mainly affects the stress state at the invert, whereas the changes in compressive stress at the other positions are relatively minor and can be considered negligible. In contrast, both the middle and lower parts of the middle partition wall are significantly affected, while the influence on the top part is limited. This indicates that the middle partition wall is subjected to more unfavorable effects along the height direction than the primary support.
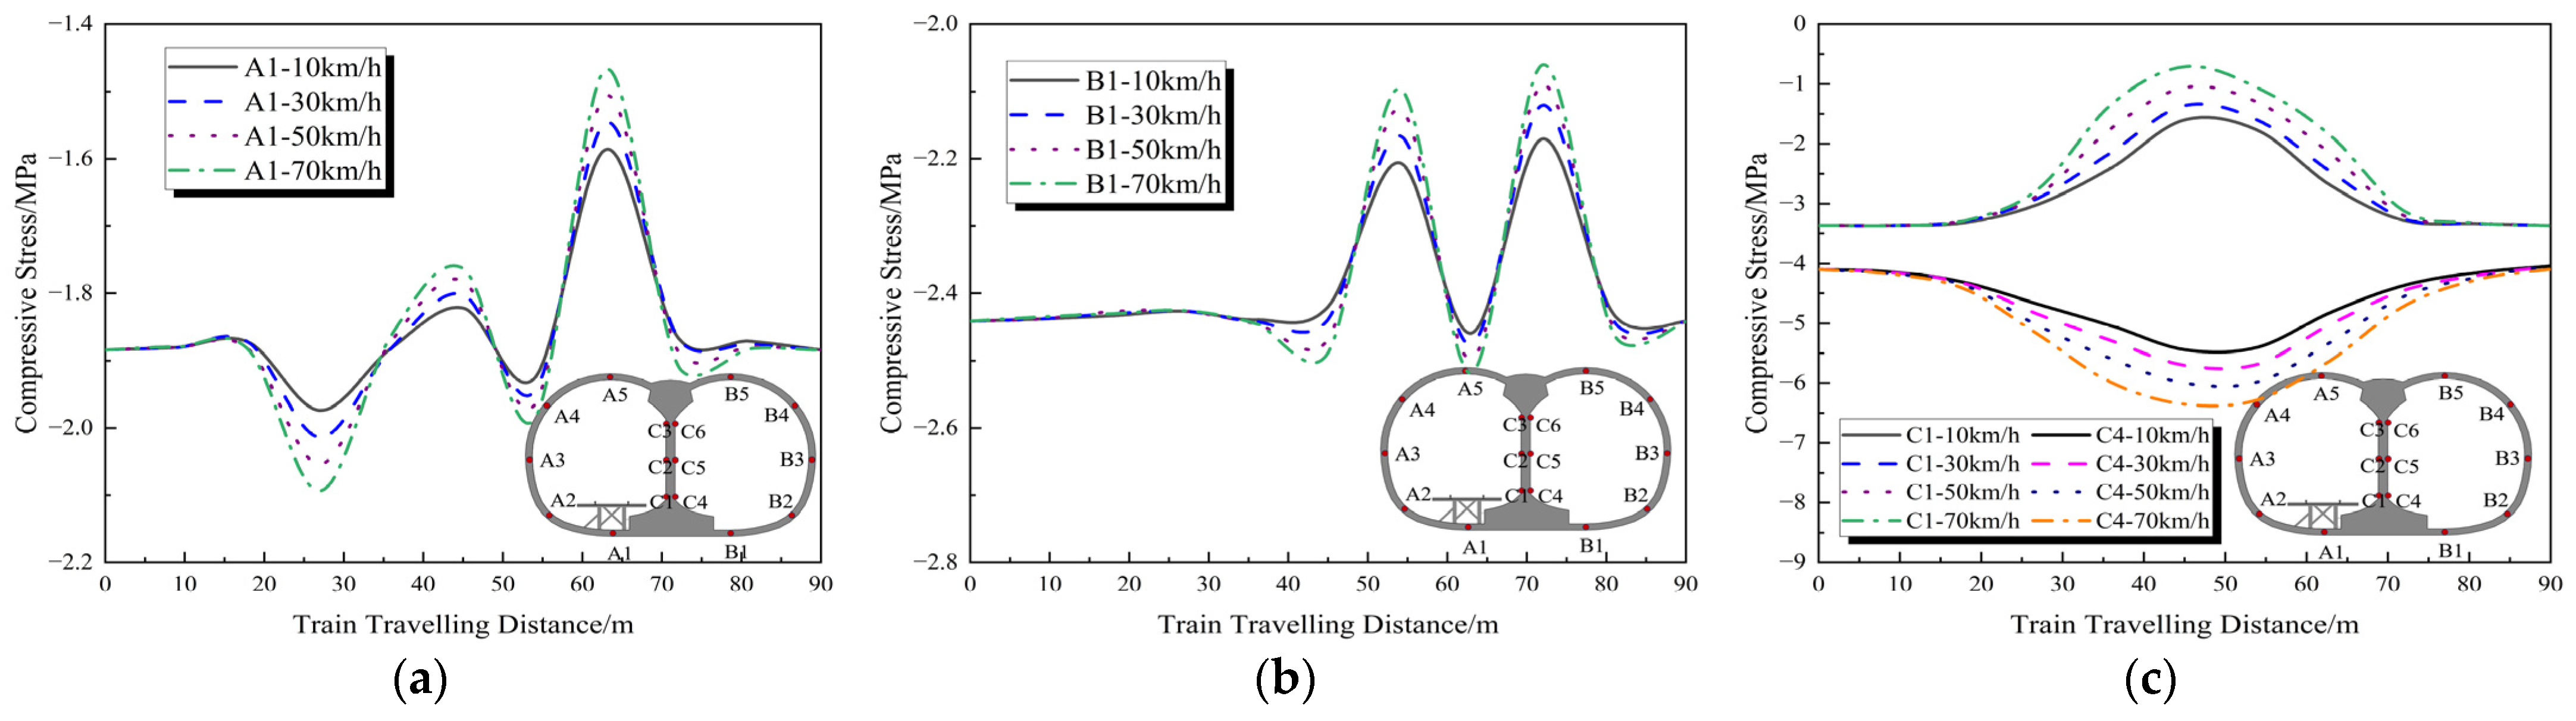
Based on the statistical results presented in Figure 7, the monitoring points most sensitive to train loading in the left tunnel, middle partition wall, and right tunnel were identified as points A1, B1, C1, and C4, respectively. The stress variations at these points under different train operating speeds are summarized in Figure 8. It can be clearly observed that the structural stress response increases with increasing train operating speed, and similar trends are observed at all selected monitoring points, which is consistent with findings reported in relevant studies. Within the investigated speed range, the maximum lining compressive stress remained below 10 MPa and generally recovered after train passage. The stress response increased with train speed and was most pronounced at the tunnel invert. Unlike conventional symmetric cases, the present double-arch tunnel showed a clear asymmetric stress distribution, particularly in the lower middle partition wall, due to unilateral load transfer through the temporary trestle.
It should be noted that the above results do not imply that train loading has no influence on structural safety. In practical engineering, the adverse effects of train loading on structural deformation and damage often become evident only after long-term repeated loading. However, the tunnel structure discussed in this study is still under construction, and unilateral train loading exists only over a short period. It should be emphasized that the response analyzed in this section represents the short-term behavior of the tunnel–trestle system during individual train passages in the construction stage. Although the calculated stress and deformation largely recover after the train leaves the monitoring section, this recovery does not imply that repeated train loading has no long-term effects. Under numerous loading cycles, fatigue damage, stiffness degradation, residual deformation, and crack initiation or propagation may gradually accumulate.

3.1.3. Lining Structure Deformation Analysis

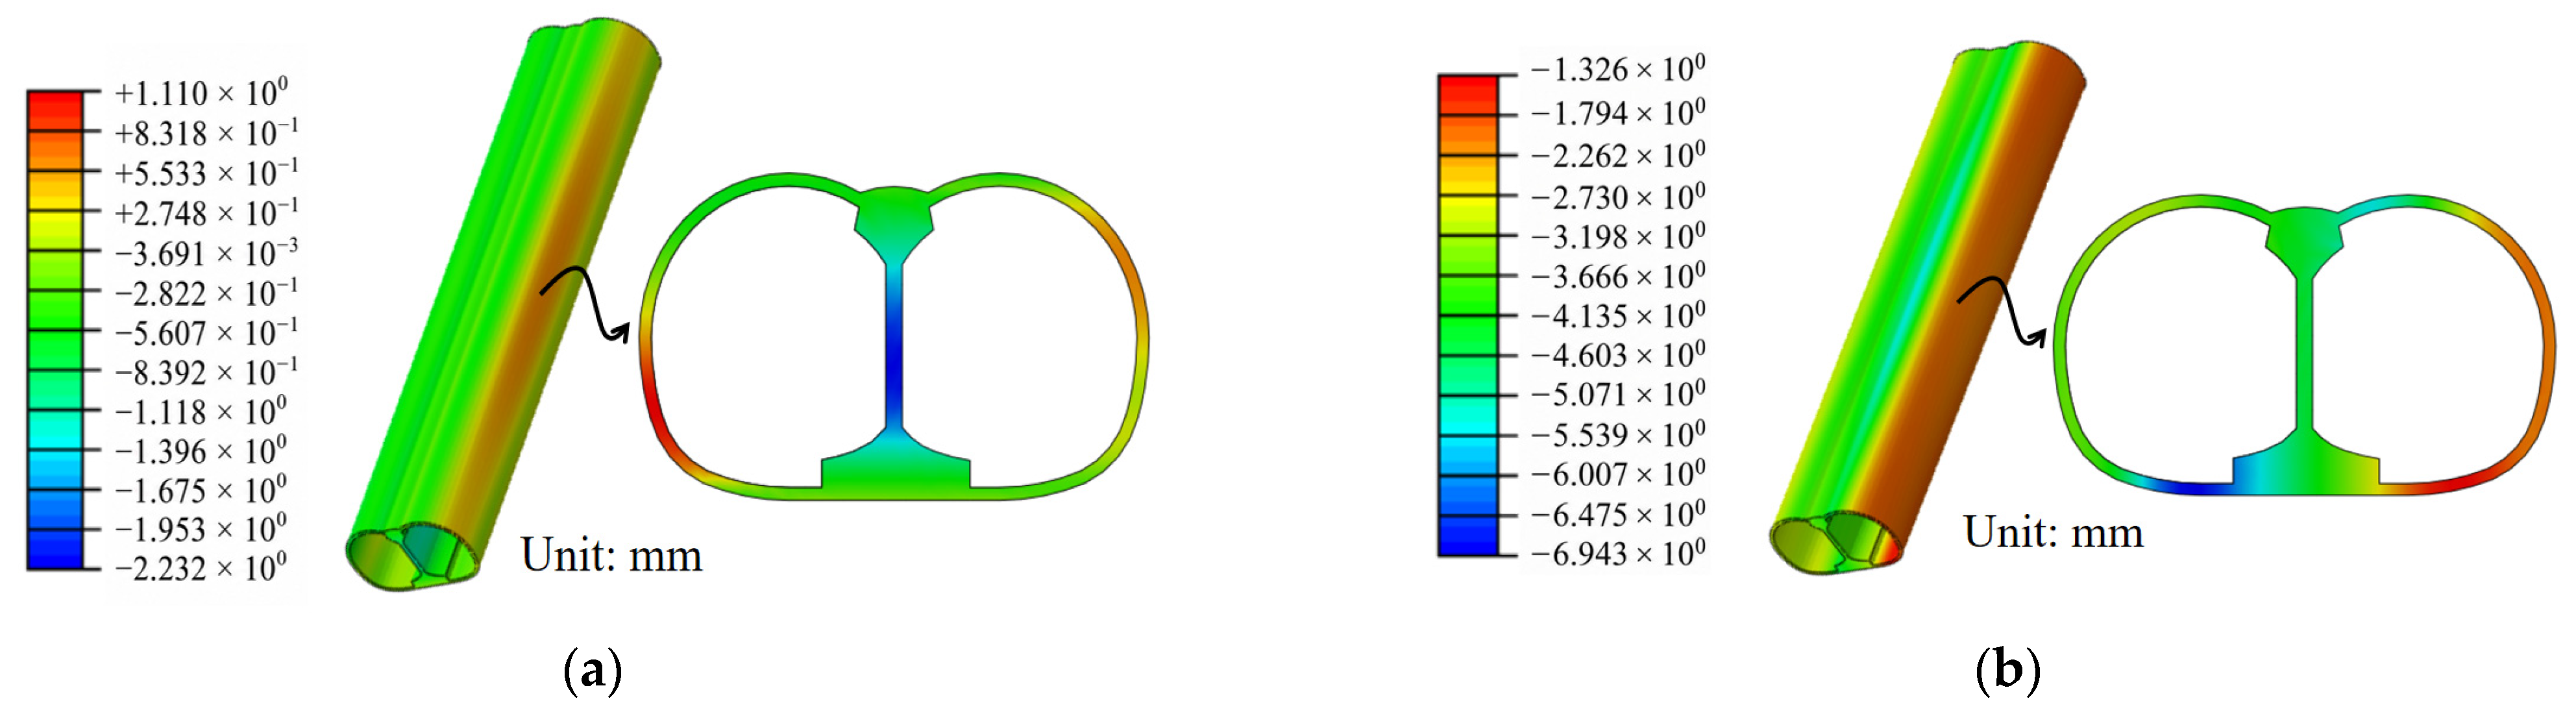
Considering that the deformation distribution characteristics of the tunnel structure are generally similar under different train operating speeds, the deformation contour plots of the tunnel lining structure at 70 km/h were selected for discussion, as shown in Figure 9. It can be seen that when the train reaches the monitoring section, the maximum horizontal deformation of the left tunnel is approximately 1.11 mm. In contrast, the maximum horizontal deformation of the right tunnel is about 0.57 mm, which is much smaller than that of the left tunnel. This indicates that, under unilateral train loading, the influences on different parts of the double-arch tunnels are significantly different, and the tunnel carrying the train load is subjected to a more pronounced deformation response. In addition, the horizontal deformation of the middle partition wall is greater, with a peak value reaching 2.23 mm, which is nearly twice that of the primary support. This further demonstrates the asymmetric deformation effect induced by unilateral train loading. Owing to train operation on the trestle above the left tunnel, the deformation direction of the middle partition wall also tends toward the left tunnel. The larger deformation of the loaded-side tunnel and lateral displacement of the middle partition wall indicate mechanical coupling between the two bores. Under unilateral loading, the temporary trestle applies an eccentric vertical dynamic load to the loaded-side bore, while the middle partition wall transfers part of this load to the adjacent bore. This combined direct loading and load redistribution results in the observed asymmetric deformation pattern.
The vertical displacement contour of the structure is shown in Figure 9b. In terms of vertical deformation, unilateral train loading induces downward deformation of the nearby invert and the base of the middle partition wall, with a maximum value of 6.94 mm. In contrast, the vertical deformation of the middle partition wall base on the right-tunnel side is relatively small, approximately 2.70 mm. A difference of about 3 mm in vertical displacement is observed between the left and right sides. Moreover, considering that the above deformation does not cause the material of the middle partition wall to enter the plastic deformation stage, the deformation is expected to recover to a symmetric state between the left and right tunnel sides after the train has passed.
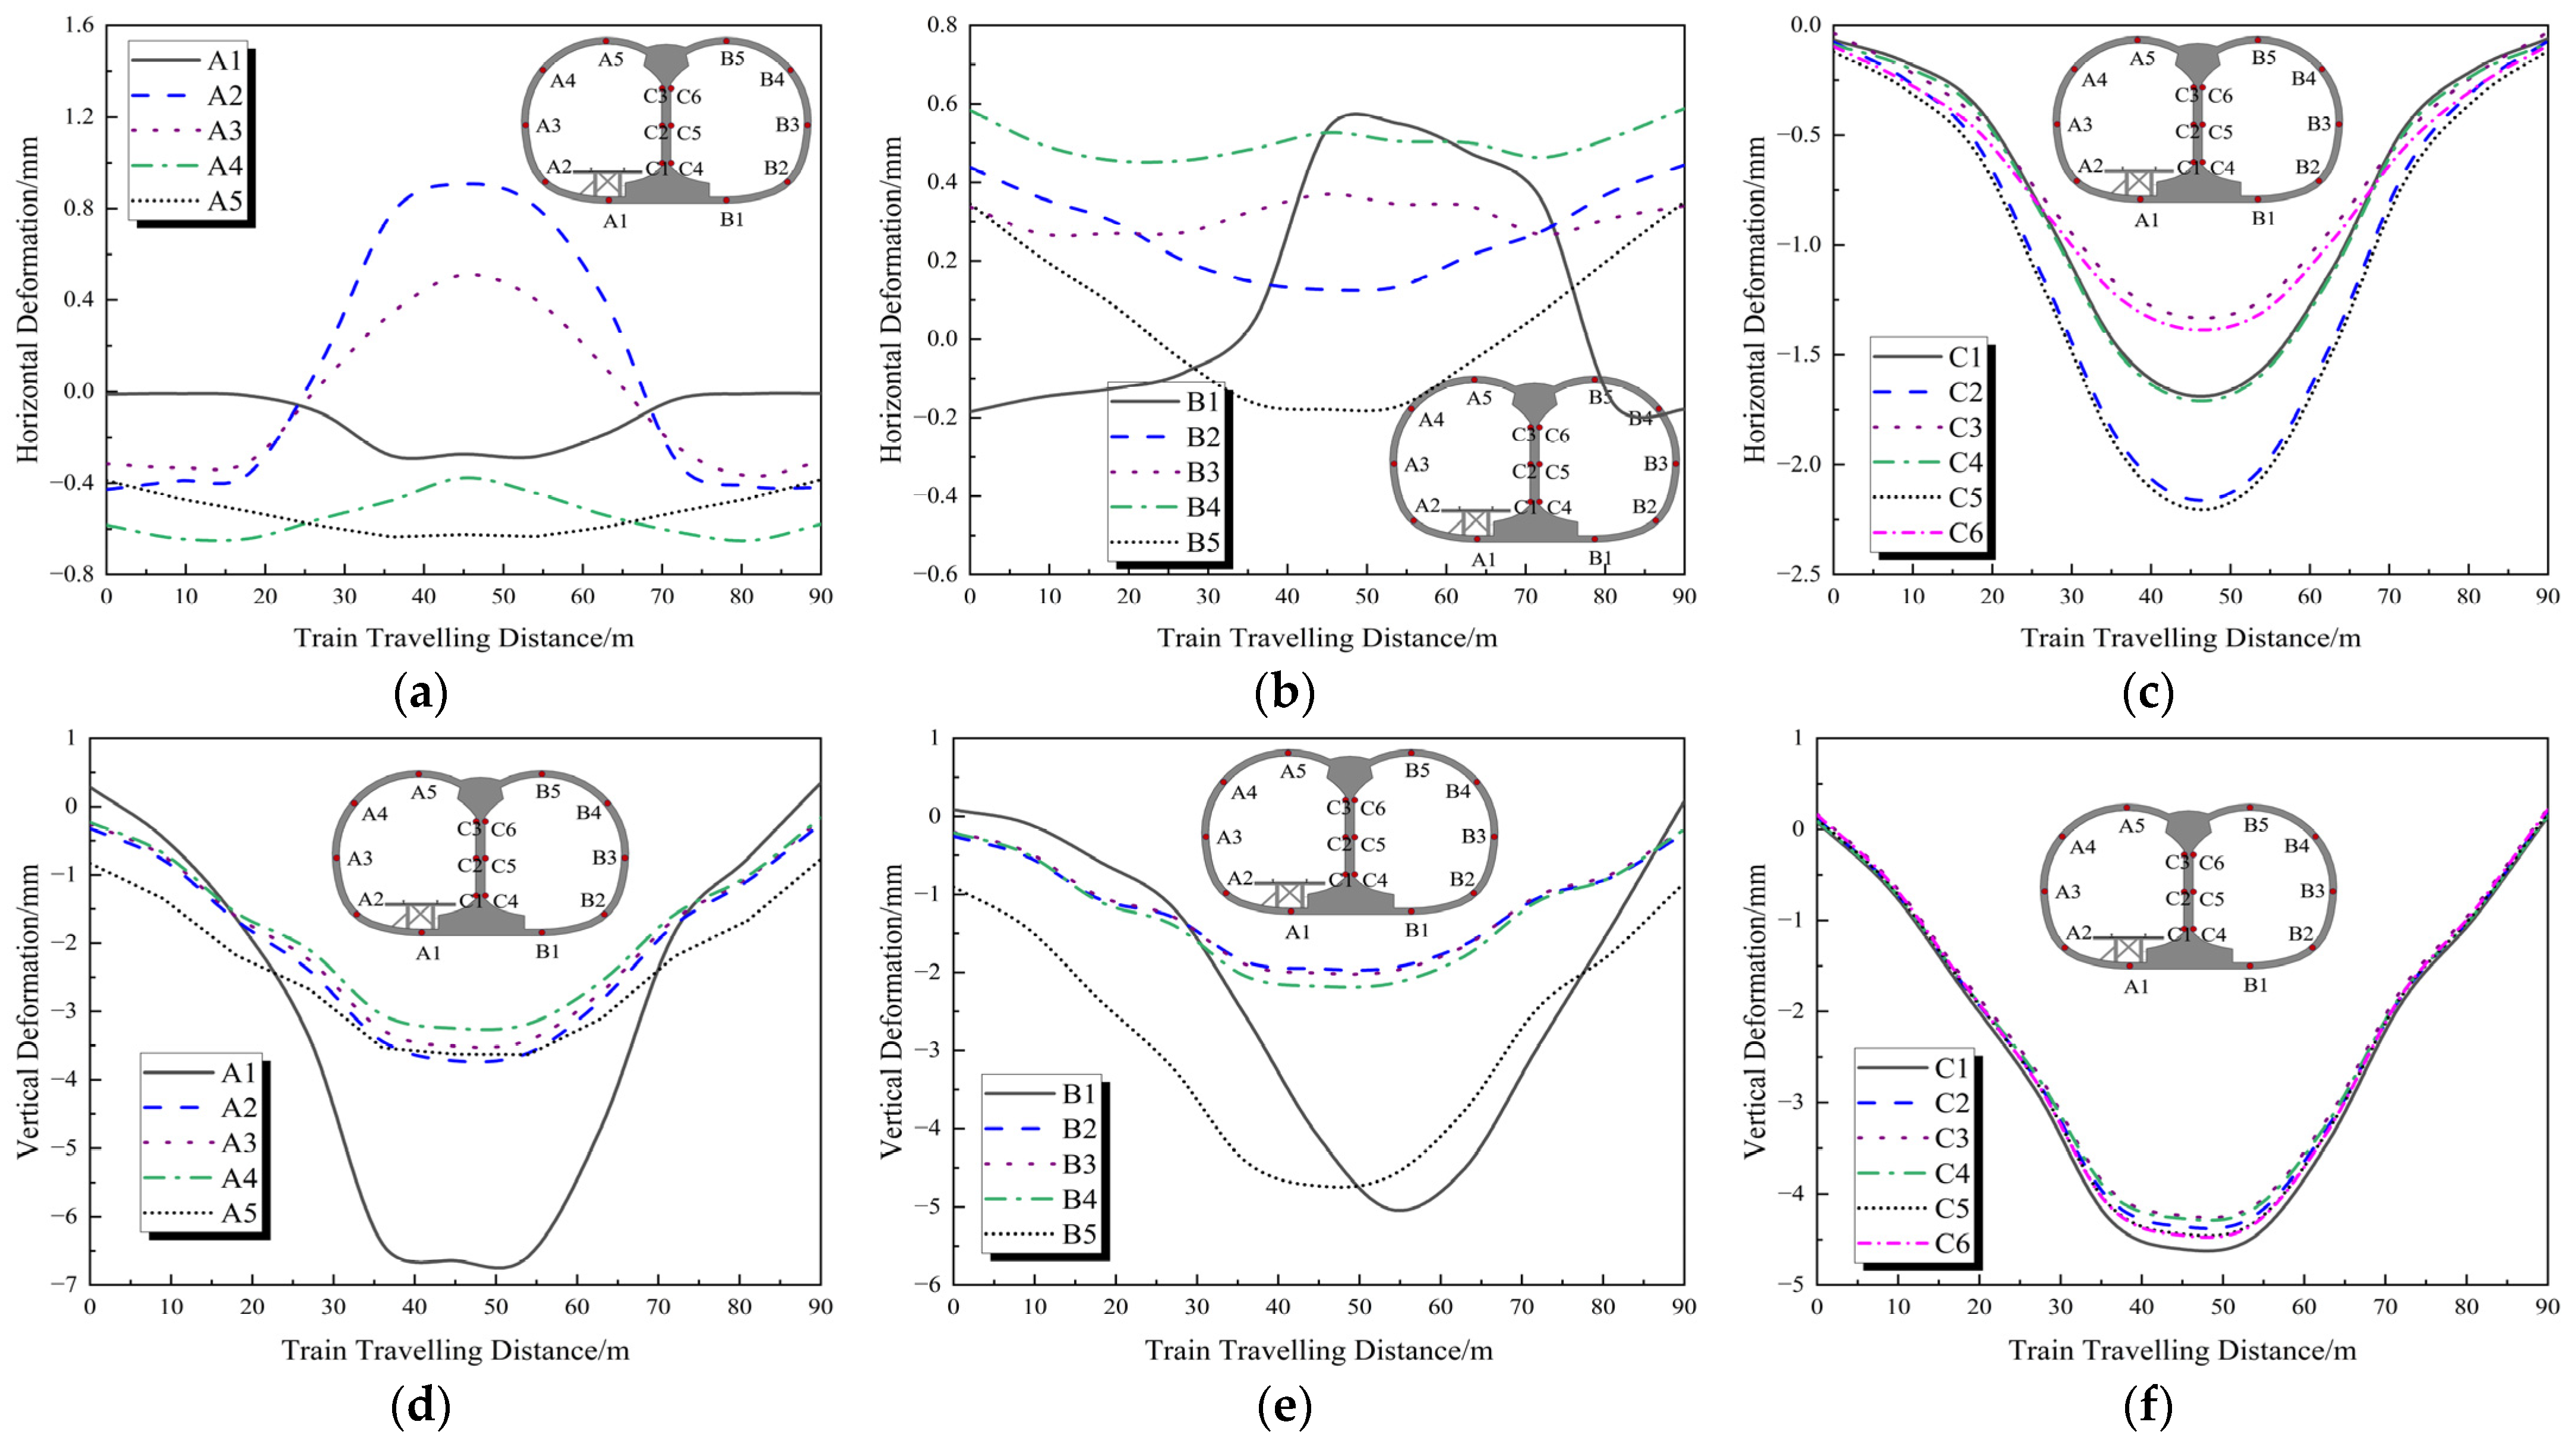
The deformation variations at different monitoring points with respect to the train traveling distance were further extracted, as shown in Figure 10. It can be observed that, as the train position changes, both the horizontal and vertical deformations of the middle partition wall in the mined tunnel vary accordingly. Specifically, the arch waist of the primary support deforms inward toward the tunnel, whereas the middle partition wall deforms toward the trestle, indicating an overall narrowing tendency of the tunnel structure in the horizontal direction. In addition, the vertical deformation at the tunnel vault increases, exhibiting a certain settlement tendency. A comparison indicates that, for both horizontal and vertical deformations, considerable differences exist among different positions in the left and right tunnel bores. Specifically, the maximum difference in horizontal deformation among the monitoring points in the left tunnel reaches 1.6 mm, whereas that in the right tunnel is 0.8 mm. The maximum difference in vertical deformation among the monitoring points in the left and right tunnels is approximately 3 mm. This suggests that, under unilateral train loading, the deformation distribution of the tunnel lining differs significantly from that under gravity loading alone. In addition, a pronounced difference in vertical deformation is observed between the left and right tunnel bores. Owing to the eccentric effect of unilateral train loading, the maximum deformation at the invert of the left tunnel exceeds that of the right tunnel by approximately 5 mm. In contrast, the deformation differences among the monitoring points on the middle partition wall are much smaller.
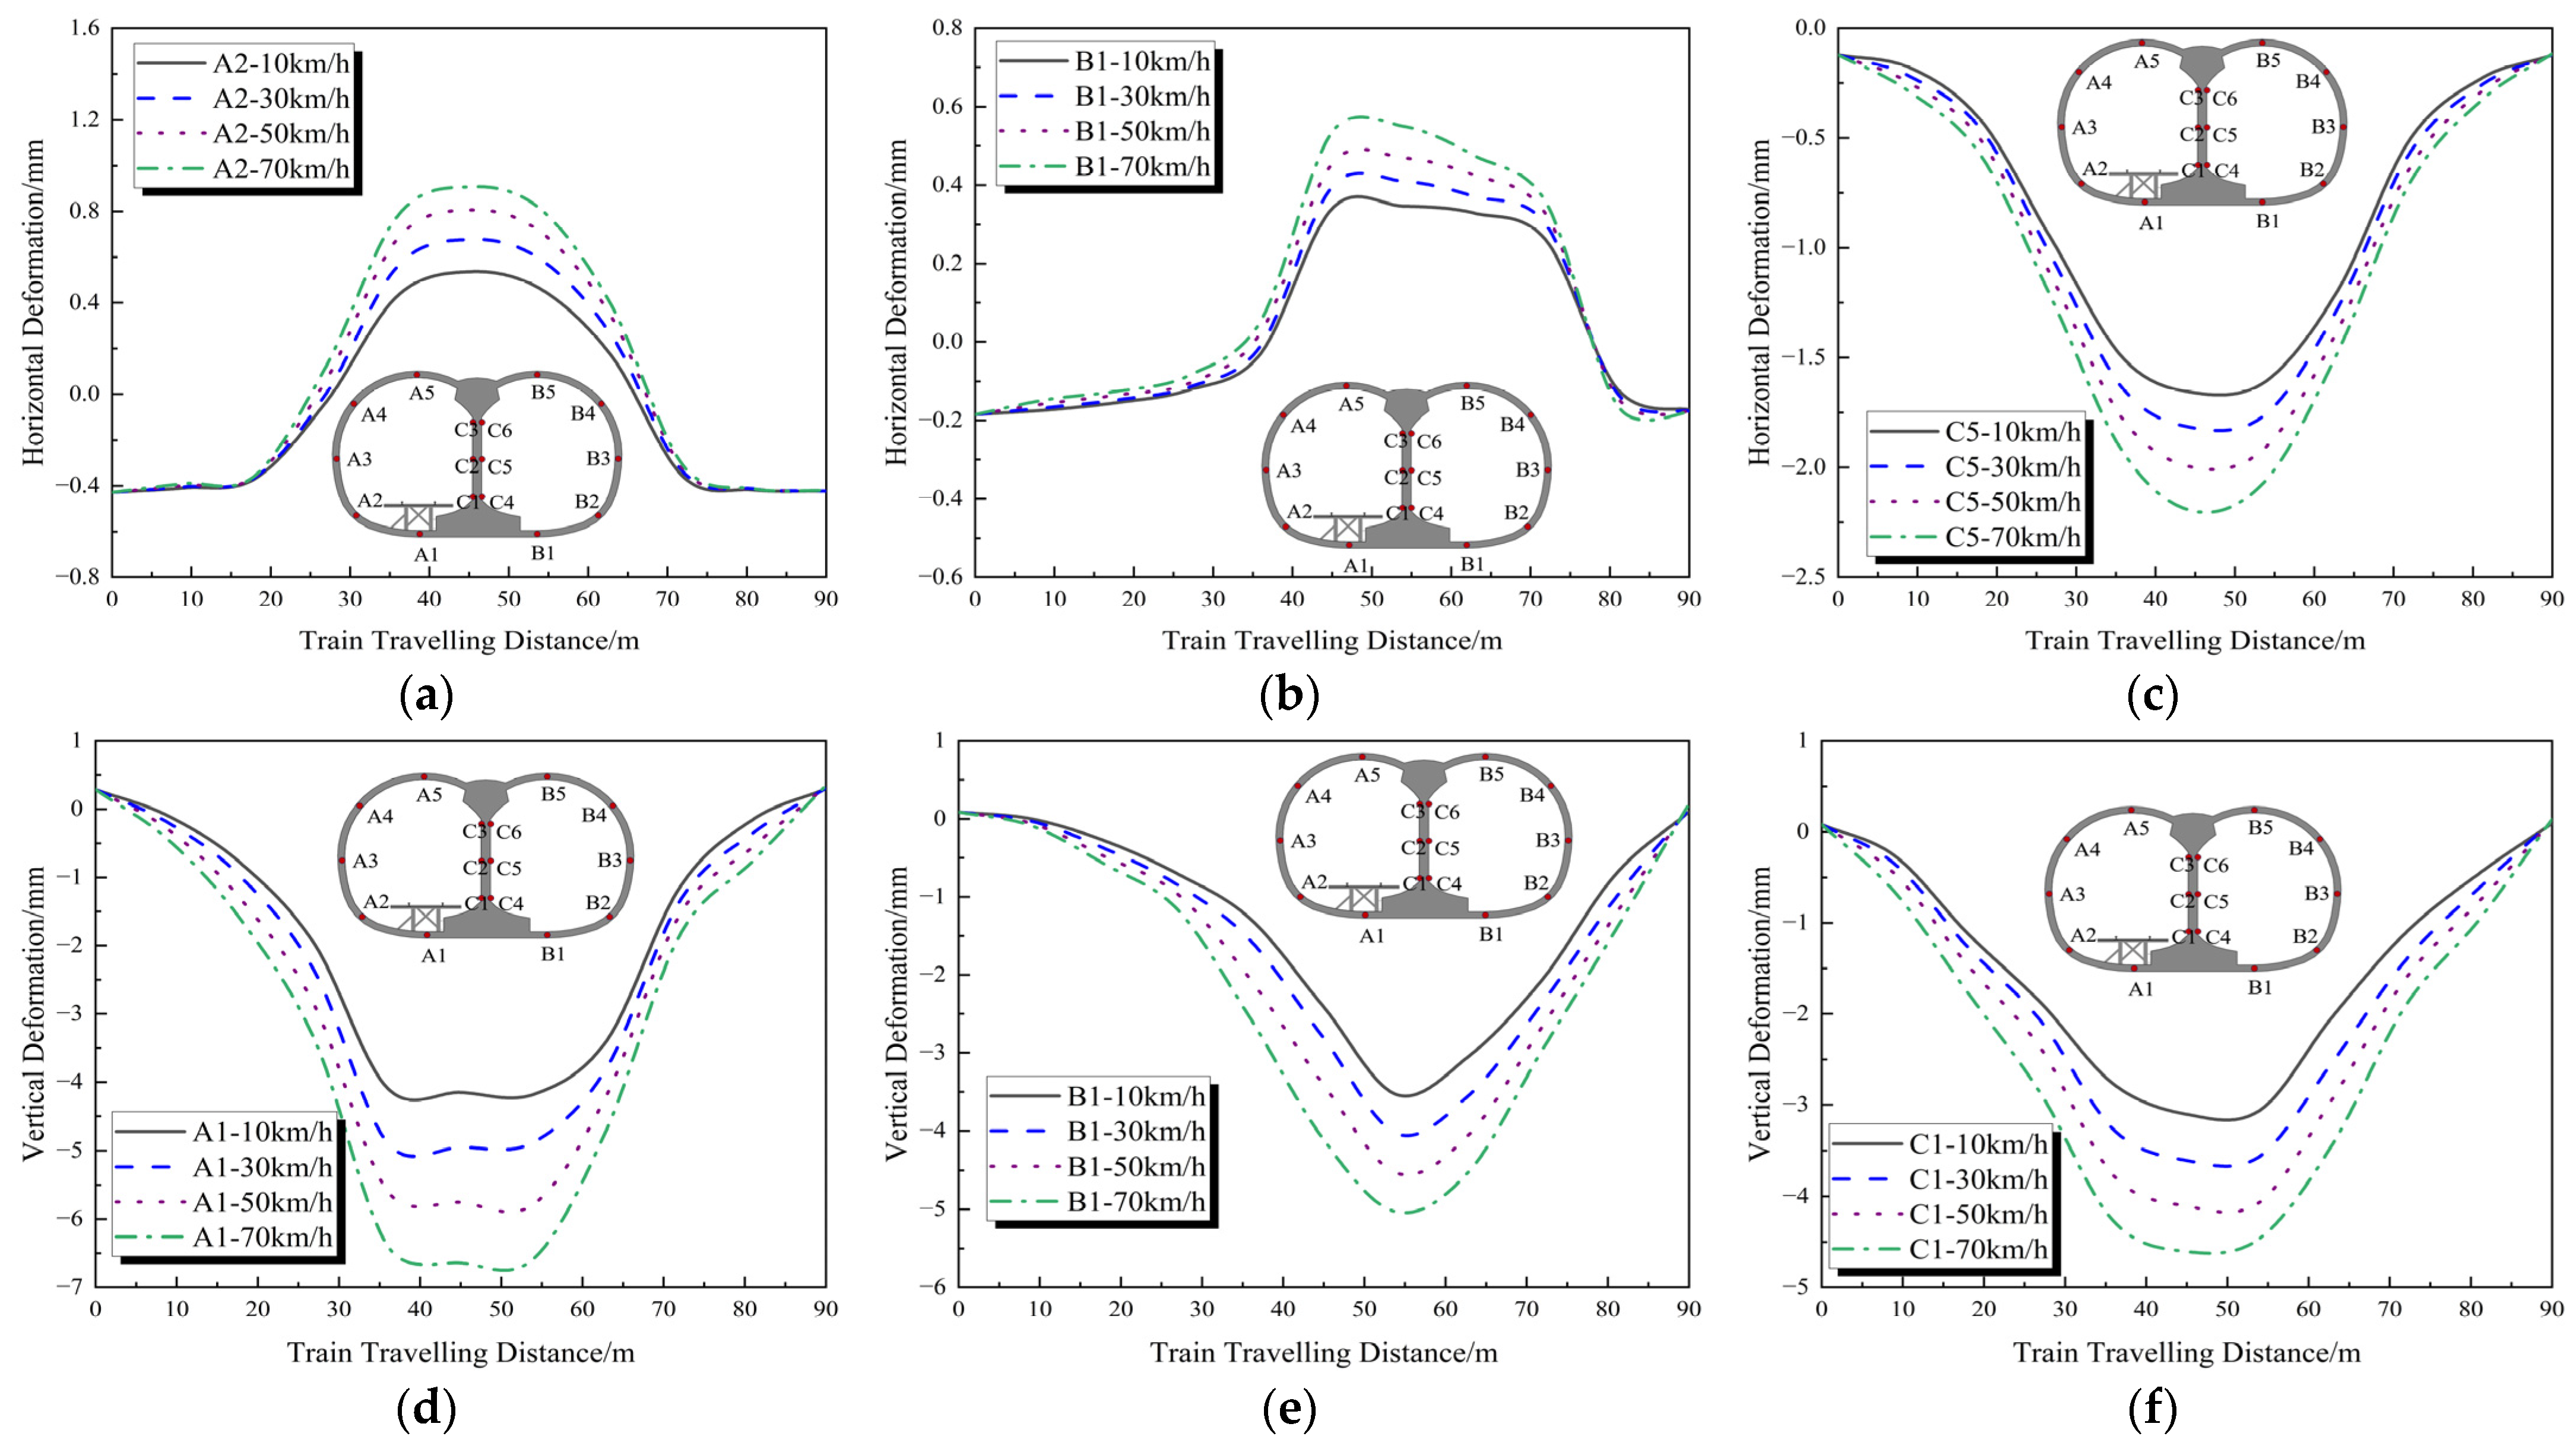
Based on Figure 10, the monitoring points most sensitive to train loading in the left tunnel, middle partition wall, and right tunnel were selected for further analysis. Specifically, points A2, B1, and C5 were selected for horizontal deformation, while points A1, B1, and C1 were selected for vertical deformation. The deformation variations at these points under different train operating speeds are summarized in Figure 11. As shown in the figure, the structural deformation response becomes more pronounced with increasing train speed, which is consistent with the conclusions obtained from the analysis of the structural stress response. Therefore, the stress and deformation amplitudes of the structure under train loading can be effectively mitigated by controlling and reducing the upper limit of the train operating speed. For the case investigated in this study, although the maximum horizontal deformation of the tunnel lining structure is relatively small, the relative vertical deformation is more significant. For the investigated project, the train operating speed is recommended to be controlled within 30 km/h, as the deformation response becomes more pronounced above approximately 30 km/h. This value is a project-specific operational-control speed rather than a universal deformation-based limit. The deformation characteristics are also consistent with previous studies reporting speed-dependent amplification and coupled responses between adjacent tunnels [14,15,20,21]. Nevertheless, the present case shows a more distinct left–right asymmetry because the train load acts only on one side of the unfinished double-arch tunnel. The larger deformation of the loaded-side bore and the lateral movement of the middle partition wall indicate that the two tunnel bores should be regarded as a mechanically coupled system rather than being evaluated independently.

3.1.4. Effect of Train Operation on Trestle Bridge Stress

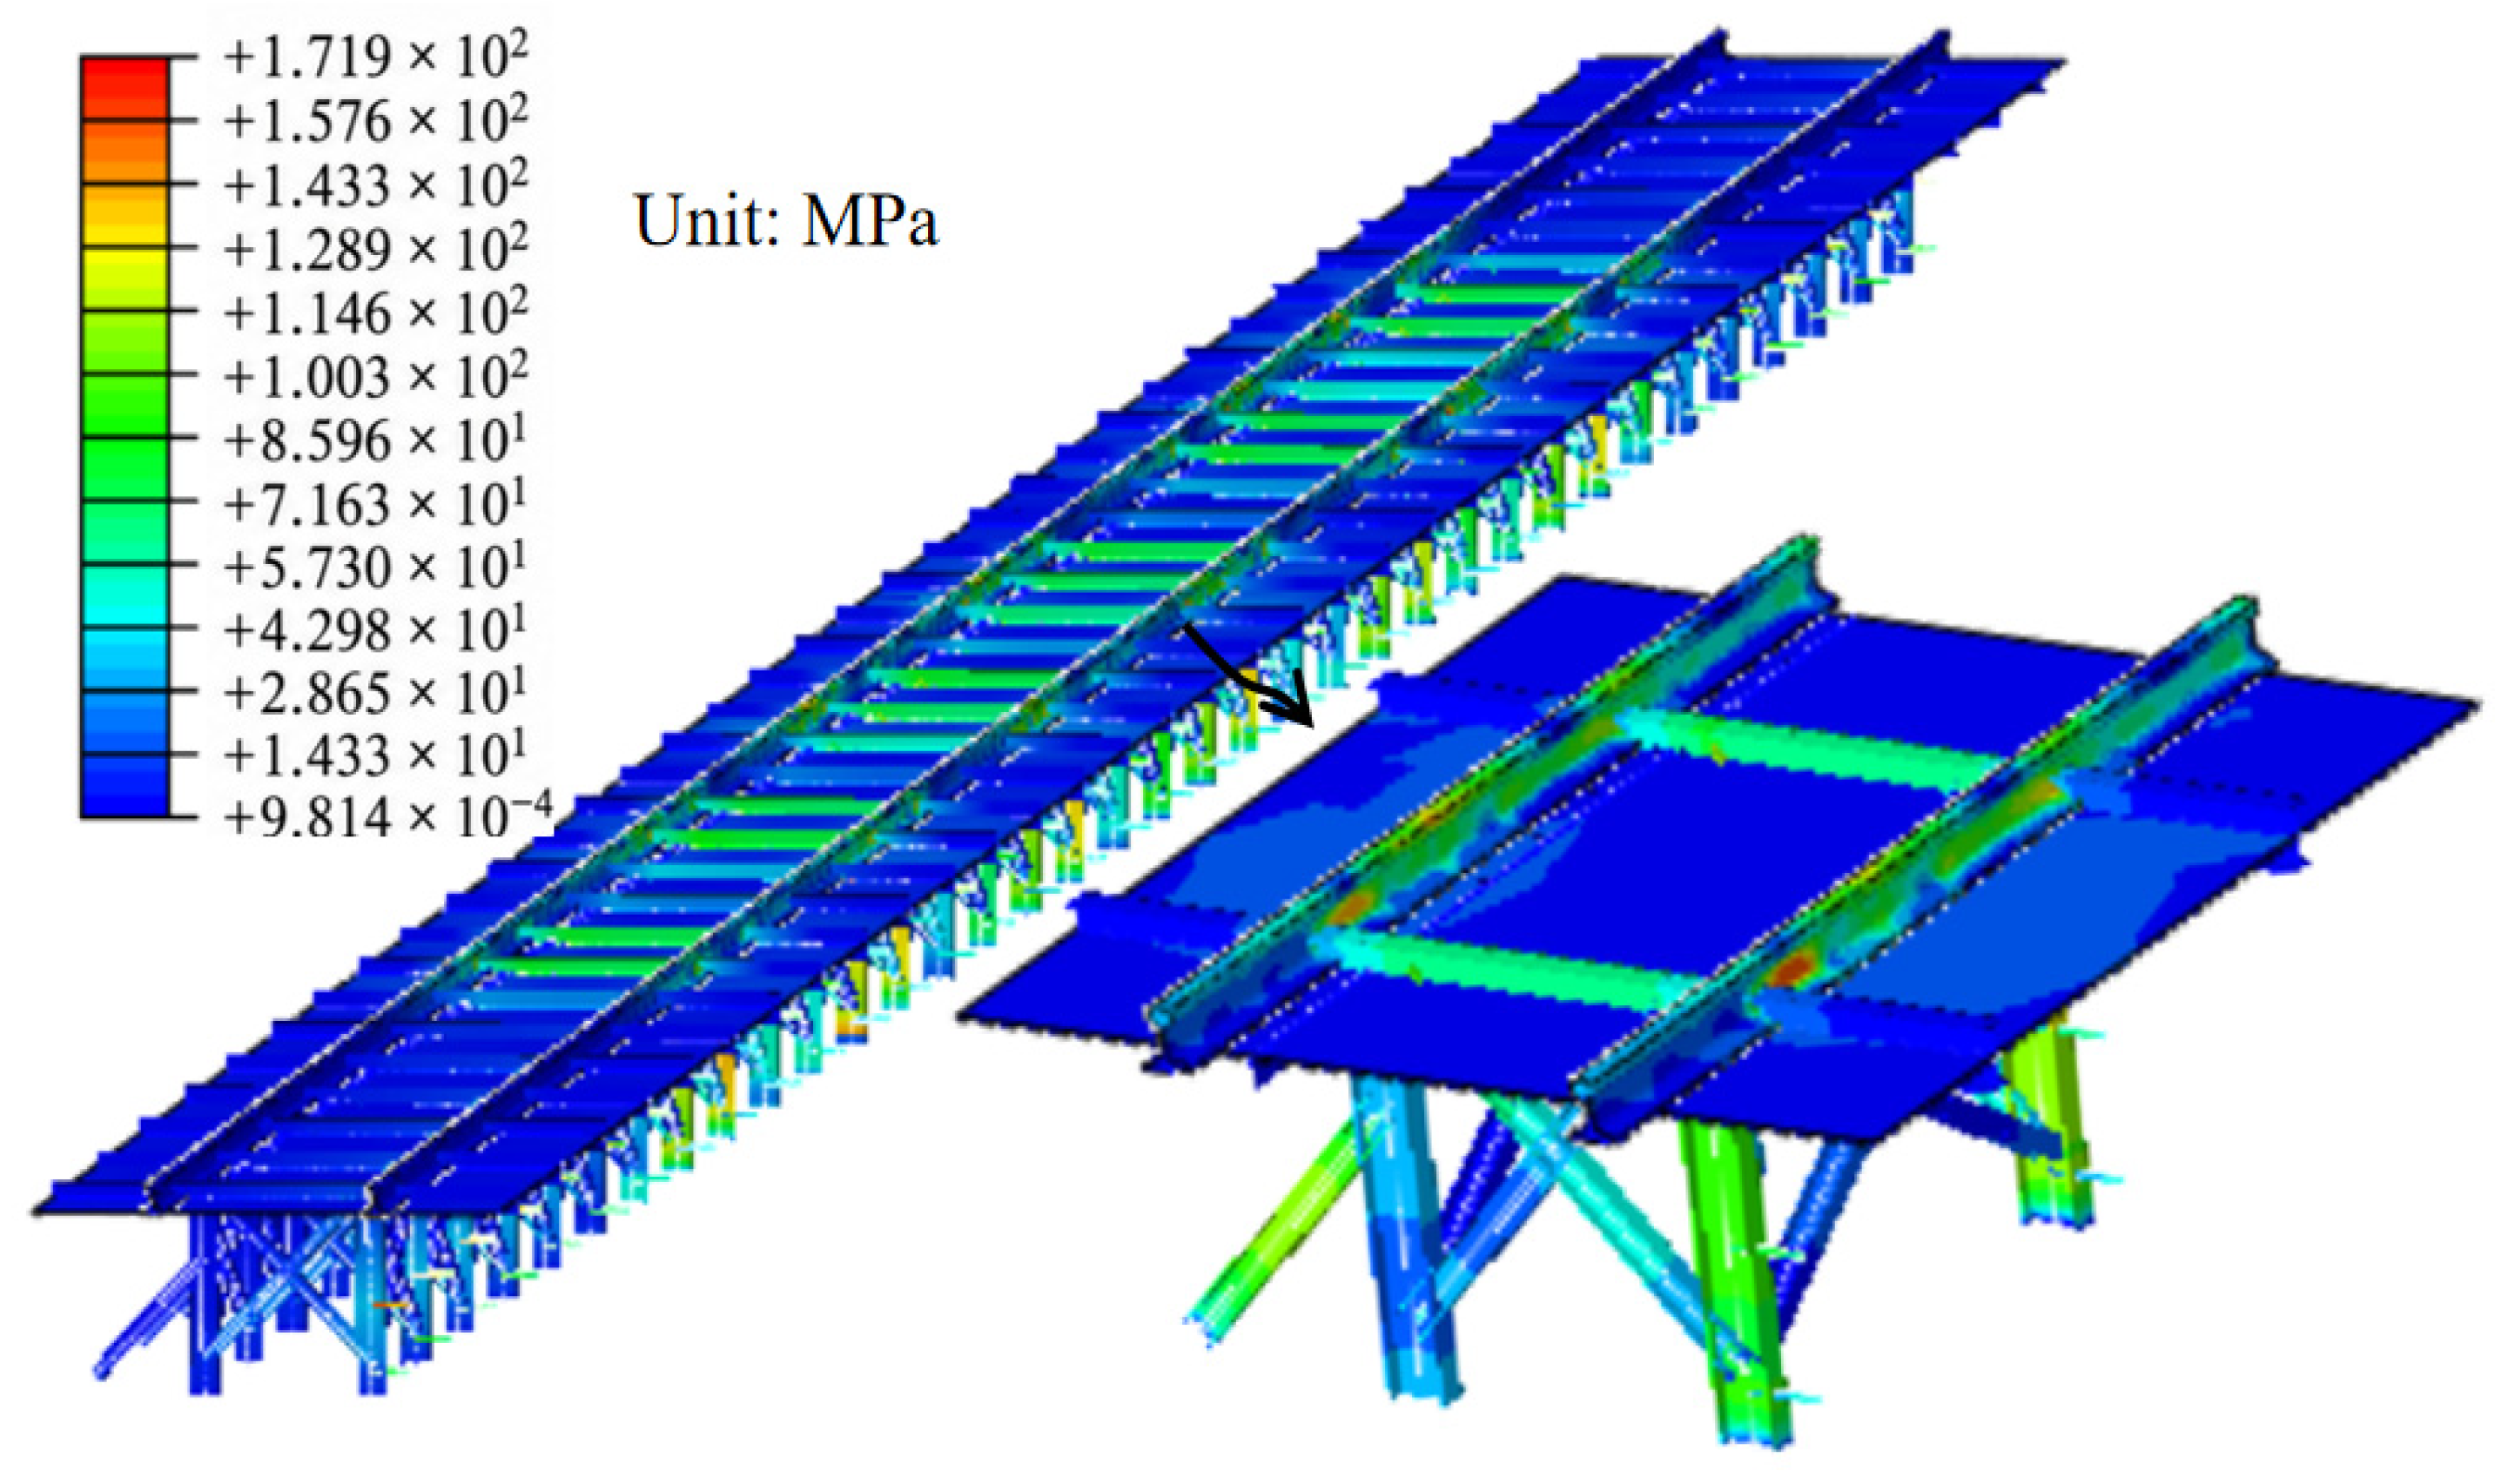
Figure 12 shows the calculated stress results of the trestle structure when the train reaches the monitoring section at an operating speed of 70 km/h. At this moment, the front and rear ends of the trestle are only slightly affected by the train load and are essentially subjected to gravity loading alone. Accordingly, the stress levels at both ends of the trestle are relatively low, with a maximum stress of only approximately 14 MPa. For the trestle segment directly subjected to train loading, an obvious stress concentration can be observed in the rails at the wheel–rail contact positions, where the stress exceeds 120 MPa, while the stress levels in the remaining regions are comparatively lower. The maximum equivalent stress of the trestle is approximately 172 MPa. Based on the applicable design strength f d of Q235 steel for the corresponding member thickness, the stress-utilization ratio is η s = 172 / f d , which remains below unity under the investigated short-term loading condition. This comparison evaluates the material stress level only; global stability, member buckling, and connection capacity require separate design verification.

3.1.5. Effect of Train Operation on Trestle Bridge Deformation

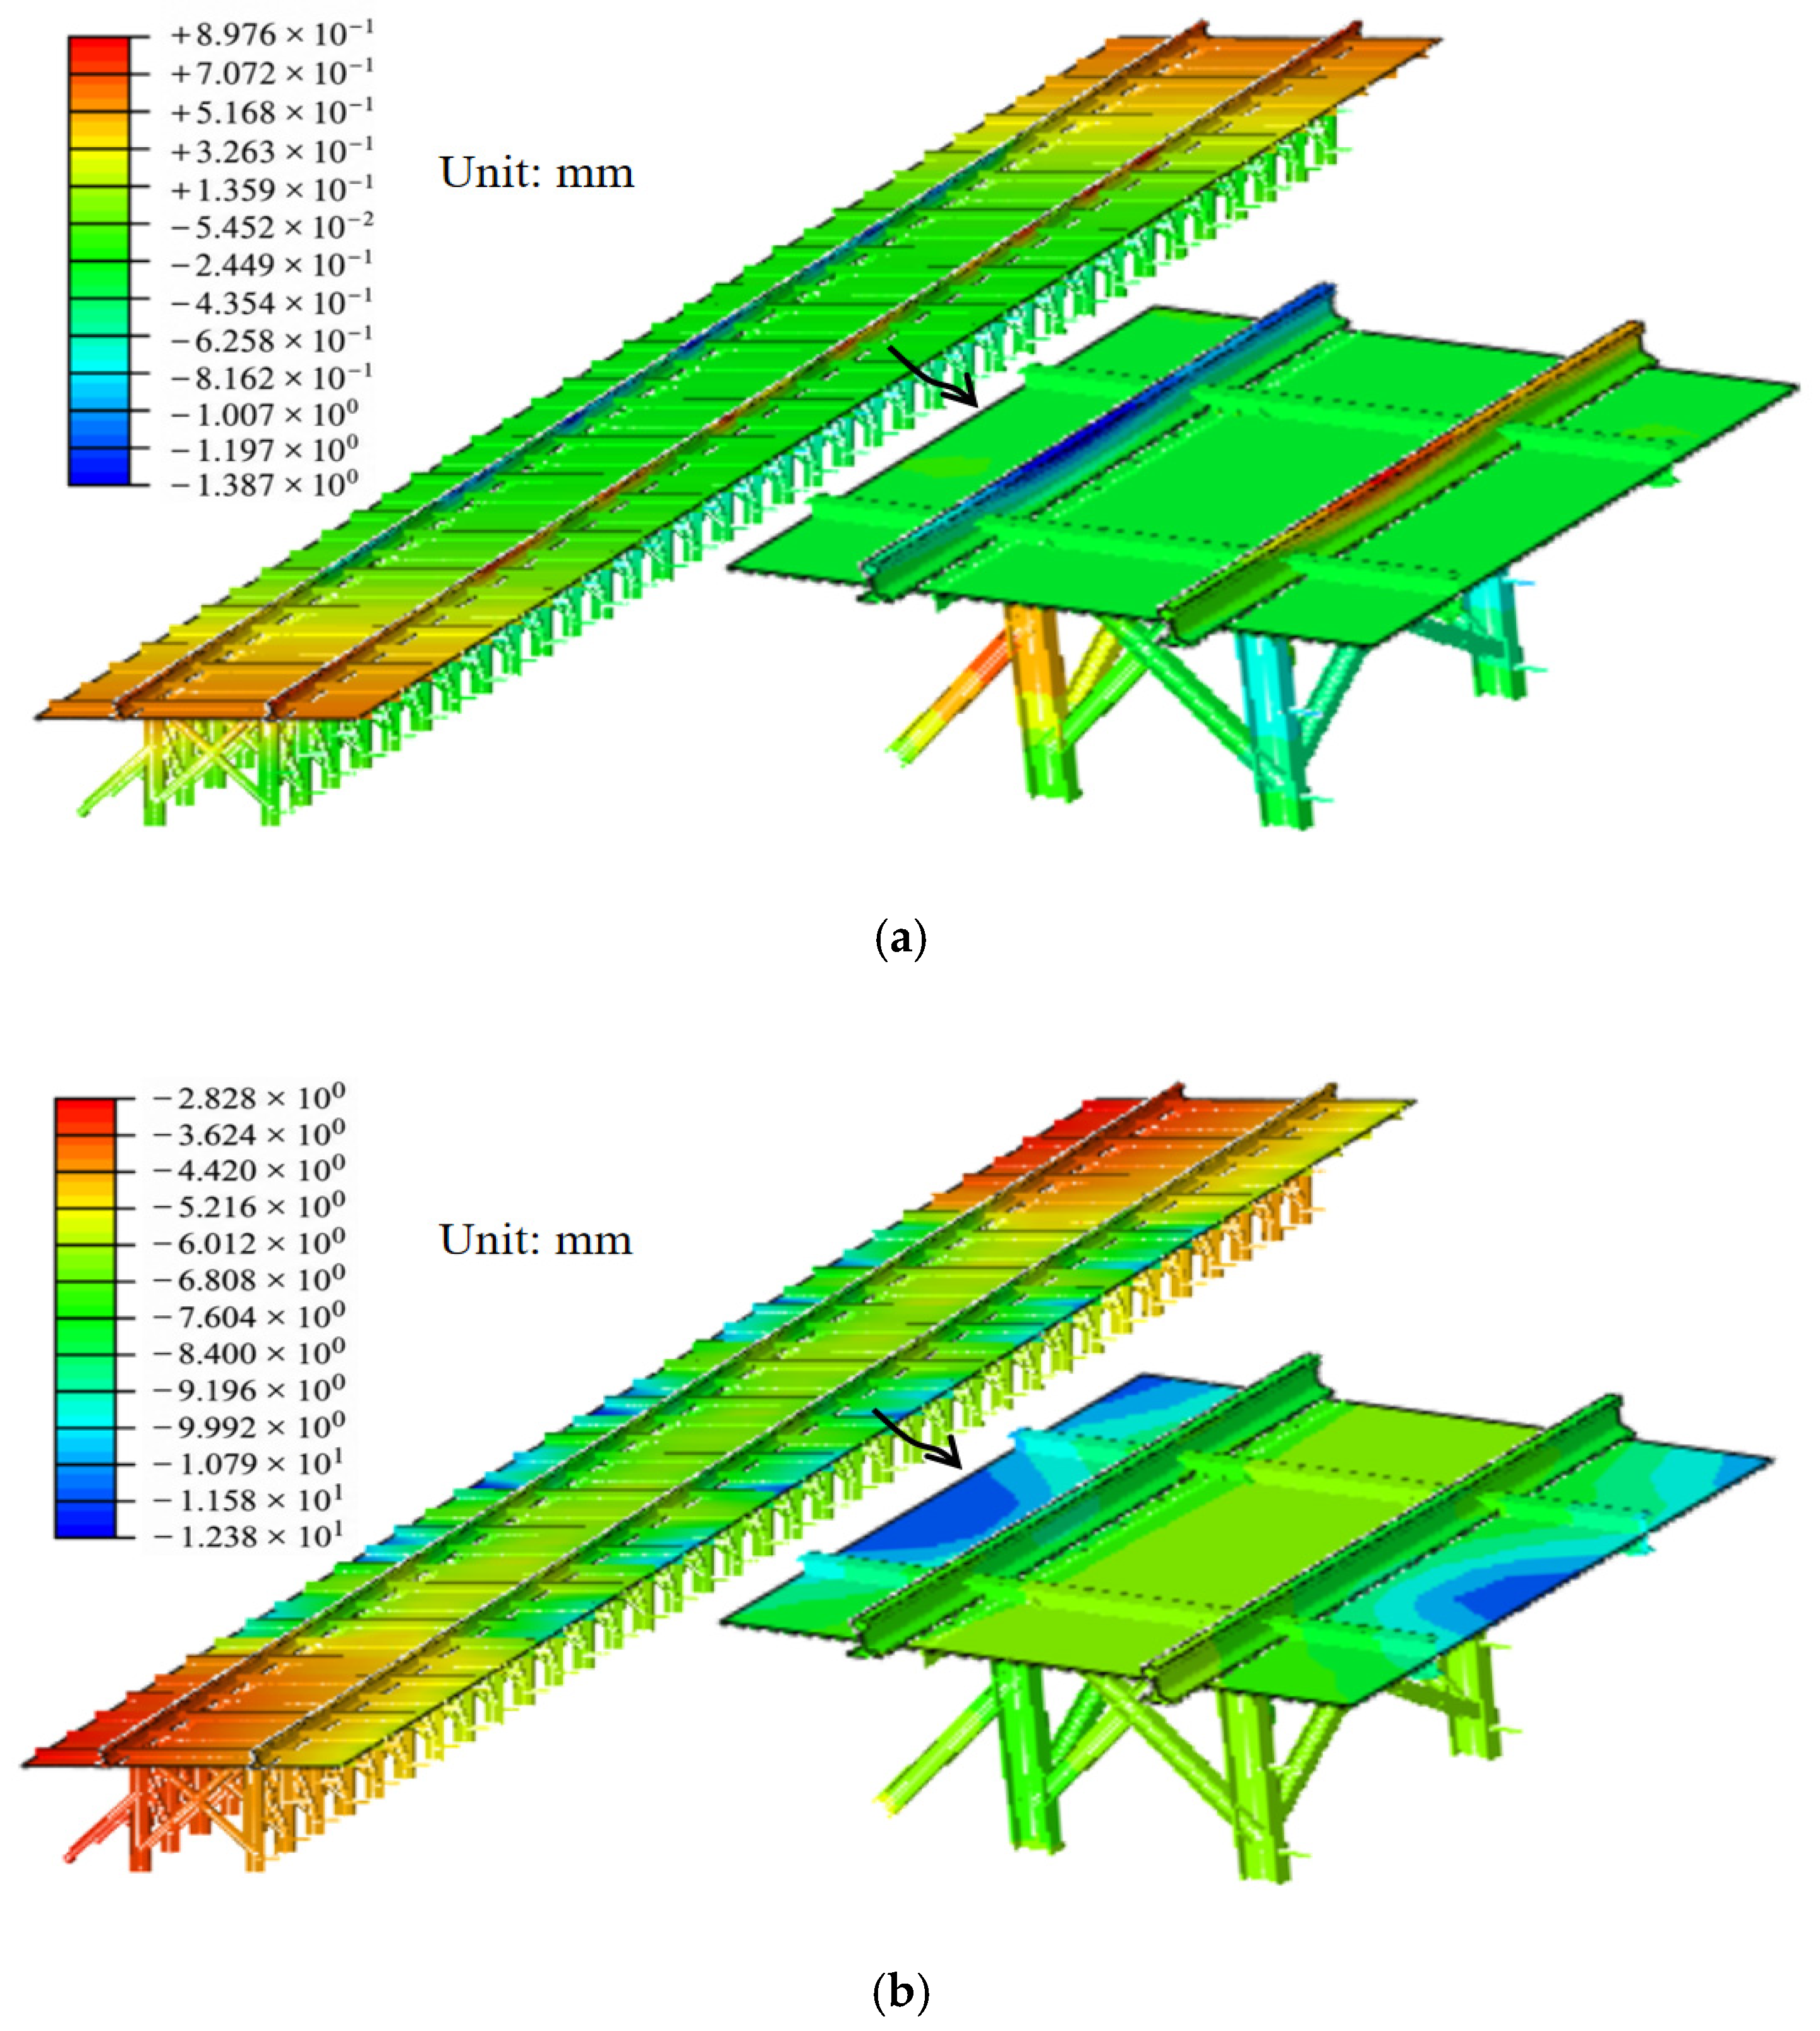
Figure 13 presents the calculated horizontal and vertical deformation results of the trestle structure when the train reaches the monitoring section at an operating speed of 70 km/h. As shown in the figure, train loading has a relatively limited influence on the horizontal deformation of the trestle structure, and the deformation is mainly concentrated along the two rails. The maximum horizontal deformation of the trestle in the train-running direction is less than 1.5 mm. However, train loading induces relatively large vertical deformation in the trestle. When the train moves onto a certain rail segment, the maximum vertical displacement of the nearby rail is approximately 8.4 mm, whereas the maximum vertical deformation of the rail in the region not yet passed by the train is only about 2.8 mm. This indicates that train loading causes a vertical deformation difference of approximately 6.6 mm in the rails. In addition, relatively large local deformation occurs in the trestle deck within the train operating range, reaching approximately 12 mm, which is nearly 50% greater than the rail deformation. This may be attributed to the transmission of dynamic loads induced by train operation through the deck, and such deformation is expected to disappear after the train has passed. At 70 km/h, the maximum vertical displacements of the rail and local trestle deck reach approximately 8.4 mm and 12 mm, respectively, indicating appreciable local deformation. These values are reported as short-term response indicators rather than serviceability limits, as no project-specific allowable deformation criterion is adopted in the present analysis.

3.2. Monitoring

3.2.1. Monitoring Objectives, Indicator System, and Overall Approach

To reveal the cooperative stress and deformation response characteristics of the double-arch tunnel lining structures and the trestle bridge under unilateral train loading, so that a basis can be provided for train operating speed control during the construction stage, a structural response monitoring scheme is designed, and an indicator system based on the preceding three-dimensional numerical analysis results is established. The monitoring objects include three key components: the initial tunnel support structure, the middle partition wall, and the construction trestle. The focus is placed on the dynamic variation characteristics of structural stress, vertical displacement, horizontal displacement, and equivalent stress of the trestle steel components during train passage.
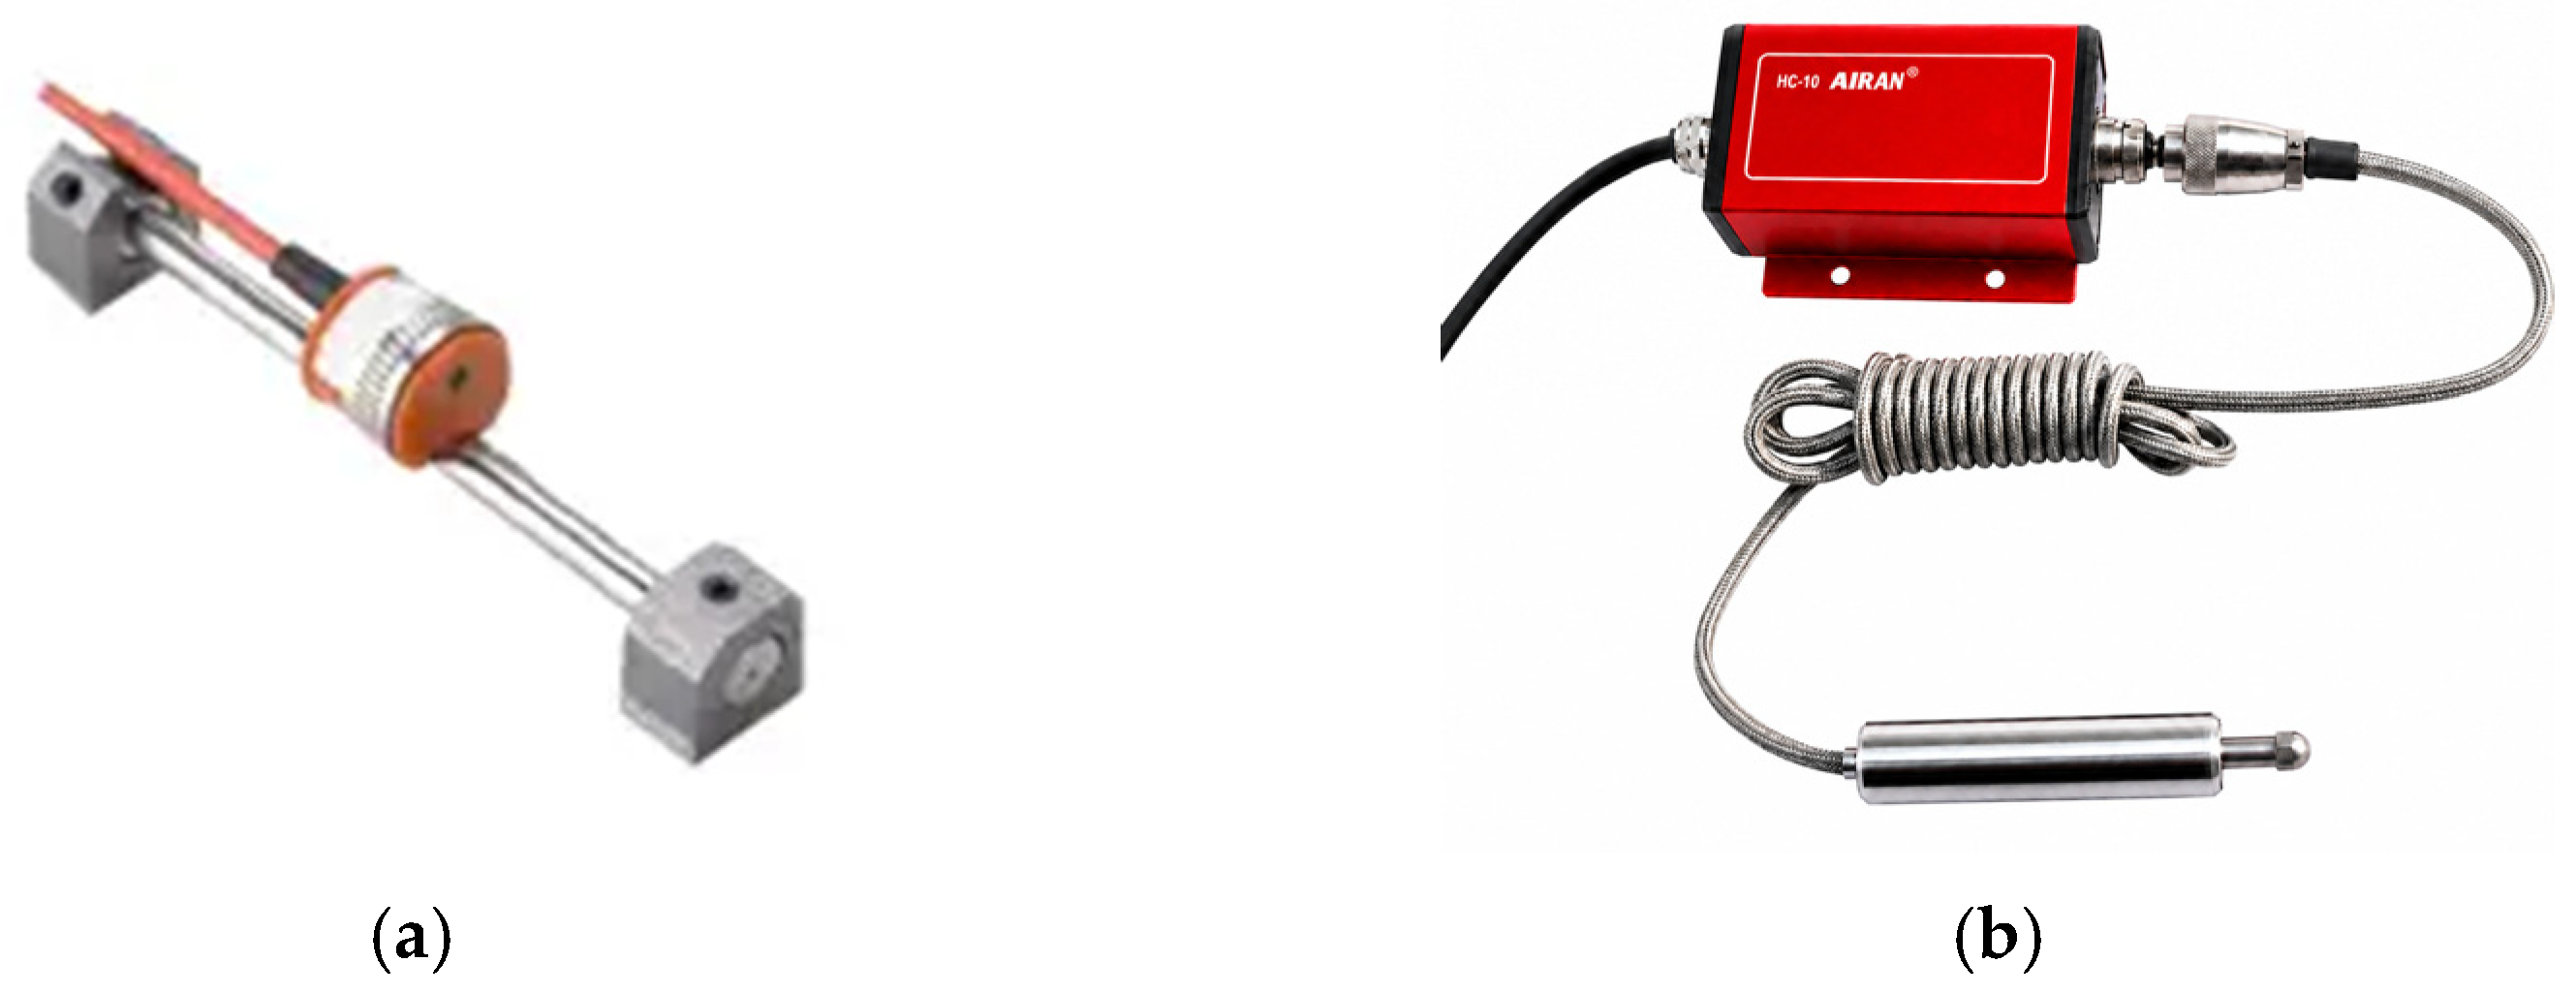
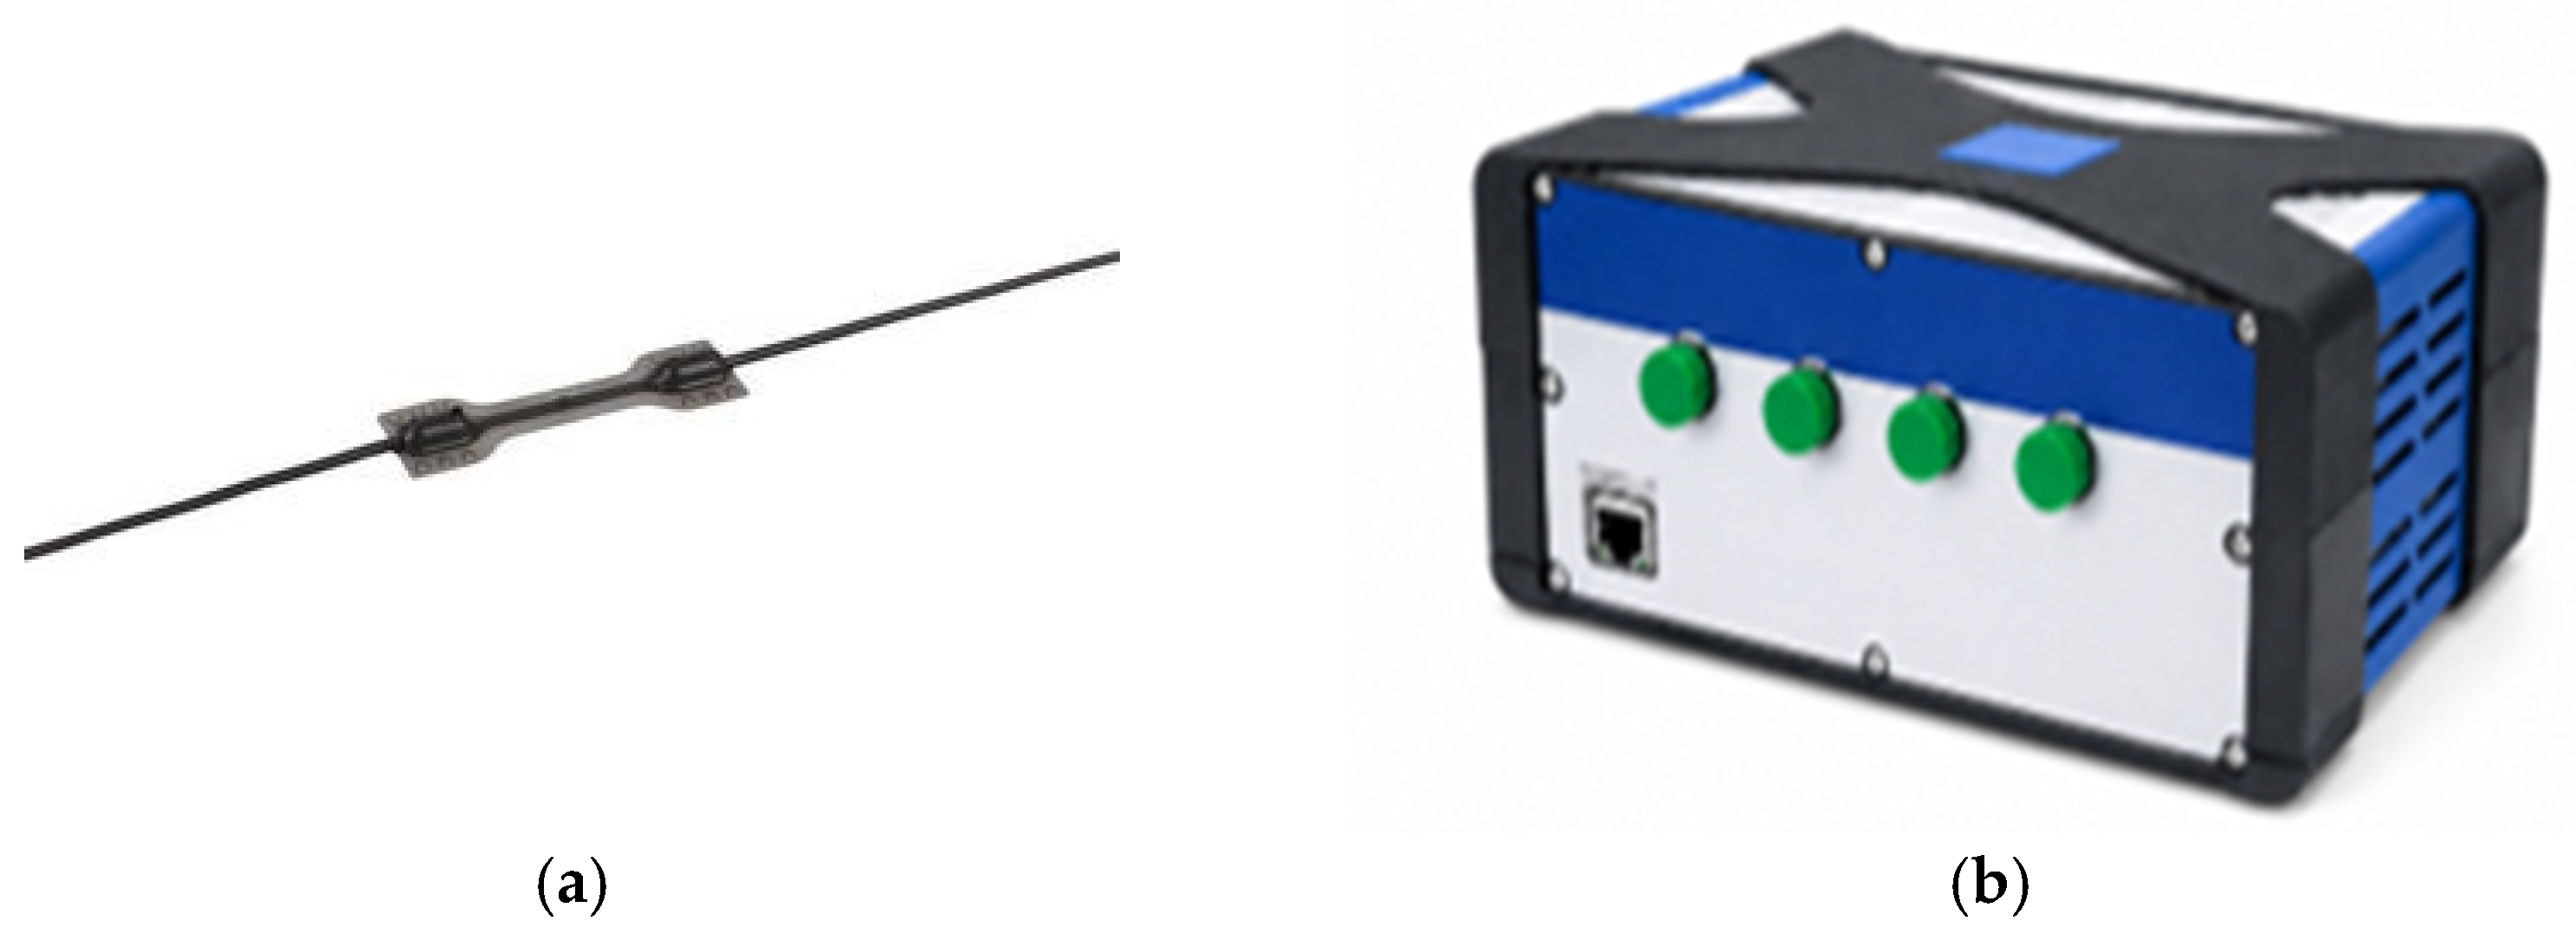
According to the numerical simulation results, the structural response under unilateral train loading exhibits obvious spatial asymmetry. Among them, the bottom of the middle partition wall, the arch invert of the left tunnel on the train-running side, and the rail–top slab connection region of the trestle show relatively high response sensitivity, and are key locations for structural safety control during the construction stage. Therefore, this study selects the maximum compressive stress at the bottom of the middle partition wall, the maximum vertical displacement at the arch invert of the left tunnel, the maximum horizontal displacement in the middle-lower part of the middle partition wall, and the maximum equivalent stress of the trestle as the main evaluation indicators, which are used to characterize the evolution law of stress and deformation of the tunnel–trestle bridge system under different train operating speeds. The monitoring devices for tunnel lining structures and trestle bridge are shown in Figure 14 and Figure 15.
The MIRAN LVDT displacement sensor had a 25 mm measuring range, a resolution of ≤1 μm, a linearity error of ≤±0.25% FS, and a repeatability of 1–10 μm. Before the 63-day monitoring program, sensor installation, zero calibration, and initial-state recording were completed on Day 0, with the initial readings used as reference values for the subsequent 15 sets of train-passage measurements. Sensor installation and reference conditions were maintained throughout the monitoring period, with periodic zero/reference checks.
Measurement uncertainties may arise from sensor linearity and temperature drift, mounting and reference-point stability, electrical interference, strain-gauge installation and gauge-factor uncertainty, lead-wire resistance, bridge imbalance, and data-acquisition accuracy. Variations in wheel–rail contact and local track irregularities may also cause scatter between train passages but are considered operational variability rather than instrumentation error.
The monitoring period lasted for a total of 63 days. On Day 0, sensor installation, zero-value calibration, and initial-state recording were completed. Formal monitoring was conducted on Days 4, 8, 12, 16, 20, 24, 28, 32, 36, 40, 44, 48, 52, 56, and 60, and a total of 15 sets of peak structural response data under train passage conditions were obtained. From Days 61 to 63, structural stability rechecking after train passage was carried out. Through comparative analysis of the monitoring indicators under different speed conditions, the influence law of train operating speed on structural response is further identified, and a reasonable speed control range during the construction stage is determined.

3.2.2. Monitoring Sections and Measuring Point Arrangement

Considering the engineering condition that the length of the section without completed secondary lining is approximately 50 m, the main monitoring section M0 is arranged in the middle of this section, and one verification monitoring section, M − 10 and M + 10, is arranged respectively in front of and behind it. The M0 section is used to capture the maximum dynamic response when the train runs near the monitoring section, while the M − 10 and M + 10 sections are mainly used to identify the propagation and attenuation laws of structural response during train approach, passage, and departure.
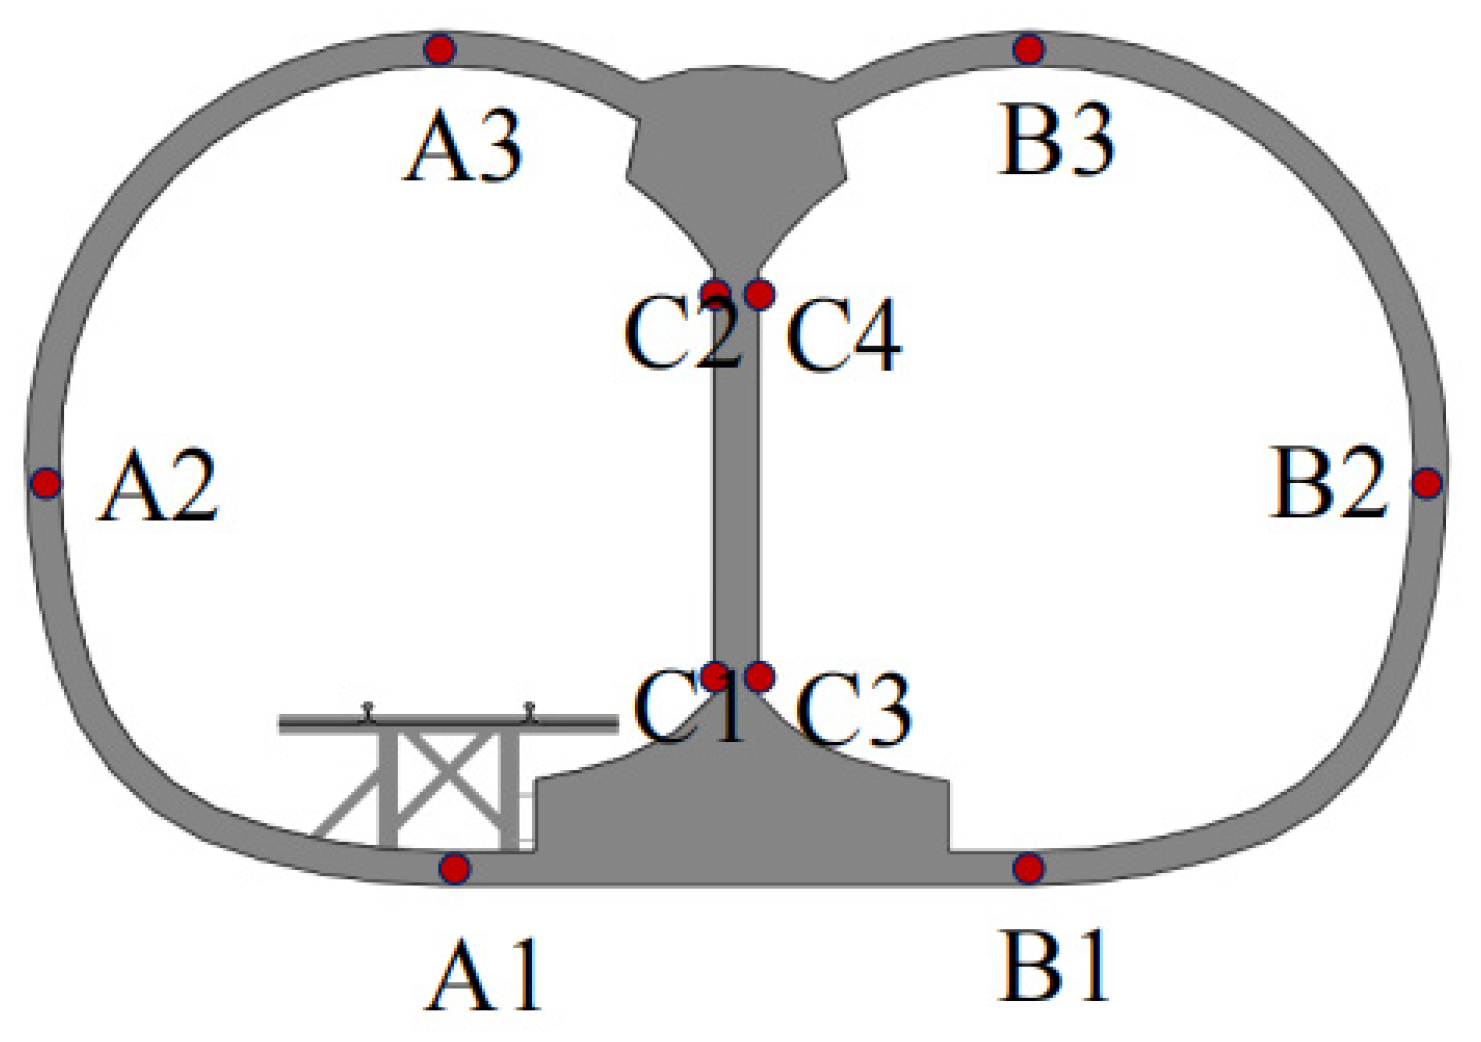
In a typical cross-section, the monitoring points of the initial tunnel support are numbered as Class A for the left tunnel, Class B for the right tunnel, and Class C for the middle partition wall. Monitoring points are arranged at the vault, arch shoulder, arch waist, sidewall, and arch invert of the left and right tunnels, respectively. For the middle partition wall, monitoring points are arranged at the top, middle, and bottom along the height direction. Considering that the bottom of the middle partition wall is subjected to the most unfavorable stress under unilateral train loading, point C1 at the bottom of the middle partition wall should be taken as the key point for stress monitoring. For tunnel deformation, vertical displacement observation points should be mainly arranged at point A1 at the arch invert of the left tunnel, and point B1 at the arch invert of the right tunnel.
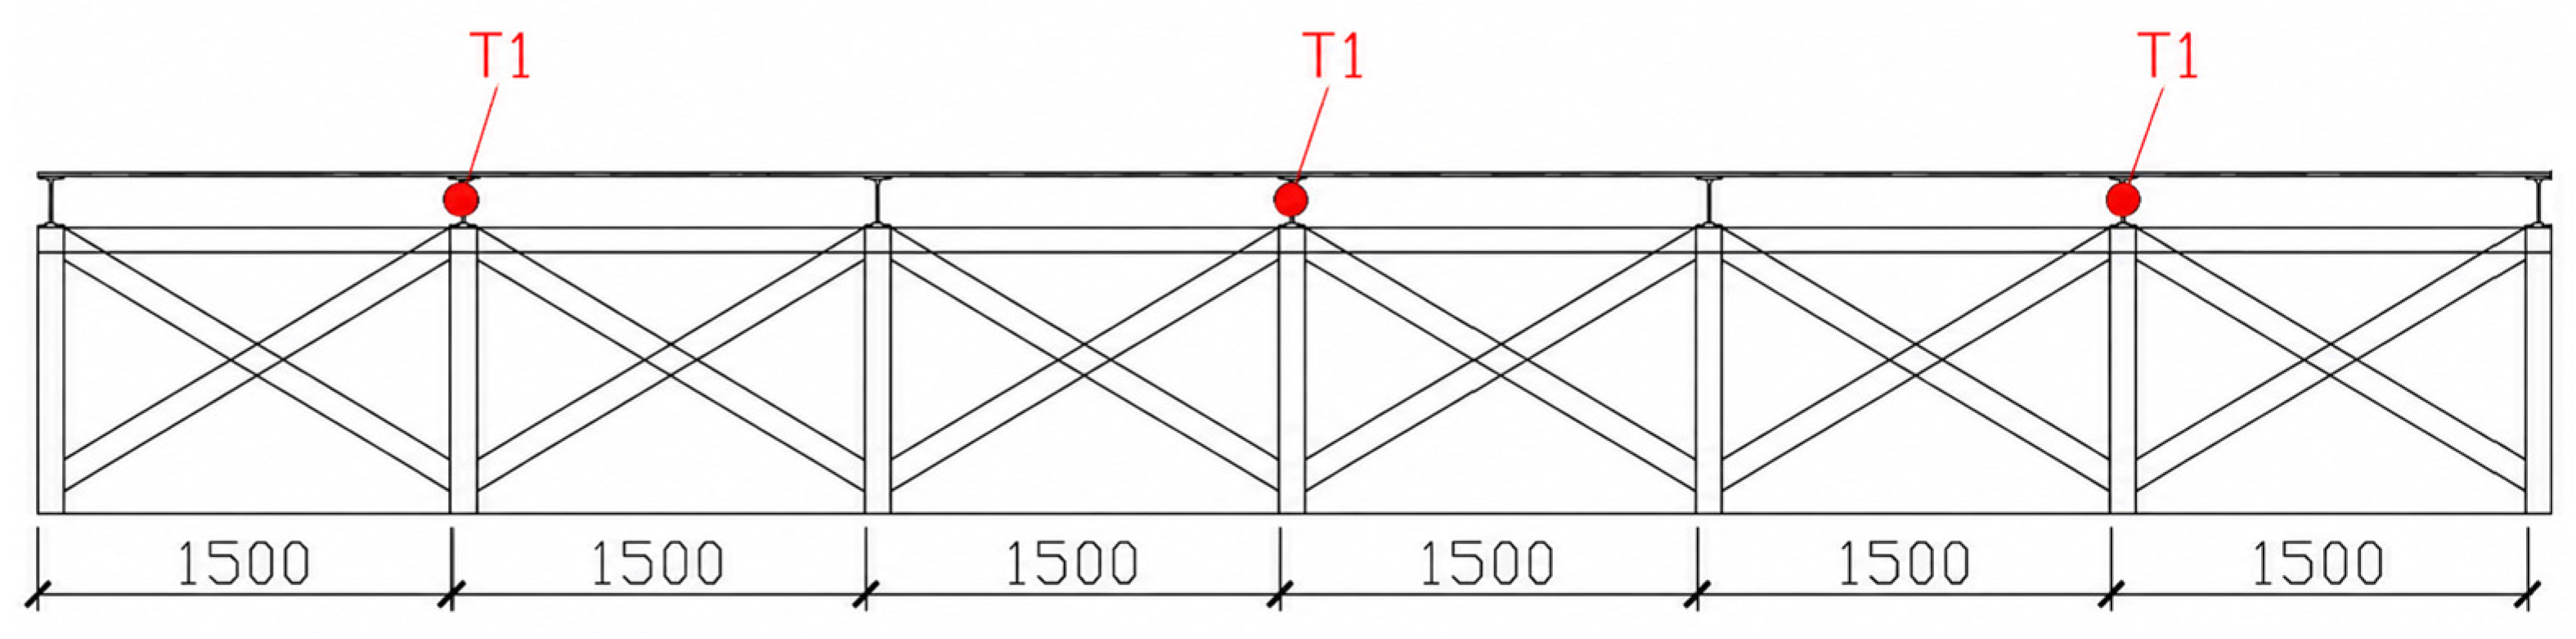
The trestle monitoring point is mainly arranged in the rail region directly subjected to train wheel loads and is numbered T1. T1 is used to reflect the local stress variation in the rail wheel-load region. The monitoring points on tunnel lining structure and trestle bridge can be found in Figure 16 and Figure 17.

3.2.3. Variation in the Stress of the Tunnel Lining Structure Under Different Train Speeds

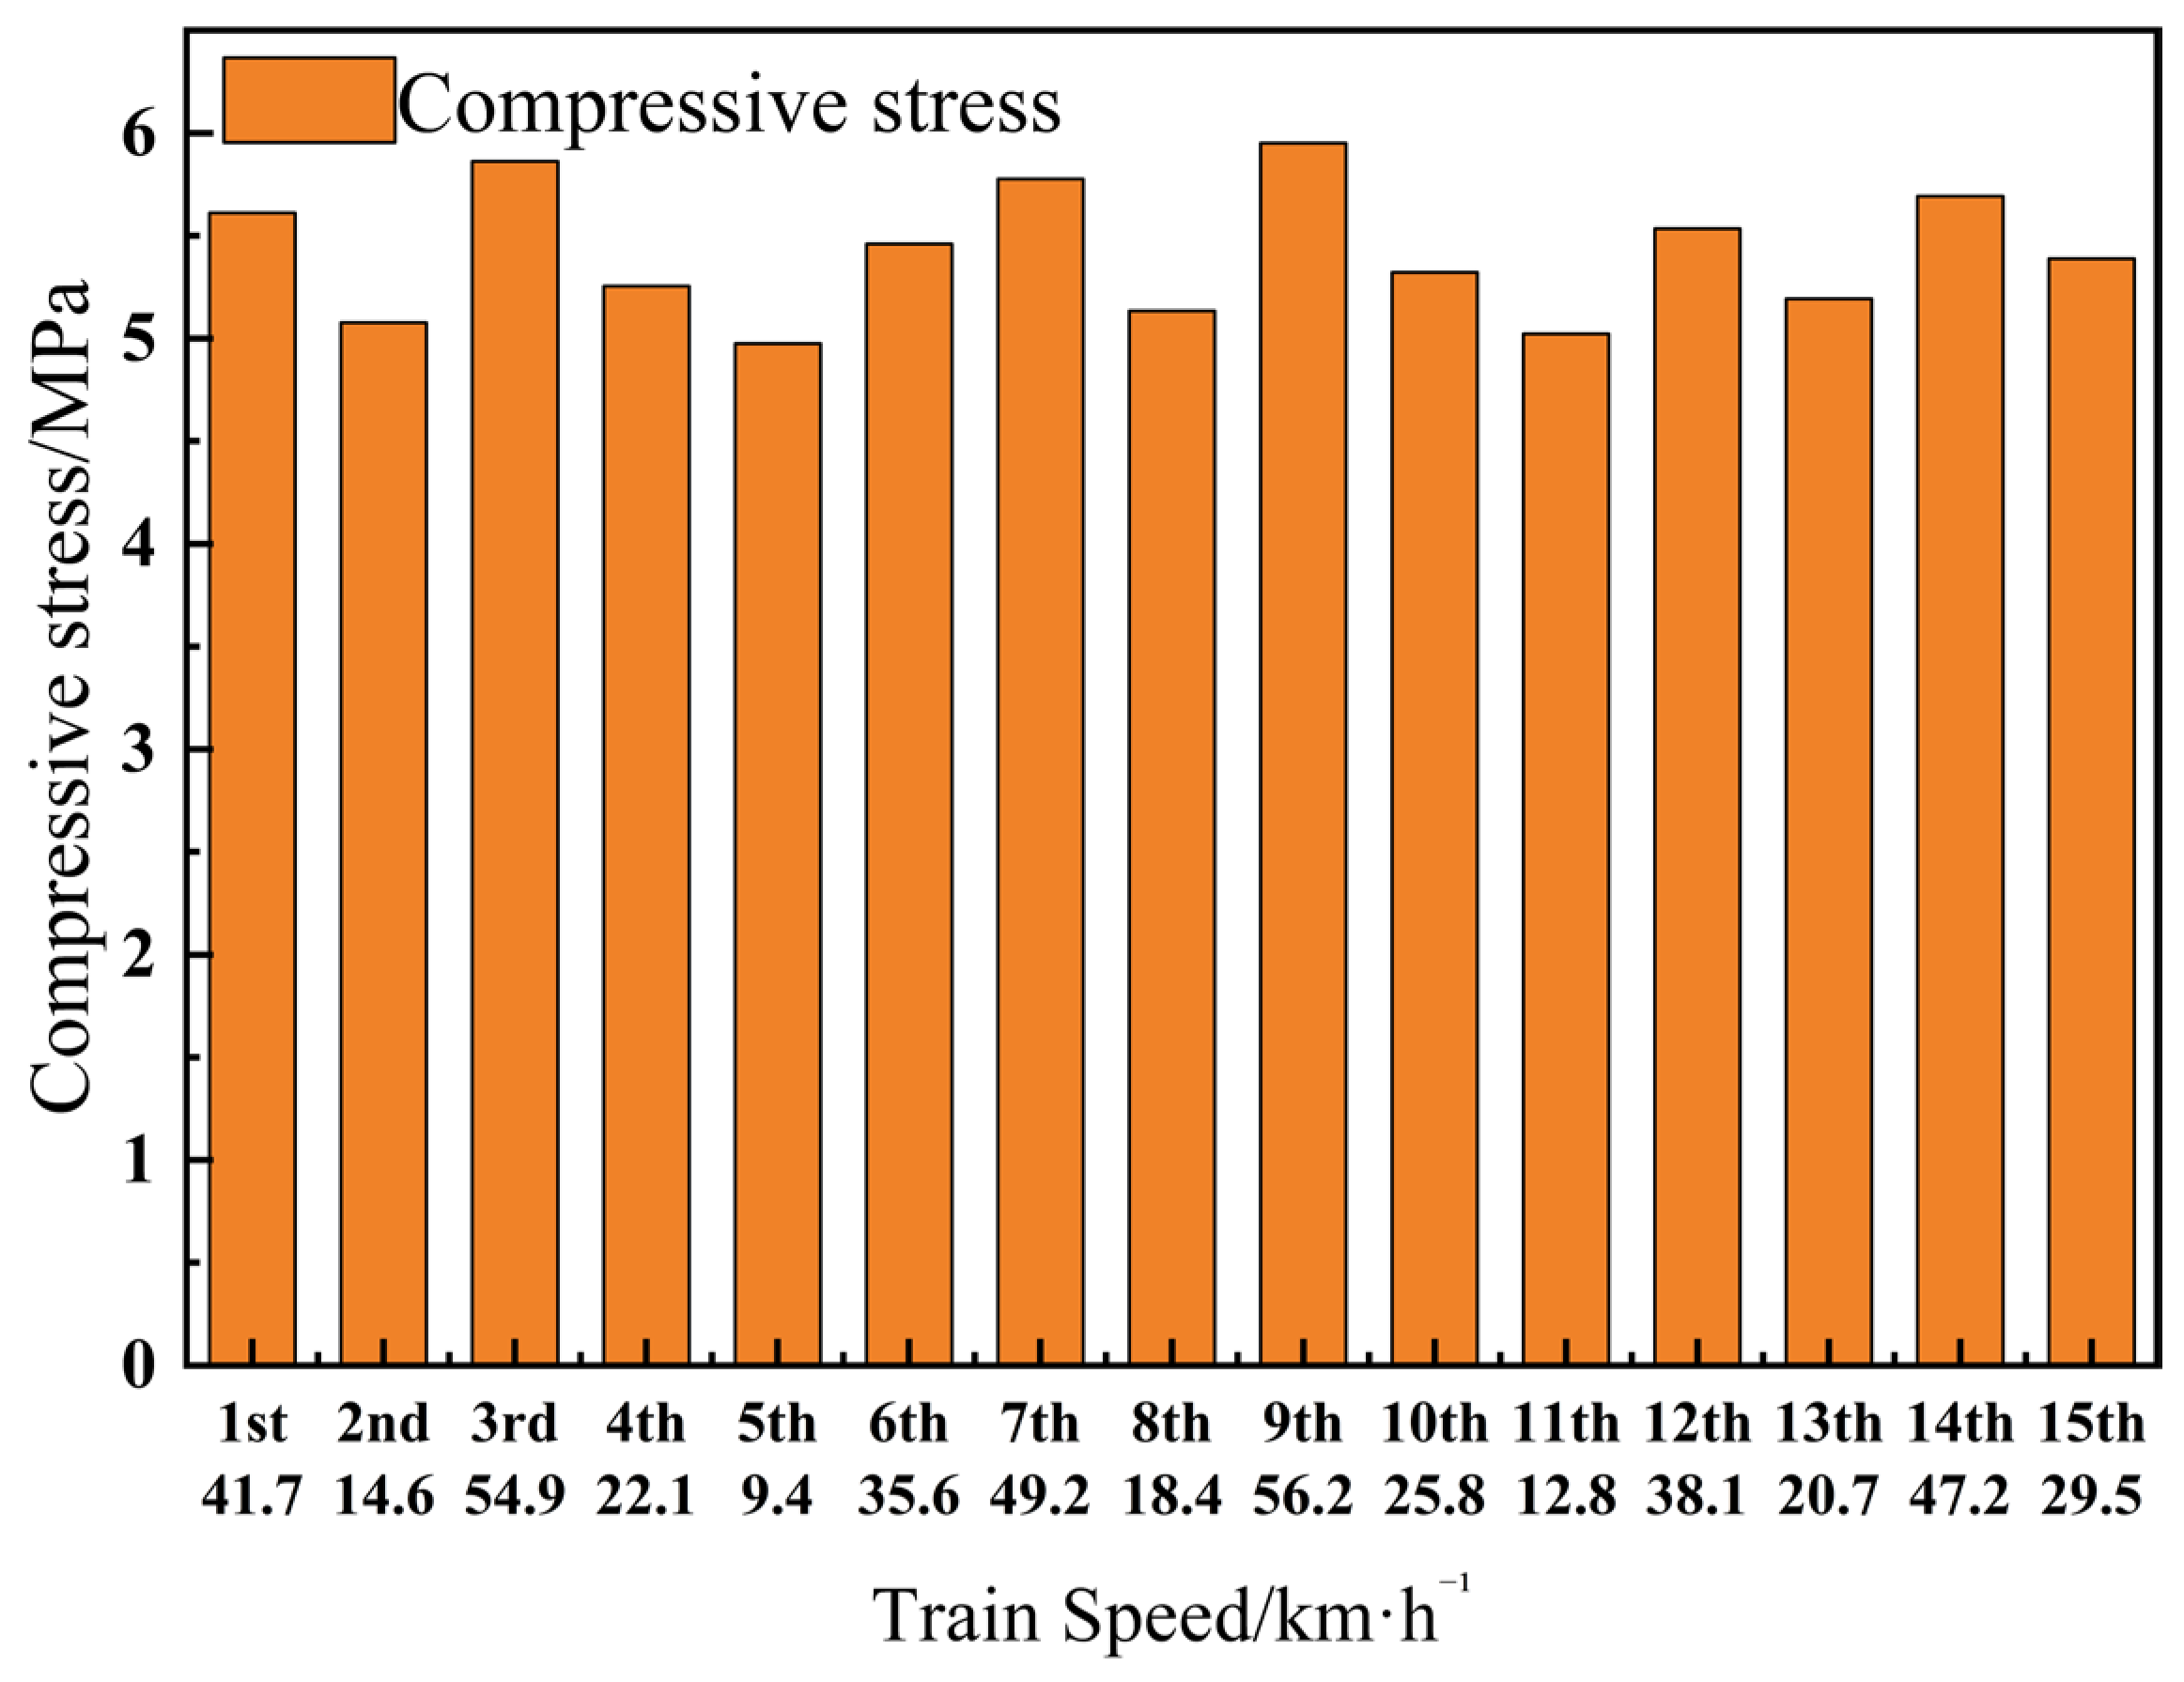
To analyze the influence of train operating speed on the stress state of the twin-tunnel structure under construction, the control point at the bottom of the right side of the middle partition wall is selected as the stress monitoring object. This location is close to the side subjected to unilateral train loading, is significantly affected by eccentric wheel loads, and exhibits the maximum compressive stress response in the numerical analysis. During monitoring, the absolute value of the peak compressive stress when the train passes through the monitoring section is taken as the evaluation indicator. Meanwhile, the train formation, axle load, and transportation load are kept basically consistent to reduce the interference of non-speed factors on the monitoring results. The numerical prediction results of the maximum compressive stress at the control point of the middle partition wall under different train operating speeds are shown in Figure 18.
As shown in Figure 18, as the train operating speed increased from 9.4 km/h to 56.2 km/h, the maximum compressive stress at the control point of the middle partition wall increased from 4.98 MPa to 5.95 MPa, with a cumulative increase of approximately 19.6%. In the low-speed range, the stress increased relatively gently; when the train speed exceeded 40 km/h, the stress growth rate increased to some extent, indicating that the dynamic effect of the train was gradually strengthened.
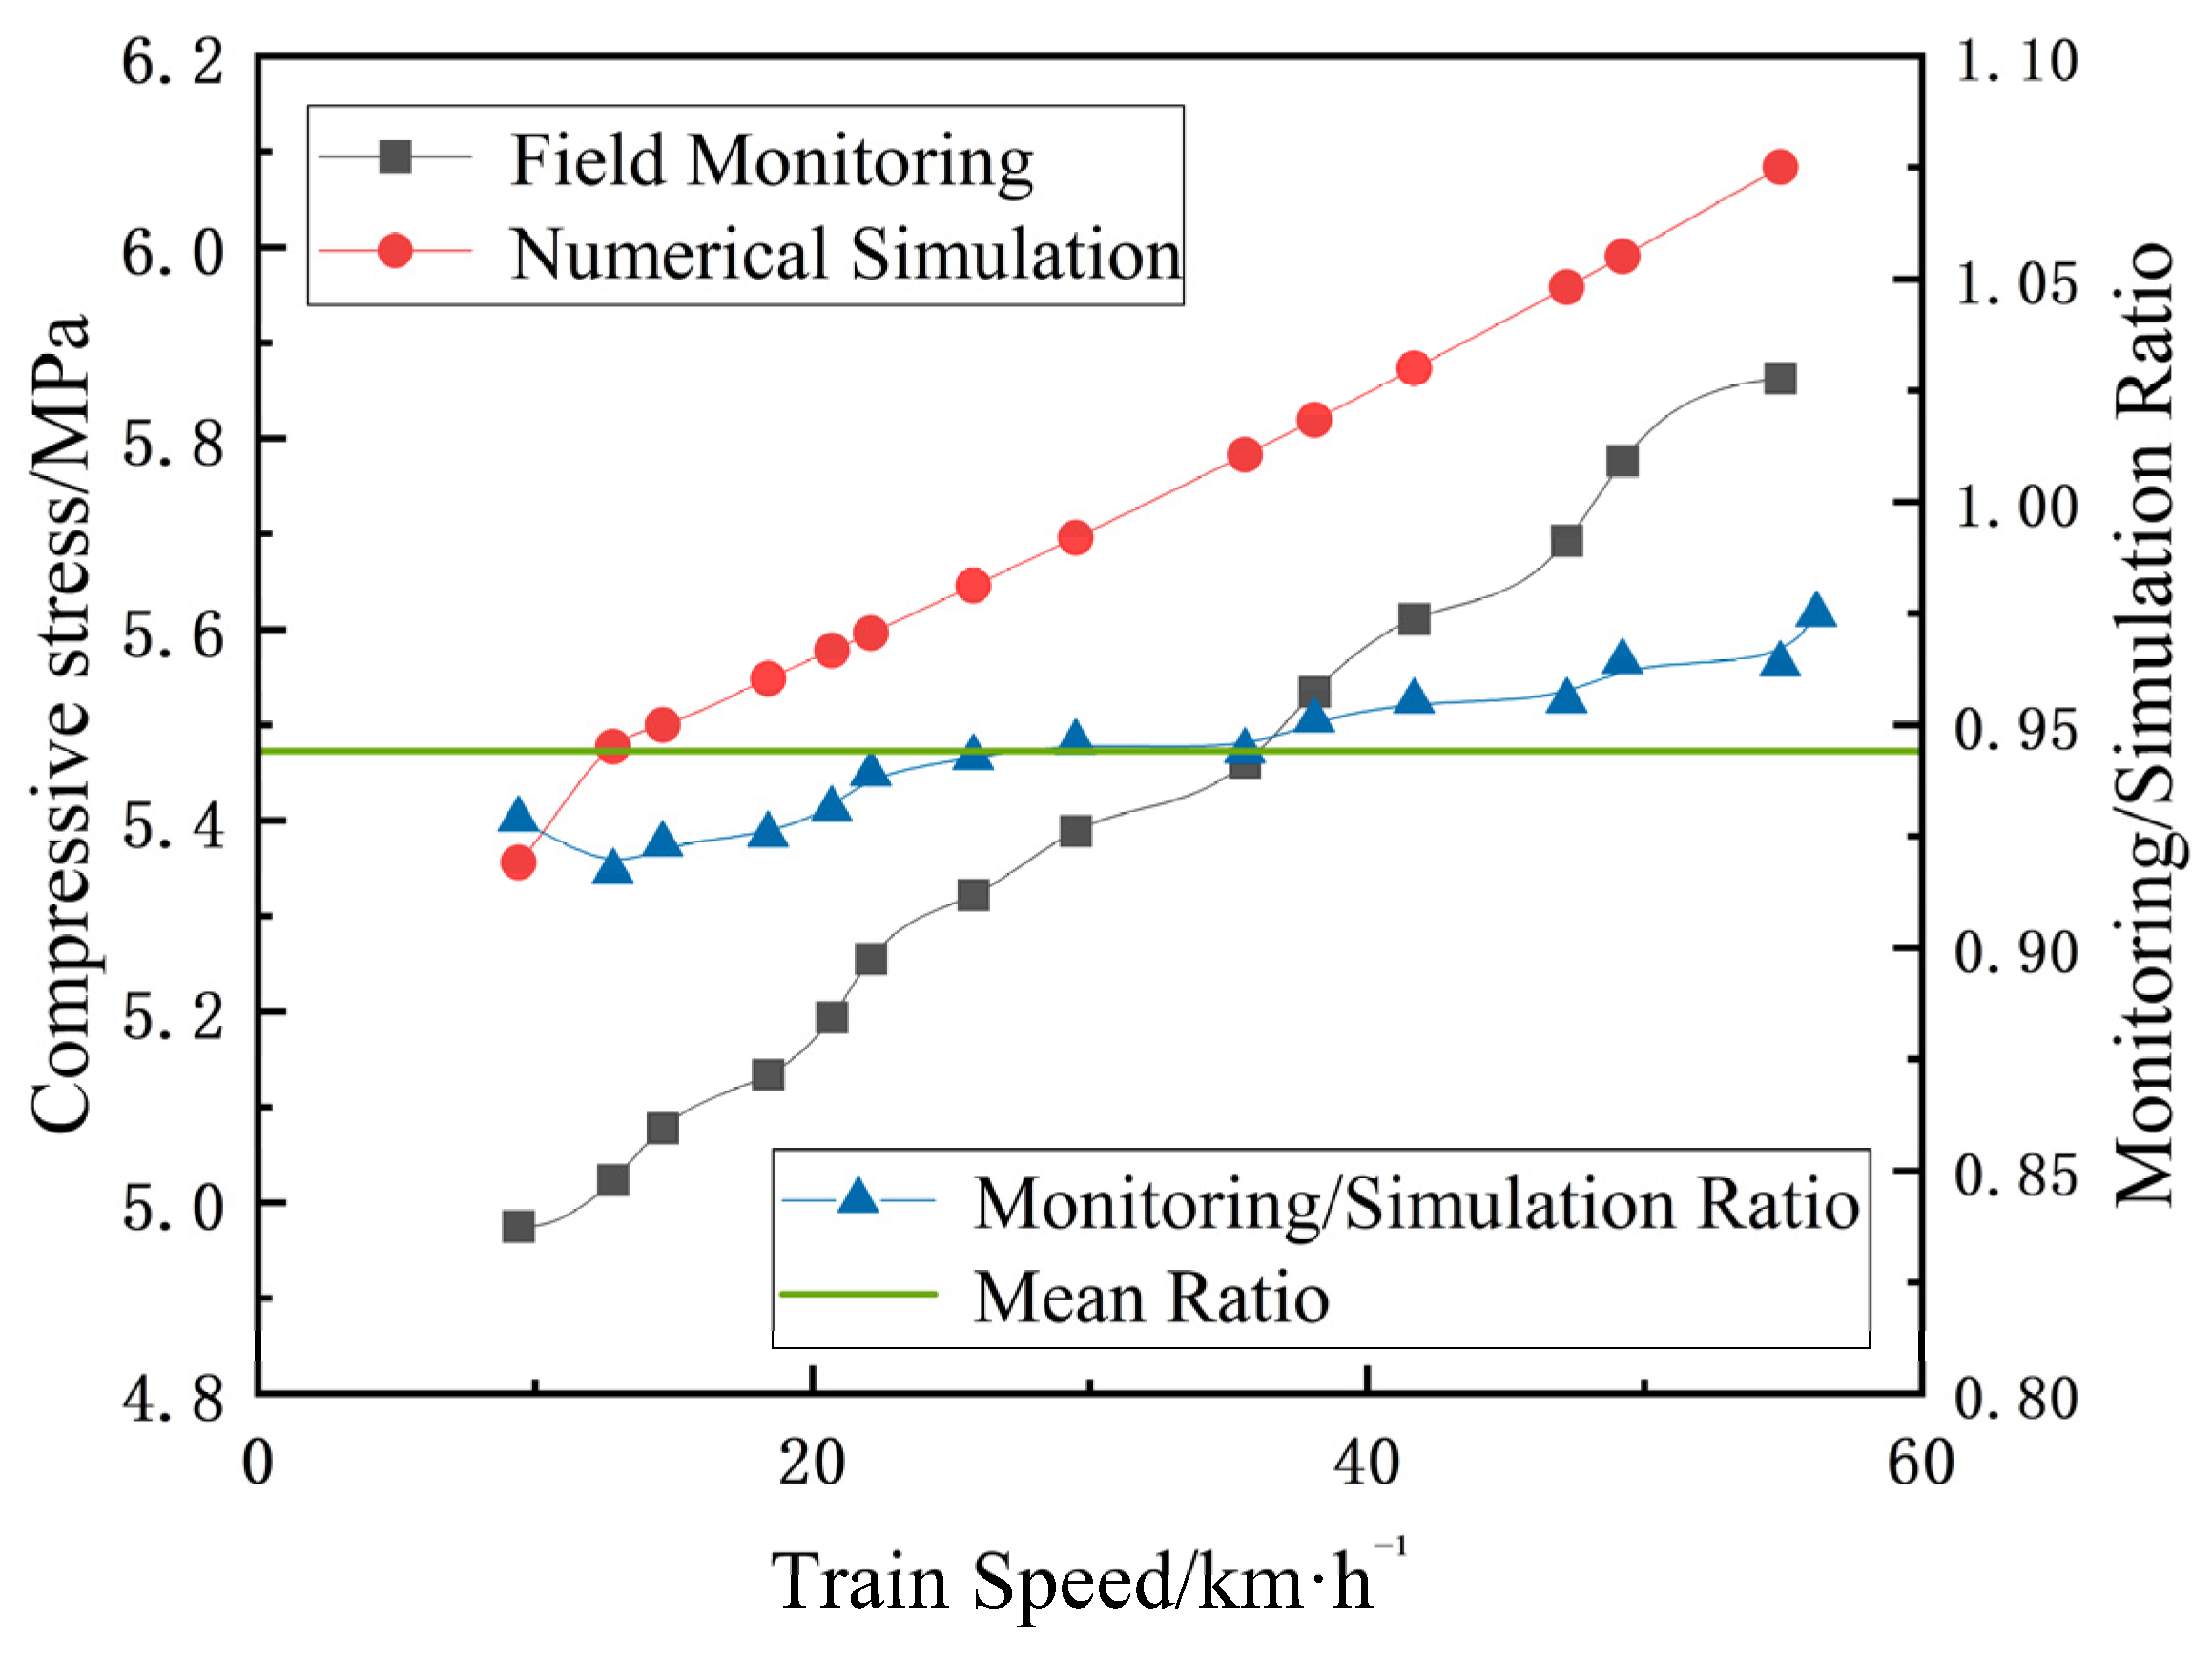
Figure 19 compares the monitored and numerically simulated compressive stresses of the tunnel lining structure. To quantitatively assess their overall agreement, the ratio of the field-monitoring value to the corresponding numerical-simulation value was calculated for each train speed. The pointwise ratios are plotted against the secondary vertical axis, and the horizontal line represents their mean value. The ratios remain close to 1.0 over the investigated speed range, with a mean ratio of approximately 0.95, indicating good overall agreement between the monitoring and numerical results. At 56.2 km/h, the measured maximum compressive stress is 5.95 MPa and is close to the numerical prediction at the same speed. The two datasets also exhibit similar speed-dependent trends. Within the investigated speed range, the middle partition wall remains in the elastic stress stage, without a sudden increase in stress or evident instability.

3.2.4. Deformation Response of the Tunnel Lining Structure Under Different Train Speeds

To analyze the influence of train operating speed on the deformation response of the twin-tunnel structure under construction, point A1 at the arch invert of the left tunnel on the side subjected to unilateral train loading is selected as the vertical deformation control point. This location is close to the trestle on the train-running side and is significantly affected by unilateral wheel loads and dynamic load transmission. In the preceding numerical analysis, it exhibited a relatively large vertical deformation response. Therefore, this study takes the absolute value of the maximum vertical deformation at point A1 during train passage through the monitoring section as the evaluation indicator for tunnel deformation.
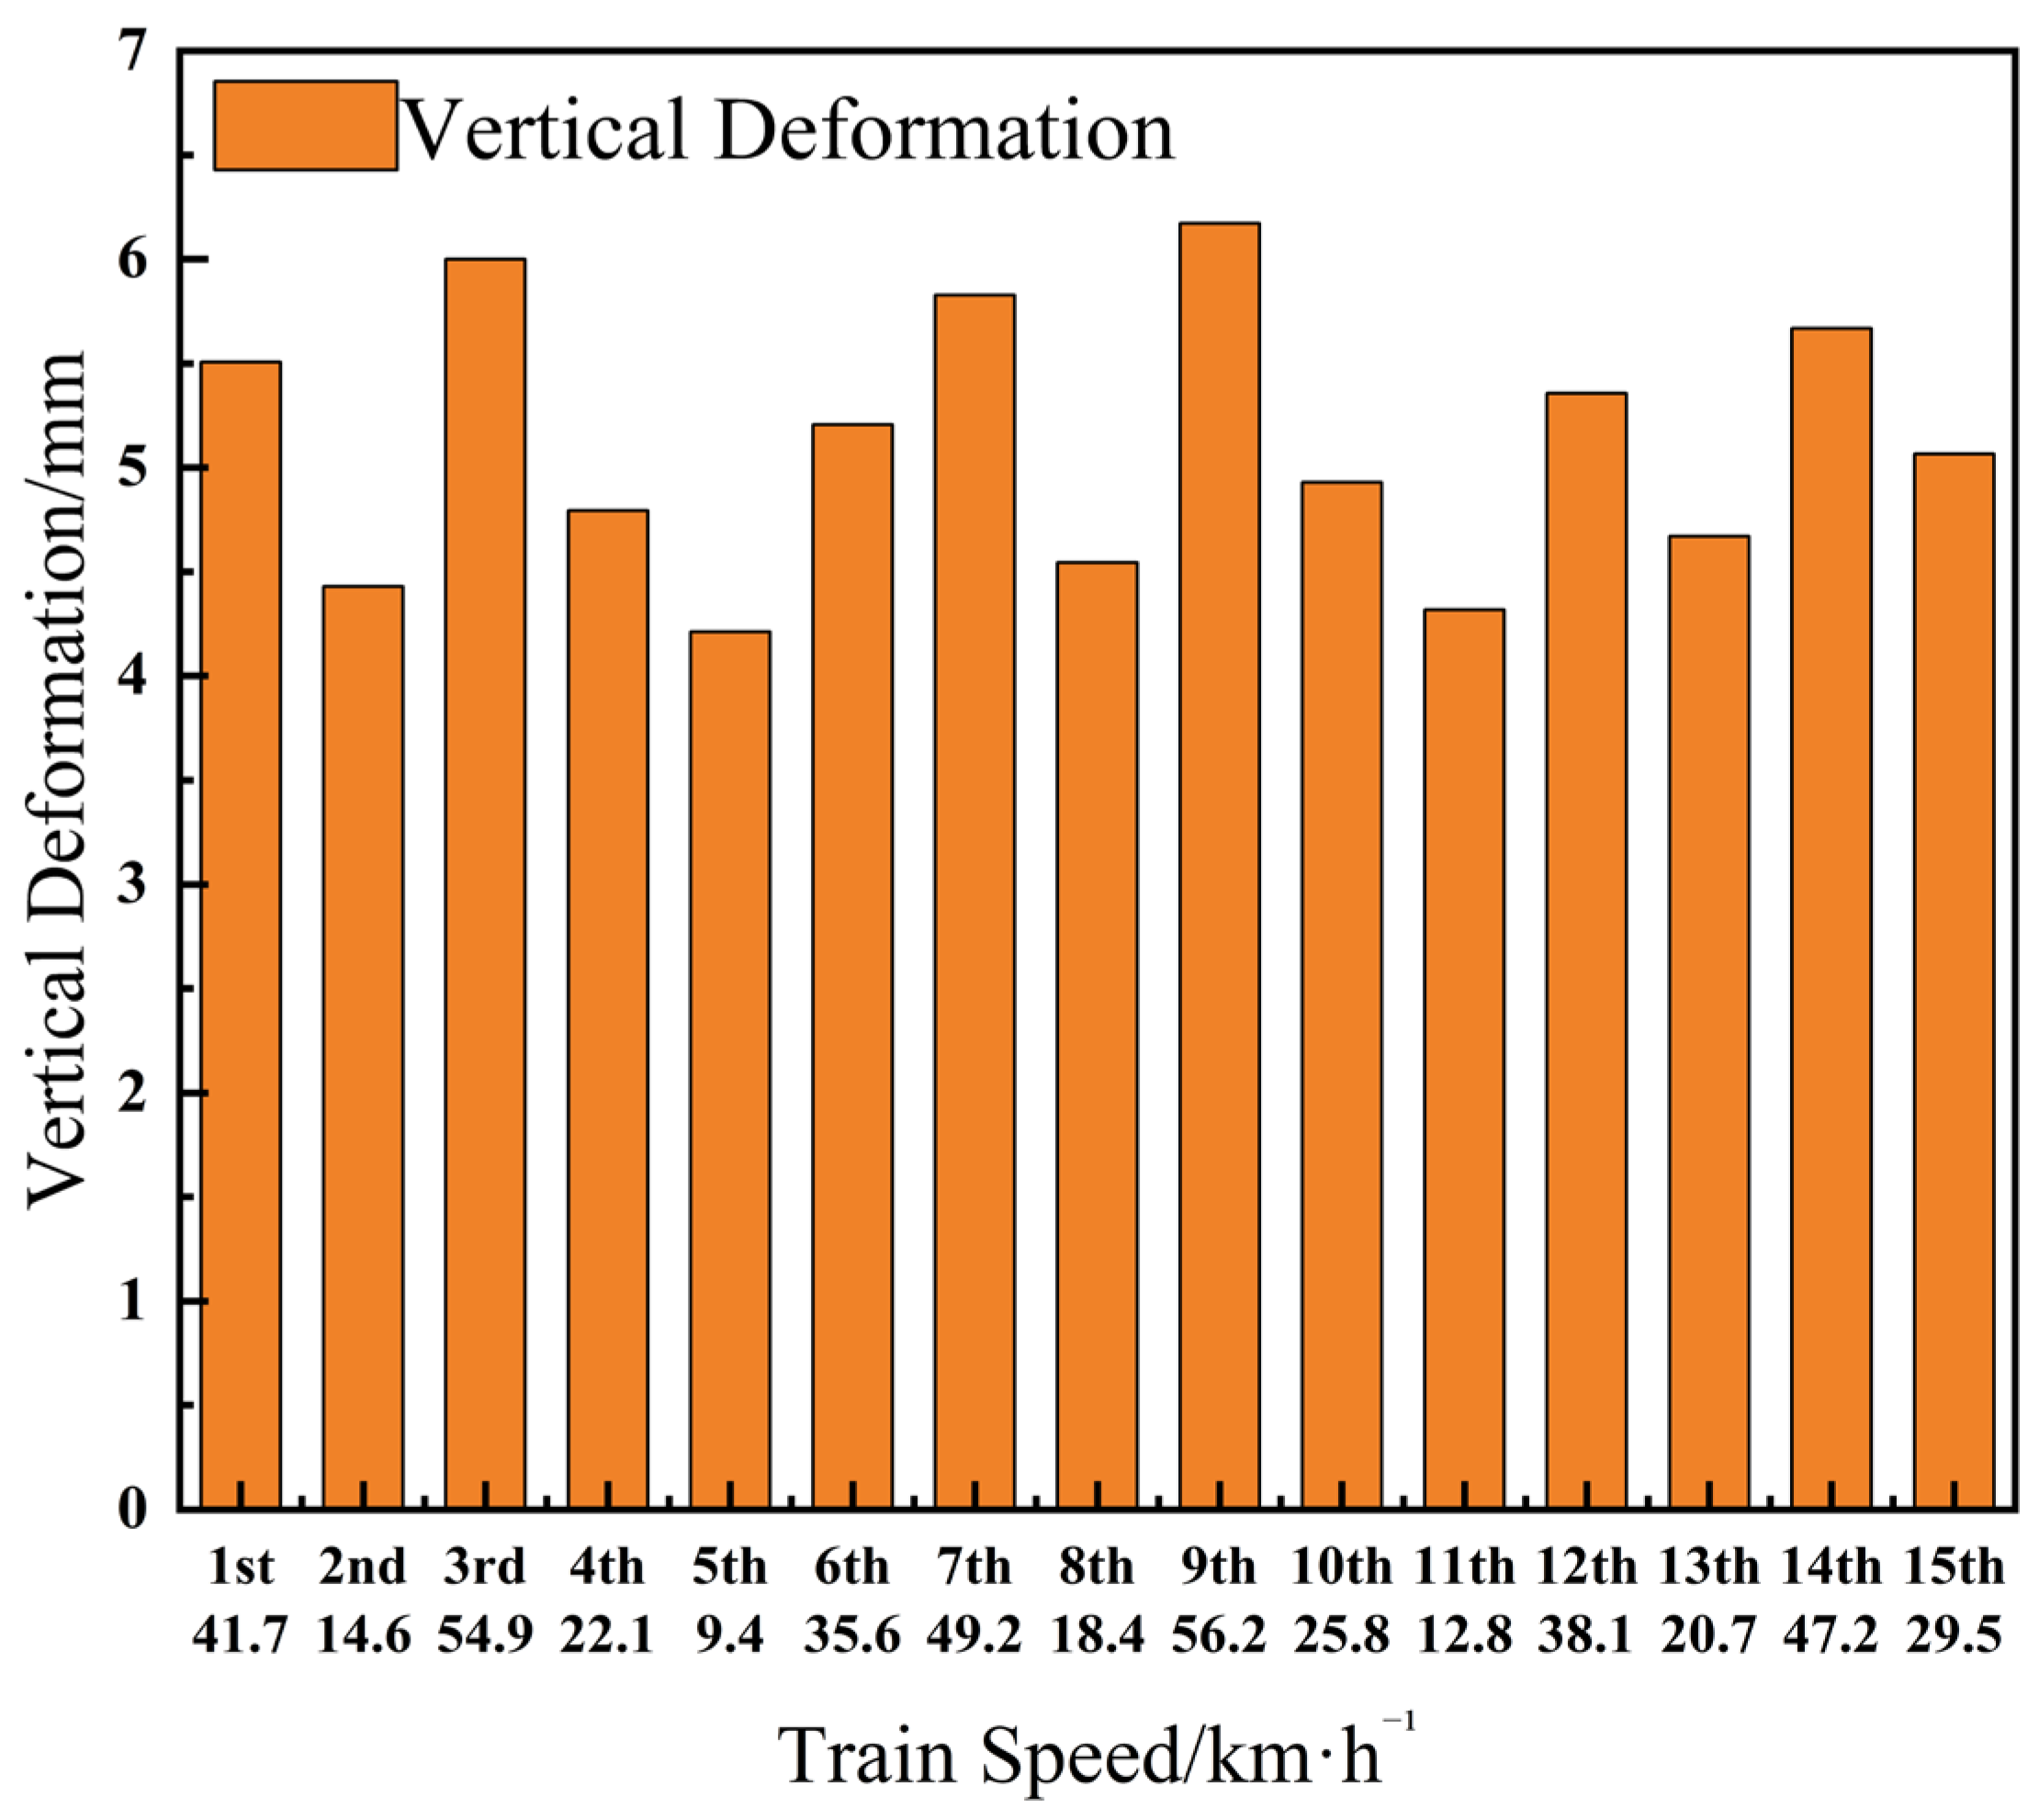
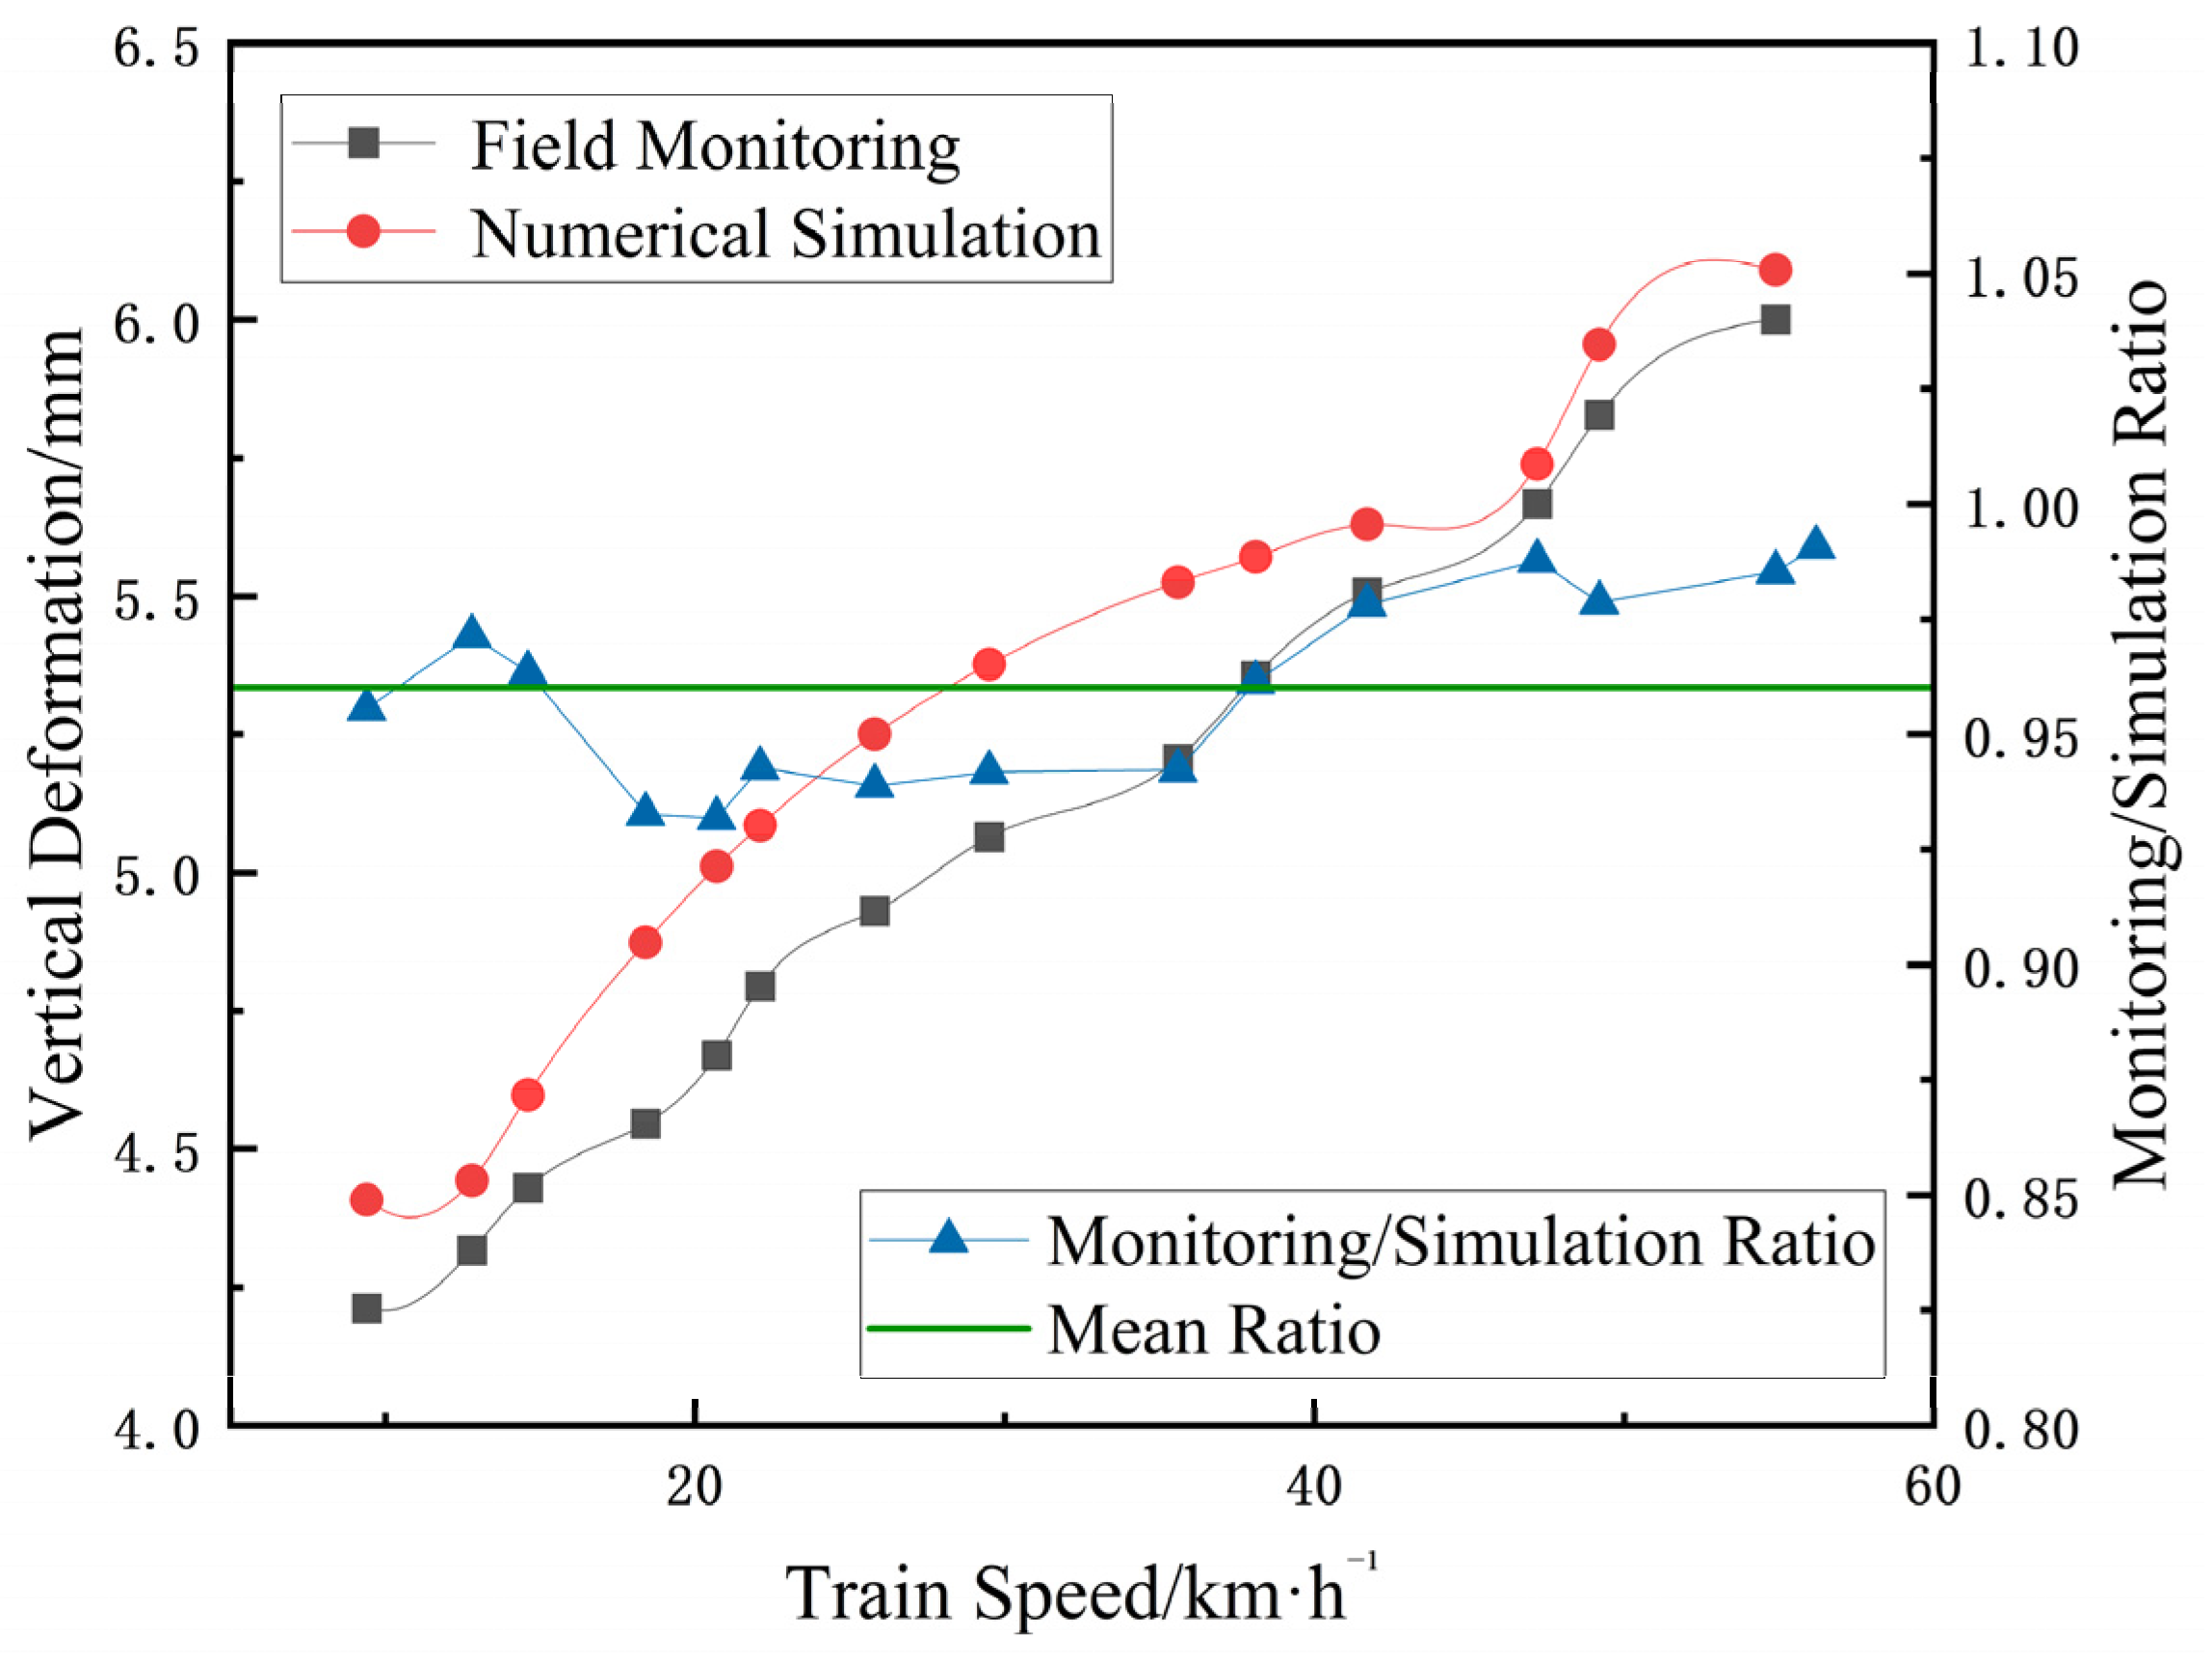
The results of the maximum vertical deformation of the tunnel structure under different train operating speeds are shown in Figure 20. As the train operating speed increased from 9.4 km/h to 56.2 km/h, the maximum vertical deformation at point A1 of the left tunnel arch invert increased from 4.21 mm to 6.17 mm, with a cumulative increase of approximately 46.5%. Overall, the vertical deformation of the tunnel showed a nonlinear increasing trend with the increase in train speed. In the low-speed stage, the deformation increase was relatively gentle; when the train speed exceeded approximately 30 km/h, the deformation response increased gradually at low speeds and became more pronounced around and above 30 km/h.
Figure 21 compares the monitored and numerically simulated vertical deformation responses of the tunnel lining. The monitoring-to-simulation ratio was calculated at each train speed and is presented using the secondary vertical axis. The horizontal line indicates the mean ratio for all investigated train speeds. The pointwise ratios fluctuate slightly around the mean value, while the mean ratio is approximately 0.96, showing that the numerical model satisfactorily reproduces the overall magnitude of the monitored vertical deformation. At train speeds of 29.5 and 32.8 km/h, the measured maximum vertical deformations at point A1 are approximately 4.93 and 5.07 mm, respectively. Considering the small difference between these adjacent measurements and the uncertainty inherent in field monitoring, the difference of 0.14 mm is not interpreted as a distinct deformation-threshold crossing. Instead, the overall monitoring and numerical results indicate that the deformation response becomes more pronounced around and above 30 km/h. Therefore, approximately 30 km/h is recommended as a project-specific and conservative operational-control value rather than a precisely defined deformation-based limit.
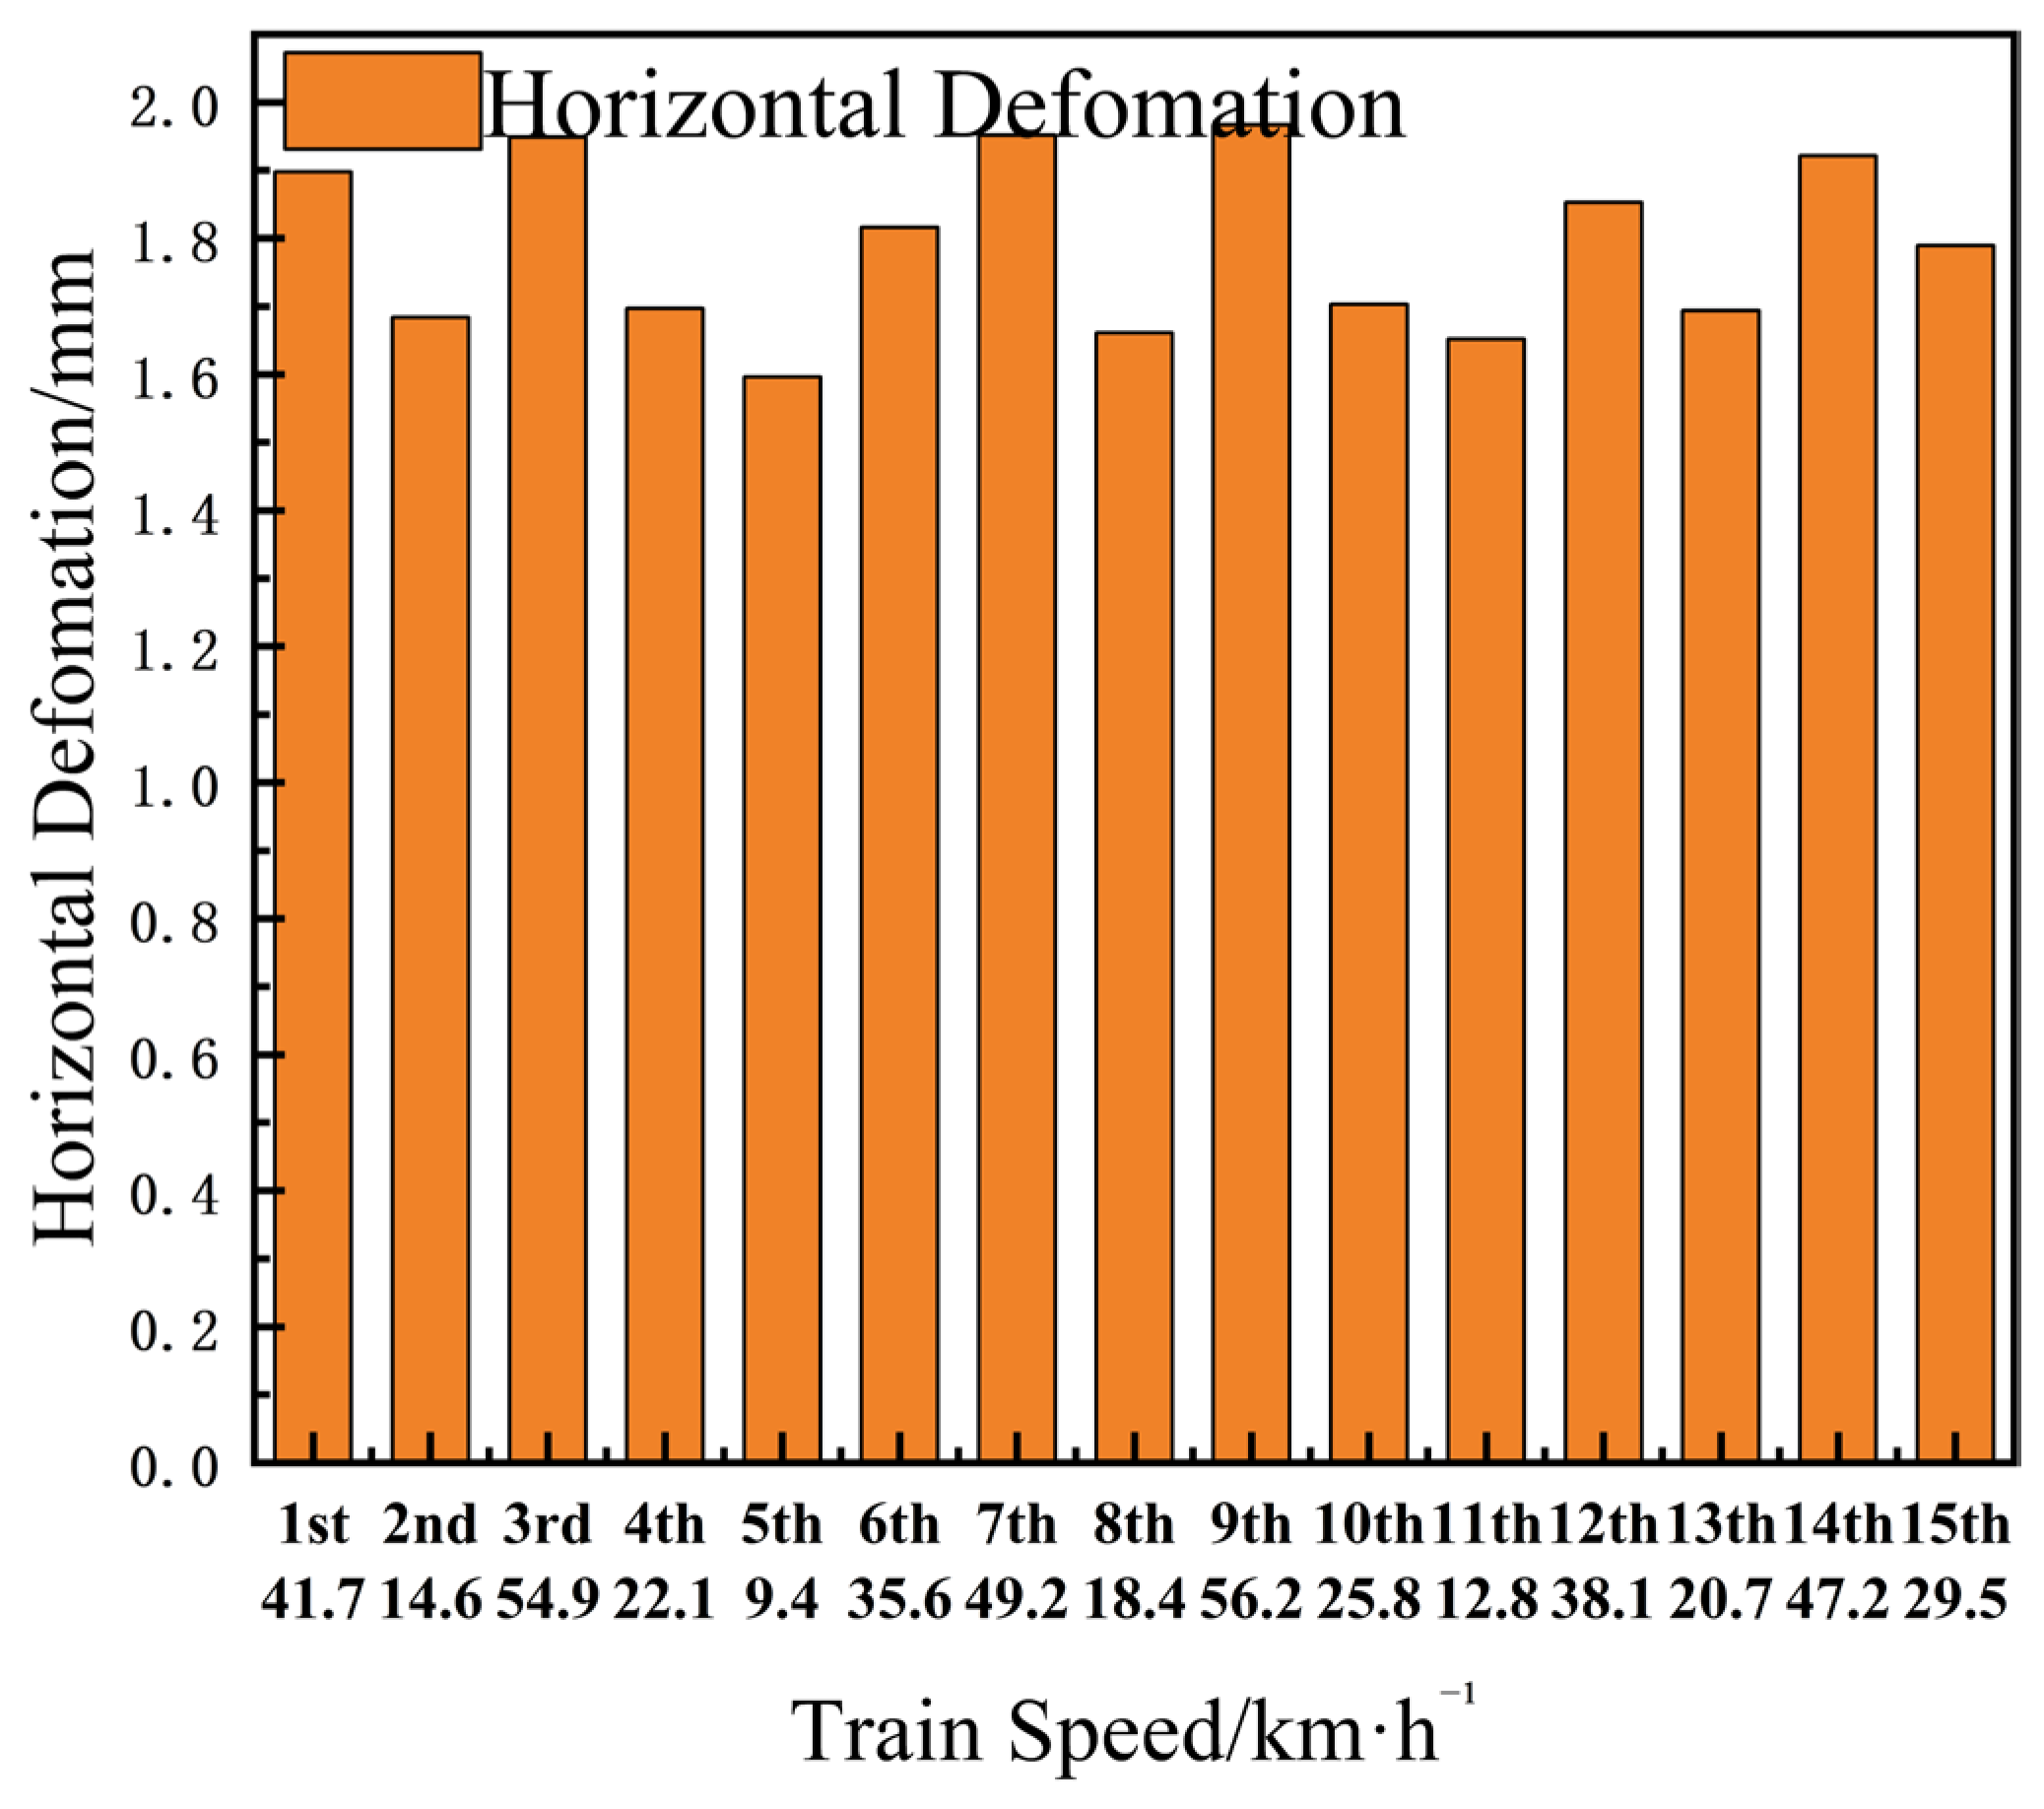
To further analyze the influence of unilateral train loading on the horizontal deformation of the double-arch tunnel structure under construction, point C1 of the middle partition wall is selected as the horizontal deformation control point. This measuring point is located in the middle-lower region of the middle partition wall and is close to the load-transfer range of the unilateral train operation. In the numerical simulation, it exhibited a relatively significant transverse deformation response. The monitoring results of the maximum horizontal deformation at point C1 of the middle partition wall under different train speeds are shown in Figure 22.
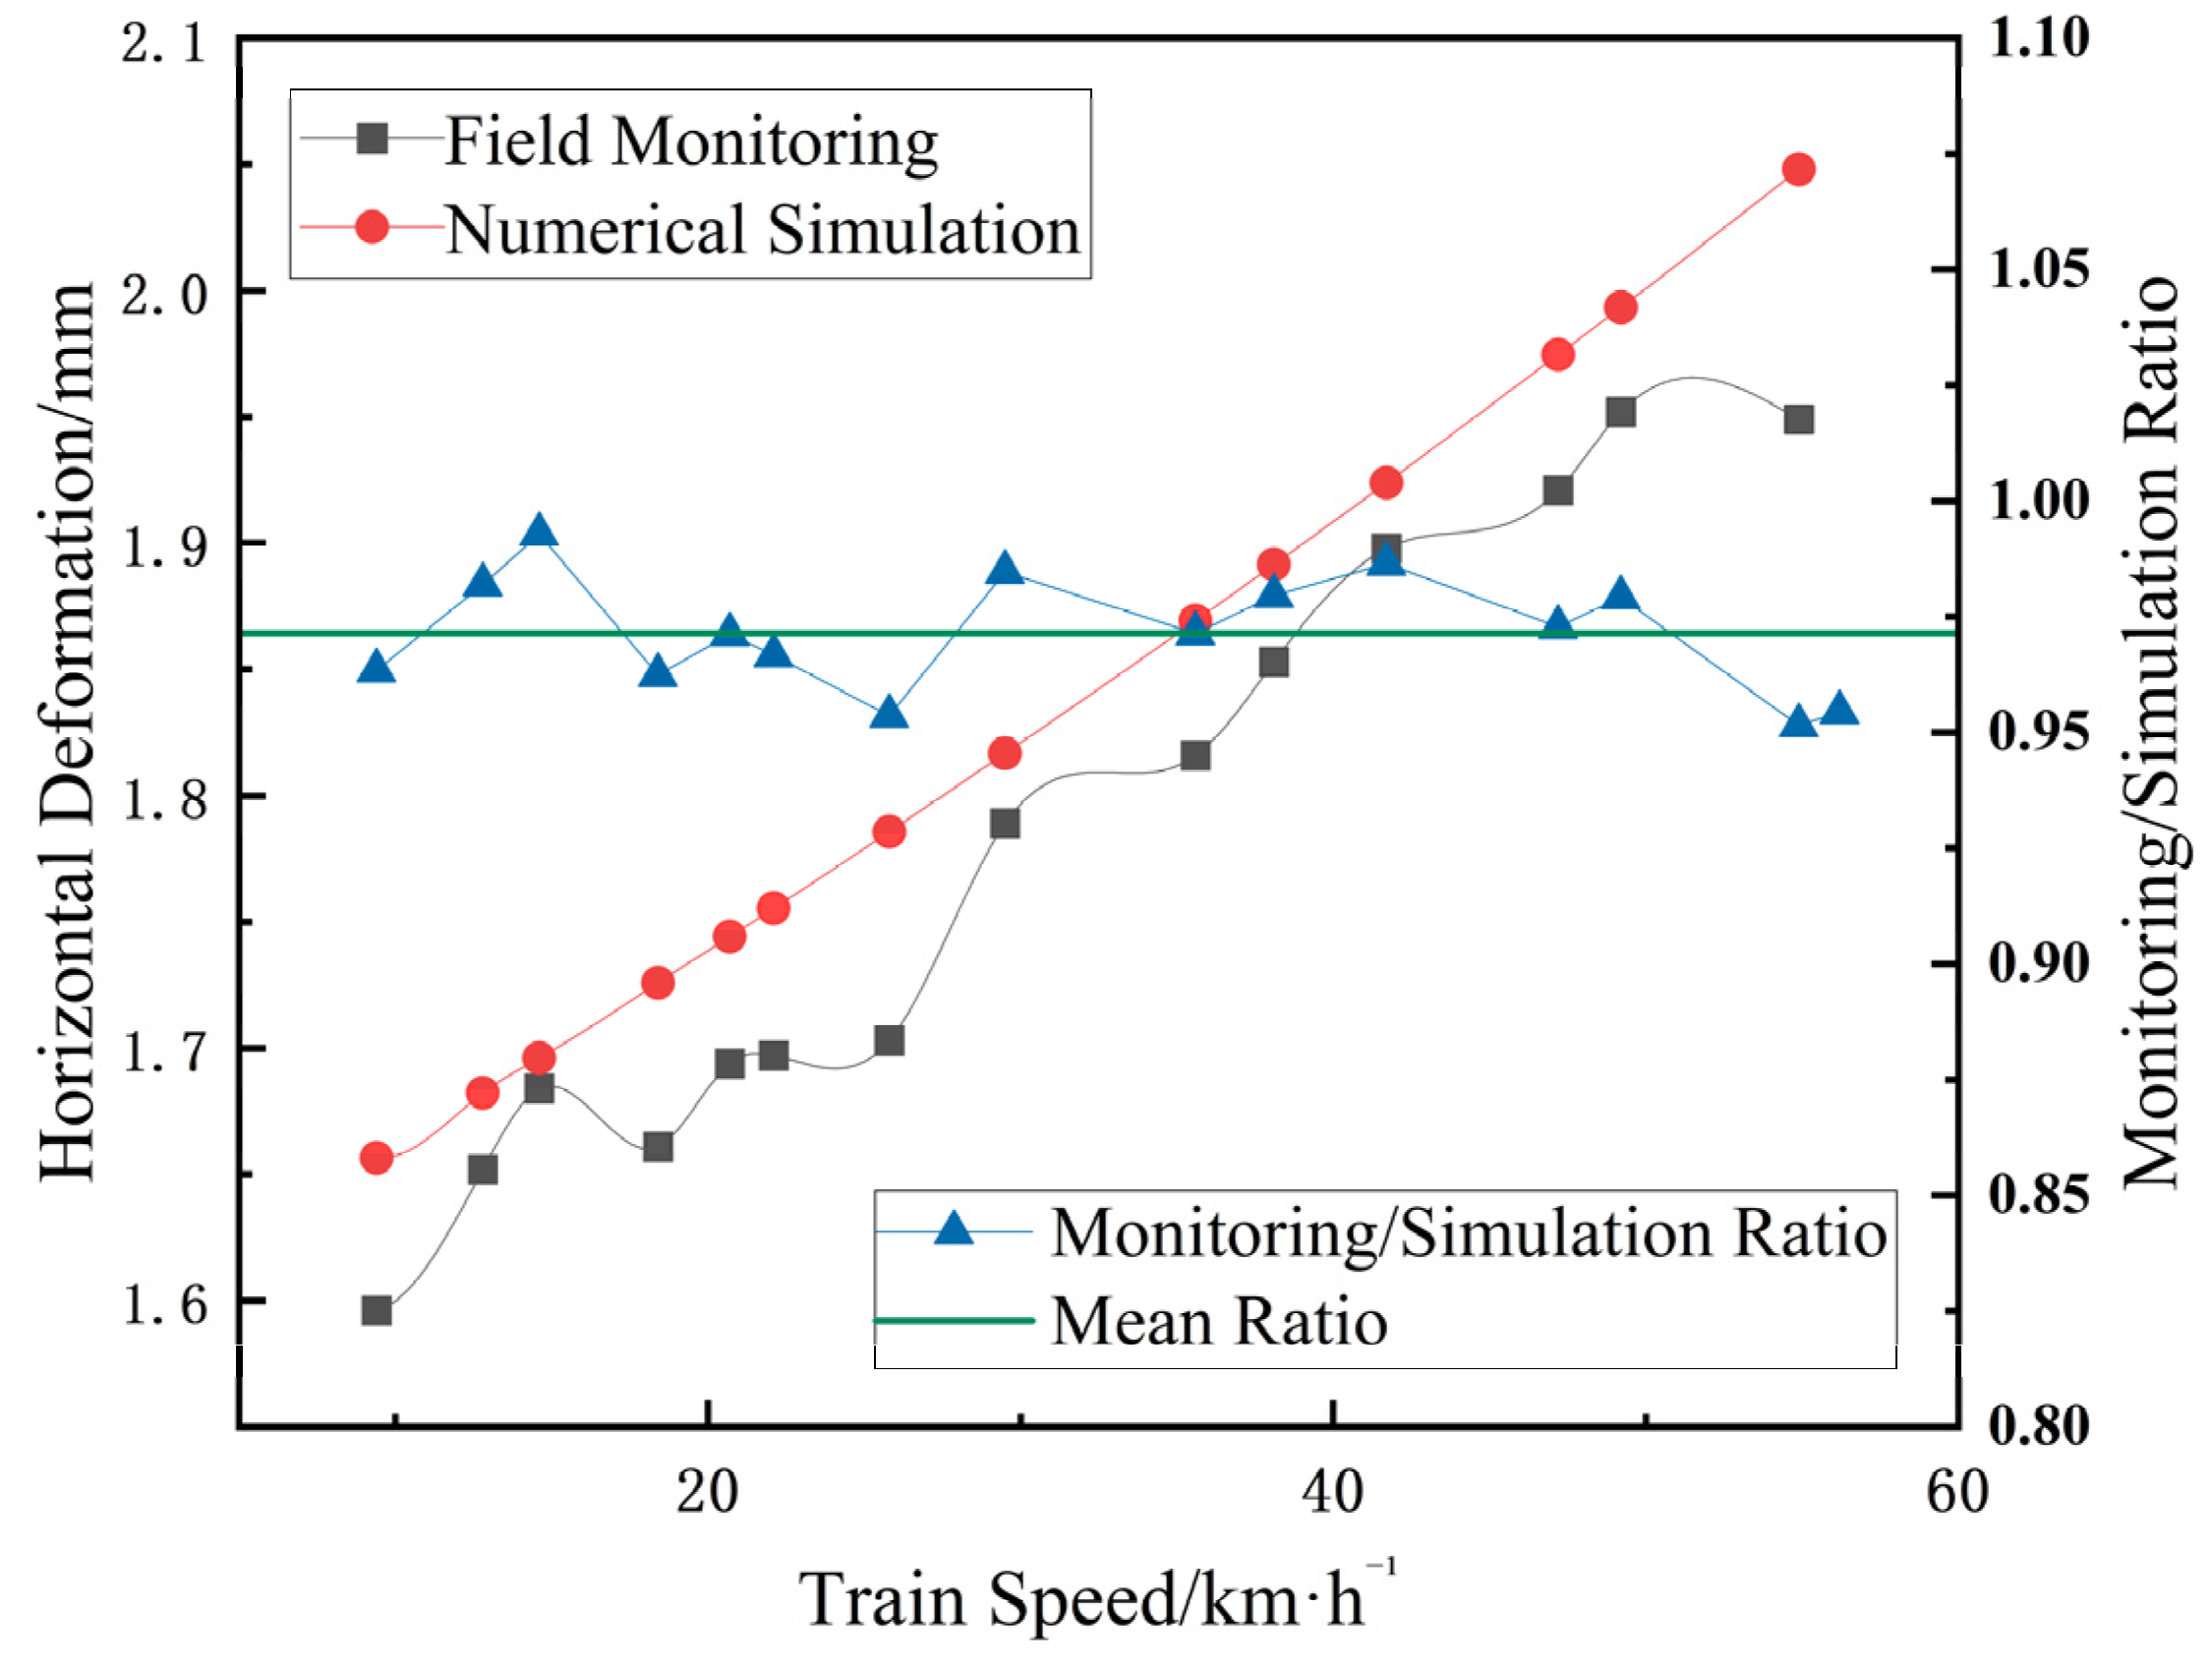
Figure 23 compares the monitored and numerically simulated horizontal deformation responses at point C1. The monitoring-to-simulation ratios corresponding to the different train speeds are plotted against the secondary vertical axis, and their mean value is represented by the horizontal line. The ratios are concentrated near 1.0, with a mean ratio of approximately 0.97. This result indicates that the numerical model provides a satisfactory overall prediction of the horizontal deformation, although small point wise fluctuations are present in the field-monitoring data.
As the train operating speed increased from 9.4 km/h to 56.2 km/h, the monitored maximum horizontal deformation at point C1 increased from 1.10 mm to 1.93 mm, corresponding to a cumulative increase of approximately 75.8%. Overall, the structural horizontal deformation increased with the increase in train operating speed, but the increments under adjacent speed conditions showed certain fluctuations. This was mainly because factors such as the wheel–rail contact state, horizontal vibration characteristics, local track irregularity, and measurement errors during train operation may have a certain influence on the peak response. Therefore, the field-monitoring results usually exhibit the variation characteristics of overall increase and local discreteness.
From the variation process, when the train speed was lower than 30 km/h, the maximum horizontal deformation at point C1 remained within 1.5 mm, and the transverse deformation of the structure was relatively small. When the train speed exceeded 30 km/h, the increasing trend of horizontal deformation gradually became obvious. In particular, when the train speed reached 52.9 km/h and 56.2 km/h, the maximum horizontal deformation reached 1.85 mm and 1.93 mm, respectively, indicating that higher operating speeds would further intensify the tendency of the middle partition wall to offset toward the tunnel on the train-running side.
Combined with the vertical deformation response results, it can be seen that under unilateral train loading, the middle partition wall not only undergoes obvious vertical settlement, but also exhibits transverse offset toward the tunnel on the train-running side. This asymmetric deformation characteristic is an important response form of the double-arch tunnel under eccentric train loading during the construction stage. To reduce the additional deformation of the middle partition wall and adjacent initial support structures, it is still recommended that the train operating speed be controlled within 30 km/h during the construction transportation stage, and horizontal deformation monitoring of the middle-lower and bottom regions of the middle partition wall should be strengthened. It should be emphasized that this threshold is a project-specific control value rather than a universal speed limit for double-arch tunnel construction. The value of approximately 30 km/h is obtained for the investigated tunnel–trestle system based on the overall monitored and calculated response trends under the present construction and loading conditions, and should not be interpreted as a universal or precisely defined speed limit.

3.2.5. Stress Response of the Trestle Bridge Under Different Train Speeds

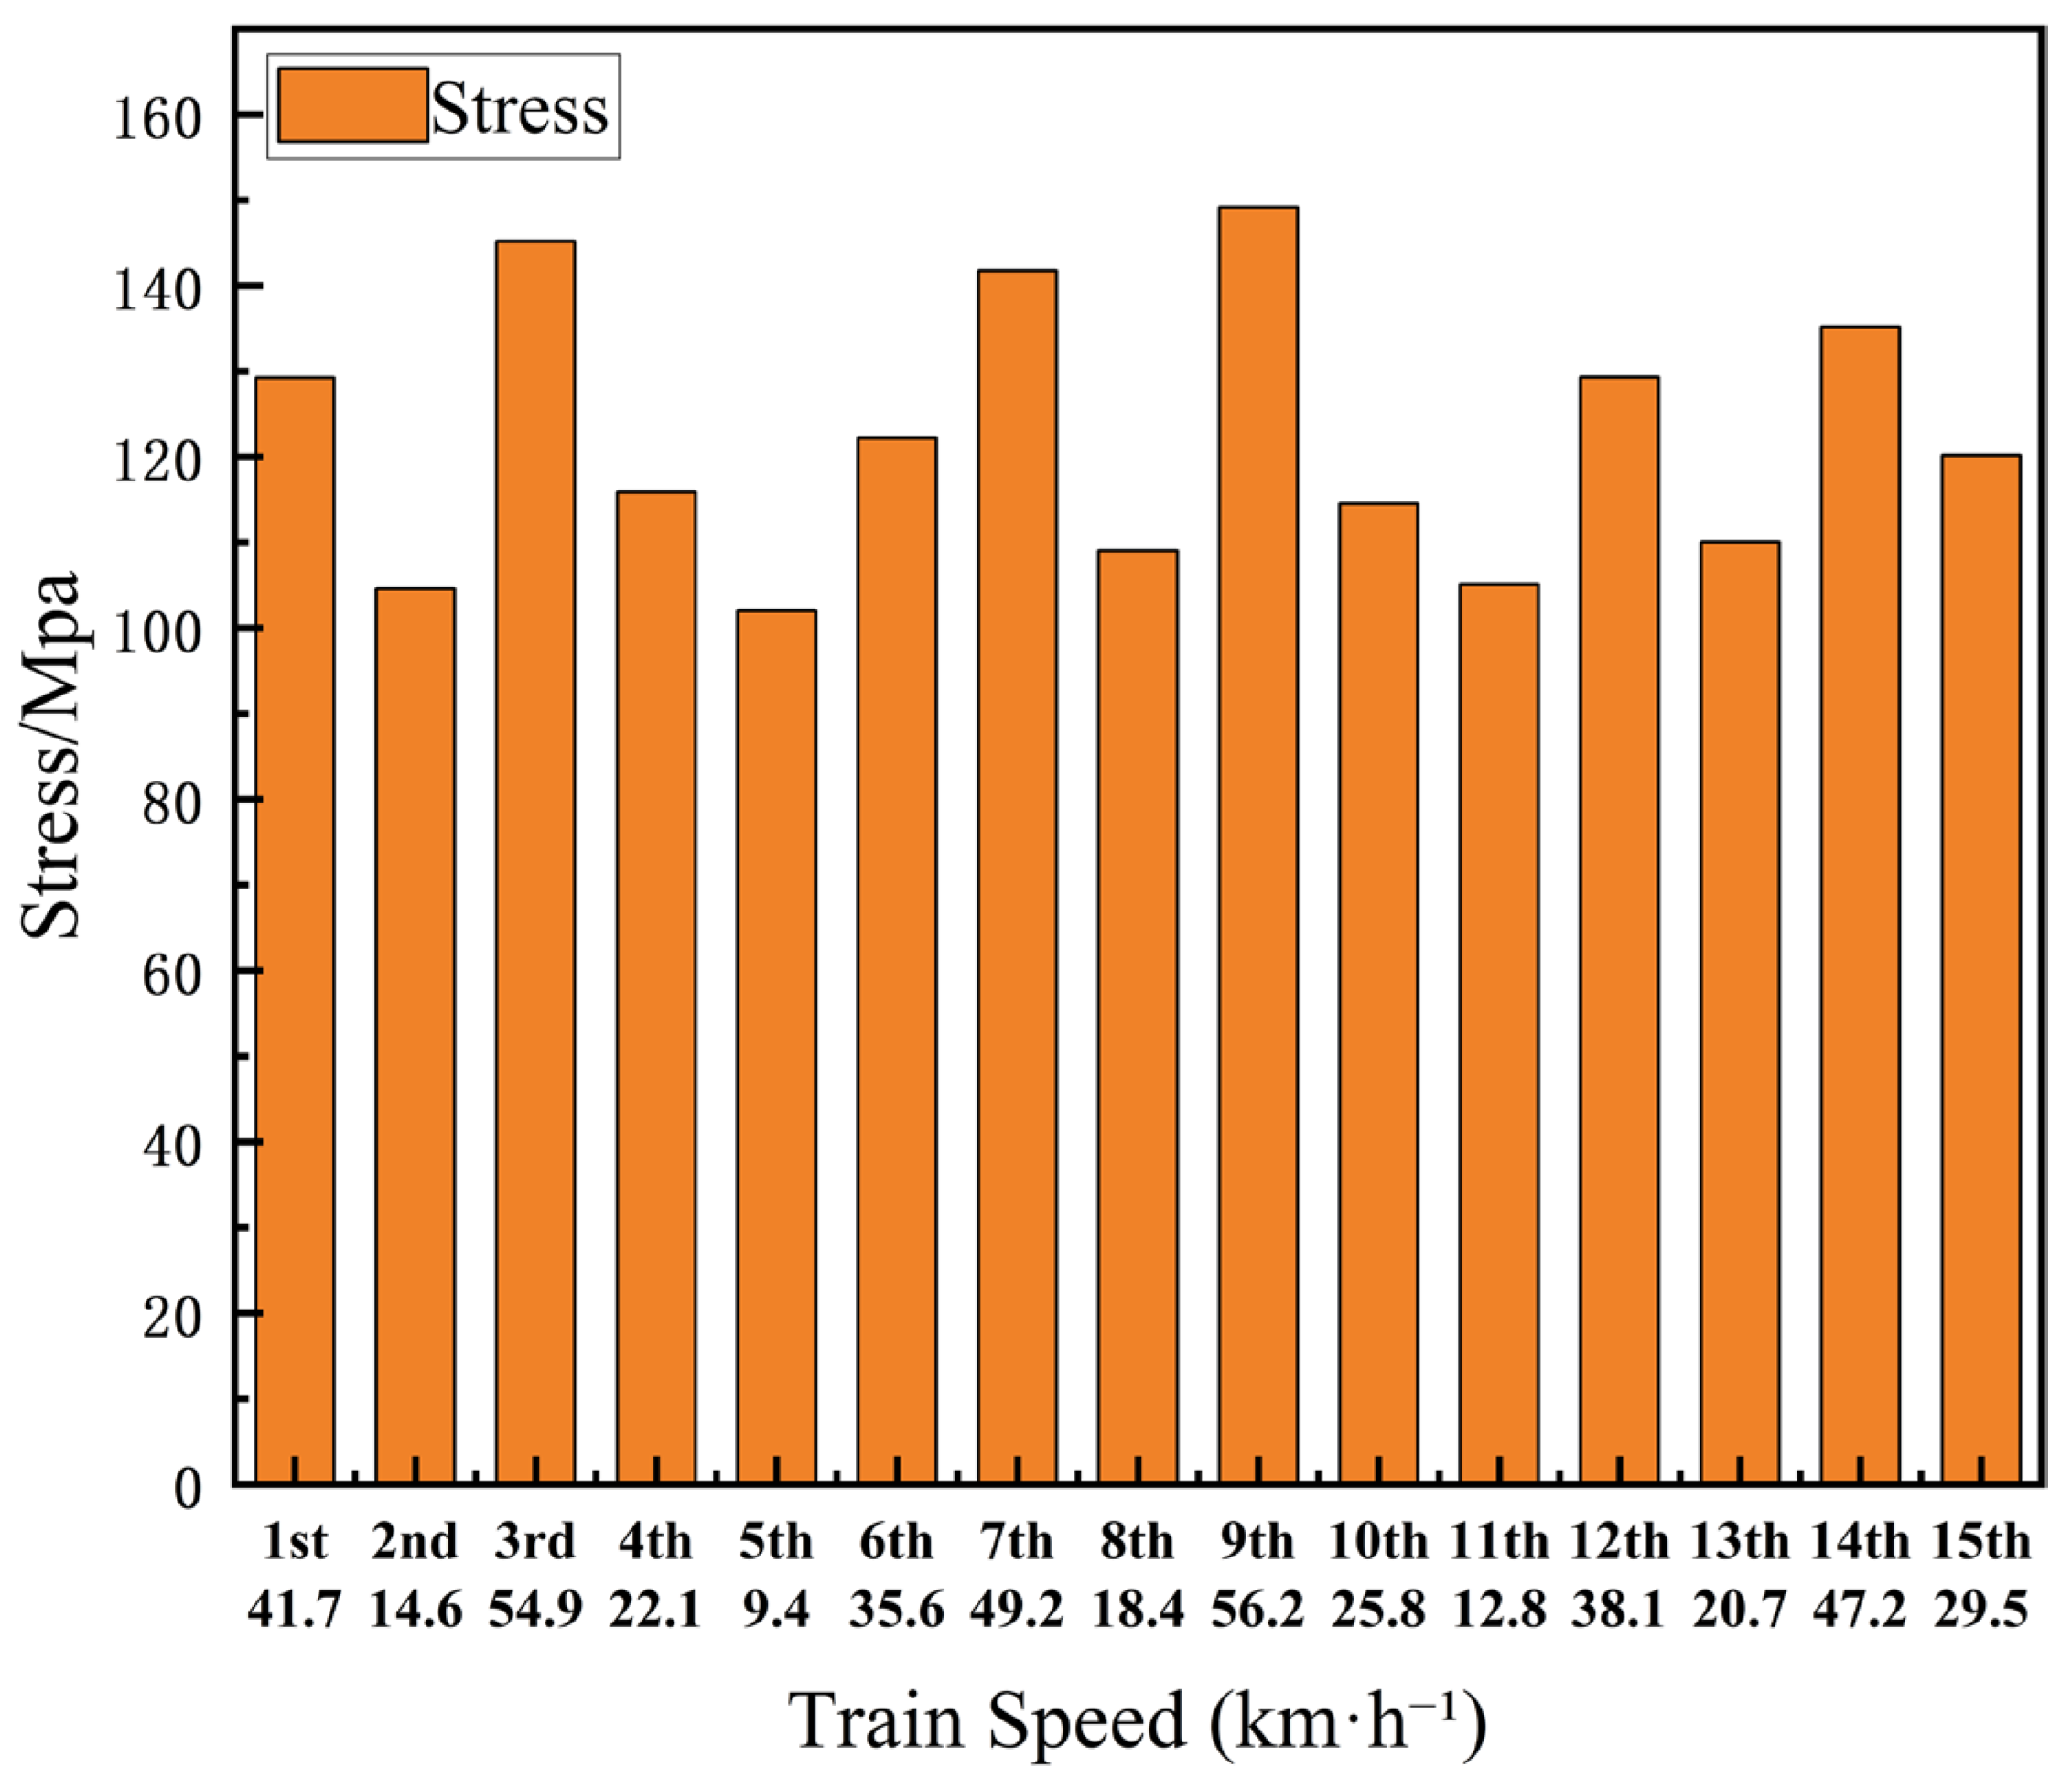
To analyze the influence of train operating speed on the stress state of the trestle bridge structure, the rail–top slab connection region near the area directly subjected to train wheel loads is selected as the stress control region of the trestle. The maximum stress of the trestle structure during train passage through the monitoring section is taken as the evaluation indicator. This region is directly subjected to wheel–rail loads and exhibits relatively obvious local stress concentration, making it a key location for safety control of the trestle structure. The detection results of the stress of the trestle bridge under different train speeds are shown in Figure 24.
As shown in Figure 24, when the train operating speed increased from 9.4 km/h to 56.2 km/h, the maximum equivalent stress of the trestle increased from 103.18 MPa to 149.18 MPa, with a cumulative increase of approximately 44.6%. Overall, the maximum stress of the trestle bridge continued to increase with the increase in train speed, but the increments under adjacent speed conditions were not completely the same. For example, when the train speed increased from 29.5 km/h to 32.8 km/h, the maximum stress increased by 3.48 MPa; whereas when the train speed increased from 32.8 km/h to 36.1 km/h, the increase was 2.99 MPa. This phenomenon indicates that the dynamic response of the train is affected not only by the operating speed, but also by the wheel–rail contact state, local track irregularity, and vibration characteristics of the trestle components. Although the overall structural response increases with train speed, the increments between adjacent speed conditions are not strictly monotonic. This scatter may result from variations in wheel–rail contact, local track irregularities, and temporary-trestle vibration that are not fully captured by the simplified excitation model. Therefore, the numerical model is more suitable for interpreting the overall speed-dependent trend than reproducing individual fluctuations in the field data.
When the train operating speed was lower than 30 km/h, the maximum equivalent stress of the trestle bridge remained below 120 MPa. When the train speed increased to 32.8 km/h, the maximum equivalent stress reached 120.52 MPa, indicating that after the train speed exceeded 30 km/h, the influence of the wheel-load dynamic effect on the local stress of the trestle bridge began to become more obvious. The maximum equivalent stress of the trestle corresponding to the maximum monitored speed of 56.2 km/h was 149.18 MPa, which was still lower than 172 MPa obtained from the numerical simulation under the 70 km/h condition, with a reduction of approximately 13.3%.
Combined with the yield strength of Q235 steel, it can be seen that within the train speed range studied in this paper, the maximum equivalent stress of the trestle bridge was lower than the yield strength of the steel. The trestle bridge components were generally in the elastic stress stage, and short-term train operation would not cause obvious plastic damage.
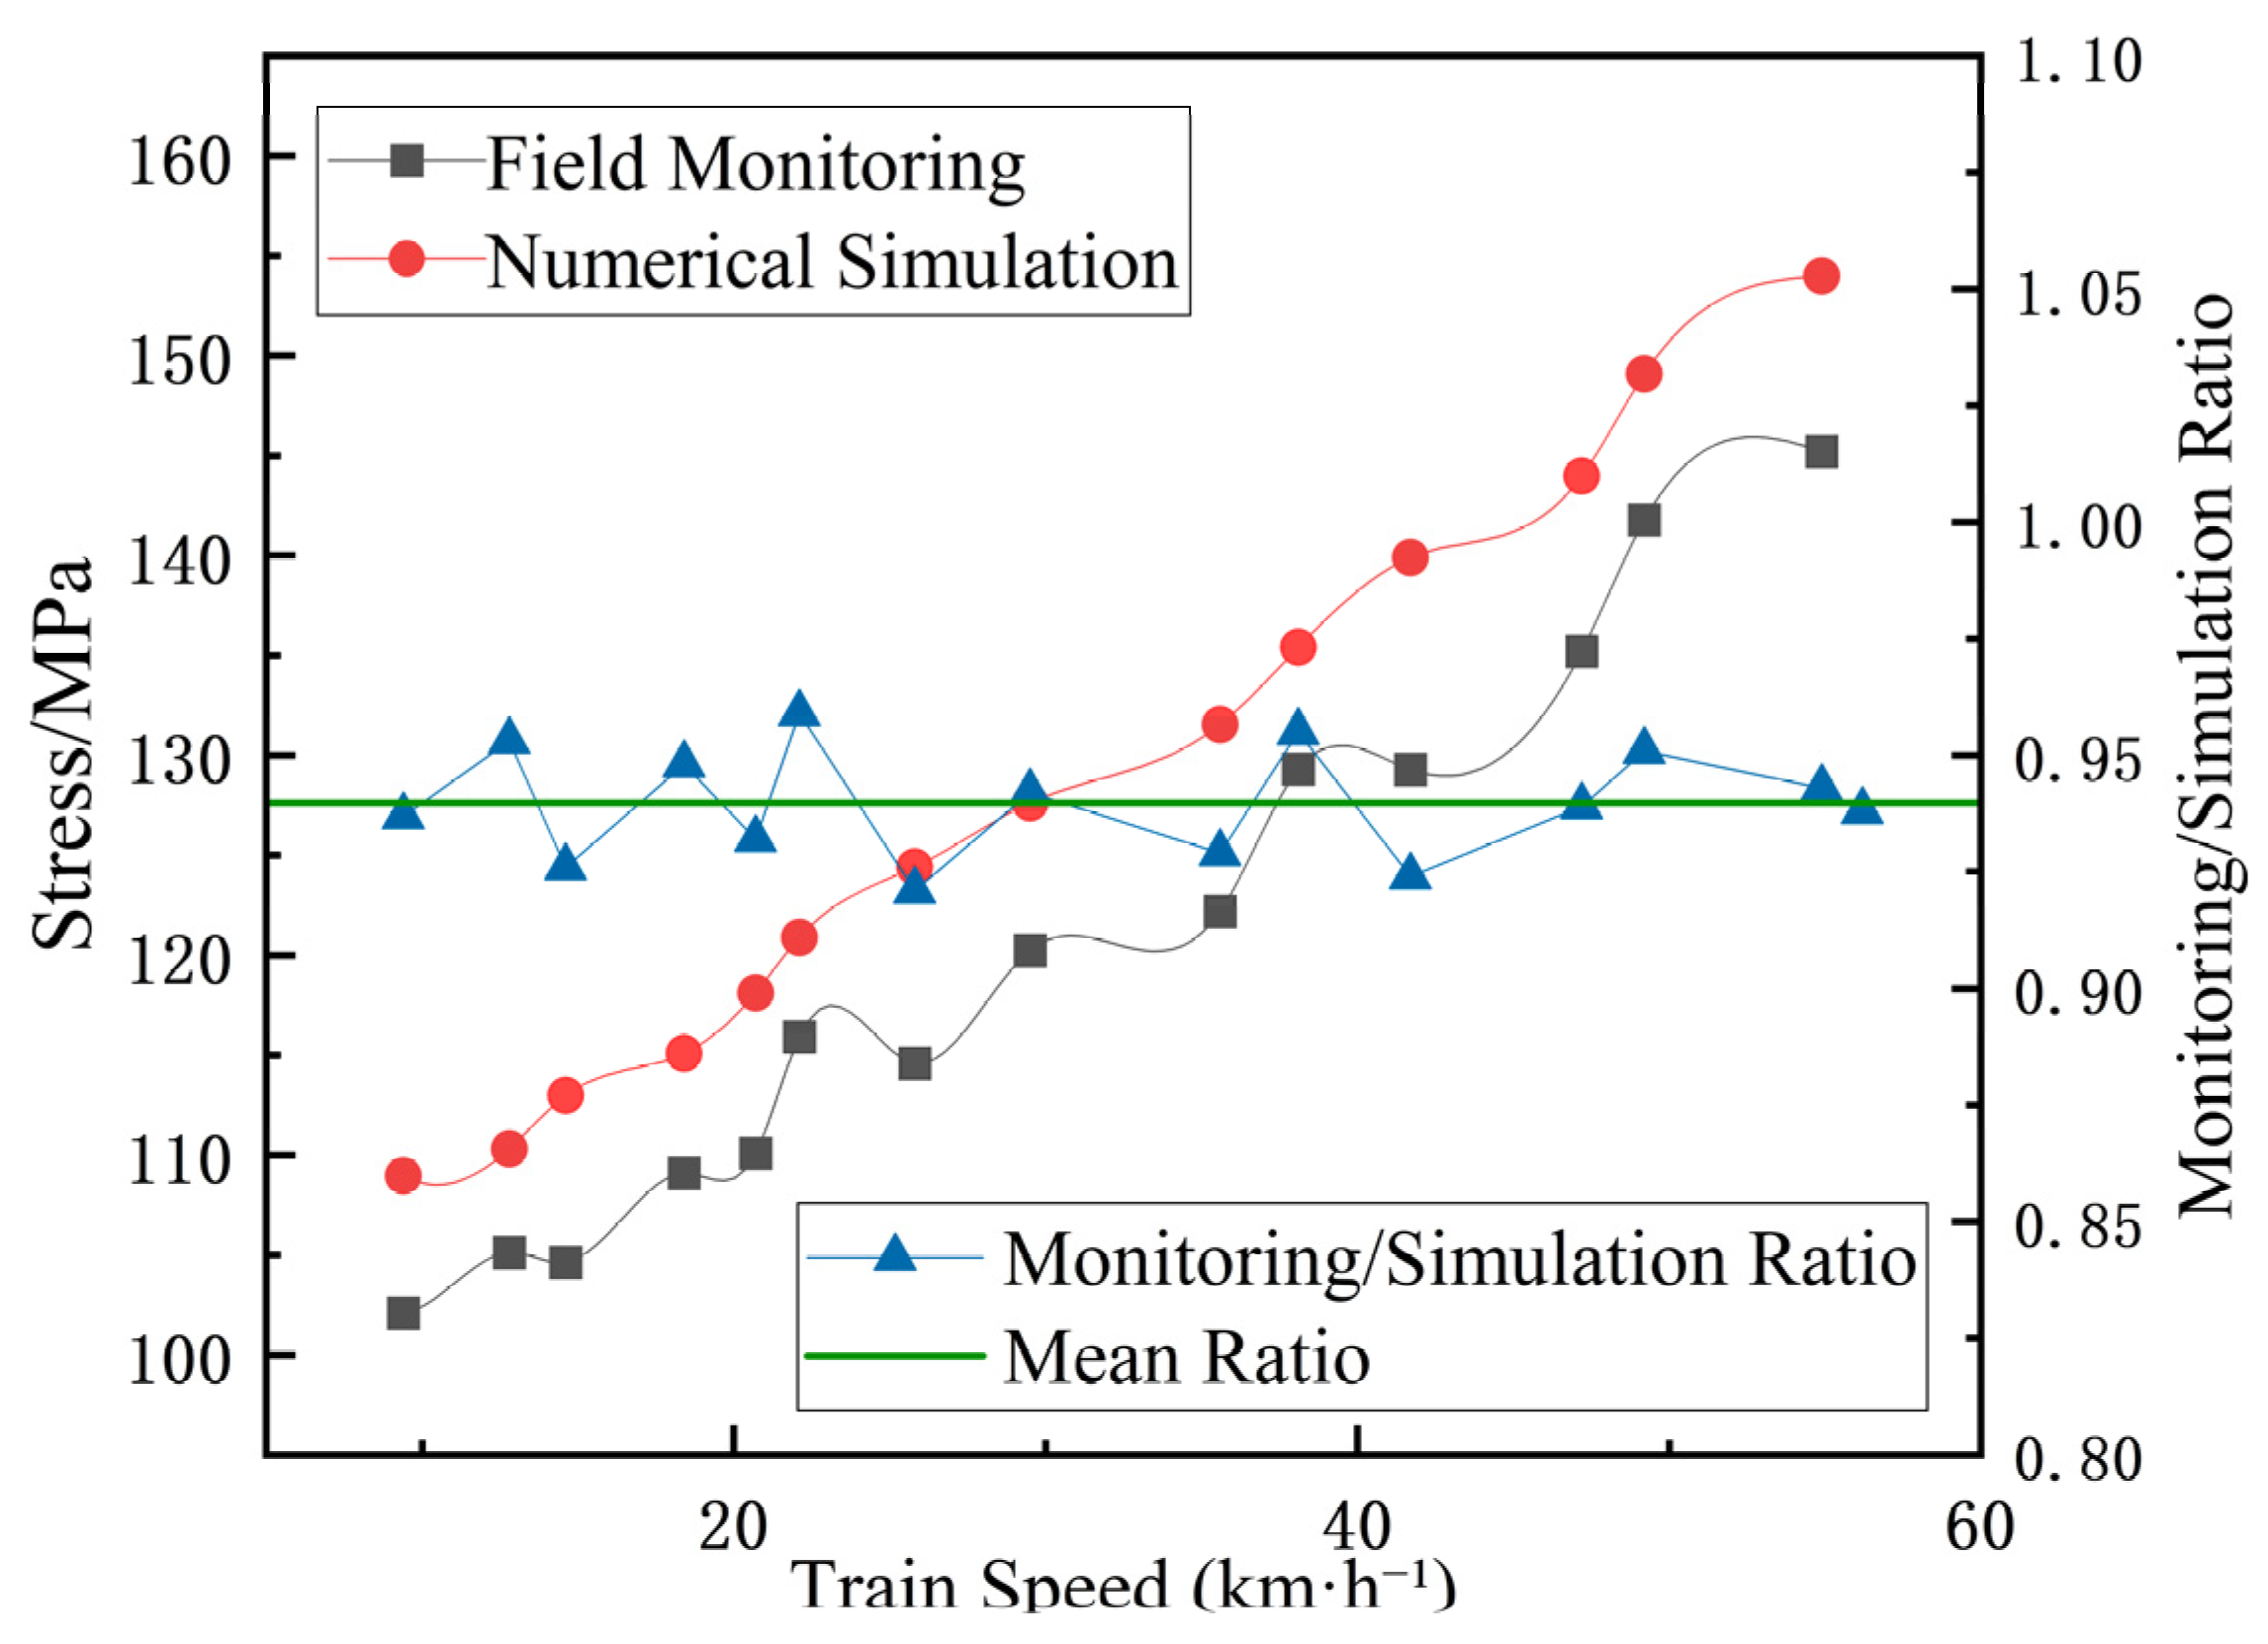
Figure 25 compares the monitored and numerically simulated equivalent stresses of the trestle bridge. For each train speed, the field-monitoring value was divided by the corresponding numerical-simulation value, and the resulting ratios are plotted against the secondary vertical axis. The horizontal line represents the mean ratio for all investigated train speeds. The pointwise ratios remain relatively stable and close to 1.0, with a mean value of approximately 0.94. The numerical simulation therefore captures both the overall stress level and its increasing trend with train speed, although it slightly overestimates the measured stress.
The monitoring-to-simulation ratios in Figure 19, Figure 21, Figure 23 and Figure 25 are generally slightly lower than 1.0, indicating a moderate systematic overprediction by the numerical model. This difference is mainly attributed to the idealized train loading, simplified structural and contact conditions, and uniform material and damping parameters adopted in the model. In the actual structure, joint flexibility, interface slip, construction tolerances, and material heterogeneity provide additional energy dissipation that is not fully represented numerically. Differences between the idealized output locations and the actual sensor positions may also contribute to the discrepancy. Therefore, the model captures the overall response trends but provides slightly conservative predictions.

3.2.6. Comprehensive Evaluation of Structural Response

Based on the comprehensive analysis of the response indicators, train operating speed is an important factor affecting the stress and deformation of the double-arch tunnel lining structure under construction and the trestle bridge. When the train speed was below 30 km/h, the maximum compressive stress of the middle partition wall was approximately 5.32 MPa, the maximum vertical displacement at the left-tunnel invert was approximately 4.93 mm, the maximum horizontal displacement of the middle partition wall was approximately 1.40 mm, and the maximum equivalent stress of the trestle was approximately 117.04 MPa. The overall structural response was relatively gentle. As the operating speed further increased, the vertical displacement of the tunnel and the local stress of the trestle increased more obviously, indicating that the influence of dynamic loading was gradually strengthened.
For the investigated project, a train operating speed of approximately 30 km/h is recommended as a construction-stage operational-control value based on the observed short-term stress and deformation responses. This value is project-specific and should not be interpreted as a general structural safety limit. These results support the use of the temporary trestle as a construction-stage transport measure under controlled-speed operation and continued structural monitoring; however, global stability, buckling, and connection capacity require separate design verification. Meanwhile, the stress and displacement variations of the bottom of the middle partition wall, the arch invert of the left tunnel, the rail wheel-load action region, the mid-span of the trestle top slab, and the components near the main girder supports should be monitored with emphasis. When the monitoring results show a significant acceleration in the increase of stress or displacement, continuous accumulation of peak values within adjacent monitoring periods, or when structural deformation cannot recover to a stable level after train passage, the train operating speed should be reduced in a timely manner, and the trestle connection nodes, rail support conditions, and the initial support state around the middle partition wall should be rechecked.
Compared with previous studies, the engineering significance of this study lies in revealing the asymmetric load-transfer behavior of an unfinished double-arch tunnel under unilateral train operation on a temporary trestle. Accordingly, the loaded-side invert, lower middle partition wall, and trestle wheel-load region should be treated as key monitoring locations. However, the degree of asymmetry is project-specific and requires verification under different tunnel and construction conditions.
The conclusions are based on prescribed excitation-force functions and mainly reflect the short-term speed-dependent response of the investigated tunnel–trestle system. Effects of fully coupled vehicle–track interaction, stochastic track irregularities, component-specific damping, and possible resonance require further investigation.
The recommended 30 km/h speed limit should therefore be regarded as a case-specific engineering control value. For projects with comparable structural, loading, and geological conditions, it may serve only as a preliminary or conservative reference. The allowable speed should be reassessed using project-specific numerical analysis and, where feasible, trial-operation monitoring, particularly for cases involving higher axle loads, weaker surrounding ground, more flexible temporary supports, incomplete support, initial defects, or stricter deformation criteria.

4. Discussion

The observed increase in tunnel stress and deformation with train speed is consistent with previous numerical and experimental studies of train-induced tunnel responses [8,14,15,16,20,21]. Previous studies have also shown that adjacent tunnel structures exhibit coupled responses under moving train loads [14,15]. However, most of these studies considered completed tunnels, conventional track systems, or more symmetric loading conditions. In the present study, the train load acts unilaterally on a temporary trestle inside an unfinished double-arch tunnel, resulting in a more pronounced asymmetric response between the two tunnel bores. In particular, the loaded-side invert, lower middle partition wall, and trestle wheel-load region were identified as the most sensitive locations. These findings extend previous work by describing the short-term load-transfer characteristics of a tunnel–trestle system under construction.
The numerical results should be interpreted considering the adopted constitutive assumptions. The Mohr–Coulomb model does not explicitly represent stress-dependent stiffness, loading–unloading behavior, or cyclic degradation, while the linear-elastic treatment of the primary support and middle partition wall excludes cracking, damage, and progressive residual deformation. The results therefore represent short-term construction-stage responses under these assumptions.
The excitation-force-function method captures the main speed-dependent loading trend but does not explicitly consider fully coupled vehicle–track interaction, wheel–rail force fluctuations, stochastic track irregularities, component-specific damping, or possible resonance. It is therefore more suitable for identifying overall response trends than reproducing local transient fluctuations. Future studies may employ a coupled vehicle–track–trestle–tunnel model with measured track irregularities and calibrated damping.
Although the monitored and numerical responses are largely recoverable after individual train passages, repeated loading may cause fatigue deterioration, stiffness degradation, residual deformation, and crack development. Since these long-term mechanisms are not included, the conclusions are limited to short-term construction-stage behavior, and long-term assessment requires cyclic nonlinear analysis and extended monitoring.

5. Conclusions

To investigate the stress and deformation response characteristics and safety state of double-arch tunnel under construction and a trestle bridge structure subjected to unilateral train loading, a three-dimensional numerical method and in situ monitoring were adopted to analyze the responses at critical structural locations under different train operating speeds. The main conclusions are as follows.
(1)
Under unilateral train loading, the deformation distribution of the tunnel lining changes significantly, and the structure exhibits an overall downward displacement tendency. The vertical deformation of the left and right tunnel bores becomes asymmetrically distributed. For the primary support, except for the relatively large stress variations at the inverts of the left and right tunnel bores, the other positions are only slightly affected.
(2)
The stress in the middle partition wall increases markedly under train loading. The middle partition wall exhibits displacement toward the trestle, and a distinct difference in vertical deformation is observed between the base of the middle partition wall on the left-tunnel side and that on the right-tunnel side. For the investigated tunnel–trestle system, approximately 30 km/h is recommended as a conservative construction-stage operational-control value based on the combined short-term stress and deformation response trends. This value is specific to the present structural, geological, loading, and construction conditions and should not be interpreted as a generally applicable speed limit.
(3)
As the train operating speed increases, the stress–deformation responses of the tunnel lining and trestle structure also increase. Therefore, controlling the train operating speed can serve as an effective measure to mitigate the adverse effects of train loading.
(4)
The tunnel invert and the bottom of the middle partition wall are the most sensitive locations under unilateral train loading. Under the investigated short-term construction-stage conditions, the calculated and monitored responses remained predominantly elastic, with no obvious irreversible deformation during individual train passages. However, long-term effects such as fatigue damage, stiffness degradation, and crack propagation were not evaluated and should be addressed in future studies.
It should be noted that the conclusions are limited to the short-term response of the specific tunnel–trestle system investigated in this study. The quantitative results and recommended operational-control value are therefore project-specific. Future studies should incorporate long-term monitoring, cyclic loading, and nonlinear damage modeling, and consider different geological conditions, tunnel geometries, support systems, and train configurations to evaluate the broader applicability of the findings.

Author Contributions

Conceptualization, methodology, writing—original draft, and funding acquisition, G.Z.; formal analysis, investigation, software, and writing—original draft, Y.S.; writing—review and editing, and funding acquisition, H.Z.; Resources, and validation X.L.; formal analysis, and software, S.L.; methodology, software, writing—review and editing, and funding acquisition, J.L.; and formal analysis, investigation and software, Z.G. All authors have read and agreed to the published version of the manuscript.

Funding

This study is supported by the Tianjin Natural Science Foundation Project (Grant Nos. 25JCQNJC00290, 25JCQNJC00300), and the Natural Science Foundation of China (Grant No. 52578597), which are gratefully acknowledged.

Institutional Review Board Statement

Not applicable.

Informed Consent Statement

Not applicable.

Data Availability Statement

The data presented in this study are available on request from the corresponding author.

Conflicts of Interest

Authors Xiaomin Liu and Zhenzhou Gao were employed by China Construction Sixth Engineering Bureau Co., Ltd. The remaining authors declare that the research was conducted in the absence of any commercial or financial relationships that could be construed as a potential conflict of interest.

References

  1. Qu, S.; Yang, J.; Zhu, S.; Zhai, W.; Kouroussis, G.; Zhang, Q. Experimental study on ground vibration induced by double-line subway trains and road traffic. Transp. Geotech. 2021, 29, 100564. [Google Scholar] [CrossRef] [Scilit]
  2. He, C.; Liu, Y.; Di, H.; Zhang, X.; Zhou, S. Modeling of train-induced environmental vibrations from railway traffic: A state-of-the-art review. Railw. Eng. Sci. 2026, 34, 407–429. [Google Scholar] [CrossRef] [Scilit]
  3. Di, H.; Su, G.; Yu, J.; Xu, Y.; Xu, P.; Zhou, S. Field measurement and evaluation of vibrations inside buildings above metro tunnels. Soil Dyn. Earthq. Eng. 2023, 166, 107767. [Google Scholar] [CrossRef] [Scilit]
  4. Sang, B.; Yan, C.; Wang, C.; Qu, X. Study on dynamic response and long-term settlement of silty soil around Shanghai metro tunnel. Sci. Rep. 2024, 14, 9172. [Google Scholar] [CrossRef] [Scilit]
  5. Liu, Y.K.; Deng, E.; Yang, W.C.; Ni, Y.Q.; Zhou, Z.; Zhang, J.J. Aerodynamic intensification effect and dynamic response of cracks on high-speed railway tunnel linings. Tunn. Undergr. Space Technol. 2023, 140, 105308. [Google Scholar] [CrossRef] [Scilit]
  6. Wang, T.T.; Chiu, Y.C.; Li, K.J. Index for assessing spalling in tunnel lining based on displacement monitoring and crack mapping. Tunn. Undergr. Space Technol. 2024, 153, 105975. [Google Scholar] [CrossRef] [Scilit]
  7. Zhao, C.; Lei, M.; Jia, C.; Wu, C.; Yang, Z.; Shi, Y. Influence mechanism of initial mechanical damage on concrete permeability and tunnel lining leakage. Eng. Fract. Mech. 2024, 310, 110531. [Google Scholar] [CrossRef] [Scilit]
  8. Hu, J.; Bian, X. Experimental and numerical studies on dynamic responses of tunnel and soils due to train traffic loads. Tunn. Undergr. Space Technol. 2022, 128, 104628. [Google Scholar] [CrossRef] [Scilit]
  9. Ding, Z.; Huang, X.; Sun, M.M.; Xu, L.Y.; Huang, Z.G.; Zhou, Q.H. Experimental study on the influence of cracks on tunnel vibration under subway train load. Tunn. Undergr. Space Technol. 2023, 142, 105444. [Google Scholar] [CrossRef] [Scilit]
  10. Guo, W.; Yang, W.; Qian, Z.; Yang, L.; He, C.; Qu, S. The effect of internal structure on dynamic response of road-metro tunnels under train vibration loads: An experimental study. Tunn. Undergr. Space Technol. 2023, 138, 105182. [Google Scholar] [CrossRef] [Scilit]
  11. Zhang, K.; Xie, H.; Guo, W.; Zhou, C.; Hu, G.; Luo, J.; Qiu, J.; Zhu, J. Experimental study on dynamic response of rock tunnel subjected to train moving load. Geomech. Geophys. Geo-Energy Geo-Resour. 2023, 9, 125. [Google Scholar] [CrossRef] [Scilit]
  12. Li, L.; Cheng, L.; Liu, W.; Yu, X. Train-induced response of stiffness-degraded tunnel linings. Tunn. Undergr. Space Technol. 2024, 148, 105739. [Google Scholar] [CrossRef] [Scilit]
  13. Liu, Y.K.; Wang, Y.L.; Deng, E.; Ni, Y.Q.; Yang, W.C.; Ao, W.K. Characteristics of the crack tip field in high-speed railway tunnel linings under train-induced aerodynamic shockwaves. Undergr. Space 2024, 18, 199–217. [Google Scholar] [CrossRef] [Scilit]
  14. Zhou, Y.; Yang, W.; Yao, C.; Xu, Z. Centrifuge modelling of the dynamic response of twin tunnels under train-induced vibration load. Soil Dyn. Earthq. Eng. 2024, 185, 108908. [Google Scholar] [CrossRef] [Scilit]
  15. Hu, Y.; Tang, H.; Xu, Y.; Lei, H.; Lu, J.; Chen, X.; Gao, Z. Effect of moving train load on ground movement and tunnel deformation due to stacked shield tunnelling. Soil Dyn. Earthq. Eng. 2024, 187, 108992. [Google Scholar] [CrossRef] [Scilit]
  16. Chen, Z.P.; Zang, Y.W.; Yang, Z.X.; Xu, R.Q.; Gong, X.N.; Yan, J.J.; Wang, J.C. Analytical solution for longitudinal dynamic response of shield tunnel linings using the state-space method. Comput. Geotech. 2024, 169, 106104. [Google Scholar] [CrossRef] [Scilit]
  17. Ma, M.; Xu, L.; Liu, W.; Tan, X. Semi-analytical solution of a coupled tunnel-soil periodic model with a track slab under a moving train load. Appl. Math. Model. 2024, 128, 588–608. [Google Scholar] [CrossRef] [Scilit]
  18. Hou, R.; Li, T.; Zhang, Z.; Li, L.; Liu, B.; Ren, D. Experimental study on modal analysis and vibration response of tunnel structures under different damage conditions due to subway train loads. Sci. Rep. 2025, 15, 3022. [Google Scholar] [CrossRef] [Scilit]
  19. Yang, L.; Yang, W.; Zhou, Y.; Chen, Z.; Yao, C. An experimental study of the influence of local segment damage on dynamic response characteristics of shield tunnels. Tunn. Undergr. Space Technol. 2025, 166, 106976. [Google Scholar] [CrossRef] [Scilit]
  20. Castellini, F.; Faccini, L.; Collina, A. On the vibration induced by train operations in tunnels: A comparative study of different track systems through experiments and numerical simulations. Int. J. Rail Transp. 2026, 14, 136–152. [Google Scholar] [CrossRef] [Scilit]
  21. Qu, X.; Thompson, D.J.; Ntotsios, E.; Squicciarini, G. Assessing the impact of building foundations located in the transmission path on train-induced ground vibration using a hybrid computational model. Railw. Eng. Sci. 2026, 1–17. [Google Scholar] [CrossRef] [Scilit]
  22. Reumers, P.; Degrande, G.; Lombaert, G.; Thompson, D.J.; Ntotsios, E.; Bouvet, P.; Nélain, B.; Nuber, A. Integration of a hybrid vibration prediction model for railways into noise mapping software: Methodology, assumptions and demonstration. Railw. Eng. Sci. 2025, 33, 1–26. [Google Scholar] [CrossRef] [Scilit]
  23. ISO 14837-1:2005; Mechanical Vibration—Ground-Borne Noise and Vibration Arising from Rail Systems—Part 1: General Guidance. ISO: Geneva, Switzerland, 2005.
  24. ISO/TS 14837-34:2024; Mechanical Vibration—Ground-Borne Noise and Vibration Arising from Rail Systems—Part 34: Characterizing Irregularity of the Running Surfaces with Respect to Vibration Excitation. ISO: Geneva, Switzerland, 2024.
  25. Jin, Z.; Zhang, W.; Li, Y.; Geng, X. Numerical studies of ballastless track-embankment vibrations considering track irregularities. Transp. Geotech. 2025, 51, 101536. [Google Scholar] [CrossRef] [Scilit]
  26. Wang, D.; Luo, J.; Li, F.; Wang, L.; Su, J. Research on dynamic response and fatigue life of tunnel bottom structure under coupled action of train load and groundwater. Soil Dyn. Earthq. Eng. 2022, 161, 107405. [Google Scholar] [CrossRef] [Scilit]
  27. Xu, L.; Ma, M. Dynamic response of the multilayered half-space medium due to the spatially periodic harmonic moving load. Soil Dyn. Earthq. Eng. 2022, 157, 107246. [Google Scholar] [CrossRef] [Scilit]
  28. Yuan, Z.; Cao, Z.; Tang, H.; Xu, Y.; Wu, T. Analytical layer element with a circular cavity and its application in predicting ground vibrations from surface and underground moving sources. Comput. Geotech. 2021, 137, 104262. [Google Scholar] [CrossRef] [Scilit]
  29. Assarkhaniki, Z.; Sabri, S.; Rajabifard, A.; Kahalimoghadam, M. Advancing sustainable development goals: Embedding resilience assessment. Sustain. Sci. 2023, 18, 2405–2421. [Google Scholar] [CrossRef] [Scilit]
  30. Liu, Z.; Xia, H.; Zhang, T. A review of research methods on the coupling relationship between urban rail transit and urban space: Revealing spatiotemporal relationships through big data. Int. J. Digit. Earth 2024, 17, 2339363. [Google Scholar] [CrossRef] [Scilit]
Figure 1. Tunnel section design (unit: mm).
Applsci 16 08639 g001
Figure 2. Project overview of the tunnel lining structure and the trestle bridge.
Applsci 16 08639 g002
Figure 3. Three-dimensional numerical model. (a) Global numerical model. (b) Trestle and track Model. (c) Tunnel reinforcement model.
Applsci 16 08639 g003
Figure 4. Locomotive operation simulation.
Applsci 16 08639 g004
Figure 5. Layout of typical monitoring sections and points. (a) Monitoring section. (b) Key monitoring points.
Applsci 16 08639 g005
Figure 6. Compressive stress for tunnel structure with speed of 70 km/h.
Applsci 16 08639 g006
Figure 7. Compressive stress of tunnel structure with speed of 70 km/h. (a) Left tunnel bore. (b) Right tunnel bore. (c) Middle partition wall.
Applsci 16 08639 g007
Figure 8. Compressive stress of tunnel structure with different speeds. (a) Left tunnel bore. (b) Right tunnel bore. (c) Middle partition wall.
Applsci 16 08639 g008
Figure 9. Deformation of tunnel structure with speed of 70 km/h. (a) Horizontal deformation; (b) Vertical deformation.
Applsci 16 08639 g009
Figure 10. Deformation of tunnel structure with speed of 70 km/h. (a) Left tunnel bore horizontal deformation. (b) Right tunnel bore horizontal deformation. (c) Middle partition wall horizontal deformation. (d) Left tunnel bore vertical deformation. (e) Right tunnel bore vertical deformation. (f) Middle partition wall vertical deformation.
Applsci 16 08639 g010
Figure 11. Deformation of tunnel structure with different speeds. (a) Left tunnel bore horizontal deformation. (b) Right tunnel bore horizontal deformation. (c) Middle partition wall horizontal deformation. (d) Left tunnel bore vertical deformation. (e) Right tunnel bore vertical deformation. (f) Middle partition wall vertical deformation.
Applsci 16 08639 g011
Figure 12. Stress results of trestle bridge with speed of 70 km/h.
Applsci 16 08639 g012
Figure 13. Deformation of trestle bridge under train speed of 70 km/h. (a) Horizontal deformation. (b) Vertical deformation.
Applsci 16 08639 g013
Figure 14. Tunnel stress and displacement monitoring devices. (a) Vibrating wire displacement transducer. (b) LVDT displacement transducer.
Applsci 16 08639 g014
Figure 15. Trestle bridge stress monitoring devices. (a) Strain gauge. (b) Strain data acquisition system.
Applsci 16 08639 g015
Figure 16. Layout of monitoring points on tunnel lining structure.
Applsci 16 08639 g016
Figure 17. Monitoring points on trestle bridge.
Applsci 16 08639 g017
Figure 18. Compressive stress monitoring data.
Applsci 16 08639 g018
Figure 19. Comparison of the monitored and numerically simulated structural stresses and the corresponding monitoring-to-simulation ratios.
Applsci 16 08639 g019
Figure 20. Vertical deformation monitoring data.
Applsci 16 08639 g020
Figure 21. Comparison of the monitored and numerically simulated vertical deformations and the corresponding monitoring-to-simulation ratios.
Applsci 16 08639 g021
Figure 22. Horizontal deformation monitoring data.
Applsci 16 08639 g022
Figure 23. Comparison of the monitored and numerically simulated horizontal deformations and the corresponding monitoring-to-simulation ratios.
Applsci 16 08639 g023
Figure 24. Stress monitoring data of trestle bridge.
Applsci 16 08639 g024
Figure 25. Comparison of the monitored and numerically simulated trestle-bridge stresses and the corresponding monitoring-to-simulation ratios.
Applsci 16 08639 g025
Table 1. Physical and mechanical parameters of soil layer around the mining tunnel.
Ground Strataγ/ ( k N · m 3 ) ES/MPaCu/kPaφDepth/m
Fill Soil17.85.20151.5
Pebble Layer23.5540338.9
Loess17.25.57125.9
Sandstone22.7365237.4
Sandstone24.15752516.3
Table 2. Model material parameters.
Structureγ/( k N · m 3 ) E/GPaPoisson’s Ratio
Primary Support of the Mined Tunnel2223.50.2
Middle Partition Wall of the Mined Tunnel2230.50.2
Primary Support Reinforcement782100.25
Middle Partition Wall Reinforcement782100.25
Lightweight Steel Rail Track782100.25
Trestle Support Frame782100.25
Disclaimer/Publisher’s Note: The statements, opinions and data contained in all publications are solely those of the individual author(s) and contributor(s) and not of MDPI and/or the editor(s). MDPI and/or the editor(s) disclaim responsibility for any injury to people or property resulting from any ideas, methods, instructions or products referred to in the content.