Article

Effect of Infill Pattern, Density, and Orientation on the Mechanical and Surface Characteristics of MEX-Printed PLA Samples for Casting-Pattern Applications

by
Gulim Tattimbetova
1,*,
Oleksandr Kapustynskyi
2,*,
Asset Rakishev
1,
Jelena Škamat
3 and
Gulnara Zhetessova
1
1
Department of Technological Equipment, Mechanical Engineering and Standardization, Abylkas Saginov Karaganda Technical University, Karaganda 100012, Kazakhstan
2
Department of Mechanics and Material Engineering, Vilnius Gediminas Technical University, Plytines g. 25, LT-10105 Vilnius, Lithuania
3
Laboratory of Composite Materials, Vilnius Gediminas Technical University, Saulėtekio al. 11, LT-10223 Vilnius, Lithuania
*
Authors to whom correspondence should be addressed.
Appl. Sci. 2026, 16(17), 8538; https://doi.org/10.3390/app16178538
Submission received: 21 June 2026 / Revised: 25 August 2026 / Accepted: 26 August 2026 / Published: 27 August 2026

Abstract

Material extrusion (MEX) enables rapid fabrication of single-use polymer casting patterns for foundry and mechanical engineering applications, where handling strength and surface texture are critical. This study examines how infill pattern, density, and orientation affect the mechanical and surface properties of samples printed from ELEGOO PLA on a Bambu Lab A1 using Bambu Studio 2.5.0. Two infill types (triangle, grid), two densities (50%, 70%), and five orientations were evaluated via uniaxial tension, fixed-deflection three-point bending, line-profile and areal surface texture measurements, and SEM fracture analysis. Tensile strength ranged from 23.60 to 29.19 MPa. Raising infill density from 50% to 70% increased mean tensile strength from 24.62 to 27.65 MPa. The highest tensile strength, 29.19 MPa, occurred for a 70% grid infill at 75° orientation; the highest bending load at 4 mm midspan deflection, 107.97 N, occurred for a 70% grid infill at 15°. Across the descriptive surface dataset, differences among the top, side, and bottom surfaces were greater than the variations associated with infill orientation. Top, side, and bottom surfaces formed via different mechanisms; the relatively high bottom-surface roughness arose from replication of the textured PEI build plate. The selected lower-density fracture surfaces exhibited more pronounced visible gaps and inter-bead discontinuities in the SEM images. Within the tested range, the 70% grid infill produced the best overall mechanical performance. These findings are specific to the ELEGOO PLA–Bambu Lab A1–Bambu Studio 2.5.0 system and should not be interpreted as intrinsic PLA properties, used for direct cross-material benchmarking, or assumed to represent behavior under industrial foundry conditions. Instead, they provide system-specific screening data for selecting candidate infill configurations and for the subsequent evaluation of this commercial MEX printing platform for producing single-use polymer casting patterns for complex-geometry components in mechanical engineering under representative foundry conditions.

1. Introduction

Material extrusion (MEX), commonly referred to in the literature and commercial practice, and the terminology used by filament-based desktop printers and slicing software for fused deposition modeling or fused filament fabrication (FDM/FFF), is an additive manufacturing process in which polymer parts are produced by depositing material layer by layer according to a CAD model [1,2,3,4,5]. In accordance with ISO/ASTM 52900:2021 [1], the standardized term MEX is used throughout the remainder of this manuscript. The quality and performance properties of the parts produced by the MEX method are significantly determined by the manufacturing parameters (layer height, speed, extrusion temperature, infill, wall thickness, etc.); by varying these parameters, it is possible to adjust the mechanical properties and performance specifications of the products, ensuring the required levels of strength, stiffness, and reliability [6].
The material most commonly used for MEX printing is polylactic acid (PLA), due to its high manufacturability and printing reliability [7]. At the same time, the mechanical properties of 3D-printed PLA samples largely depend on the part’s internal structure and the quality of layer-to-layer adhesion, making it important to analyze how infill patterns and printing parameters affect tensile properties [8,9]. PLA should not be regarded as a mechanically invariant material category. Commercial filaments distributed under the generic PLA designation can differ substantially in polymer feedstock, molecular architecture, additive packages, colorants, moisture exposure history, and filament-production parameters. Schwartz et al. documented pronounced variation in the mechanical response of 11 commercially available PLA filaments [10]. In a related study, Hodžić et al. showed that PLA filaments from different manufacturers exhibited yield-strength differences of approximately 33%, even when samples of identical color were produced using the same printer and nominally identical processing conditions [11]. Accordingly, quantitative results reported across different investigations should be compared only with great caution, unless filament formulation, printer model, slicing software and settings, sample orientation, print speed, thermal boundary conditions, layer height, wall or shell configuration, and mechanical testing protocol are all closely harmonized. Cross-study comparisons can therefore reveal overarching trends, but they do not, in general, establish strict equivalence among materials, printing conditions, or printer systems. In particular, the study by [12] demonstrates that infill pattern and density directly influence tensile strength and enable selection of the required strength level given the product’s mass and material consumption; the study also highlights the advantage of the honeycomb pattern among the options considered.
Related findings are supported by studies focused on statistical experimental design and quantitative assessment of the contribution of various factors. In article [13], tensile tests on PLA samples are conducted in accordance with ASTM D638-14 [14], and the influence of infill pattern, infill density, and filler cell orientation is investigated using a design-of-experiments (DOE) approach (Minitab 2020). The authors highlight that infill density is the most significant factor (linearly increasing mechanical properties). At the same time, cell orientation and infill type also play significant roles in determining yield strength.
Together with DOE, the Taguchi approach is widely used to identify dominant factors and derive practical recommendations when the number of experiments is limited. Article [15] investigates the parameters of print speed, fill percentage, layer thickness, and line width. It is shown that the fill ratio significantly affects tensile strength. In contrast, layer thickness dominates the effect on relative elongation at break, underscoring the multi-criteria nature of selecting printing modes that balance strength and ductility.
For constructing predictive models and optimizing parameter sets, regression and multi-criteria approaches are also applicable. Ref. [16] investigates the influence of printing parameters on mechanical properties (including tensile properties) and uses response surface methodology (RSM)/regression and a desirability function to select optimal settings, including the fill percentage. It is noted that the fill ratio has the greatest effect on tensile and fixed-deflection bending response, and validation experiments confirm the identified settings.
It is important to note that mechanical properties can be controlled not only by adjusting the infill percentage but also by “enhancing” the internal print paths. Ref. [17] demonstrates that combining the infill density, the type of infill, and the infill line multiplier allows for comparable strength with lower material consumption and weight. Increasing the line multiplier improves mechanical properties, which is attributed to improved interlayer bonding with “wider” infill lines; it is also emphasized that this approach may be more advantageous than a uniform increase in infill in terms of print time.
Although most of the studies cited were conducted on PLA, a similar trend is observed for high-performance polymers, such as polyethylene terephthalate (PET) and polyethylene terephthalate glycol-modified (PETG): an increase in infill density leads to higher strength and stiffness. Still, it is accompanied by a decrease in ductility and fracture energy. For example, ref. [18] uses polyether ether ketone (PEEK) to demonstrates the broader relevance of internal fill structure to the mechanical behavior of material-extrusion parts.
The article in [19] presents an experimental study on the influence of printing direction on the mechanical properties of cylindrical samples manufactured by MEX. The samples were made from acrylonitrile butadiene styrene (ABS) P430 material and placed on the machine platform at different angles (0°, 45°, 90°) to the printing direction. Stress relaxation tests were conducted under uniaxial compression in accordance with ISO 3384:1 [20]. The results show that the printing direction significantly affects the rheological properties of the samples, particularly the elastic moduli E and E1 in the Standard I rheological model. Samples printed at a 0 ° angle exhibited the highest values of these moduli, while samples at 45° had the lowest. The viscosity parameter was less affected by the printing direction.
For practical applications, filament-based MEX offers a significant advantage for foundry production: the ability to rapidly manufacture parts with complex geometries without the need to develop traditional pattern tools. In casting technologies, this allows for the production of a single-use polymer casting pattern directly from CAD data, reducing production preparation time and simplifying the fabrication of models with complex geometries. PLA is widely used as the material for such models due to its affordability and printing stability.
In foundry applications, surface texture represents a critical functional attribute rather than a purely visual or secondary quality characteristic. The topography of a 3D-printed casting pattern may be reproduced by the molding material or investment shell and subsequently transferred to the final casting, thereby influencing surface finish, dimensional accuracy, and the extent of post-processing required. Nguyen et al. demonstrated that an increase in the surface roughness of 3D-printed patterns leads to a corresponding increase in the surface roughness of cast components produced via the investment casting route. Consequently, the surface quality of a printed pattern must be evaluated in conjunction with its mechanical integrity. This consideration is particularly relevant for material extrusion (MEX) processes, in which the top, side, and bottom surfaces of printed components are formed by distinct mechanisms and can therefore exhibit markedly different surface topographies [21].
Despite substantial research on the effects of MEX printing parameters on the strength of PLA samples, the practical challenge of manufacturing disposable casting patterns requires confirming that these patterns maintain sufficient mechanical integrity during the molding stages. During mold preparation, the model is subjected to stresses during removal and trimming, assembly, transportation, and compaction of the molding compound; the most vulnerable areas in this process are thin sections and stress concentration zones. In this regard, tensile testing of standard samples is considered a fundamental and reproducible method for quantitatively assessing material strength and interlayer adhesion quality, as well as for justifying the selection of printing parameters for the use of MEX polymers as casting patterns.
Previous investigations have examined various facets of the interdependence between material extrusion (MEX) processing conditions, mechanical performance, and surface integrity. Lalegani Dezaki et al. analyzed the influence of infill parameters on the tensile strength and surface roughness of PLA samples [22]. Sedlák et al. characterized the top, lateral, and bottom surfaces of polymer components produced by filament-based additive manufacturing using both profile-based and areal surface roughness metrics [23]. Saharudin et al. demonstrated that reliance on a single Ra parameter is inadequate for a comprehensive characterization of surface texture [24], while Zhu et al. emphasized the necessity of treating up-skin, down-skin, and side surfaces as distinct entities in polymer additive manufacturing [25]. However, only a limited number of studies concurrently employ the profile parameters Ra, Rq, and Rz together with the areal parameters Sa, Sq, and Sz across all three characteristic surface orientations, while simultaneously assessing tensile response, fixed-deflection bending behavior, and scanning electron microscopy (SEM) fracture morphology within a single, consistent factorial printing design.
Although the influence of infill density, infill pattern, and infill direction on the mechanical properties of PLA printed by MEX has been widely studied, most previous studies have examined tensile properties, bending properties, surface quality, or fracture morphology in isolation. As a result, the question of how the same set of printing parameters simultaneously affects tensile response, fixed-deflection bending behavior, surface formation, and fracture morphology remains understudied. This gap is particularly important for disposable casting-pattern applications, where the printed PLA part must combine sufficient handling strength with acceptable surface quality and controlled material consumption.
The scientific hypothesis of this study is that infill density, infill structure, and infill direction affect various properties of PLA parts through distinct mechanisms. The infill density would primarily control the effective strength cross-section and the amount of free space; the infill pattern could affect stress transfer and crack propagation. In contrast, the infill direction might primarily affect behavior through its interaction with the selected infill topology and the load direction. At the same time, surface roughness was expected to depend not only on the infill’s internal structure but also on the conditions of surface formation, including contact with the build plate and layer-by-layer deposition.
Therefore, the principal original contribution of this study lies in the comprehensive and integrated assessment of tensile strength, fixed-deflection bending behavior, profile and areal surface topography, and fracture morphology for an identical set of MEX-fabricated PLA configurations. The concurrent use of the roughness parameters Ra, Rq, and Rz, together with the areal parameters Sa, Sq, and Sz, on the top, side, and bottom surfaces supports a differentiated comparison between trends associated with internal architecture and those associated with the surface-formation mechanisms.
The objective of the present study is to conduct a controlled, system-specific evaluation of the effects of infill pattern, infill density, and infill orientation within a single commercial material extrusion (MEX) printing configuration, comprising ELEGOO PLA feedstock, a Bambu Lab A1 printer, and Bambu Studio slicing software. The study is not designed to compare PLA with other polymer classes, to establish a performance hierarchy among PLA manufacturers, or to derive material-agnostic process parameters. Instead, it aims to generate experimental screening data for a commercially available desktop MEX platform that can subsequently be examined with respect to its suitability for low-volume production of single-use or sacrificial casting patterns under representative foundry conditions.

2. Materials, Equipment, Procedures, and Testing Methodology

To ensure reproducibility, this study details the materials, printing parameters, sample preparation, testing protocols, and statistical approaches used. The following subsections describe the fabrication of the MEX-printed PLA samples, the tensile and fixed-deflection bending tests, surface texture characterization, SEM-based fracture analysis, and the statistical assessment of the tensile data.

2.1. Materials and Fabrication Methods

In this investigation, commercially available Elegoo PLA (Shenzhen Elegoo Technology Co., Ltd., Shenzhen, China) 3D MEX-printed material (1.75 mm diameter) was used (Table 1). The samples were manufactured using filament-based desktop material extrusion (MEX), following the process terminology defined in ISO/ASTM 52900. SOLIDWORKS Student Edition 2025 SP2.0 was used to design dogbone samples for the tensile test and rectangular form samples for the bending test. The developed stereolithography (STL) files were imported into Bambu Studio 2.5.0 to slice the sample. This program managed and monitored print progress, queued prints, and handled various material allocations. The samples were printed on a commercial Bambu Lab A1 (Shenzhen, China) printer using a 0.4 mm nozzle (Table 2). Custom printing settings were used to give the printing program more control, allowing the printer to define parameters such as line multiplier, pattern, and infill ratios. Perimeters—2. Top and bottom surface pattern—monotone. Solid layers on top and bottom—3. Print speed for the first layer: 50 mm/s; print speed for other layers: outer perimeters—200 mm/s, inner perimeters—300 mm/s. Build plate temperature: 65 °C. Nozzle temperature: 220 °C. Layer height: 0.2 mm. Layer width: 0.42 mm. Infill overlap: 15%. All samples were printed using the standard Bambu Studio profile selected for PLA on the Bambu Lab A1 printer. Only the investigated infill parameters were changed between sample prints, namely infill pattern, infill density, and infill direction. All other printing parameters were kept constant across all samples to ensure that the observed differences in mechanical response and surface morphology were attributable to the selected infill parameters rather than to changes in overall printing conditions. Samples were printed and stored under laboratory conditions of approximately 21 °C and 40% relative humidity (RH) before testing.
All samples were fabricated using a single, commercially available ELEGOO PLA filament, a Bambu Lab A1 printer equipped with a 0.4 mm nozzle, a textured PEI build plate, and an identical Bambu Studio software version and baseline slicing profile. The use of a unified, tightly controlled material–printer–slicer configuration enhances the internal validity of the factorial comparison, as the observed differences can be attributed predominantly to the infill parameters under investigation. However, this approach concurrently constrains the external validity of the findings: the measured mechanical and surface properties should not be generalized as representative of all PLA filaments or all MEX systems.
The combination of ELEGOO PLA and the Bambu Lab A1 platform was selected as a commercially accessible candidate system for prospective low-volume production of single-use casting patterns. The present investigation, which is based on standardized sample geometries, does not constitute a validation of performance under industrial foundry conditions. Such validation would require trials employing representative pattern geometries, quantitative assessment of dimensional stability, systematic evaluation of handling and molding behavior, analysis of pattern removal or burnout characteristics, and direct characterization of surface replication fidelity in both the mold and the final casting.
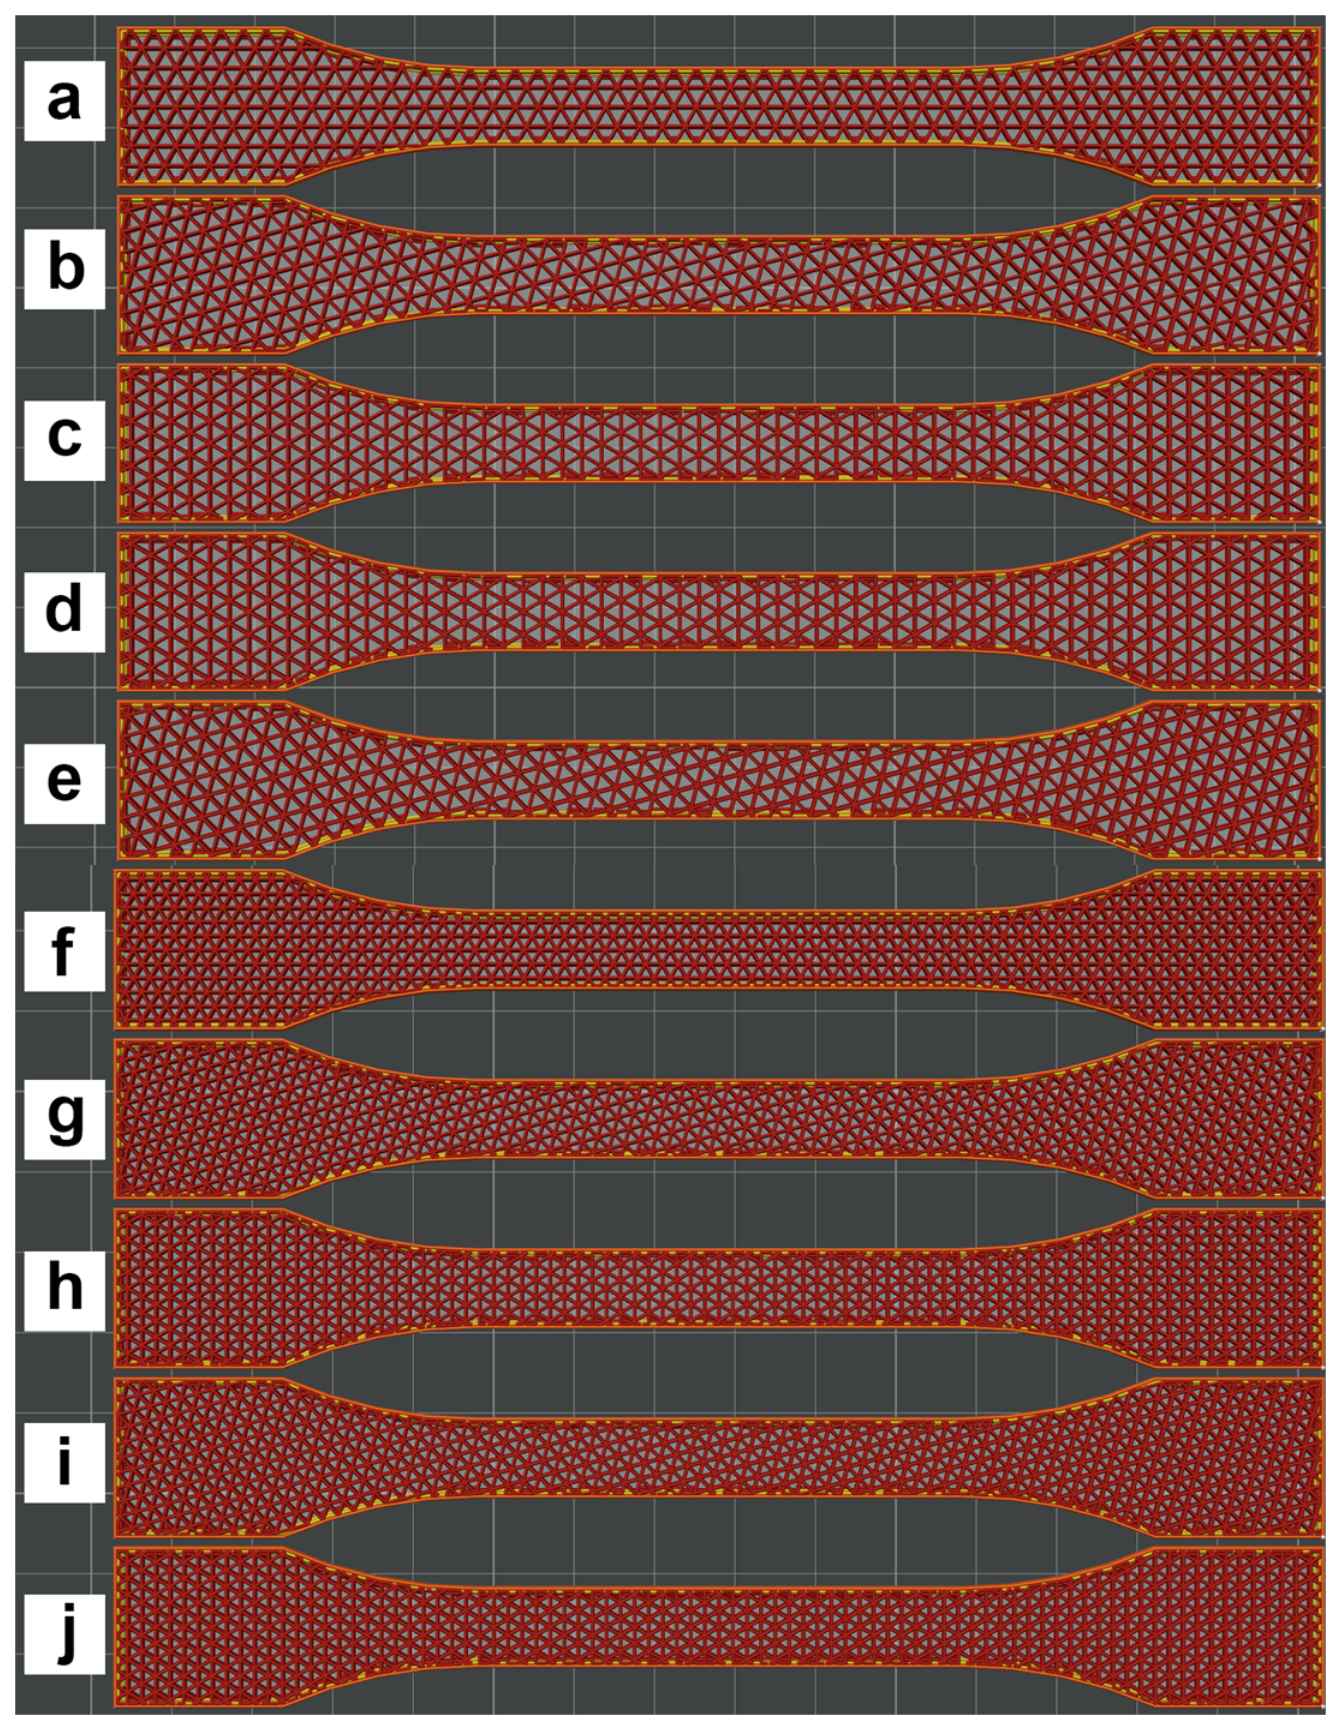
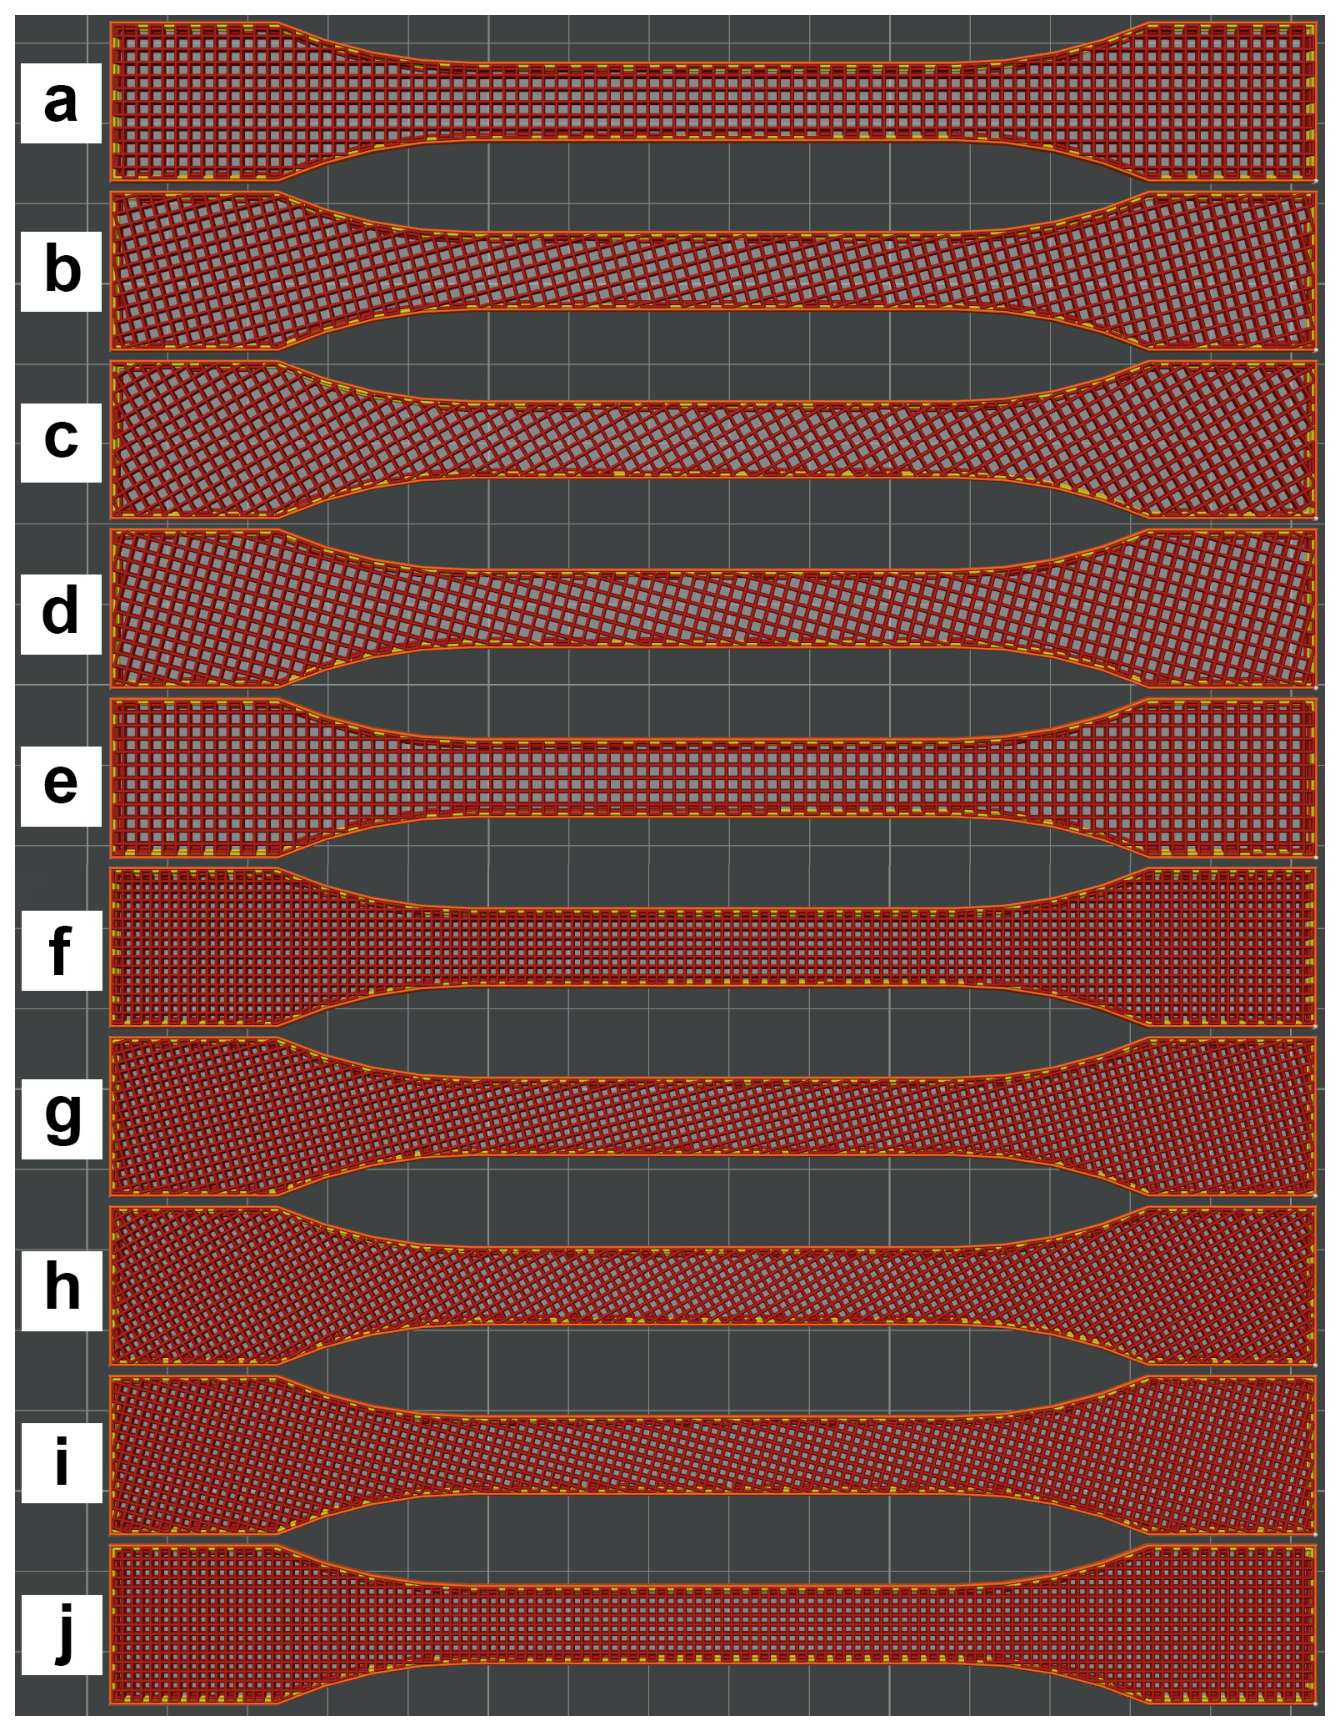
The experimental design employed a balanced three-factor arrangement to systematically assess the influence of infill pattern, infill density, and infill orientation on tensile strength, as well as to comparatively analyze the corresponding fixed-deflection bending response, surface topography, and fracture morphology of PLA samples fabricated via material extrusion (MEX) additive manufacturing. Figure 1 and Figure 2 and Table 3 summarize various printing parameters employed during sample printing. A total of 120 samples were printed: 3 samples for each sample category for tensile testing and 3 samples for each sample category for bending testing.
Infill densities of 50% and 70% were chosen to represent medium and high levels of partial infill relevant to single-use casting patterns. These applications demand a compromise between adequate strength and stiffness and factors such as material usage, 3D printing time, component weight, and the need for later removal or burnout of the model. A fully solid 100% infill was excluded because the aim of this work was not to establish a baseline for solid material, but to evaluate how practical, partially infilled PLA structures perform as a function of their internal architecture. Moreover, using 100% infill would largely diminish the contribution of the internal open structure and make the effects of geometry and infill orientation less representative of lightweight, disposable model applications. Consequently, the investigation was restricted to a partial infill range of 50–70%, while incorporating fully solid samples is identified as a potential direction for subsequent studies.
The selected infill patterns were used to evaluate the sensitivity of the mechanical response to the orientation of the internal tool path—as specified by the slicer software—relative to the sample axis. The angles included the reference orientation, slight and moderate rotations, a significantly off-axis orientation, and an orthogonal orientation. Although an ideal infinite rectangular grid may be geometrically similar after a 90° rotation, actual MEX-printed samples have finite dimensions and include perimeter walls, intersections between the path and wall sections, and software-defined toolpath chamfers. Therefore, the infill direction was retained as a processing parameter to assess whether these orientation-dependent features affect the mechanical response of the 3D-printed PLA samples.

2.2. Tensile and Bending Test

The mechanical properties of the 3D-printed samples were determined through tensile and bending tests. A universal tensile testing instrument, 2055 P-0.5 (Tochpribor, Ivanovo, Russia), equipped with LabVIEW 2020 software (National Instruments, Austin, TX, USA) and PXI system hardware (NI PXIe-1073 chassis and NI PXIe-4330 controller, Austin, TX, USA) was used [28]. Tensile strength analysis was based on the maximum force recorded during the test and the corresponding tensile strength calculated from the initial cross-sectional area of the sample.
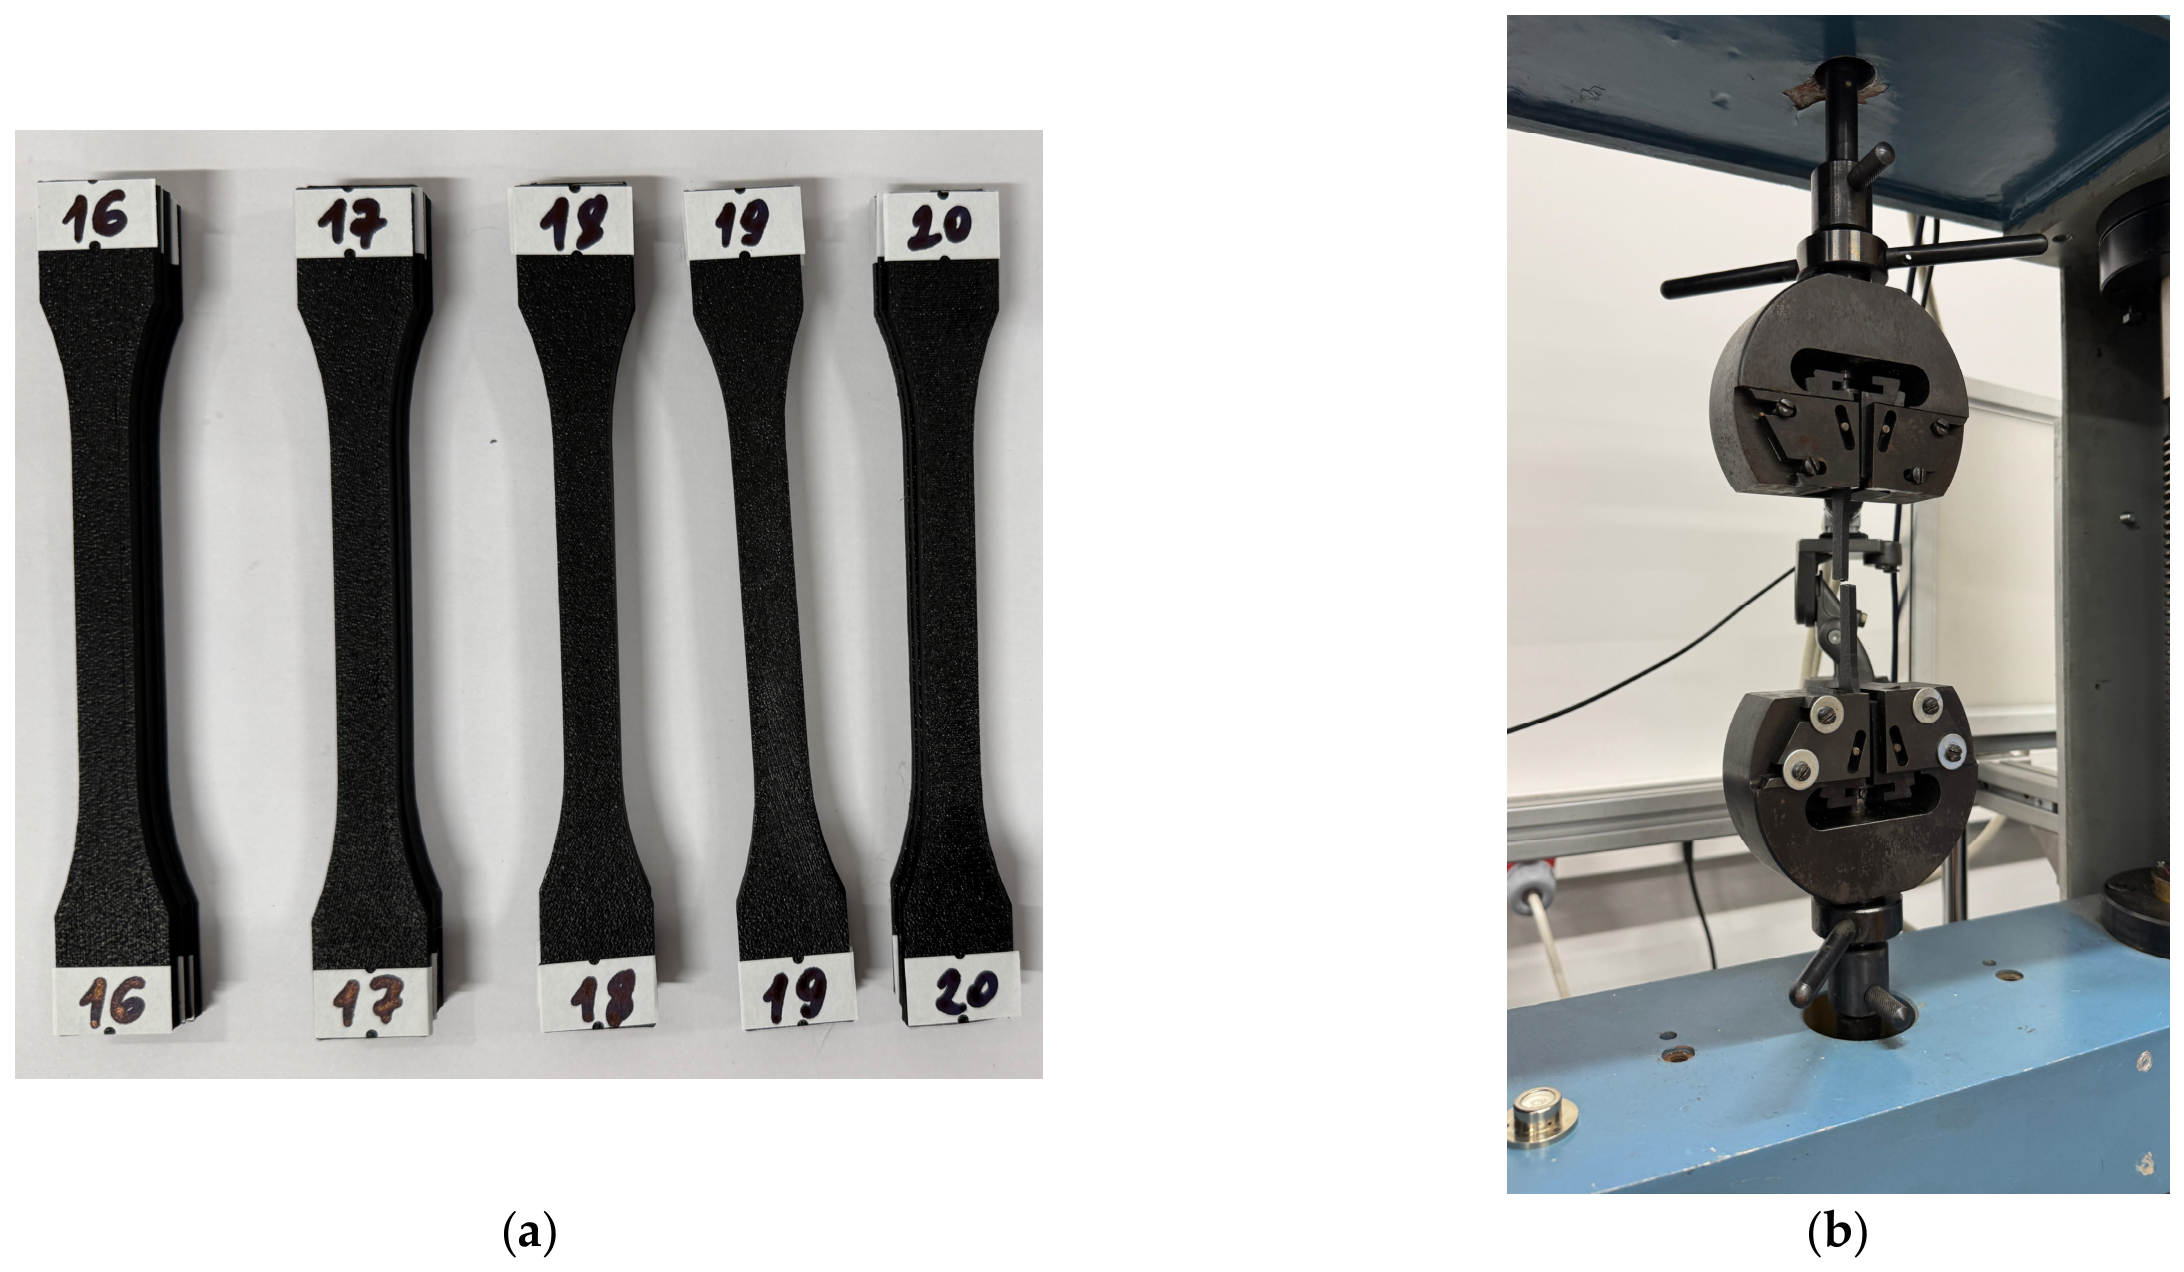
Tensile tests were performed according to ISO 527-1 [29] and ISO 527-2 [30] using dog-bone samples that conform to the geometry of ISO 20753 [31] A1 (Figure 3). The samples had nominal dimensions of 150 × 10 × 4 mm, corresponding to the multipurpose standardized sample commonly used for mechanical characterization of thermoplastic materials. All tests were conducted under identical conditions for all samples to ensure the comparability of the results.
The tensile test results were analyzed using the maximum recorded force. Tensile strength was calculated as the ratio of the maximum tensile force to the initial cross-sectional area of the sample in the working section, σmax = Fmax/A0. The results are presented as MPa tensile strength values and used for a comparative evaluation of the 3D printing modes studied. Complete stress–strain curves were not included since the tensile strength is considered the primary comparative parameter in this study, and the displacement data were used only as machine-recorded displacement values and were not analyzed as true strain for determining strain-dependent properties.
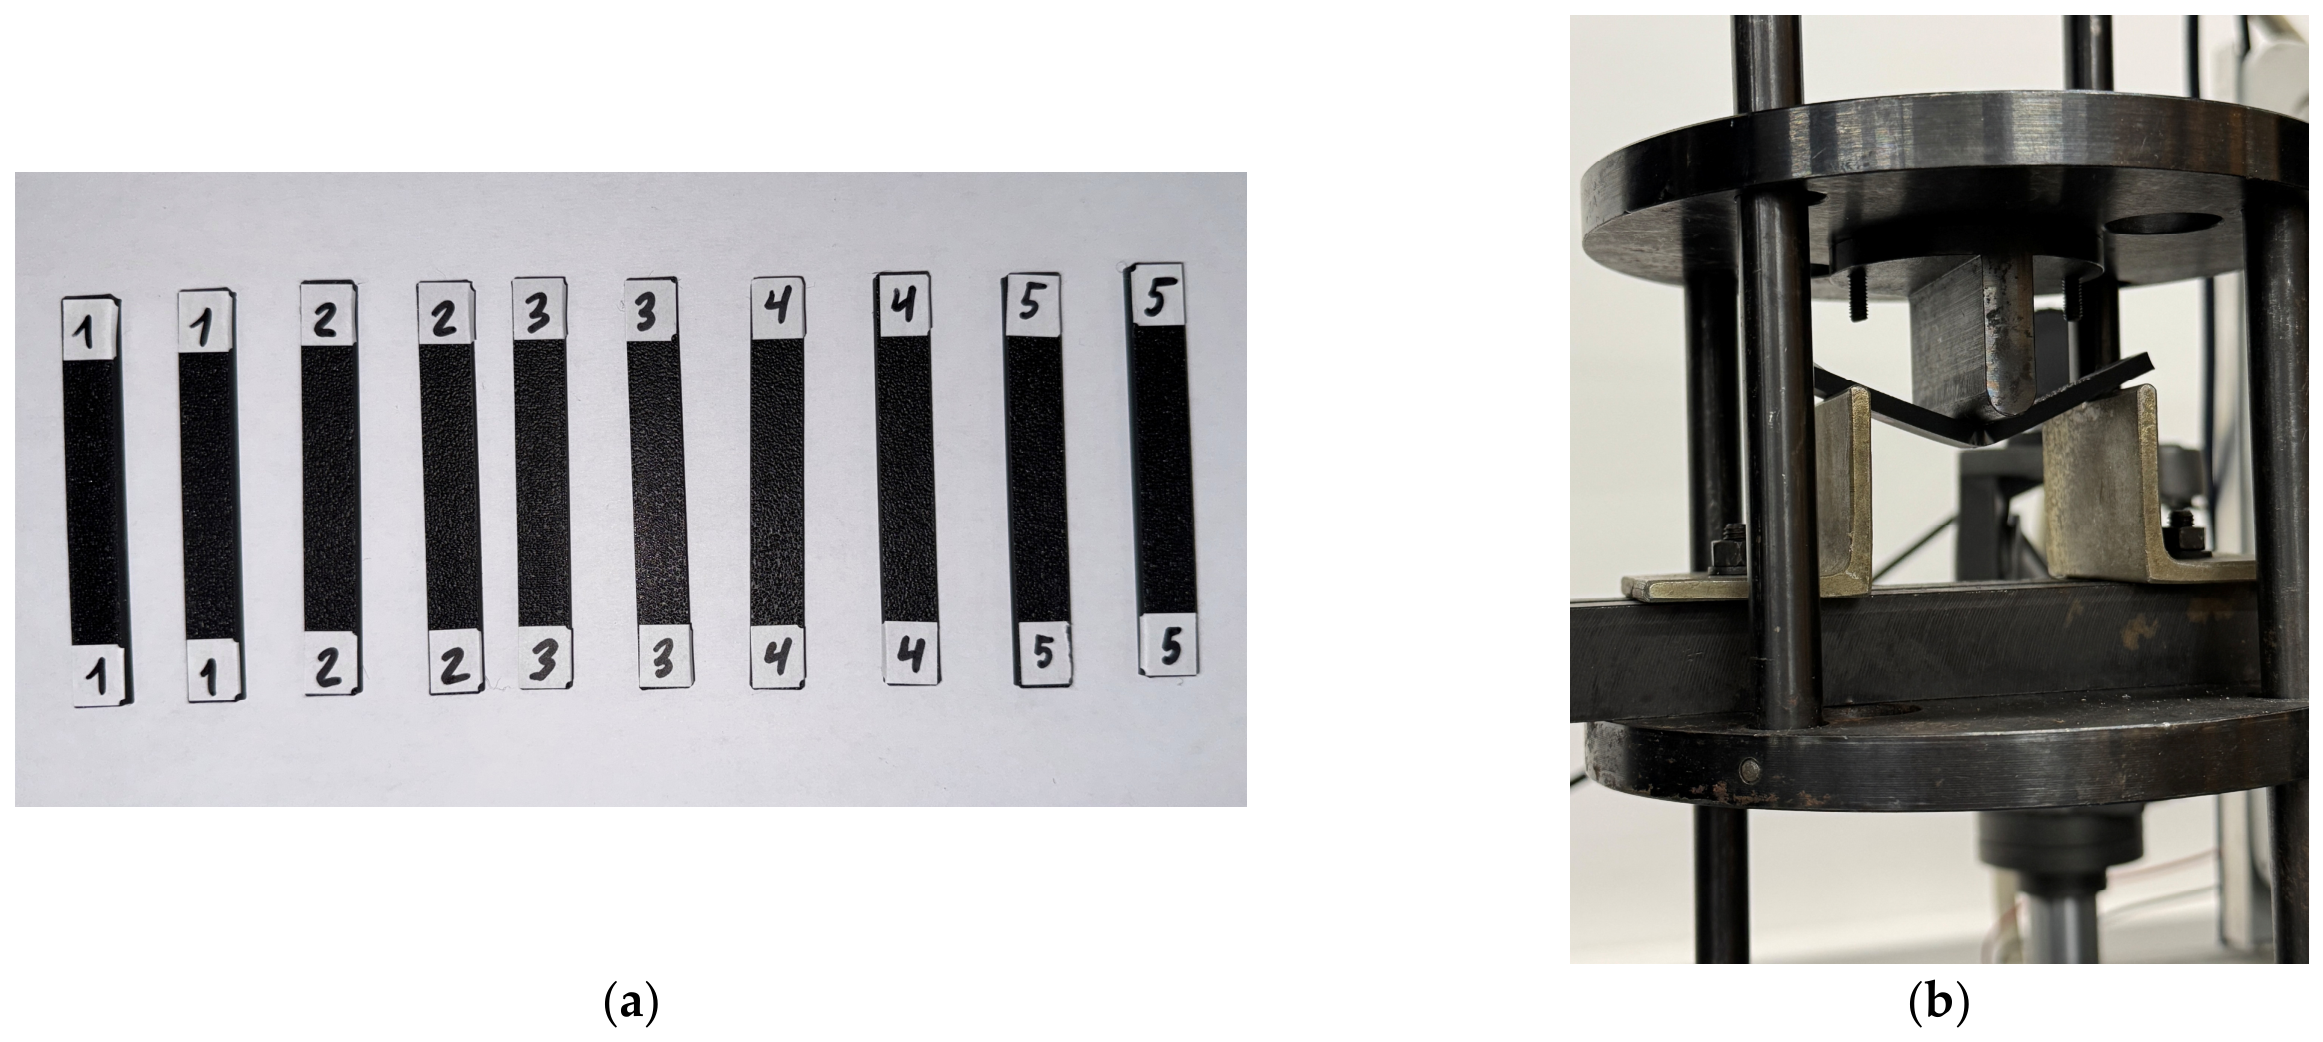
The fixed-deflection bending response was evaluated using a three-point bending setup adapted from ISO 178 [32] (Figure 4). The bending load recorded at a midspan deflection of 4 mm was used as the comparison metric. Rectangular samples with dimensions of 80 × 22 × 4 mm were used. The support span was 64 mm, the crosshead advance rate was 2 mm/min, the support roller diameter was 8 mm, and the loading roller diameter was 10 mm. Although the sample width differed from the standard geometry, all samples were tested under identical conditions, enabling an internally consistent comparison among the investigated printing modes. The tests were performed under controlled displacement conditions, and the applied force corresponding to a predefined deflection was recorded. This approach enabled a direct comparison of the load-bearing capacity of the samples under identical deformation conditions.
The bending test was used not as a comprehensive statistical assessment of the bending strength, but as a supplementary comparative assessment of the strength response under cross-sectional deformation. For each printing mode, three replicate samples were tested. Therefore, the bending results were interpreted as indicative trends and used to support the tensile data rather than as independent, statistically conclusive evidence.

2.3. Surface Roughness Analysis and 3D Surface Imaging

Surface roughness was measured using a non-contact CNC Vision Measuring System (Mitutoyo Quick Vision Hyper, Tokyo, Japan) with Mitutoyo QVPAK version 14.1 and Mitutoyo MCubeMap Ultimate V9 software version [33]. For each region, a 2.5 mm × 1.8 mm scanning area was analyzed. Surface topography was evaluated using areal (3D) surface texture parameters in accordance with ISO 25178-2 [34]. The analysis was primarily based on the areal surface texture parameters, arithmetic mean height (Sa), root mean square height (Sq), and maximum height (Sz). For 3D surface imaging, samples that were prepared for tensile testing were used.
To enable comparison with conventional approaches reported in the literature, the profile-based parameters arithmetic mean roughness (Ra), root mean square roughness (Rq), and maximum height of the profile (Rz) were also evaluated in accordance with ISO 21920-2 [35].
Three-dimensional surface measurements and their corresponding topographic images were obtained from three separate areas on each sample: the top, side, and bottom surfaces. These specific areas were chosen to capture the characteristic variations in surface formation resulting from the additive manufacturing process.
The study also descriptively examined how variations in the printing parameters were associated with the resulting surface-texture morphology across the three surface orientations. Special emphasis was placed on assessing how surface pattern and roughness metrics differ among the top, side, and bottom regions.
To maintain consistency and allow for comparison of the results, all measurements were carried out under the same conditions. For every sample and each surface orientation, measurements were taken at an identical, predefined position. The measurement area, the resolution, and the data processing methods were kept unchanged for all samples.

2.4. SEM Fracture Analysis

An SEM, Axia ChemiSEM (Thermo Fisher Scientific, Waltham, MA, USA) [36,37], and an optical microscope, Eclipse MA–200 (Nikon, Tokyo, Japan) [38] with a digital Moticam A16 (Motic, Hong Kong, China) camera [39], were used for microstructure analysis. SEM examinations were carried out on selected samples that had been subjected to tensile testing following fracture: samples 5, 7, 13, and 17. These samples were selected to represent both infill types and infill densities. The fracture surfaces were examined at low and higher magnifications to assess the overall fracture path, interlaminar adhesion, voids, and local fracture features.
The fractured samples were analyzed without applying a gold coating. This approach was selected to preserve the native morphology of the fracture surface and to prevent any alterations introduced by sample preparation, especially the potential displacement of loose fracture fragments and the concealment of fine gaps, voids, and unfilled regions between the deposited layers.

2.5. Statistical Analysis

Statistical analysis was carried out to investigate how infill pattern, infill density, and infill direction affect the tensile strength of PLA samples produced by MEX 3D printing. A three-factor analysis of variance (ANOVA) was applied, treating infill pattern, infill density, and infill direction as fixed factors. The model incorporated the main effects of each factor, along with all possible two-way and three-way interaction terms. This method was employed to assess whether the influence of one printing parameter varied depending on the level of another parameter.
Three replicate tensile samples were tested for each experimental condition. The experimental design was balanced and comprised 20 printing modes, yielding a total of 60 tensile test data points. While having only three repetitions per condition limits the number of observations for each individual mode, this was considered adequate for an initial factorial assessment of the primary treatment effects within the experimental matrix. Consequently, the ANOVA outcomes were interpreted as statistical support for identifying the most influential factors and their interactions, rather than as a general predictive model applicable to all MEX-printed PLA systems.
Statistical significance was determined at a threshold of p < 0.05. The F-value was employed to compare the variance accounted for by each factor or interaction against the residual variance. Alongside p-values, the partial coefficient of determination (ηp2) was calculated to quantify the relative contribution of each factor and interaction to the overall variation in tensile strength. Given the small number of replicates, effects associated with low F-values or non-significant p-values were interpreted with caution, and the statistical findings were evaluated in conjunction with the mean values, standard deviations, and the experimentally observed trends.

3. Experimental Results and Discussion

The effects of infill pattern, infill density, and infill orientation were investigated using tensile testing, fixed-deflection bending tests, surface-texture characterization, and qualitative SEM analyses. The resulting data are examined independently and in an integrated manner to illuminate the relationships between internal architecture, mechanical behavior, and surface-formation mechanisms in MEX-produced PLA samples.

3.1. Tensile Results

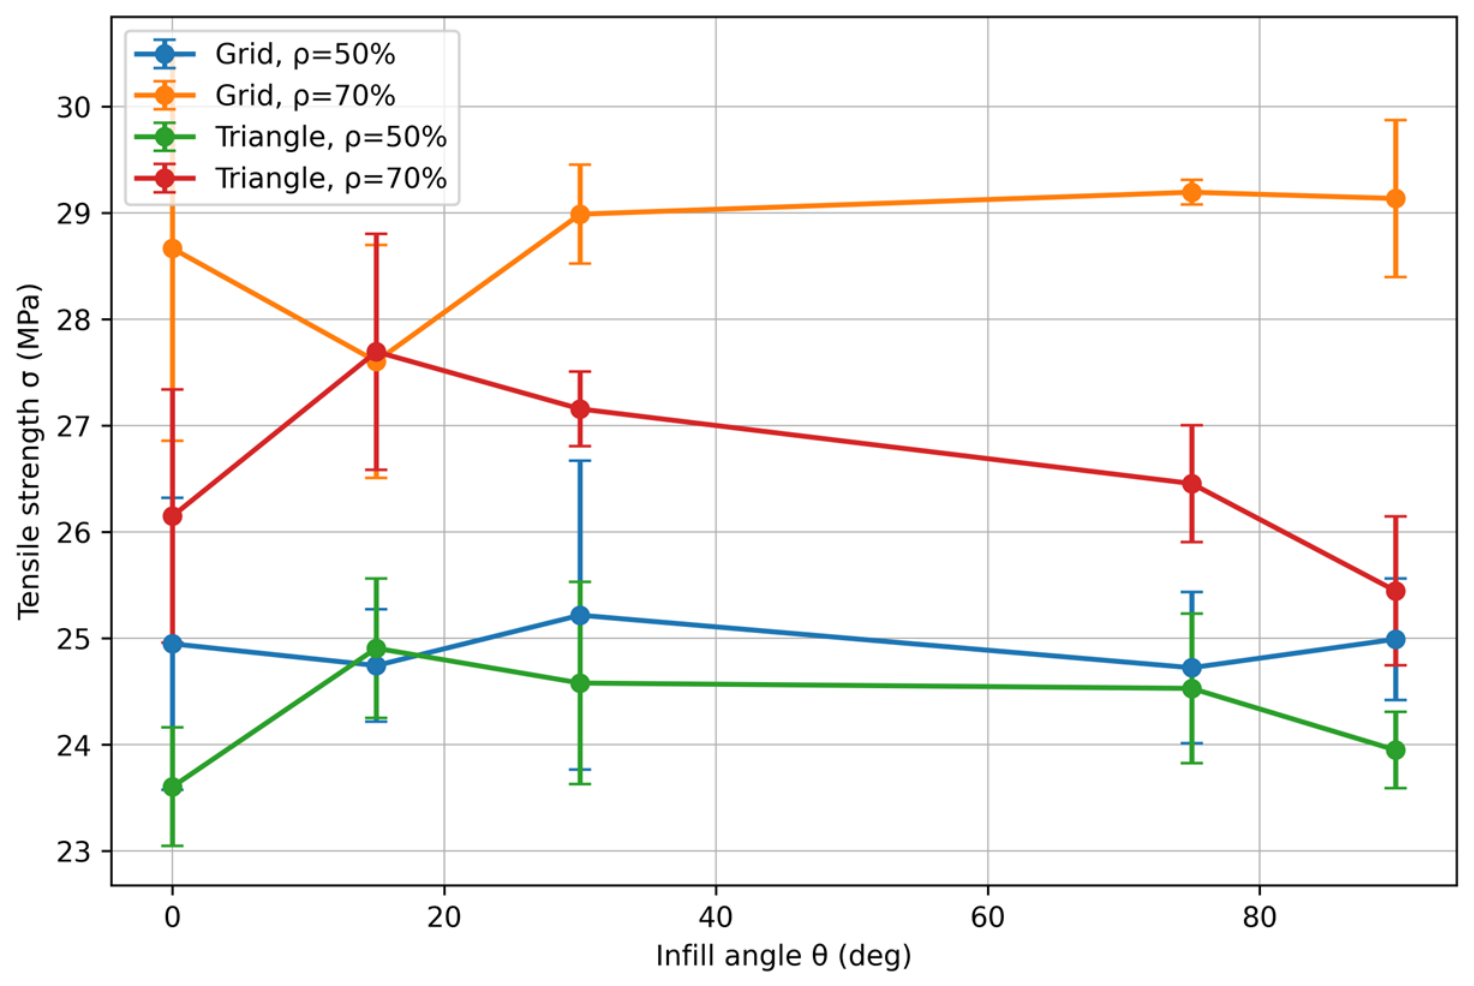
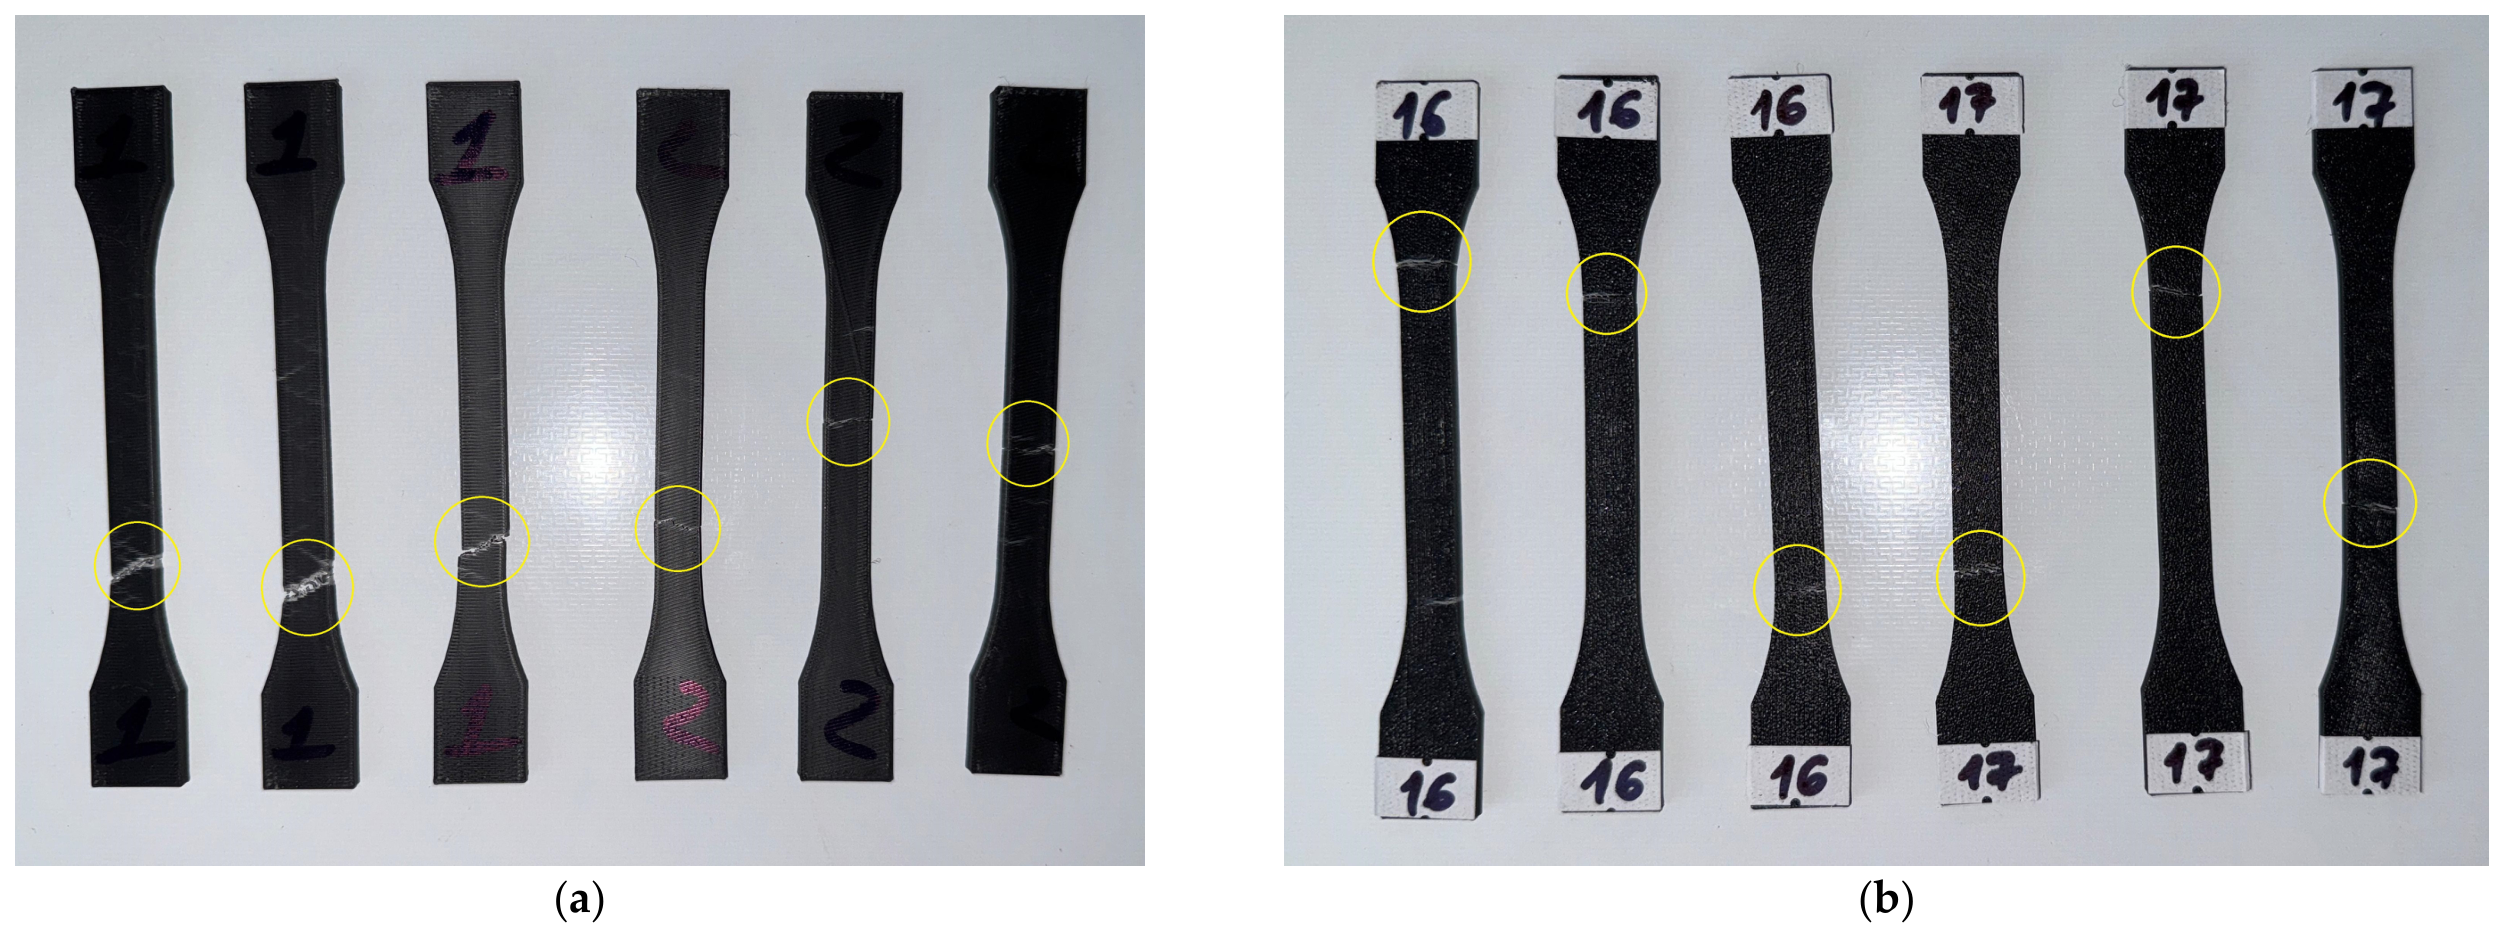
The mechanical performance of MEX-printed PLA samples was examined across 20 different combinations of 3D printing parameters, involving two infill patterns, two infill densities, and five infill orientations. For each printing configuration, three samples were tested, and the tensile strength is reported as the mean value accompanied by the standard deviation. The complete tensile test data set is summarized in Table 4, while Figure 5 illustrates how infill orientation affects tensile strength across different infill patterns and density combinations. Representative post-fracture sample images are provided in Figure 6. In this work, tensile strength was determined from the maximum measured force and the initial cross-sectional area of the sample. Accordingly, the analysis emphasizes the relative effects of infill pattern, infill density, and infill orientation on tensile strength, rather than on strain-dependent properties such as tensile modulus of elasticity or elongation at break.
The measured tensile strength ranged from 23.60 to 29.19 MPa, confirming the significant influence of the internal 3D print architecture on the strength of the PLA samples. The lowest tensile strength was observed for the triangle infill pattern at a density of 50% and an infill direction of 0°. In contrast, the highest strength was recorded for the grid infill pattern at a density of 70% and an infill direction of 75°. The difference between these two settings was 5.59 MPa, corresponding to an increase of approximately 23.7% over the least effective configuration.
The most significant factor affecting tensile strength was found to be the infill density. Increasing the infill density from 50% to 70% was associated with a systematic increase in strength for both infill configurations. On average across all angles and infill patterns, tensile strength increased from 24.62 MPa at 50% density to 27.65 MPa at 70% density. This improvement is consistent with the greater nominal amount of infill material and the formation of a more continuous internal load-bearing structure, which is expected to reduce the size and prominence of internal open regions and improve stress transfer between neighboring deposited roads.
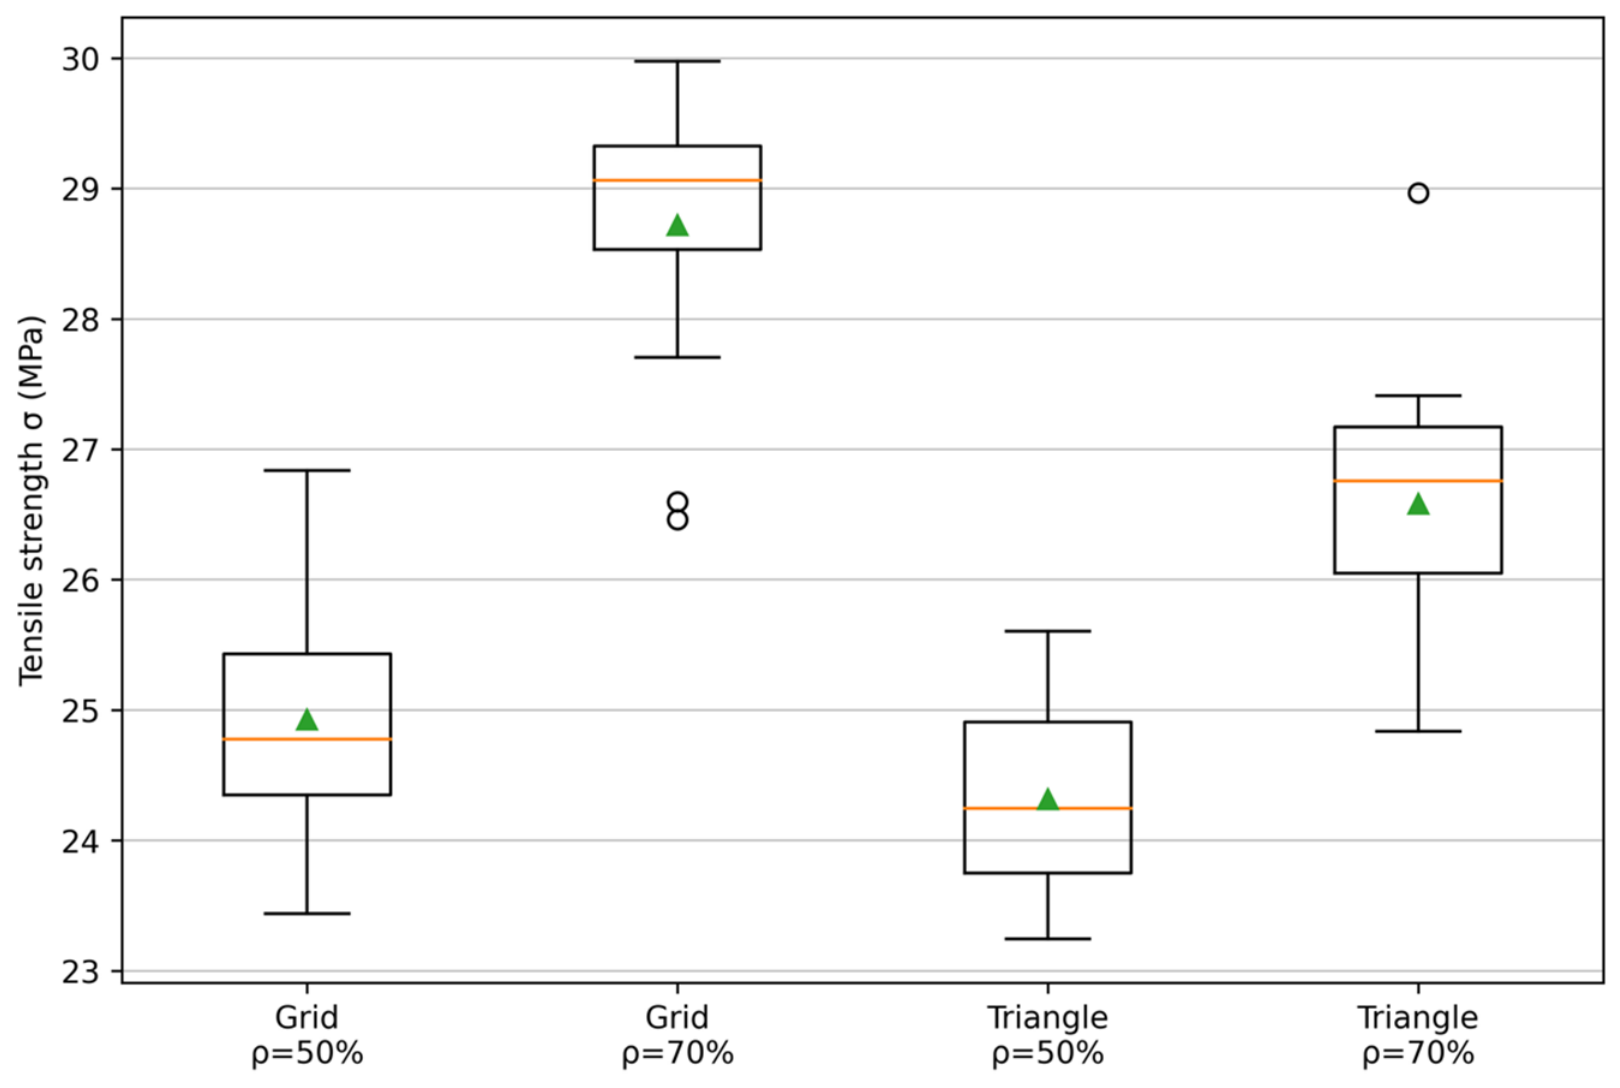
The effect of the infill pattern was also noticeable. On average, samples with a grid structure exhibited higher tensile strength than those with a triangle pattern, with mean values of 26.82 and 25.45 MPa, respectively. However, this difference was highly dependent on the infill density. At 50% density, the difference between the grid and triangle patterns was relatively small. At 70% density, the advantage of the grid structure became more pronounced: the average tensile strength of the grid-structured samples reached 28.72 MPa, compared to 26.58 MPa for the triangle-structured samples. This suggests that the grid structure becomes more effective when a greater amount of material is available to form continuous stress paths.
The effect of the infill direction was less uniform and should not be interpreted as an independent monotonic effect. For samples with a grid structure at 50% density, the tensile strength remained practically constant across the range of angles studied, varying only between 24.72 and 25.22 MPa. In contrast, samples with a triangle pattern at 70% density demonstrated a more pronounced dependence on the angle: the maximum strength was obtained at 15°, and then gradually decreased at 90°. A similar interaction effect was observed for samples with a grid structure at 70% density, with maximum values at 75° and 90°. Thus, the results show that the infill direction influences tensile strength primarily through its interaction with the infill pattern and density, rather than as a universal independent parameter.
The comparative analysis shown in Figure 7 confirms that the Grid-70% configuration performed most strongly in terms of tensile strength among the groups studied, whilst the Triangle-50% configuration yielded the lowest strength levels. However, greater variation was observed in several modes, which may be related to local variations in intertrack adhesion, void distribution, or crack initiation sites.
Within the investigated material–printer–slicer system and parameter range, increasing nominal infill density was the primary means of improving tensile strength. The infill pattern and infill direction further influence the mechanical response, but their effects are most significant when considered in conjunction with density. Among the modes studied, the 70% density grid model provided the most favorable tensile properties, particularly at fill angles of 75° and 90°.
The ANOVA confirmed the trends observed in the tensile strength data. Infill density had the strongest effect on tensile strength within the experimental range studied (Table 5), with F = 170.30, p < 0.001, and a partial coefficient of determination ηp2 = 0.810. This confirms that increasing the infill density from 50% to 70% was the primary factor contributing to the improvement in tensile strength. The effect of the infill pattern was also statistically significant, with F = 34.95, p < 0.001, and a partial coefficient of determination ηp2 = 0.466, indicating that the internal architecture of the printed samples influenced their load-bearing capacity. In contrast, the main effect of infill direction was not statistically significant, with F = 1.08 and p = 0.379. However, the interaction between infill pattern and infill direction was significant (F = 3.32, p = 0.019), indicating that the effect of infill direction depends on the selected infill pattern. The interaction between pattern and density was also significant, with F = 10.79 and p = 0.002, indicating that the effect of the infill pattern becomes more pronounced at higher infill densities. The interaction between density and direction, as well as the three-way interaction, was not statistically significant.
The absence of a statistically significant main effect of the infill direction indicates that the rotation of the internal infill did not result in a uniform, independent change in tensile strength across all configurations. This result is consistent with the expected similarity of certain rotated periodic infill geometries. However, the significant interaction between the infill pattern and the infill direction indicates that the direction’s effect depended on the chosen infill topology and on its interaction with the sample geometry and perimeter walls.
Since only three samples were produced for each individual pattern, the ANOVA outcomes should be regarded as a factorial screening analysis, limited by the specific experimental design used in this study. The strong influence of infill density and the significant influence of the infill pattern are consistently supported by both the statistical evaluation and the observed experimental behavior, while weaker or non-significant effects should be treated with caution and not overinterpreted.

3.2. Bending Results

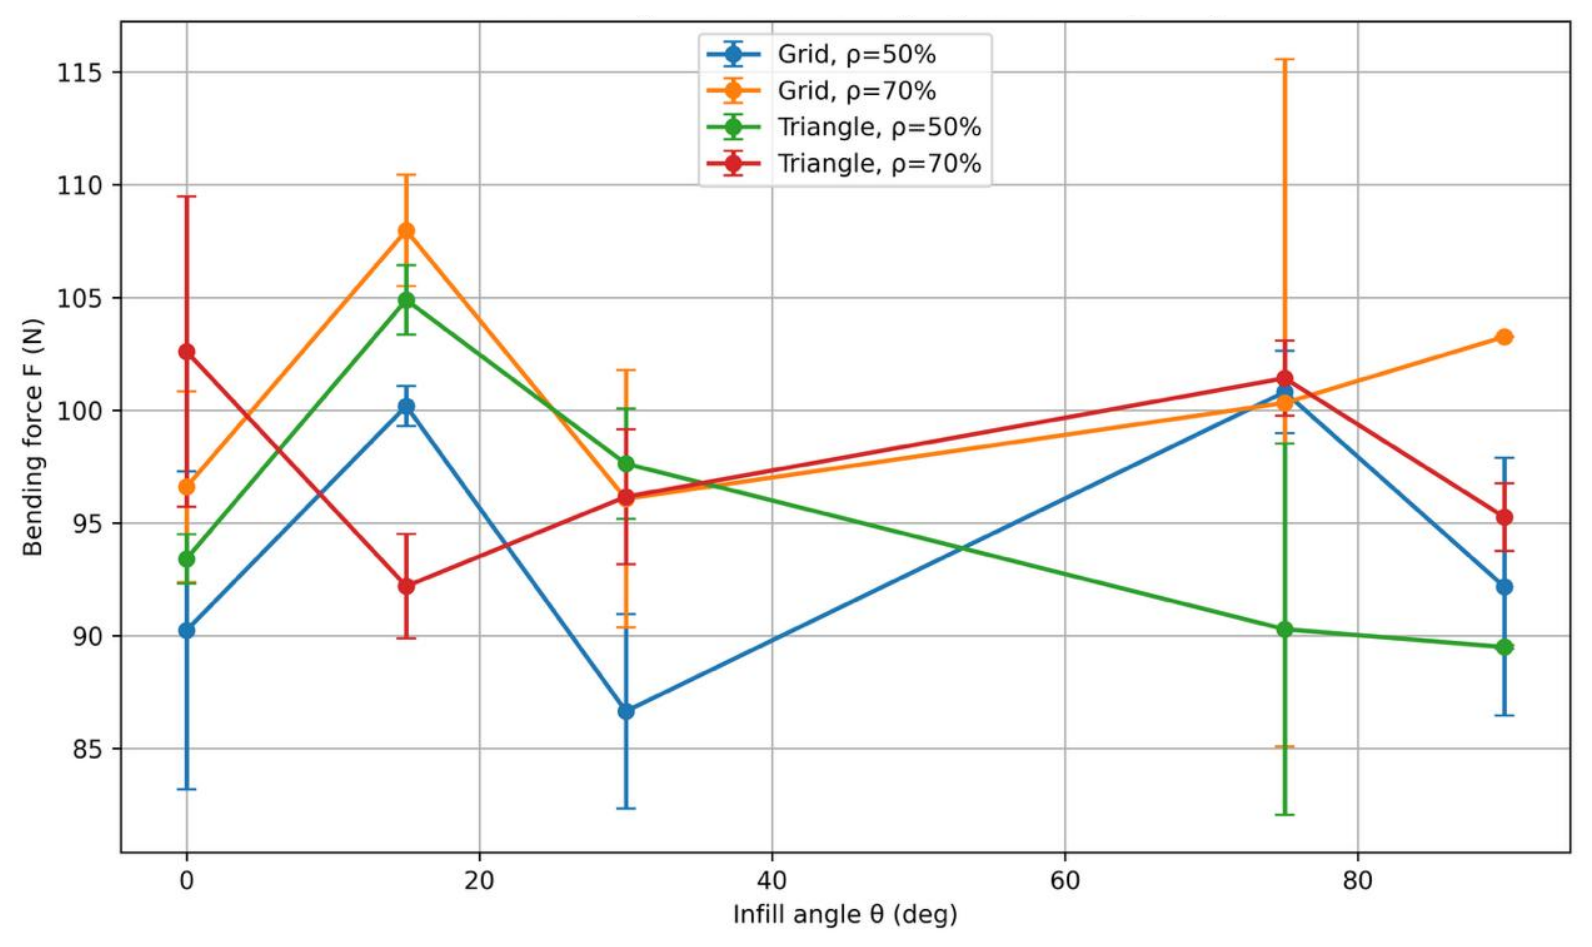
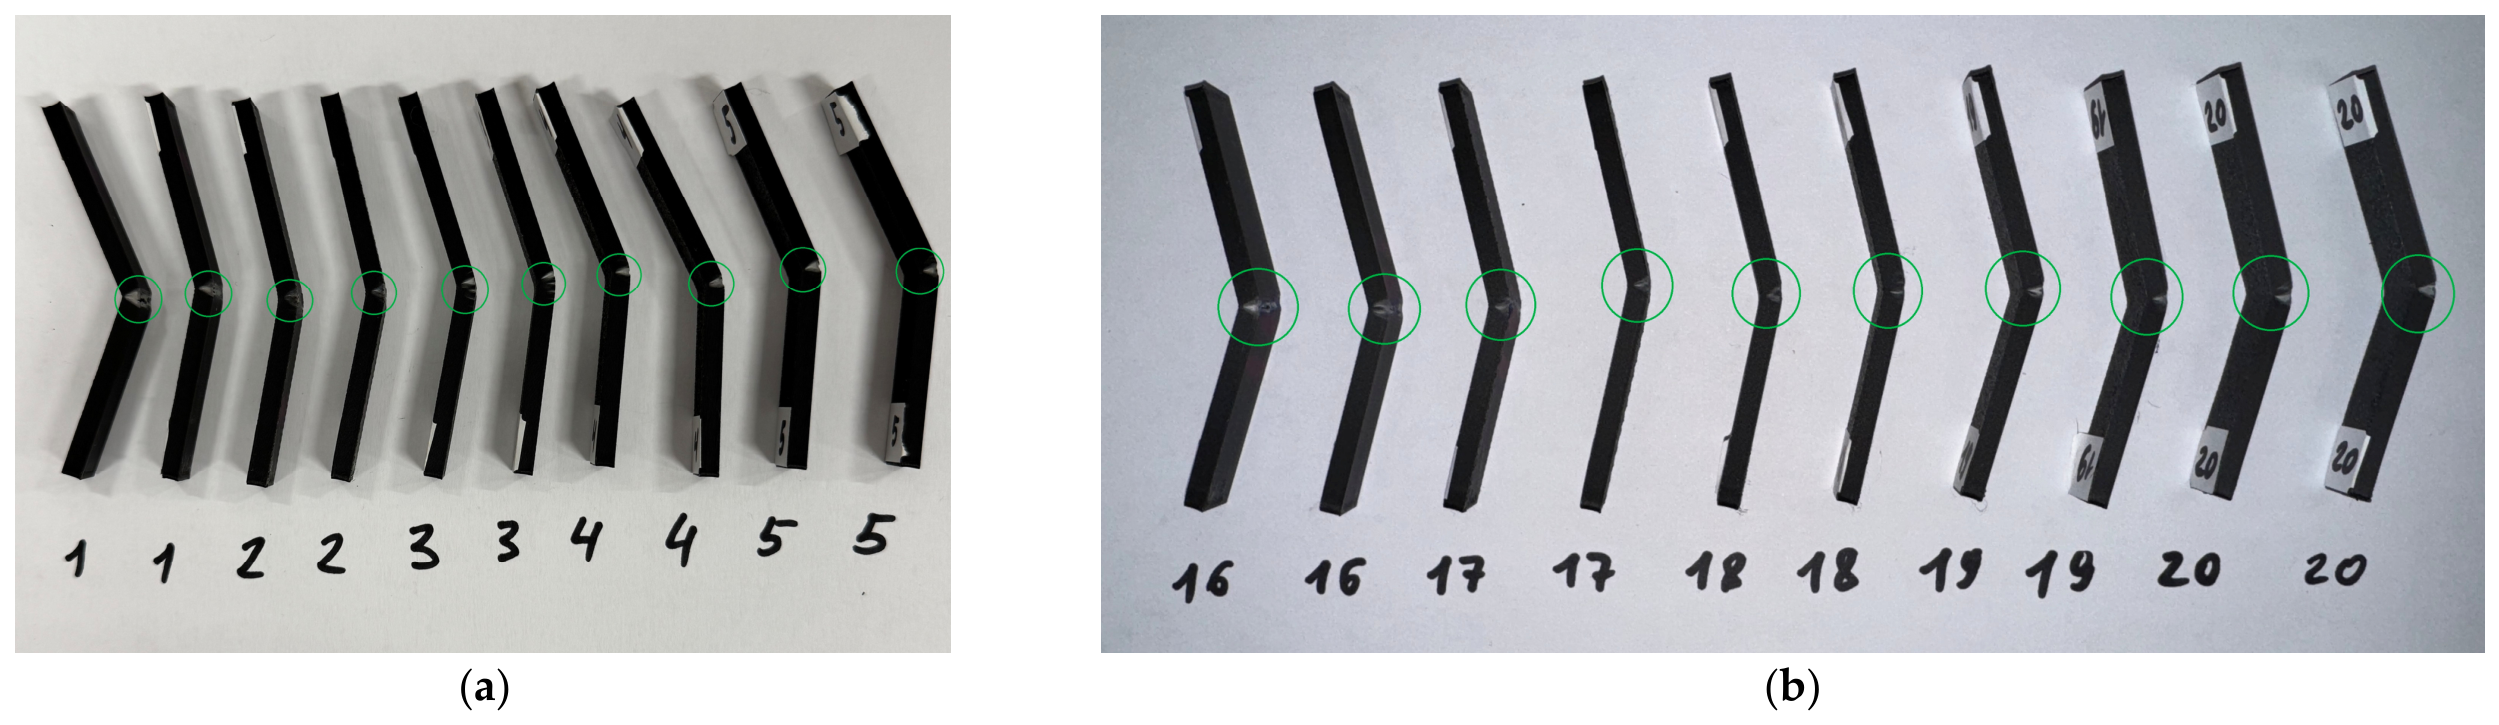
In addition to the tensile experiments, fixed-deflection bending tests were performed as an additional comparative method to assess how MEX-printed PLA samples respond to transverse loading. The bending results were used primarily to detect overall trends and to support the interpretation of the tensile findings, rather than to provide statistically robust data for determining flexural properties. To enable a direct comparison of all 3D printing modes under identical deformation conditions, the load measured at a constant deflection of 4 mm was chosen as the primary comparison metric. The corresponding results are compiled in Table 6 and illustrated in Figure 8, while representative sample images after bending are provided in Figure 9.
At a deflection of 4 mm, the bending load varied between 86.60 and 107.97 N, demonstrating that the 3D printing parameters influenced not only tensile strength but also the sample’s resistance to bending deformation. The lowest bending load was measured for sample 13, 3D-printed with a grid infill at 50% density and an infill direction of 30°. Conversely, the highest bending load was obtained for sample 17, produced with a grid infill at 70% density and a 15° infill direction. The difference between these two configurations was approximately 21.38 N, representing an increase of roughly 24.7% over the weakest bending setup.
A comparative analysis suggests that higher infill density was associated with a higher fixed-deflection bending response. When considering all infill types and orientations, the average bending load at a deflection of 4 mm increased from approximately 94.57 N at 50% density to 99.16 N at 70% density. This trend indicates that the higher-density configurations generally exhibited greater resistance to bending deformation under the selected test conditions. However, the effect of density was less pronounced than in tensile tests, indicating that bending behavior also depends heavily on the quality and integrity of the outer printed layers.
Among the groups studied with different infill densities, the Grid-70 configuration exhibited the highest average bending load at a deflection of 4 mm, approximately 100.80 N. The Triangle-70 group showed a slightly lower average value of 97.53 N, followed by Triangle-50 and Grid-50 with average values of 95.14 and 93.99 N, respectively. Thus, the grid structure proved more advantageous, particularly at higher infill densities, consistent with the tensile test results presented in Section 3.1. At an infill density of 50%, the difference between the grid and triangle pattern was relatively small, whereas at a density of 70%, the grid structure exhibited a more beneficial response to bending.
The effect of the infill direction was not monotonous. For triangle samples with a density of 50%, the highest bending load was observed at 15°, and the lowest at 90°. For triangle samples with a density of 70%, high values were recorded at 0° and 75°. In the case of grid samples, the group with a density of 50% exhibited high bending loads at 15° and 75°, whilst the group with a density of 70% reached its maximum value at 15° and also maintained a high value at 90°. These results show that the influence of the infill direction depends on its interaction with the infill pattern and density, rather than being an independent parameter.
The variability across repeated measurements was mostly moderate, though some testing conditions showed substantial variation. Notably, sample 19 displayed a comparatively large standard deviation, indicating that local differences in internal bonding, void distribution, or outer layer quality may have affected its bending behavior. This is noteworthy because bending loads are more sensitive than tensile loads to defects at or near the surface. During bending, one side of the sample is subjected to tensile stress, whilst the opposite side is compressed; therefore, the uniformity of the outer layers and the presence of local defects near the loaded surface can significantly affect the measured force.
Generally, the results of the bending tests are consistent with the results from the tensile tests. At 70% infill, the grid configuration showed a higher mean bending response than the triangle configuration. However, the rankings of individual samples differed between the tensile and bending tests. This difference indicates that the behavior under tension and bending is determined in part by different structural features. Tensile strength characteristics are mainly determined by the continuity of internal load transfer paths along the direction of loading, whereas the response to bending is more sensitive to the outer layers, local defects, and the orientation of the deposited layers relative to the bending load.

3.3. Surface Roughness and 3D Topography

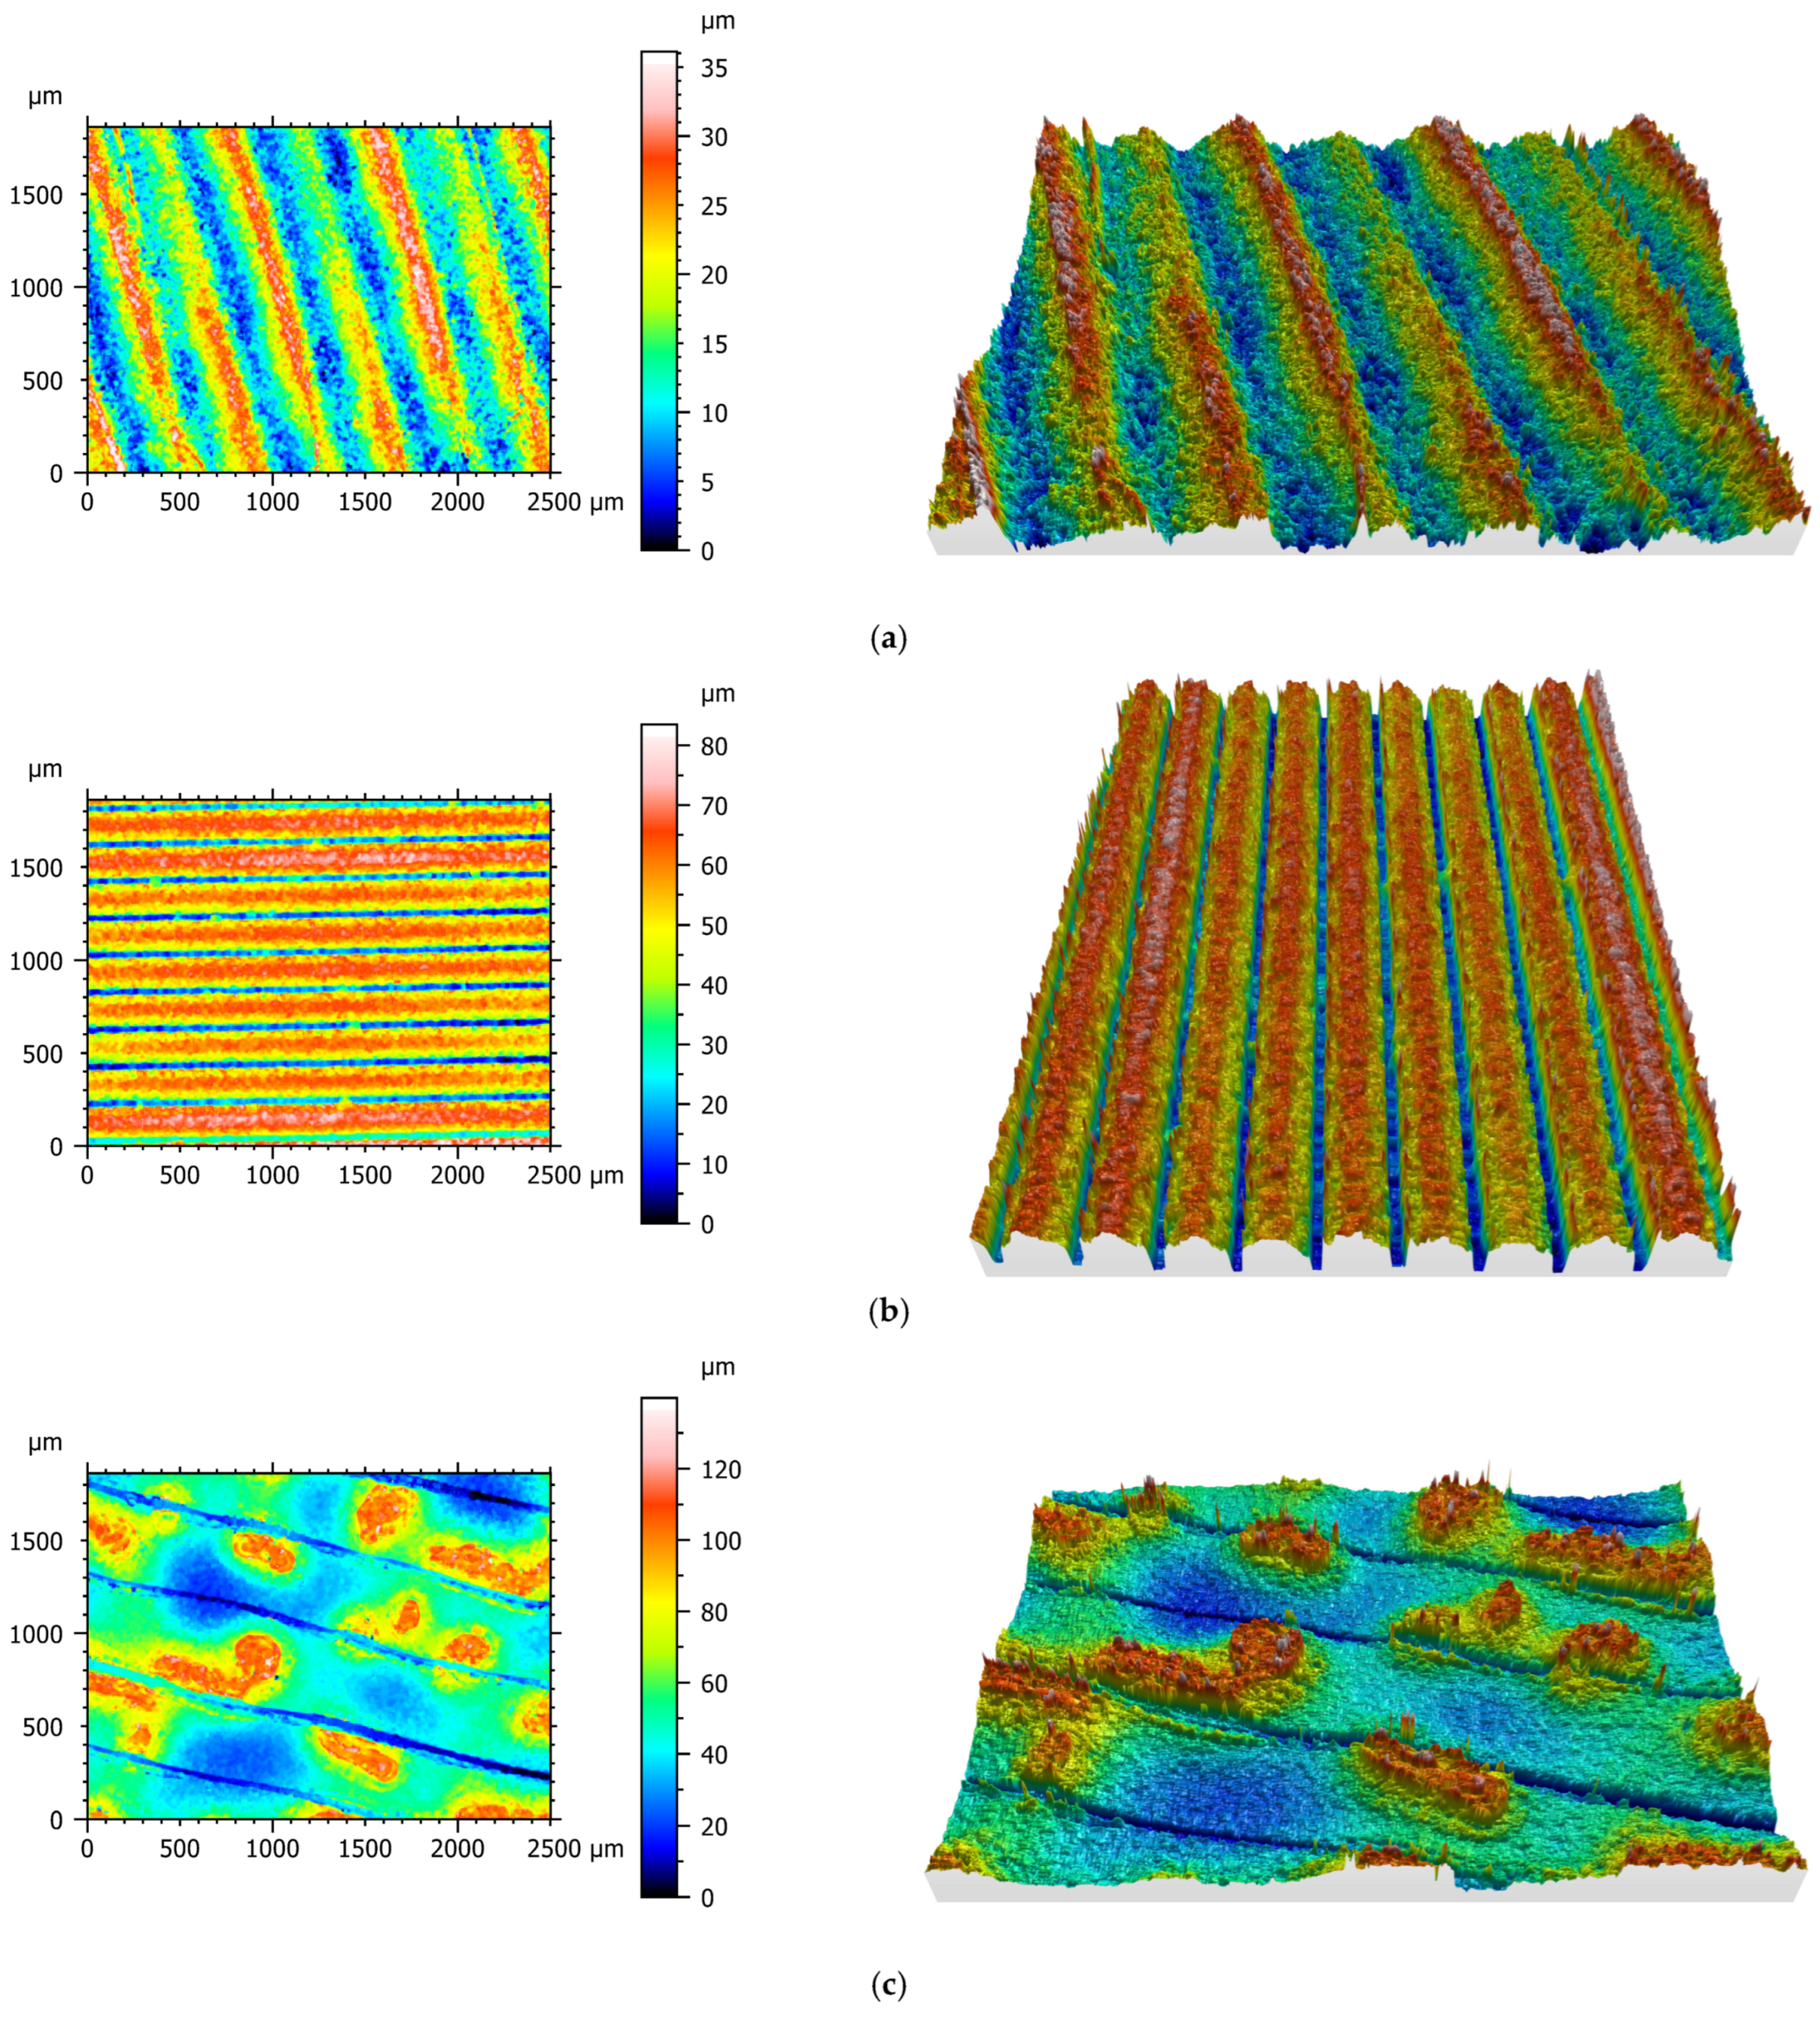
The surface quality of MEX-printed PLA samples was based on three characteristic surface orientations: top, bottom, and side. These surfaces are formed under different printing conditions and therefore reflect different morphological features of the printed structure. The top surface is mainly determined by the final deposited layers and their overlap, the bottom surface depends on direct contact with the build platform, and the side surface reflects the layer-by-layer deposition process. Surface texture was characterized using one representative sample for each of the 20 printing modes. For every sample, a single predefined region was analyzed on each of the top, side, and bottom surfaces, yielding a total of 60 areal surface datasets. The standard deviations reported in Table 7 quantify the variability across the 20 distinct printing modes and do not capture within-mode measurement repeatability or instrument-related uncertainty. Consequently, the individual values presented in Table 8 and Table 9 correspond to single, non-replicated measurements and are interpreted in a purely descriptive manner. Representative three-dimensional surface topography maps are provided in Figure 10.
The concurrent application of profile and areal roughness parameters was chosen intentionally. The areal parameters Sa, Sq, and Sz describe the height distribution over the entire measured surface and are therefore less sensitive to the selection of an individual profile, whereas the profile parameters Ra, Rq, and Rz remain widely adopted in engineering practice and facilitate comparison with the profile-based literature. Previous MEX investigations have predominantly focused on Ra alone or have examined only one or two surface orientations. Sedlák et al. analyzed top, side, and bottom surfaces using both profile and areal parameters [23], and Saharudin et al. showed that a single Ra value does not adequately characterize the surface texture of additively manufactured polymers [24]. The present study advances this body of work by quantifying Ra, Rq, Rz, Sa, Sq, and Sz for all three surface orientations within a consistent infill pattern–density–infill direction design matrix.
Clear differences were observed between the three measured surface orientations. Under the present printing conditions, the bottom surface exhibited the highest roughness, with average Sa and Sq values of approximately 18.95 µm and 23.54 µm, respectively. It also showed the highest maximum height, with Sz averaging approximately 135.96 µm. In this study, the bottom surface was in direct contact with the heated build platform, which was equipped with a Bambu Textured PEI Plate.
Therefore, the measured bottom-surface roughness should be interpreted as the result of the interaction between the first printed layer and this specific textured build surface. The textured PEI plate can imprint its surface morphology onto the first layer, while first-layer spreading and adhesion conditions may further increase local height variations. Consequently, the bottom-surface roughness reported here is not a universal value for MEX-printed PLA and strongly depends on the build plate selected. The use of other 3D building plates, such as a smooth PEI sheet, Cool Plate SuperTack, Engineering plate, or another build plate, could significantly change the roughness and topography of the bottom surface.
The side surface exhibited an intermediate level of roughness, with average Sa and Sq values of approximately 13.47 µm and 16.96 µm, respectively. In contrast to the bottom surface, the morphology of the side surface was primarily attributable to the layer-by-layer structure formed during MEX printing. In this study, the layer height was 0.2 mm; accordingly, the side-surface roughness was largely determined by these printing parameters. The repeated deposition of individual layers created characteristic ridges and valleys along the height of the sample, which are clearly visible on the 3D surface maps. Therefore, the lateral surface roughness presented here should be interpreted in relation to the selected layer height. Changing the layer height can significantly affect the side-wall topography and result, resulting in a reduction or increase in roughness, depending on the printing conditions and the quality of material deposition.
The top surface exhibited the lowest average roughness among the three measured orientations, with average Sa and Sq values of approximately 7.80 µm and 9.39 µm, respectively. However, the top surface also showed visible differences between samples. These differences can be explained by variations in infill direction, local track overlap, and filament spreading, and the formation of small gaps or ridges between the final deposited tracks. Therefore, despite the top surface being, on average, smoother than the bottom and side surfaces, its morphology remained sensitive to the chosen printing path and the local distribution of the deposited material.
Across the descriptive surface dataset, the differences among the top, side, and bottom surfaces were greater than the variations associated with infill direction. The bottom surface showed the highest roughness under the selected printing conditions due to its contact with the Bambu Textured PEI Plate, the top surface was generally the smoothest, and the side surface displayed a characteristic layered morphology. This distinction is important for practical applications of printed PLA patterns because surface roughness can affect surface replication, post-processing requirements, dimensional accuracy, and interaction with surrounding materials during casting-related processes.
The available data suggest that the tensile-strength trends were more directly associated with the internal infill architecture than with the descriptive differences in surface texture. However, surface quality can influence bending behavior and the onset of failure, particularly as bending stresses are concentrated near the sample’s outer surfaces. In this context, a rougher bottom surface and a layered side surface can act as potential sites of local stress concentration, depending on the load configuration.
These surface-orientation-dependent phenomena are directly pertinent to the prospective application of MEX-printed PLA as a sacrificial pattern material in casting processes. In foundry practice, the surface topography of a polymer pattern may be reproduced by the molding material or investment shell and subsequently transferred to the casting. Nguyen et al. demonstrated that increases in the surface roughness of additively manufactured patterns are correlated with corresponding increases in the surface roughness of the cast products derived from them. Consequently, the comparatively rough bottom surface generated by the textured PEI build plate, the layer-wise side-wall morphology, and the deposition-track features of the top surface are all expected to influence mold formation, dimensional accuracy, surface quality, and the extent of required post-processing.
However, the present study did not encompass mold fabrication or casting experiments. Consequently, the effective replication of the characterized PLA surface topography in an actual mold or cast component was not empirically validated and should be systematically investigated in future foundry-focused research.

3.4. Fracture Morphology and SEM Analysis

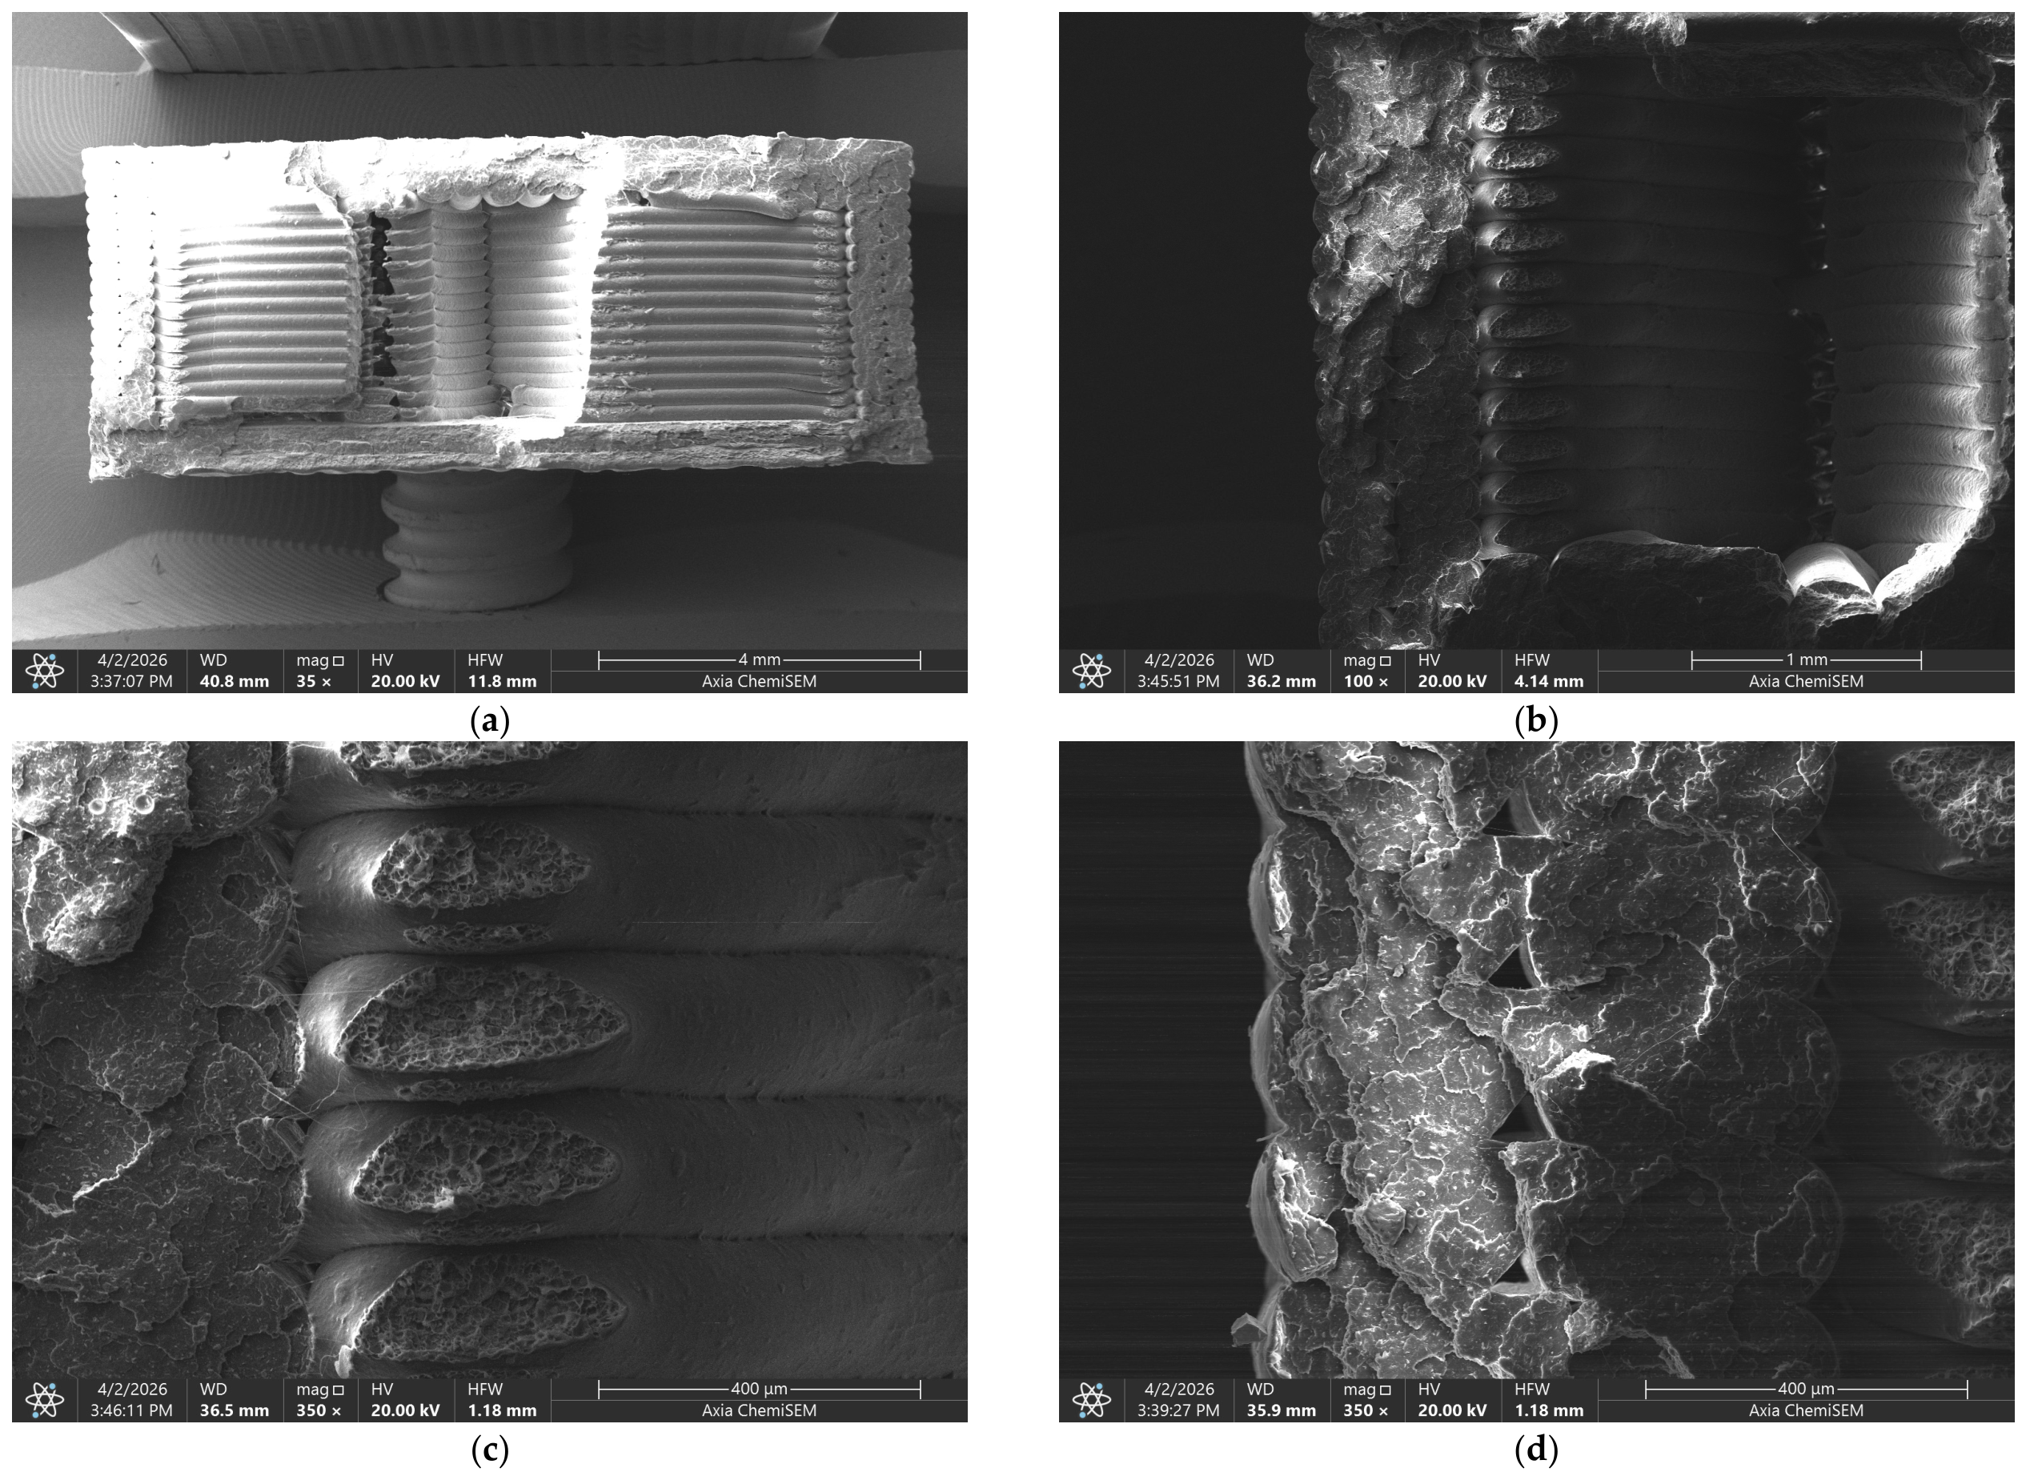
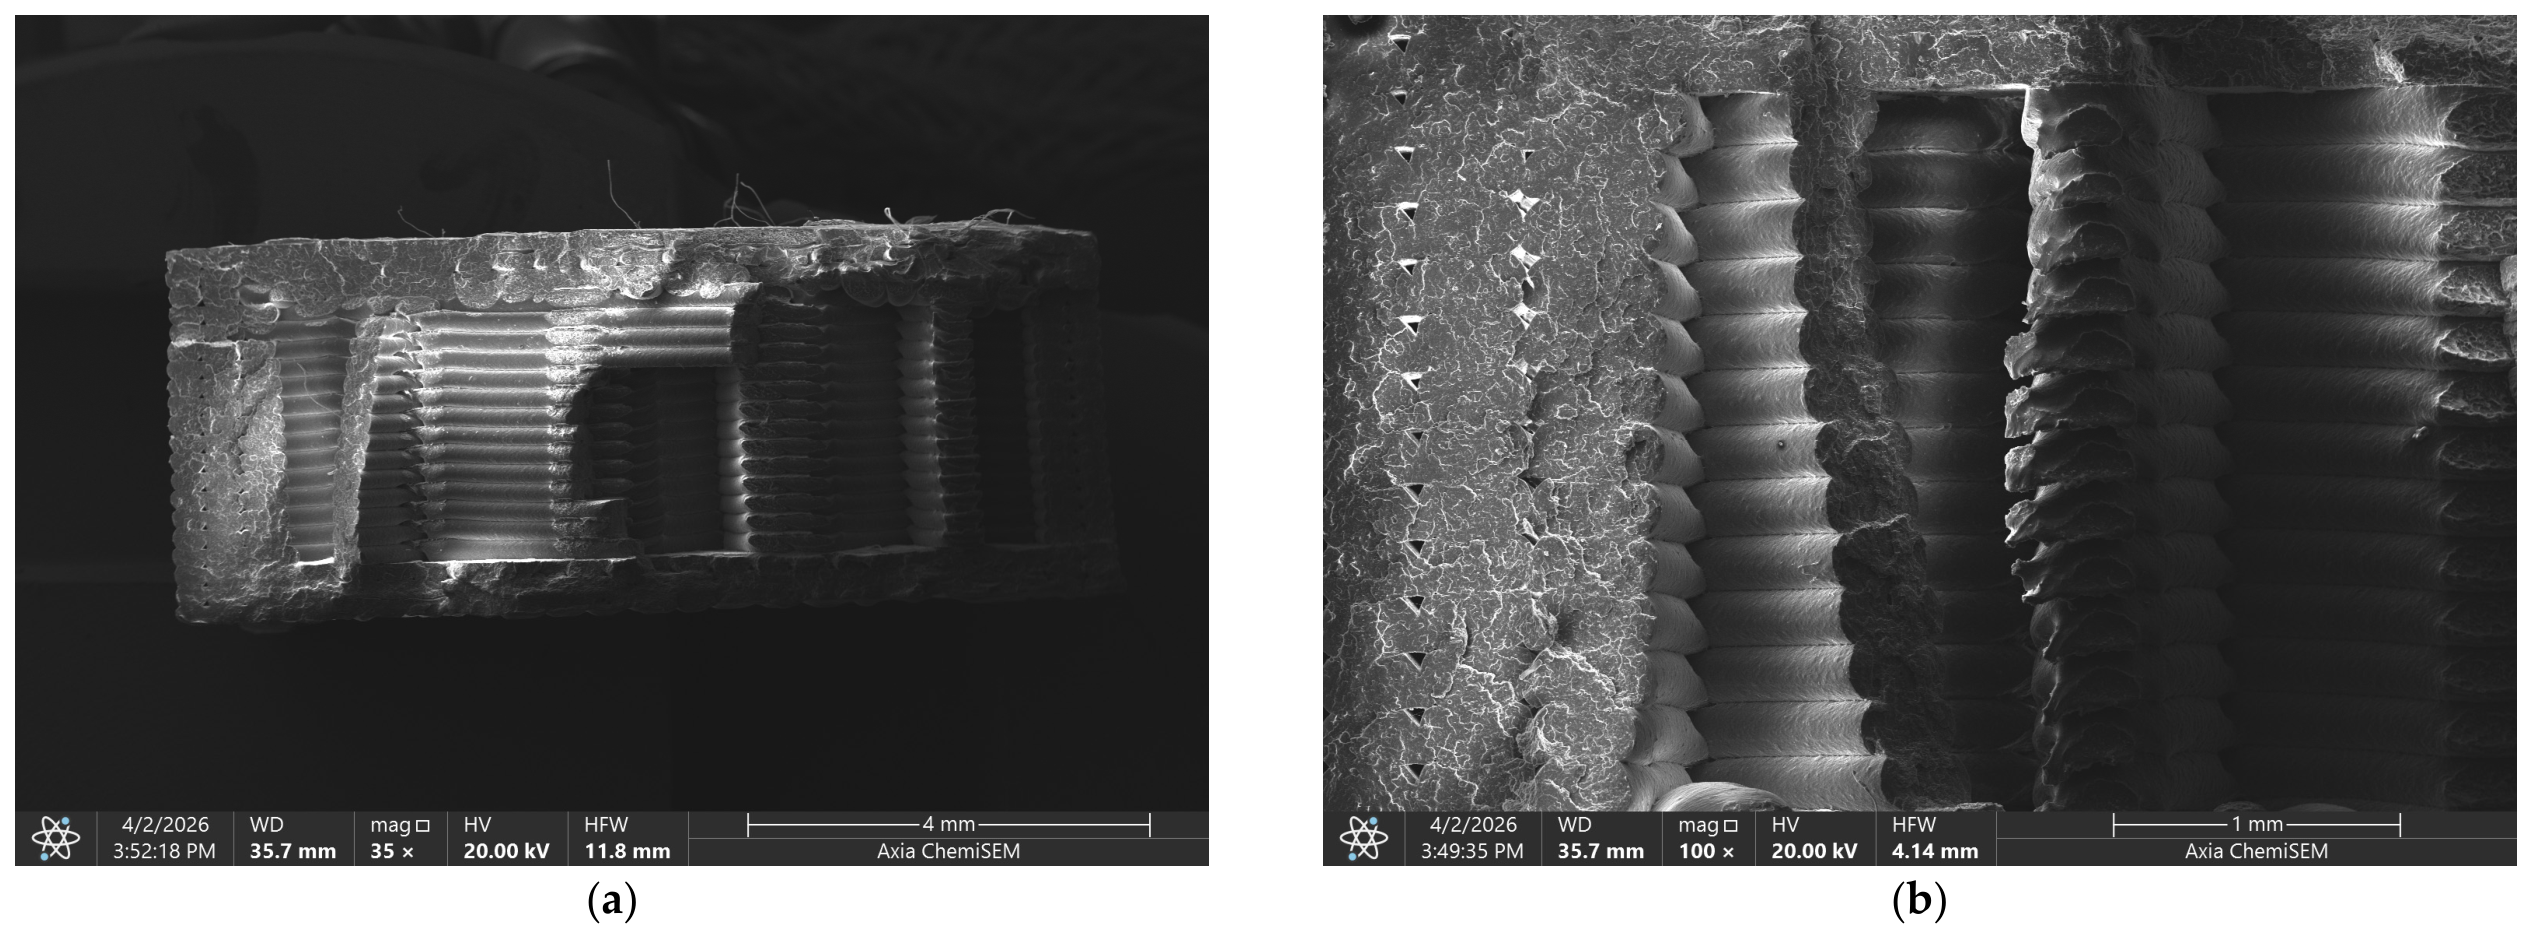
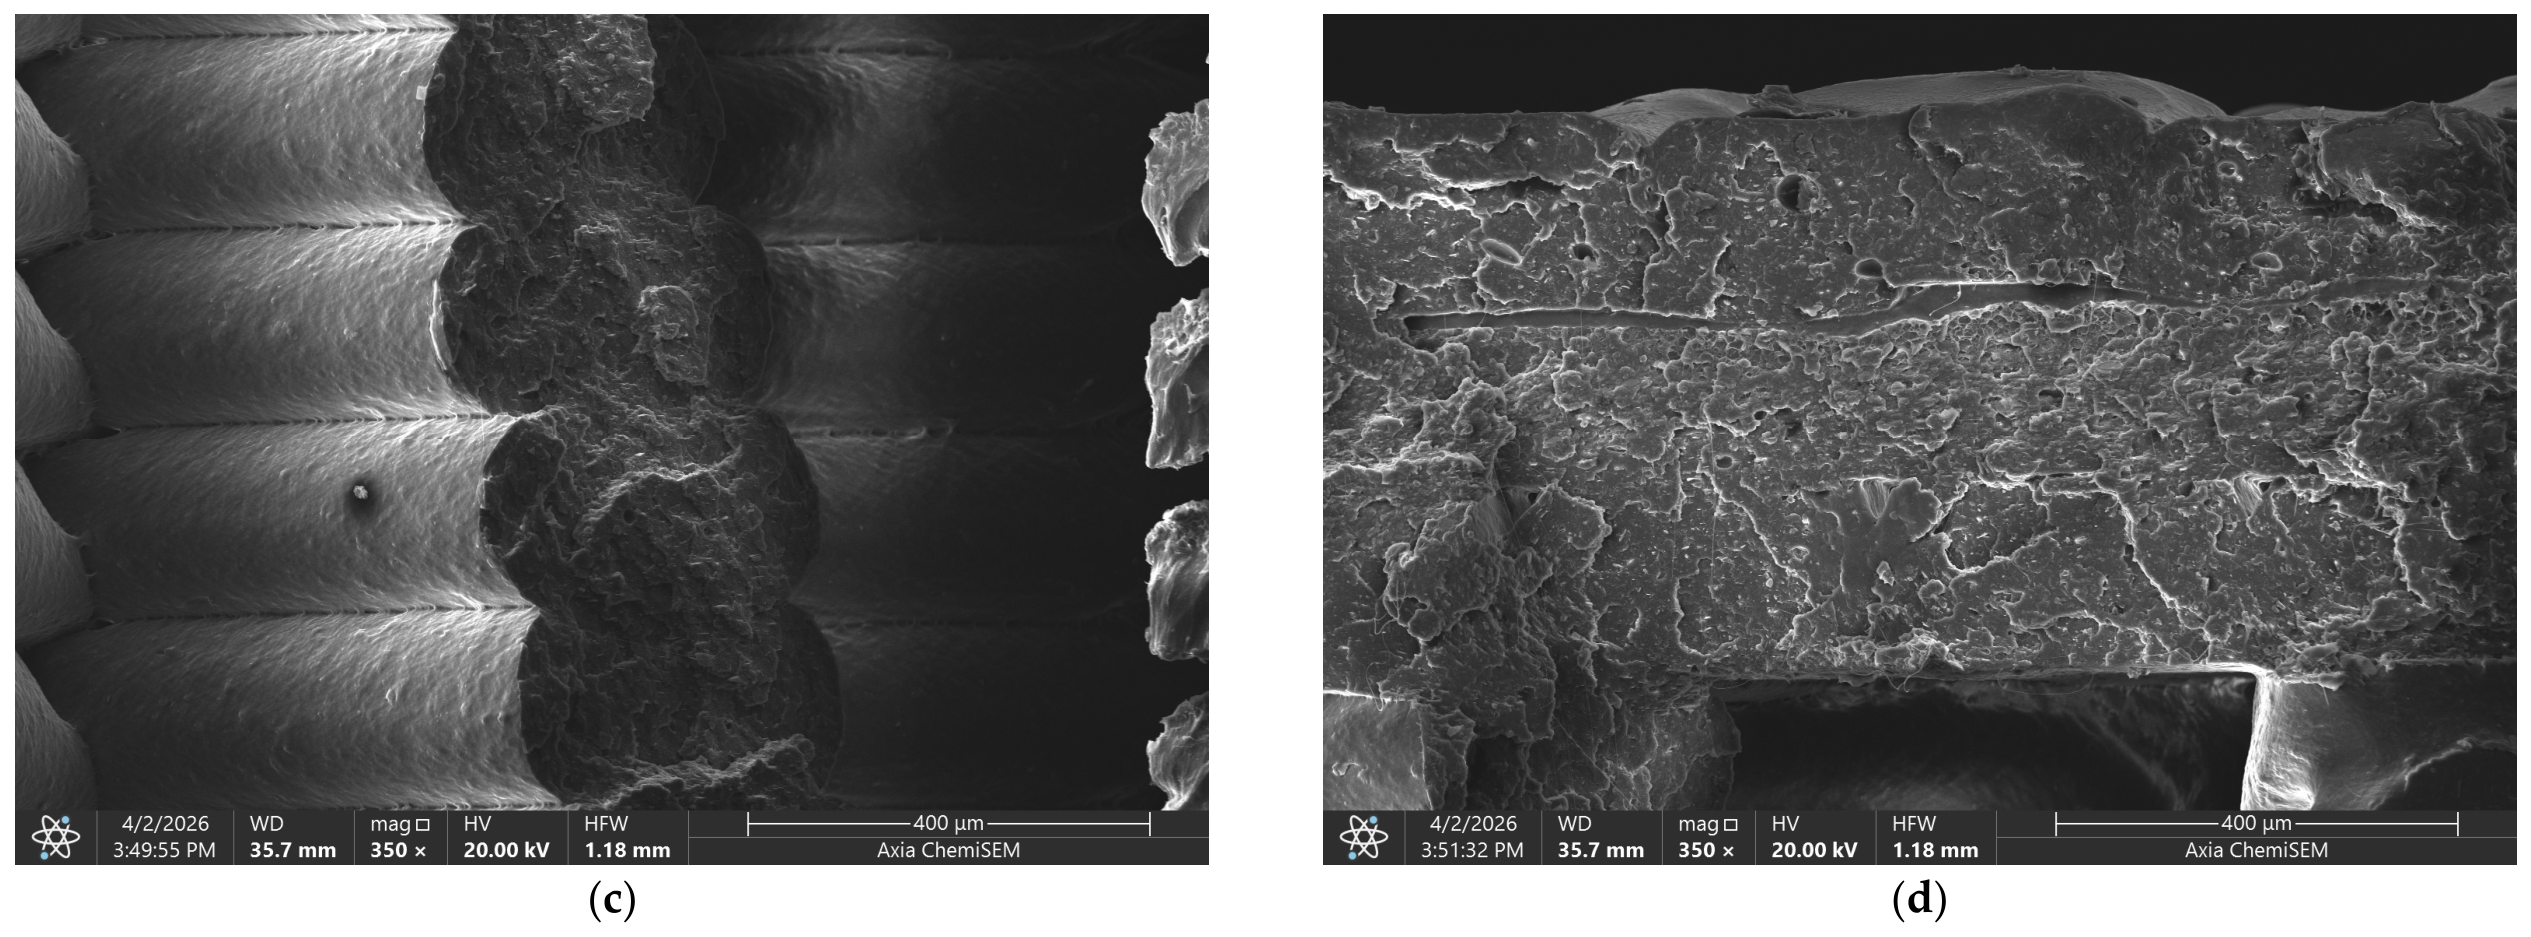
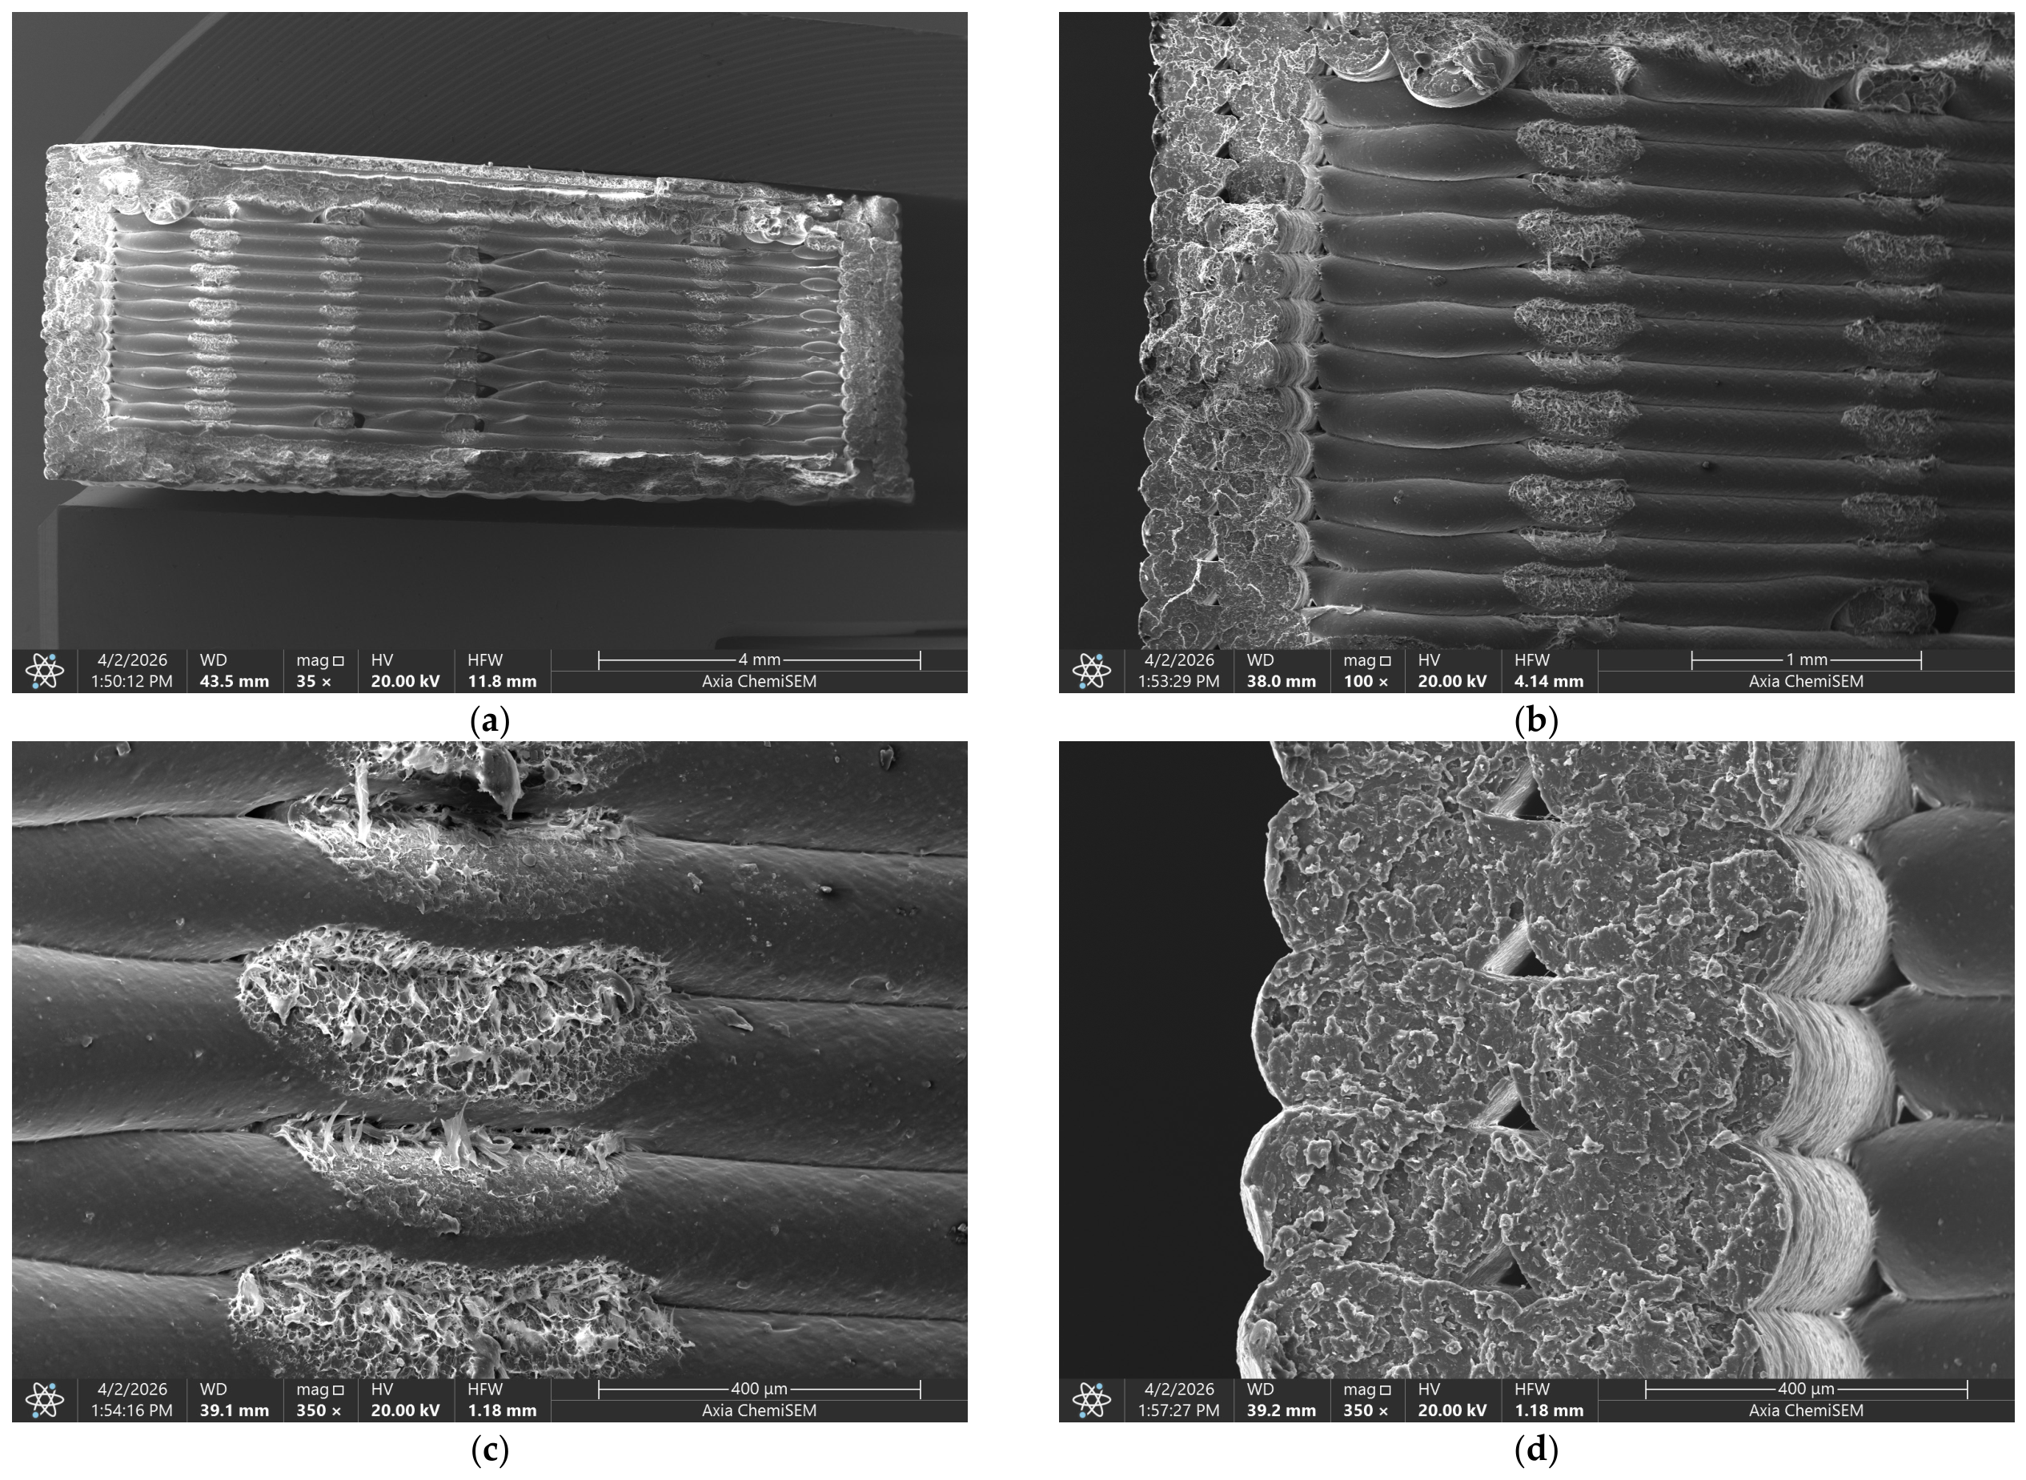
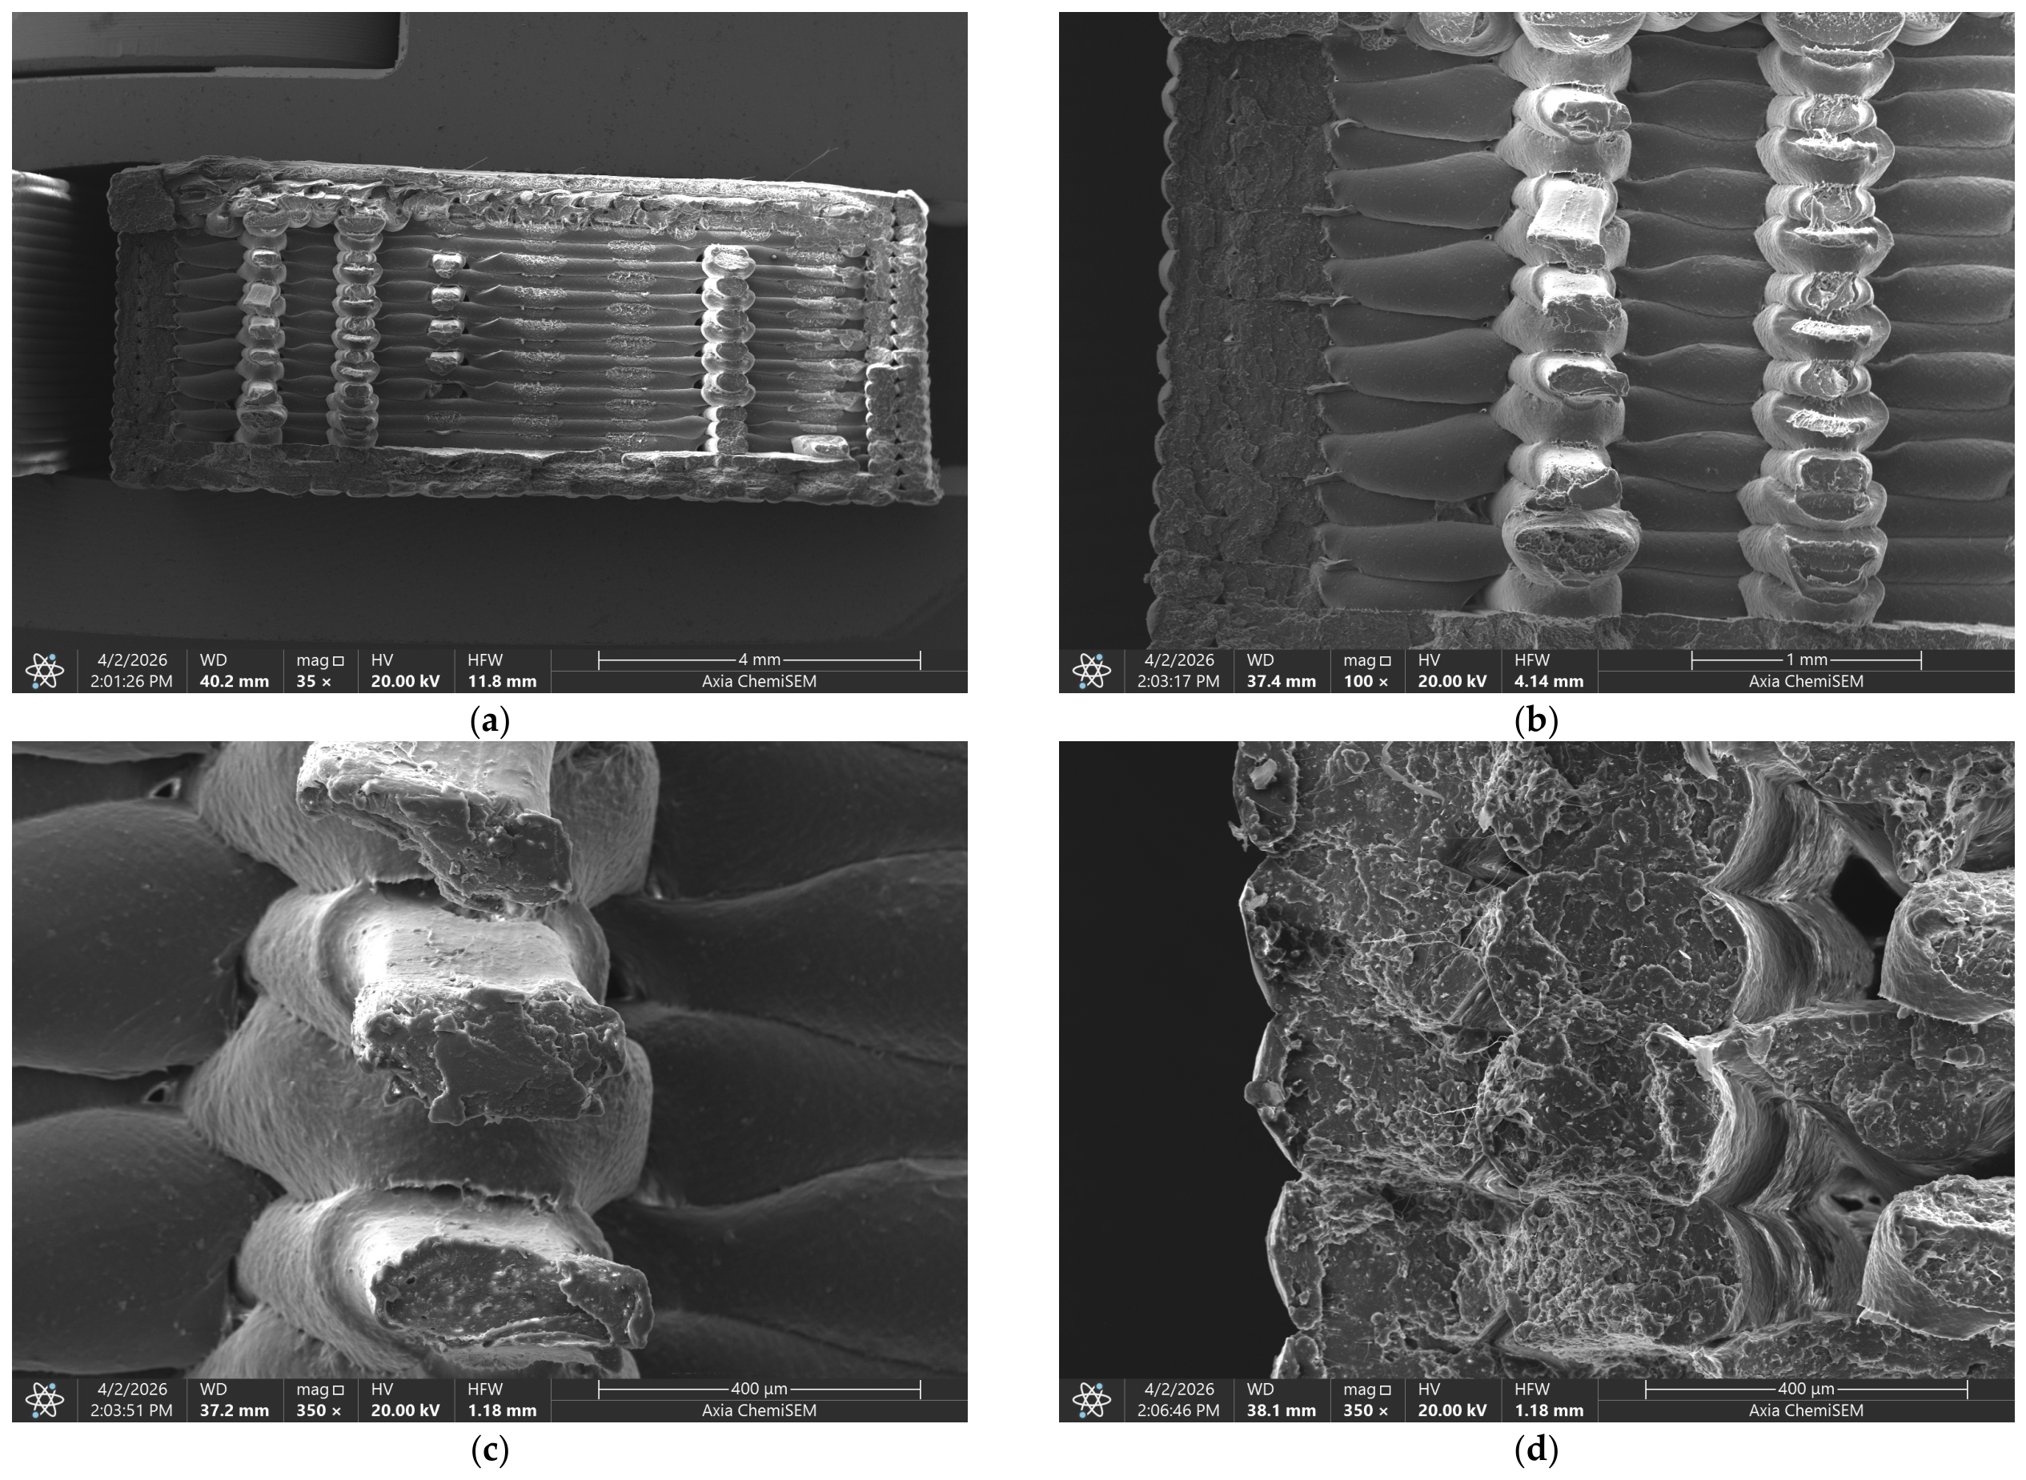
The fracture morphology of selected MEX-printed PLA samples was investigated by scanning electron microscopy after tensile testing to determine the fracture mechanisms associated with different infill patterns. Four representative samples were selected for SEM analysis: samples 5 (Figure 11), 7 (Figure 12), 13 (Figure 13), and 17 (Figure 14). These samples cover both types of infill examined and both infill densities, allowing for a comparison of the fracture characteristics associated with triangle and grid architectures at 50% and 70% densities.
At low magnification, the fracture surfaces demonstrated an irregular fracture path rather than a smooth and continuous crack plane. This morphology is typical of polymer structures 3D-printed using the MEX method, where fracture is determined not only by the polymer’s internal strength but also by the print architecture, including layer orientation, interlayer adhesion, voids, and layer interfaces. The fracture path generally followed areas of reduced adhesion or localized stress concentrations between neighboring deposited layers. This confirms that the internal structure created during the 3D printing process has played an important role in determining the tensile behavior discussed in Section 3.1.
Samples with lower density, especially in the Triangle-50 and Grid-50 configurations, showed more pronounced gaps and breaks between the deposited layers on the fracture surfaces. These features indicate that crack propagation was facilitated by the presence of internal voids and areas of weaker adhesion. In such structures, the effective cross-sectional area is reduced, and the crack can propagate more easily across the interfaces between layers. This observation is consistent with the lower tensile and fixed-deflection bending response values obtained for the 50% density groups.
The higher-density samples showed a more compact internal structure, with smaller open spaces between adjacent deposited roads. This is particularly important for the Grid-70 configuration represented by Sample 17, which also exhibited the highest bending load at a deflection of 4 mm. The denser architecture provides more continuous load-bearing paths and improves stress transfer through the sample. As a result, crack propagation becomes less dependent on large voids and more strongly affected by the quality of local bonds between neighboring roads and layers.
The comparison between Triangle and Grid samples indicates that the infill pattern affects not only the amount of internal material, but also the way cracks propagate through the printed architecture. In Triangle samples, the crack path can be redirected by the angular arrangement of the infill roads, whereas in Grid samples, the more continuous crossing structure may provide more effective load redistribution when the density is sufficiently high. This helps explain why the Grid pattern became more advantageous at 70% infill density in both tensile and bending tests.
The qualitative SEM observations support the interpretation that the mechanical behavior of MEX-printed PLA is controlled by the combined effect of the infill density, infill pattern, road orientation, and interfacial bonding quality. The selected higher-density fracture surfaces appeared more compact and exhibited less pronounced open gaps within the examined fields of view. These observations are consistent with the tensile and bending results and provide a microstructural explanation for the better mechanical performance of the Grid-70 configurations. It should be noted that the SEM analysis was qualitative and was performed only on samples after tensile tests to support the interpretation of fracture morphology.

3.5. Discussion

The results indicate that the mechanical properties and surface quality of PLA 3D MEX-printed samples are determined by a combination of internal architecture, surface formation conditions, and interphase adhesion quality. Tensile tests demonstrated that infill density is the dominant factor influencing mechanical strength, whilst the infill structure and direction change the mechanical response through their interaction with density. Bending tests confirmed the positive effect of higher infill density, although the ranking of individual samples did not correspond to that observed in the tensile tests. This difference suggests that the responses to tensile and bending stresses are determined in part by different structural features.
Published investigations offer a relevant framework for interpreting the tensile behavior measured in the present study. Ekşi and Karakaya [15] reported tensile strengths in the range of 19.10–31.46 MPa for PLA samples fabricated with 50% infill, and 26.16–30.19 MPa for samples with 75% infill. The tensile strength range obtained here (23.60–29.19 MPa) lies within these relatively broad intervals. More importantly, both studies demonstrated a similar overarching trend: an increase in nominal infill density enhances tensile performance by augmenting the volume fraction and continuity of load-bearing material.
Ben Hadj Hassine et al. [13] likewise identified infill density, infill pattern, and infill orientation as key parameters governing the mechanical response of MEX-printed PLA components. Although their work focused primarily on yield strength rather than ultimate tensile strength, the reported sensitivity of mechanical behavior to internal architecture is consistent with the tendencies observed in the present investigation.
Furthermore, Jatti et al. [16] reported tensile strengths of up to 54.20 MPa under optimized printing conditions and at considerably higher material content. Collectively, these studies corroborate the general conclusion that increased material continuity and reduced internal porosity or void content lead to improved mechanical performance of MEX-printed PLA structures.
Nevertheless, the numerical values reported in these studies should be interpreted as qualitative reference points rather than as definitive material performance benchmarks. The individual investigations employed different commercial PLA filaments, printer architectures, slicing software, print speeds, extrusion and build-plate temperatures, layer heights, wall and shell configurations, sample orientations and geometries, conditioning protocols, and mechanical testing standards. Consequently, overlap among the reported tensile-strength ranges does not substantiate equivalence of the underlying PLA materials or printing systems. Likewise, higher or lower tensile-strength values reported in a given study cannot be unambiguously ascribed to any single processing parameter in isolation.
The significance of this limitation is underscored by the work of Schwartz et al. [10], who reported substantial variability in the mechanical response of 11 commercially available PLA filaments. In a similar vein, Hodžić et al. [11] observed an approximately 33% variation in yield strength among PLA filaments from different manufacturers, despite using the same printer, nominally identical processing parameters, and an identical filament color. Controlled multi-material investigations, such as the study by Kadhum et al. [40] on PLA, PLA+, and PETG, demonstrate that a meaningful hierarchy of material performance can only be established when all materials are fabricated and characterized under a unified experimental protocol. Because the present study did not incorporate PLA from alternative manufacturers, nor other polymers processed using the same Bambu Lab A1–Bambu Studio configuration, it does not establish a cross-material performance hierarchy or disentangle intrinsic material sensitivity from process-induced sensitivity. Consequently, the conclusions drawn here are limited to comparisons among the examined infill conditions within the specific ELEGOO PLA–Bambu Lab A1–Bambu Studio system.
In tensile testing, the mechanical response is determined by the ability of the 3D-printed internal structures to transmit the applied load along the continuous 3D-printed layers and across the bonded interfaces between neighboring layers. Increasing the infill density from 50% to 70% increased the amount of supporting material, reduced the size of internal spaces, and increased the number of contact points between neighboring applied channels. As a result, the effective cross-sectional area increased, and stress became distributed across a more continuous internal structure. This indicates that samples with 70% infill generally performed better than those with 50% infill, and the average tensile strength increased from 24.62 MPa at 50% infill density to 27.65 MPa at 70% infill density, corresponding to an improvement of approximately 12.3%. This interpretation is consistent with previous studies showing that higher infill density improves the mechanical properties of MEX-printed PLA by increasing material continuity and reducing internal porosity [13,15,16].
Gibson–Ashby-type scaling relationships offer a rigorous quantitative framework for correlating the mechanical response of cellular, lattice, and partially infilled structures with their effective relative density. Implementation of this approach, however, necessitates accurate determination of the actual relative density for each printed configuration, a consistently defined fully dense reference property, and topology-specific calibration constants and scaling exponents.
In the present study, only the nominal slicer infill percentages were documented; the pre-test mass, effective sample volume, and actual porosity were not measured for each configuration, and no fully dense reference set produced with the same material and printing parameters was included. The samples and their complete fracture fragments were not retained in a condition that would permit reliable post-test mass determination. Because pre-test mass and actual sample dimensions were not recorded, the effective relative density cannot be reconstructed reliably from the current dataset. Accordingly, treating the nominal 50% and 70% slicer infill settings as direct surrogates for the effective relative density is likely to yield a quantitatively misleading interpretation.
Future investigations should therefore incorporate precise mass and dimensional measurements for each sample, fabrication and characterization of a fully dense reference series, quantitative porosity assessment via micro-computed tomography or image-based cross-sectional analysis, and independent calibration of the scaling relationships for the grid and triangle lattice topologies [41,42,43,44,45].
The effect of the infill pattern can be explained by differences in stress-transfer mechanisms and stress distribution within the 3D-printed structure. Even at the same nominal infill density, different patterns result in varying numbers of intersections between tracks, varying lengths of unsupported paths, and varying local stress concentration points. In a grid pattern, the printed lines form a more direct and continuous structure that supports the load, thereby improving stress transfer between the perimeter walls and the internal infill. In contrast, the triangular pattern creates more inclined load-transfer paths and a greater number of angular intersections, which can redirect stresses, but may also create local regions that promote crack initiation. Therefore, the observed differences between samples with a grid pattern and those with a triangular pattern should be interpreted as structure-dependent effects rather than as changes in the internal properties of the PLA material.
The influence of infill orientation is governed by the angle between the 3D-printed internal filaments and the principal load direction. When the filaments are aligned more favorably with respect to the applied tensile load, a larger proportion of the load can be transmitted axially along the filaments themselves. Conversely, as the filaments become increasingly inclined relative to the loading direction, load transfer relies predominantly on interfilament adhesion, interlayer interfaces, and shear transfer between adjacent filaments.
This mechanism accounts for the observation that infill orientation did not exert a uniformly dominant effect across all samples, yet still exhibited a statistically significant interaction with the infill pattern in the analysis of variance. In other words, the mechanical effect of orientation is contingent upon the manner in which the selected infill pattern connects the internal tracks to the sample boundaries and how the additively manufactured architecture redistributes and carries stress under loading.
During bending, the stress distribution differs from that in uniaxial tension because the outer regions of the sample experience the highest tensile and compressive stresses. In contrast, the central region is closer to the neutral axis. Therefore, the response to bending is more sensitive to the continuity of the outer layers, the interaction between the shell regions and the infill, and the ability of the internal architecture to support near-surface tensile and compressive zones. This explains why the bending results did not fully replicate the tensile results, although the positive effect of the higher infill density remained pronounced. The Grid-70 configuration again demonstrated the highest average bending response, indicating that this structure provides a favorable combination of material continuity, load transfer, and resistance to local stress concentration.
Layer height and wall thickness can also affect the mechanical properties of PLA 3D-printed parts. Layer height affects interlayer adhesion quality, the effective contact area between layers, and the formation of gaps between neighboring layers. Layer thickness, including the number of perimeter walls and the top/bottom layers, can also affect the strength of 3D-printed samples, especially under bending conditions, where the outer regions of the sample are subjected to the largest tensile and compressive stresses. The parameters were kept constant for all samples in this study: the layer height was 0.2 mm, and the wall parameters did not vary between the printing modes. Therefore, their effects were controlled for in the experimental design, and the observed differences were primarily attributable to infill density, infill pattern, and infill direction. However, in future studies, the interaction between wall parameters, layer height, and infill structure should be considered.
The results of the surface roughness measurements showed that clear differences in measured topography were observed among the top, side, and bottom surfaces. The average Sa values increased from 7.80 μm for the top surface to 13.47 μm for the side surface and 18.95 μm for the bottom surface, indicating that the observed surface-quality differences appeared to be governed primarily by the surface formation mechanism rather than by the infill architecture itself. Similar trends have been reported for MEX-printed PLA, where layer thickness was identified as one of the most influential parameters on surface roughness, with higher layer thicknesses generally resulting in more pronounced surface irregularities due to the staircase effect [46,47].
Under these 3D printing conditions, the bottom surface exhibited the highest roughness because it was formed in direct contact with the heated build plate, which was fitted with a textured Bambu PEI build plate. Therefore, the roughness of the bottom surface should be considered specific to this particular build surface and may vary significantly when using a different build surface. The side surface demonstrated a characteristic layered morphology, largely determined by the selected layer height of 0.2 mm. This observation is consistent with previous studies showing that layer thickness strongly controls the surface finish of MEX-manufactured PLA components and that reducing layer height generally improves surface quality [46,47]. Changing the layer height may therefore lead to a reduction or increase in the roughness of the side wall, depending on the printing conditions and the quality of material deposition. The top surface was generally the smoothest, though it remained sensitive to localized track overlap, filament flow, and infill direction.
Qualitative SEM observations provided microstructural support for the interpretation of the mechanical results. Samples with lower density exhibited more pronounced gaps and discontinuities between adjacent deposited roads, reducing the effective load-bearing cross-section and promoting crack initiation and propagation. In contrast, the selected higher-density fracture surfaces exhibited a more compact morphology and less pronounced visible gaps. Similar observations have been reported in [46], which identified void formation, insufficient fusion between adjacent filaments, and weak interlayer bonding as the main factors contributing to reduced mechanical performance in MEX-printed PLA samples. Therefore, the present SEM observations support the conclusion that the improved tensile strength and fixed-deflection bending response of higher-density samples were associated with enhanced structural continuity and more efficient stress transfer between the deposited layers.
The fracture behavior observed by SEM also supports these mechanism-based interpretations. In lower-density samples, cracks can initiate and propagate through internal voids, weak boundaries between filaments, and gaps between 3D-printed filaments. These defects reduce the effective bearing area and contribute to local stress concentration. In the selected higher-density fracture surfaces, less pronounced visible gaps and apparently improved continuity between deposited roads were observed. These morphological features may contribute to less direct crack propagation and to the improved mechanical response of the higher-density configurations. Thus, the observed fracture morphology supports the interpretation that the mechanical response of the 3D-printed PLA samples was controlled not only by the amount of material present in the cross-section but also by the quality and continuity of the 3D-printed internal structure. Similar mechanisms have been described in previous studies, in which the formation of voids, insufficient fusion between adjacent filaments, and weak interlayer bonding were identified as key factors that reduce the mechanical properties of PLA printed using the MEX method [46].
Recent studies reported in the literature provide additional context for the present findings. Croccolo et al. [48] demonstrated that the tensile performance of MEX-fabricated PLA components can be enhanced by selectively modifying the temperature and cooling conditions applied during infill deposition, without adversely affecting dimensional accuracy. Their results indicate that the mechanical response associated with a given infill architecture remains strongly influenced by the thermal history of the deposited filaments and the consequent quality of inter-filament bonding. These observations substantiate the methodological choice in the present work to keep all thermal and baseline printing parameters constant, while systematically varying only the infill pattern, density, and orientation.
The dependence of mechanical performance on internal topology is further corroborated by the results of Gocyk et al. [49], who observed pronounced differences in strength among honeycomb, gyroid, and Archimedean-chord infill architectures. These findings substantiate the conclusion that nominal infill percentage, considered in isolation, is insufficient to characterize mechanical behavior, as distinct topological configurations give rise to different load paths, node intersections, unsupported spans, and local stress concentrations. In the present study, this effect is manifested in the enhanced mechanical efficacy of the grid pattern relative to the triangular pattern at a nominal infill level of 70%.
For casting-pattern applications, Shah et al. [50] recently investigated the dimensional fidelity and surface integrity of additively manufactured impeller patterns intended for investment casting. Their findings underscore that the applicability of a printed pattern is governed not only by its mechanical integrity but also by its dimensional accuracy and surface topography. These observations corroborate the combined mechanical and surface-texture assessment framework adopted in the present study. Concurrently, their employment of a representative, geometrically complex pattern emphasizes the necessity for the subsequent phase of the present research to verify the selected printing configurations using actual casting-pattern geometries, followed by associated molding or casting operations.
A grid pattern with a 70% infill density demonstrated the most favorable overall mechanical properties among the configurations investigated—it combined good tensile strength with the highest average bending load at a deflection of 4 mm and a more compact fracture morphology. The superior performance of the Grid-70 configuration suggests that mechanical efficiency depends not only on the amount of deposited material but also on the internal architecture’s ability to distribute applied loads and limit stress concentrations. However, surface requirements should also be considered when selecting the final 3D print parameters. For applications where the quality of the bottom surface is critical, the choice of build platform can be just as important as the infill parameters. Similarly, if smooth side walls are required, the layer height should be optimized alongside the infill settings.
In general, the results indicate that the mechanical properties and surface quality should not be optimized separately. A higher infill density and the corresponding infill pattern improve internal mechanical strength, whilst the build surface, layer height, and deposition path determine the final surface morphology. Therefore, the optimal 3D printing strategy for PLA patterns produced by MEX 3D printing should balance mechanical strength, fixed-deflection bending response, and surface quality in accordance with the intended application.
It should be noted that this study was conducted on standardized samples for tensile and bending tests, rather than on full-scale disposable casting pattern or representative geometric shapes from foundries. Therefore, the results should be interpreted as screening data for MEX-printed PLA plastic, rather than as a comprehensive validation of the characteristics of a casting pattern. The use of standardized samples allowed us to isolate the effects of infill pattern, infill density, and infill direction under controlled conditions. However, real-world casting patterns may involve complex geometries, variable wall thicknesses, localized stress concentrations, dimensional-accuracy requirements, surface-quality constraints, assembly considerations, and specific handling conditions in the foundry. Therefore, further work should include testing representative disposable casting-pattern geometries and evaluating their dimensional stability, surface quality, handling resistance, molding behavior, and removal or burnout characteristics.


4. Conclusions

Based on the results obtained, the principal conclusions on the influence of infill density, pattern, and orientation are presented below, along with the study’s main limitations and recommended directions for future research.
This study showed that the mechanical properties and surface morphology of the MEX-printed PLA samples are determined not only by the material itself but also by the internal 3D printing structure. Across the range studied, the density of the infill was the dominant factor influencing the tensile strength. Increasing the infill density from 50% to 70% raised the average tensile strength from 24.62 to 27.65 MPa, indicating that greater structural material content and a more continuous internal structure improve load transfer under tensile stress.
The infill pattern also affected the mechanical properties. A grid pattern with a 70% infill density provided the most favorable overall mechanical response among the configurations studied. The highest tensile strength, 29.19 MPa, was obtained for the grid infill with a 70% infill density and an infill direction of 75°, while the highest bending load at a deflection of 4 mm, 107.97 N, was achieved for the grid infill with a 70% infill density and an infill direction of 15°. The bending results showed a similar positive trend with increasing infill density, although they were interpreted as a supplementary fixed-deflection comparison rather than as statistically conclusive flexural-property data. These results demonstrate that the tensile and bending results are connected but not identical, as the two loading modes involve different stress distributions and stress-transfer mechanisms.
In contrast to infill density, the influence of infill orientation was not consistent across all configurations and was contingent on its interaction with the specific infill pattern employed. Consequently, infill orientation should be evaluated in conjunction with infill topology, sample geometry, and loading direction, rather than treated as an independent variable. The qualitative SEM observations supported these interpretations, demonstrating that the fracture pattern is associated with voids, inter-track boundaries, interlayer regions, and local discontinuities in the 3D-printed structure.
Within the investigated ELEGOO PLA–Bambu Lab A1–Bambu Studio 2.5.0 configuration, the 70% grid infill exhibited the most advantageous overall mechanical performance among the examined parameter sets. This outcome must not be construed as a universal optimum for PLA materials or for other MEX platforms. Rather, the results constitute system-specific screening data intended to inform subsequent assessments in single-use or sacrificial casting-pattern applications. However, surface requirements should also be considered when selecting printing parameters, as the roughness measurements revealed clear differences among the top, side, and bottom surfaces. In particular, the bottom-surface morphology should be interpreted in the context of the textured Bambu PEI plate, while the side-surface results are specific to the fixed layer height of 0.2 mm used in this study.
The main limitation of the study is that the experiments were conducted on standardized tensile and bending samples rather than on representative full-scale casting-pattern geometries. The present study evaluates the effects of infill pattern, infill density, and infill direction on the mechanical performance of PLA samples printed by MEX to compare selected infill parameters and identify a candidate configuration for subsequent evaluation in casting-pattern applications. Therefore, the results should be interpreted as data obtained at the parameter level, rather than as a comprehensive evaluation of the characteristics of single-use models. Furthermore, only one PLA material, one printer–slicer system, two infill densities, and two infill patterns were investigated. Future studies will consider additional infill densities, reference samples with full density, quantitative porosity analysis, other 3D printing materials, and testing on representative part geometries.

Author Contributions

Conceptualisation, G.T. and A.R.; formal analysis, G.Z. and A.R.; investigation, G.T. and O.K.; methodology, O.K.; resources, G.T. and J.Š.; writing—original draft preparation, G.T., O.K. and A.R.; writing—review and editing, G.T., O.K. and A.R.; visualisation, O.K. and J.Š. All authors have read and agreed to the published version of the manuscript.

Funding

This research received no external funding.

Institutional Review Board Statement

Not applicable.

Informed Consent Statement

Not applicable.

Data Availability Statement

The original contributions presented in the study are included in the article; further inquiries can be directed to the corresponding author.

Acknowledgments

During the preparation of this manuscript, the authors used DeepL Translator (web version; accessed on 24 August 2026, DeepL SE, Cologne, Germany, https://www.deepl.com/en), Grammarly for Microsoft Word (version v1.2.289.1946; Grammarly, Inc., San Francisco, CA, USA, https://www.grammarly.com/), and Writefull Premium for Microsoft Word (version 2025.59.0 (#1326); Writefull, Amsterdam, The Netherlands, https://www.writefull.com/) for the purposes of language editing and proofreading (translation, grammar, structure, spelling, punctuation, and formatting), as they are non-native English speakers. A premium Writefull subscription was provided by Vilnius Gediminas Technical University. The authors declare that AI was not used in the preparation and development of the presented research, paragraphs, results, or the manuscript. The authors have reviewed and edited the output and take full responsibility for the content of this publication.

Conflicts of Interest

The authors declare no conflicts of interest.

Abbreviations

The following abbreviations are used in this manuscript:
ABSAcrylonitrile butadiene styrene
FDMFused deposition modeling
FFFFused filament fabrication
PLAPolylactic acid
MEXMaterial Extrusion
SEMScanning electron microscopy
STLStereolithography file format
PEIPolyetherimide
PETPolyethylene terephthalate
PETGPolyethylene terephthalate glycol-modified
PEEKPolyether ether ketone
ANOVAAnalysis of variance
SaArithmetical mean height
SqRoot mean square height
SzMaximum height
RaArithmetic mean roughness of the profile
RqRoot mean square roughness of the profile
RzMaximum height of the profile
RSMResponse surface methodology

References

  1. ISO/ASTM 52900:2021; Additive Manufacturing—General Principles—Fundamentals and Vocabulary. ISO: Geneva, Switzerland, 2021.
  2. Jayawardane, H.; Davies, I.J.; Gamage, J.R.; John, M.; Biswas, W.K. Sustainability perspectives—A review of additive and subtractive manufacturing. Sustain. Manuf. Serv. Econ. 2023, 2, 100015. [Google Scholar] [CrossRef] [Scilit]
  3. Pérez, M.; Carou, D.; Rubio, E.M.; Teti, R. Current advances in additive manufacturing. Procedia CIRP 2020, 88, 439–444. [Google Scholar] [CrossRef] [Scilit]
  4. Zhai, X.; Jin, L.; Jiang, J. A survey of additive manufacturing reviews. Mater. Sci. Addit. Manuf. 2022, 1, 21. [Google Scholar] [CrossRef] [Scilit]
  5. Zhou, L.; Miller, J.; Vezza, J.; Mayster, M.; Raffay, M.; Justice, Q.; Al Tamimi, Z.; Hansotte, G.; Sunkara, L.D.; Bernat, J. Additive manufacturing: A comprehensive review. Sensors 2024, 24, 2668. [Google Scholar] [CrossRef] [Scilit] [PubMed]
  6. Solomon, I.J.; Sevvel, P.; Gunasekaran, J. A review on the various processing parameters in FDM. Mater. Today Proc. 2021, 37, 509–514. [Google Scholar] [CrossRef] [Scilit]
  7. Valerga, A.P.; Batista, M.; Salguero, J.; Girot, F. Influence of PLA filament conditions on characteristics of FDM parts. Materials 2018, 11, 1322. [Google Scholar] [CrossRef] [Scilit] [PubMed]
  8. Algarni, M.; Ghazali, S. Comparative study of the sensitivity of pla, abs, peek, and petg’s mechanical properties to fdm printing process parameters. Crystals 2021, 11, 995. [Google Scholar] [CrossRef] [Scilit]
  9. Srivastava, M.; Rathee, S.; Patel, V.; Kumar, A.; Koppad, P.G. A review of various materials for additive manufacturing: Recent trends and processing issues. J. Mater. Res. Technol. 2022, 21, 2612–2641. [Google Scholar] [CrossRef] [Scilit]
  10. Schwartz, J.J.; Hamel, J.; Ekstrom, T.; Ndagang, L.; Boydston, A.J. Not All PLA Filaments Are Created Equal: An Experimental Investigation. Rapid Prototyp. J. 2020, 26, 1263–1276. [Google Scholar] [CrossRef] [Scilit]
  11. Hodžić, D.; Pandžić, A.; Hajro, I.; Tasić, P. Strength Comparison of FDM 3D Printed PLA Made by Different Manufacturers. TEM J. 2020, 9, 966–970. [Google Scholar] [CrossRef] [Scilit]
  12. Ganeshkumar, S.; Kumar, S.D.; Magarajan, U.; Rajkumar, S.; Arulmurugan, B.; Sharma, S.; Li, C.; Ilyas, R.A.; Badran, M.F. Investigation of Tensile Properties of Different Infill Pattern Structures of 3D-Printed PLA Polymers: Analysis and Validation Using Finite Element Analysis in ANSYS. Materials 2022, 15, 5142. [Google Scholar] [CrossRef] [Scilit] [PubMed]
  13. Ben hadj Hassine, S.; Chatti, S.; Louhichi, B.; Seibi, A. Experimental Study of the Tensile Behavior of Structures Obtained by FDM 3D Printing Process. Polymers 2024, 16, 1562. [Google Scholar] [CrossRef] [Scilit] [PubMed]
  14. ASTM D638-14; Standard Test Method for Tensile Properties of Plastics. ASTM International: West Conshohocken, PA, USA, 2014.
  15. Ekşi, S.; Karakaya, C. Effects of Process Parameters on Tensile Properties of 3D-Printed PLA Parts Fabricated with the FDM Method. Polymers 2025, 17, 1934. [Google Scholar] [CrossRef] [Scilit] [PubMed]
  16. Jatti, V.S.; Sapre, M.S.; Jatti, A.V.; Khedkar, N.K.; Jatti, V.S. Mechanical Properties of 3D-Printed Components Using Fused Deposition Modeling: Optimization Using the Desirability Approach and Machine Learning Regressor. Appl. Syst. Innov. 2022, 5, 112. [Google Scholar] [CrossRef] [Scilit]
  17. Khaliq, J.; Gurrapu, D.R.; Elfakhri, F. Effects of Infill Line Multiplier and Patterns on Mechanical Properties of Lightweight and Resilient Hollow Section Products Manufactured Using Fused Filament Fabrication. Polymers 2023, 15, 2585. [Google Scholar] [CrossRef] [Scilit] [PubMed]
  18. Vázquez-Silva, E.; Pintado-Pintado, J.A.; Moncayo-Matute, F.P.; Torres-Jara, P.B.; Moya-Loaiza, D.P. Effect of Infill Density on the Mechanical Properties of Natural Peek Processed by Additive Manufacturing. Polymers 2025, 17, 347. [Google Scholar] [CrossRef] [Scilit] [PubMed]
  19. Kozior, T.; Kundera, C. Evaluation of the Influence of Parameters of FDM Technology on the Selected Mechanical Properties of Models. Procedia Eng. 2017, 192, 463–468. [Google Scholar] [CrossRef] [Scilit]
  20. ISO 3384-1:2024; Rubber, Vulcanized or Thermoplastic—Determination of Stress Relaxation in Compression Part 1: Testing at Constant Temperature. ISO: Geneva, Switzerland, 2024.
  21. Nguyen, T.T.; Tran, V.T.; Pham, T.H.N.; Nguyen, V.-T.; Thanh, N.C.; Thi, H.M.N.; Duy, N.V.A.; Thanh, D.N.; Nguyen, V.T.T. Influences of Material Selection, Infill Ratio, and Layer Height in the 3D Printing Cavity Process on the Surface Roughness of Printed Patterns and Casted Products in Investment Casting. Micromachines 2023, 14, 395. [Google Scholar] [CrossRef] [Scilit] [PubMed]
  22. Lalegani Dezaki, M.; Ariffin, M.K.A.M.; Serjouei, A.; Zolfagharian, A.; Hatami, S.; Bodaghi, M. Influence of Infill Patterns Generated by CAD and FDM 3D Printer on Surface Roughness and Tensile Strength Properties. Appl. Sci. 2021, 11, 7272. [Google Scholar] [CrossRef] [Scilit]
  23. Sedlák, J.; Spišák, L.; Hrušecká, D.; Juřičková, E.; Hrbáčková, L.; Joska, Z. Analysis of Test Plastic Samples Printed by the Additive Method Fused Filament Fabrication. MM Sci. J. 2021, 2021, 4283–4290. [Google Scholar] [CrossRef] [Scilit]
  24. Saharudin, M.S.; Hajnys, J.; Kozior, T.; Gogolewski, D.; Zmarzły, P. Quality of Surface Texture and Mechanical Properties of PLA and PA-Based Material Reinforced with Carbon Fibers Manufactured by FDM and CFF 3D Printing Technologies. Polymers 2021, 13, 1671. [Google Scholar] [CrossRef] [Scilit] [PubMed]
  25. Zhu, Z.; Lou, S.; Majewski, C. Characterisation and Correlation of Areal Surface Texture with Processing Parameters and Porosity of High Speed Sintered Parts. Addit. Manuf. 2020, 36, 101402. [Google Scholar] [CrossRef] [Scilit]
  26. ELEGOO PLA 3D Printer Filament 1.75mm Colored 1KG. (n.d.). ELEGOO EU. Available online: https://eu.elegoo.com/products/pla-filament-1-75mm-colored-1kg (accessed on 2 February 2026).
  27. Bambu Lab A1 3D Printer (n.d.). Bambu Lab EU Store. Available online: https://eu.store.bambulab.com/products/a1 (accessed on 5 January 2026).
  28. Kapustynskyi, O.; Višniakov, N. Effect of Local Laser Treatment on the Strengthening of Thin-Walled Structures Fabricated from Non-Alloy Steel. Materials 2023, 16, 4555. [Google Scholar] [CrossRef] [Scilit] [PubMed]
  29. ISO 527-1:2019; Plastics—Determination of Tensile Properties Part 1: General Principles. ISO: Geneva, Switzerland, 2019.
  30. ISO 527-2:2025; Plastics—Determination of Tensile Properties Part 2: Test Conditions for Molding and Extrusion Plastics. ISO: Geneva, Switzerland, 2025.
  31. ISO 20753:2023; Plastics—Test Samples. ISO: Geneva, Switzerland, 2023.
  32. ISO 178:2019; Plastics—Determination of Flexural Properties. ISO: Geneva, Switzerland, 2019.
  33. Maqsood, N.; Islam, B.; Stravinskas, K.; Kapustynskyi, O.; Petkevič, R.; Shahidi, A.; Mordas, G. Comparative Study of AlSi10Mg and 304 Stainless-Steel Fillers in PA12 Composites Manufactured Using Injection Molding Process for Liners and Sleeve-Based Applications: Microstructure, Mechanical Properties, Thermal Stability, and Wear Behavior. Polymers 2025, 17, 2785. [Google Scholar] [CrossRef] [Scilit] [PubMed]
  34. ISO 25178-2:2021; Geometrical Product Specifications (GPS)—Surface Texture: Areal Part 2: Terms, Definitions and Surface Texture Parameters. ISO: Geneva, Switzerland, 2021.
  35. ISO 21920-2:2021; Geometrical Product Specifications (GPS)—Surface Texture: Profile Part 2: Terms, Definitions and Surface Texture Parameters. ISO: Geneva, Switzerland, 2021.
  36. Axia ChemiSEM. Thermo Fisher Scientific. Available online: https://www.thermofisher.com/lt/en/home/electron-microscopy/products/scanning-electron-microscopes/axia-chemisem (accessed on 11 February 2026).
  37. Višniakov, N.; Beinoras, P.; Kapustynskyi, O. Upset Resistance Welding of a Microcomposite Cu-Nb Conductor for Pulsed Power Applications. Metals 2025, 15, 394. [Google Scholar] [CrossRef] [Scilit]
  38. Inverted Eclipse MA200. Nikon Instruments Inc. Available online: https://industry.nikon.com/en-us/products/industrial-microscopy/industrial-microscopes/inverted-eclipse-ma200 (accessed on 11 February 2025).
  39. Moticam A16. Motic Europe. Available online: https://moticeurope.com/en/moticam-a16.html (accessed on 11 February 2025).
  40. Kadhum, A.H.; Al-Zubaidi, S.; Abdulkareem, S.S. Effect of the Infill Patterns on the Mechanical and Surface Characteristics of 3D Printing of PLA, PLA+ and PETG Materials. ChemEngineering 2023, 7, 46. [Google Scholar] [CrossRef] [Scilit]
  41. Gibson, L.J.; Ashby, M.F. Cellular Solids: Structure and Properties, 2nd ed.; Cambridge University Press: Cambridge, UK, 1997. [Google Scholar]
  42. Cerda-Avila, S.N.; Medellín-Castillo, H.I.; Lim, T. Analytical Models to Estimate the Structural Behaviour of Fused Deposition Modelling Components. Rapid Prototyp. J. 2021, 27, 658–670. [Google Scholar] [CrossRef] [Scilit]
  43. Syrlybayev, D.; Perveen, A.; Talamona, D. Experimental Investigation of Mechanical Properties and Energy Absorption Capabilities of Hybrid Lattice Structures Manufactured Using Fused Filament Fabrication. Int. J. Adv. Manuf. Technol. 2023, 125, 2833–2850. [Google Scholar] [CrossRef] [Scilit]
  44. Maskery, I.; Sturm, L.; Aremu, A.O.; Panesar, A.; Williams, C.B.; Tuck, C.J.; Wildman, R.D.; Ashcroft, I.A.; Hague, R.J.M. Insights into the Mechanical Properties of Several Triply Periodic Minimal Surface Lattice Structures Made by Polymer Additive Manufacturing. Polymer 2018, 152, 62–71. [Google Scholar] [CrossRef] [Scilit]
  45. Ghosh, M.; D’Souza, N.A. Improved Mechanical Performance in FDM Cellular Frame Structures through Partial Incorporation of Faces. Polymers 2024, 16, 1340. [Google Scholar] [CrossRef] [Scilit] [PubMed]
  46. Gajjar, T.; Yang, R.; Ye, L.; Zhang, Y.X. Effects of key process parameters on tensile properties and interlayer bonding behavior of 3D printed PLA using fused filament fabrication. Prog. Addit. Manuf. 2025, 10, 1261–1280. [Google Scholar] [CrossRef] [Scilit]
  47. Bintara, R.D.; Lubis, D.Z.; Pradana, Y.R.A. The effect of layer height on the surface roughness in 3D printed polylactic acid (PLA) using FDM 3D printing. IOP Conf. Ser. Mater. Sci. Eng. 2021, 1034, 012096. [Google Scholar] [CrossRef] [Scilit]
  48. Croccolo, D.; De Agostinis, M.; Fini, S.; Mele, M.; Olmi, G.; Campana, G. Effects of Infill Temperature on the Tensile Properties and Warping of 3D-Printed Polylactic Acid. Prog. Addit. Manuf. 2024, 9, 919–934. [Google Scholar] [CrossRef] [Scilit]
  49. Gocyk, K.; Afshar, R.; Abali, B.E. On Strength Variations Effected by Infill Patterns Such as Honeycomb, Gyroid, and Archimedean Chords Used in Additive Manufacturing. Polymers 2026, 18, 1619. [Google Scholar] [CrossRef] [Scilit] [PubMed]
  50. Shah, M.; Patel, D.; Pande, S.; Alasim, F.; Mahajan, K.A. Accuracy in Additively Manufactured Impeller Patterns: An Experimental Study of Dimensional Fidelity and Surface Integrity. Processes 2026, 14, 835. [Google Scholar] [CrossRef] [Scilit]
Figure 1. Infill pattern for triangle: (a) 50%, 0°; (b) 50%, 15°; (c) 50%, 30°; (d) 50%, 75°; (e) 50%, 90°; (f) 70%, 0°; (g) 70%, 15°; (h) 70%, 30°; (i) 70%, 75°; (j) 70%, 90°.
Applsci 16 08538 g001
Figure 2. Infill pattern for grid: (a) 50%, 0°; (b) 50%, 15°; (c) 50%, 30°; (d) 50%, 75°; (e) 50%, 90°; (f) 70%, 0°; (g) 70%, 15°; (h) 70%, 30°; (i) 70%, 75°; (j) 70%, 90°.
Applsci 16 08538 g002
Figure 3. Tensile testing: (a) 3D-printed samples for the tensile test; (b) tensile test setup.
Applsci 16 08538 g003
Figure 4. Bending testing: (a) 3D-printed samples for the bending test; (b) bending test setup.
Applsci 16 08538 g004
Figure 5. Tensile strength of MEX-printed PLA as a function of infill direction for different infill pattern–density combinations. Error bars indicate standard deviation, n = 3.
Applsci 16 08538 g005
Figure 6. Samples after tensile testing: (a) samples 1–3; (b) samples 16–17.
Applsci 16 08538 g006
Figure 7. Distribution of tensile strength grouped by infill pattern and density.
Applsci 16 08538 g007
Figure 8. Distribution of bending loads grouped by infill pattern and density.
Applsci 16 08538 g008
Figure 9. Samples after bending testing: (a) samples 1–5; (b) samples 16–20.
Applsci 16 08538 g009
Figure 10. 3D surface topography maps of MEX-printed PLA sample 17 (Grid, 70%, 15°): (a) top surface, (b) side surface, and (c) bottom surface.
Applsci 16 08538 g010
Figure 11. SEM fracture morphology of sample 5 after tensile loading, a representative low-density triangle configuration, with infill density 50% and infill direction 90°: (a) magnification ×35, (b) magnification ×100, (c) magnification ×350, (d) magnification ×350.
Applsci 16 08538 g011
Figure 12. SEM fracture morphology of sample 7 after tensile loading, a representative high-density triangle configuration with infill density 70% and infill direction 15°: (a) magnification ×35, (b) magnification ×100, (c) magnification ×350, (d) magnification ×350.
Applsci 16 08538 g012aApplsci 16 08538 g012b
Figure 13. SEM fracture morphology of sample 13 after tensile loading, a representative low-density grid configuration with infill density 50% and infill direction 30°: (a) magnification ×35, (b) magnification ×100, (c) magnification ×350, (d) magnification ×350.
Applsci 16 08538 g013
Figure 14. SEM fracture morphology of sample 17 after tensile loading, a representative high-density grid configuration with the highest bending response, infill density 70%, and infill direction 15°: (a) magnification ×35, (b) magnification ×100, (c) magnification ×350, (d) magnification ×350.
Applsci 16 08538 g014
Table 1. Properties of commercially available PLA material [26].
ManufacturerDiameter, mmDensity, g/cm3Melt Index,
g/10 min
Melting
Temperature, °C
Tensile Strength (Z), MPaBending Strength, MPa
Elegoo PLA1.75 mm ± 0.03 mm1.268.1 ± 1.515823 ± 272 ± 5
The values in Table 1 are manufacturer-reported material data and are provided for material identification only. They should not be treated as directly comparable reference values for the samples tested in the present study because the manufacturer’s sample geometry, printing system, orientation, and test conditions may differ.
Table 2. Technical data of the Bambu Lab A1 3D printing machine [27].
SpecificationsBambu Lab A1
Build Volume, mm3256 × 256 × 256
Hot EndAll-Metal
Extruder GearsHardened Steel
NozzleHardened Steel
Nozzle Diameter, mm0.4
Filament Diameter, mm1.75
Heatbed Build PlateBambu Textured PEI Plate
Supported FilamentIdeal for PLA, PETG, etc.
Table 3. Geometric printing parameters.
PatternInfill DensityInfill Direction/Sample Number
15°30°75°90°
Triangle50%12345
70%678910
Grid50%1112131415
70%1617181920
Table 4. Tensile strength of MEX-printed PLA samples.
Sample NumberPatternInfill Density, %Infill Direction, °σ, MPaSD, MPa
1Triangle50023.600.56
2Triangle501524.910.66
3Triangle503024.580.95
4Triangle507524.530.70
5Triangle509023.950.36
6Triangle70026.151.19
7Triangle701527.691.11
8Triangle703027.160.35
9Triangle707526.460.55
10Triangle709025.450.70
11Grid50024.951.37
12Grid501524.740.53
13Grid503025.221.45
14Grid507524.720.71
15Grid509024.990.57
16Grid70028.671.81
17Grid701527.601.10
18Grid703028.990.46
19Grid707529.190.12
20Grid709029.140.74
Note: Values are presented as mean ± standard deviation (SD), n = 3.
Table 5. Three-way ANOVA results for tensile strength of MEX-printed PLA samples.
SourcedfF-Valuep-ValuePartial ηp2
Pattern134.95<0.0010.466
Density1170.30<0.0010.810
Infill direction41.080.3790.098
Pattern × Density110.790.0020.212
Pattern × Infill direction43.320.0190.249
Density × Infill direction40.140.9680.013
Pattern × Density × Infill direction41.040.3840.097
Residual40---
Table 6. Bending load of MEX-printed PLA samples at 4 mm deflection.
Sample NumberPatternInfill Density, %Infill Direction, °Mean, NSD, N
1Triangle50093.411.092
2Triangle5015104.8931.541
3Triangle503097.6262.448
4Triangle507590.2598.272
5Triangle509089.4970.084
6Triangle700102.66.879
7Triangle701592.1952.318
8Triangle703096.1582.989
9Triangle7075101.4191.666
10Triangle709095.261.505
11Grid50090.2167.083
12Grid5015100.1840.891
13Grid503086.5964.389
14Grid5075100.8061.829
15Grid509092.1695.717
16Grid70096.5594.295
17Grid7015107.9732.469
18Grid703096.0415.751
19Grid7075100.23115.375
20Grid7090103.2120
Note: Values are presented as mean ± standard deviation, n = 3.
Table 7. Surface roughness parameters of MEX-printed PLA.
SurfaceSa, µmSq, µmSz, µmRa, µmRq, µmRz, µm
Top7.80 ± 2.429.39 ± 2.8055.42 ± 14.313.63 ± 2.034.33 ± 2.3515.85 ± 8.87
Side13.47 ± 0.4816.96 ± 0.6583.24 ± 5.2712.34 ± 0.6015.51 ± 0.7353.57 ± 2.27
Bottom18.95 ± 1.2223.54 ± 1.10135.96 ± 8.246.85 ± 2.278.54 ± 2.8632.95 ± 13.08
Note: Values are presented as mean ± standard deviation.
Table 8. Surface roughness parameters Sa, Sq, and Sz of MEX-printed PLA.
SamplePatternInfill Density, %Infill
Direction, °
Sa, µmSq, µmSz, µm
TopSideBottomTopSideBottomTopSideBottom
1Triangle5006.2013.4316.697.8617.2321.6153.9383.07129.60
2Triangle50155.8313.1718.547.1016.4823.6050.1581.73141.40
3Triangle50307.1213.5018.038.6116.9022.5251.4693.19128.10
4Triangle50759.2513.6918.9610.7817.3623.6060.6285.47137.60
5Triangle50908.0113.2718.279.6216.8522.2754.8786.82126.60
6Triangle7004.6212.8519.165.6416.0423.3934.9580.97131.70
7Triangle70156.3812.8018.387.7516.1722.9243.3180.94123.20
8Triangle70307.1313.9419.508.7017.8724.5249.9195.12141.80
9Triangle70759.6812.9920.2111.9616.2624.8579.3078.80135.10
10Triangle709010.1413.7818.2911.8517.3222.7669.4577.76132.70
11Grid5006.6113.9918.328.2417.7323.3947.1379.96150.10
12Grid50155.7813.9819.287.0917.6124.7444.8785.05146.80
13Grid50306.0213.6217.397.3617.0122.4848.8180.72140.90
14Grid50759.3413.9420.3210.8317.5124.5559.7286.83140.90
15Grid50907.6213.9618.278.9117.6122.4458.5587.97138.60
16Grid7005.8613.6320.017.1617.4223.7740.3586.04125.80
17Grid70155.8613.1018.707.0416.6723.6036.1283.50139.80
18Grid70308.4213.0419.819.9616.4024.4258.1778.51129.70
19Grid707511.1312.4421.9713.7515.5526.2379.5472.82151.40
20Grid709014.9213.0818.1117.5316.3523.1987.2279.59127.40
Table 9. Surface roughness parameters Ra, Rq, and Rz of MEX-printed PLA.
SamplePatternInfill Density, %Infill
Direction, °
Ra, µmRq, µmRz, µm
TopSideBottomTopSideBottomTopSideBottom
1Triangle5005.2912.947.646.5516.418.6928.0457.2727.96
2Triangle50155.5712.046.556.4415.027.9324.3653.1727.78
3Triangle50305.2812.644.616.2015.615.9123.2853.4424.18
4Triangle50751.5012.528.991.8615.8211.387.8854.9046.59
5Triangle50901.1112.488.771.3615.6610.546.7655.5138.14
6Triangle7003.7511.986.324.3314.887.7316.0751.5723.81
7Triangle70154.9811.404.916.1914.586.4024.4850.4821.06
8Triangle70304.9612.477.265.6816.019.8121.0453.6328.03
9Triangle70751.5912.078.821.9515.2510.797.8252.6951.19
10Triangle70900.9113.015.281.1416.406.325.8354.7724.99
11Grid5005.1713.362.746.7516.643.5030.5256.4314.68
12Grid50155.2312.948.445.9316.1811.3321.0255.8236.59
13Grid50304.5712.623.775.3515.854.6720.6954.1619.14
14Grid50751.2512.808.751.6915.9210.817.8855.1942.96
15Grid50900.9112.737.971.1616.039.796.0955.6948.68
16Grid7005.4112.475.946.3515.877.9922.8054.0130.96
17Grid70155.2011.697.366.0314.948.6620.8052.8329.23
18Grid70306.8111.465.207.7014.576.3126.0049.6120.73
19Grid70751.8711.3012.572.3314.1615.8610.8049.1863.26
20Grid70901.3011.935.171.5814.936.277.6351.0222.25
Disclaimer/Publisher’s Note: The statements, opinions and data contained in all publications are solely those of the individual author(s) and contributor(s) and not of MDPI and/or the editor(s). MDPI and/or the editor(s) disclaim responsibility for any injury to people or property resulting from any ideas, methods, instructions or products referred to in the content.