Article

A Systematic Transparency Assessment Framework for Life Cycle Background Database to Address Three-Level Black Boxes

1
CNOOC Research Institute Ltd., Beijing 100028, China
2
Carbon Neutrality Future Technology College, Sichuan University, Chengdu 610065, China
*
Author to whom correspondence should be addressed.
Appl. Sci. 2026, 16(17), 8476; https://doi.org/10.3390/app16178476
Submission received: 13 May 2026 / Revised: 10 July 2026 / Accepted: 23 July 2026 / Published: 26 August 2026

Abstract

Life cycle background databases (LCBDs) determine the credibility and reproducibility of life cycle assessment (LCA) results. However, insufficient transparency in databases has long been a critical issue affecting the reliability of LCA applications. Here, the study proposes a user-centric transparency assessment framework covering database configuration, model traceability and data quality assessment and documentation to evaluate four mainstream databases (ecoinvent, GaBi, USLCI, CLCD × WebLCA). At the database level, only six countries hold over 1000 datasets and large dataset volumes stem mainly from repetitive regional/technical variants rather than new unit processes, causing severe combinatorial redundancy. Three quantitative indicators are therefore proposed to distinguish genuine product diversity from redundant data. At the model level, a five-tier hierarchical traceability chain is innovatively constructed from the end-user perspective to enable full backward tracing. Most databases lack reverse traceability from results to raw data, resulting in poor model reproducibility, reflecting a deficiency in basic standards. At the data quality level, current data quality assessments suffer from undisclosed weighting mechanisms and inadequate uncertainty quantification, impeding the identification of quality weaknesses. This user-centric framework assesses the transparency of LCBDs. By detecting the transparency deficiencies, the framework offers references for developers to standardize disclosure protocols and assists users in selecting appropriate databases, while enhanced database transparency further strengthens the scientific credibility of LCA results and the robustness of sustainability assessments.

1. Introduction

Life cycle assessment (LCA) is defined as the compilation and evaluation of the inputs, outputs, and potential environmental impacts of a product system throughout its life cycle–spanning raw material extraction, production, transportation, use, and end-of-life disposal [1,2]. Presently, LCA has been widely deployed in product design [3], technological performance evaluation [4], green certificate [5] and supply chain management [6] and has been established as a pivotal instrument for driving the global green and low–carbon transition [7], providing essential scientific foundations for policy formulation [8,9]. Accordingly, the quantification of product carbon footprints via LCA methodologies has emerged as a focal point of international regulatory frameworks [10].
Mandatory carbon footprint requirements for products have been stipulated in key legislative instruments, including the EU Regulation 2023/1542 concerning batteries and waste batteries, the draft revised Construction Products Regulation, and France’s public procurement policies for photovoltaic modules. The enactment of these policies signals a new phase in which LCA and carbon footprint assessment are evolving from voluntary evaluation tools to compulsory regulatory mandates [11]. This shift may further develop into technical barriers that shape the landscape of international trade rules and market access conditions [12]. Meanwhile, a surge of sustainable development policies and initiatives has emerged to advance decarbonization goals [13,14], fostering technological progress that reshapes energy consumption patterns and decarbonization pathways [15]. Thus, the evolving emission characteristics under new energy scenarios further highlight the need for robust and transparent carbon footprint accounting methodologies.
Life cycle background database (LCBD) is developed by investigating thousands of unit processes associated with the production of primary energy carriers and raw materials [16]. Raw data from these unit processes are collected, processed, and cross–validated to generate unit process datasets (UPDs) [17]. These UPDs are then integrated with the background database to construct complete life cycle models, and dedicated LCA software aggregates and calculates the corresponding Life Cycle Inventory results [18,19]. When stored in database, these results form aggregated process datasets (APDs) [20]. In turn, such datasets can function as background databases for upstream processes, supporting life cycle modeling, computation, and analysis for downstream products [21].
The reliability of LCA and carbon footprint outcomes is highly dependent on the underlying life cycle background database [22]. Nevertheless, the widespread lack of transparency in LCBDs has long plagued the sound development of global LCA research [23]. The adverse impacts extend far beyond discrete deviations in single-product accounting [24], triggering in-depth industrial dilemmas and systemic governance disorders [25]. Existing evidence indicates that mainstream databases present substantial discrepancies in carbon benchmark data for identical accounting objects [26]. Taking China’s average grid carbon footprint factor in 2023 as an illustrative case, the China Electricity Council (CEC, Beijing, China) reports a value of 0.6205 kg CO2 e/kWh [27]. It was found through the database that the China Life Cycle Database (https://www.weblca.net, accessed on 8 May 2026) (CLCD, Chengdu, China) yields a result of 0.617 kg CO2 e/kWh, whereas the ecoinvent (https://ecoquery.ecoinvent.org/3.11/cutoff/search?query=&currentPage=1&pageSize=10&searchBy=activity, accessed on 8 May 2026) (Zurich, Switzerland) and GaBi (https://lcadatabase.sphera.com/, accessed on 8 May 2026) (Leinfelden-Echterdingen, Germany) produce values of 0.962 kg CO2 e/kWh and 0.7611 kg CO2 e/kWh, respectively, representing deviations of 55.04% and 22.66% relative to the CEC figure. As a fundamental energy source, electricity is extensively employed in industrial product manufacturing [28]. Such drastic biases undermine the credibility of LCA results [29] and may incur cross-border trade disputes due to inconsistent carbon footprint assessments [30]. However, most database conceal core details covering data sources, data processing and quality control criteria from end users [31], restricting users’ ability to trace potential errors and ultimately jeopardizing the reproducibility of standardized LCA results [32,33].
However, the achievement of transparency in LCBD is confronted with substantial challenges. Primarily, the ISO 14040 and ISO 14067 standards, which serve as the cornerstones of the LCA methodological framework, explicitly acknowledge the importance of transparency. However, the standards fail to stipulate concrete methodologies for attaining database transparency. They neither delineate specific operational protocols nor establish systematic and comprehensive regulations for LCBD construction workflows, data quality control, and traceability requirements. Second, a systematic review of the LCA literature reveals that contemporary research predominantly focuses on environmental impact quantification [34], uncertainty assessment [35], and the application of LCA to renewable energy systems and related domains [36]. Terms such as background database and transparency have not yet emerged as core thematic concerns within the field [37,38], and few studies have investigated what specific information should be disclosed to improve database transparency [39]. More significantly, the current LCBD landscape is characterized by a supply structure dominated by a small number of key databases [40]. Within this paradigm, strong market competition and strict intellectual property controls are lacking. As a result, major databases face neither sufficient external pressure nor adequate internal motivation. This environment prevents major databases from systematically disclosing their full construction rationale, data processing workflows, and detailed quality control procedures [41].
Recently, transparency-related studies have gradually emerged. Studies have reported inadequate disclosure of original data sources, incomplete documentation of data processing procedures, limited accessibility of supporting references and insufficient traceability of inventory generation pathways [42,43]. Transparency problems have also been identified in data quality assessment, including opaque weighting mechanisms, unclear uncertainty characterization methods and insufficient documentation of quality evaluation procedures [44]. Such gaps impede users’ ability to trace the generation, processing, and validation of inventory datasets, thereby eroding confidence in database-derived results and compromising the reproducibility of LCA studies [45]. To mitigate the prevalent transparency issues embedded in LCBDs, contemporary studies have concentrated on technical tool development and standardized documentation practices. From the technical perspective, numerous studies advocate implementing the FAIR data principles to unify data exchange schemas and assign persistent identifiers, thereby facilitating the interoperability and cross-platform sharing of LCI datasets [46,47]. Current research is increasingly focused on establishing unified data recording formats and systematic version control mechanisms. On the one hand, open data exchange standards such as ILCD XML, JSON-LD, and EcoSpold are being promoted, while elementary flow lists [42] and nomenclature systems are being harmonized to reduce data conversion barriers across different platforms and software [39]. On the other hand, semantic techniques and blockchain facilitate dataset lifecycle management, which significantly enhances the traceability and auditability of data revisions across the entire LCBDs operation process [48,49]. Despite these efforts, current technical solutions and standardized formatting strategies only refine external data sharing and management patterns. These approaches fail to disclose essential underlying information and clarify transparency-related details for end-users. As a result, end-users remain uninformed of specific calculation mechanisms and cannot verify result reliability, making database transparency ambiguous from the user’s perspective.
To address this issue, this study develops a user-oriented structured transparency assessment framework. First, a full-process transparency chain is defined by establishing a reverse traceability chain from LCA results to models, unit processes, input–output inventories, and raw data with processing procedures. Second, representative databases are selected, including both mainstream and emerging databases such as ecoinvent, GaBi, USLCI, and CLCD × WebLCA, to ensure broad coverage of regional and methodological diversity. Third, public database information is systematically collected by retrieving data on dataset scale, product coverage, documentation, and data quality assessment methods from official database platforms and public repositories. Fourth, transparency is evaluated at three levels. The major innovations of this study are outlined as follows. First, a user-oriented comprehensive transparency evaluation system is constructed, which covers multiple critical dimensions including dataset scale, model traceability, data quality assessment, and database documentation. Second, grounded in model structures and computational logic, this study innovatively develops an end-to-end backward traceability chain that bridges the entire pathway from LCA results to raw data and processing. Third, analytical results demonstrate that mainstream LCA databases ubiquitously entail a three-level black-box issue pertaining to dataset generation, model tracing, and data quality regulation, whose internal mechanisms are inaccessible to ordinary users.
The study delivers theoretical merits and practical implications for the entire LCA domain. The integrated evaluation framework and end-to-end traceability chain fill the research gap pertaining to the transparency assessment of LCBDs and provide a set of practicable assessment methodologies and implementation procedures. Practically, this study enables end users to analyze and screen databases via the proposed evaluation framework and conduct rigorous retrospective validation. Meanwhile, the summarized three-level black boxes distinctly reveal the fundamental deficiencies of current database disclosure frameworks and provide improvement directions for database transparency and information disclosure, further promoting the standardized and sustainable development of LCA transparency.

2. Comparison and Analysis of Global Database

2.1. Database Overview

LCDBs are core infrastructure for quantifying the environmental performance of products. A key characteristic is their coverage of diverse industries and product categories [40]. Database limited to one sector cannot independently complete a full life cycle assessment and relies on other databases for background data [50]. To facilitate reliable transparency assessment and ensure representativeness, this study covers typical LCBDs across Europe, North America, and China, including ecoinvent, GaBi, USLCI, and CLCD × WebLCA. The selected databases encompass the mainstream development modes of current LCBDs, namely, public open-source and commercial proprietary. All targeted databases dominate global LCA research and industrial practices with high citation rates and extensive practical utilization, possessing typicality and authority in LCA research. Full selection standards and detailed information regarding the database are summarized in Tables S1 and S2 of Supplementary Materials.
Database basic information was collected via official websites, dedicated LCA auxiliary platforms and software. Qualitative attributes covering developer affiliation, geographic coverage, charging mode, documentation format and data quality protocols were retrieved from official web introductions and technical specifications, while quantitative APD and UPD counts were quantified via authorized access to corresponding proprietary supporting tools. The basic features of targeted databases were systematically summarized in Table 1.
The compilation of publicly available information reveals clear differences in database type and dataset volume. USLCI and ecoinvent are unit process databases containing only UPDs, while the remaining databases are aggregated process databases dominated by APDs. Dataset scales vary widely across databases, and some do not disclose unit process data at all, indicating inconsistent transparency at the dataset level. This inconsistency and ambiguity in disclosing datasets complicates horizontal comparisons of the actual data modeling depth and core capacity of the database [51].

2.2. Number of Databases per Country

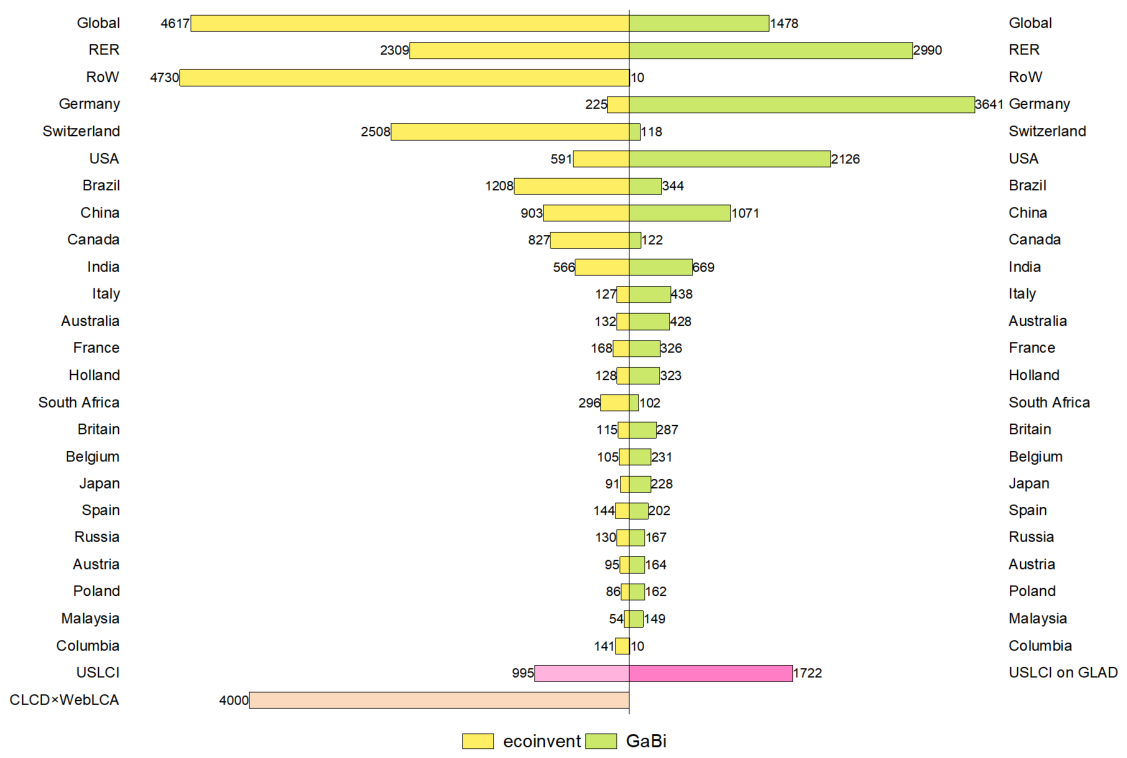
Given the requirement for comprehensive regional data coverage in LCA database, this study analyzed the geographic distribution of datasets. For the multi–country database including ecoinvent and GaBi, the 20 countries with the highest dataset counts were examined. For national databases such as USLCI and CLCD, the total number of domestic datasets was compiled. All results were benchmarked against open–access data from the Global LCA Data Access network (GLAD). Detailed information is provided in Table S3 of Supplementary Materials.
Figure 1 reveals a severe imbalance in global life cycle data resources. Only a few countries, such as Germany, Switzerland, the United States, China, and Japan, possess foundational inventories with more than 1000 datasets in mainstream databases, preliminarily enabling them to support LCA analysis for their primary industries. The vast majority of countries, especially developing nations, have extremely scarce data records, which constrain the completeness and accuracy of product carbon footprint accounting. Consequently, this study recommends that the database regularly publish reports on dataset counts and sectoral distribution by country or region, transparently communicating their data accumulation progress and gaps, thereby providing guidance for international data collaboration and development priorities.

2.3. Granularity and Duplication of Products

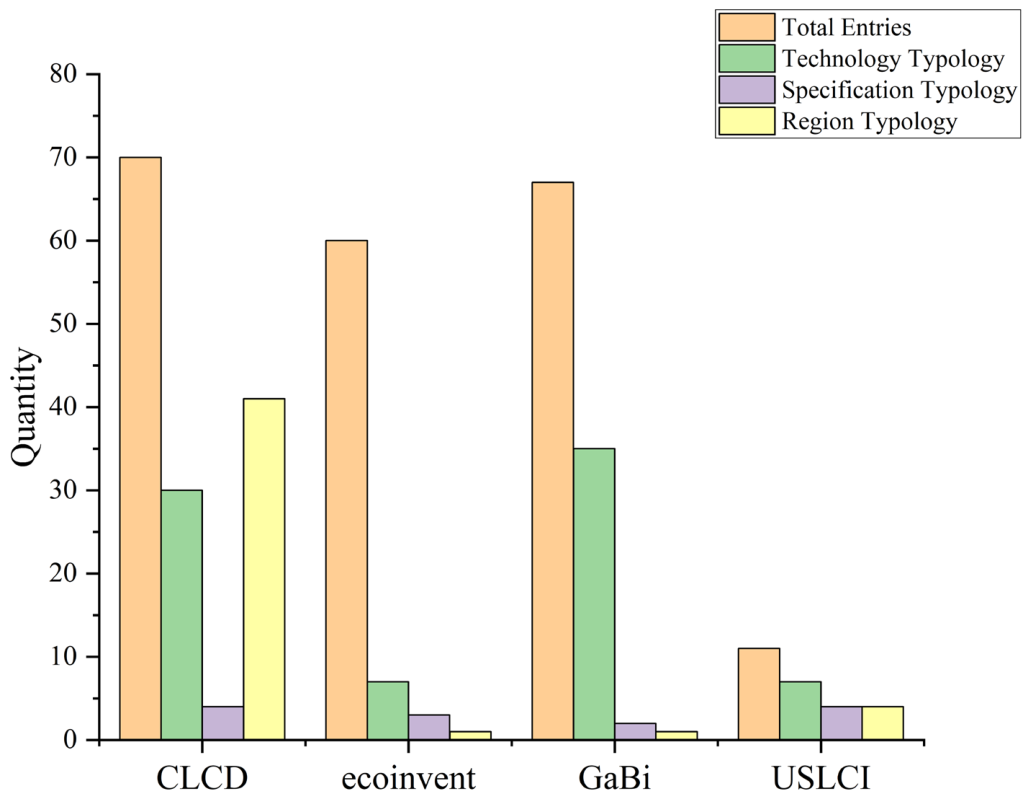
While country coverage reflects overall data availability, the granularity of product datasets plays an equally important role in balancing representativeness and practical usability [52]. To explore in depth how different databases implement granularity strategies and how these strategies affect dataset scale, this study selects the electricity sector as a representative case for micro-level analysis. As a universal input across all economic sectors, electricity exhibits clear variability in generation technology, voltage specification, and regional grid configuration, making the power sector a well-suited example for examining product subdivision practices. The results of this analysis are presented in Figure 2 and the detailed quantities of various types of power datasets are presented in Table S4 of Supplementary Materials.
The analysis shows that all databases subdivide power products across technology, specification, and regional dimensions, though to varying degrees. However, certain subdivision strategies can cause a combinatorial explosion in dataset counts. As shown in Figure 2, the number of electricity-related datasets ranges from 11 to 70 across the databases, while the underlying typologies differ markedly: 7–35 technology types, 2–4 specification types, and 1–41 regional types. When subdivision relies primarily on cross-combining these attributes—rather than on proportionally expanding or substantially adjusting the underlying unit process data, the result is a large number of datasets that are highly similar or redundant in core inventory content. This practice may mislead users who take dataset counts as a proxy for database capacity, creating an inflated perception of unique information. The observed discrepancies in reported dataset counts across platforms further underscore the need for scale transparency in database documentation.
To overcome the limitations of current database users who rely solely on entry counts and to drive database development from pursuing scale expansion toward enhancing substantive data quality and transparency, this paper proposes constructing an “information density index” as a core evaluation tool. The index aims to quantify the effective information content, which is represented by three sub–indicators.
I 1 = N p t N U P D s
The indicator I1 represents the ratio of the number of independent product types to the number of UPDs, which reflects the average diversity of products supported by each core data unit in the database. A lower I1 generally indicates that the database builds product models based on more fundamental, highly reusable unit processes, with original data concentrated at the foundational level.
I 2 = N A P D s N U P D s
The indicator I2 represents the ratio of the number of APDs to the number of UPDs, which reveals the extent to which a database generates derivative datasets by incorporating different upstream background data. A high I2 suggests that a large volume of aggregated process datasets may be built upon a limited core library of unit process datasets, indicating potential information redundancy through combinatorial derivation.
I 2 = N D s N U P D s
The indicator I3 represents the ratio of the number of cited data sources to the number of UPDs. It assesses the richness of supporting documentation for UPDs, serving as a key measure of data reliability, robustness, and the thoroughness of data development. A higher I3 generally indicates that the data have undergone more extensive cross–validation across multiple independent sources.

3. Model Traceability and Integrity

3.1. Model Tracing Methods

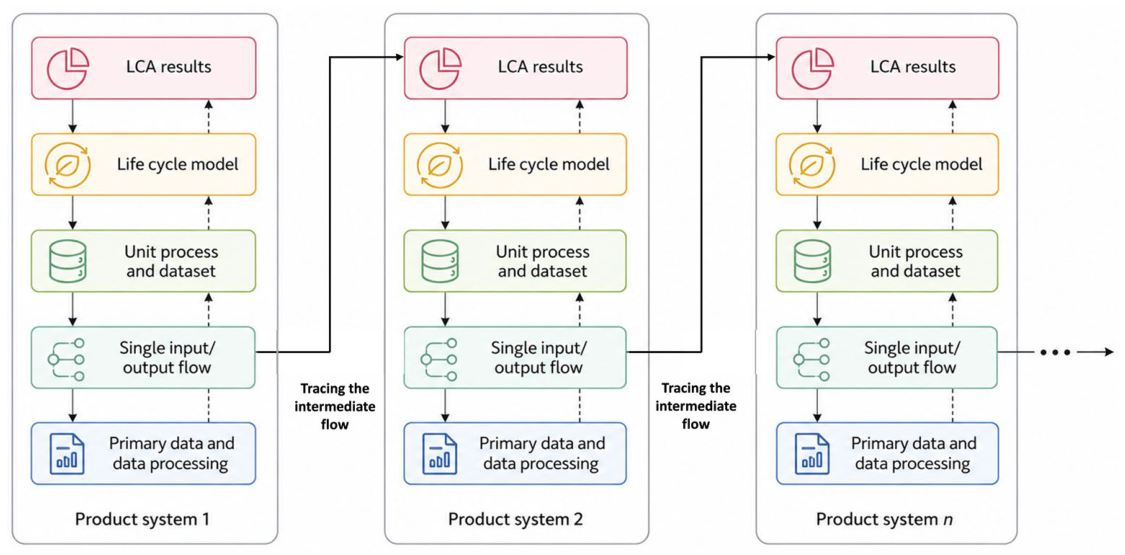
To address the black box of life cycle models that leads to the non–reproducibility of the LCA results, this section proposes a standardized traceability chain derived from the process–based life cycle model and its computational logic, which is consistent with the transparent traceability chain from the LCA results to the raw data and processing procedures. The full–process transparency chain developed in this study follows results → model → unit processes/datasets → input and output inventory → raw data and processing. As illustrated in Figure 3, the dashed lines represent the forward flow of data processing, whereby raw data are collected, processed, and incorporated into model development, ultimately generating the final LCA results. In contrast, the solid lines indicate the reverse traceability sequence for LCA database transparency, which allows for the backtracking of LCA results to their original raw data sources.
Transparency in the life cycle database means that database providers should disclose sufficient information to ensure the traceability of the entire process of data collection, processing and calculation, which constitutes the fundamental and paramount transparency requirement for such database. In practical life cycle database development, however, full information disclosure is not always feasible, as the complete traceability of data is subject to two key constraints. First, some unit process data involve corporate trade secrets or third-party intellectual property rights and thus cannot be disclosed to the public. Second, data processing workflows are highly complex; documenting all processing algorithms and procedures in full requires considerable time and relies on robust functional support from specialized software tools. Given these constraints, complete end–to–end traceability in life cycle database is difficult to achieve. Therefore, this study proposes differentiating the degree of transparency for each link in the traceability chain based on specific disclosure recipients and scenarios. According to the disclosure scope and accessibility of information at each link in the traceability chain, we define a five-level transparency scale for LCBD, with transparency decreasing progressively from a to e. Detailed information on the evaluated datasets and scoring evidence is provided in Table S5 of Supplementary Materials.
Applying the aforementioned traceability methodology and transparency level definitions, this study takes the accessible perspective of database users as the core and collects publicly disclosed information for each link in the traceability chain across six target LCBD. Data collection is conducted through systematic access to the official websites of each database and manual retrieval and collation of open information, with the transparency status of the database derived and presented in Table 2.

3.2. Traceability Aggregate Results and Models

Building on the traceability methodology and transparency grading criteria proposed in Section 3.1, this section presents a systematic comparative analysis of the transparency performance of six target LCBD across all the links in the traceability chain. The analysis identifies the disparities among the database in terms of model traceability, document disclosure and navigation functionality, thereby providing empirical data to underpin the subsequent formulation of transparency disclosure specifications for LCBD.
With respect to the transparency of life cycle results, as presented in row 1 of Table 2, CLCD, ecoinvent and GaBi have developed life cycle models and generated corresponding calculation outcomes, which are accessible only to paying users. In contrast, USLCI has not established complete life cycle models; thus, no relevant LCA calculation results have been produced for these two databases. Turning to documentation, as shown in row 2 of Table 2, all the aforementioned databases make their documentation available to users: CLCD and GaBi offer model documentation, while ecoinvent and USLCI provide unit process documentation. Model documentation integrates relevant information across multiple unit processes included in a life cycle model, whereas unit process documentation focuses solely on the information of individual unit processes.
Beyond such categorical differences, the content structure of the documentation, listed in rows 3 and 4 of Table 2, varies across the database. For model documentation, CLCD automatically extracts all model unit processes to generate a unit process table while providing representative descriptions and input–output data for each unit process with accessible data sources. Hyperlinks are also embedded for each unit process input, enabling navigation to the corresponding upstream background life cycle models for in-depth traceability. By comparison, GaBi displays model structures via static diagrams or flowcharts, failing to fully present all integrated unit processes or support viewing their input–output data. Unlike CLCD and GaBi do not provide unit process tables or hyperlinks to upstream background processes in its public documentation, making it impossible to verify the effective linkage between background data and life cycle models. For unit process documentation, ecoinvent calculates the life cycle results for each unit process and its corresponding products and provides only individual unit process documents that allow navigation between one another. Neither the USLCI has linked respective unit processes to construct complete life cycle models or produce LCA results, with only unit process documentation accessible. Accordingly, these three databases provide information only on individual unit processes, with no access to unit process tables; thus, the subroutines included in the document disclosure model are marked as “n.a.”. With respect to document navigation functionality, partial connections have been established between unit processes in the USLCI, enabling navigation between some of them.
This section identifies varying transparency levels across traceability links in life cycle database, with inconsistent disclosure content across different platforms. Most unit process databases do not integrate into complete life cycle models or generate LCA results; thus, they are unable to disclose model–included unit processes or enable cross–model traceability navigation. Unlike unit process database, the aggregated process database is built on life cycle models, yet most fail to fully disclose their model–included unit processes or provide traceability access to all upstream background processes, falling short of the basic transparency requirements for LCBD. Based on the above findings, relevant stakeholders are recommended to refer to the transparency assessments in Table 2 and formulate differentiated tiered traceability disclosure specifications aligned with LCBD types (unit/aggregated process database) and user group needs (paying users, general users, reviewers). For the aggregated process database, mandate full disclosure of model–included unit process information and traceability links to all upstream background processes. For the unit process database, standardize the content structure of unit process documentation, promote interconnection between unit processes, and promote the gradual development and disclosure of complete life cycle models. Database developers are also required to disclose relevant information accurately and comprehensively in accordance with these specifications to enhance LCBD transparency, thereby supporting users in selecting appropriate databases and further alleviating the prevalent black box issue in LCBD.

3.3. Traceability Unit Process Datasets

The traceability of UPDs is a critical challenge impacting the transparency of the current LCBD. Specifically, methodological hurdles exist regarding the visibility of input–output inventories, detailed in row 5 of Table 2. Furthermore, the numerical transparency of inventory values, as shown in row 6 of Table 2, presents another challenge. Under the public information disclosure framework, marked discrepancies exist among the leading LCBDs. GaBi typically categorizes their unit process inventory data and specific values as ‘unknown’, rendering their detailed underlying inventories inaccessible to external users. Ecoinvent, in contrast, permits paying subscribers to access inventory tables and their associated values. Free UPDs, such as the USLCI publicly display their unit process inventory tables and specific values. CLCD × WebLCA offers input–output inventory tables for each unit process, complemented by descriptive information on their technical, geographical, and temporal representativeness within its model documentation; however, it does not fully disclose detailed inventory values, which are generally restricted to authorized users who have purchased the unit process or successfully completed a review process. These differing disclosure practices directly contribute to the varying degrees of “black box” characteristics among LCBD, affecting model traceability and completeness.
Significant disparities are also evident in the accessibility of UPD sources listed in row 7 of Table 2 across various LCBD. GaBi typically provides only a generalized description of referenced data sources at the model level and lacks detailed source lists for specific unit processes. The construction of UPDs in USLCI still has room for improvement in terms of multi-source data cross-validation and completeness of source inventories. Ecoinvent offers relatively limited access to data lists; they generally mention the types of data sources employed in their documentation but fail to provide clear, accessible lists within specific unit process documents. This disclosure method “no list on unit process level” impedes users’ ability to trace the origin of specific data. Conversely, CLCD × WebLCA enables users to access the multiple data sources underpinning unit process construction, establishing a robust foundation for in-depth data verification and source evaluation.
Differences in transparency at the level of individual inventory data and data processing in row 8 of Table 2 are most pronounced, directly influencing data quality and the reproducibility of the LCA results. Some unit process databases have room for improvement in data source support and processing workflow disclosure. The derivation basis for their unit process data is relatively homogeneous, and the processing flow from raw data to final inventory values is not fully public, which increases the difficulty of ensuring data integrity and technical representativeness to a certain extent. Although USLCI and ecoinvent compile individual inventory entries and data from multiple sources, they do not furnish detailed explanations of data source composition or the complete processing path, thus hindering users’ ability to trace and reproduce the data processing logic. GaBi offers only a general description of dataset-level data sources and processing, without deconstructing these for individual unit process and their corresponding inventory data. The CLCD × WebLCA system meticulously records and discloses the complete processing workflow from raw data to standardized inventory data, ensuring that the generation of each inventory value is traceable and reproducible.
In summary, the construction of UPDs within LCBD should be grounded in the cross–validation of multiple sources, accompanied by the disclosure of specific data integration methodologies and processing pathways to guarantee data reliability and reproducibility. The CLCD × WebLCA system exemplifies an open and collaborative model, facilitating the participation of multiple stakeholders in database development. It mandates that each inventory data entry be systematically integrated and processed from multiple source materials. Its data processing procedures are accessible to authorized users, thereby achieving a significant degree of transparency in the database construction process.
The concept of “traceability” in life cycle methods encompasses two fundamental directions. First, life–cycle process chain traceability involves hierarchical tracing backward from a target process along the product life–cycle path to its upstream associated processes, ensuring the inclusion of all relevant processes within the system boundary. Second, data drill–down traceability pertains to the micro–level examination of data construction for a specific unit process. This entails sequentially tracing the visibility of its input–output inventories, the provenance of their values, and the accessibility of source lists, ultimately aiming for complete transparency of the original source of a single inventory data entry and its associated processing and conversion logic.
Comparative analysis of major LCBD shows that most databases offer public visibility in input–output inventory inclusivity and numerical transparency. These aspects meet basic data accessibility requirements. However, deeper traceability is needed for data lists, individual inventory data items, and their processing procedures. As the depth of traceability increases, the granularity of the involved information becomes finer, and the volume of data requiring recording and disclosure expands substantially. This characteristic typically leads to a corresponding reduction in the level of public disclosure. However, it is precisely the transparency of this in-depth information that forms the cornerstone for ensuring the reliability, reproducibility, and scientific rigor of LCA results, directly determining the practical value of LCBD and the credibility of LCA outcomes. Consequently, future LCBD development should transcend mere compliance with basic data format and superficial structural requirements, focusing instead on establishing a fully transparent, end–to–end system. Such a system necessitates not only data visibility but also the independent verifiability and reproducibility of its generation logic.
Based on the established information disclosure standards, database providers are strongly encouraged to clearly define the specific content to be disclosed at different levels of traceability. Given the substantial volume and heterogeneous nature of information required for deep traceability, coupled with the significant associated workload and technical complexity, reliance on manual recording alone is unsustainable. Therefore, the development and integration of relevant software tools are imperative for providing technical support for standardized data recording, systematic processing, and end–to–end traceability.

3.4. Life Cycle Completeness

Building upon advancements in the transparency and traceability of LCBD, the assessment of life cycle completeness has emerged as a pivotal indicator for evaluating the systemic quality of the database. In this study, life cycle completeness is defined and evaluated at two hierarchical levels: (i) unit process completeness, concerning the inclusion of all required input and output inventory elements, and (ii) model system completeness, concerning the traceable linkage of intermediate flows to upstream background processes.
At the unit process level, Life cycle completeness requires the comprehensive inclusion of input–output inventories for each unit process. Achieving this is primarily realized through the systematic collection and cross-verification of multi-source data, which helps identify and address inventory gaps that may arise from reliance on a single data source.
To operationalize this assessment, petroleum and gas production is selected as a representative test case. This sector involves a balanced and widely applicable set of inventory categories-energy consumption, raw materials, infrastructure, natural resources, waste treatment, and multi-media emissions, that are conceptually relevant to industrial unit processes across sectors. The presence or absence of these elements therefore provides a clear basis for comparing database completeness.
As presented in Table 3, notable differences exist in the inventory structures of LCBD. GaBi provides aggregated process representations or generalized technical classifications, which limit the visibility of detailed inventory entries and reduce the feasibility of fine-grained completeness verification. In contrast, CLCD × WebLCA supports this requirement by enabling public access to input and output inventory names, while detailed inventory values and underlying unit process data are accessible to authorized users, thereby facilitating completeness verification. Ecoinvent’s petroleum and gas unit process inventory system demonstrates a high degree of completeness, encompassing the entire material flow from energy and raw materials to capital equipment and a wide spectrum of emissions, thereby facilitating process integrity verification. USLCI adopts a highly granular approach, listing a large number of specific pollutant emissions. While this level of detail increases technical specificity, it also raises data collection effort and may reduce general applicability in broader LCA modeling contexts. Unit process information, input and output inventory data of oil and gas products from each database are presented in Tables S6 and S7 of Supplementary Materials.
Comparative analysis indicates significant discrepancies in the inventory composition for the same unit process across different databases, posing challenges to guaranteeing unit process completeness:
(a)
Conceptual ambiguity of unit process definition: The database exhibits differing interpretations of the fundamental concept of unit process. This conceptual ambiguity can lead to highly simplified unit process inventory entries that fail to present complete input–output lists.
(b)
Completeness of the unit process inventory type: A complete unit process should encompass all essential input inventories, including raw materials, energy consumption, and natural resources, as well as output inventories such as waste awaiting disposal and environmental emissions to the atmosphere, water bodies, and soil.
(c)
Comprehensiveness of unit process input–output content: The content of unit process input–output must be comprehensive. Taking ecoinvent as an example, it typically employs multi–source data fusion and cross-validation to construct a relatively complete material balance.
Second, at the model system level, establishing a complete life-cycle modeling chain is paramount. This involves effectively linking the intermediate flows of each unit process to corresponding background data to trace their upstream environmental impacts. The associated unit process input–output inventories must also be clear and complete. Only when the environmental impact of a particular intermediate flow meets predefined cutoff criteria can its linkage be interrupted without significantly compromising the credibility of the final LCA results.
Therefore, it is recommended that database providers systematically collect and compare multiple datasets for the same product or production technology to ensure the completeness of process input and output inventories. Furthermore, the collaborative development and promotion of standardized unit process templates are essential to ensure the comprehensive characterization of critical material flows and environmental emission data.

4. Data Quality Assessment and Database Documentation

Data quality assessment (DQA) represents a critical component in ensuring the traceability and completeness of LCBD. Concurrently, database documentation serves as the primary medium for conveying data quality information. These two elements collectively form the foundation for transparency concerning the ‘data quality’ dimension of LCBD. This chapter systematically analyzes the current status and limitations of DQA methodologies for LCBD. By examining the practical implementation reflected in database documentation, targeted recommendations for methodological optimization are proposed, thereby contributing to the refinement of the LCBD transparency framework.

4.1. Data Quality Assessment

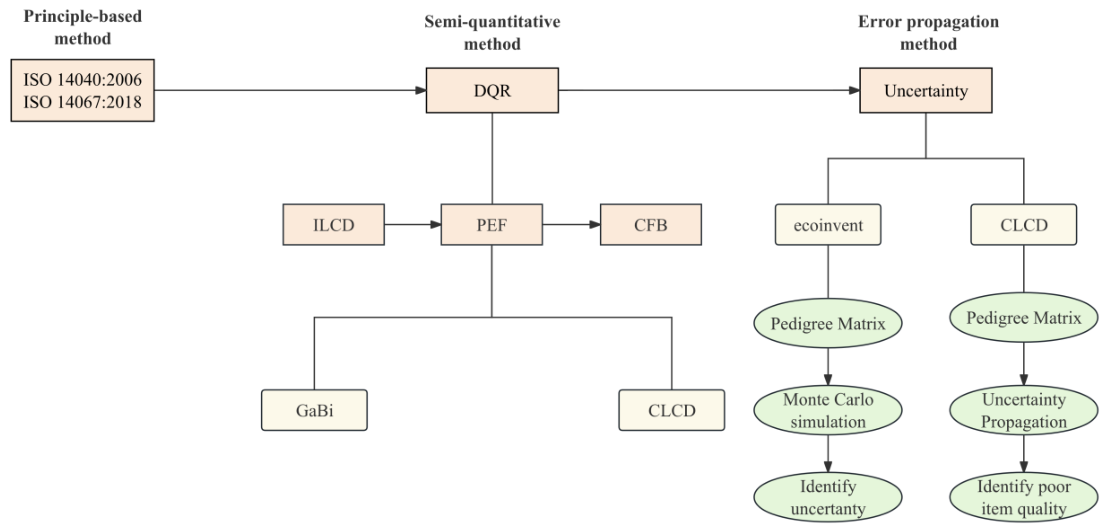
Following a systematic review of the qualitative requirements for model traceability and completeness, following a systematic review of the qualitative requirements for model traceability and completeness, the challenge of scientifically quantifying and evaluating these attributes to assess overall data quality emerges as a core element in ensuring the reliability and credibility of LCA results [53]. Within the LCA field, various interrelated DQA methods have been developed. The ISO standards establish principled requirements for data quality assessment, providing a foundational theoretical framework [1,2]. However, they lack specific quantitative indicators or scoring mechanisms, limiting their practical applicability. Building upon the ISO framework, the international life cycle data (ILCD) system pioneered a systematized, semi–quantitative assessment framework across six dimensions [54]. It refined scoring rules and quantification methods for data quality indicators and introduced the ‘magnify the weakest link’ assessment principle. The product environmental footprint (PEF) method draws on the core principles of the ILCD framework, further streamlining the assessment process with a focus on specific product categories [55]. At the database application level, GaBi’s assessment methods include ILCD, PEF, and its own six–dimensional indicator averaging approach [56]. Ecoinvent transforms quality scores into uncertainty coefficients via a pedigree matrix and quantifies overall uncertainty through Monte Carlo simulation [57]. This approach links data quality to statistical uncertainty, in contrast to methods centered on expert scoring, such as the EU’s data quality rating (DQR). CLCD × WebLCA employs a combination of pedigree matrix weighting and error propagation models to identify key sources of uncertainty, enabling a dynamic quantitative analysis of data impact within specific models [58]. Despite differences in dimensionality, scoring mechanisms, and results presentation, these methods share the common objective of ensuring the reliability and credibility of LCA outcomes, as depicted in Figure 4.
However, current DQA methods face significant challenges regarding theoretical clarity and practical transparency. In methods represented by DQR, substantial heterogeneity exists in how different implementing bodies interpret and apply the same methodology. For instance, GaBi has not explicitly disclosed its weighting calculation logic within the DQR process, whereas the EU New Battery Regulation mandates a weighted average for unit processes contributing ≥80% to environmental impacts. In practical applications of DQR across different LCBD, regulatory contexts, and time periods, significant and evolving disparities exist in specific scoring algorithms, weight allocation, and compliance interpretations. Furthermore, DQR has yet to establish a clear, transferable pathway linking front–end qualitative requirements (i.e., traceability and completeness) to back–end quantitative scoring, resulting in a disconnect between qualitative stipulations and quantitative assessment. Conversely, uncertainty quantification methods based on Monte Carlo simulation, while capable of generating probability distributions and confidence intervals for overall results, often fail to identify and pinpoint the specific sources of major uncertainties within the system. Consequently, they provide limited actionable guidance for targeted data improvement, making it difficult to implement precise optimization measures focused on the low-quality life cycle stages with the greatest impact on the final results. A pertinent example is the significant deviation (up to 55%) observed between the electricity carbon footprint factors calculated by ecoinvent and GaBi on the one hand and those from the China Electricity Council and CLCD × WebLCA on the other. Existing DQA systems struggle to effectively address critical questions arising from such discrepancies: Can the underlying mechanism of this deviation be explained through data quality scores? Can the specific low-quality data stages causing deviation be precisely identified? Can the quality of electricity carbon footprint factors across different datasets be scientifically distinguished?
In summary, current DQA methods exhibit shortcomings in theoretical consistency, methodological maturity, and operational transparency. It is therefore recommended that database providers establish detailed, standardized, and actionable DQA scoring rules. Such rules should enable users not only to assess overall data quality and identify critical weak points but also to receive direct guidance on priorities for data quality improvement. Only through the development and adoption of such transparent and diagnostic DQA methodologies can the “black box” between front–end data development and back–end database applications be effectively dismantled, thereby enhancing the scientific robustness and practical utility of LCA.

4.2. Database Documentation

As the principal conduit for the storage, presentation, and communication of data quality information, the design and specifications of LCBD documentation must adhere to multi–dimensional transparency requirements. Specifically, documentation should facilitate the systematic disclosure of data sources, calculation methods, and critical assumptions. Furthermore, it must demonstrate traceability, completeness, and robust data quality assessment while providing standardized metadata that complies with international benchmarks [59].
Examining current documentation practices in LCBD highlights an issue. Databases such as GaBi adopt the ILCD format directly, a point illustrated in Table 4. Despite this, empirical verification indicates that their inventory documentation is plagued by pervasive content gaps. This results in a significant deficit in database documentation transparency. The ILCD format, primarily designed to standardize and unify data structures [60,61], prioritizes structural conformity over the intuitive presentation of internal logic. Consequently, its direct application without bespoke adaptation can lead to a relative reduction in information readability, comprehensibility, and overall transparency, thereby impeding users’ practical needs for tracing the underlying logic of data generation. Ecoinvent and the USLCI have achieved a rudimentary level of transparency through their documented fields. However, the detailed disclosure of the processing logic for individual inventory data entries remains deficient. The scope of their document fields is more oriented toward meeting basic data visibility requirements, falling short of the deeper transparency necessary for the traceability and reproducibility of data generation logic.
In contrast, CLCD × WebLCA has developed a dynamic model documentation system leveraging efootprint software (https://www.efootprint.net/, accessed on 8 May 2026) that automatically generates standardized documentation directly from LCA models. This documentation not only furnishes essential background information, including temporal, geographical, and technical specifications, but also incorporates input and output inventory tables. Crucially, it integrates built-in inventory contribution analysis and uncertainty analysis results. This enables users to assess model quality, identify key inventories significantly influencing carbon footprint outcomes, and scientifically evaluate the robustness of the entire LCA result based on quantitative uncertainty metrics. From the perspectives of both document structure and field coverage, CLCD × WebLCA’s database documentation demonstrates a preliminary yet comprehensive fulfillment of multi–dimensional transparency requirements.
Based on these observations, it is recommended that database providers establish a standardized, structured database documentation format. This format clearly defines a series of core metadata fields to provide critical information that enhances data transparency.

5. Conclusions

Taking typical global LCBD as its subject, this study establishes a full–chain transparent traceability system using public information and develops the first systematic framework for evaluating LCBD transparency across the entire process. From the dimensions of product coverage, model traceability and data quality, three prevalent black boxes in current LCBD are identified, and standardized disclosure requirements are specified, providing methodological support for addressing transparency challenges and improving the robustness and reliability of LCA and product carbon footprint accounting. The results show that first, the absence of a standardized product counting system is the main cause of the scale black box in LCBD. Only six national databases worldwide cover more than 1000 basic products, and the maximum coverage in a single region is approximately 4000 items. The tens of thousands of widely claimed products are mostly generated by combined variations in region, technology, and specification rather than new unit processes, meaning that they do not genuinely expand basic product coverage. This also reveals a global shortage of large-scale functional LCBD, which cannot meet the LCA demands of diverse regions and industries. Second, the lack of model traceability leads to a second black box, as the core computational logic cannot be verified or reproduced. Most LCBDs do not support backward tracing from the final results to the raw data and processing procedures, and no standardized traceability mechanism exists. Some databases contain definitional errors and missing unit process inventories; aggregated databases often fail to disclose unit process details and upstream pathways, whereas unit process databases lack proper linkage to form complete life cycle models, meaning that disclosure and functionality generally fall below basic transparency requirements. Third, a data quality black box arises from the misalignment between current quality assessment methods and model logic. Existing DQR approaches do not disclose the weighting logic or the linkage between traceability, completeness, and quality scores. Moreover, uncertainty methods such as Monte Carlo simulation cannot identify specific sources of variation or provide targeted improvements, resulting in weak quality control across the LCA field.
The proposed transparency assessment framework offers practical value for multiple stakeholders in the LCA community. Database developers can utilize the framework to benchmark current transparency performance, prioritize targeted improvements, and standardize disclosure protocols across dataset construction, model documentation, and data quality reporting. LCA practitioners and product carbon footprint analysts gain a clear basis for selecting databases that align with specific transparency requirements, thereby reducing the risk of unintended bias and enhancing the defensibility of assessment outcomes. Standard-setting bodies may draw on the identified transparency gaps and the proposed disclosure requirements to inform the development of clearer, more operational regulations for LCBD transparency. By strengthening transparency across these dimensions, the framework ultimately contributes to improved reproducibility, comparability, and scientific credibility of LCA results in both research and policy applications.

5.1. Implication

To enhance LCBD transparency and promote industry standardization, database developers should tailor tiered traceability disclosure guidelines based on database type and user needs. They should shift focus from maximizing dataset quantity to improving actual data quality and effective information content while developing specialized software to support standardized data recording, systematic processing, and end–to–end traceability. Collaboration on standardized unit process templates is essential to ensure the completeness of input–output lists and transparent disclosure of data sources, processing workflows, and quality evaluation results. With respect to LCA standard–setting bodies, existing standards such as ISO 14040 and 14044 should be updated to address LCBD transparency gaps. Comprehensive, operational standards for LCBD construction, data quality control, and traceability disclosure should be established to unify the requirements for product coverage counting, model tracing, and quality assessment, thereby fostering global consistency in fundamental regulations. For LCBD users, the fully transparent traceability chain and indicators proposed in this study enable targeted database selection based on research needs. They can scientifically identify a high–transparency, reliable–quality database and validate the transparency and quality of the utilized database, ultimately improving the robustness and reliability of LCA research outcomes.

5.2. Limitations

This study retains scope for further improvement. For instance, its transparency assessment relies solely on official public database information, and future work could involve collaboration with developers to obtain more accurate data for refined evaluation. In addition, the scoring system may be enhanced through large-scale user surveys and the Delphi method to refine indicator weights, whereas sensitivity analysis using the analytic hierarchy process and entropy weight method can be applied to examine how different weighting schemes influence database rankings, thereby improving the quantification, adaptability, and rationality of the framework. Finally, this research focuses on a static evaluation of current transparency conditions; future studies could integrate big data and artificial intelligence to establish a dynamic quantitative assessment system for LCBD transparency, enabling real–time updates alongside database evolution and LCA standard development, thus providing sustained methodological support for global transparency governance of LCBD.

Supplementary Materials

The following supporting information can be downloaded at: https://www.mdpi.com/article/10.3390/app16178476/s1, Figure S1: A Three-Level transparency assessment framework for LCBD: from traceability chain to actionable outcomes. Table S1: Database selection: inclusion and exclusion criteria. Table S2: Database versions and data collection timeline. Table S3: GLAD platform cross-validation. Table S4: Electricity product granularity. Table S5: Complete a–e transparency grading for traceability chain. Table S6: Petroleum and gas unit process completeness. Table S7: ecoinvent: petroleum and gas production, offshore.

Author Contributions

Made substantial contributions to the conception and design of the study and performed data analysis and interpretation: X.L., L.S., H.Y., Y.Z., P.W., L.X. and H.W. Performed data acquisition and technical and material support: X.L., L.S., H.Y., Y.Z., P.W., L.X. and H.W. Performed data acquisition and material support: X.L., P.W., L.X. and H.W. Performed data acquisition and administrative approval: X.L., L.S., H.Y., Y.Z., P.W., L.X. and H.W. All authors have read and agreed to the published version of the manuscript.

Funding

This work is supported by the “Oil and Gas Product Carbon Footprint Data Measurement and Calculation” project (No. CCL2024RCPS0198RSN), the Natural Science Foundation of Sichuan Province (2025NSFSC1987), and the Postdoctoral Fellowship Program of CPSF (GZB20240484).

Institutional Review Board Statement

Not applicable.

Informed Consent Statement

Not applicable.

Data Availability Statement

Data and materials are available from the corresponding authors upon reasonable request.

Conflicts of Interest

Authors Lili Sun, Hang Yu, and Yiping Zhang were employed by the company CNOOC Research Institute Ltd. The remaining authors declare that the research was conducted in the absence of any commercial or financial relationships that could be construed as a potential conflict of interest.

Abbreviations

The following abbreviations are used in this manuscript:
LCBDLife cycle background database
LCALife cycle assessment
UPDsUnit process datasets
APDsAggregated process datasets
DQAData quality assessment
ILCDInternational life cycle data
DQRData quality rating

References

  1. ISO 14040; Environmental Management–Life Cycle Assessment Principles and Framework. International Organization for Standardization: Geneva, Switzerland, 2006.
  2. ISO 14044; Environmental Management–Life Cycle Assessment Requirements and Guidelines. International Organization for Standardization: Geneva, Switzerland, 2006.
  3. Turner, C.; Oyekan, J.; Garn, W.; Duggan, C.; Abdou, K. Industry 5.0 and the circular economy: Utilizing LCA with intelligent products. Sustainability 2022, 14, 14847. [Google Scholar] [CrossRef] [Scilit]
  4. Hu, Z.; Li, P.C.; Zhang, Z.Z.; Chen, G.Y.; Song, C.F. Microalgae fixed flue gas CO2 into biomass: Comparative of life cycle assessment and technical–economic analysis of different technologies. J. Environ. Chem. Eng. 2025, 13, 119467. [Google Scholar] [CrossRef] [Scilit]
  5. Meng, X.; Wu, J.; Zhang, Y.; Ren, J.; Yue, D.; Manzardo, A. Critical review: A standardized blueprint for green certificate integration in life cycle assessment. Carbon Footpr. 2025, 4, 29. [Google Scholar] [CrossRef] [Scilit]
  6. Cordero, P. Carbon footprint estimation for a sustainable improvement of supply chains: State of the art. J. Ind. Eng. Manag. 2013, 6, 805–813. [Google Scholar] [CrossRef] [Scilit]
  7. Fernández–González, J.; Rumayor, M.; Domínguez–Ramos, A.; Irabien, A.; Ortiz, I. The relevance of life cycle assessment tools in the development of emerging decarbonization technologies. JACS Au 2023, 3, 2631–2639. [Google Scholar] [CrossRef] [Scilit] [PubMed]
  8. Miao, Z.; Huo, D.; Li, Y. A review of multi-factor footprints: A bibliometric perspective. Carbon Footpr. 2025, 4, 6. [Google Scholar] [CrossRef] [Scilit]
  9. Dong, Q.; Zhong, C.; Geng, Y.; Dong, F.; Chen, W.; Zhang, Y. A bibliometric review of carbon footprint research. Carbon Footpr. 2024, 3, 3. [Google Scholar] [CrossRef] [Scilit]
  10. Finnveden, G.; Hauschild, M.Z.; Ekvall, T.; Guinée, J.B.; Heijungs, R.; Hellweg, S.; Koehler, A.; Pennington, D.; Suh, S. Recent developments in Life Cycle Assessment. J. Environ. Manag. 2009, 91, 1–21. [Google Scholar] [CrossRef] [Scilit] [PubMed]
  11. Sala, S.; Amadei, A.M.; Beylot, A.; Ardente, F. The evolution of life cycle assessment in European policies over three decades. Int. J. Life Cycle Assess. 2021, 26, 2295–2314. [Google Scholar] [CrossRef] [Scilit]
  12. Guo, Y.J. Green Trade Barriers under the Developing Country Perspective. Future Hum. Image 2024, 21, 4–15. [Google Scholar] [CrossRef] [Scilit]
  13. Liu, X.; Yu, J.; You, C.; Di, D.; Di, L. Resource-saving campus construction and university green innovation: Evidence from the establishment of demonstration units for conservation-oriented public institutions. Int. J. Sustain. High. Educ. 2026, 1–26. [Google Scholar] [CrossRef] [Scilit]
  14. Zhao, W.; Wang, C.; Liu, X.; Li, G. Pollutant Discharge Permit Regulation and Firms’ Environmental Investment Responses: Firm-level Evidence from China. Int. Rev. Econ. Financ. 2026, 105468. [Google Scholar] [CrossRef] [Scilit]
  15. Liu, X.; Cifuentes-Faura, J.; Zhao, S.; Wang, L.; Yao, J. Impact of artificial intelligence technology applications on corporate energy consumption intensity. Gondwana Res. 2025, 138, 89–103. [Google Scholar] [CrossRef] [Scilit]
  16. Wernet, G.; Bauer, C.; Steubing, B.; Reinhard, J.; Moreno-Ruiz, E.; Weidema, B. The ecoinvent database version 3 (part I): Overview and methodology. Int. J. Life Cycle Assess. 2016, 21, 1218–1230. [Google Scholar] [CrossRef] [Scilit]
  17. Kellens, K.; Dewulf, W.; Overcash, M.; Hauschild, M.; Duflou, J. Methodology for systematic analysis and improvement of manufacturing unit process life-cycle inventory (UPLCI)—CO2PE! initiative. Part 1: Methodology description. Int. J. Life Cycle Assess. 2012, 17, 69–78. [Google Scholar] [CrossRef] [Scilit]
  18. Miranda Xicotencatl, B.; Kleijn, R.; van Nielen, S.; Donati, F.; Sprecher, B.; Tukker, A. Data implementation matters: Effect of software choice and LCI database evolution on a comparative LCA study of permanent magnets. J. Ind. Ecol. 2023, 27, 1252–1265. [Google Scholar] [CrossRef] [Scilit]
  19. Liu, X.; Wang, H.; Chen, J.; He, Q.; Zhang, H.; Jiang, R.; Chen, X.; Hou, P. Method and basic model for development of Chinese reference life cycle database. J. Acta Sci. Circumst. 2010, 30, 2136–2144. [Google Scholar]
  20. UNEP. Global Guidance Principles for Life Cycle Assessment Databases: A Basis for Greener Processes and Products; UNEP: Paris, France, 2011. [Google Scholar]
  21. Kuczenski, B. Partial ordering of life cycle inventory databases. J. Life Cycle Assess. 2015, 20, 1673–1683. [Google Scholar] [CrossRef] [Scilit]
  22. Liu, T.; Liu, Y.; Song, Z. Research and practice on method of LCA background database development in Chinese steel industry. Steel Iron 2025, 60, 262–270. [Google Scholar]
  23. Stenzel, A.; Waichman, I. Supply-chain data sharing for scope 3 emissions. npj Clim. Action 2023, 2, 7. [Google Scholar] [CrossRef] [Scilit]
  24. Pauer, E.; Wohner, B.; Tacker, M. The influence of database selection on environmental impact results. Life cycle assessment of packaging using GaBi, ecoinvent 3.6, and the environmental footprint database. Sustainability 2020, 12, 9948. [Google Scholar] [CrossRef] [Scilit]
  25. Xu, C.; Jia, T.; Qi, J.; Cai, Z.; Zhang, R.; Xiong, R.; Chang, H.; Lu, X.; Li, N.; Tian, J.; et al. Addressing critical challenges towards a robust data system for life cycle assessment. Nat. Rev. Clean. Technol. 2025, 1, 788–800. [Google Scholar] [CrossRef] [Scilit]
  26. Seckar, M.; Schwarz, M.; Pochyba, A.; Polgar, A. A comparative analysis of the environmental impacts of wood–aluminum window production in two life cycle assessment software. Sustainability 2024, 16, 9581. [Google Scholar] [CrossRef] [Scilit]
  27. Ministry of Ecology and Environment of the People’s Republic of China. Announcement No. 19 of 2025: Release of 2024 Power Carbon Footprint Factors. 2025. Available online: https://www.mee.gov.cn/xxgk2018/xxgk/xxgk01/202510/t20251024_1130734.html (accessed on 8 May 2026).
  28. Yi, J.; Sun, H.R.; Lin, W.F.; Li, X.; Gan, D. Comparative analysis of carbon emission accounting standards for power systems. Power Syst. Technol. 2025, 49, 920–933. [Google Scholar]
  29. Zhu, G.Y.; Tian, Y.J.; Xiong, J.; Xiao, D.; Liu, H.; Wang, C.; Xie, K. High-resolution data unveils overestimation of China’s electricity carbon footprint in international LCA databases. Innov. Energy 2026, 3, 100132. [Google Scholar] [CrossRef] [Scilit]
  30. Luo, B.; Gu, A.; Chen, X.; Zuo, P.; Weng, Y.; Chen, Y. EU carbon border adjustment mechanism and international industrial landscape: Impact assessment based on a global computable general equilibrium model. J. Tsinghua Univ. (Sci. Technol.) 2024, 64, 1492–1501. [Google Scholar]
  31. Bishop, G.; Styles, D.; Lens, P.N.L. Environmental performance comparison of bioplastics and petrochemical plastics: A review of life cycle assessment (LCA) methodological decisions. Resour. Conserv. Recycl. 2021, 168, 105451. [Google Scholar] [CrossRef] [Scilit]
  32. Corlay, V.; Bekri, D.; Lacroix, M.-A.; Pelcat, M.; Peralta, M.; Pichon, P.-Y.; Saillenfest, L.; Weppe, O.; Rumley, S. All LCA models are wrong. Are some of them useful? Towards open computational LCA in ICT. arXiv 2026, arXiv:2604.06290. [Google Scholar]
  33. Köck, B.; Friedl, A.; Serna Loaiza, S.; Wukovits, W.; Mihalyi-Schneider, B. Automation of life cycle assessment—A critical review of developments in the field of life cycle inventory analysis. Sustainability 2023, 15, 5531. [Google Scholar] [CrossRef] [Scilit]
  34. Bluhm, H.; Wohlschlager, D.; Pohl, J.; Beucker, S.; Bieser, J.; Schien, D.; Widdicks, K.; Friday, A.; Blair, G.S. Understanding digitalization’s environmental impact: Why LCA is essential for informed decision–making. npj Clim. Action 2025, 4, 41. [Google Scholar] [CrossRef] [Scilit] [PubMed]
  35. Tan, E.; Tu, Q.; Martins, A.A.; Yao, Y.; Sunol, A.; Smith, R.L. Uncertainty in inventories for life cycle assessment: State–of–the–art, challenges, and new technologies. Environ. Prog. Sustain. Energy 2025, 44, 14644. [Google Scholar] [CrossRef] [Scilit]
  36. Li, J.; Wang, J.; Hao, Y.; Tan, H.; Shao, B.; Zhang, C. Global evolution of research on life cycle assessment: A data–driven visualization of collaboration, frontier identification, and future trend. Environ. Impact Assess. Rev. 2026, 116, 108093. [Google Scholar] [CrossRef] [Scilit]
  37. Isah, M.E.; Zhang, Z.; Matsubae, K.; Itsubo, N. Bibliometric analysis and visualization of research on life cycle assessment in Africa. Int. J. Life Cycle Assess. 2024, 29, 1339–1351. [Google Scholar] [CrossRef] [Scilit]
  38. Moutik, B.; Summerscales, J.; Graham–Jones, J.; Pemberton, R. Life cycle assessment research trends and implications: A bibliometric analysis. Sustainability 2023, 15, 13408. [Google Scholar] [CrossRef] [Scilit]
  39. Nair, R.R.; Chougule Mallesh, K.; Gomez, J.C.; Brand-Daniels, U. A generalized schema to publish and share life cycle inventories (LCI): Exemplary case of an aviation fuel supply chain. J. Clean. Prod. 2024, 520, 146120. [Google Scholar] [CrossRef] [Scilit]
  40. Kalverkamp, M.; Helmers, E.; Pehlken, A. Impacts of life cycle inventory databases on life cycle assessments: A review by means of a drivetrain case study. J. Clean. Prod. 2020, 269, 121329. [Google Scholar] [CrossRef] [Scilit]
  41. Amon, F.; Dahlbom, S.; Blomqvist, P. Challenges to transparency involving intellectual property and privacy concerns in life cycle assessment/costing: A case study of new flame retarded polymers. Clean. Environ. Syst. 2021, 3, 100045. [Google Scholar] [CrossRef] [Scilit]
  42. Guo, J.; Li, R.Q.; Zhang, R.R.; Qi, J.; Li, N.; Xu, C.; Chiu, A.S.F.; Wang, Y.; Tanikawa, H.; Xu, M. Shedding light on the shadows: Transparency challenge in background life cycle inventory data. J. Ind. Ecol. 2025, 29, 766–776. [Google Scholar] [CrossRef] [Scilit]
  43. Wright, M.M.; Tan, E.C.D.; Tu, Q.; Martins, A.; Parvatker, A.G.; Yao, Y.; Sunol, A.; Smith, R.L. Life Cycle Inventory Availability: Status and Prospects for Leveraging New Technologies. ACS Sustain. Chem. Eng. 2024, 12, 12695–13029. [Google Scholar] [CrossRef] [Scilit] [PubMed]
  44. Edelen, A.; Ingwersen, W.W. The Creation, Management, and Use of Data Quality Information for Life Cycle Assessment. Int. J. Life Cycle Assess. 2018, 23, 759–772. [Google Scholar] [CrossRef] [Scilit] [PubMed]
  45. Saavedra-Rubio, K.; Thonemann, N.; Crenna, E.; Lemoine, B.; Caliandro, P.; Laurent, A. Stepwise Guidance for Data Collection in the Life Cycle Inventory (LCI) Phase: Building Technology-Related LCI Blocks. J. Clean. Prod. 2022, 366, 132903. [Google Scholar] [CrossRef] [Scilit]
  46. Ghose, A. Can LCA be FAIR? Assessing the status quo and opportunities for FAIR data sharing. Int. J. Life Cycle Assess. 2024, 29, 733–744. [Google Scholar] [CrossRef] [Scilit]
  47. Edelen, A.N.; Cashman, S.; Young, B.; Ingwersen, W.W. Life Cycle Data Interoperability Improvements through Implementation of the Federal LCA Commons Elementary Flow List. Appl. Sci. 2022, 12, 9687. [Google Scholar] [CrossRef] [Scilit] [PubMed]
  48. Jia, Y.; Zhang, P.; Liu, Q. Bridging the semantic gap: A review of data interoperability challenges and advanced methodologies from BIM to LCA. Sustainability 2026, 18, 3352. [Google Scholar] [CrossRef] [Scilit]
  49. Zhou, J.; Duan, Y. Blockchain-enabled product life cycle assessment information management system. Ain Shams Eng. J. 2026, 17, 103993. [Google Scholar] [CrossRef] [Scilit]
  50. Valente, A.; Vadenbo, C.; Fazio, S.; Shobatake, K.; Edelen, A.; Sonderegger, T.; Karkour, S.; Kusche, O.; Diaconu, E.; Ingwersen, W.W. Elementary flow mapping across life cycle inventory data systems: A case study for data interoperability under the global life cycle assessment data access (glad) initiative. Int. J. Life Cycle Assess. 2024, 29, 789–802. [Google Scholar] [CrossRef] [Scilit] [PubMed]
  51. Teng, Y.; Li, C.Z.; Shen, G.Q.P.; Yang, Q.; Peng, Z. The impact of life cycle assessment database selection on embodied carbon estimation of buildings. Build. Environ. 2023, 243, 110648. [Google Scholar] [CrossRef] [Scilit]
  52. Clayton, R.; Kirk, J.; Banford, A.; Stamford, L. A review of radioactive waste processing and disposal from a life cycle environmental perspective. Clean. Technol. Environ. Policy 2025, 27, 665–682. [Google Scholar] [CrossRef] [Scilit]
  53. Baitz, M.; Piotrowski, M. Appropriateness and reliability of life cycle assessment results in relation to data quality: Avoiding result discrepancy while improving decision certainty via use of adequate inventory data. Environ. Res. Infrastruct. Sustain. 2025, 5, 3. [Google Scholar] [CrossRef] [Scilit]
  54. European Commission, Joint Research Centre. International Reference Life Cycle Data System (ILCD) Handbook: General Guide for Life Cycle Assessment–Detailed Guidance; Institute for Environment and Sustainability: Ispra, Italy, 2010. [Google Scholar]
  55. European Commission. Recommendation (EU) 2021/2279 of 15 December 2021 on the Use of the Environmental Footprint Methods to Measure and Communicate the Life Cycle Environmental Performance of Products and Organisations. 2021. Available online: https://eur-lex.europa.eu/legal-content/EN/TXT/?uri=CELEX:32021H2279 (accessed on 8 May 2026).
  56. Kupfer, T.; Baitz, M.; Makishi Colodel, C.; Kokborg, M.; Schöll, S.; Rudolf, M.; Thellier, L.; Gonzalez, M.; Schuller, O.; Hengstler, J.; et al. GaBi Databases & Modeling Principles; Sphera: Chicago, IL, USA, 2017. [Google Scholar]
  57. Bamber, N.; Turner, I.; Arulnathan, V.; Li, Y.; Zargar Ershadi, S.; Smart, A.; Pelletier, N. Comparing sources and analysis of uncertainty in consequential and attributional life cycle assessment: Review of current practice and recommendations. Int. J. Life Cycle Assess. 2020, 25, 168–180. [Google Scholar] [CrossRef] [Scilit]
  58. Xu, G.; Luo, Y.; Zhang, Y.; Wang, H.; Shen, Y.; Liu, Y.; Shang, S. Comparison on environmental impacts of cereal and forage production in the Lo-ess Plateau of China: Using life cycle assessment with uncertainty and variability analysis. J. Clean. Prod. 2020, 380, 135094. [Google Scholar]
  59. Wolf, M.; Kusche, O.; Düpmeier, C. The International Reference Life Cycle Data System (ILCD) Format–Basic Concepts and Implementation of Life Cycle Impact Assessment (LCIA) Method Data Sets. In Innovations in Sharing Environmental Observations and Information; Shaker Verlag: Aachen, Germany, 2011; Volume 2, pp. 809–817. [Google Scholar]
  60. Kusche, O.; Düpmeier, C.; Recchioni, M.; Mathieux, F. Creating LCA Data Exchange Networks. In Proceedings of the International Conference on Informatics for Environmental Protection, Sustainable Development and Risk Management, Dessau, Germany, 29–31 August 2012. [Google Scholar]
  61. Cardoso, V.E.; Sanhudo, L.; Silvestre, J.D.; Almeida, M.; Costa, A.A. Challenges in the harmonization and digitalization of Environmental Product Declarations for construction products in the European context. Int. J. Life Cycle Assess. 2024, 29, 759–788. [Google Scholar] [CrossRef] [Scilit]
Figure 1. Number of countries in the datasets for each database. Notes: Yellow bars and green bars represent regional datasets from multi-national databases ecoinvent and GaBi, respectively. The light pink bar shows datasets of the national USLCI database, the orange bar indicates datasets of the national CLCD database, and the dark pink bar represents USLCI datasets available on the GLAD platform.
Applsci 16 08476 g001
Figure 2. Statistical overview of power products and their datasets across various databases.
Applsci 16 08476 g002
Figure 3. Model tracing methods and sequences; product systems 1–3 are examples of lifecycle models for different product systems.
Applsci 16 08476 g003
Figure 4. Hierarchy Diagram of Data Quality Assessment Methodologies.
Applsci 16 08476 g004
Table 1. Systemic characteristics of the database.
DatabaseCLCD × WebLCAEcoinventGaBiUSLCI
InstitutionSichuan University, Yike Environmental Technology Co., Ltd.the Swiss research institutions, EPFL, Empa, Agroscope, the Paul Scherrer InstituteIKP, University of StuttgartNational Renewable Energy Laboratory
Country/RegionChinaGlobalIKP, University of StuttgartNational Renewable Energy Laboratory
Number of APDs4000020,5770
Number of UPDs025,0000995
Fee–based×
Documentation FormatWebLCA, ILCD–compliantecoSPOLDILCD—compliantJSON—LD
Data Quality Assessment MethodWebLCA–DQR,Pedigree matrix + uncertainty analysisPedigree matrix + uncertainty simulationPEF—DQR—likeUSEPA—DQR
Table 2. Database traceability and transparency status reports.
DatabaseCLCD × WebLCAEcoinventGaBiUSLCI
Results and life cycle modelsResults transparencybbbn.a.
Document transparencyaaaa
Subroutines included in the document disclosure modelan.a.a *n.a.
Document navigationaba *a *
Unit Process and list dataVisibility of input and output listsaaunknowna
Visibility of list valuesbaunknowna
Searchability of the unit process data listbno list on unit process levelno list on unit process leveln.a.
Data processing for individual line itemsbddn.a.
Notes: “a” means the corresponding feature is publicly accessible. “b” reveals that access is limited to subscription users. “c” indicates that the feature is available only to the reviewers. “d” means that access is restricted exclusively to the author. “e” shows that the feature is not accessible even to the author. The notation “n.a.” represents that the feature is not currently available. “unknown” reveals that feature accessibility cannot be determined from publicly available information, and the asterisk “*” indicates that the feature has been incompletely implemented. All assessments are based solely on public information obtained from the official platforms of each LCBD, and the actual transparency status may require further disclosure by database developers for definitive verification.
Table 3. Completeness of oil and gas production unit processes in the database.
DatabaseCLCD × WebLCAEcoinventUSLCI
Unit Processpetroleum and gaspetroleum and gas production, onshoreCrude oil, on–shore domestic, at extraction
Reference productpetroleum and gaspetroleumCrude oil
Input Inventory CountEnergy consumption266
Raw materials220
Infrastructure420
Natural resources121
Output Inventory CountDisposal waste148
Emissions to air320
Emissions to water290
Emissions to soil210
Table 4. Transparency of information in database documentation fields.
Transparency InformationDatabase Documentation
WebLCA
(CLCD × WebLCA)
Ecospold
(Ecoinvent)
ILCD
(GaBi)
Document transparencyModel documentationDocumentationProcess dataset
Subroutines included in the document disclosure modelName of the main background datasetExchangesFlow diagram(s) or picture(s) (source dataset)
Document navigationUpstream processExchangesIncluded datasets
(process dataset)
Input/Output inventory visibilityInventory
and parameters
Exchanges/
Inventory data visibilityInventory and parametersExchanges/
Availability of unit process data listReferenceData source/
Data and information processing for inventoryAlgorithms and assumptionsExchange details/
Data quality assessmentData quality
uncertainty
Data quality uncertaintyData quality indicator
Notes: “√” marks represent publicly available information, while “×” indicates unavailable information. “/” indicates that this information field is not defined in this database document format.
Disclaimer/Publisher’s Note: The statements, opinions and data contained in all publications are solely those of the individual author(s) and contributor(s) and not of MDPI and/or the editor(s). MDPI and/or the editor(s) disclaim responsibility for any injury to people or property resulting from any ideas, methods, instructions or products referred to in the content.