1. Introduction
As global oil and gas exploration extends into deep formations, deepwater, and HTHP regions, drilling challenges are intensifying. Approximately 75% of drilling complications occur in low-permeability mudstone formations [
1], where the complex mechanical behavior of deep mudstone under HTHP conditions fundamentally constrains drilling efficiency. Revealing the deformation and failure mechanisms of mudstone under HTHP conditions is therefore a key scientific issue for drilling acceleration.
The mechanical behavior of deep mudstone is controlled by mineral composition, microstructure, and temperature–pressure conditions, exhibiting significant cross-scale heterogeneity. The coexistence of clay minerals (illite, chlorite) and brittle minerals (quartz) endows it with “brittle–ductile” properties, and its hydration swelling characteristics cause structural degradation [
2,
3,
4,
5,
6]. Microcracks within the mudstone directly control fragmentation characteristics and crack evolution [
7,
8,
9]. High temperature induces thermal damage and strength reduction, while confining pressure inhibits lateral dilation and promotes shear failure [
10,
11]. Single-scale analysis is insufficient, necessitating multiscale characterization methods that bridge microscopic mineral properties to macroscopic mechanical responses.
In experimental studies, HTHP triaxial tests remain the primary approach for obtaining macroscopic mechanical parameters. Liu et al. [
7] characterized mudstone deformation under confining pressures of 0–25 MPa and identified the progressive transition from brittle to ductile behavior. Yu et al. [
8] investigated permeability evolution over 40–100 °C and revealed the temperature-dependent nature of fluid transport properties. Alneasan and Alzo’ubi [
10] found that mode II fracture toughness increased by 15–47% at 500 °C, indicating thermally induced strengthening of shear resistance. Feng et al. [
11] studied thermal expansion up to 400 °C and documented irreversible thermal strain. Liu et al. [
12] identified 10 MPa as the brittle–ductile transition threshold for mudstone under ambient temperature. However, these macroscopic tests provide limited insight into the underlying microscale mechanisms, and the derived parameters represent bulk properties that average out the contributions of individual mineral phases.
At the microscale, nanoindentation has emerged as a powerful tool for probing mineral-specific mechanical properties. Sun et al. [
13] reported a clay matrix hardness of 398.22 MPa and elastic modulus of 11.89 GPa, demonstrating the significant contrast between clay minerals and brittle phases. Luo et al. [
14] revealed progressive homogenization of indentation response with increasing depth, suggesting that microscale properties are depth-dependent due to the presence of pores and microcracks. Recent advances have further extended nanoindentation to multiscale characterization of heterogeneous rocks [
15] and established quantitative frameworks for upscaling mineral-scale measurements to macroscopic properties [
16]. Despite these contributions, a systematic cross-scale correlation linking microscopic mineral properties, mesoscopic crack evolution, and macroscopic failure behavior remains lacking in the literature, as most existing studies address either the microscale or the macroscale in isolation.
In numerical simulation, the finite element method (FEM) offers high accuracy for continuous deformation analysis but suffers from mesh dependency and difficulties in handling fracture coalescence [
16,
17,
18]. The extended finite element method (XFEM) allows crack propagation without remeshing [
18,
19,
20,
21] but cannot fully describe the continuous-to-discontinuous transition during progressive failure. The discrete element method (DEM) naturally captures rock fragmentation and block motion [
21,
22,
23,
24,
25] but has low computational efficiency for large-scale problems and difficulty in calibrating microparameters. The combined finite–discrete element method (FDEM), proposed by Munjiza et al. [
26,
27,
28,
29,
30], integrates the advantages of FEM for continuum deformation and DEM for post-fracture behavior, and the Y-Geo platform has achieved significant international impact [
27,
29]. Recent developments have extended FDEM to dynamic excavation problems [
31] and quasi-static loading in layered rocks [
32], demonstrating its versatility in geomechanical applications. Furthermore, multiscale cross-platform frameworks combining PFC and FDEM have been developed to simulate thermal-crack network evolution [
33], and waterjet-assisted cutting processes have been investigated through integrated experimental and FDEM approaches [
34], showing the growing capability of FDEM to handle complex loading conditions.
However, existing FDEM models predominantly treat rock as a homogeneous continuum, assigning uniform mechanical properties regardless of mineral type [
35]. This simplification, while computationally efficient, fails to capture mesoscale damage evolution where crack initiation is strongly controlled by mineral interfaces and grain-scale heterogeneity. The spatial distribution of minerals, the mechanical contrast between a weak clay matrix and strong quartz grains, and the statistical variability of local strength all play critical roles in determining crack paths and ultimate failure modes—effects that are inherently averaged out in homogeneous models. Heterogeneity has been introduced into FDEM through the Weibull distribution in a number of recent studies. Most of them assign a single shape parameter to the whole model, so grain stiffness and grain-boundary strength vary together and cannot be controlled independently. Assigning one parameter to the matrix elements and a second parameter to the cohesive elements separates the two sources of heterogeneity. The first then governs where stress concentrates and the second governs whether a stressed region fails. This separation has been established for ultra-deep dolomite with the same numerical implementation used here [
36]. It has not been applied to mudstone under high temperature and high pressure, where a weak clay matrix and stiff quartz grains coexist and the mechanical contrast between them is large. Moreover, although grain-based modeling approaches have been applied to granite [
15,
16] and have demonstrated improved prediction of crack patterns, similar efforts for mudstone—particularly under HTHP conditions—remain scarce. The combined challenges of high clay content, temperature-dependent plasticity, and pressure-sensitive failure make mudstone a particularly difficult material to model, and existing FDEM frameworks have not yet been systematically extended or validated for this rock type under realistic thermomechanical conditions.
Classical strength theories were largely established on the basis of experiments conducted on ideal brittle materials under ambient temperature or simple-loading conditions. However, for porous sedimentary rocks such as mudstone under high-temperature and high-pressure conditions, the failure behavior exhibits pronounced nonlinearity, enhanced plasticity, and thermally induced degradation, and the applicability of these classical criteria remains largely unverified. Therefore, rather than attempting to propose a new strength theory, this study employs the classical theories as a reference framework and systematically carries out the following work: (1) obtaining the macroscopic mechanical parameters of mudstone under high-temperature and high-pressure conditions through triaxial compression tests; (2) revealing the thermo-mechanical coupled damage mechanisms through microstructural observations; and (3) reproducing the complete continuum-to-discontinuum failure process via FDEM numerical simulations. The purpose of this study is to fill the gap in mechanical data for mudstone under the given thermomechanical conditions, to examine the applicability boundaries of classical theories to this rock type, and to lay the foundation for the future development of temperature-dependent strength criteria. Two classical criteria are used in this study, and their roles are distinct. The Mohr–Coulomb criterion is applied to the macroscopic response. The friction angle and the cohesion are back-calculated from the measured strengths in
Section 3.5, and the failure plane predicted from them is compared with the measured and simulated angles. The Drucker–Prager criterion is applied to the microelement strength inside the damage constitutive model described in
Section 2.3. Criteria formulated at the lattice scale or at the scale of individual microcrack populations are not applied here, because the present measurements do not resolve those scales.
To address these issues, this study takes an HTHP mudstone formation in the western South China Sea as the research object and proposes a multiscale experimental–numerical combined characterization method. XRD, SEM, nanoindentation, and HTHP triaxial tests are integrated to obtain data from nanoscale to macroscale. An FDEM numerical model incorporating mineral spatial heterogeneity and Weibull strength distribution is constructed to quantify cross-scale correlations among mineral phases, crack networks, and macroscopic failure, providing a theoretical basis for drilling optimization in deep HTHP mudstone formations.
2. Materials and Methods
This study adopts an integrated “experiment–observation–simulation” research approach, in which the three components have distinct roles while mutually corroborating one another. Triaxial compression tests provide macroscopic mechanical parameters (peak strength, elastic modulus, Poisson’s ratio, and failure modes), which constitute the core experimental basis for the conclusions. Microstructural observations (SEM/BSE) reveal the damage characteristics of post-test samples (thermally induced microcracks, mineral alteration, etc.), providing microscopic evidence for the mechanistic interpretation of macroscopic mechanical responses. FDEM numerical simulations, calibrated against experimental data, extend the analysis to the spatiotemporal evolution of stress fields, displacement fields, and acoustic emission events beyond the resolution limits of experimental observations, on the premise of model reliability having been validated. The final conclusions are drawn primarily from experimental observations and supplemented by numerical simulations, with both approaches collectively supporting a comprehensive understanding of the failure mechanisms of mudstone under high-temperature and high-pressure conditions.
2.1. Nanoindentation and Scanning Electron Microscopy (SEM) Experiments
Microscopic experiments mainly included nanoindentation testing and scanning electron microscopy (SEM) analysis. The SEM/EDS specimen preparation and analysis procedures in this study strictly follow the ASTM C1723-16 [
37] standard and are consistent with recent high-quality studies that employ rigorous microstructural characterization strategies [
38,
39]. Rock samples were first thinned using a Leica RES 102 ion beam (Leica Microsystems, Wetzlar, Germany) thinning system to meet the thickness requirements for subsequent observation, then finely polished with an EM TIC 3X ion beam milling instrument (Leica Microsystems, Wetzlar, Germany) to remove surface damage layers such as oxide films and scratches, achieving an atomically flat surface (SY/T 5162-2021) [
40]. During argon ion beam polishing for SEM sample preparation, the sample is placed in a high-vacuum chamber, where a high-energy argon ion beam, generated by ionizing argon gas under a high-voltage electric field, is directed at a specific angle onto the sample surface. By precisely controlling the accelerating voltage and milling time, the physical sputtering effect of the ion beam progressively removes oxide layers, scratches, and damaged layers introduced by mechanical grinding. This process yields an atomically flat surface, effectively eliminating stress-induced artifacts while preserving the microstructural features of shale, including micropores, organic matter, and mineral boundaries, thereby providing a high-quality surface for subsequent high-resolution imaging and EDS analysis. EDS mapping was carried out on seven fields of view. Elemental distribution data were acquired for eleven rock-forming elements, namely O, Na, Mg, Al, Si, S, K, Ca, Ti, Fe, and C. Each element map was converted to a binary element domain by Otsu thresholding. The mapped area fraction of every element was then calculated field by field. Between-field variability is therefore expressed as a mean and a standard deviation over the seven fields. The spatial association between elements was quantified by the Pearson correlation coefficient of the paired intensity maps. The coefficient was computed for each field and then averaged. Pixels were further assigned to mineral phases by a rule set based on element co-occurrence. This yields phase-area fractions that can be compared directly with the XRD quantitative results.
A carbon coating was then applied using an EM ACE 200 carbon coater (Leica Microsystems, Wetzlar, Germany) to prevent image drift in clay mineral areas caused by charging effects (ASTM E1078-14) [
41]. Mechanical property tests were conducted using a KLA G200 nanoindenter (KLA, Shanghai, China) to obtain the elastic modulus and hardness of each mineral component, while high-resolution observation of mudstone microstructure was performed using a ZEISS Merlin field-emission scanning electron microscope (GB/T 17359-2012) [
42]. Mineral composition was determined by X-ray diffraction. Whole-rock powder was scanned with Cu Kα radiation. The 2θ range was 3° to 48° and the step was 0.02°. The clay fraction finer than 2 μm was separated by sedimentation and prepared as oriented mounts. Each mount was scanned three times, first air-dried, then again after ethylene-glycol solvation, and finally after heating at 550 °C. Clay species were identified from the behavior of the basal reflections across the three treatments. Whole-rock and clay-mineral contents were quantified following SY/T 5163-2018 [
43].
The related equipment is shown in
Table 1.
2.2. Uniaxial/Triaxial Compression Tests
Uniaxial and triaxial compression specimens were prepared from downhole cores and machined into standard cylindrical samples with a diameter of 25 mm and a height of 50 mm. Three specimens were prepared in total. Their coring depths are close and their petrophysical properties are comparable. The end faces were ground sequentially with sandpapers to ensure flatness and parallelism. Given the strong water sensitivity of mudstone, wire electrical discharge machining (WEDM) was adopted during coring to minimize disturbance. All specimens exhibited intact appearances with no visible macroscopic fractures.
Two test temperatures were used, 20 °C and 150 °C. The in situ temperature of the target interval ranges from 140 °C to 160 °C, and 150 °C is the median of that range. The high-temperature case therefore represents the formation condition, and the ambient case serves as the reference. Intermediate temperatures were not tested, and
Section 5 identifies this as a direction for further work.
The testing equipment employed was the RTR-1500 high-temperature and high-pressure rock-mechanics testing system manufactured by GCTS, Tempe, AZ, USA. Deformation measurements were performed using LVDT displacement sensors (KEYENCE, Itasca County, MN, USA). Uniaxial tests were conducted under a strain-controlled loading mode at a loading rate of 0.05%-min−1. Axial loading was applied under strain control, with the loading rate gradually increasing from 0.01%-min−1 to 0.05%-min−1, and then maintained constant until specimen failure, after which loading continued for a certain period. Overall, this constituted a quasi-static loading mode.
2.3. FDEM Principles and Model Establishment
The finite–discrete element method (FDEM) proposed by Munjiza et al. [
28] combines the advantages of the finite element method (FEM) in the continuous deformation stage and the discrete element method (DEM) in the discontinuous deformation stage. In this method, the computational domain is discretized into triangular elements using Delaunay triangulation, and zero-thickness quadrilateral cohesive elements are embedded at the interfaces between adjacent triangular elements to characterize the progressive failure process from continuum to discontinuum. During computation, the stress within each triangular element is solved based on the generalized Hooke’s law under plane strain conditions and then converted into nodal forces. The quadrilateral cohesive elements determine three types of yield failure modes—tensile, shear, or mixed-mode—according to the cohesive fracture model. Contact searching is performed using the the Non-Binary Tree (NBS) algorithm, and contact forces are calculated using the distributed penalty function method. By solving the equations of motion, nodal velocities and displacements are updated at each time step, reproducing the entire process from microcrack initiation to macroscopic fracture. Based on this method, Mahabadi et al. developed the Y-Geo program and its companion graphical user interface Y-GUI, facilitating model-parameter assignment and boundary-condition application [
29].
To simulate the progressive failure process of mudstone under high-temperature and high-pressure conditions, a numerical method capable of handling both continuum deformation and discontinuum fracture evolution is required. The conventional finite element method (FEM) offers high accuracy in solving elastic–plastic deformation but struggles to effectively model element splitting and discontinuous displacement fields after fracture coalescence. The discrete element method (DEM), while proficient in simulating inter-particle/block interactions and movements, is less capable of characterizing the continuous stress–strain distribution within intact rock and is computationally expensive. The extended finite element method (XFEM), although capable of modeling crack propagation without mesh re-meshing, still faces numerical stability challenges when dealing with multiple crack intersections, branching, and complex fracture networks.
- (1)
Model Establishment
Mesoscopic heterogeneity determines the fracturing effect and progressive failure process of rock under stress fields. To accurately simulate the mechanical behavior of deep HTHP mudstone, a numerical model was constructed based on mesoscopic heterogeneity. The procedure includes: (1) obtaining mineral composition via XRD; (2) obtaining the elastic modulus of the primary minerals via nanoindentation; (3) constructing a two-dimensional geometric model and randomly assigning basic properties to triangular elements using Y-GUI; (4) assigning mineral elastic modulus and Poisson’s ratio parameters to the Weibull distribution; (5) setting strength parameters of quadrilateral cohesive elements through the Weibull distribution. This model is capable of reproducing the strength reduction characteristics and fragility of mudstone.
For each specimen, five indentation points were placed on different mineral phases. Grouping the point-level results by phase (guided by SEM/EDS) yielded representative moduli of about 45 GPa for the clay minerals and 55 GPa for quartz, consistent with the specimen-level range of 43.9–58.2 GPa. These phase-representative values were assigned to the corresponding finite elements (
Table 2). The numerical model measured 25 × 50 mm, consistent with the laboratory specimens, and was discretized with a triangular mesh of 0.6 mm characteristic size (9660 solid elements). A time step of 3 × 10
−9 s was used, and axial load was applied through rigid platens at a constant velocity of 0.05 m/s with a platen–specimen friction coefficient of 0.1.
The relevant parameters of the cohesive elements are shown in
Table 3.
- (2)
Parameter Calibration
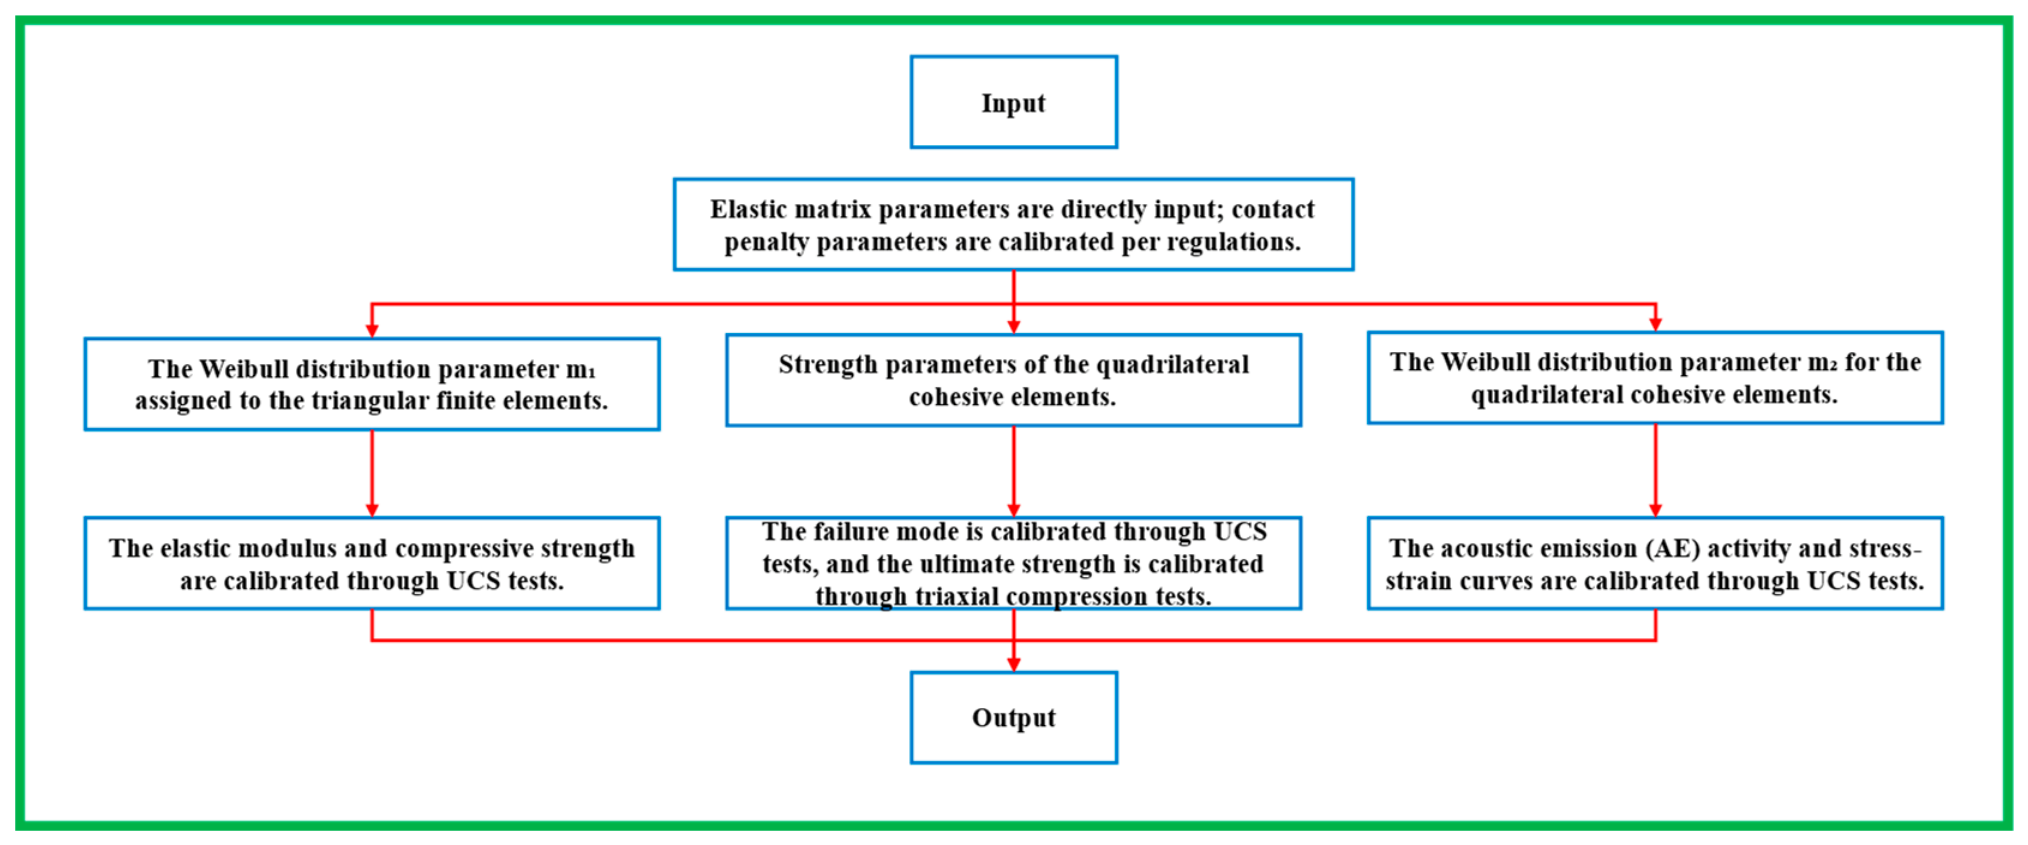
Since the model incorporates both the Weibull parameter m
1 for triangular finite elements and m
2 for quadrilateral cohesive elements, separate calibration is required (
Figure 1). m
1 is calibrated against the elastic modulus and compressive strength obtained from uniaxial compression tests, while m
2 is calibrated against the post-peak shape of the stress–strain curve and the macroscopic crack pattern observed under uniaxial compression. When m
1 = 2 and m
2 = 2.5, the peak strength and elastic modulus obtained from numerical simulation show good agreement with experimental results (
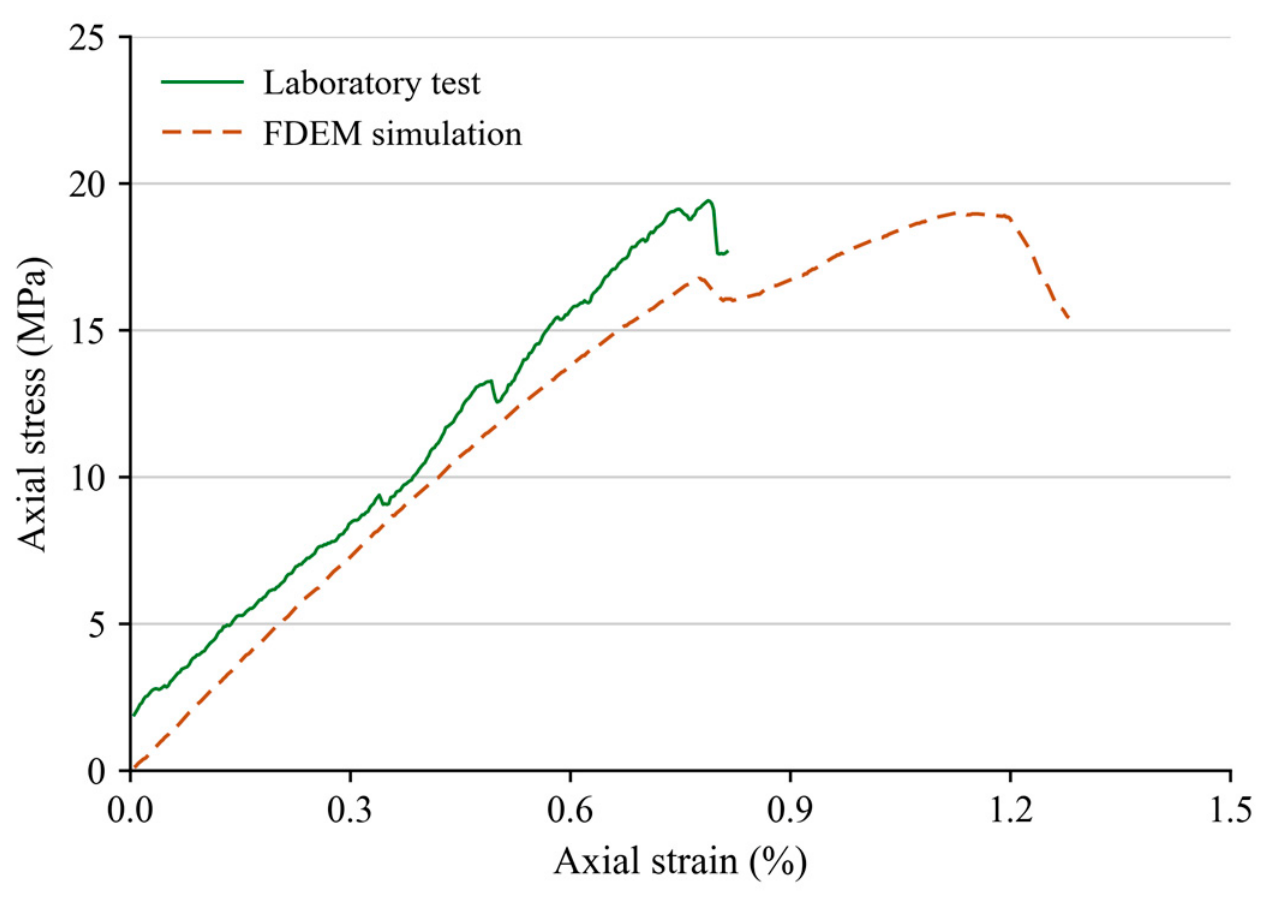
Table 4). The corresponding stress–strain comparison under uniaxial compression is given in
Figure 2. A quantitative assessment of the agreement is presented in
Section 3.5. It should be noted that this parameter combination is not unique, and different microscopic parameter values may yield similar results. The sensitivity of the two Weibull parameters is examined in
Section 3.7.
Figure 1.
Calibration procedure for the two Weibull parameters. The parameter m1 is assigned to the triangular finite elements and is calibrated against the elastic modulus and the compressive strength from uniaxial compression tests. The parameter m2 is assigned to the quadrilateral cohesive elements and is calibrated against the failure mode, the acoustic emission activity and the post-peak curve shape, with the ultimate strength checked against the triaxial tests. UCS denotes uniaxial compressive strength.
Figure 1.
Calibration procedure for the two Weibull parameters. The parameter m1 is assigned to the triangular finite elements and is calibrated against the elastic modulus and the compressive strength from uniaxial compression tests. The parameter m2 is assigned to the quadrilateral cohesive elements and is calibrated against the failure mode, the acoustic emission activity and the post-peak curve shape, with the ultimate strength checked against the triaxial tests. UCS denotes uniaxial compressive strength.
Figure 2.
Axial stress–strain response of the mudstone under uniaxial compression at 20 °C. Green solid curve, laboratory test; orange dashed curve, FDEM simulation. Quantitative error metrics are given in
Table 5.
Figure 2.
Axial stress–strain response of the mudstone under uniaxial compression at 20 °C. Green solid curve, laboratory test; orange dashed curve, FDEM simulation. Quantitative error metrics are given in
Table 5.
Table 5.
Quantitative validation metrics of the FDEM model against the laboratory results, separated into quantities that served as calibration targets and quantities that did not.
Table 5.
Quantitative validation metrics of the FDEM model against the laboratory results, separated into quantities that served as calibration targets and quantities that did not.
| Quantity | Condition | Experiment | Simulation | Error or Reference |
|---|
| Quantities used to calibrate the model |
| Peak strength (MPa) | 0 MPa, 20 °C | 19.5 | 19.1 | −2.05% |
| Elastic modulus (GPa) | 0 MPa, 20 °C | 2.597 | 2.61 | 0.50% |
| Curve RMSE (MPa) | 0 MPa, 20 °C | — | — | 1.73 |
| Curve NRMSE (%) | 0 MPa, 20 °C | — | — | 9.9 |
| Coefficient of determination | 0 MPa, 20 °C | — | — | 0.894 |
| Peak deviatoric stress (MPa) | 40 MPa, 20 °C | 121.8 | 124.5 | 2.2% |
| Curve RMSE (MPa) | 40 MPa, 20 °C | — | — | 3.00 |
| Curve MAE (MPa) | 40 MPa, 20 °C | — | — | 1.97 |
| Curve NRMSE (%) | 40 MPa, 20 °C | — | — | 2.8 |
| Coefficient of determination | 40 MPa, 20 °C | — | — | 0.991 |
| Peak deviatoric stress (MPa) | 40 MPa, 150 °C | 116.7 | 117.1 | 0.3% |
| Curve RMSE (MPa) | 40 MPa, 150 °C | — | — | 3.28 |
| Curve MAE (MPa) | 40 MPa, 150 °C | — | — | 2.41 |
| Curve NRMSE (%) | 40 MPa, 150 °C | — | — | 3.1 |
| Coefficient of determination | 40 MPa, 150 °C | — | — | 0.986 |
| Peak strain (%) | 0 MPa, 20 °C | 0.79 | 1.13 | +43%, see Section 3.5 |
| Failure mode | 0 MPa, 20 °C | axial splitting | tensile cracks 75% of length | consistent |
| Work to peak (MJ·m−3) | 40 MPa, 20 °C | 1.41 | 1.45 | 3.1% |
| Work to peak (MJ·m−3) | 40 MPa, 150 °C | 1.72 | 1.85 | 7.7% |
| Quantities not used in the calibration |
| Poisson’s ratio | 0 MPa, 20 °C | 0.178 | 0.17 | −4.49% |
| Shear-crack length fraction (%) | 40 MPa, 20 °C | shear failure | >98 | consistent |
| Shear-crack length fraction (%) | 40 MPa, 150 °C | shear failure | >98 | consistent |
| Crack band angle (°) | 0 MPa, 20 °C | 67 to 90 | 74 | within the observed range |
| Shear plane angle (°) | 40 MPa, 20 °C | 71 | 55 | Mohr–Coulomb 58.0 |
| Shear plane angle (°) | 40 MPa, 150 °C | 59 | 59 | Mohr–Coulomb 57.3 |
| Friction angle (°) and cohesion (MPa) | 20 °C | 26.0 and 6.10 | — | from the two tests |
| Displacement ratio, failure to peak | 0 MPa, 20 °C | — | 1.75 | Figure 3 |
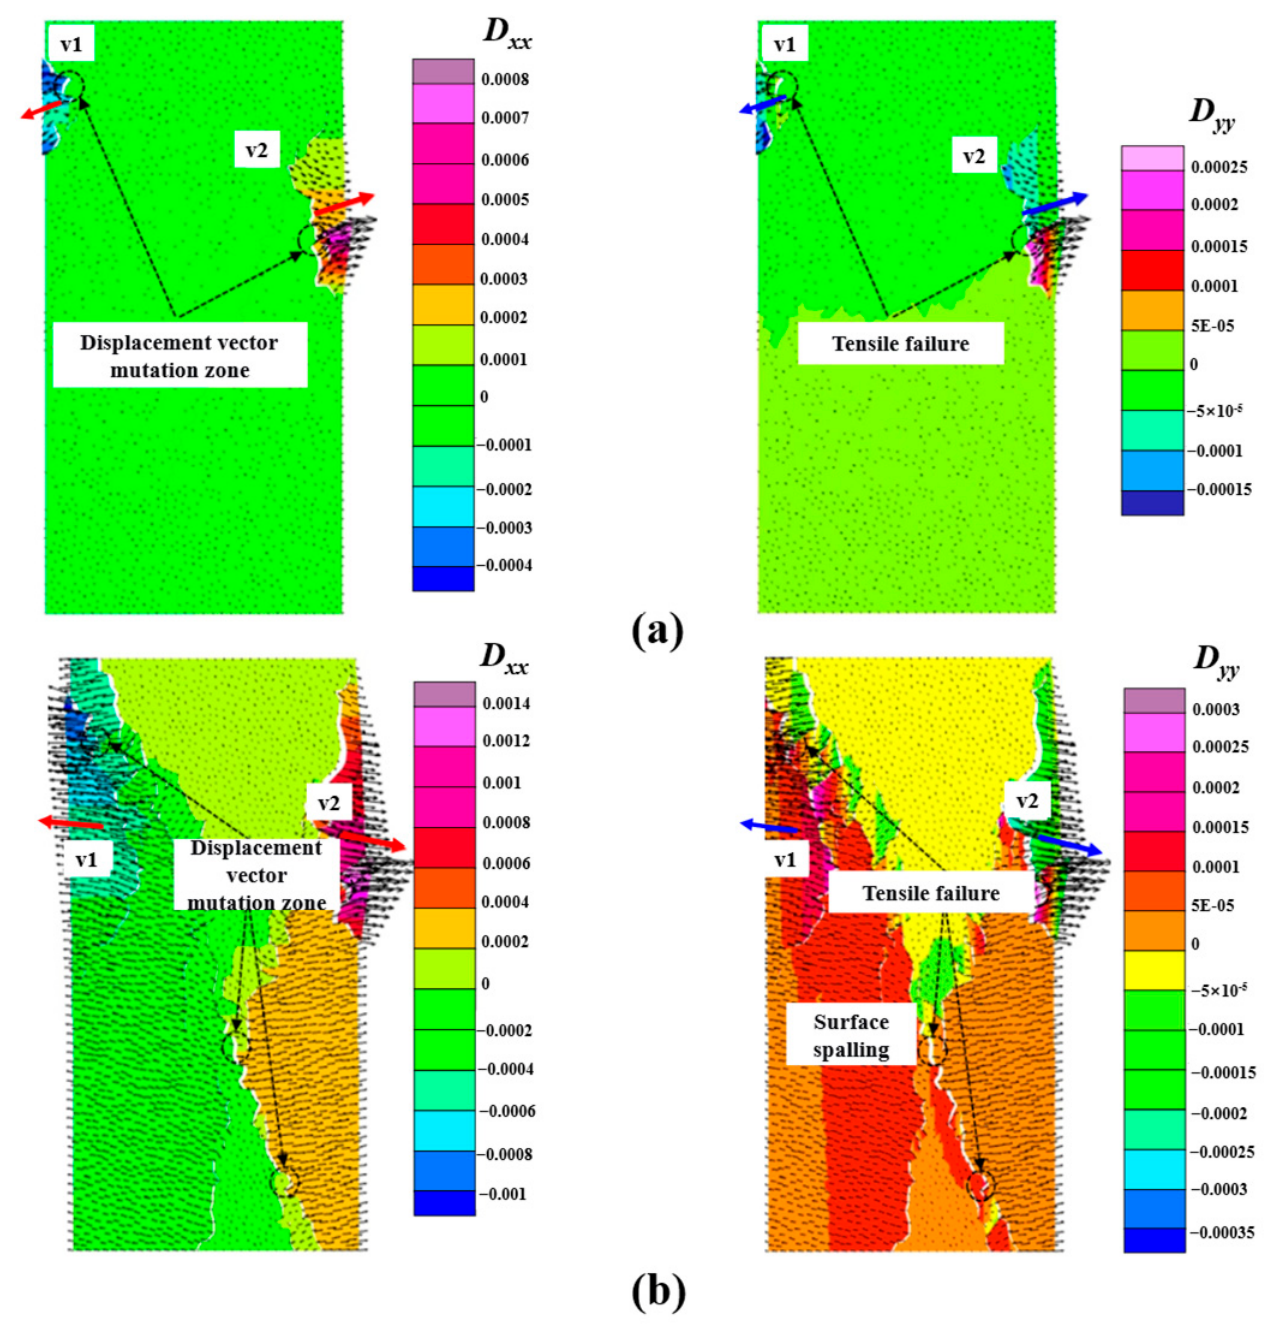
Figure 3.
Displacement fields of the specimen under uniaxial compression at 20 °C. (a) Peak state; (b) failure state. In each state the left panel gives the horizontal displacement Dxx and the right panel gives the vertical displacement Dyy, with the color scale beside each panel. Arrows v1 and v2 are displacement vectors. Labeled zones mark the displacement vector mutation zone, the tensile failure zone, and the surface spalling zone. All fields are FDEM results.
Figure 3.
Displacement fields of the specimen under uniaxial compression at 20 °C. (a) Peak state; (b) failure state. In each state the left panel gives the horizontal displacement Dxx and the right panel gives the vertical displacement Dyy, with the color scale beside each panel. Arrows v1 and v2 are displacement vectors. Labeled zones mark the displacement vector mutation zone, the tensile failure zone, and the surface spalling zone. All fields are FDEM results.
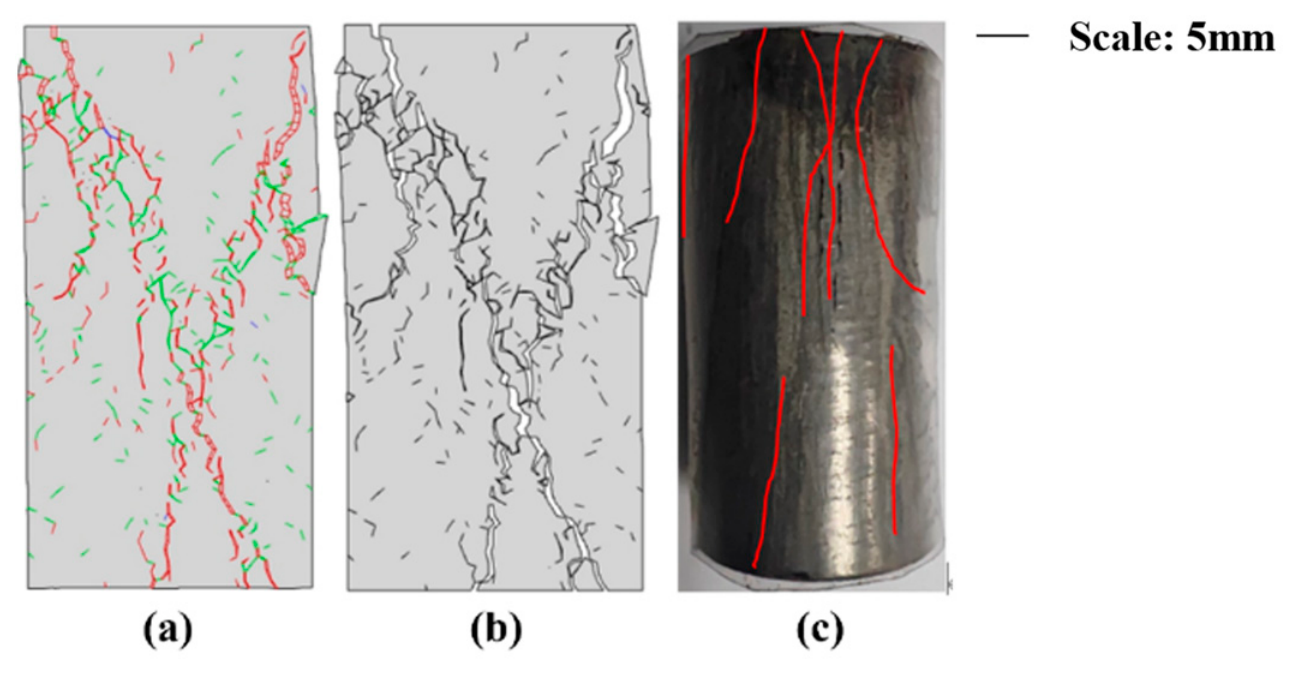
The uniaxial compression numerical simulation results (
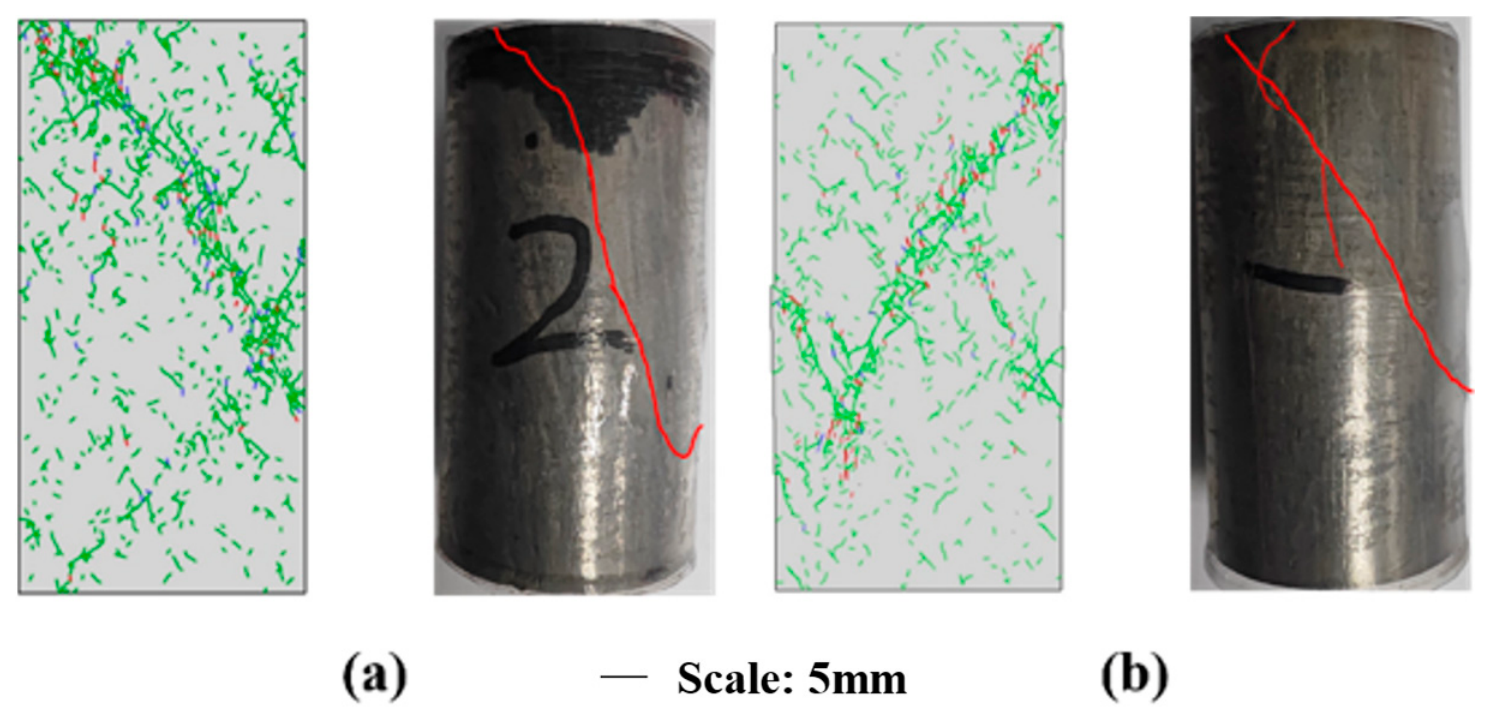
Figure 4a,b) show that the cementation strength assigned based on the Weibull distribution successfully characterized the microcracks and weak cementation between microscopic minerals within the mudstone. A large number of discrete microcracks are visible in the simulation results, involving both intergranular fractures between different mineral components and intragranular fractures within the same mineral. At the early loading stage, microcracks initiated and then gradually propagated and coalesced with increasing load, eventually forming several vertical and oblique tensile macroscopic main fractures, which is consistent with the laboratory test results (
Figure 4c).
Temperature effects are introduced at the cohesive-element level through a statistical, Weibull-based damage evolution law rather than a prescribed failure mode. The damage variable of each cohesive element follows a Weibull cumulative form whose characteristic parameters, M and F_o, are obtained by fitting the deviatoric stress–strain curve of the corresponding triaxial test. Because these parameters are fitted separately to the 20 °C and 150 °C curves, the temperature-induced reduction in peak strength, the delayed yield point, and the accelerated post-peak softening emerge from the calibrated mesoscale damage response. The full formulation of this damage constitutive model—including the Drucker–Prager microelement-strength criterion and the fitting of M and F_o from the deviatoric stress–strain data—is detailed in our earlier work [
44] and is therefore only summarized here.
3. Results
3.1. Mineral Composition and Microstructural Characteristics
3.1.1. Mineral Composition Characteristics
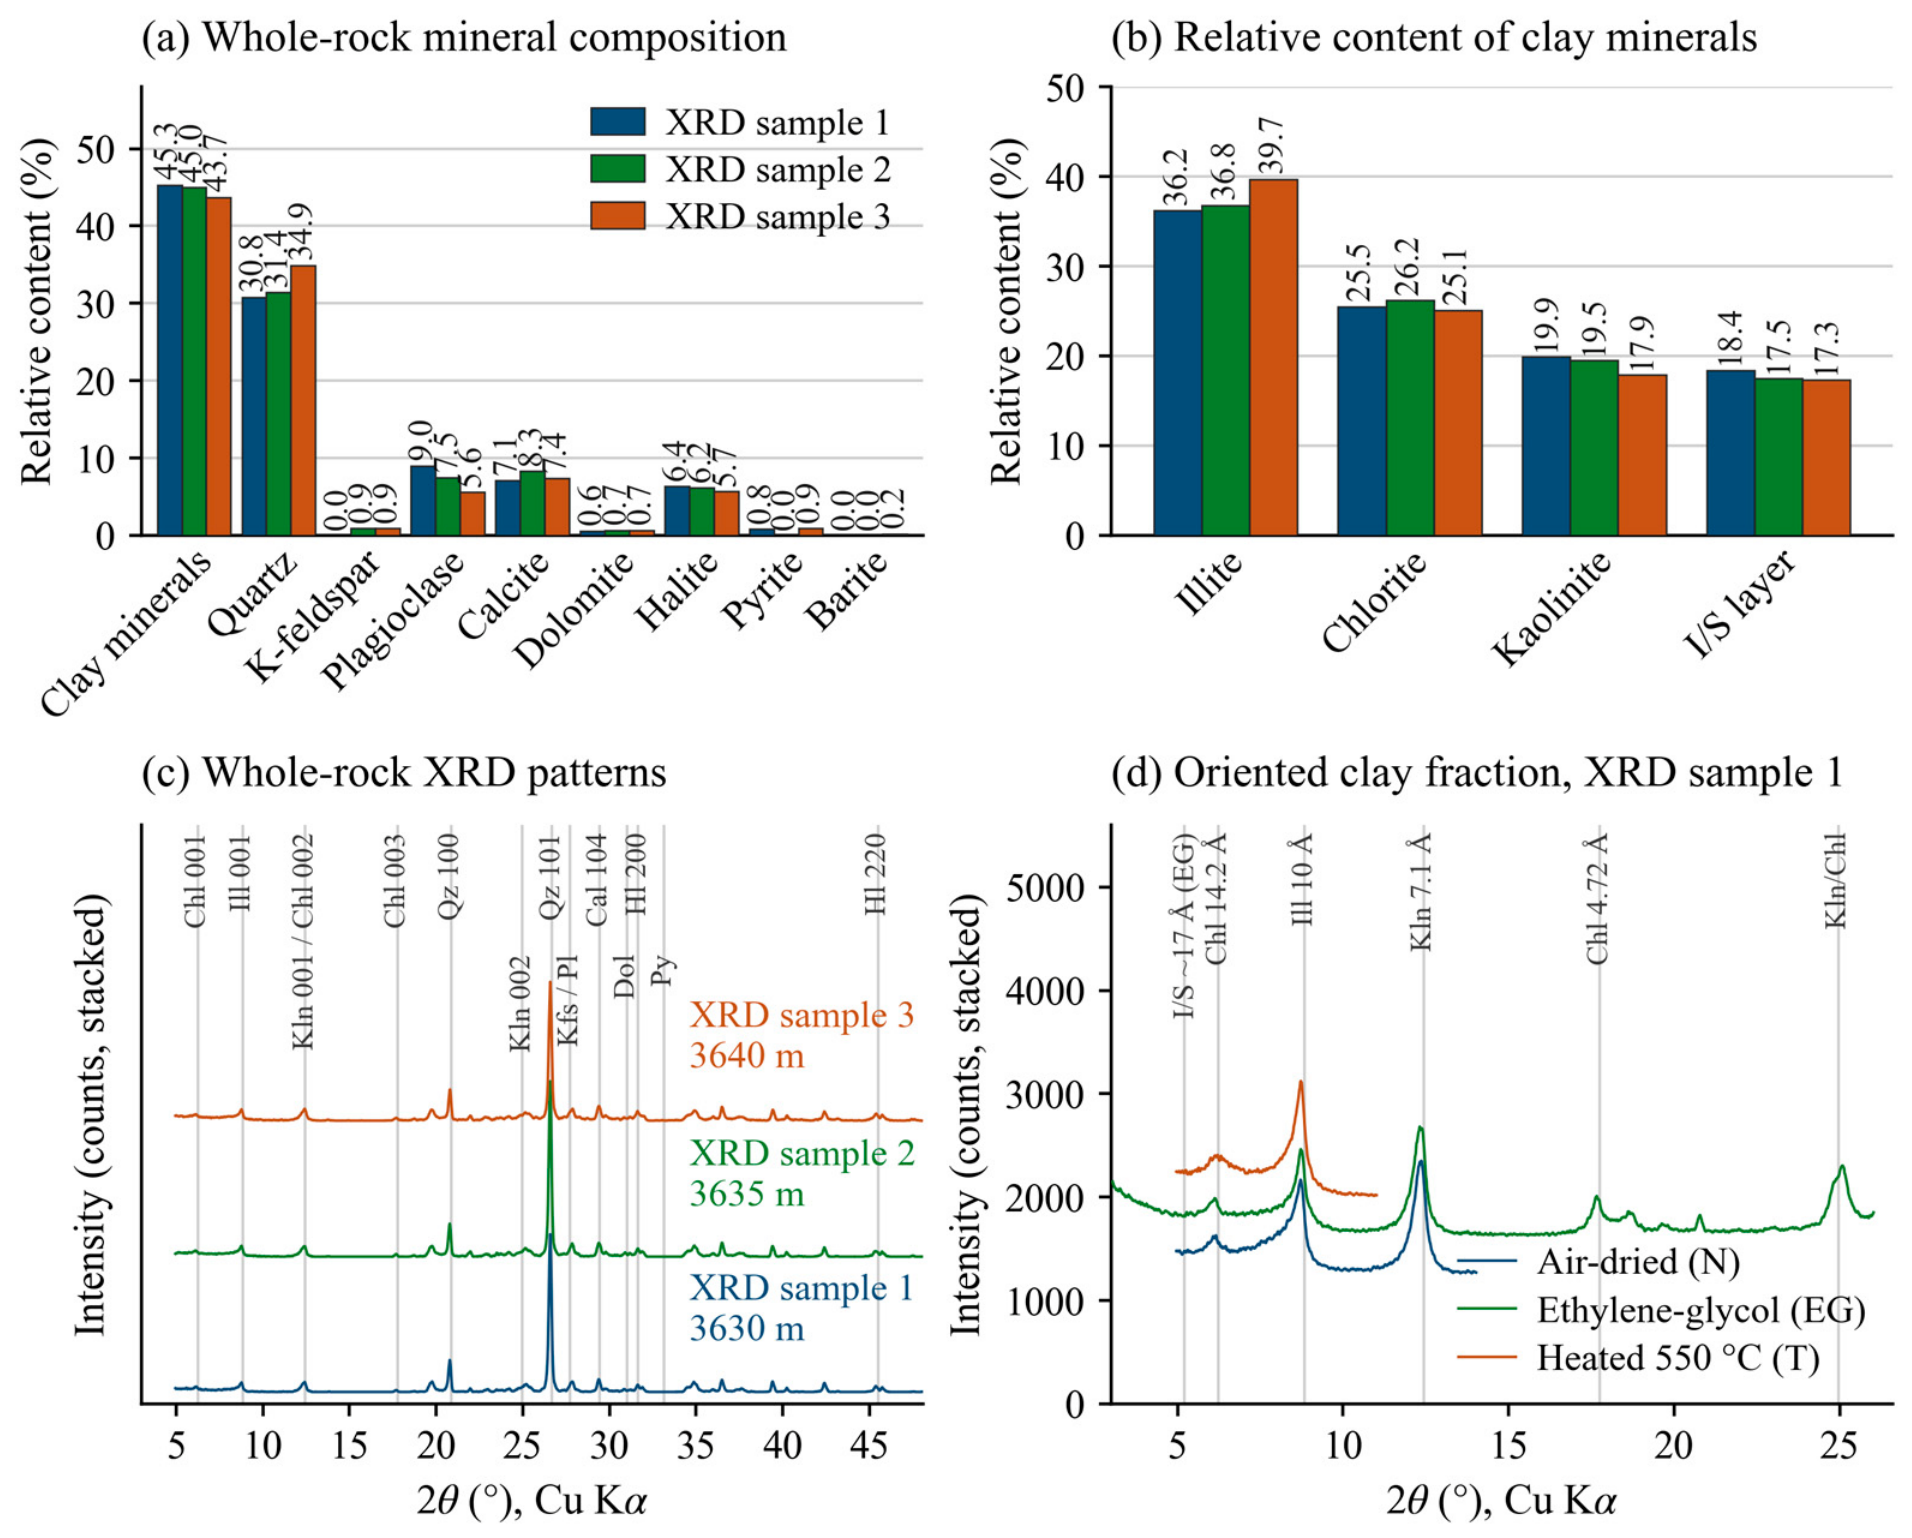
The XRD results show that the mudstone is composed mainly of clay minerals and quartz. The clay content ranges from 43.7% to 45.3% with a mean of 44.67%. The quartz content ranges from 30.8% to 34.9% with a mean of 32.37%. Feldspar, calcite, dolomite, halite, pyrite, and barite together account for 21% to 24%. Within the clay fraction, illite is dominant at 36.2% to 39.7% with a mean of 37.57%, and it is accompanied by chlorite, kaolinite, and illite/smectite mixed layers. These results are summarised in
Figure 5a,b. The three XRD samples were taken from adjacent positions within the same cored interval as the mechanical specimens. The coefficient of variation of the total clay content across the three samples is only 1.9%. The mineral composition of this interval is therefore treated as uniform in the numerical model.
The corresponding diffraction patterns are given in
Figure 5c,d. The three whole-rock patterns agree closely in peak position and in relative intensity. The quartz 101 reflection near 26.6° is the strongest peak in every sample. The clay basal reflections near 6.2°, 8.8°, and 12.4° are present in every sample as well. Feldspar, calcite, dolomite, halite, and pyrite appear only as weak peaks, which is consistent with their low-quantified contents. The oriented mounts in
Figure 5d support the species assignment. The 10 Å reflection keeps its position after glycol solvation and after heating, which identifies illite. The 14.2 Å reflection is retained in all three states and strengthens after heating. This is the response expected of chlorite, and the chlorite 4.72 Å reflection is resolved in the solvated scan. The 7.1 Å reflection in the air-dried and solvated scans arises from kaolinite together with the chlorite 002 reflection. A weak feature near 17 Å is resolved only in the solvated scan. It corresponds to the small proportion of illite/smectite mixed layers reported in
Figure 5b.
3.1.2. Microstructural Characteristics
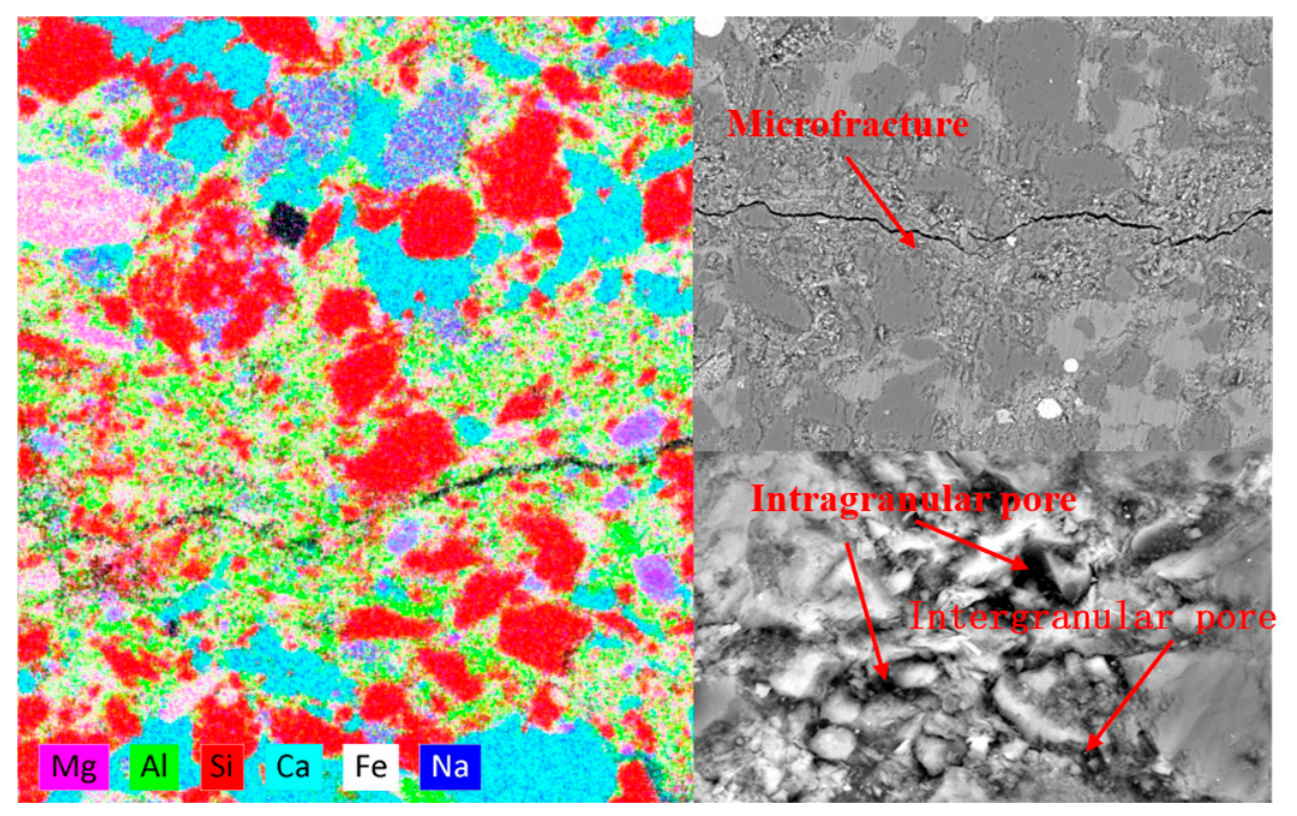
ESEM observations shown in
Figure 6 revealed that microcracks were well developed in the mudstone, exhibiting an irregular network-like distribution, with some cracks showing a relatively high degree of interconnection. According to references [
45,
46], three types of pores are developed in the mudstone: intragranular pores, intergranular pores, and organic matter pores. Intragranular pores are distributed between clay-mineral crystallites, displaying elongated or irregular shapes. Intergranular pores are developed along mineral grain boundaries, exhibiting relatively good connectivity. Organic matter pores are sporadically distributed within organic matter particles, with relatively small pore sizes. The above-mentioned pore-fracture system constitutes potential pathways for fluid migration and stress concentration.
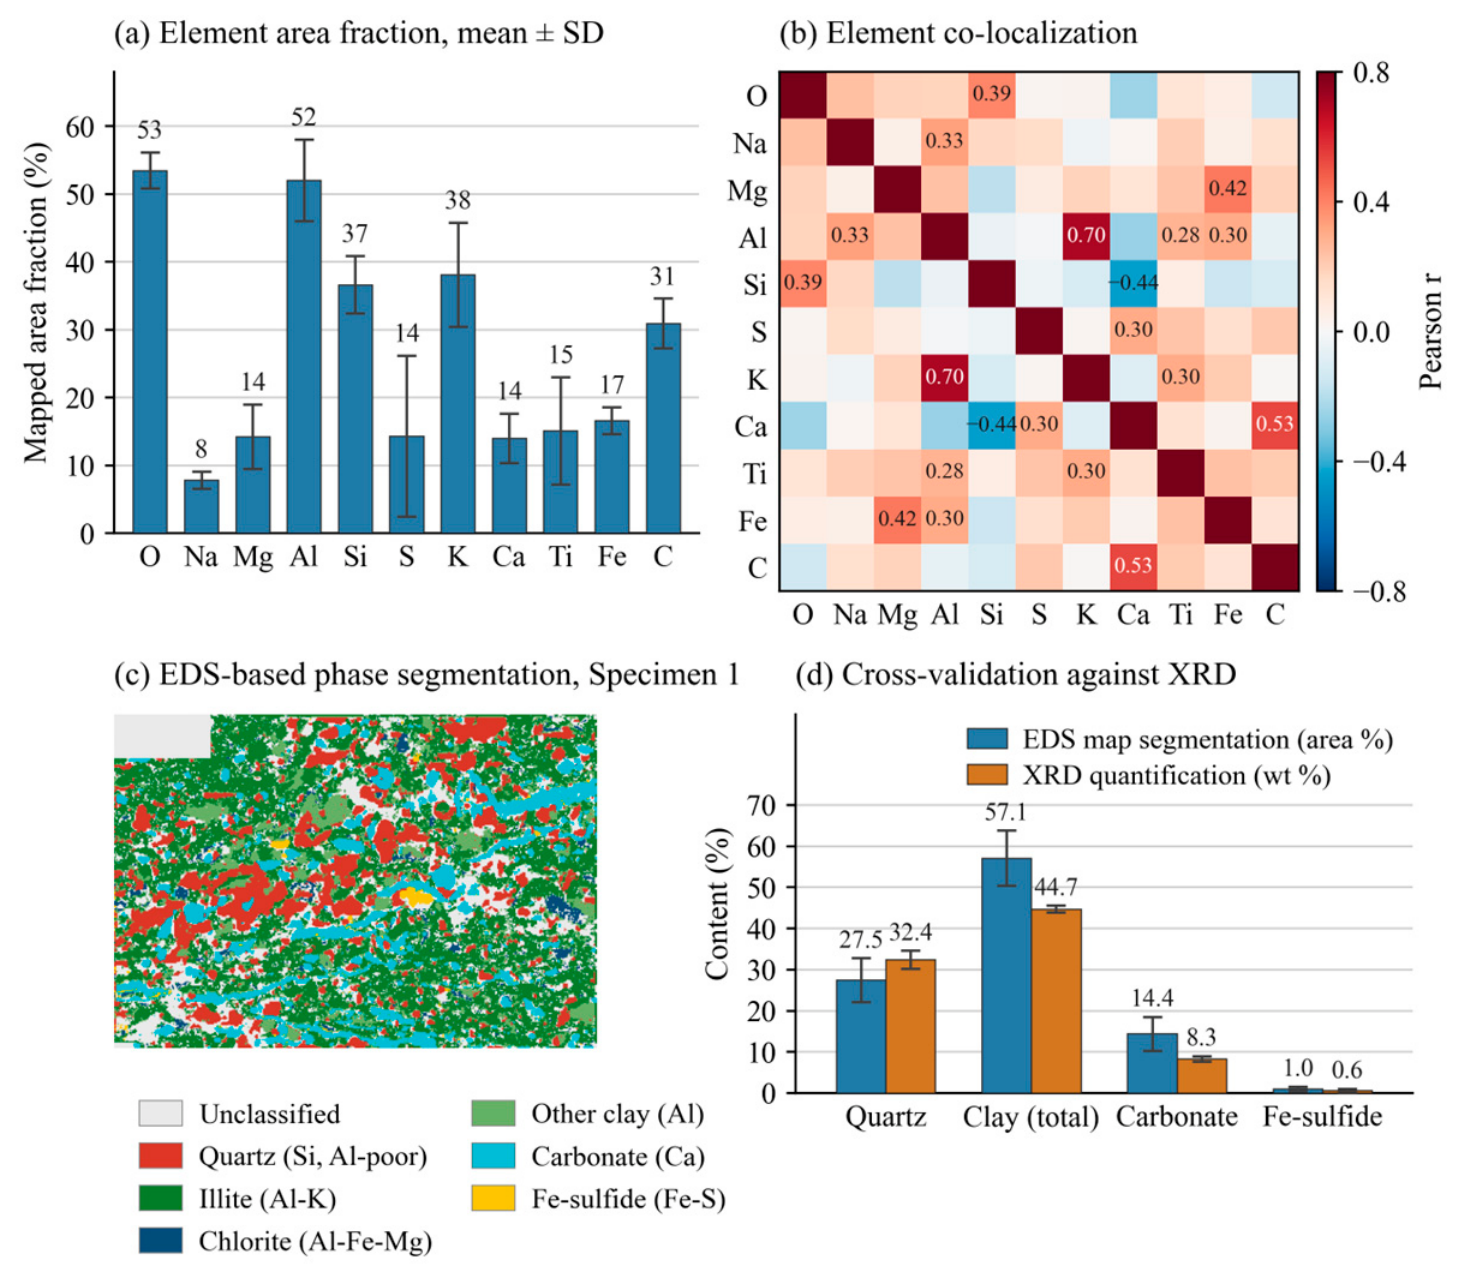
High-resolution imaging and elemental analysis were carried out with a ZEISS Merlin field-emission scanning electron microscope fitted with a Bruker XFlash 6|30 energy-dispersive spectrometer. Seven fields of view were mapped for eleven elements.
Figure 7a gives the mapped area fraction of each element as a mean and a standard deviation over the seven fields. O, Al, K, and Si occupy the largest areas. This is consistent with an assemblage dominated by clay minerals and quartz.
The spatial association between elements is quantified in
Figure 7b. Al and K form the most strongly correlated pair at r = 0.70, which locates the illite domains. Ca and C give r = 0.53 and mark the carbonate domains. Mg and Fe give r = 0.42, as expected for chlorite. Al and Na give r = 0.33, which corresponds to plagioclase. Si and Ca are negatively correlated at r = −0.44. This reflects the mutual exclusion of quartz grains and carbonate cement. Each of these associations matches a mineral that was independently quantified by XRD. The element maps can therefore be read as a mineral distribution rather than as a qualitative image.
Assigning every pixel to a phase on the basis of element co-occurrence gives the phase map in
Figure 7c and the phase contents in
Figure 7d. Quartz, total clay, carbonate and iron sulfide follow the same order and the same relative magnitudes as the XRD results. The clay content obtained from the maps is higher than the XRD value, 57.1% against 44.7%. Two effects account for this. The electron beam interacts with a volume about 1 to 2 μm across at 20 kV, so a pixel on the boundary between a coarse grain and the fine-grained matrix is assigned to the matrix. An area fraction measured on a single section is also not identical to a mass fraction. The meaningful result is therefore the agreement in ranking and in order of magnitude. It confirms that the mineral spatial distribution adopted in the FDEM model is representative of the material.
3.2. Nanoindentation Test Results
Based on the load-displacement curves, the elastic modulus and hardness of the three specimens were calculated, and the results are presented in
Table 6. Specimen 1 has an elastic modulus of 51.7 GPa and a hardness of 2.106 GPa. The maximum loads at each indentation point are relatively close, and the hardness is generally low. Combined with microscopic analysis, it is inferred that the specimen is predominantly composed of clay minerals, indicating good homogeneity, and the low hardness reflects a relatively strong plastic character. Specimen 2 exhibits an elastic modulus of 58.2 GPa and a hardness of 2.96 GPa. Compared with Specimen 1, both the elastic modulus and hardness are increased, suggesting that this specimen has a denser structure; however, the overall hardness remains relatively low, indicating a weak resistance to external indentation. Specimen 3 has an elastic modulus of 43.9 GPa and a hardness of 1.42 GPa, both significantly lower than those of the previous two specimens. Nevertheless, combined with mineral composition analysis, it contains a higher quartz content and lower clay mineral content, suggesting a relatively loose structure with possibly a larger number of microcracks.
It should be noted that the elastic moduli from nanoindentation, 43.9 to 58.2 GPa, are several times higher than the macroscopic moduli, 2.60 to 14.24 GPa. The two are not contradictory but reflect different scales: within a micrometer-scale indentation depth, nanoindentation probes the intrinsic stiffness of mineral grains and the dense matrix, essentially excluding macroscopic pores and microcracks, whereas the uniaxial/triaxial modulus is the bulk equivalent stiffness of a specimen containing pores, microcracks, and weak intergranular cementation. This scale contrast is precisely the physical basis for mapping microscale mineral parameters to the macroscopic response through the Weibull distribution in the FDEM model.
3.3. Macroscopic Mechanical Behavior and Failure Mode
3.3.1. Mechanical Behavior
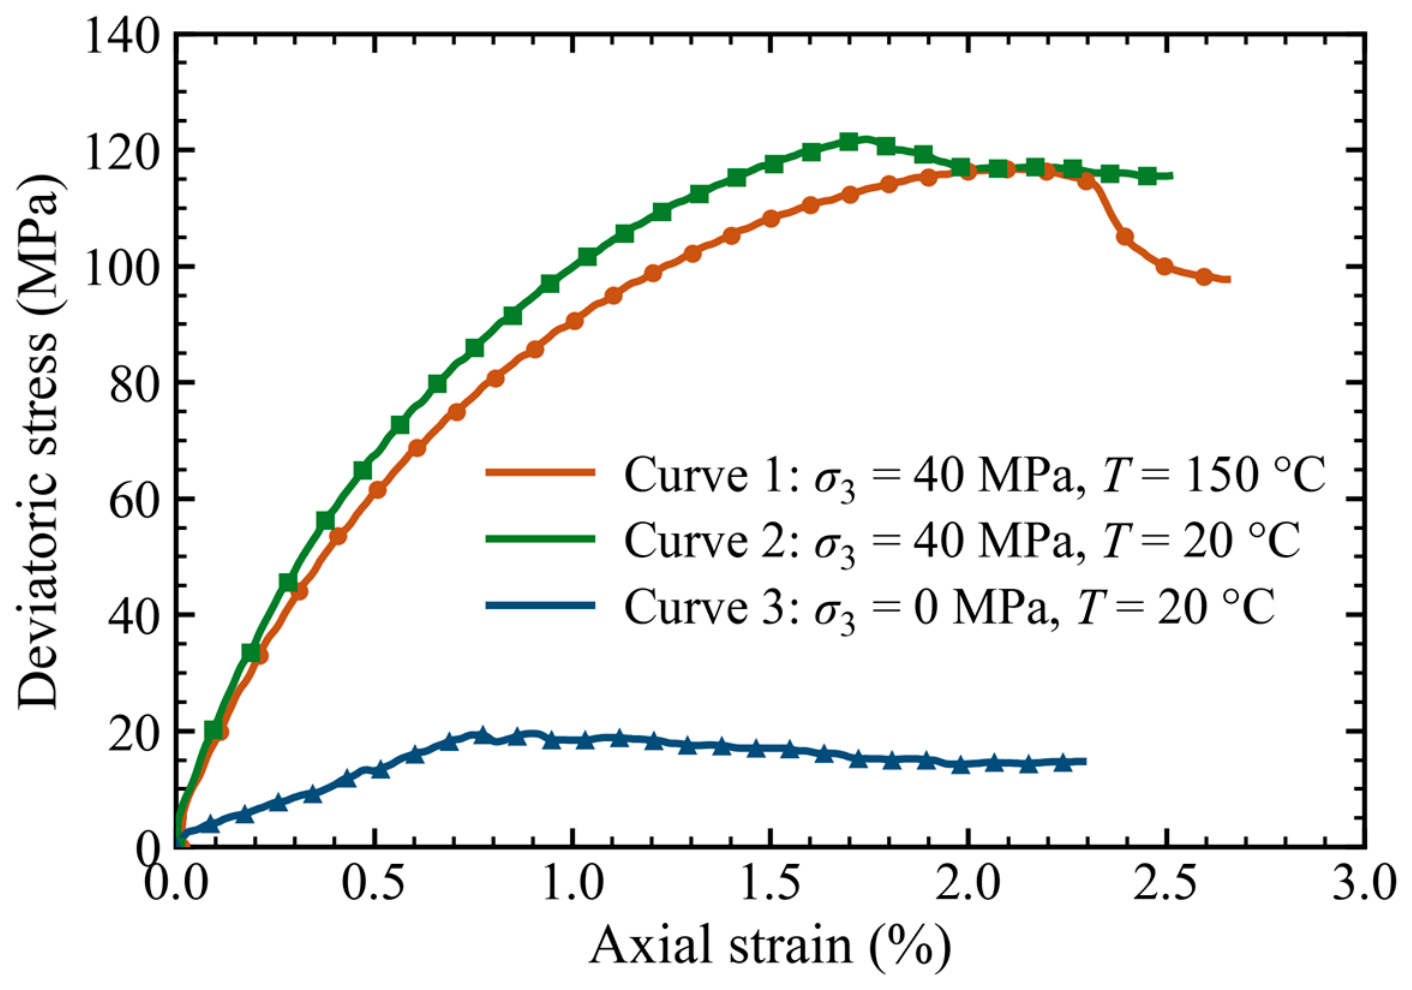
Curve 3 in
Figure 8 represents the uniaxial compressive stress–strain curve of the mudstone. The mudstone specimen exhibits remarkably pronounced plastic characteristics, with the overall curve displaying a concave shape and virtually no crack-closure stage. Only a brief linear elastic deformation occurs at the initial stage, followed immediately by the nonlinear deformation stage, during which deformation continuously develops with increasing compressive stress, and most of the deformation is irrecoverable upon unloading. The slope of the curve gradually decreases with increasing stress, and no sudden stress drop is observed, indicating that the specimen exhibits strong plasticity and a dense structure.
To obtain mechanical parameters under realistic formation conditions, the confining pressure was determined as 40 MPa based on the sampling depth. Curve 2 represents the stress–strain curve under triaxial compression at ambient temperature. Under confining pressure, the specimen exhibits no initial crack closure stage but rapidly enters the linear elastic stage. The latter part of the curve gradually becomes concave, displaying plastic characteristics, with a distinct yield stress point, and the post-peak curve declines gently, indicating good ductility. Comparison of the ambient-temperature triaxial and uniaxial test results reveals that when the confining pressure is increased to 40 MPa, the compressive strength of the mudstone increases significantly, and the Young’s modulus also exhibits an obvious change, whereas Poisson’s ratio is less affected. Compared with the ambient-temperature triaxial test, the compressive strength, Young’s modulus, and Poisson’s ratio all decrease to varying degrees under high-temperature (150 °C) triaxial conditions, indicating that temperature has a significant influence on the mechanical properties of the mudstone. The specific data are presented in
Table 7. Although the coring depth is considerable, only three mechanical tests were conducted in this study. The research focuses on the variation of mechanical properties and failure modes under high temperature and high pressure, which compensates in part for the limited number of tests.
Table 7.
Results of the uniaxial and triaxial rock mechanics tests on the plastic mudstone.
Table 7.
Results of the uniaxial and triaxial rock mechanics tests on the plastic mudstone.
| No. | Burial Depth (m) | Peak Strength (MPa) | E (GPa) | ν | Confining Pressure (MPa) | Temperature/°C |
|---|
| 1 | 3633.60 | 116.7 | 12.425 | 0.112 | 40 | 150 |
| 2 | 3634.15 | 121.8 | 14.242 | 0.213 | 40 | 20 |
| 3 | 3635.91 | 19.5 | 2.597 | 0.178 | 0 | 20 |
Table 8.
Measurement uncertainty budget and effect sizes.
Table 8.
Measurement uncertainty budget and effect sizes.
| Source or Effect | Value 1 | Value 2 | Change (%) | Result |
|---|
| Axial force, accuracy 0.25% | — | — | — | u = 0.14% |
| Specimen diameter, ±0.05 mm | — | — | — | u(area) = 0.23% |
| Combined stress uncertainty | — | — | — | U = 0.54% at k = 2 |
| Peak strength, uniaxial (MPa) | 19.5 | — | — | 19.5 ± 0.11 |
| Peak strength, 40 MPa, 20 °C (MPa) | 121.8 | — | — | 121.8 ± 0.66 |
| Peak strength, 40 MPa, 150 °C (MPa) | 116.7 | — | — | 116.7 ± 0.64 |
| Elastic modulus, all conditions | — | — | — | U = 0.6% at k = 2 |
| Confining pressure on strength (MPa) | 19.5 | 121.8 | +524.6 | d = 37.6, n = 1 |
| Confining pressure on modulus (GPa) | 2.597 | 14.242 | +448.4 | d = 32.1, n = 1 |
| Temperature on strength (MPa) | 121.8 | 116.7 | −4.2 | d = 0.30, n = 175 |
| Temperature on modulus (GPa) | 14.242 | 12.425 | −12.8 | d = 0.91, n = 19 |
| Temperature on Poisson’s ratio | 0.213 | 0.112 | −47.4 | d = 3.40, n = 2 |
3.3.2. Macroscopic Failure Mode
Specimen 1 (150 °C, 40 MPa) is dominated by shear failure, with the main crack developing along the shear plane, accompanied by an axial vertical crack, exhibiting a shear-axial composite failure. Specimen 2 (ambient temperature, 40 MPa) is also dominated by shear failure, with the main crack propagating along the shear plane, locally accompanied by wing cracks. Specimen 3 (ambient temperature, uniaxial) is dominated by splitting failure, with cracks predominantly distributed in the axial vertical direction. In terms of failure characteristics, splitting-type failure exhibits a higher fracture-generation rate and more significant volumetric-dilation effects, whereas shear-type failure exhibits the highest load-bearing strength, with composite failure falling between the two.
3.4. FDEM Numerical Simulation of Mesoscopic Damage and Failure
The 20 °C and 150 °C cases below are based on the same virtual specimen (identical mesh, mineral spatial distribution, and random seed); only the temperature-dependent cohesive parameters differ, so the temperature effect is examined under otherwise identical sample conditions.
3.4.1. Microcrack Distribution Characteristics
Further analysis of
Figure 4 and
Figure 9 reveals that the microcrack distribution characteristics differ significantly under different loading conditions. Under uniaxial compression (
Figure 4), tensile cracks are predominant and dispersedly distributed, mainly developing along the loading direction and forming multiple approximately parallel longitudinal crack zones. Under ambient-temperature triaxial compression, shear cracks replace tensile cracks as the dominant type and concentrate into an evident shear band, as shown in
Figure 9a. All crack and failure plane angles reported here are measured from the specimen cross-section, which is normal to the loading axis. The simulated shear band is inclined at 55° on this basis. The crack density within the shear band is significantly higher than that in the surrounding area, and the damage exhibits pronounced localization characteristics. Under HTHP triaxial compression (
Figure 9b), the failure mode remains shear-dominated, but the crack distribution tends to be more diffuse, with both the shear band width and the internal crack density increased, and sporadically distributed tensile microcracks also observable outside the band. These crack distribution characteristics agree with the failure modes observed in the experiments, both in type and in orientation. The quantitative comparison is given in
Section 3.5.
3.4.2. Displacement Field Distribution and Evolution Characteristics
Figure 3 presents the displacement cloud maps and vector diagrams of the mudstone specimen under uniaxial compression, exhibiting typical tensile failure characteristics. At the peak state (
Figure 3a), the horizontal displacement (D
xx) is symmetrically distributed in the middle of the specimen, with displacement vectors v
1 and v
2 pointing outward, indicating a significant lateral dilation effect resulting from the Poisson effect induced by axial compression. The vertical displacement (D
yy) exhibits uniform compressive deformation, with the displacement gradient linearly distributed along the axial direction, consistent with the experimental observation of a dense internal structure without an initial crack closure stage. At the failure state (
Figure 3b), the horizontal displacement becomes discontinuous at the vector mutation zone, corresponding to the location of tensile cracks, with the directions of vectors v
1 and v
2 deflected, reflecting the separation movement of materials on both sides of the crack. The maximum horizontal displacement increases from 0.0008 to 0.0014, and the displacement localization phenomenon is highly consistent with the longitudinal splitting failure mode observed on the specimen surface. The maximum horizontal displacement therefore grows by a factor of 1.75 between the peak state and the failure state, which provides a direct measure of the degree of displacement localization. The vertical displacement field also exhibits heterogeneous characteristics, with a significant difference in displacement gradient on both sides of the tensile failure zone.
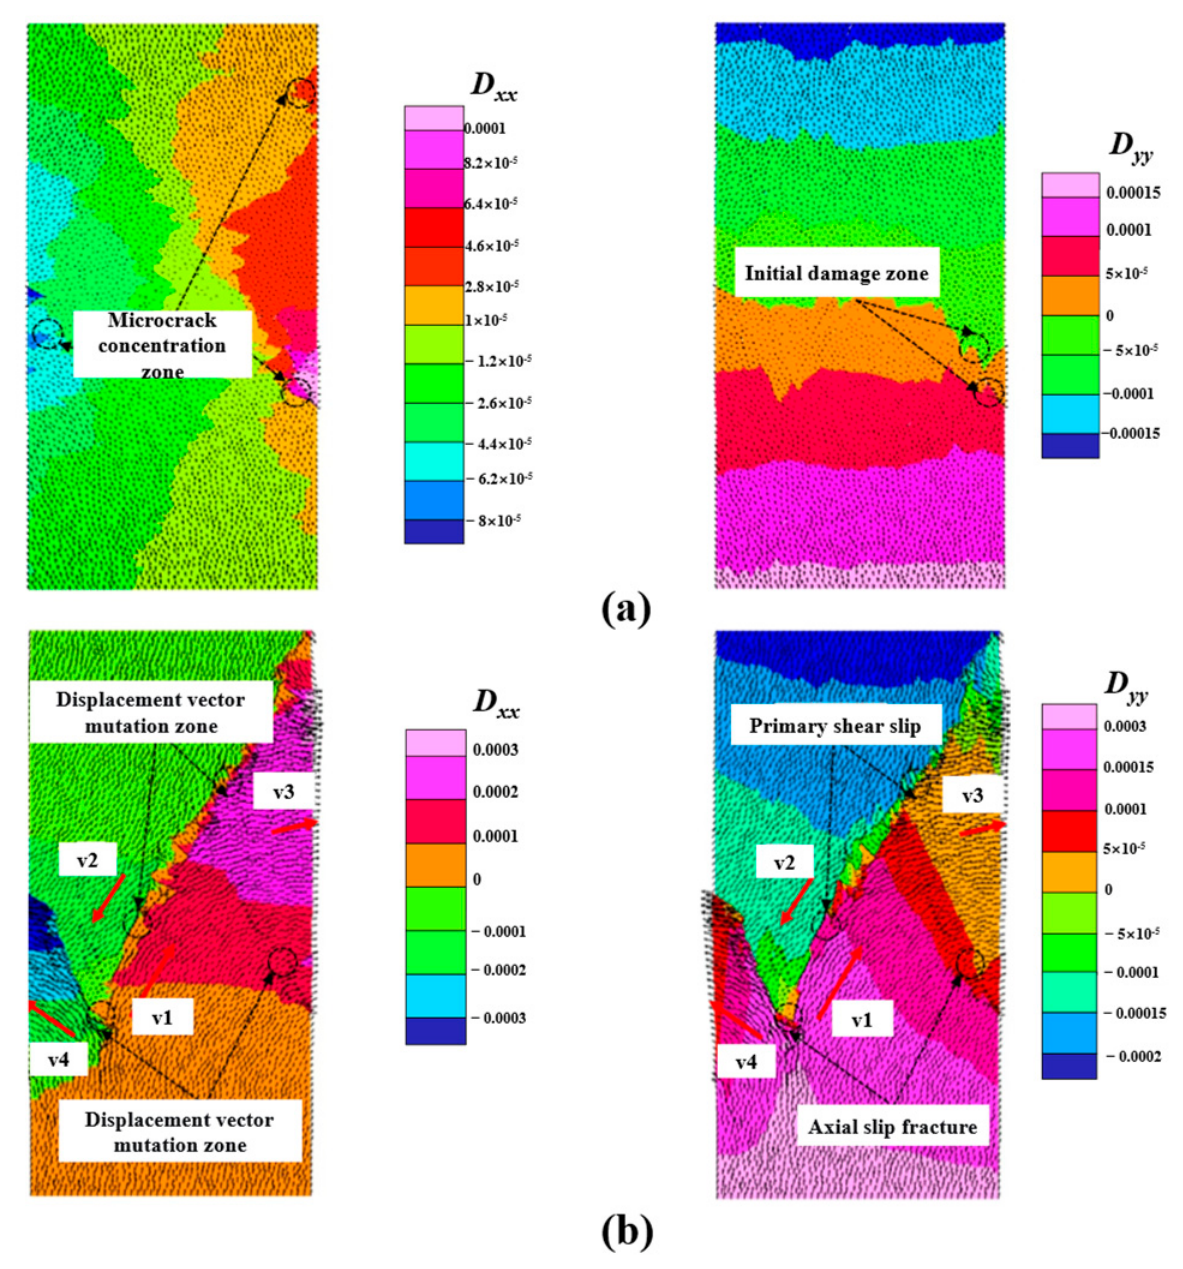
Figure 10 presents the displacement cloud maps and vector diagrams of the mudstone specimen under ambient-temperature triaxial compression. The application of confining pressure fundamentally alters the displacement field distribution pattern. At the peak state (
Figure 10a), the horizontal displacement exhibits distinct zoning characteristics, with microcrack-concentrated areas developing along the diagonal direction, indicating the formation of a shear band. The opposite directions of the displacement vectors indicate the onset of shear deformation, which explains the appearance of the yield point on the experimental curve, i.e., the material had already undergone irrecoverable plastic deformation before reaching the peak strength. At the failure state (
Figure 10b), the vector mutation zones clearly delineate the geometric morphology of the shear band, with vectors v
1 and v
2 pointing in opposite directions to v
3 and v
4, respectively. The displacement gradient is extremely large within the band while remaining relatively intact outside the band, and the highly localized deformation is consistent with the single oblique failure plane observed in the experiment. The vertical displacement field exhibits sliding characteristics at the shear band, with significant vertical offset, and the maximum displacement difference reaches 0.0003, reflecting the cumulative effect of shear slip.
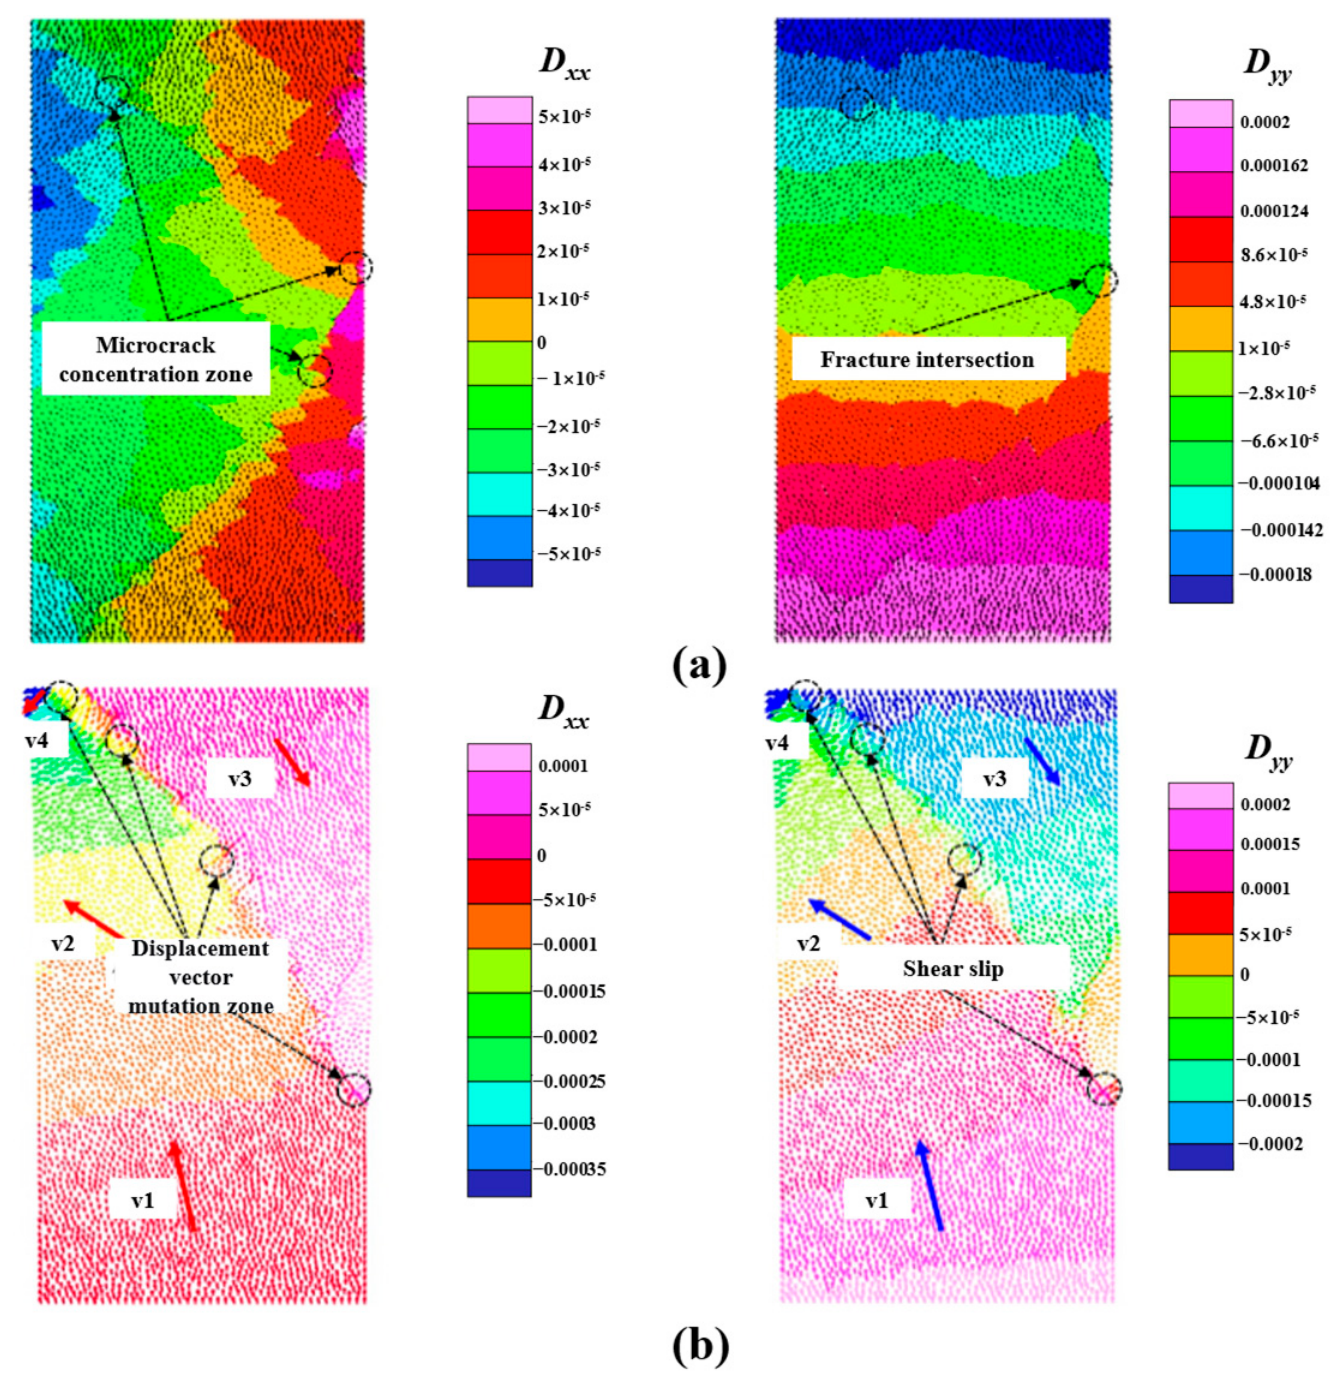
Figure 11 presents the displacement cloud maps and vector diagrams of the mudstone specimen under high-temperature triaxial compression. High temperature significantly alters the evolution process of the displacement field. At the peak state (
Figure 11a), the displacement field in the microcrack-concentrated areas exhibits diffuse characteristics, in contrast to the concentrated distribution observed under ambient-temperature conditions. The displacement vectors indicate the simultaneous development of multidirectional deformation, suggesting that high temperature promotes the activation of multiple failure mechanisms, corresponding to the post-yield shift observed in the experiments, i.e., the material maintains its load-bearing capacity over a larger strain range. At the failure state (
Figure 11b), the extent of the vector mutation zones expands, forming a widened shear band with the superposition of two movement modes: “principal shear slip” and “axial shear slip”. Vectors v
1–v
4 indicate that the main shear band is dominated by shear slip, while the areas outside the band exhibit squeezing-flow characteristics, explaining the prolonged plastic flow and the rapid post-peak drop observed in the experiments.
Comparing the displacement field evolution under the three loading conditions, the lateral dilation and tensile failure under uniaxial compression reflect free deformation under unconfined conditions; the formation of shear bands under triaxial compression demonstrates the controlling effect of confining pressure on the deformation mode; and the diffuse-to-localized transition under high-temperature conditions reveals the influence of temperature on the internal structure and deformation mechanisms of the material. The displacement field evolution is closely related to the initiation, propagation, and coalescence of microcracks, with displacement-concentrated areas corresponding to the key locations of damage accumulation. This analytical approach provides a quantitative mesoscopic interpretation for understanding the deformation and failure mechanisms of mudstone under complex stress–temperature conditions.
3.4.3. Acoustic Emission (AE) Event Response
In the FDEM model, an analog acoustic-emission (AE) event is registered whenever a cohesive element ruptures, with its magnitude scaled by the released kinetic energy. It should be noted that all acoustic emission (AE) characteristics analyzed in this section are derived from post-processing of the FDEM numerical simulations, rather than from experimental measurements. In this study, AE events are defined as the release of elastic strain energy when elements undergo brittle failure in the numerical model, thereby simulating the acoustic emission response during the rock fracturing process.
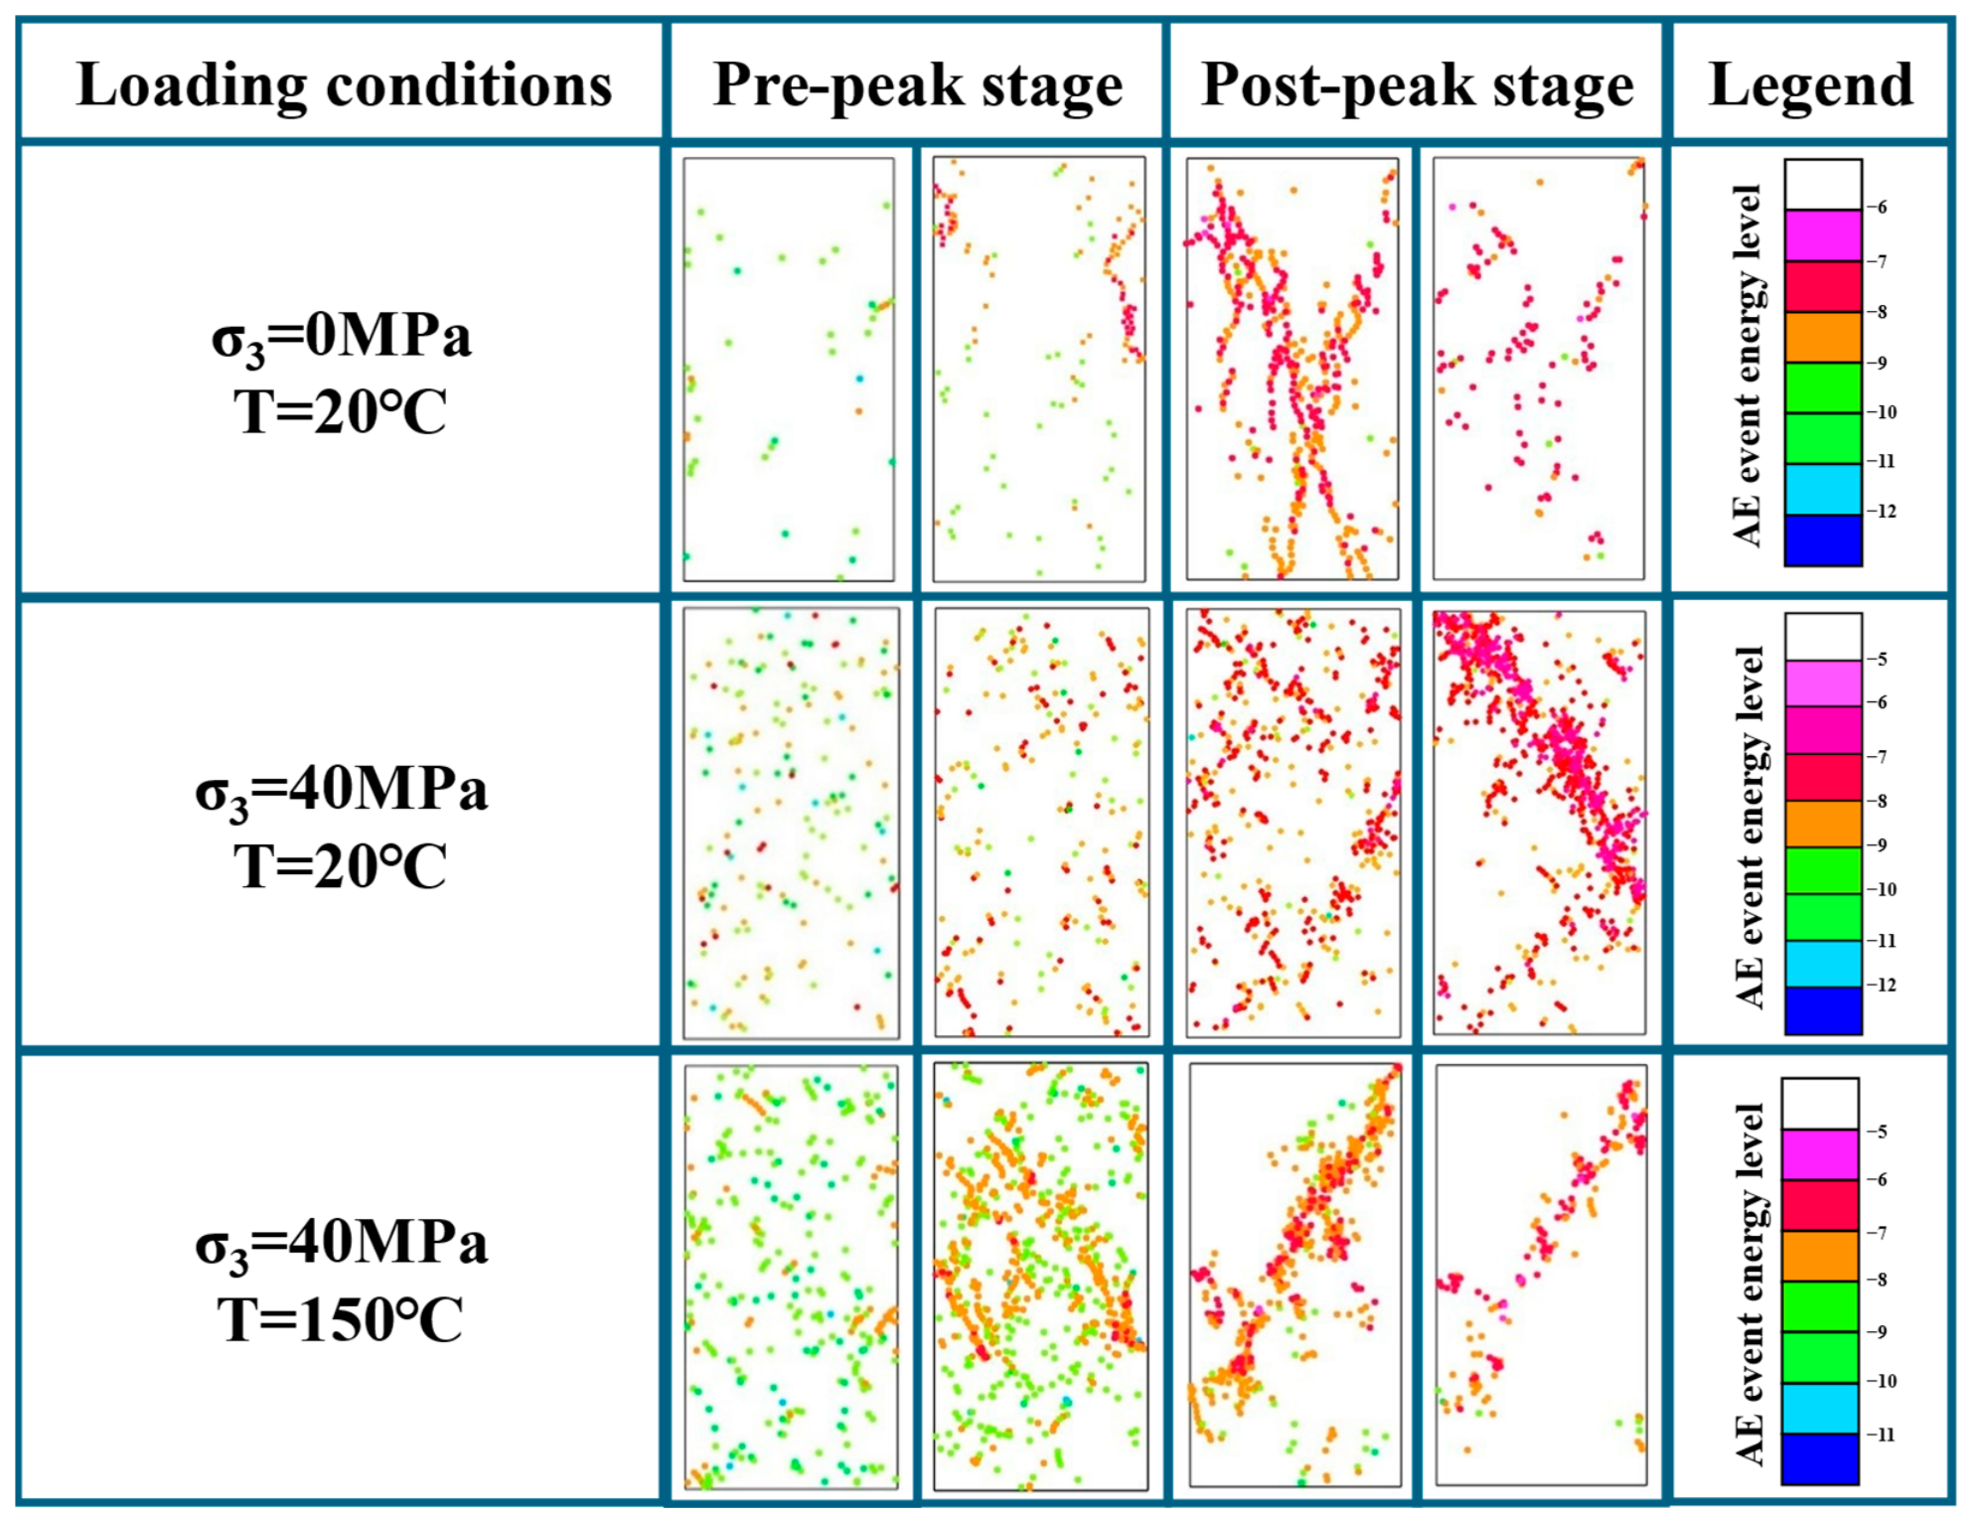
Figure 12 summarizes the AE event evolution characteristics of mudstone specimens at various stages under different loading conditions. Under uniaxial compression, AE events are sparse at the early stage, with energy levels concentrated in the range of −12 to −10, corresponding to particle adjustment and microcrack closure; events increase before the peak, with energy levels rising to −10 to −8, reflecting microcrack initiation; after the peak, events become highly concentrated with longitudinal band-like distributions, and high-energy events (−7 to −5) significantly increase, corresponding to macroscopic crack propagation and coalescence. Under ambient-temperature triaxial compression, the confining pressure makes the early-stage AE events more active (−11 to −9); before the peak, events show localized clustering, indicating shear band incubation; after the peak, an oblique concentrated band is formed with energy levels rising to −7 to −5, reflecting the energy release of shear slip. Under HTHP conditions, a relatively large number of medium-energy events (−10 to −8) appear at the early stage with diffuse distribution; before the peak, event density increases, forming multiple localized concentrations; after the peak, although still exhibiting a shear band pattern, the band width increases and events occur both inside and outside the band, indicating that high temperature promotes the diffusion of damage.
Longitudinal comparison shows that under uniaxial compression, AE activity is concentrated in the post-peak stage with a sudden-release characteristic; under triaxial compression, events occur continuously with a progressive characteristic; under high-temperature conditions, activity is active from the early stage, reflecting the promoting effect of temperature on damage. In terms of spatial distribution, uniaxial compression forms multiple longitudinal concentrated bands, triaxial compression forms a single oblique concentrated band, and under HTHP conditions, the shear band widens and becomes diffuse. The energy level evolution exhibits a transition from low to high, but under uniaxial compression, the jump is concentrated in the post-peak stage; under triaxial compression, it is a progressive increase; under HTHP conditions, the energy level range is relatively broad at all stages, indicating that multiscale failure mechanisms are simultaneously active.
AE events are essentially the process of elastic strain energy release. Under uniaxial compression, energy is released suddenly through tensile cracking, with high-energy events concentrated after the peak. However, owing to the high plasticity of mudstone, load-bearing capacity can still be maintained through plastic flow. Under triaxial compression, the confining pressure changes the energy release mode: low-energy continuous release occurs at the early stage, and after gradual accumulation along the potential shear plane, energy is released in a concentrated manner, forming a yield plateau and ductile failure. High temperature influences the process from two aspects: on one hand, it reduces the strength and stiffness of the material, diminishing its energy storage capacity; on the other hand, the thermal activation effect promotes microscopic damage, with energy dispersedly released through a larger number of small-scale events, leading to early-stage activity and spatial diffuseness, macroscopically manifested as reduced peak strength and prolonged plastic flow.
3.5. Quantitative Comparison Between the Model and the Experiments
The agreement between simulation and experiment is assessed through four groups of indicators, namely the stress–strain response, the energy absorbed before the peak, the crack orientation distribution, and the macroscopic failure geometry. The first two are obtained from the curves used to calibrate the model, so they measure how well the calibration was achieved. The last two did not enter the calibration and are independent checks. The results are summarized in
Table 5, which keeps the two groups apart.
For the stress–strain response, three loading conditions were compared point by point over the common axial strain interval of each test. Under uniaxial compression the root mean square error is 1.73 MPa, the normalized root mean square error is 9.9%, and the coefficient of determination is 0.894, as shown in
Figure 2. The peak strength error is only 2.05%, but the simulated peak strain of 1.13% exceeds the measured value of 0.79%. This offset arises because the triangular finite elements deform linearly before fracture, so the model cannot reproduce the initial compaction stage of natural rock. The pre-peak fit is therefore the weakest part of the comparison, and it is reported here rather than omitted. Under triaxial compression the agreement is much closer, as shown in
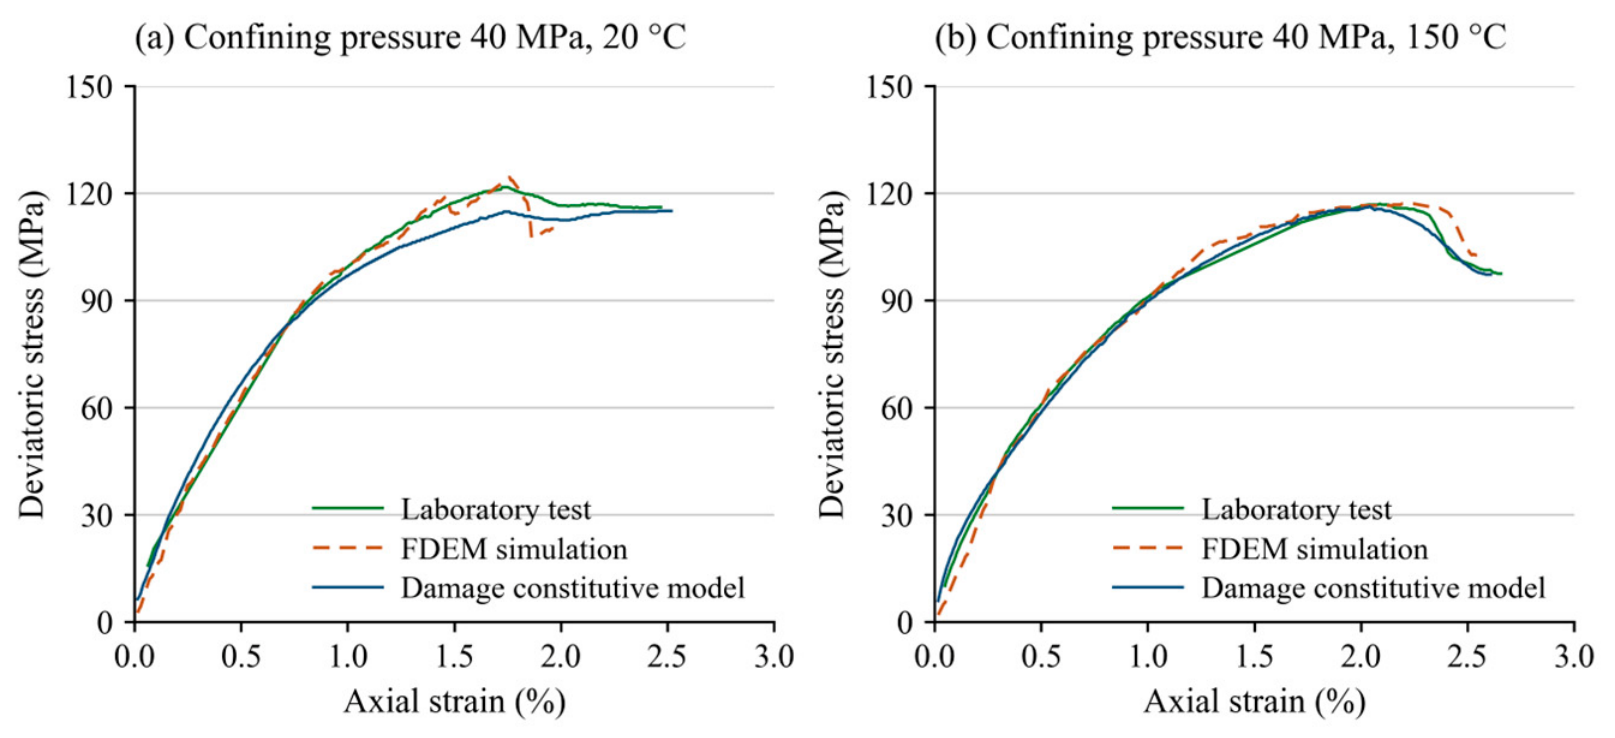
Figure 13. At 40 MPa and 20 °C the root mean square error is 3.00 MPa, the normalized root mean square error is 2.8% and the coefficient of determination is 0.991. At 40 MPa and 150 °C the corresponding values are 3.28 MPa, 3.1%, and 0.986. Peak strength errors are 2.2% and 0.3%. These two triaxial curves were themselves calibration targets. The ultimate strength under confining pressure was used to fix
m2, and the damage parameters
M and
Fo were fitted to the same curves. A close fit is expected for this reason. It shows that the calibration converged, and it is not by itself evidence of predictive capability.
The energy check uses the work per unit volume accumulated up to the peak, obtained by integrating the stress over the axial strain. At 40 MPa and 20 °C the measured value is 1.41 MJ·m−3 and the simulated value is 1.45 MJ·m−3, a difference of 3.1%. At 150 °C the values are 1.72 MJ·m−3 and 1.85 MJ·m−3, a difference of 7.7%. The model therefore reproduces not only the peak stress but also the energy stored before failure.
The crack orientation distribution was extracted from the simulated crack maps and weighted by crack length. Under uniaxial compression, tensile cracks account for about 75% of the total crack length and the crack population concentrates at 74°, close to the loading axis. Under both triaxial conditions, shear cracks account for more than 98% of the total crack length. The simulated band inclination is 55° at 20 °C and 59° at 150 °C. The transition from a tensile, axis-parallel crack population to an inclined shear band is thus captured quantitatively rather than described qualitatively.
The macroscopic failure geometry was compared against two independent references. The failure surfaces traced on the tested specimens are inclined at about 71° at 20 °C and about 59° at 150 °C. These are apparent angles read on the curved lateral surface, so an uncertainty of several degrees should be allowed. The second reference is the Mohr–Coulomb criterion. Fitting the uniaxial strength of 19.5 MPa and the triaxial strength of 121.8 MPa at 40 MPa confining pressure gives an internal friction angle of 26.0° and a cohesion of 6.10 MPa, which predicts a failure plane at 58.0°. The same procedure applied to the 150 °C result gives 24.6° and 6.25 MPa, and a predicted plane at 57.3°. The simulated band inclination differs from the criterion by 3.0° at 20 °C and by 1.7° at 150 °C. The measured angle differs by 1.7° at 150 °C. At 20 °C the measured value of 71° differs by 13.0° and is the outlier of the four. It is an apparent angle read on the curved lateral surface, where a shear plane is foreshortened and reads steeper than its true inclination. The mean of the four angles is 61° against a mean prediction of 57.7°. Agreement between the numerical model, the tested specimens, and a classical strength criterion is therefore obtained on a quantity that was not used in the calibration.
Two limits of this validation should be stated. The comparison rests on one test per loading condition, so the errors reported here describe the agreement for these specimens and not the variability of the formation. The failure-plane angles read from photographs are apparent values. Independent support for the numerical framework comes from our earlier work on ultra-deep dolomite, in which the same FDEM implementation and the same dual Weibull discretization scheme were validated against triaxial tests at six confining pressures from 0 to 220 MPa, with the peak strength error within 3% and a coefficient of determination of 0.9989. A blind test of the same framework has also been reported. The Weibull and cohesive parameters were calibrated on two confining pressures, and the mechanical response at three higher confining pressures up to 220 MPa was then predicted without further adjustment. The mean absolute errors were 1.98% for peak strength, 2.36% for elastic modulus, and 1.78% for peak strain, and the errors of the predicted cases were of the same magnitude as those of the calibrated cases [
36]. Evidence for the predictive capability of the framework is therefore available from a data set independent of the present one.
A distinction should be drawn between the quantities used to calibrate the model and those that were not. The Weibull parameters were calibrated against the uniaxial strength and modulus, against the post-peak shape of the curve and against the ultimate strength under triaxial compression. The temperature-dependent damage parameters were fitted to the two triaxial curves. The agreement obtained for all of these quantities measures how well the calibration was achieved. The macroscopic Poisson’s ratio, the crack type proportions under confining pressure, the failure plane angles, and the displacement localization were not used in the calibration. Their agreement with the experiments, and in the case of the failure plane angles with the Mohr–Coulomb criterion, is therefore an independent test. It is on this second group that the predictive capability of the framework rests.
Table 5 separates the two groups.
3.6. Statistical Treatment and Measurement Uncertainty
Three of the measurement sets in this study are replicated and are therefore treated statistically. Mineral composition was determined on three samples, nanoindentation was carried out on three specimens, and EDS mapping covered seven fields of view.
Table 9 lists the mean, the standard deviation, the coefficient of variation, and the 95% confidence interval for each of these quantities. The clay mineral content is the most stable quantity, with a coefficient of variation of 1.9% across the three samples. The indentation modulus varies by 14.0% and the indentation hardness by 35.7%, so the mechanical properties are far more variable than the mineral composition over the same interval.
The uniaxial and triaxial compression tests were run once per loading condition. No standard deviation, confidence interval, or significance test can be obtained from a single measurement, and none is reported. The measurement uncertainty of these tests was instead evaluated as a Type B budget following the GUM. The axial force is measured to 0.25% and the specimen diameter is machined to 0.05 mm, which combine to an expanded stress uncertainty of 0.54% at a coverage factor of two. Adding the displacement resolution of 0.001 mm gives an expanded modulus uncertainty of about 0.6%.
Table 8 lists the budget. Instrument uncertainty is therefore one to two orders of magnitude smaller than the specimen-to-specimen variability, which confirms that the limiting factor is the number of specimens and not the accuracy of the equipment.
The consequence for the reported effects was quantified using the coefficient of variation of 14.0% as an estimate of material variability. The increase in strength from 19.5 MPa to 121.8 MPa produced by 40 MPa of confining pressure corresponds to an effect size of 37.6, so a single pair of specimens is sufficient to establish it. The reduction in Poisson’s ratio at 150 °C corresponds to an effect size of 3.4 and the reduction in elastic modulus to 0.91. The reduction in peak strength at 150 °C is only 4.2% and corresponds to an effect size of 0.30. About 175 specimens per condition would be needed to establish it at a significance level of 0.05 and a power of 0.8. The thermal reduction in peak strength is therefore treated throughout this paper as indicative rather than as a statistically established result, whereas the effect of confining pressure is robust to any plausible level of specimen variability.
3.7. Sensitivity, Convergence, and the Limits of a Composition to Property Regression
A regression between mineral composition and mechanical properties cannot be established from three specimens, and the available data indicate that such a regression would not be meaningful. Voigt and Reuss bounds were computed from the measured mineral fractions and the mineral moduli listed in
Table 2. The Voigt–Reuss–Hill average is 49.09 GPa for specimen 1, 49.13 GPa for specimen 2, and 49.37 GPa for specimen 3, a total spread of 0.27 GPa or 0.6%. The measured indentation moduli are 51.7, 58.2, and 43.9 GPa, a spread of 14.3 GPa or 27.9%. Mineral composition therefore accounts for less than 0.1% of the observed variance. The ranking is also reversed. Specimen 3 has the highest quartz content and the highest predicted modulus, yet the lowest measured modulus, and the correlation between predicted and measured values is negative at −0.81. The specimen-scale stiffness of this mudstone is thus controlled by microcracks and pore structure rather than by mineral proportions, which is consistent with the loose fabric inferred for specimen 3 in
Section 3.2.
No sensitivity scan and no mesh convergence study were carried out on the mudstone model presented here. Both were established in our earlier work on an ultra-deep dolomite, using the same FDEM implementation and the same dual Weibull discretization scheme [
47]. The results quoted below are therefore properties of the numerical implementation rather than of the present model, and they are reported as support for the parameter choices. A six-by-six scan of m
1 and m
2 showed that m
1 governs the elastic modulus almost independently of m
2, that m
2 governs the pre-peak nonlinearity, the acoustic emission onset and the failure mode, and that the influence of both parameters saturates once m exceeds about four. That threshold coincides with the zero-skewness point of the two-parameter Weibull distribution, so it has a statistical rather than an empirical basis. The values adopted here, m
1 = 2 and m
2 = 2.5, lie below the threshold, which is the regime in which the macroscopic response is genuinely controlled by mesoscale heterogeneity. The same work found the macroscopic response to converge for a mesh size not exceeding 1.2 mm, with relative variations below 5%. The characteristic mesh size of 0.6 mm used here, corresponding to 9660 solid elements, is finer than that threshold by a factor of two and therefore lies inside the converged range. A second study of the same implementation quantifies the contrast between the two parameters. Reducing m
2 from 2.0 to 1.5 lowers the peak strength by 28%, whereas a change of the same magnitude in m
1 alters it by 8% and acts mainly on the initial slope and the peak strain. A global sensitivity analysis carried out on that data set ranks m
2 first and m
1 second among fourteen mesoscale parameters, ahead of cohesion, Young’s modulus, and internal friction angle [
36]. The two heterogeneity parameters are therefore the dominant inputs of the model, and this is the basis for calibrating them separately and in sequence in
Section 2.3.
The uncertainty budget and the effect sizes are given in
Table 8, and the error metrics for the numerical validation are given in
Table 5. The reporting format follows recent studies that combine microstructural characterization with quantitative sensitivity and validation analysis [
38,
39].
4. Discussion
- (1)
The mineral assemblage sets the deformation style at the grain scale. Illite dominates the clay fraction, and its layered structure provides weak planes that slip before any brittle phase fails. For a rock containing about one third quartz, the indentation hardness of 1.42 to 2.96 GPa is low. This indicates that the load path at the micrometer scale runs through the clay matrix rather than through the quartz grains. The result is consistent with
Section 3.7, where mineral composition accounts for less than 0.1% of the variance in the measured modulus while the microcrack and pore network accounts for the remainder. Composition therefore governs the deformation mechanism, and fabric governs the stiffness.
- (2)
The compressive strength and failure mode of the mudstone are strongly dependent on confining pressure and temperature. Increasing confining pressure from 0 to 40 MPa at ambient temperature increases the peak strength from 19.5 MPa to 121.8 MPa and transforms the failure mode from axial splitting to shear-dominated failure. At 150 °C and 40 MPa confining pressure, the peak strength decreases to 116.7 MPa, the yield point is delayed, and the post-peak decline accelerates. Pressure strengthening is established by the present data, with an effect size of 37.6. Thermal weakening is indicated rather than established, because the 4.2% reduction in peak strength corresponds to an effect size of only 0.30. The two act as competing mechanisms, and only the first is quantified here.
- (3)
The FDEM model incorporating mineral spatial heterogeneity through the Weibull distribution successfully reproduces the macroscopic stress–strain response under uniaxial compression, with errors of −2.05% for peak strength and 0.50% for elastic modulus relative to experimental data. The simulated response was compared with the laboratory results on four groups of indicators, as listed in
Table 5. The curve and energy metrics that follow derive from the data used in the calibration and therefore measure the quality of the fit. The normalized root mean square error of the deviatoric stress curve is 2.8% at 40 MPa and 20 °C and 3.1% at 40 MPa and 150 °C, with coefficients of determination of 0.991 and 0.986. The work accumulated before the peak differs by 3.1% and 7.7% for the two conditions. The simulated crack populations reproduce the measured failure modes, with tensile cracks near the loading axis under uniaxial compression and shear cracks concentrated in an inclined band under confining pressure. The simulated shear-plane angles agree with the Mohr–Coulomb prediction within 3° at both temperatures, and the measured angle agrees within 2° at 150 °C. This agreement supports the validity of the modeling approach and is consistent with mineral-scale heterogeneity being a primary control on mesoscale damage evolution. The second group in
Table 5 did not enter the calibration, and the agreement obtained for it is therefore evidence of predictive capability rather than of fit quality.
- (4)
The displacement field records the same competition in the deformation mode. Without confinement the specimen is free to dilate laterally, so the Poisson effect drives the horizontal displacement outward and tensile separation follows. Confining pressure suppresses lateral dilation. This removes the tensile path and forces the deformation onto an inclined plane of maximum shear, where the displacement gradient becomes large while the material outside the band stays intact. At 150 °C the field is diffuse before the peak and localizes only afterwards. Thermal activation lowers the local strength threshold in a larger number of elements, so damage nucleates in many places at once instead of concentrating early. This is why the yield point is delayed while the post-peak decline is faster.
- (5)
The simulated acoustic emission response is the energy counterpart of the same process. Under uniaxial compression the elastic strain energy is released suddenly through tensile cracking, so high-energy events concentrate after the peak. Confining pressure stores energy along the incipient shear plane and releases it progressively, which produces the yield plateau and the ductile post-peak branch. At 150 °C the reduced stiffness lowers the energy that the specimen can store, and thermal activation disperses the release over a larger number of small events. These signatures are obtained independently of the stress–strain curve, and they support the same interpretation of the damage process.
Triaxial compression tests were conducted once under each of the three conditions, so no standard deviation, confidence interval, or significance test can be derived for the macroscopic parameters. The instrument uncertainty is small, at 0.54% for stress and about 0.6% for modulus, but the specimen-to-specimen variability measured by nanoindentation reaches 14.0% for modulus and 35.7% for hardness. About 175 specimens per condition would be required to establish the 4.2% thermal reduction in peak strength, whereas the effect of confining pressure is established by the present data. The FDEM model adopts a two-dimensional plane strain assumption and does not account for three-dimensional stress states or anisotropic fabric. Mechanical tests were performed only at 20 °C and 150 °C, and the mineralogical evolution of samples after high-temperature exposure was not independently characterized. The findings are based on a single deep mudstone formation in the western South China Sea, and caution should be exercised when generalizing these results to other formations without further validation. The numerical predictions regarding crack evolution, displacement fields, and AE event distributions are model-dependent and should be treated as qualitative or semi-quantitative indications rather than experimentally verified facts, unless independently confirmed by additional experimental evidence.
The deformation and failure mechanisms revealed in this study provide practical implications for drilling operations in deep HTHP mudstone formations. Regarding wellbore stability, the transition from tensile splitting to shear-dominated failure under confining pressure indicates that borehole-wall failure in deep high-stress formations predominantly occurs in shear mode; thus, stability analysis should focus on shear-strength parameters rather than tensile strength alone. The temperature-induced strength reduction and accelerated post-peak softening further suggest that time-dependent thermal effects should be incorporated into stability assessments. In terms of mud-weight window design, the significant pressure-dependent strengthening effect of mudstone necessitates that mud weight determination be calibrated against the actual in situ confining pressure level, while the thermal weakening at elevated temperatures implies a narrower mud weight window for deep HTP formations. Regarding drilling efficiency, tensile splitting failure facilitates rock fragmentation, whereas shear-dominated failure requires higher weight-on-bit, indicating that drilling parameters and bit design should be optimized according to the expected failure mode. The thermal degradation of mechanical properties also highlights the need to account for temperature-induced strength reduction in drilling operations within deep HTP formations, including hole cleaning and tripping speed decisions. These findings provide an experimental and theoretical basis for wellbore stability analysis, mud-weight design, and drilling-parameter optimization in deep HTHP mudstone formations.
5. Future Work
The limitations listed above define six directions for further work.
The first is a larger and repeated test program. The statistical treatment in
Section 3.6 shows what would be required. About 19 specimens per condition would establish the reduction in elastic modulus at 150 °C, and about 175 would be needed for the 4.2% reduction in peak strength. A campaign of at least 20 specimens per condition, taken from adjacent positions in a single cored interval to limit between-specimen variance, would allow one-way analysis of variance to be applied to the modulus and to Poisson’s ratio.
The second is three-dimensional modeling. The present model is two-dimensional and resolves the in-plane mineral topology only. A three-dimensional extension would represent out-of-plane fabric and would also allow the mesh convergence threshold to be re-established, since that threshold is expected to shift with dimensionality [
47]. The obstacle to a three-dimensional extension is computational cost rather than formulation, since the dual Weibull scheme transfers to three dimensions without change. Two routes are open. The first is a solver accelerated on general-purpose graphics hardware. The second is a surrogate model trained on the output of two-dimensional runs, which has been demonstrated for this implementation and which returns a complete stress–strain curve in milliseconds against several hours for a direct simulation [
36].
The third is in situ X-ray computed tomography.
Section 3.7 shows that mineral composition explains less than 0.1% of the variance in the measured modulus, so the specimen-scale stiffness is governed by the microcrack and pore network. Computed tomography during loading would map that network in three dimensions and would supply the geometric input that the present model now assigns statistically.
The fourth is digital image correlation.
Table 5 reports a simulated displacement-localization ratio of 1.75 with no measured counterpart. Full-field surface-strain measurement would provide that counterpart and would allow the width and the onset strain of the localization band to be compared directly.
The fifth is laboratory acoustic emission. All acoustic emission results in this study come from post-processing of the numerical model. Physical sensors mounted inside the triaxial cell would allow the simulated event rate and energy distribution to be validated against measured waveforms.
The sixth is coupled thermo-hydro-mechanical modeling. All tests were run dry, whereas the clay content of 44.67% makes this mudstone strongly water sensitive. Coupling pore fluid and drilling-fluid chemistry to the present framework would extend it to the wellbore conditions that motivate the study. Intermediate temperatures between 20 °C and 150 °C, together with mineralogical characterization after heating, would locate the onset of thermal weakening and identify the reactions responsible for it.