Article

Coordinated Cyber–Physical Attack Strategies in Power Systems Considering Defense Resource Allocation and Emergency Dispatch Responses

1
College of Electrical Engineering, Zhejiang University, Hangzhou 310027, China
2
Electric Power Research Institute of Guangdong Power Grid Co., Ltd., Guangzhou 510050, China
*
Author to whom correspondence should be addressed.
Appl. Sci. 2026, 16(15), 7847; https://doi.org/10.3390/app16157847
Submission received: 14 July 2026 / Revised: 1 August 2026 / Accepted: 4 August 2026 / Published: 6 August 2026
(This article belongs to the Section Electrical, Electronics and Communications Engineering)

Abstract

Deliberate coordinated cyber–physical attacks, which combine cyber intrusions with physical disruptions, pose growing risks to the secure and reliable operation of power systems. To identify highly disruptive coordinated cyber–physical attack strategies under pre-attack defense allocation and post-attack emergency dispatch responses, a tri-level defender–attacker–defender (DAD)-based attack strategy optimization model is proposed. First, based on the association between substation automation control systems and transmission line operation, the mechanism of breaker-tripping attacks (BTAs) through compromised digital relays in substations is investigated. Second, a tri-level DAD model is developed to optimize coordinated BTA and physical line attack strategies while accounting for pre-attack cyber and physical defense, cascading failure propagation, and post-attack emergency dispatch responses. Then, based on duality theory, network flow models, and the column-and-constraint generation (C&CG) algorithm, an iterative solution framework consisting of a defense master problem and an attack-dispatch subproblem is constructed to capture post-attack topology updates, cascading line outages, generator redispatch and load-shedding responses. Finally, the proposed method is validated using the IEEE 39 bus and IEEE 118 bus power systems. Case study results demonstrate that the proposed model identifies the most damaging coordinated cyber–physical attack strategies and that BTA-induced topology changes and cascading failure propagation significantly affect attack target selection. The proposed solution method obtains the accurate optimal objective value while reducing computational time by 92.91% for IEEE 39 bus power system, and it successfully obtains a converged solution for IEEE 118 bus power system.

1. Introduction

In recent years, digital substations, dispatch automation systems, wide-area measurement systems, and communication networks have become increasingly important in supporting the monitoring, protection, and control of power systems. Although these technologies improve system observability and operational flexibility, they also expand the attack surface available to malicious actors. Cybersecurity studies have therefore investigated vulnerability assessment, multilayer protection schemes, cyber–physical testbeds, cross-domain attack paths, the physical impacts of cyber events, and cyber-constrained emergency operation strategies for power systems [1,2]. Even systems satisfying conventional N-1 security criteria may remain vulnerable to coordinated cyber–physical attacks and cascading outages [3,4,5]. Therefore, optimizing coordinated cyber–physical attack strategies while accounting for defense resource allocation and emergency dispatch is important for revealing realistic worst-case threats.
Existing studies have explored various mechanisms through which cyberattacks and physical attacks can jointly disrupt power system operation. A coordinated attack model is proposed in which physical line outages are concealed through cyber-based topology and load data manipulation in [6]. A tri-level physical layer DAD model for evaluating the vulnerability and protection of transmission assets under deliberate physical disruptions is presented in [7]. A defense model considering full substation topology and multiple attack mechanisms is presented, including physical attacks and cyberattacks that induce relay misoperation or maloperation in [8]. A coordinated attack model based on malicious command injection and physical line disconnections is investigated in [9]. A network topology optimization method is proposed to mitigate the impacts of coordinated attacks in [10]. A game-theoretic defense model against sequential cyberattacks on substations is developed in [11]. In [12], cascading failure mechanisms and load redistribution effects are modeled to reveal the propagation of initial outages through power networks. More recently, tri-level defense models have been extended to incorporate cyber–physical interdependence, uncertain attack scenarios, and resilience-oriented defense strategies [13,14,15,16].
Attacker–defender optimization has provided an important analytical basis for identifying vulnerable components and allocating limited defense resources. Early studies formulated power grid protection and vulnerability assessment as bilevel interdiction problems, in which an attacker selects disruptive outages and a system operator minimizes the resulting load shedding through corrective actions [17,18,19]. Building on these studies, tri-level defender–attacker–defender (DAD) models have been developed to determine pre-attack hardening strategies, worst-case attack plans, and post-attack operational responses [20,21,22,23,24,25]. Subsequent research has incorporated multiperiod attack processes, attack resource uncertainty, decomposition algorithms, and column-and-constraint generation methods to improve the modeling capability and computational tractability of DAD problems [26,27,28,29].
Despite these advances, several limitations remain. First, existing coordinated cyber–physical attack models mainly represent cyber effects through false data manipulation, malicious dispatch, relay misoperation or maloperation, or exogenously specified component outages. The control chain from substation cyber compromise to coordinated breaker trips and explicit line and generator state transitions has not been integrated into coordinated attack strategy optimization. Second, existing studies have not jointly characterized how this BTA mechanism interacts with direct physical line attacks, defense resource allocation, overload-driven cascading failure propagation, and post-attack emergency dispatch to reshape the selection of the most damaging attack targets. Third, the integration of binary defense decisions, heterogeneous attack decisions, topology state transitions, and multistage cascading failures substantially increases the computational complexity of the resulting optimization problem, thereby requiring an efficient solution method.
To address these limitations in attack mechanism modeling, defense response representation, and cascading failure analysis, a tri-level DAD-based coordinated cyber–physical attack strategy optimization model is developed. The model optimizes the most damaging combination of BTA and physical transmission line attack targets while explicitly accounting for defense resource allocation, cascading failure propagation, and post-attack emergency dispatch responses. The main contributions are summarized as follows:
  • Based on the association between substation automation control systems and transmission line operation, a BTA mechanism through compromised digital relays is established. The proposed mechanism describes how attackers exploit cyber intrusions to issue malicious breaker-trip commands and induce transmission line outages, thereby converting cyberattack behaviors into explicit physical topology changes and improving the representation of the physical consequences of cyberattacks;
  • A tri-level DAD-based coordinated cyber–physical attack strategy optimization model is developed to characterize the sequential interaction among pre-attack defense deployment, coordinated cyber–physical attacks, cascading failure propagation, and post-attack emergency dispatch. The model integrates upper-level joint cyber- and physical defense, middle-level BTA and physical line attack optimization with cascading failure propagation, and lower-level emergency dispatch responses, thereby enabling the identification of the most damaging coordinated attack strategies, critical attack targets, cascading failure propagation paths, and final load-shedding consequences under limited defense and attack resources;
  • A decomposition-based iterative solution methodology incorporating reformulation of the middle and lower levels, network flow relaxation, duality-based transformation, and C&CG-based cut generation is developed. The original problem is decomposed into a defense master problem and an attack and dispatch subproblem, enabling the iterative optimization of the most damaging coordinated attack strategies and the associated defense responses under limited resources.

2. Cyber-Induced Breaker-Tripping Attack and Topology State Transition Model Under Deliberate Attack Scenarios

In digital substations, protection and control intelligent electronic devices (IEDs), merging units, station-level communication switches, and dispatching systems exchange sampled values, generic object-oriented substation event (GOOSE) messages, and remote control signals to support measurement, protection, and control functions. Although this communication architecture improves the automation and operational efficiency of substations, it also exposes circuit breaker control chains to unauthorized access and malicious command manipulation. Existing studies have demonstrated that cyber intrusions into substation automation systems may compromise protection and control functions, induce false trip signals, and cause the unintended opening of circuit breakers [30,31]. In addition, switching attack studies have shown that an attacker capable of manipulating one or multiple circuit breakers may disrupt system operation, destabilize critical components, or initiate cascading failures [32,33,34]. The systemic risk associated with switching attacks has also been examined from the perspective of substation cybersecurity technologies and residual cyber risk [35].
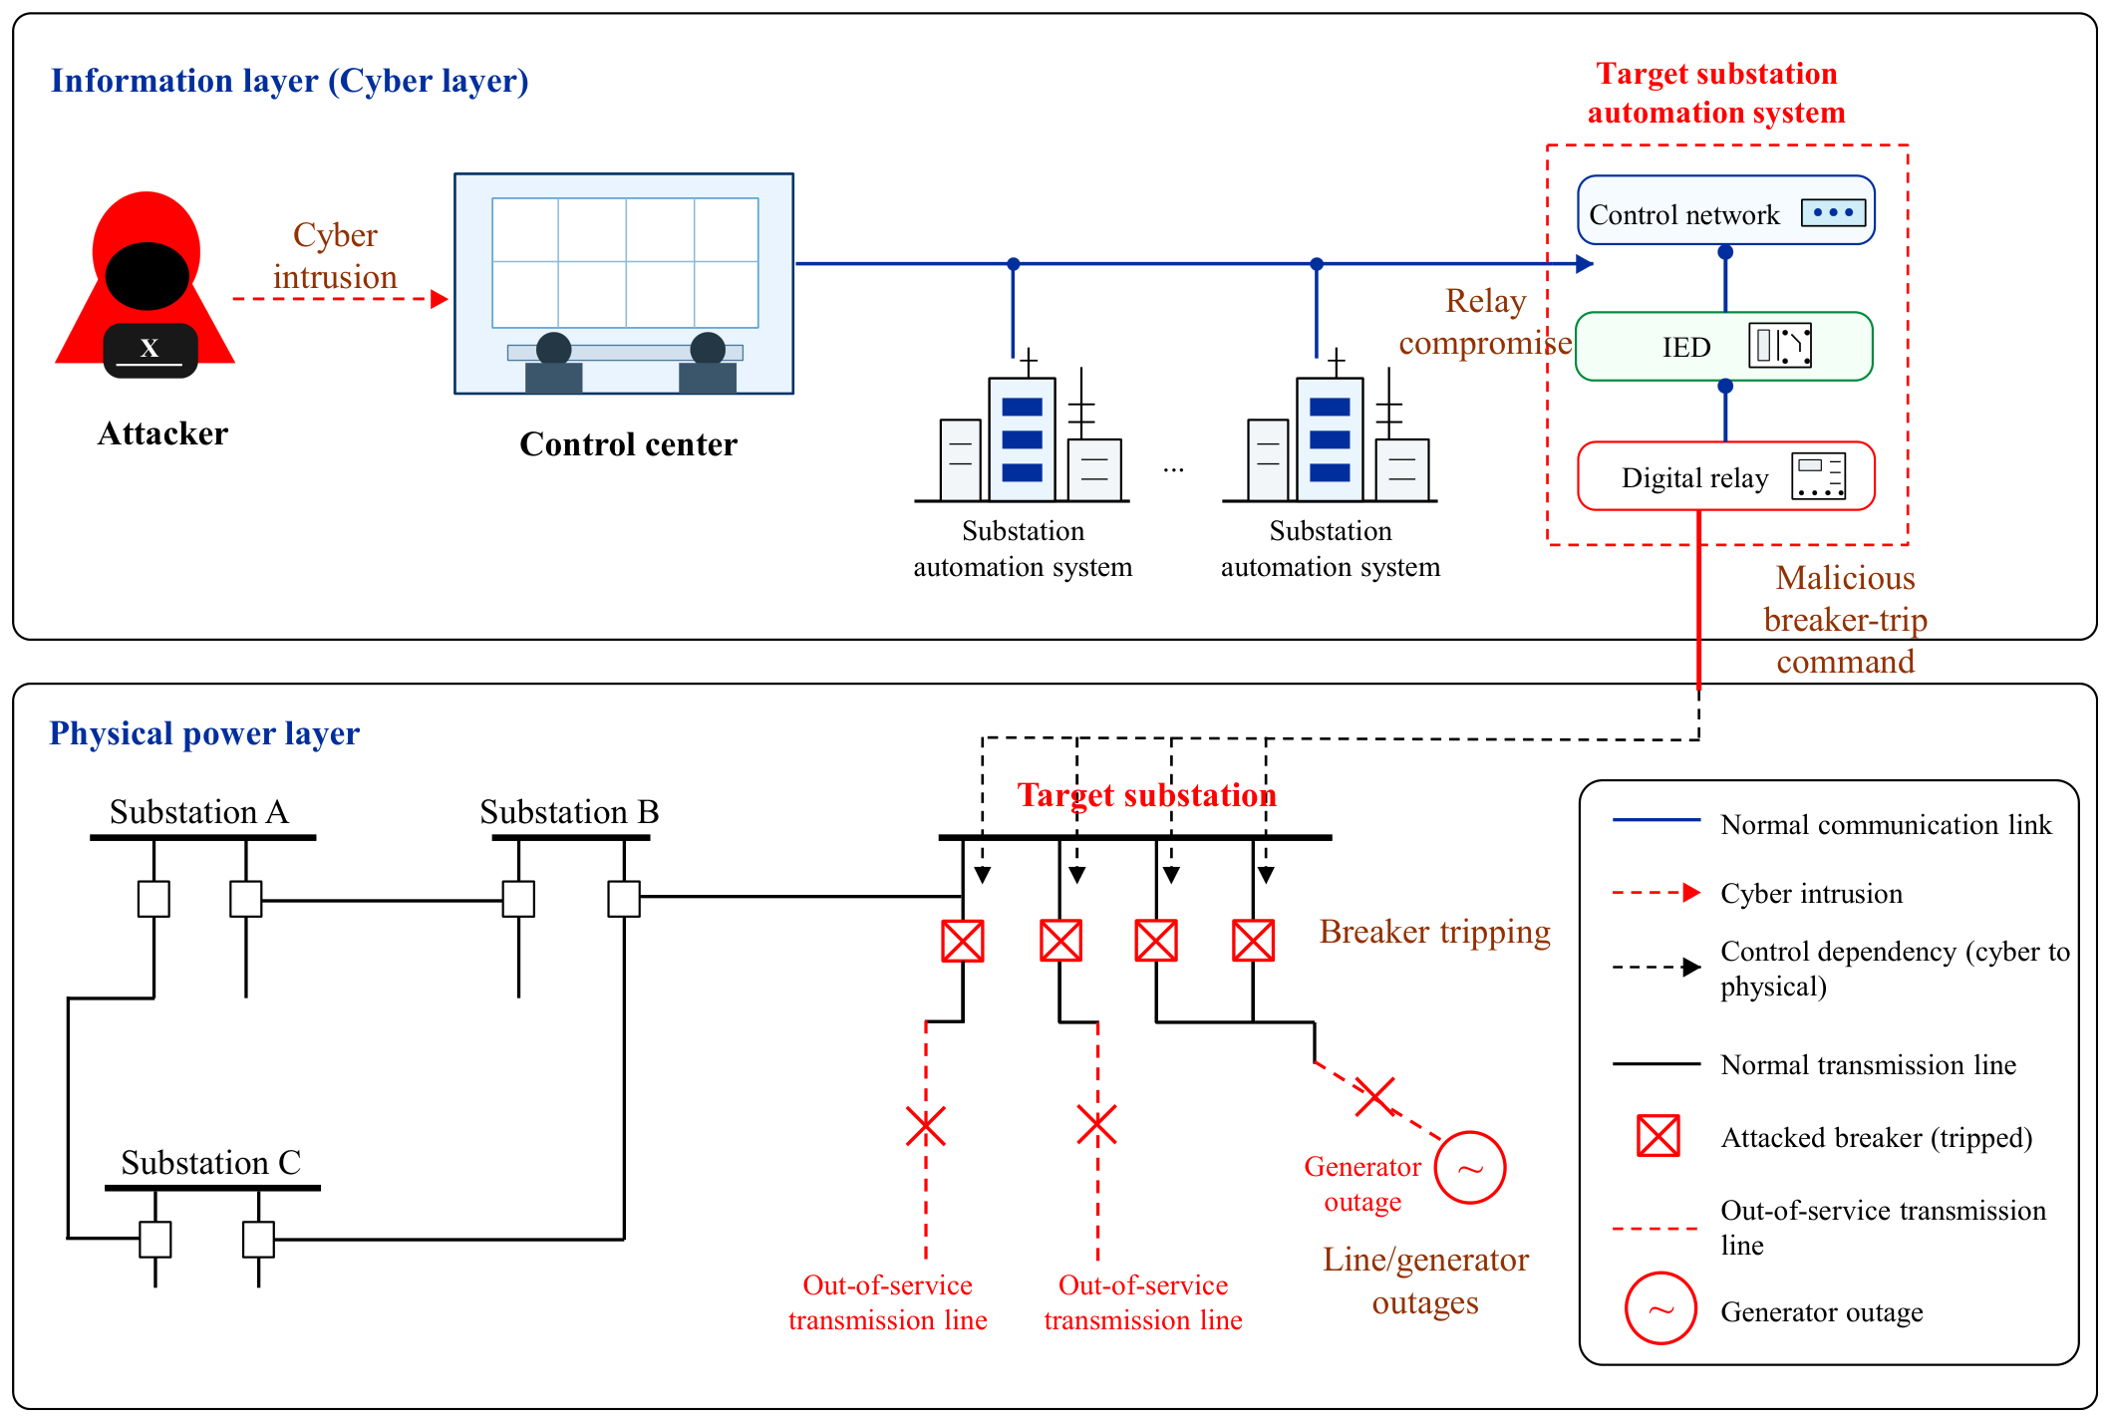
Based on the attack mechanisms reported in [30,31,32,33,34,35], this study considers a deliberate BTA scenario in which the attacker obtains sufficient command authority over the breaker control chain of a selected substation. Existing studies demonstrate that cyber intrusions into substation automation systems can compromise protection and control functions and enable malicious breaker control commands [30,31], while coordinated switching attacks involving multiple circuit breakers can cause transmission line outages and initiate cascading failures [32,33,34,35]. Accordingly, after compromising the control network, IEDs, or digital relays associated with the target breakers, the attacker is assumed to issue coordinated breaker-trip commands. The model focuses on the resulting topology changes and system consequences rather than the preceding cyber intrusion process, which is consistent with the objective of identifying the most damaging coordinated attack strategy under limited attack resources. Therefore, the cyberattack decision is mapped into physical topology changes through BTA-induced line and generator outage states. This mapping provides the cyber-to-physical transition mechanism embedded in the subsequent DAD model. To clarify the relationship between cyber compromise and physical topology changes, Figure 1 depicts the BTA mechanism in which the attacker compromises the substation control chain, issues malicious breaker-trip commands, and consequently causes outages of incident transmission lines and connected generators.
Accordingly, this study defines a breaker-tripping attack (BTA) as a cyberattack in which an attacker compromises the control network, IEDs, or digital relays of a target substation and issues malicious breaker-trip commands. Unlike a generic communication node failure or a cyberattack that only manipulates measurements, a BTA directly alters circuit breaker states and consequently changes the physical topology of the power system. This direct cyber-to-physical effect is particularly important for coordinated attack strategy optimization because the resulting line outages may redistribute power flows, create overloads, and trigger subsequent cascading failures. Once a BTA targeting substation n is successful, the circuit breakers associated with transmission lines connected to that substation trip in a coordinated manner. Specifically, if either terminal substation of a transmission line is successfully attacked, the line is assumed to be out of service, as expressed in (1). Likewise, a generator connected to the attacked substation is assumed to be out of service, as expressed in (2).
w l = 0 n E ( l ) v n = 0 1 else ,       l
w g = 0 v C ( g ) = 0 1 else ,       g
where w l is a binary variable denoting the operating status of transmission line l, which may change as a result of the outage of connected substations; w l = 1 indicates that line l is in normal operation, whereas w l = 0 indicates that it is disconnected. E(l) denotes the set of substations connected to transmission line l. v n is a binary variable indicating whether substation n is targeted by a BTA; v n = 1 indicates that substation n is not attacked, whereas v n = 0 indicates that it is attacked. w g is a binary variable denoting the operating status of generator g, which may change due to the outage of connected substations; w g = 1 indicates normal operation, whereas w g = 0 indicates that the generator is out of service. C(g) denotes the substation connected to generator g. (1) and (2) describe the cyber-induced physical consequence of a BTA. Unlike a direct physical line attack, a BTA first compromises the substation control chain and then changes the operating states of the modeled transmission lines and generators controlled through the target substation by issuing coordinated breaker-trip commands. Thus, v n represents the cyberattack decision, whereas w l and w g represent the physical operating consequences induced by the cyber intrusion. These cyber-induced topology state variables are further coupled with direct physical line attacks in the middle-level attack model.

3. A Tri-Level DAD-Based Model for Coordinated Cyber–Physical Attack Strategy Optimization

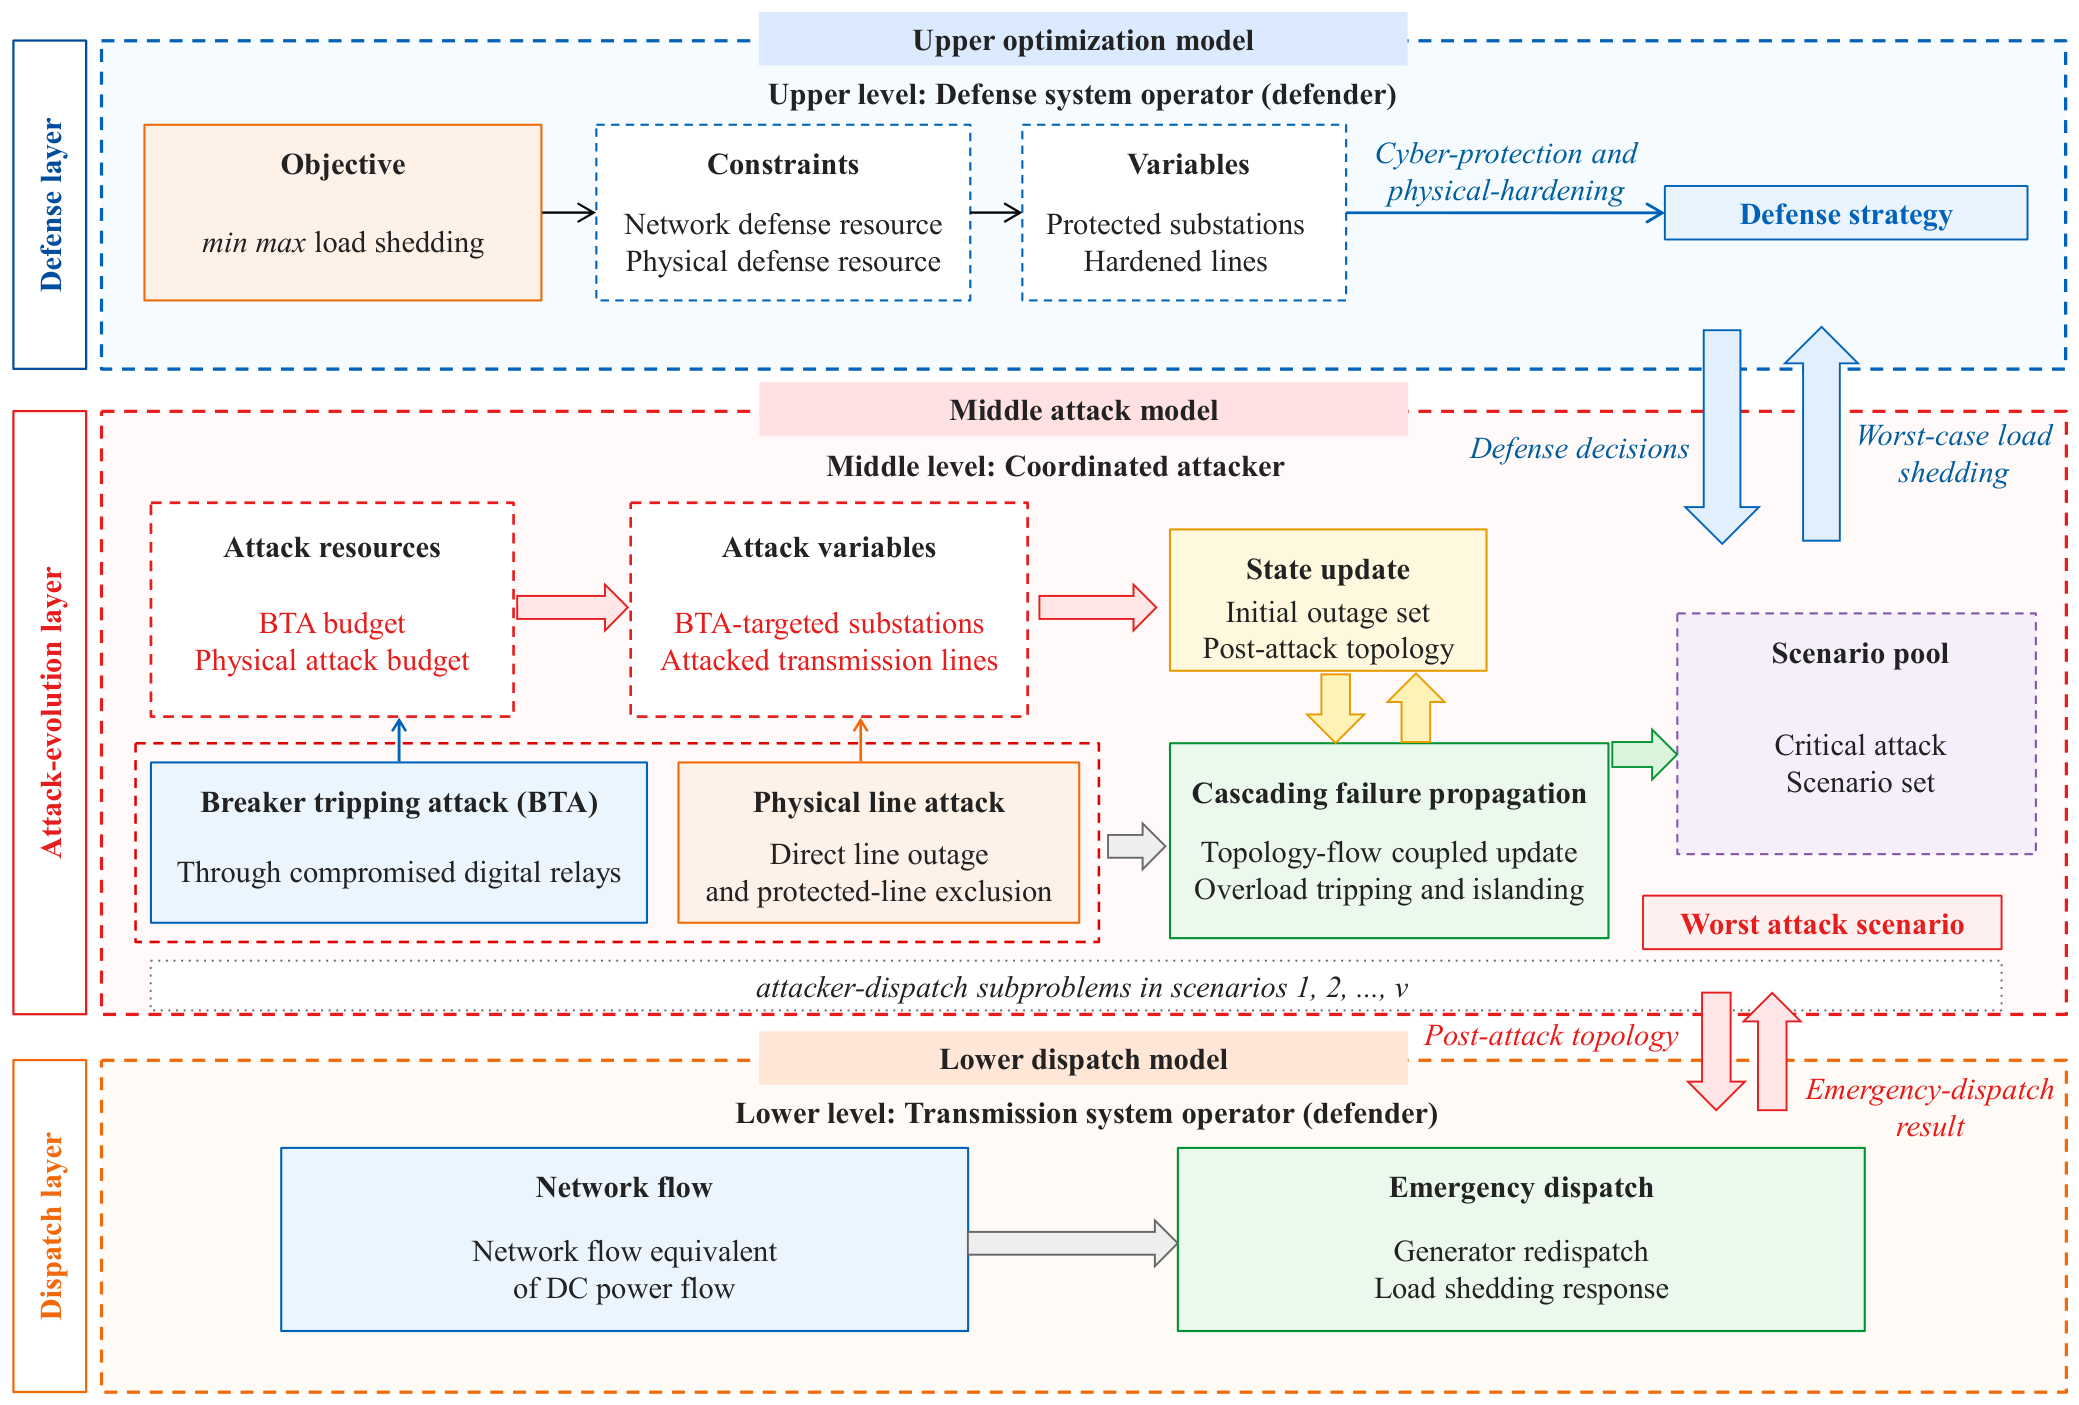
Following the sequential decision-making process of pre-attack defense, coordinated attack implementation, and post-attack emergency dispatch, a tri-level DAD model is established to optimize the most damaging coordinated cyber–physical attack strategies, as illustrated in Figure 2. The model follows a deterministic sequential decision-making process. The upper-level defender first determines the cyber- and physical-defense configuration. The middle-level attacker then selects the most damaging coordinated attack strategy after observing the defense configuration and anticipating the optimal emergency dispatch response. The attacker does not determine the emergency dispatch decisions; these decisions are independently optimized by the lower-level dispatch center to minimize load shedding. At the upper level, the defender allocates two types of preventive resources before an attack occurs: cyber protection for substation automation control systems and physical hardening for transmission lines. These defense resources are assumed to be available but not yet deployed; their deployment locations are determined by the upper-level defender before the attack, after which the middle-level attacker optimizes its attack strategy with full knowledge of the resulting defense configuration. At the middle level, the attacker selects two heterogeneous attack actions: BTAs against substations and direct physical attacks against transmission lines. The BTA decisions first determine the cyber-induced availability of incident transmission lines and connected generators through (1) and (2), and are then combined with direct physical line attacks to form the initial post-attack topology. Cascading failure propagation further updates the line, generator, and load states before the lower-level emergency dispatch is performed. At the lower level, the dispatch center performs emergency dispatch under the damaged network topology to mitigate load shedding. The three levels are coupled through transmission line status variables and load-shedding outcomes: upper-level defense decisions modify the feasible attack set at the middle level; middle-level attacks and cascading failures alter the network available to the lower level; and the optimal load shedding determined at the lower level, in turn, defines the attack payoff at the middle level and the defense evaluation at the upper level. Thus, although emergency dispatch is implemented after the coordinated attack and cascading failure propagation, its optimal response is considered in the middle-level attack strategy optimization through the tri-level DAD model. The attacker therefore selects its targets according to the final load shedding after the dispatch center performs optimal generator redispatch and load shedding.

3.1. Upper-Level Defense Model with Joint Cyber- and Physical-Defense Resource Allocation

Before an attack occurs, the objective of the upper-level defender is to preselect substation control chains for cyber protection and transmission lines for physical hardening under limited defense budgets, thereby minimizing the load shedding caused by deliberate attacks, as formulated in (3):
min s n , s l d = 1 N d Δ P d D
where s n is a binary variable indicating whether the automation control system of substation n receives cyber protection; s n = 1 indicates that substation n is protected, and s n = 0 otherwise. s l is a binary variable indicating whether transmission line l is physically hardened; s l = 1 indicates that line l is hardened, and s l = 0 otherwise. N d denotes the number of load buses in the system. Δ P d D denotes the load shedding at load bus d, where refers to the lower-level emergency dispatch stage and Δ P d D denotes the optimal value obtained from the lower-level objective function.
Cyber- and physical-defense resources are separately limited. Accordingly, the defender determines which substation automation control systems to provide with cyber protection and which critical transmission lines to physically harden, subject to the corresponding resource budgets in (4) and (5):
n s n S c y b
l s l S p h y
where S c y b denotes the available cyber-defense resources, representing the maximum number of substations that can be protected. S p h y denotes the available physical-defense resources, representing the maximum number of transmission lines that can be hardened.

3.2. Middle-Level Coordinated Attack Strategy Optimization Model Considering Cascading Failures

The middle level represents the attacker, whose objective is to maximize the total load shedding in the power system, as expressed in (6):
max v n , v l d = 1 N d Δ P d D
where v l is a binary variable indicating whether transmission line l is subjected to a physical attack, with 1 and 0 representing that the line is not attacked and attacked, respectively.
At the initial failure stage, the attacker makes two types of coordinated attack decisions. The cyber decision is to compromise substation automation control systems and launch BTAs, while the physical decision is to directly attack transmission lines. Constraint (7) limits the number of substations selected for BTAs, and constraint (8) excludes substations with cyber protection from the feasible BTA target set. Constraint (9) limits the number of transmission lines selected for physical attacks, and constraint (10) excludes physically hardened lines from the feasible physical attack target set. In this way, cyber-defense and physical-defense constrain different attack channels, while their effects are jointly reflected in the post-attack topology.
n = 1 N n ( 1 v n ) N
v n s n , n
l = 1 N l ( 1 v l ) L
v l s l , l
where N n and N l denote the numbers of substations and transmission lines in the system, respectively.
After the BTA and physical attack decisions are determined, the initial outage state is obtained by combining cyber-induced outages and direct physical outages. If a substation is successfully targeted by a BTA, the transmission lines and generators connected to that substation are removed from service according to (1) and (2). Meanwhile, transmission lines subjected to direct physical attacks are also removed from service. Therefore, the initial operating states of transmission lines and generators are given by (11) and (12):
o l , 0 = 0 v l = 0   or   w l = 0 1 else ,       l
o g = w g ,       g
where o l , 0 is a binary variable denoting the operating state of transmission line l at the initial failure stage, with 1 and 0 representing in-service and disconnected states, respectively. o g is a binary variable denoting the operating state of generator g at the initial failure stage, with 1 and 0 representing normal operation and outage, respectively.
Throughout the cascading failure process, the power system is subject to nodal power balance constraints. Equations (13)–(15) collectively determine the power-flow state at each cascading stage. Since some generators and loads may be disconnected during cascading failure propagation, the generation and load within the remaining system may become unbalanced. Therefore, the output of the slack bus n ¯ is adjusted to maintain system-wide power balance, as formulated in (16)–(18):
f p = b p θ p ,       p
f l , p = b l , p n = 1 N n C n , l L θ n , p ,       l , p
b l , p = b l o l , p 1 ,       l , p
P p = C L f p ,       p
P n , p = g = 1 N g C n , g G P g , p G d = 1 N d C n , d D P d , p D ,       n n ¯ , p
P n ¯ , p = n n ¯ P n , p ,       p
where f p is the transmission line power-flow vector at cascading stage p, and f l , p is the power flow on line l at stage p. b p is the line-bus susceptance matrix at cascading stage p. θ p is the bus angle vector, in which θ n , p denotes the voltage angle of bus n at stage p. b l denotes the admittance of line l under normal operating conditions. o l , p is a binary variable denoting the operating state of line l at stage p, with 1 and 0 representing in-service and disconnected states, respectively. b l , p is the admittance of line l at stage p, which is equal to 0 when the line is out of service and equal to b l otherwise. P p denotes the nodal net injection vector at cascading stage p, where P n , p and P n ¯ , p represent the net power injection at non-slack bus n and slack bus n ¯ , respectively. C L is the bus-line incidence matrix, an entry of C n , l L is equal to 1 when line l is connected to and directed away from bus n, equal to −1 when it is directed toward bus n, and equal to 0 otherwise. C n , g G and C n , d D are the bus-generator and bus-load incidence matrices, respectively. P g , p G and P d , p D denote the output power of generator g and the power demand of load d at cascading stage p, respectively.
The cascading failure model is designed to preserve the topology-flow coupling that directly links attack decisions to system-level consequences. At each propagation stage, the updated topology is used to recalculate active power flows; overloaded lines are then tripped, and newly isolated generators and loads are removed before the next stage. This stage-wise process captures the principal steady-state propagation chain. Based on the line-flow results, the tripping status of each line at a given cascading stage can be determined. A line trips when its power flow exceeds its capacity limit. Accordingly, the operating state of a line at the current stage is jointly determined by its operating state at the preceding stage and its current tripping status, as expressed in (19) and (20):
r l , p = 1       f l , p > f l max 0       f l , p f l max ,       l , p
o l , p = o l , p 1 r l , p ,       l , p
where r l , p is a binary variable indicating whether line l trips because of overload at cascading stage p; values of 1 and 0 denote overloaded tripping and no overload, respectively.
When all transmission lines connected to a power bus are out of service, the bus is considered failed. The generators connected to the failed bus are also removed from service, and their output power is set to zero; otherwise, their operating states and output powers remain unchanged, as expressed in (21) and (22). Similarly, loads connected to the failed bus are disconnected, as expressed in (23) and (24):
ω g , p = 0 l S ( g ) o l , p 1 = 0 1 else ,       g , p
P g , p G = ω g , p P g , 0 G ,       g , p
ρ d , p = 0 l S ( d ) o l , p 1 = 0 1 else ,       d , p
P d , p D = ρ d , p P d , 0 D ,       d , p
where S(g) denotes the set of transmission lines connected to generator g. ω g , p denotes its operating state at cascading stage p, with 1 and 0 representing normal operation and outage, respectively. S(d) denotes the set of transmission lines connected to load d. ρ d , p denotes its operating state, with 1 and 0 representing connected and disconnected states, respectively. P g , 0 G and P d , 0 D denote the initial output power of generator g and the initial power demand of load d, respectively.

3.3. Lower-Level Defense Model Considering Emergency Dispatch

The lower-level model represents the emergency dispatch implemented by the dispatch center after the power system is subjected to deliberate attacks, including optimal power flow and load-shedding measures. Its objective is to minimize the total load shedding, as formulated in (25):
min P G , Δ P D d = 1 N d Δ P d D
where P G denotes the vector of generator outputs during the emergency dispatch stage. Δ P D denotes the load-shedding vector, in which Δ P d D represents the load shedding of load d. For transmission networks operating with voltage magnitudes close to their nominal values, relatively small phase angle differences, and reactance-dominated branches, the DC formulation preserves the key relationship among network topology, active power transfers, line limits, generator redispatch, and load shedding. Therefore, this study employs the DC formulation for solution.
Once an attack is successfully implemented, the system topology changes dynamically as a result of the initial failures and subsequent cascading failure propagation. At the emergency dispatch stage, the dispatch center performs emergency dispatch based on the updated topology after the damage evolution process. The dispatch decisions are subject to the DC power-flow constraints in (26)–(32), including nodal power balance constraints, transmission-line power-flow constraints, line-flow limits, voltage-angle limits, generator-output limits, and load-shedding constraints:
C L f = C G P G C D ( P 0 D Δ P D )
f l b l n = 1 N n C n , l L θ n + 2 θ max b l ( 1 o l , a ) ,       l
f l b l n = 1 N n C n , l L θ n 2 θ max b l ( 1 o l , a ) ,       l
o l , a f l max f l o l , a f l max ,       l
θ max θ n θ max ,       n
o g P g min P g G o g P g max ,       g
0 Δ P d D P d , 0 D ,       d
where f denotes the transmission-line power-flow vector during the emergency dispatch stage, and f l denotes the power flow on transmission line l. P 0 D is the initial load demand vector, in which P d , 0 D denotes the initial power demand of load d. θ n denotes the voltage angle of bus n during emergency dispatch, and θ max is the maximum allowable voltage angle. a denotes the total number of cascading failure propagation stages. P g min and P g max are the lower and upper output limits of generator g, respectively.

4. Solution Method for the Tri-Level DAD-Based Coordinated Cyber–Physical Attack Strategy Optimization Model

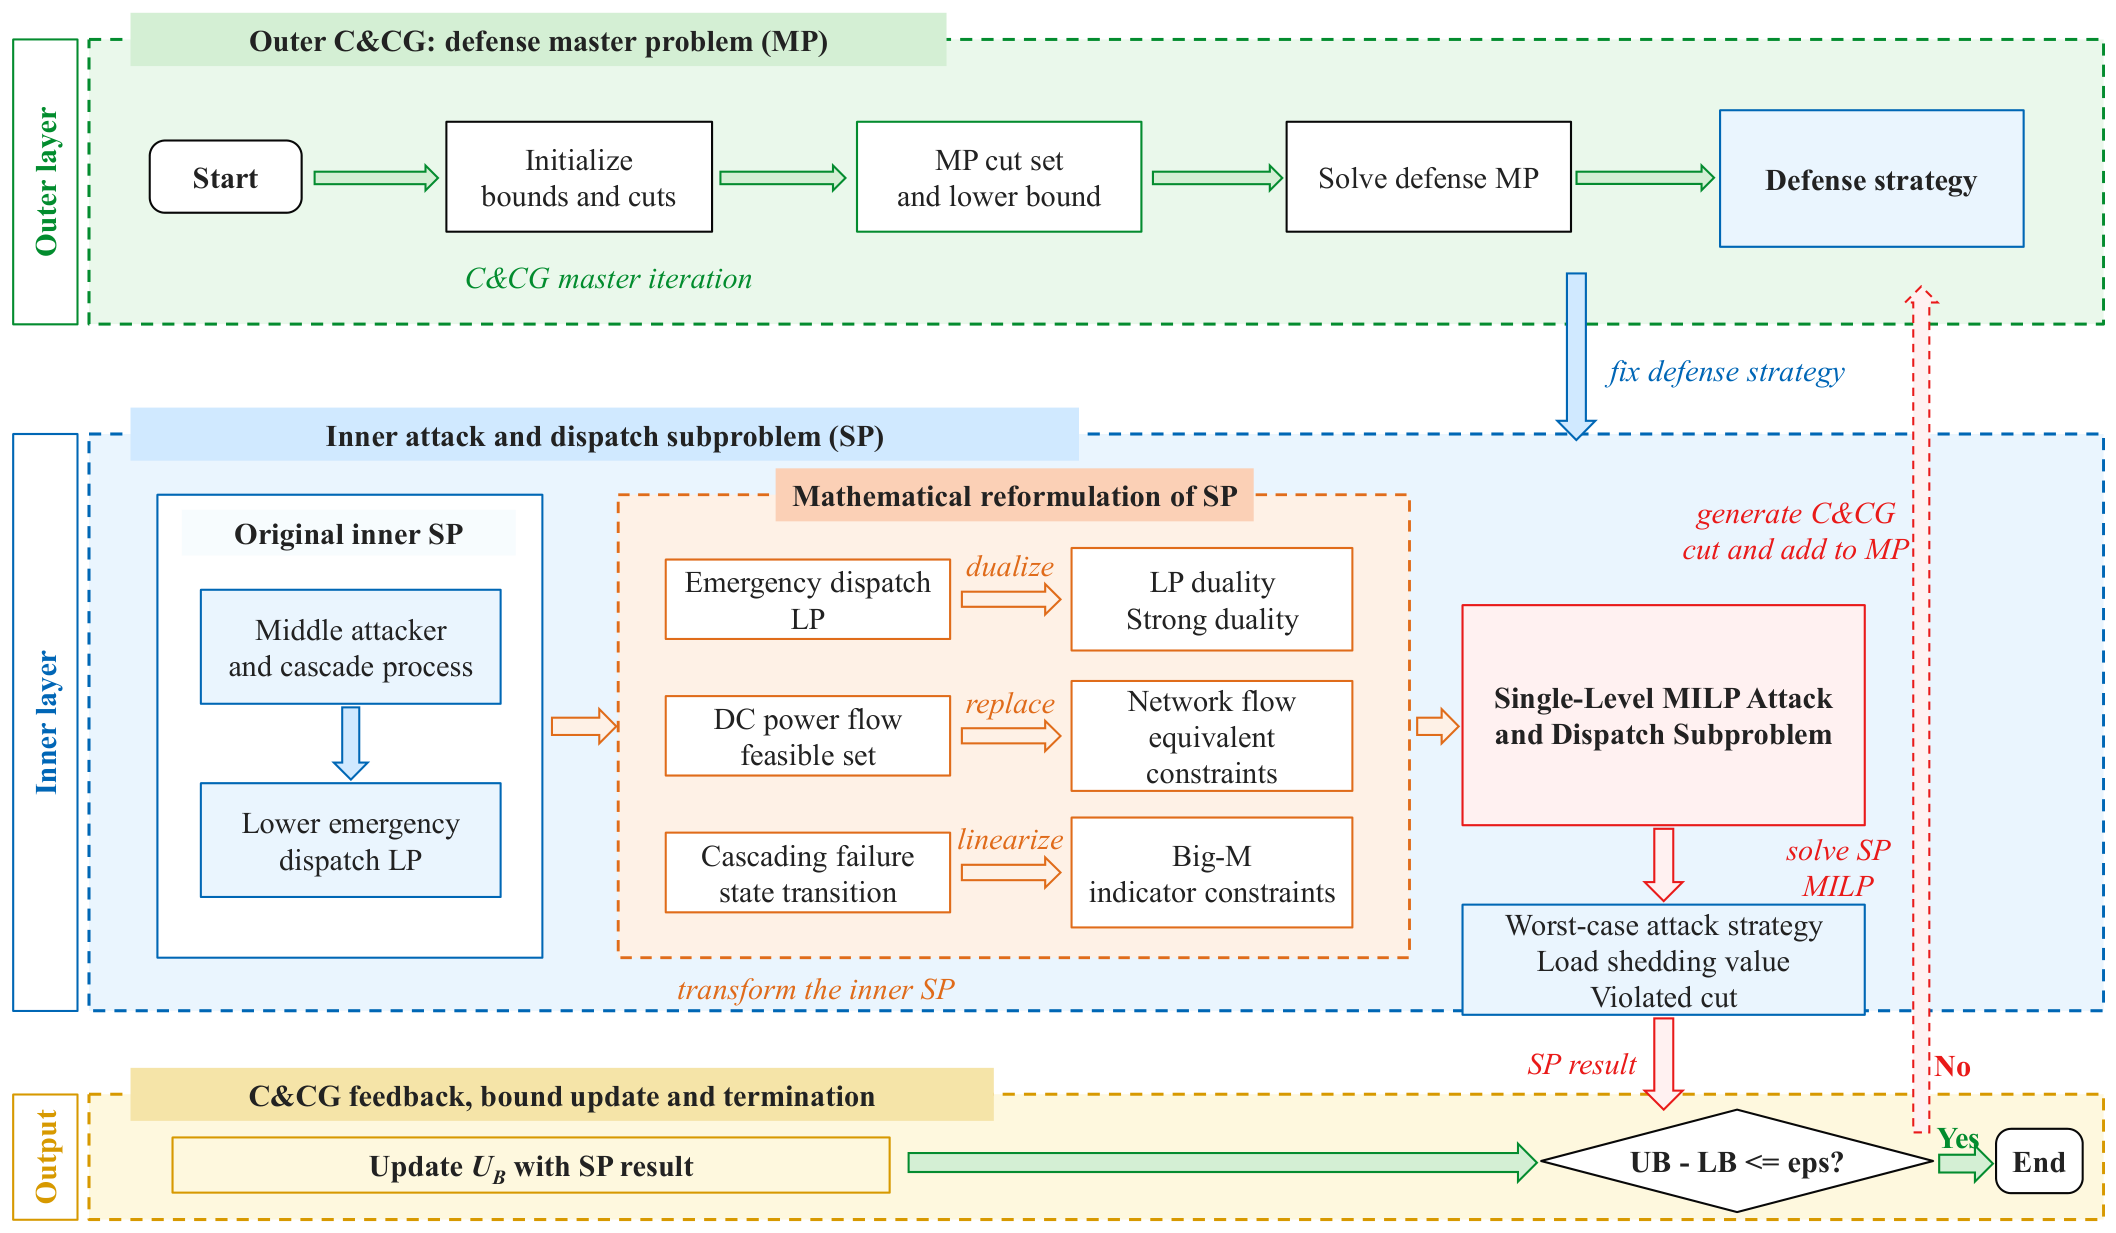
The proposed tri-level DAD-based attack strategy optimization model simultaneously incorporates binary defense variables, attack variables, transmission line status variables, and a multistage cascading failure propagation process, making it difficult to solve directly using conventional mathematical programming solvers. To address this issue, the lower-level emergency dispatch model is first equivalently reformulated using a network flow model, thereby eliminating bus angle variables and their coupling with transmission-line-status variables. Subsequently, based on strong duality theory, the lower-level minimization problem is transformed into its dual maximization form, and the middle- and lower-level attacker–defender (AD) model is reformulated as a single-level mixed-integer linear programming subproblem. Finally, a column-and-constraint generation (C&CG) algorithm is employed to iteratively solve the tri-level DAD model through the interaction between the master problem and the subproblem [21,28]. The overall solution procedure is illustrated in Figure 3.

4.1. Network-Flow Reformulation and Dualization of the Middle-Level and Lower-Level AD Bilevel Subproblem

As indicated by (25)–(32), the lower-level model is a linear programming problem that satisfies the strong duality property. Therefore, duality theory can be used to reformulate the middle-level and lower-level AD bilevel subproblem as a single-level mixed-integer programming model. However, direct dual reformulation introduces nonlinear terms into the objective function. Since the upper bounds of the dual variables are unknown, these nonlinear terms cannot be linearized directly and must instead be handled using the Big-M method. Nevertheless, excessively large Big-M values may substantially increase the computational time required to solve the model [18,25].
To address the slow solution process caused by multiple nonlinear terms and dual variables, a network-flow formulation is employed to reformulate the middle-level and lower-level AD bilevel subproblem. Specifically, the lower-level optimal DC power-flow model is represented using a network-flow model such that the coefficient matrix associated with the dual variables becomes totally unimodular. This enables the derivation of upper and lower bounds for the dual variables, thereby enabling explicit bounds for the dual variables and facilitating the linearization of bilinear terms. Subsequently, duality theory is applied to transform the resulting model into a single-level mixed-integer linear programming model.
To improve computational tractability, the lower-level optimal DC power-flow model is relaxed into a network flow model by removing the branch power-flow constraints in (27) and (28) and the voltage angle limit constraint in (30). This relaxation provides a tight lower bound for the original lower-level model. Therefore, the original model can be replaced by the network flow model for solution, as follows:
max n = 1 N n α n ( d = 1 N d C n , d D P d , 0 D ) l = 1 N l ( β l + β l ) o l , a f l max g = 1 N g μ g o g P g max + g = 1 N g μ g o g P g min d = 1 N d υ d P d , 0 D
s.t. (1) and (2), (7)–(24)
n = 1 N n ( C n , l L α n ) + β l β l = 0 ,       l
n = 1 N n ( C n , g G α n ) μ g + μ g = 0 ,       g
n = 1 N n ( C n , d D α n ) υ d + υ d = 1 ,       d
β l , β l , μ g , μ g , υ d , υ d 0 ,       l , g , d
where α n , β l , β l , μ g , μ g , υ d and υ d are dual variables.
Let x : G x h represent constraints (34)–(37), where G is the coefficient matrix of the dual variables and x is the vector composed of the dual variables. According to Cramer’s rule, the dual variable x can be calculated as follows:
x i = det [ G 1 G 2 G i 1 h G i + 1 G n ] det [ G ]
where Gi is a submatrix of G.
Since G is an integer matrix, the absolute value of its determinant is greater than or equal to 1. Therefore, according to (38), x i can be calculated as follows:
x i det [ G 1 G 2 G i 1 h G i + 1 G n ]
Since [G h] is a totally unimodular matrix, the absolute value of its determinant is lower than or equal to 1, as shown in (40):
det [ G 1 G 2 G i 1 h G i + 1 G n ] 1
Accordingly, the upper and lower bounds of all dual variables can be obtained from (37), (39) and (40), as expressed in (41) and (42):
0 β l , β l , μ g , μ g , υ d , υ d 1       l , g , d
1 α n 1       n
After obtaining the bounds of the dual variables, intermediate variables ξ l , ξ l can be introduced to linearize the nonlinear products of β l o l , a and β l o l , a , as shown in (43) and (44):
ξ l o l , a β l 1 + o l , a ξ l ξ l β l ξ l 0 ,       l
From (41)–(44), the network-flow model can be used to further derive the upper and lower bounds of the dual variables while eliminating the nonlinear terms ( β l + β l ) o l , a . Finally, the middle-level and lower-level AD bilevel subproblem is reformulated as the following single-level mixed-integer linear programming model:
max n = 1 N n α n ( d = 1 N d C n , d D P d , 0 D ) g = 1 N g μ g o g P g max + g = 1 N g μ g o g P g min d = 1 N d υ d P d , 0 D l = 1 N l ( ξ l + ξ l ) f l max
s.t. (1) and (2), (7)–(24), (34)–(37), (43) and (44).

4.2. C&CG-Based Solution of the Coordinated Cyber–Physical Attack Strategy Optimization Model

As indicated by (45), once the upper-level defense strategy is fixed, the middle-level coordinated cyber–physical attack, cascading failure propagation, and lower-level emergency dispatch processes can be reformulated as a single-level mixed-integer linear programming model. Therefore, the column-and-constraint generation (C&CG) algorithm is employed to solve the proposed tri-level DAD model. The algorithm decomposes the original model into a defense master problem (MP) and an attack-dispatch subproblem (SP). The MP determines the optimal defense resource allocation over the currently identified set of attack strategies, whereas the SP identifies the attack strategy that produces the maximum load shedding under a given defense strategy and feeds it back to the MP. Through alternating iterations between the MP and SP, the optimal solution to the tri-level DAD model is gradually obtained. Let the set of attack strategies generated by iteration t be denoted by V ^ ( t ) = v ^ n ( 1 ) , v ^ l ( 1 ) , v ^ n ( 2 ) , v ^ l ( 2 ) , , v ^ n ( t ) , v ^ l ( t ) , where v ^ n ( k ) and v ^ l ( k ) are the substation BTA status vector and transmission line physical attack status vector in attack strategy k, respectively. An auxiliary variable η is introduced to represent the maximum load shedding caused by the generated attack strategies under the current defense strategy. The objective function and constraints of the MP at iteration t are given in (46)–(49).
min η
n s n S c y b
l s l S p h y
η d Δ P ^ d D ( k )
where Δ P ^ d D ( k ) denotes the load shedding of load d under attack strategy k.
The MP considers only the attack strategies included in the current attack strategy set V ^ ( t ) ; hence, its objective value provides a lower bound on the optimal objective value of the original tri-level DAD model. After solving the MP, the defense strategy s ( t ) and objective value η ( t ) at iteration t are obtained, and the lower bound L B ( t ) is updated as follows:
L B ( t ) = max L B ( t 1 ) , η ( t )
The defense strategy obtained from the MP is then fixed as follows:
s n = s n ( t ) , n s l = s l ( t ) , l
The fixed defense strategy is subsequently substituted into the single-level mixed-integer linear programming formulation of the middle-level and lower-level AD model, thereby constructing the attack-dispatch SP at iteration t. The SP aims to maximize the system load shedding and identifies the optimal BTA strategy, transmission-line physical attack strategy, and the corresponding cascading failure propagation process under the current defense strategy. Let the most damaging attack strategy obtained from the SP be v ^ n ( t + 1 ) , v ^ l ( t + 1 ) , and let the corresponding maximum load shedding be Q ( t ) . Since s ( t ) is a feasible defense strategy for the original tri-level DAD model and Q ( t ) is the maximum load shedding that can be caused by the attacker under this defense strategy, Q ( t ) provides an upper bound on the optimal objective value of the original problem. The upper bound U B ( t ) is updated as follows:
U B ( t ) = min U B ( t 1 ) , Q ( t )
When the current upper and lower bounds do not satisfy the convergence criterion, the most damaging attack scenario associated with v ^ n ( t + 1 ) , v ^ l ( t + 1 ) has not yet been incorporated into the MP. The corresponding attack strategy is therefore added to the attack strategy set:
V ^ ( t + 1 ) = V ^ ( t ) v ^ n ( t + 1 ) , v ^ l ( t + 1 )
Subsequently, the effective attack status variables, initial failure variables, cascading failure status variables, network-flow variables, and associated constraints corresponding to the newly generated attack strategy are added to the MP. The iteration counter is updated as t = t + 1 , and the MP is solved again. When the convergence condition in (54) is satisfied, the algorithm terminates. At convergence, the attack strategy identified by the SP represents the most damaging coordinated cyber–physical attack strategy against the corresponding defense configuration, while the MP provides the associated cyber- and physical-defense allocation.
U B ( t ) L B ( t ) ε

5. Case Studies

To validate the effectiveness of the proposed attack strategy optimization method, case studies are conducted using IEEE 39 bus and IEEE 118 bus power systems. Each substation is assumed to be equipped with a corresponding substation automation control system. Accordingly, the two test systems contain 39 and 118 substation automation control systems, respectively. The IEEE 39 bus power system is used to analyze optimized attack strategies, compare different modeling methods, and examine the effects of defense resources, attack resources, and line overload thresholds. The IEEE 118 bus power system is further used to evaluate the applicability and computational performance of the proposed model on a larger transmission network. The tri-level DAD solution method described in Section 4 is applied to identify the most damaging coordinated cyber–physical attack strategies under defense resource allocation and emergency dispatch responses. All simulations are implemented in MATLAB R2024b.

5.1. Coordinated Cyber–Physical Attack Strategy Optimization Results

The proposed model is applied to an IEEE 39 bus power system to optimize coordinated cyber–physical attack strategies. The defense budgets of two cyber-protected substations and three physically hardened lines, together with the attack budgets of two BTA targeted substations and four physically attacked lines, are selected to construct a representative limited resource setting of moderate attack and defense intensity. Under this setting, neither side can protect or disrupt all candidate assets, while both cyber and physical attack channels remain active. The model is solved iteratively to obtain the most damaging attack strategy, the corresponding defense configuration, the initial and cascading outage lines, and the resulting final load shedding, as presented in Table 1. In Table 1, the substation and transmission line indices follow the numbering in IEEE 39 bus power system data; ‘#’ denotes the sequence number of a substation automation control system, and ‘L’ denotes the sequence number of a transmission line.
The results in Table 1 demonstrate that the proposed model can identify the most damaging coordinated attack strategy from a large set of feasible attack combinations while accounting for defense resource allocation and emergency dispatch responses. Under the given resource limits, the optimized attack strategy targets substations #20 and #24 through BTAs and transmission lines L33, L36, L37, and L39 through physical attacks. The corresponding defense configuration provides cyber protection for substations #22 and #23 and physically hardens transmission lines L28, L34, and L38. Despite this targeted defense deployment, the attacker exploits unprotected substation automation control systems and transmission lines, causing severe topology disruption and a final load shedding of 4292.53 MW. Therefore, the identified strategy represents the most damaging coordinated cyber–physical attack identified under the given defense configuration against the given defense configuration.
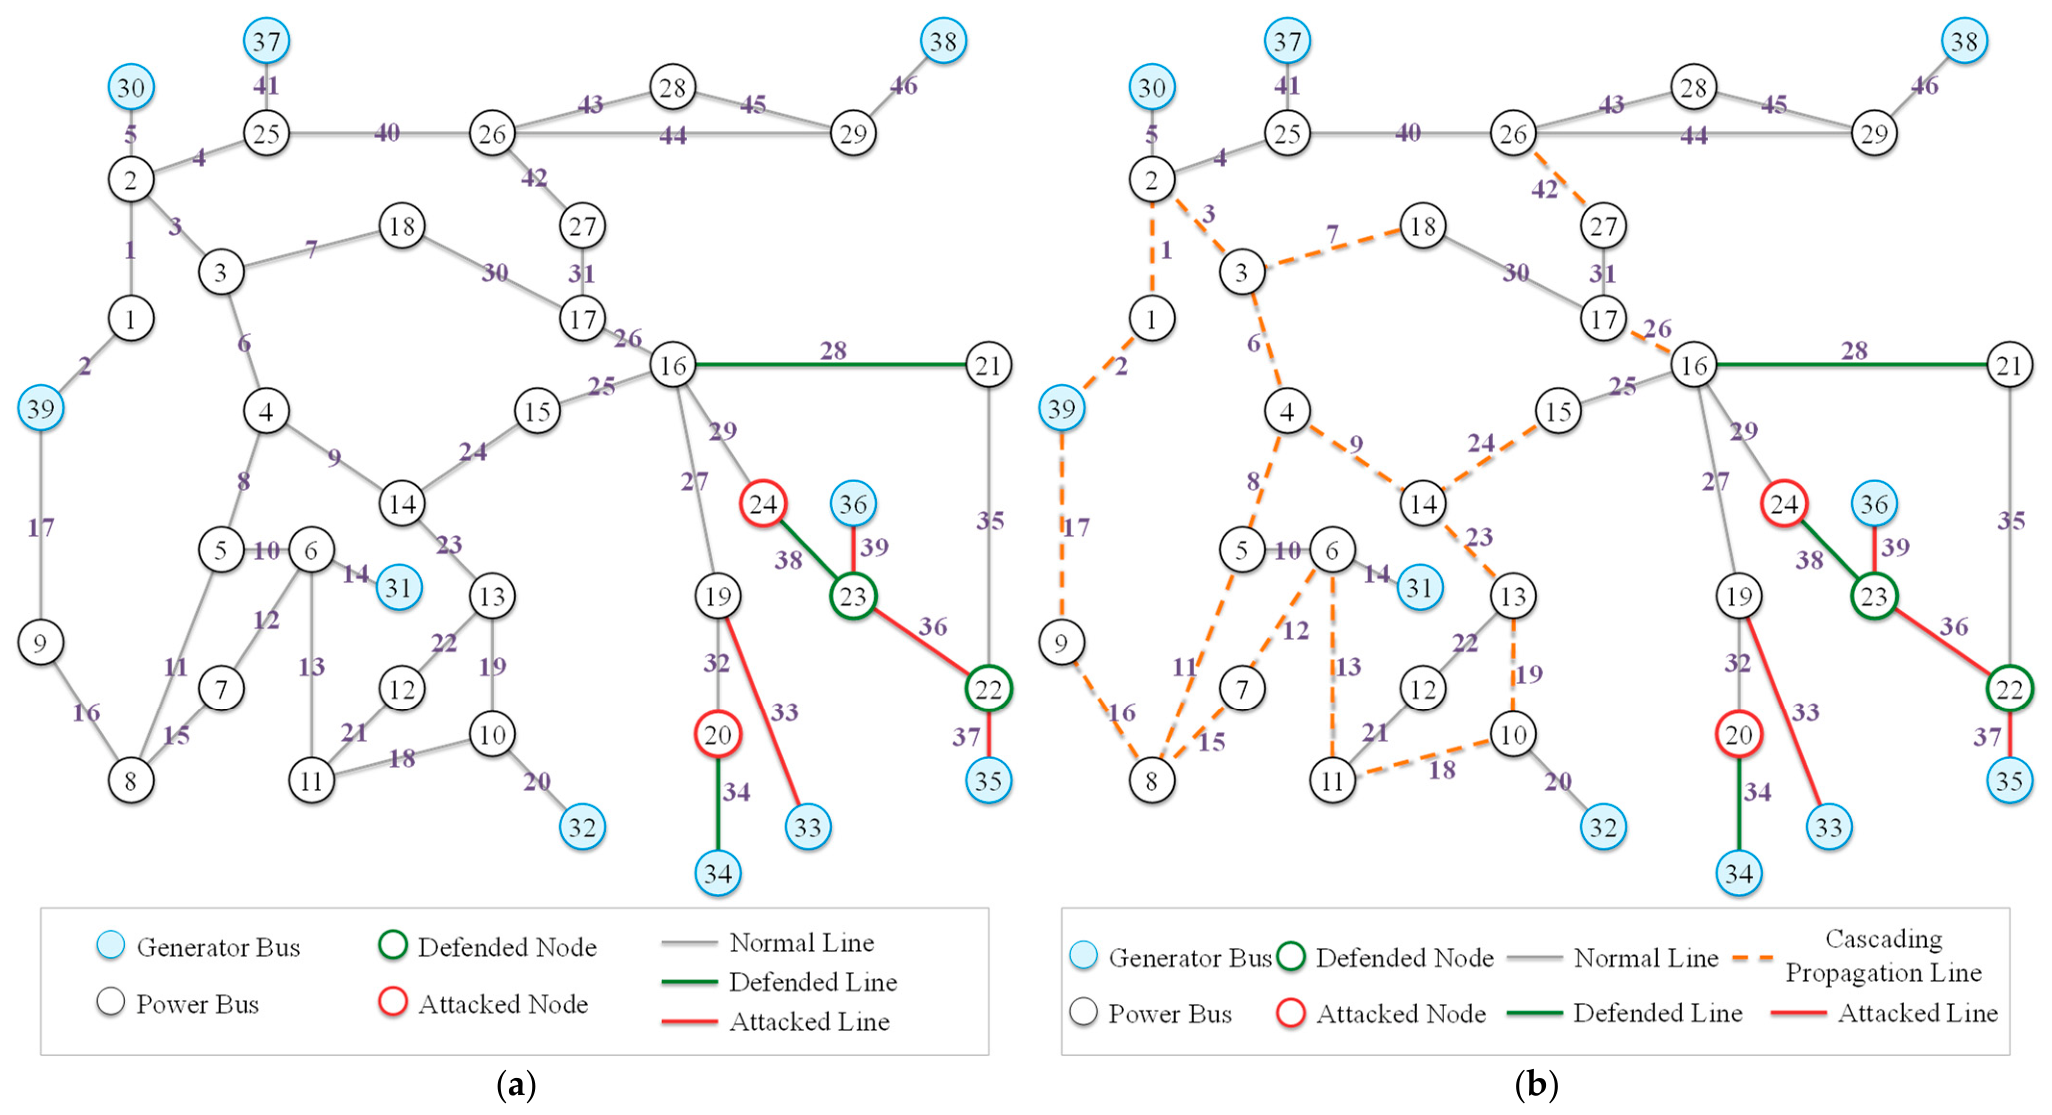
The consequences of the optimized attack strategy under the associated defense configuration are further analyzed. After providing cyber protection for substations #22 and #23 and physically hardening transmission lines L28, L34, and L38, the attacker selects substations #20 and #24 for BTAs and transmission lines L33, L36, L37, and L39 for physical attacks. The initial outages subsequently cause overload tripping of other transmission lines, thereby initiating the cascading failure propagation process, as illustrated in Figure 4.
As shown in Figure 4a, BTAs against substations #20 and #24 cause the tripping of their associated transmission lines, while physical attacks directly disconnect transmission lines L33, L36, L37, and L39. These initial outages change the original network topology, weaken the transmission capacity between generation areas and load areas, and cause the redistribution of power flows over the remaining lines. The total system load demand before the attack is 6254.23 MW. After the initial coordinated attack, 5017.93 MW of demand remains connected within the surviving operating areas, indicating that 1236.30 MW of load has been directly disconnected by the initial topology separation. The surviving generators have a pre-attack scheduled output of 2296.13 MW, whereas their aggregate upper generation limit is 4940 MW. By performing an optimal power-flow calculation with minimum load shedding for the islands shown in Figure 4a, the load shedding caused by the initial failures is obtained as 1454.23 MW.
As shown in Figure 4b, the power-flow redistribution after the initial outages further causes several remaining transmission lines to become overloaded and successively tripped. The cascading outage process expands the affected area and further reduces the available transmission paths, which significantly aggravates the imbalance between available generation and load demand. The total load demand in the remaining operating areas is then reduced to 2732 MW, corresponding to cumulative topology-induced load disconnection of 3522.23 MW. Although the surviving generators still have an aggregate upper generation limit of 4940 MW, the fragmented network topology and transmission constraints prevent this capacity from being fully delivered to the remaining loads. Following emergency dispatch, the final load shedding reaches 4292.53 MW. Therefore, cascading failures result in an additional load shedding of 2838.30 MW, accounting for 66.12% of the total load shedding. This result indicates that the consequence of coordinated cyber–physical attacks is not limited to the initially attacked components; instead, the subsequent topology-flow coupled cascading process may dominate the final system damage.
In summary, the case study results show that the consequence of coordinated cyber–physical attacks is not limited to the initially attacked components. BTA-induced outages and physical line attacks may trigger subsequent topology-flow coupled cascading failures, which further amplify the final load-shedding consequence. Therefore, BTA-induced topology changes, cascading failure propagation, defense resource allocation, and post-attack emergency dispatch should be jointly considered when optimizing coordinated cyber–physical attack strategies and quantifying their consequences.

5.2. Comparison of Different Attack Strategy Optimization Methods

To evaluate how different modeling assumptions affect optimized attack targets and estimated load shedding, the proposed coordinated cyber–physical DAD-based attack strategy optimization method (CCP-DAD) is compared with the coordinated attack response AD method (CAR-AD) [4], the static contingency DAD method (SC-DAD) [20], and the transmission asset DAD method (TA-DAD) [7]. The four methods represent different attack channels and response processes; therefore, the comparison is conducted under a common unit resource normalization and is interpreted as a mechanism-oriented benchmark. The total defense and attack budgets are normalized on a unit resource basis across all schemes. For TA-DAD, which contains only physical transmission asset decisions, the cyber-defense and BTA resources in CCP-DAD are represented by additional physical hardening and direct line attack resources, respectively. Thus, the two cyber-defense resources and two BTA resources in CCP-DAD are represented by two additional hardened transmission lines and two additional directly attacked transmission lines in TA-DAD. This normalization preserves the total numbers of defensive and offensive actions and allows the comparison to focus on the consequences of representing different attack channels rather than differences in total resource quantity. The optimized attack strategies, corresponding defense configurations, and resulting load shedding obtained using the four methods are presented in Table 2.
As shown in Table 2, the maximum load shedding produced by the attack strategy optimized using the proposed method is lower than that obtained by CAR-AD but higher than those obtained by SC-DAD and TA-DAD. CAR-AD does not consider pre-attack defense strategies, allowing the attacker to directly select the worst attack scenario without cyber protection or physical line hardening. Its estimated load shedding is 5.34% higher than that of the proposed method, indicating that pre-attack cyber protection of substations and physical hardening of transmission lines can effectively reduce load shedding caused by coordinated cyber–physical attacks. SC-DAD neglects the load shedding caused by cascading failures, resulting in an estimated load shedding that is 18.82% lower than that obtained by the proposed method. This result indicates that cascading failures are a major source of additional load shedding, and neglecting overload tripping and dynamic topology updates may lead to substantial underestimation of the consequences of optimized attacks. TA-DAD considers only physical attacks on transmission lines and neglects BTAs targeting substation automation control systems. Consequently, its estimated load shedding is 26.71% lower than that of the proposed method. This is because TA-DAD does not represent the topological impacts of BTAs, particularly the coordinated outages of multiple transmission lines resulting from compromised substation control systems and malicious breaker-tripping commands.
The above results indicate that CAR-AD may overestimate the final load shedding under coordinated attacks because it neglects pre-attack defense and allows the attacker to select the worst targets under completely unprotected conditions. SC-DAD may underestimate system load shedding because it neglects the additional losses caused by cascading failure propagation. TA-DAD may also underestimate both the severity of attack strategies and load shedding because it neglects the amplifying effects of BTAs. Overall, the proposed CCP-DAD method explicitly embeds BTA-induced cyber-to-physical topology transitions into the DAD framework while simultaneously considering pre-attack cyber- and physical defense, coordinated cyber–physical attacks, cascading failure propagation, and post-attack emergency dispatch. Therefore, it can more realistically identify the most damaging coordinated cyber–physical attack strategies and quantify their system-level consequences under defense resource allocation and emergency dispatch responses.

5.3. Sensitivity Analysis

5.3.1. Effects of Defense Resource Allocation on Optimized Attack Strategies

With the attacker resource budget fixed at two substation automation control systems and its physical attack resource budget fixed at four transmission lines, this section investigates how defense resource allocation reshapes the attacker’s optimal target selection and the resulting load-shedding consequences. The defender’s available resources for cyber protection of substation automation control systems and physical hardening of transmission lines are gradually increased. Table 3 presents the optimal defense strategies, optimal attack strategies, and final load shedding under different defense resource allocations. In the ‘Defense Resources’ column, the ordered pair denotes the numbers of substation automation control systems protected at the cyber layer and transmission lines hardened at the physical layer, respectively.
As shown in Table 3, increasing defense resources reduces the final load shedding under the worst-case attack scenario. Compared with the (1, 2) configuration, the final load shedding is reduced by 58.77 MW, 524.60 MW, and 967.05 MW under the (2, 3), (3, 4), and (4, 5) configurations, respectively. These results indicate that increasing the number of substations with cyber protection and physically hardened transmission lines can weaken the impacts of the original attack strategy and force the attacker to select alternative targets. When the defense resource allocation increases from (1, 2) to (2, 3), the defender additionally protects substation #23 and hardens line L38. Accordingly, the attacker shifts its targets to substations #20 and #24 and transmission lines L33, L36, L37, and L39, reducing the final load shedding to 4292.53 MW. When the resource allocation further increases to (3, 4), substation #20 and line L29 are additionally protected and hardened, respectively. The attacker no longer targets substation #20 but instead attacks substations #19 and #24 and transmission lines L32, L33, L36, and L39, resulting in a final load shedding of 3826.70 MW. When the defense resources are further increased to (4, 5), substation #24 and line L33 are additionally protected and hardened, respectively. Since several high-impact targets in the preceding attack strategies are then protected, the attacker further shifts to substations #19 and #29 and transmission lines L1, L7, L9, and L12, reducing the final load shedding to 3384.25 MW. These results show that, as defense resources continue to increase, the attacker gradually abandons the original combinations of high-impact substations and transmission lines and instead selects relatively less-damaging targets. Consequently, load shedding under the worst-case scenario is further suppressed.

5.3.2. Effects of Attack Resource Allocation on Optimized Attack Strategies

To investigate how attack resource availability affects optimal target selection and attack consequences, the defense resources are fixed to allow for cyber protection of two substations and physical hardening of three transmission lines. The attacker’s BTA and physical attack resources are then gradually increased. Table 4 presents the optimal defense strategies, optimal attack strategies, and final load shedding under different attack resource allocations. In the ‘Attack Resources’ column, the ordered pair denotes the numbers of substations selected for BTAs and transmission lines selected for physical attacks, respectively.
As shown in Table 4, the final load shedding under the worst-case attack scenario increases as the attack resources increase. The successive transitions from (0, 3) to (1, 4), from (1, 4) to (2, 4), and from (2, 4) to (3, 5) increase the final load shedding by 722.65 MW, 705.08 MW, and 746.37 MW, respectively. These results indicate that increasing the number of substations targeted by BTAs and transmission lines subject to physical attacks expands the set of available attack targets and further aggravates the load shedding caused by coordinated cyber–physical attacks. When the attack resource allocation increases to (1, 4), the attacker is able to launch a BTA against one substation automation control system and physical attacks against four transmission lines. Accordingly, the attacker launches a BTA targeting substation #22, increasing the final load shedding to 3587.45 MW. When the attack resource allocation further increases to (2, 4), the defender adjusts its strategy to protect substations #22 and #23 and harden transmission lines L28, L34, and L38. The attacker then shifts to coordinated attacks on substations #20 and #24 and transmission lines L33, L36, L37, and L39, resulting in a further increase in final load shedding to 4292.53 MW. When the attack resource allocation increases to (3, 5), the defender reconfigures its cyber protection from substations #22 and #23 to substations #20 and #22 while retaining the hardening of L28, L33, and L38. The attacker then targets substations #19, #23 and #24 and transmission lines L32, L34, L36, L37, and L39. The final load shedding consequently increases to 5038.90 MW, indicating that the available defense resources are insufficient to counter large-scale attacks. Overall, as attack resources continue to increase, the attacker can combine targets across a larger number of substations and transmission lines and continuously adjust its attack strategy during the game. Consequently, load shedding under the worst-case scenario further increases.

5.3.3. Joint Effects of Cyber–Physical-Defense Resources on Attack Strategy Optimization

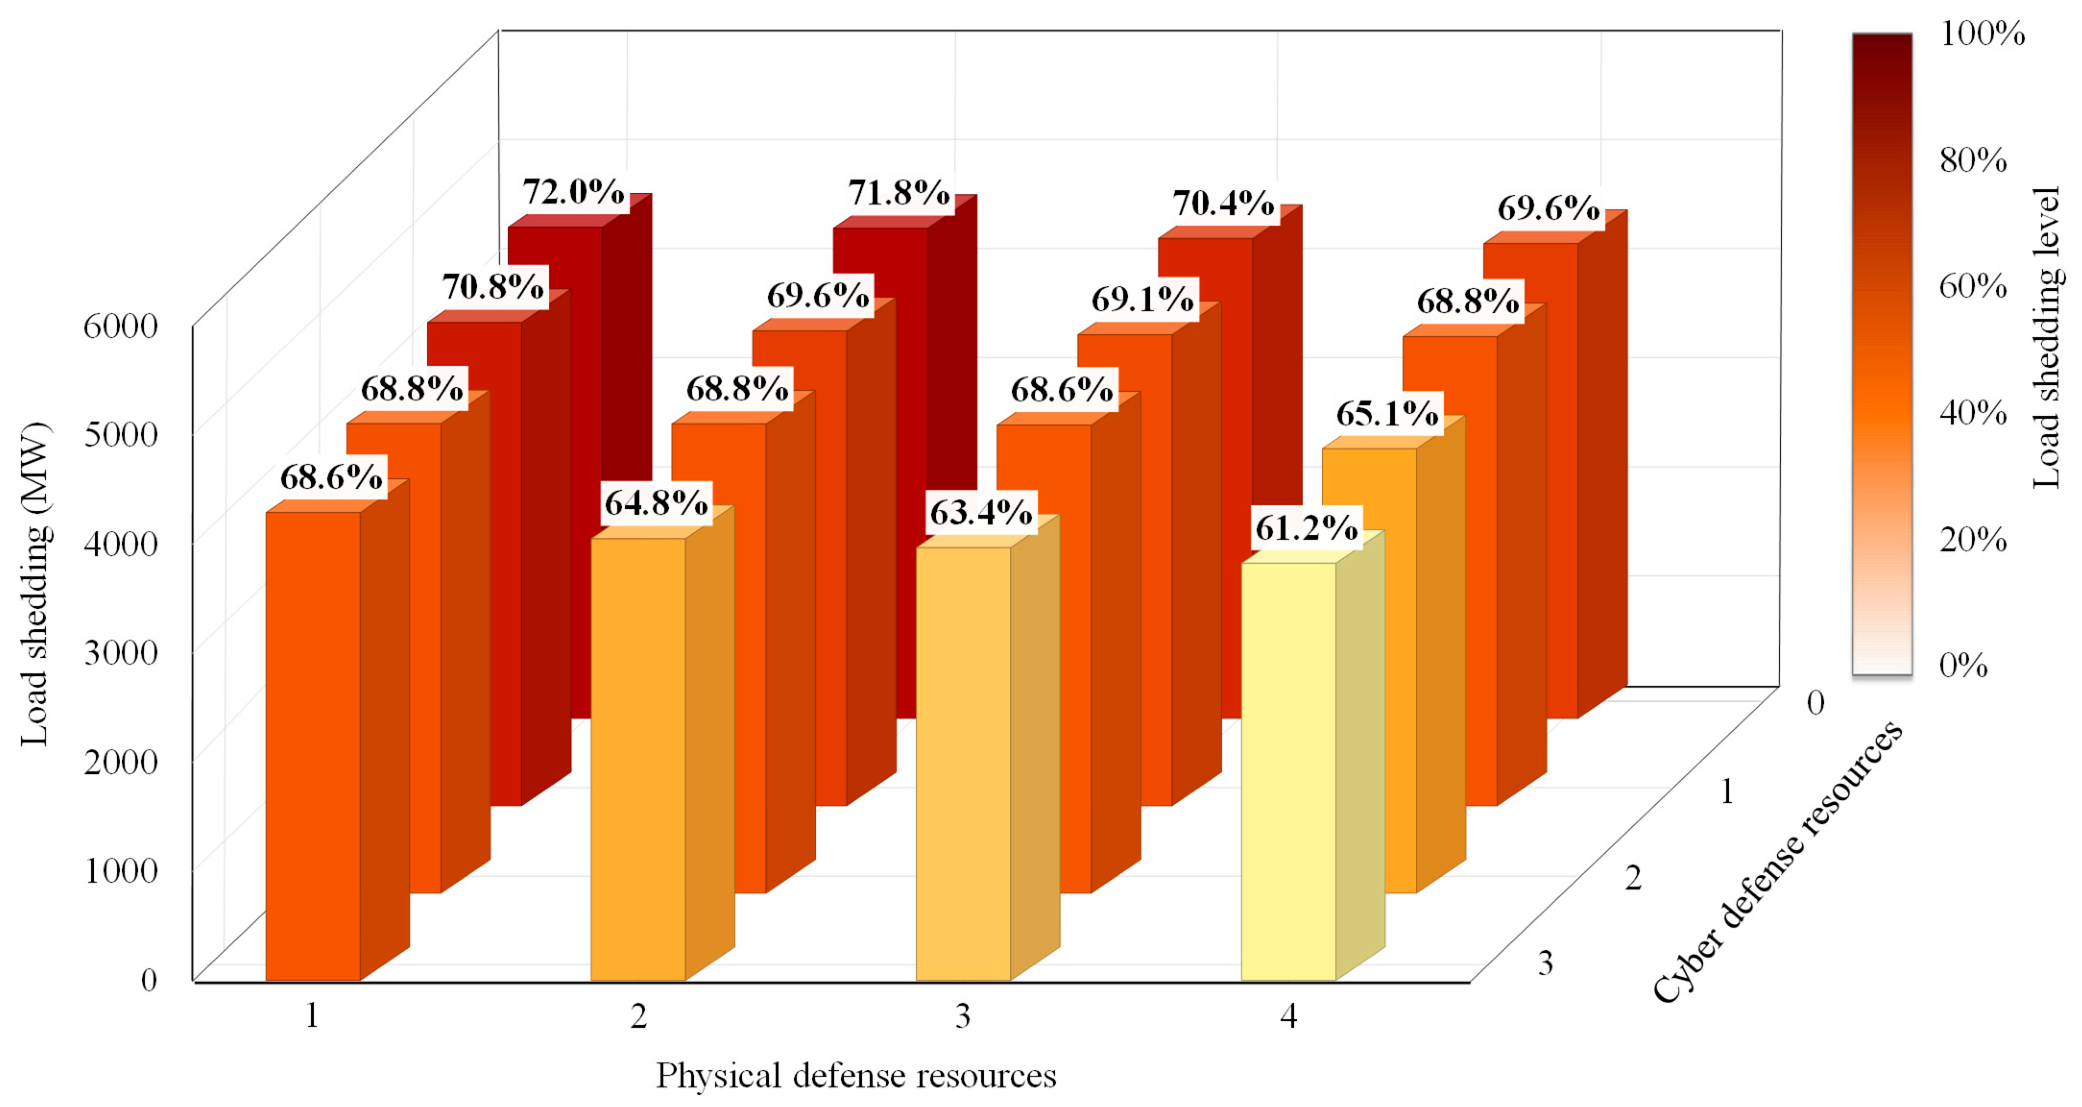
To further examine how cyber- and physical-defense resources jointly constrain the most damaging coordinated attack strategies and their consequences, the attacker’s BTA and physical attack resources are fixed at two substations and four transmission lines, respectively. Under this setting, the cyber-defense resources are varied from 0 to 3, while the physical-defense resources are varied from 1 to 4. For each resource allocation, the defense strategy, attack strategy, and load-shedding ratio are reevaluated. The results are shown in Figure 5.
As shown in Figure 5, the final load shedding generally decreases as either cyber-defense resources or physical-defense resources increase. For example, when the defender can protect two substation automation control systems and harden three transmission lines, the final load shedding is 4292.53 MW, accounting for 68.6% of the total load. When only one additional cyber-defense resource is added, increasing the number of protected substations from 2 to 3, the load-shedding ratio decreases to 63.4%, corresponding to a reduction of 7.56%. In contrast, when only one additional transmission line is hardened, increasing the physical-defense resources from 3 to 4, the load-shedding ratio decreases to 65.1%, corresponding to a reduction of 5.09%. Therefore, under this resource allocation, increasing cyber-defense resources provides a greater marginal load-shedding reduction than increasing physical-defense resources. It is noteworthy that, when the number of cyber-defense resources is fixed at 2, increasing the number of physically hardened transmission lines from 1 to 2 results in almost no change in final load shedding, with the load-shedding ratio remaining approximately 68.8%. This indicates that, under this resource allocation, the additional hardened transmission line provides limited marginal protection. Moreover, Figure 5 shows that the load-shedding ratio is 69.6% for both the allocation of zero cyber-defense resources and four physical-defense resources and the allocation of one cyber-defense resource and two physical-defense resources. Similarly, the load-shedding ratio is 68.6% for both the allocation of two cyber-defense resources and three physical-defense resources and the allocation of three cyber-defense resources and one physical-defense resource. These results indicate that, for the IEEE 39 bus power system and within certain resource allocation ranges, adding one cyber-defense resource can provide protection effects comparable to those achieved by hardening multiple transmission lines.
Overall, from the attacker’s perspective, cyber protection more strongly restricts access to high-impact BTA targets than physical hardening restricts direct line attack targets under the tested resource settings. As defense resources increase, the feasible combinations of high-impact attack targets become more limited, forcing the attacker to shift toward less damaging components and reducing the maximum load shedding. For the investigated system, these results support prioritizing the cyber protection of critical substation automation control systems while coordinating it with the physical hardening of critical transmission lines.

5.3.4. Effects of Line Overload Thresholds on Optimized Attack Strategies

With the defense resources fixed at two cyber-protected substations and three physically hardened transmission lines, and the attack resources fixed at two substations for BTAs and four transmission lines for physical attacks, this section investigates how the line overload threshold affects the optimized defense and attack strategies, cascading failure propagation, and final load shedding. The line overload threshold coefficient is set to 0.9, 1.0, and 1.1, corresponding to 90%, 100%, and 110% of the original overload tripping threshold, respectively. The defense and attack strategies are reoptimized under each threshold coefficient. Table 5 presents the optimal defense strategies, optimal attack strategies, cascading outage lines, and final load shedding under different line overload threshold coefficients.
As shown in Table 5, increasing the line overload threshold gradually suppresses cascading failure propagation and reduces the final load shedding. When the threshold coefficient increases from 0.9 to 1.0, the number of lines tripped during cascading propagation decreases from 24 to 18, while the final load shedding decreases from 4622.83 MW to 4292.53 MW. Thus, six cascading outage lines are avoided, and the final load shedding is reduced by 330.30 MW. When the threshold coefficient further increases to 1.1, the number of cascading outage lines decreases to 10, and the final load shedding decreases to 3954.23 MW. Compared with the coefficient of 1.0, eight additional cascading line outages are avoided, and the final load shedding is reduced by 338.30 MW. These results indicate that a higher line overload threshold allows the remaining transmission lines to withstand larger power-flow redistribution before tripping, thereby limiting the expansion of cascading outages and reducing the resulting system damage. It is also noteworthy that when the line overload threshold coefficient increases to 1.1, the attacker changes its BTA target to substation #39, which is connected to a generator with a large output capacity. As the higher overload threshold weakens the contribution of cascading propagation to the final damage, the attacker has less incentive to rely on subsequent overload tripping. Instead, it targets substation #39 to disconnect substantial generation capacity and create a more severe power imbalance during the initial failure stage. This change shows that the line overload threshold affects not only the scale of cascading propagation but also the attacker’s target selection. Under a lower threshold, the attacker can rely more heavily on cascading line outages to amplify the initial damage, whereas under a higher threshold, the optimized attack strategy places greater emphasis on causing substantial load shedding directly during the initial failure stage.

5.4. Model Applicability and Computational Performance Analysis

To further evaluate the applicability of the proposed model to larger transmission networks, the IEEE 118 bus power system is selected for additional testing. Compared with the IEEE 39 bus power system, this system contains a larger number of substations, generators, loads, and transmission lines, resulting in substantially more feasible combinations of cyber and physical attack targets. Under the specified defense and attack resource constraints, the proposed model is used to optimize the defense configuration and identify the coordinated cyber–physical attack strategy that causes the maximum load shedding after cascading failure propagation and emergency dispatch. The optimized defense strategy, attack strategy, initial outage lines, cascading outage lines, and final load shedding are presented in Table 6.
As shown in Table 6, the proposed model can identify the most damaging coordinated attack strategy from a large number of feasible attack combinations while accounting for defense resource allocation and emergency dispatch responses. Under the specified resource constraints, the optimal defense strategy protects substation automation control systems #30, #69, and #80 and hardens transmission lines L8, L30, L104, L183, and L184. In response to this defense configuration, the attacker launches BTAs against substations #54, #65, and #92 and conducts physical attacks on transmission lines L36, L38, L51, L98, L123, and L141. The coordinated attack causes 18 transmission lines to become unavailable during the initial failure stage. The resulting redistribution of power flows further causes more lines to trip during cascading propagation. Although the defender deploys targeted cyber protection and physical hardening resources, the attacker exploits unprotected substation automation control systems and transmission lines to cause extensive topology changes and restrict power transfer between generation and load areas. Following cascading failure propagation and emergency dispatch, the final load shedding reaches 1452.89 MW. These results demonstrate that the proposed model can identify critical combinations of cyber- and physical-attack targets and quantify their system consequences in a larger transmission network, confirming its applicability to power systems with greater network scale.
To evaluate the solution accuracy and computational efficiency of the proposed method, the IEEE 39 bus and IEEE 118 bus power systems are solved using both the proposed method and the method based directly on duality theory. For each case, the objective value, number of C&CG iterations, and total computational time are recorded. A maximum computational time of 48 h is imposed. The comparative results are presented in Table 7, in which ‘-’ indicates that the corresponding result was not obtained because the method did not converge within the 48 h computational time limit.
As shown in Table 7, for the IEEE 39 bus power system, both the proposed method and the method based directly on duality theory obtain the same objective value of 4292.53 MW. This result indicates that the reformulation and linearization adopted in the proposed method do not change the optimal objective value of the original problem and can accurately reproduce its optimal solution. The proposed method completes the solution of the IEEE 39 bus power system in six C&CG iterations and requires 1287 s. In comparison, the method based directly on duality theory also obtains the optimal solution after six iterations but requires 18,142 s. Thus, the proposed method reduces the computational time by 16,855 s, corresponding to a reduction of 92.91%, and is approximately 14.10 times faster. For the IEEE 118 bus power system, the proposed method converges after 12 C&CG iterations and obtains an objective value of 1452.89 MW in 72,480 s. In contrast, the method based directly on duality theory does not complete the solution within the 48 h computational time limit. This result indicates that the direct method becomes difficult to solve within a practical time as the system scale and the number of feasible attack combinations increase, whereas the proposed method can still obtain a converged solution for the larger test system.
Overall, the proposed solution method preserves the optimal objective value while substantially reducing computational time. It also improves computational tractability and enables the coordinated attack strategy optimization model to be applied to larger transmission networks.

6. Conclusions

This paper develops a tri-level DAD optimization model for coordinated cyber–physical attack strategies considering defense resource allocation and emergency dispatch responses. The model jointly represents BTAs through compromised digital relays, direct physical attacks on transmission lines, cascading failure propagation, and emergency dispatch after attacks. A solution method integrating network flow modeling, duality theory, and the C&CG algorithm is developed. Case studies on the IEEE 39 bus and IEEE 118 bus power systems lead to the following conclusions: First, the proposed model can identify the most damaging coordinated cyber–physical attack strategy under the corresponding optimal defense resource allocation and quantify the resulting topology changes, cascading failure propagation, emergency dispatch, and final load shedding. Second, neglecting defense before attacks, cascading failure propagation, or the topological effects of BTAs changes the optimized attack targets and may lead to inaccurate estimates of maximum load shedding. Third, increasing defense resources forces the attacker to shift toward less-damaging targets, whereas increasing attack resources expands the feasible attack combinations and increases the resulting load shedding. Increasing the line overload threshold suppresses cascading propagation and reduces final load shedding while causing the attacker to place greater emphasis on damage during the initial failure stage. Fourth, the proposed solution method preserves the optimal objective value while substantially improving computational efficiency. These results demonstrate that the proposed model and solution method can effectively optimize coordinated cyber–physical attack strategies in transmission systems of different scales.

Author Contributions

Conceptualization, H.F. and H.Y.; methodology, H.F. and L.Y.; software, H.F.; validation, Y.C. and L.Y.; formal analysis, H.F.; investigation, H.F. and J.H.; resources, Y.L. and J.B.; data curation, H.F. and X.S.; writing—original draft preparation, H.F.; writing—review and editing, H.Y. and Z.L.; visualization, H.F.; supervision, H.Y.; project administration, J.H., Y.L., J.B., X.S. and Z.L. All authors have read and agreed to the published version of the manuscript.

Funding

This research was funded by the Science and Technology Project of China Southern Power Grid Company, grant number 036100KC23110012 (GDKJXM20231178).

Data Availability Statement

The original contributions presented in the study are included in the article, further inquiries can be directed to the corresponding author.

Conflicts of Interest

Authors Jinhua Huang, Yuhao Liu, Jikai Bi and Xudong Song were employed by the company Electric Power Research Institute of Guangdong Power Grid Co., Ltd. The remaining authors declare that the research was conducted in the absence of any commercial or financial relationships that could be construed as a potential conflict of interest. The authors declare that this study received funding from the Science and Technology Project of China Southern Power Grid Company. The funder had the following involvement with the study: investigation, provision of resources, data curation, and project administration through its affiliated authors.

Nomenclature

nIndex of buses or substations
lIndex of transmission lines
gIndex of generators
dIndex of loads
pIndex of cascading failure stages
tIndex of C&CG iterations
kIndex of generated attack strategies
E(l)Set of terminal substations connected to line l
C(g)Substation connected to generator g
S(g)Set of lines connected to generator bus g
S(d)Set of lines connected to load bus d
V ^ ( t ) Set of attack strategies generated by iteration t
N n , N l , N g , N d Numbers of substations, lines, generators, and loads
S c y b , S p h y Cyber- and physical-defense budgets
N, LBTA and physical attack budgets
b l Susceptance of line l
f l max Overload tripping threshold of line l
θ max Maximum allowable voltage angle
P g min , P g max Lower and upper output limits of generator g
P g , 0 G Initial output of generator g
P d , 0 D Initial demand of load d
ε Convergence tolerance of the C&CG algorithm
s n , s l Cyber protection and physical hardening decisions
v n , v l BTA and physical line attack decisions
w l , w g BTA-induced line and generator operating states
o l , p Operating state of line l at cascading stage p
r l , p Overload tripping state of line l at stage p
ω g , p , ρ d , p Generator and load connection states
f l , p , θ n , p Line flow and bus angle during cascading propagation
P g , p G , P d , p D Generator output and connected demand at stage p
P G , P G Emergency redispatch and load-shedding vectors
η Maximum load shedding represented in the master problem
L B , U B Lower and upper bounds of the C&CG algorithm

References

  1. Liu, R.; Vellaithurai, C.; Biswas, S.S.; Gamage, T.T.; Srivastava, A.K. Analyzing the cyber-physical impact of cyber events on the power grid. IEEE Trans. Smart Grid 2015, 6, 2444–2453. [Google Scholar] [CrossRef]
  2. Ye, Y.; Wu, Y.; Hu, J.; Hu, H.; Qian, S.; Zhang, X.; Wang, Q.; Strbac, G. Physics-guided safe policy learning with enhanced perception for real-time dynamic security constrained optimal power flow. J. Mod. Power Syst. Clean. Energy 2025, 13, 1507–1519. [Google Scholar]
  3. Zhang, H.; Liu, B.; Wu, H. Smart inverter enabled meter encoding for detecting false data injection attacks in distribution system state estimation. J. Mod. Power Syst. Clean. Energy 2025, 13, 1776–1786. [Google Scholar]
  4. Zhou, M.; Liu, C.; Abiri Jahromi, A.; Kundur, D.; Wu, J.; Long, C. Revealing vulnerability of N-1 secure power systems to coordinated cyber-physical attacks. IEEE Trans. Power Syst. 2023, 38, 1044–1057. [Google Scholar] [CrossRef]
  5. Chen, J.; Mohamed, M.A.; Dampage, U.; Rezaei, M.; Salmen, S.H.; Al Obaid, S.; Annuk, A. A multi-layer security scheme for mitigating smart grid vulnerability against faults and cyber-attacks. Appl. Sci. 2021, 11, 9972. [Google Scholar] [CrossRef]
  6. Li, Z.; Shahidehpour, M.; Alabdulwahab, A.; Abusorrah, A. Bilevel model for analyzing coordinated cyber-physical attacks on power systems. IEEE Trans. Smart Grid 2016, 7, 2260–2272. [Google Scholar] [CrossRef]
  7. Lai, K.; Illindala, M.; Subramaniam, K. A tri-level optimization model to mitigate coordinated attacks on electric power systems in a cyber-physical environment. Appl. Energy 2019, 235, 204–218. [Google Scholar] [CrossRef]
  8. Qin, C.; Zhong, C.; Sun, B.; Jin, X.; Zeng, Y. A tri-level optimal defense method against coordinated cyber-physical attacks considering full substation topology. Appl. Energy 2023, 339, 120961. [Google Scholar] [CrossRef]
  9. Wang, X.; Xue, F.; Lu, S.; Jiang, L.; Bompard, E.; Masera, M.; Wu, Q. Coordinated cyber-physical attack on power grids based on malicious power dispatch. Int. J. Electr. Power Energy Syst. 2024, 155, 109678. [Google Scholar] [CrossRef]
  10. Liu, Z.; Wang, L. Leveraging network topology optimization to strengthen power grid resilience against cyber-physical attacks. IEEE Trans. Smart Grid 2021, 12, 1552–1564. [Google Scholar] [CrossRef]
  11. Hasan, S.; Dubey, A.; Karsai, G.; Koutsoukos, X. A game-theoretic approach for power systems defense against dynamic cyber-attacks. Int. J. Electr. Power Energy Syst. 2020, 115, 105432. [Google Scholar] [CrossRef]
  12. Sapkota, A.; Karki, R. Multi-phase microgrid resiliency assessment framework against extreme weather events. Energy Convers. Econ. 2025, 6, 111–125. [Google Scholar] [CrossRef]
  13. Guo, Y.; Guo, C.; Yang, J. A tri-level optimization model for power systems defense considering cyber-physical interdependence. IET Gener. Transm. Distrib. 2023, 17, 1477–1490. [Google Scholar] [CrossRef]
  14. Yu, H.; Li, L.; Fang, H.; Huang, J.; Lin, Z.; Qi, D.; Yan, Y.; Chen, Y.; Wen, F. Resilience enhancement for cyber-physical power systems against physical deliberate attacks with spatial-temporal quantitative uncertainties. J. Mod. Power Syst. Clean. Energy 2026, 1–13, early access. [Google Scholar] [CrossRef]
  15. Qiu, S.; Shao, Z.; Wang, J.; Xu, S.; Fei, J. Research on power cyber-physical cross-domain attack paths based on graph knowledge. Appl. Sci. 2024, 14, 6189. [Google Scholar] [CrossRef]
  16. Kong, X.; Lu, Z.; Li, Y.; Guo, X.; Zhang, J.; Ding, S. Resilience-oriented defense strategy for power systems against uncertain malicious coordinated attacks. Appl. Energy 2025, 378, 124785. [Google Scholar] [CrossRef]
  17. Salmeron, J.; Wood, K.; Baldick, R. Analysis of electric grid security under terrorist threat. IEEE Trans. Power Syst. 2004, 19, 905–912. [Google Scholar] [CrossRef]
  18. Arroyo, J.M.; Galiana, F.D. On the solution of the bilevel programming formulation of the terrorist threat problem. IEEE Trans. Power Syst. 2005, 20, 789–797. [Google Scholar] [CrossRef]
  19. Motto, A.L.; Arroyo, J.M.; Galiana, F.D. A mixed-integer LP procedure for the analysis of electric grid security under disruptive threat. IEEE Trans. Power Syst. 2005, 20, 1357–1365. [Google Scholar] [CrossRef]
  20. Alguacil, N.; Delgadillo, A.; Arroyo, J.M. A trilevel programming approach for electric grid defense planning. Comput. Oper. Res. 2014, 41, 282–290. [Google Scholar] [CrossRef]
  21. Yuan, W.; Zhao, L.; Zeng, B. Optimal power grid protection through a defender-attacker-defender model. Reliab. Eng. Syst. Saf. 2014, 121, 83–89. [Google Scholar] [CrossRef]
  22. Fang, Y.; Sansavini, G. Optimizing power system investments and resilience against attacks. Reliab. Eng. Syst. Saf. 2017, 159, 161–173. [Google Scholar] [CrossRef]
  23. Ding, T.; Yao, L.; Li, F. A multi-uncertainty-set based two-stage robust optimization to defender-attacker-defender model for power system protection. Reliab. Eng. Syst. Saf. 2018, 169, 179–186. [Google Scholar] [CrossRef]
  24. Xiang, Y.; Wang, L. An improved defender-attacker-defender model for transmission line defense considering offensive resource uncertainties. IEEE Trans. Smart Grid 2019, 10, 2534–2546. [Google Scholar] [CrossRef]
  25. Wu, X.; Conejo, A.J. An efficient tri-level optimization model for electric grid defense planning. IEEE Trans. Power Syst. 2017, 32, 2984–2994. [Google Scholar] [CrossRef]
  26. Du, M.; Liu, X.; Zhou, Q.; Li, Z. Hybrid robust tri-level defense model against multiperiod uncertain attacks. IEEE Trans. Smart Grid 2022, 13, 3255–3265. [Google Scholar] [CrossRef]
  27. Ghorbani-Renani, N.; González, A.D.; Barker, K. A decomposition approach for solving tri-level defender-attacker-defender problems. Comput. Ind. Eng. 2021, 153, 107085. [Google Scholar] [CrossRef]
  28. Zeng, B.; Zhao, L. Solving two-stage robust optimization problems using a column-and-constraint generation method. Oper. Res. Lett. 2013, 41, 457–461. [Google Scholar] [CrossRef]
  29. Dong, Z.; Tian, M.; Tang, M.; Liang, J. Power generation allocation of cyber-physical power systems from a defense-attack-defense perspective. Int. J. Electr. Power Energy Syst. 2024, 156, 109690. [Google Scholar] [CrossRef]
  30. Hong, J.; Nuqui, R.F.; Kondabathini, A.; Ishchenko, D.; Martin, A. Cyber attack resilient distance protection and circuit breaker control for digital substations. IEEE Trans. Ind. Inform. 2019, 15, 4332–4341. [Google Scholar] [CrossRef]
  31. Poudel, S.; Ni, Z.; Malla, N. Real-time cyber physical system testbed for power system security and control. Int. J. Electr. Power Energy Syst. 2017, 90, 124–133. [Google Scholar] [CrossRef]
  32. Liu, S.; Mashayekh, S.; Kundur, D.; Zourntos, T.; Butler-Purry, K. A framework for modeling cyber-physical switching attacks in smart grid. IEEE Trans. Emerg. Top. Comput. 2014, 1, 273–285. [Google Scholar] [CrossRef]
  33. Liu, S.; Chen, B.; Zourntos, T.; Kundur, D.; Butler-Purry, K. A coordinated multi-switch attack for cascading failures in smart grid. IEEE Trans. Smart Grid 2014, 5, 1183–1195. [Google Scholar] [CrossRef]
  34. Yamashita, K.; Ten, C.-W.; Rho, Y.; Wang, L.; Wei, W.; Ginter, A. Measuring systemic risk of switching attacks based on cybersecurity technologies in substations. IEEE Trans. Power Syst. 2020, 35, 4206–4219. [Google Scholar] [CrossRef]
  35. Farraj, A.; Hammad, E.; Al Daoud, A.; Kundur, D. A game-theoretic analysis of cyber switching attacks and mitigation in smart grid systems. IEEE Trans. Smart Grid 2016, 7, 1846–1855. [Google Scholar] [CrossRef]
Figure 1. Mechanism of breaker-tripping attacks through compromised digital relays.
Applsci 16 07847 g001
Figure 2. Proposed tri-level DAD framework for coordinated cyber–physical attack strategy optimization.
Applsci 16 07847 g002
Figure 3. Flowchart of the proposed solution method.
Applsci 16 07847 g003
Figure 4. Cascading failure propagation under coordinated cyber–physical attacks. (a) Initial outage state after coordinated cyber–physical attacks. (b) Cascading outage propagation state after topology-flow updates.
Applsci 16 07847 g004
Figure 5. Sensitivity of worst-case attack consequences to cyber–physical-defense resource allocation.
Applsci 16 07847 g005
Table 1. Coordinated cyber–physical attack strategy optimization results for IEEE 39 bus power system.
Defense StrategyAttack StrategyInitial Outage LinesCascading Outage LinesFinal Load
Shedding
#22, #23
L28, L34, L38
#20, #24
L33, L36, L37, L39
L29, L32, L33, L34,
L36, L37, L38, L39
L1, L2, L3, L6, L7, L8,
L11, L12, L13, L15,
L16, L17, L18, L19,
L23, L24, L26, L42
4292.53 MW
Table 2. Comparison of optimized attack strategies under different methods.
MethodsDefense StrategyAttack StrategyCascading
Failures Triggered
Final Load
Shedding
CCP-DAD
(This Paper)
#22, #23
L28, L34, L38
#20, #24
L33, L36, L37, L39
Yes4292.53 MW
CAR-AD [4]-#20, #39
L5, L12, L18, L46
Yes4521.93 MW
SC-DAD [20]#22, #23
L28, L34, L38
#6, #30
L23, L33, L37, L46
No3484.50 MW
TA-DAD [7]L32, L34, L36, L37, L43L3, L6, L7, L30, L33, L46Yes3146.03 MW
Table 3. Defense resource sensitivity results with fixed attack resources.
Defense ResourcesDefense StrategyAttack StrategyFinal Load Shedding
(1, 2)#22
L28, L34
#20, #39
L9, L10, L30, L41
4351.30 MW
(2, 3)#22, #23
L28, L34, L38
#20, #24
L33, L36, L37, L39
4292.53 MW
(3, 4)#20, #22, #23
L28, L29, L34, L38
#19, #24
L32, L33, L36, L39
3826.70 MW
(4, 5)#20, #22, #23, #24
L28, L29, L33, L34, L38
#19, #29
L1, L7, L9, L12
3384.25 MW
Table 4. Attack resource sensitivity results with fixed defense resources.
Attack ResourcesDefense StrategyAttack StrategyFinal Load Shedding
(0, 3)#20, #24
L12, L28, L38
L33, L36, L392864.80 MW
(1, 4)#20, #24
L28, L37, L38
#22
L33, L34, L36, L39
3587.45 MW
(2, 4)#22, #23
L28, L34, L38
#20, #24
L33, L36, L37, L39
4292.53 MW
(3, 5)#20, #22
L28, L33, L38
#19, #23, #24
L32, L34, L36, L37, L39
5038.90 MW
Table 5. Sensitivity results under different line overload threshold coefficients.
Line Threshold CoefficientDefense StrategyAttack StrategyCascading Outage LinesFinal Load
Shedding
0.9#22, #24
L28, L37, L38
#23, #35
L29, L32, L33, L34
L1, L3, L4, L7, L10, L11, L13,
L15, L16, L20, L22, L27, L30,
L36, L37, L38, L39, L40, L41,
L42, L43, L44, L45, L46
4622.83 MW
1.0#22, #23
L28, L34, L38
#20, #24
L33, L36, L37, L39
L1, L2, L3, L6, L7, L8, L11,
L12, L13, L15, L16, L17, L18,
L19, L23, L24, L26, L42
4292.53 MW
1.1#22, #23
L28, L34, L38
#20, #39
L7, L9, L10, L41
L2, L6, L11, L23, L27, L29,
L31, L33, L35, L44
3954.23 MW
Table 6. Coordinated cyber–physical attack strategy optimization results for IEEE 118 bus power system.
Defense StrategyAttack StrategyInitial Outage LinesCascading
Outage Lines
Final Load
Shedding
#30, #69, #80
L8, L30, L104, L183, L184
#54, #65, #92
L36, L38, L51, L98, L123, L141
L36, L38, L51, L65, L74,
L75, L76, L77, L96, L98,
L99, L102, L113, L118,
L119, L120, L123, L141
L21, L31, L66, L67,
L68, L71, L97, L127,
L134, L163
1452.89 MW
Table 7. Comparison of convergence, solution accuracy and computational efficiency.
SystemSolution MethodNumber of IterationsObjective Function Value (MW)Computational Time (s)
IEEE 39 bus power systemthe proposed method64292.531287
duality theory64292.5318,142
IEEE 118 bus power systemthe proposed method121452.8972,480
duality theory---
Disclaimer/Publisher’s Note: The statements, opinions and data contained in all publications are solely those of the individual author(s) and contributor(s) and not of MDPI and/or the editor(s). MDPI and/or the editor(s) disclaim responsibility for any injury to people or property resulting from any ideas, methods, instructions or products referred to in the content.