Article

Characterization of Hydraulic Fracture–Natural Fracture Coupling and Stimulation Effects in a Tight Oil Reservoir Using Core CT

1
Exploration and Development Research Institute, PetroChina Changqing Oilfield Company, Xi’an 710018, China
2
National Engineering Laboratory for Exploration and Development of Low-Permeability Oil & Gas Fields, Xi’an 710018, China
3
College of Geosciences, Yangtze University, Wuhan 430100, China
4
Hubei Key Laboratory of Complex Shale Oil & Gas Geology and Development in Southern China, Wuhan 430100, China
5
Hubei Engineering Research Center of Unconventional Oil and Gas Geology and Engineering, Wuhan 430100, China
*
Author to whom correspondence should be addressed.
Appl. Sci. 2026, 16(15), 7767; https://doi.org/10.3390/app16157767
Submission received: 17 June 2026 / Revised: 21 July 2026 / Accepted: 31 July 2026 / Published: 4 August 2026

Abstract

Direct core-scale evidence remains insufficient for evaluating hydraulic fracture–natural fracture coupling and stimulation effectiveness in tight sandstone oil reservoirs. In this study, post-fracturing full-diameter cores from the Chang 81 tight oil reservoir in the Xi 119 well block, Xifeng Oilfield, Ordos Basin, were investigated using core observation, computed tomography (CT) scanning, fracture-source evidence and three-dimensional fracture-network reconstruction. A total of 87.56 m of core from 11 core runs was scanned at a voxel size of 50.62 μm. Natural fractures, hydraulic fractures and engineering-induced fractures were identified and distinguished based on fracture-surface features, CT expression, spatial continuity, proppant/tracer evidence and their relationship with bedding and lithological boundaries. The results show that lithological structure exerts a first-order control on hydraulic-fracture surface morphology. Massive sandstone tends to generate straight and continuous high-conductivity main fractures, argillaceous laminated sandstone promotes bedding-controlled discontinuous fractures with limited connectivity, and cross-bedded sandstone favors fracture diversion, branching and natural-fracture activation. Based on fracture assemblage, spatial connectivity and seepage behavior, three hydraulic fracture–natural fracture coupling types were classified: single hydraulic-fracture type, single main fracture–diverted fracture–natural fracture type, and dual main fractures–diverted fractures–natural fractures type. Their equivalent permeability increases stepwise from 155 mD to 345 mD and 586 mD, respectively, indicating a positive relationship between fracture-network complexity and seepage capacity. A CT-derived stimulation-effect evaluation framework was further established by integrating pore–fracture structural modification, fracture volume increase, aperture improvement and seepage-capacity enhancement. The dual main fractures–diverted fractures–natural fractures type shows the strongest stimulation response, with the largest reduction in small-aperture pore/fracture proportion, the greatest lamina-fracture aperture enlargement and the most significant permeability improvement. These results provide direct core-scale evidence for understanding fracture-network formation in continental tight sandstone reservoirs and support more targeted hydraulic-fracturing design and stimulation-effect evaluation.

1. Introduction

Horizontal drilling and multistage hydraulic fracturing have fundamentally changed the development mode of unconventional oil and gas reservoirs. Since the large-scale development of shale gas, shale oil and tight oil in North America, a relatively mature technical system has been formed, including long horizontal laterals, dense perforation clustering, high-intensity stimulation, microseismic monitoring, stimulated reservoir volume evaluation and production-response analysis [1,2,3,4,5]. However, the geometry, connectivity and conductivity of hydraulic fractures are still difficult to determine accurately only by indirect methods such as microseismic interpretation, production logging, tracer response and numerical simulation [4,5,6,7,8]. Post-fracturing coring from hydraulic fracturing test sites provides direct physical evidence for identifying hydraulic fractures, natural fractures, drilling-induced fractures and proppant distribution. Studies from the Midland Basin, Delaware Basin and other North American test sites have shown that core observation combined with computed tomography (CT) scanning can directly reveal fracture morphology, fracture swarms, fracture–bedding interaction, fracture reactivation and the actual complexity of stimulated fracture networks [6,7,8,9,10]. In recent years, advances in digital rock physics have extended CT-based fracture characterization from qualitative description to quantitative parameter extraction. High-resolution micro-CT imaging has been applied to quantify fracture aperture, spatial topology and connectivity in tight sandstones at the micrometer scale, and full-sample CT analysis workflows have been developed to characterize geometric attributes of induced fractures under different stress conditions [11,12].
Meanwhile, machine learning and deep learning algorithms (e.g., U-Net architectures and hybrid deep learning frameworks) have been gradually introduced to CT image segmentation and automatic fracture identification, significantly improving processing efficiency for large-volume CT datasets [13,14]. However, for post-fracturing core samples with complex fracture genesis and strong sedimentary heterogeneity, manual interpretation combined with multi-source geological evidence (core observation, proppant tracing, stress direction calibration) is still the mainstream scheme for reliable fine fracture characterization, purely data-driven AI methods still face challenges in distinguishing fractures from sedimentary interfaces in heterogeneous continental sandstones, and thus manual interpretation constrained by multi-source geological evidence remains the mainstream for reliable post-fracturing fracture characterization. This study adopts this semi-automatic workflow to ensure both processing efficiency and geological accuracy.
These studies indicate that physical core evidence is indispensable for reducing the uncertainty of fracture-network interpretation and for calibrating hydraulic-fracturing models.
On the basis of North American experience, China has gradually developed reservoir-specific stimulation technologies for continental and structurally complex unconventional reservoirs. Compared with many marine shale reservoirs in North America, Chinese unconventional reservoirs commonly show stronger lithological variability, more complex sedimentary stacking, stronger mechanical heterogeneity and more pronounced stress–fracture interaction [15,16,17]. In shale gas reservoirs, the Fuling shale gas field has promoted three-dimensional development technology, post-fracturing coring and fracture-network evaluation for vertically superposed shale gas reservoirs [18,19]. In continental shale oil reservoirs, the Chang 7 Member of the Ordos Basin and the Gulong shale oil reservoir of the Songliao Basin have promoted sweet-spot optimization, long-horizontal-well volume fracturing, dense fracture cutting, bedding-controlled stimulation, proppant-placement analysis and well-cluster development [20,21,22,23,24,25]. In tight conglomerate reservoirs, field experiments and mechanism studies from the Mahu Sag have focused on multi-cluster fracture initiation, fracture propagation through strongly heterogeneous conglomerates and optimization of fracturing design under gravel-controlled heterogeneity [26,27,28,29]. These studies show that China has not simply copied the North American model; rather, it has inherited and extended hydraulic-fracturing technologies in continental shale gas, shale oil and tight conglomerate reservoirs according to reservoir type and geological conditions. For tight sandstone reservoirs, recent studies have made progress in stimulated reservoir volume (SRV) quantification based on microseismic interpretation, production data inversion and numerical simulation.
For instance, a material-balance-based SRV evaluation framework has been proposed for naturally fractured unconventional reservoirs, which comprehensively considers natural fracture development, stress effects and fracturing fluid imbibition [30].
For continental tight sandstone reservoirs in the Ordos Basin, SRV has been widely recognized as the core target of volume fracturing, but these indirect evaluation methods still have large uncertainty in characterizing the internal structure and actual conductivity of fracture networks [31]. Most existing SRV models are calibrated by production data rather than direct core observations, leading to large uncertainty in internal fracture conductivity characterization. The core-scale quantitative data obtained in this study can provide direct calibration parameters for SRV evaluation of continental tight sandstones. Nevertheless, direct core-based characterization of post-fracturing fracture networks remains insufficient for tight sandstone oil reservoirs. Tight sandstone reservoirs of the Yanchang Formation in the Ordos Basin are generally characterized by low porosity, low permeability, strong lithological heterogeneity, complex diagenetic modification and locally developed natural fractures [32,33,34,35]. Staged fracturing of horizontal wells is therefore necessary for economic development, but the evaluation of stimulation effectiveness still largely depends on indirect monitoring data, production response and numerical simulation [36]. In particular, the following issues remain insufficiently constrained by full-diameter core evidence: how lithological-structure controls hydraulic-fracture surface morphology, how newly generated hydraulic fractures couple with pre-existing natural fractures, and how fracture-network architecture is transformed into seepage capacity. The lack of direct core-scale evidence limits the conversion of qualitative fracture descriptions into quantitative parameters that can support perforation-cluster design, fracture-network regulation and well-pattern optimization. Previous fracture-network classification schemes are mostly established based on numerical simulation, outcrop observation or microseismic data, which cannot directly reflect the actual coupling state of hydraulic and natural fractures at the core scale. Different from existing studies, this work constructs a classification system of hydraulic fracture–natural fracture coupling based on direct post-fracturing full-diameter core CT data from the Chang 8 tight reservoir, and establishes a quantitative causal chain from lithological structure to coupling type and then to stimulation effect. The proposed classification is further supported by pore-scale permeability simulation results, providing measurable geological parameters for fracturing design optimization. Different from existing classification schemes mostly derived from numerical simulation or indirect monitoring, this study establishes a core-scale coupling classification system with quantitative permeability constraints, which is more applicable to continental tight sandstones with strong lithological heterogeneity.
In this study, post-fracturing full-diameter cores from the Chang 81 tight sandstone oil reservoir in the Xi 119 well block of Xifeng Oilfield, Ordos Basin, are used to characterize complex fracture networks and evaluate hydraulic-fracturing effects based on core CT scanning. The objectives are to: (1) identify natural fractures, hydraulic fractures and engineering-induced fractures using core observation, CT images and fracture-source evidence; (2) clarify the control of lithological structure on hydraulic-fracture surface morphology and fracture-network complexity; (3) establish a classification scheme for hydraulic fracture–natural fracture coupling based on fracture assemblage, spatial connectivity and seepage behavior; and (4) develop a CT-derived stimulation-effect evaluation framework integrating pore–fracture structural modification, fracture volume increase, aperture improvement and equivalent seepage capacity. This study provides direct core-scale evidence for understanding fracture-network formation in continental tight sandstone oil reservoirs and offers a geological basis for optimizing hydraulic-fracturing design and stimulation-effect evaluation.

2. Materials and Methods

2.1. Study Area and Core Material

The Xi 119 well block is located in the southern Tianhuan Depression on the southwestern margin of the Ordos Basin, China. Tectonically, the study area lies within a gentle west-dipping monocline with an average stratigraphic dip of 1–3°; only low-amplitude nose-like structures develop locally, and no large-scale faults or folds are developed in the Triassic Yanchang Formation target interval. The Chang 81 tight sandstone reservoir was deposited in a delta front environment, with widely developed bedding and lamina structures that form the main natural weak planes in the reservoir.
Regionally, the Yanchang Formation has undergone multi-phase tectonic adjustments: the Indosinian movement controlled the sedimentary and diagenetic process, the Yanshanian movement was the main period of regional tectonic fracture formation, and the Himalayan movement further adjusted the present in situ stress field. The present-day stress regime is characterized by a strike-slip state (σ_H > σ_v > σ_h), with the maximum horizontal principal stress oriented at approximately N70° E, which is consistent with the dominant propagation direction of hydraulic fractures in this area. The above regional geological background provides the basic geological framework for natural fracture development and hydraulic fracture propagation. This study focuses on the characterization of hydraulic fracture–natural fracture coupling and post-fracturing stimulation effects, and does not further discuss the genetic relationship between tectonic evolution and natural fracture development.
The post-fracturing coring well was arranged within the hydraulic-fracturing test area of the Xi 119 well block. As shown in Figure 1b, the coring well Xi119–19–39H, referred to as Well 3 in the field layout, was deployed between two adjacent fractured horizontal wells, Xi119–20–38X and Xi119–20–39X, referred to as Well 2 and Well 4, respectively. The horizontal section of Well 3 is 480 m long, with an azimuth of 231.7°. Its heel and toe sections were designed to approach the expected fracture-propagation zones of the adjacent fractured wells, allowing the recovered cores to capture hydraulic fractures, diverted fractures, reactivated natural fractures and adjacent intervals with weaker fracture development.
The well-spacing relationship in Figure 1b shows that Well 3 is asymmetrically positioned relative to Wells 2 and 4. Along the maximum horizontal stress direction, the distance between Well 3 and Well 2 is approximately 150 m, whereas the distance between Well 3 and Well 4 is approximately 80 m. The corresponding perpendicular distances between the horizontal sections are about 80 m and 30 m, respectively. This asymmetric layout was designed to obtain fracture-network information at different distances from the fractured wells and to improve the chance of intersecting hydraulically induced fracture systems within the recovered core. As a result, the coring well provides both geological evidence for fracture-network interpretation and an engineering reference for evaluating the effectiveness of the fracturing design.
A total of 223.57 m of full-diameter core was recovered from Well 3. Among these cores, 11 core runs from the Chang 81 interval were selected for full-diameter CT scanning, including core runs 4, 6, 8, 9, 13, 17, 18, 21, 22, 24 and 25. The scanned intervals range from 2557.10 to 2834.48 m, with a cumulative scanned length of 87.56 m and a voxel size of 50.62 μm (Table 1). These core materials cover both fracture-bearing intervals and adjacent intervals with relatively weak fracture development, thereby supporting the subsequent CT-based fracture identification, hydraulic fracture–natural fracture coupling classification and stimulation-effect evaluation.

2.2. Core CT Scanning and Image Processing

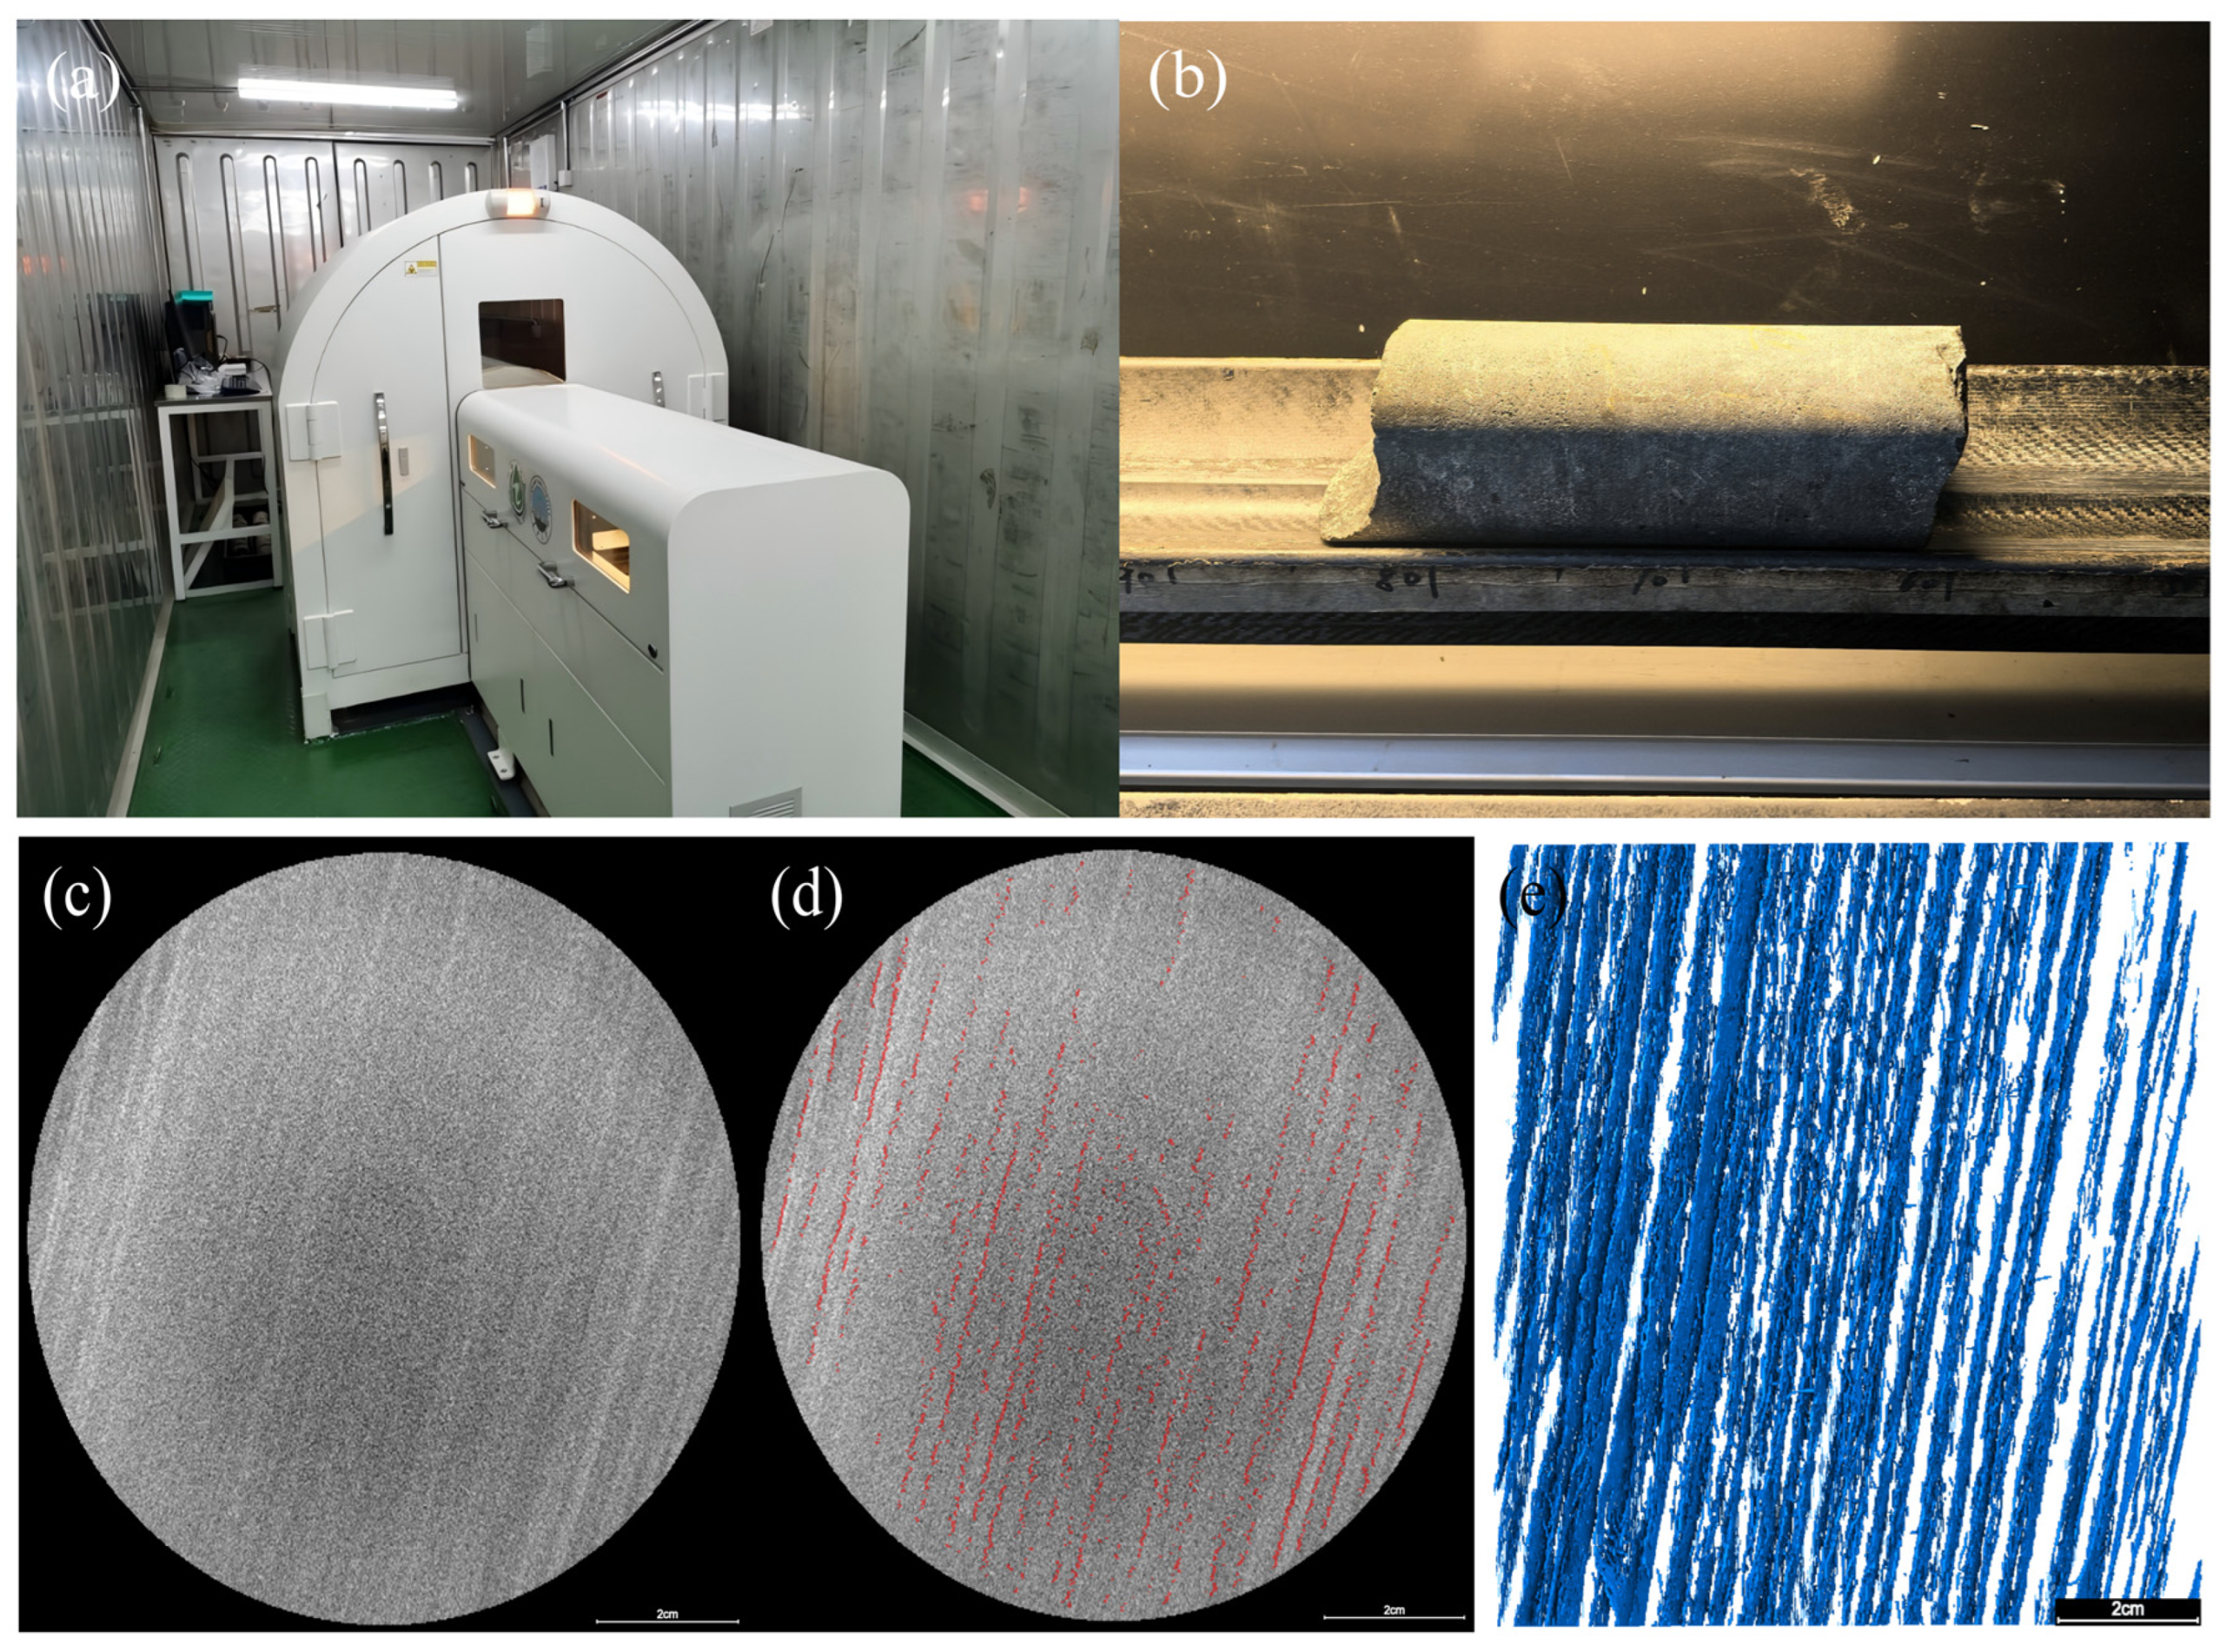
Full-diameter core CT scanning was performed using an industrial X-ray CT system (Geoscan-200, Tianjin Sanying Precision Instruments Co., Ltd., Tianjin, China) with a spatial resolution of 50.62 μm. The scanning was conducted in continuous helical mode, and the reconstructed 16-bit grayscale images cover the full diameter of the core samples. Key scanning parameters are summarized in Table 1, and the scanning system and workflow are shown in Figure 2.
Fracture identification from grayscale CT images is based on the density difference between fracture space and rock matrix: fractures and pores are filled with air or low-density residual fluid, showing significantly lower CT values (Hounsfield Units, HU) than the dense sandstone matrix. For the studied Chang 81 tight sandstone samples, the grayscale distribution presents clear zoning corresponding to different components:
Dense sandstone matrix: approximately 2200–2800 HU, with quartz and feldspar grains showing the highest grayscale values; argillaceous components and laminae: approximately 1200–1800 HU, lower than sandy matrix due to higher clay content; pores, fractures and vugs: below 900 HU, forming distinct low-grayscale linear or banded anomalies in the images.
The segmentation threshold was determined through a two-step workflow of automatic calculation and geological calibration. First, the Otsu algorithm was applied to automatically calculate the optimal grayscale boundary between matrix and pore–fracture space, yielding an initial threshold of approximately 900 HU. Second, manual geological calibration was carried out by matching CT slices with core observation results: for each core run, 5–8 typical fracture intervals identified on core surfaces were selected to verify and locally adjust the threshold, ensuring that the interpreted fracture traces on CT images are consistent with the actual fracture occurrence, continuity and cross-cutting relationships observed on the core. Interfaces with low grayscale but continuous bedding-parallel distribution were further distinguished as bedding planes rather than open fractures according to their geological occurrence.
This semi-automatic interpretation workflow ensures that the threshold selection is not only statistically optimal but also geologically reasonable, avoiding misidentification of diagenetic bands and argillaceous laminae as effective fractures.
Image processing and three-dimensional reconstruction were performed using Dragonfly (version 2022.2.0.1367; Object Research Systems (ORS) Inc., Montreal, QC, Canada) and PerGeos (version 2020.1; Thermo Fisher Scientific, Grenoble, France). After CT scanning, the reconstructed image stacks were checked against the core-run depths and core photographs to ensure depth consistency. The image interpretation was then conducted at both slice and volume scales. At the slice scale, linear, curvilinear or branching grayscale discontinuities were examined according to their continuity, width expression, relationship with bedding and connection with adjacent fractures. At the volume scale, interpreted fracture segments were traced in three dimensions to clarify their spatial extension, intersection relationship and connectivity. Bedding, laminae and lithological boundaries were also recorded because these features may control hydraulic-fracture diversion, natural-fracture reactivation and local fracture-network complexity.
The CT interpretation included four groups of information: image processing and three-dimensional reconstruction; conventional pore–fracture–cavity and porosity interpretation; sedimentary-structure interpretation, including bedding and lamina-density characteristics; and reservoir-structure interpretation, including CT-resolvable pore–fracture size classes and lamina-fracture features. These interpreted data were used in the following sections to distinguish natural fractures, hydraulic fractures and engineering-induced fractures, and to establish the hydraulic fracture–natural fracture coupling types.
Regarding the uncertainty caused by the voxel size of 50.62 μm, the minimum reliably quantifiable fracture aperture is 1 voxel (i.e., ~50.6 μm). For fractures with apertures larger than 3 voxels (~150 μm), the relative measurement error of aperture is less than 10%; for fractures with apertures between 1 and 3 voxels, the relative error increases to 15–25%. Since the main hydraulic fractures and dominant fracture channels in this study are mostly larger than 150 μm, the voxel-resolution uncertainty has limited impact on the overall permeability evaluation and coupling type classification. A sensitivity analysis was conducted by artificially adjusting the fracture aperture threshold within the measurement error range and recalculating the equivalent permeability of each coupling type. The results show that a ±20% variation in fracture aperture leads to a 12–18% change in equivalent permeability, which does not alter the stepwise-increasing trend of permeability from Type I to Type III. The voxel size of 50.62 μm defines the effective scale of the CT-based interpretation. Therefore, fractures or lamina-related discontinuities smaller than the voxel scale were not treated as independently quantified CT apertures. Such features were used only when they were supported by core-surface observations, fracture-surface characteristics or fracture-source evidence. Accordingly, the quantitative analysis in this study focuses on core-scale fractures and CT-resolvable pore–fracture structures, while sub-voxel microfractures are discussed only as auxiliary qualitative evidence.

2.3. Fracture Identification and Source Determination

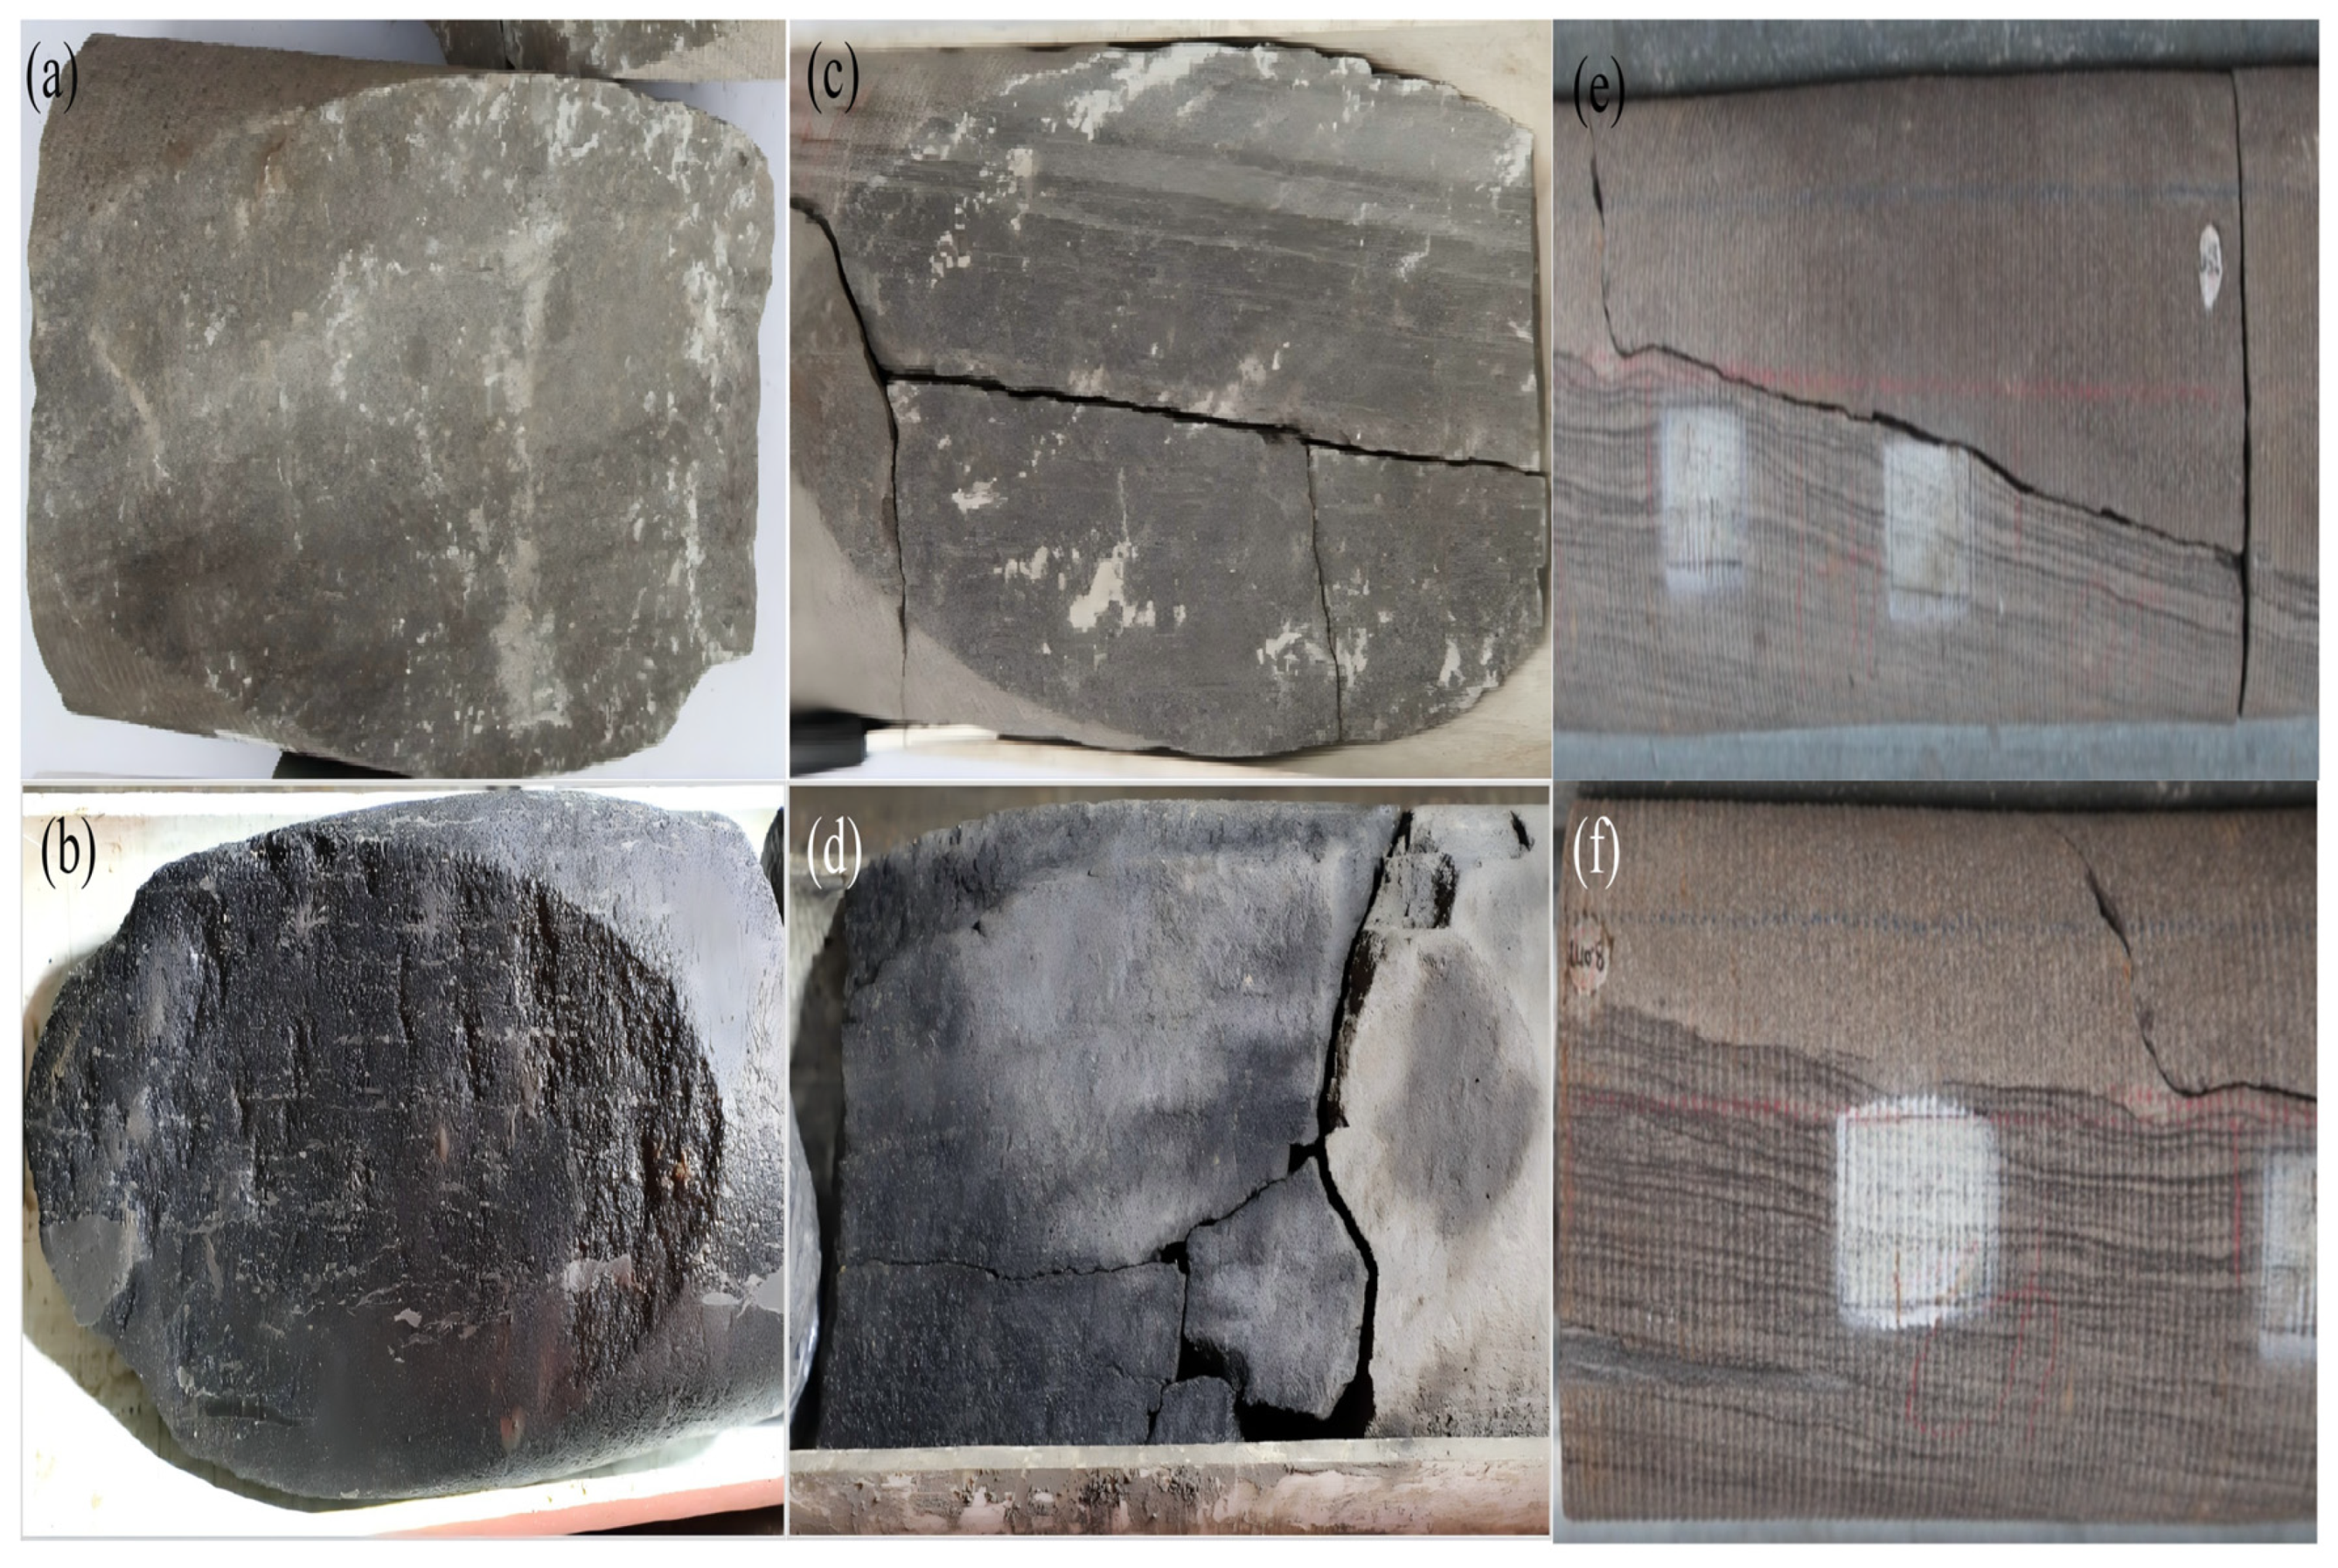
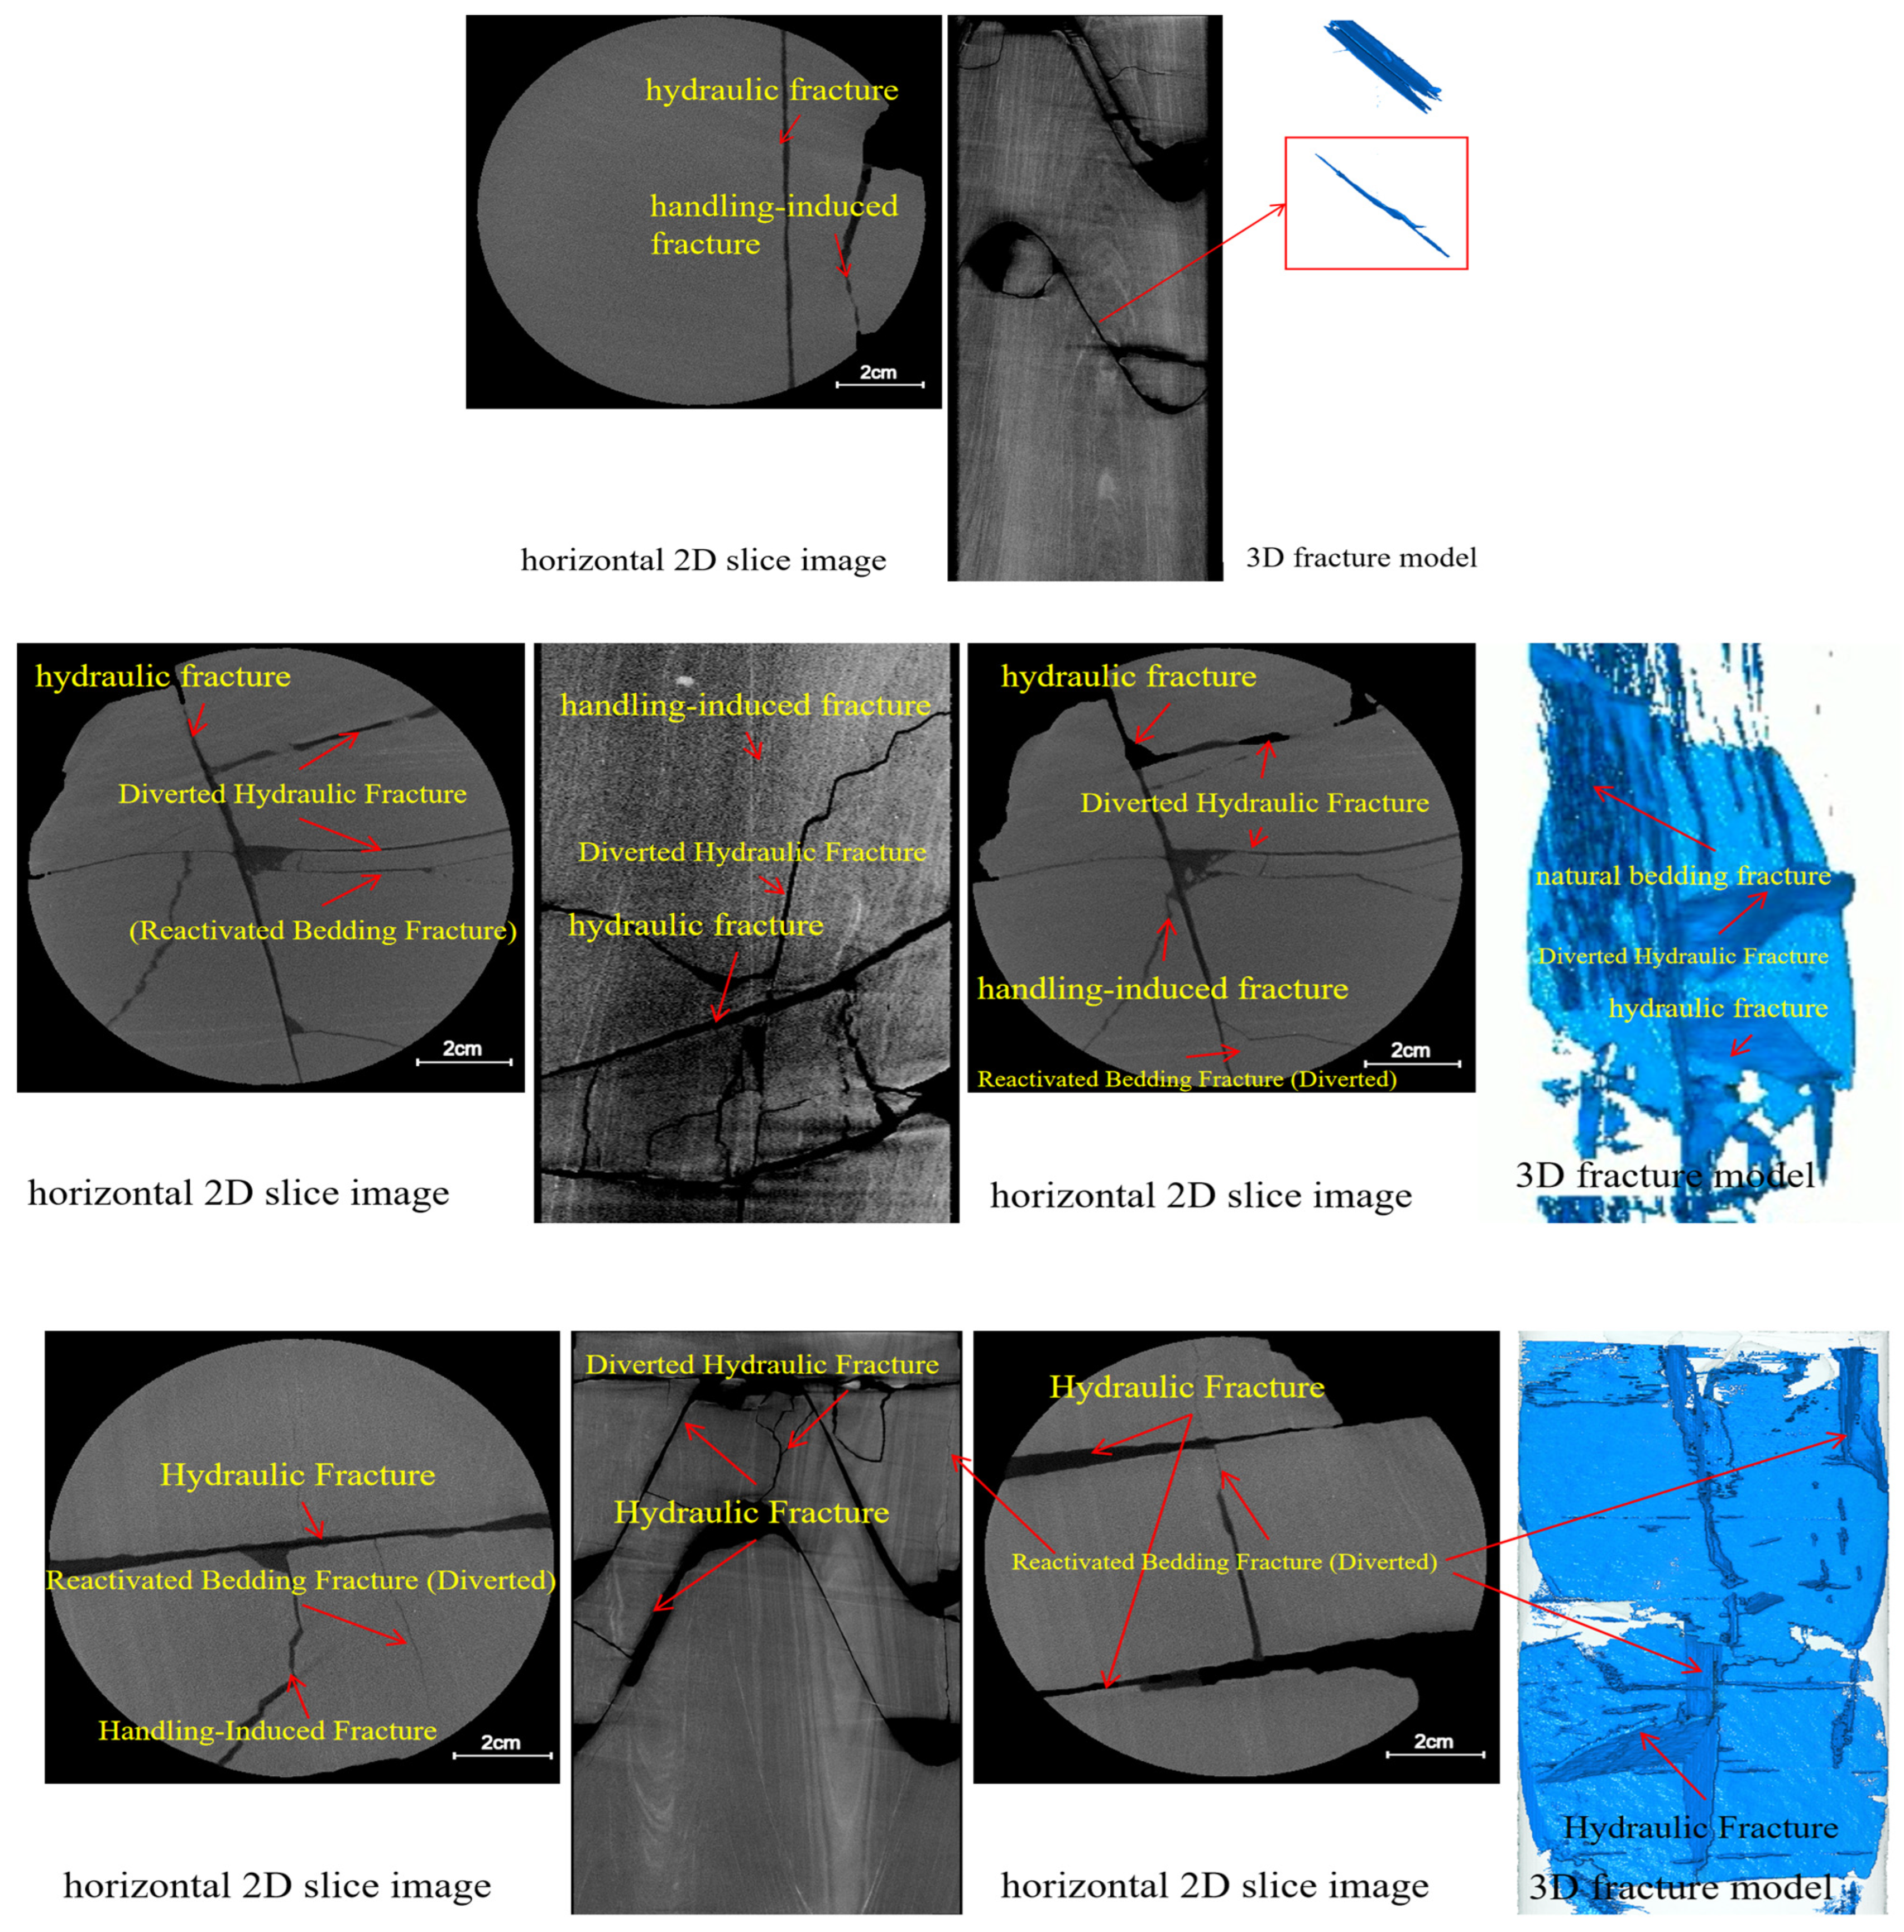
Fracture identification was carried out by integrating core observation, CT image interpretation, fracture-surface characteristics and field source-tracing evidence. Representative core-scale fracture features used for source determination are shown in Figure 3. Fresh tensile fracture surfaces, rough and uncemented fracture walls, fracture traces cutting bedding, bedding or lamina-parallel discontinuities, and short disturbance-related fractures were compared before each interpreted fracture segment was assigned to a genetic category. To ensure consistency in fracture identification, three key descriptive terms used for hydraulic fracture recognition are defined as follows:
Fresh tensile surfaces: Unweathered, uncemented fracture walls formed by hydraulic tensile failure, characterized by a rough, mineral-fresh morphology without secondary filling of calcite, bitumen or clay coating, which distinguishes them from filled or altered natural fracture surfaces. Large aperture: Fractures with an effective width greater than 150 μm measured on CT images, corresponding to the dominant flow channels in the fracture network. Strong continuity: Fractures with an uninterrupted extension length greater than 50 cm at the core scale, without significant interruption or offset by lithological interfaces or argillaceous laminae.
On the basis of these observations, fractures in the post-fracturing cores were divided into three major categories: natural fractures, hydraulic fractures and engineering-induced fractures. Natural fractures include tectonic fractures, bedding/lamina fractures and diagenetic shrinkage fractures. Hydraulic fractures include main hydraulic fractures, diverted fractures and reactivated fractures. Engineering-induced fractures mainly include drilling-induced fractures and, where identifiable, handling- or operation-related secondary fractures. The detailed identification criteria, including key evidence, CT expression, geometric characteristics and network role, are summarized in Table 2.
Natural fractures were identified mainly from inherited geological features. Tectonic fractures are commonly characterized by slickensides, cement or bitumen filling, relatively stable attitudes and occurrence directions consistent with the regional fracture trend. Bedding and lamina fractures are controlled by sedimentary structures and commonly develop along bedding or laminae. Diagenetic shrinkage fractures are generally smaller, more irregular and less continuous. On CT images, these fractures were interpreted according to their gray-value contrast, attitude, continuity and relationship with bedding or laminae. These image features were checked against fracture-surface characteristics on the core whenever possible.
Hydraulic fractures were distinguished from natural fractures by their fresh tensile surfaces, relatively large aperture expression, stronger continuity and spatial relationship with the expected hydraulic-fracture propagation direction. Main hydraulic fractures commonly form the principal conductive pathways after stimulation. Diverted fractures were interpreted where the main fracture changed direction along bedding, lithologic interfaces, natural fractures or local stress perturbations. Reactivated fractures were identified where pre-existing natural fractures were reopened or enlarged during hydraulic fracturing; such fractures usually inherit the original fracture attitude but show increased aperture, enhanced CT contrast or a clearer connection with hydraulic fractures.
Source determination of hydraulic fractures did not rely on CT morphology alone. Proppant particle size, proppant color, tracer response, microseismic interpretation and the spatial relationship between the coring well and adjacent fractured wells were jointly considered. When proppant or tracer evidence occurred in the same interval as a CT-recognized fracture, and when the fracture attitude was consistent with the main hydraulic-fracture propagation direction, the fracture was interpreted as a hydraulic fracture or a hydraulically reactivated fracture. This multi-evidence procedure reduced the uncertainty that would arise if hydraulic fractures were identified only from CT gray-value anomalies.
Engineering-induced fractures were screened out before fracture-network evaluation. These fractures are commonly short, local and closely related to drilling disturbance, core handling or borehole stress release. Their orientation may differ from the regional natural-fracture trend and from the expected hydraulic-fracture direction. Therefore, a three-step screening procedure was adopted to exclude engineering-induced fractures: (1) eliminate all fractures within 5 cm of the core surface and core ends, which are prone to stress release damage; (2) reject fractures with orientations deviating by more than 30° from the regional natural-fracture trend and the expected hydraulic-fracture propagation direction (N70° E); (3) exclude discontinuous, short-length (<10 cm) fractures without clear connection to main hydraulic fractures or natural fractures. Only fractures passing all three screening criteria were included in the effective hydraulic fracture–natural fracture coupling analysis. These screening criteria are widely adopted in post-fracturing core fracture characterization studies and can effectively distinguish drilling-induced mechanical damage from geological fractures.

2.4. Equivalent Permeability Simulation

Three-dimensional digital core models reconstructed from CT data were used to calculate equivalent permeability via the lattice Boltzmann method (LBM).

2.4.1. Simulation Settings

The D3Q19 LBM model was adopted for single-phase incompressible laminar flow simulation. A constant pressure difference of 2 MPa was applied along the core axial direction (parallel to the maximum horizontal stress direction) as the driving force, and all side boundaries were set as no-flow walls. The simulated fluid had a viscosity of 1 mPa·s, consistent with crude oil viscosity under reservoir conditions. The convergence criterion was defined as a relative change in the velocity field of less than 10−6 between adjacent iteration steps.
Simulations were performed on selected representative intervals rather than the entire scanned section, to balance computational efficiency and geological representativeness. For each coupling type, three core intervals with lengths of 40–50 cm were selected according to typical fracture development characteristics, and the arithmetic average of the three results was taken as the representative equivalent permeability of the type.

2.4.2. Method Validation and Limitations

The LBM-based permeability simulation method has been widely verified in digital rock physics studies. For tight sandstone samples, LBM results generally show a relative error of less than 15% compared with core flooding measurements, which is acceptable for comparative analysis between different fracture types.
In this study, no direct core flooding experiments were conducted on post-fracturing cores, due to sample integrity requirements and the risk of proppant displacement during testing. The permeability values reported are therefore numerical simulation results, used primarily for comparative analysis among coupling types rather than as absolute reservoir parameters. The relative trend of permeability across the three types is robust and not affected by deviations in absolute values.

3. Results

3.1. Fracture Identification from Core CT and Lithological-Structure Controls on Hydraulic Fracture Surfaces

Based on post-fracturing full-diameter core samples from the Xi 119 well block, a multi-scale fracture identification workflow was established by integrating core description, high-resolution CT scanning, and proppant tracing. Three types of genetic fractures are developed in the post-fracturing cores in the study area: natural fractures (including tectonic fractures, bedding fractures and diagenetic shrinkage fractures), hydraulically induced fractures (including main fractures, diverted fractures and reactivated fractures) and engineering-induced fractures generated during drilling and coring.
Statistical results show that bedding fractures account for the highest proportion (about 62%) among all fractures, which is consistent with the classification statistics in Table 2 and forms the basis for the coupling between hydraulic fractures and natural fractures. Hydraulic main fractures constitute the backbone of the fracture network, diverted fractures play a role in bridging main fractures and natural fractures, and reactivated fractures, as the product of natural fractures reopening during fracturing, are the key nodes for effective coupling of the fracture network.
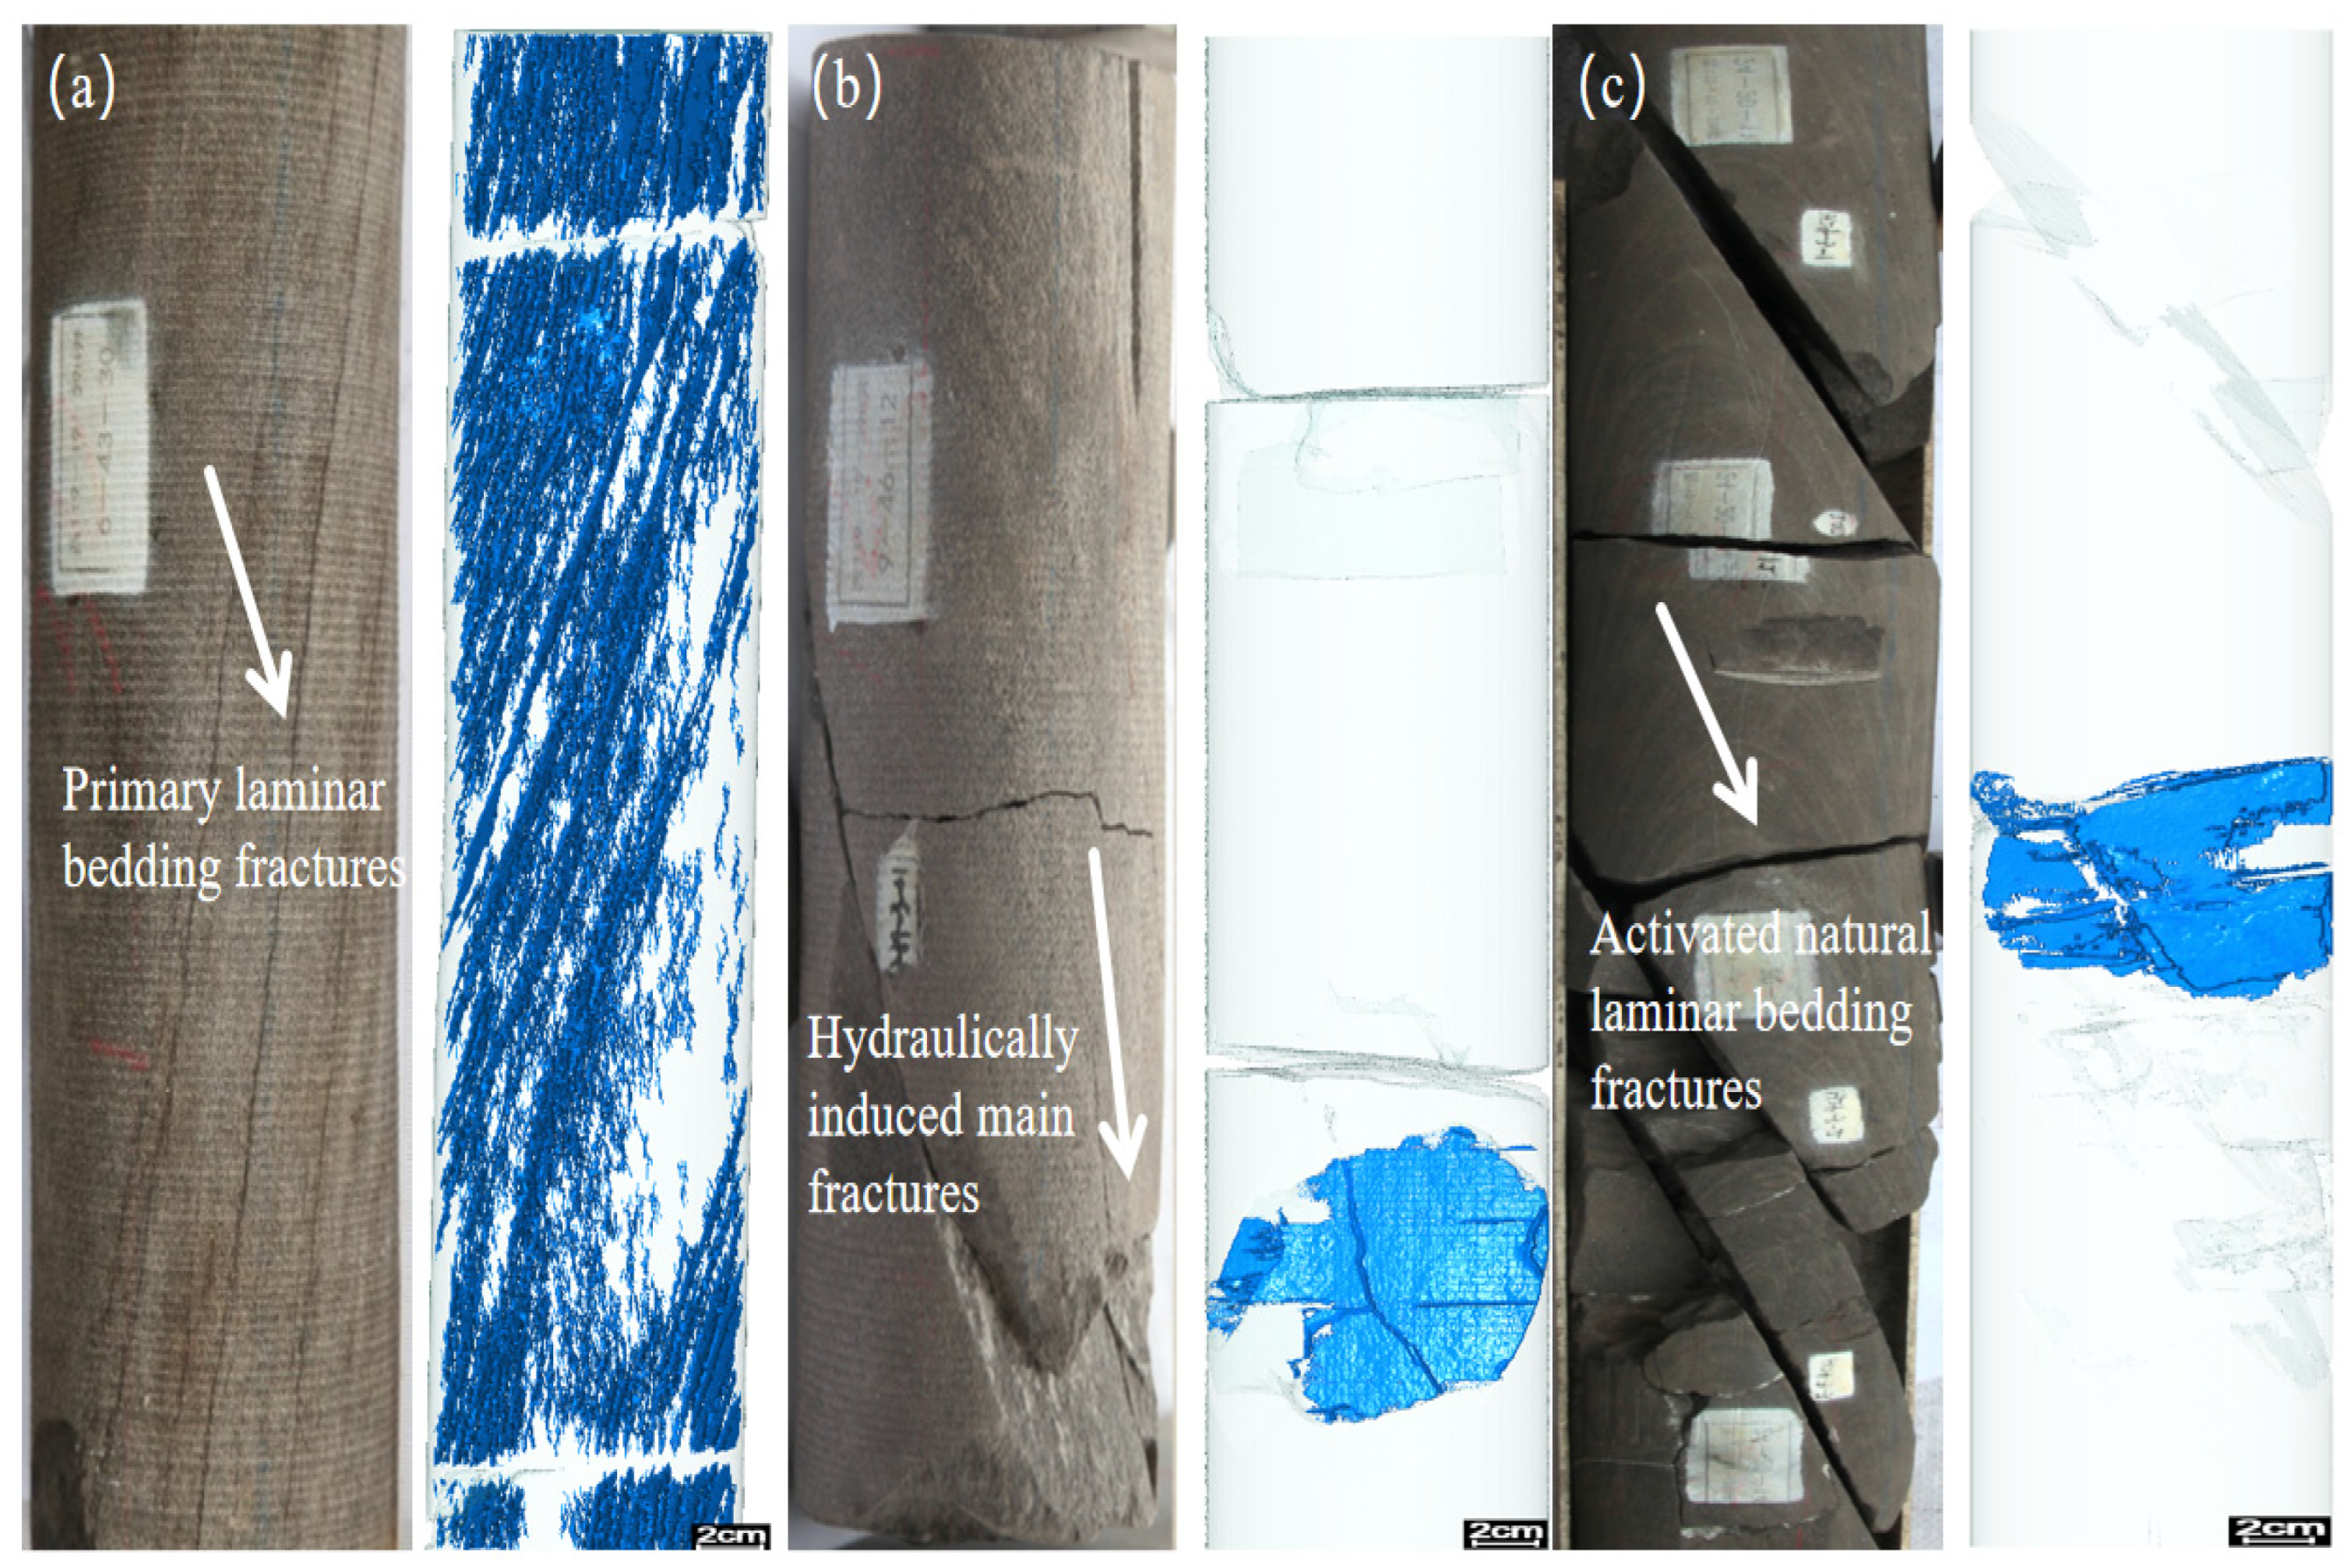
Lithologic structure has a significant control effect on the geometric morphology of hydraulic fracture surfaces, and there are systematic differences in fracture surface morphology, flatness, aperture, continuity and CT image response characteristics among sandstones of different lithologies (Table 3). Among them, massive sandstone has low argillaceous content, high brittleness index and extremely undeveloped bedding. Hydraulic fractures are dominated by straight and complete main fractures with large aperture (80–2000 μm) and strong continuity, which appear as high-gray continuous broad bands on CT images. Natural weak planes have weak control on fracture propagation in this lithology, and a single high-conductivity channel is easily formed after fracturing, with low fracture-network complexity but excellent single-fracture seepage capacity.
Argillaceous laminated sandstone has high argillaceous content and strong plasticity. Hydraulic fractures propagate in a curved and discontinuous manner along argillaceous laminae, with small and extremely uneven aperture (20–600 μm), which appear as low–medium-gray discontinuous bands on CT images. Laminae and argillaceous interlayers have strong control on fracture propagation, resulting in poor fracture continuity and weak connectivity. The stimulation effect of conventional fracturing technology is limited, and targeted optimization of injection rate and proppant placement technology is required.
Cross-bedded sandstone develops multiple sets of bedding weak planes in different directions. Hydraulic main fractures tend to turn along dominant bedding planes and activate a large number of branch fractures at the same time. The overall fracture surface is in an interlaced broken line shape with medium aperture (40–1000 μm), which appears as medium–high-gray interlaced bands on CT images. Cross-bedding provides abundant dominant paths for fracture propagation, and the fracture network formed after fracturing has high complexity, medium–strong seepage capacity and good stimulation effect.
The above differences indicate that the morphology of hydraulic fracture surfaces is mainly controlled by two factors: the “brittleness–plasticity” mechanical properties of the reservoir and the “bedding development degree”, which provides a lithological basis for the subsequent classification of hydraulic fracture–natural fracture coupling types. These lithology-dependent variations in hydraulic fracture morphology are clearly visualized in Figure 4.

3.2. Classification of Hydraulic Fracture–Natural Fracture Coupling Types

Based on the spatial coupling form of hydraulic fractures and natural fractures, fracture network skeleton structure and macroscopic connectivity characteristics, combined with quantitative parameters such as fracture linear density, connectivity and equivalent permeability obtained from CT 3D reconstruction, the complex fracture networks formed after fracturing in the study area are divided into three typical types. The differences in fracture combination characteristics, formation geological conditions, quantitative parameter thresholds and seepage capacity of various fracture networks are shown in Table 4. All quantitative parameters are derived from systematic statistics of the 87.56 m CT-scanned core interval. For each coupling type, three to five representative core segments (40–50 cm in length) were selected for detailed parameter extraction: fracture linear density is defined as the number of effective fractures per meter of core; connectivity is the proportion of fractures connected to the main fracture system relative to total fractures, calculated via 3D network topology analysis; and equivalent permeability is obtained via lattice Boltzmann method simulation. Average values of multiple samples are taken as the characteristic parameters for each coupling type, with all thresholds summarized in Table 4.
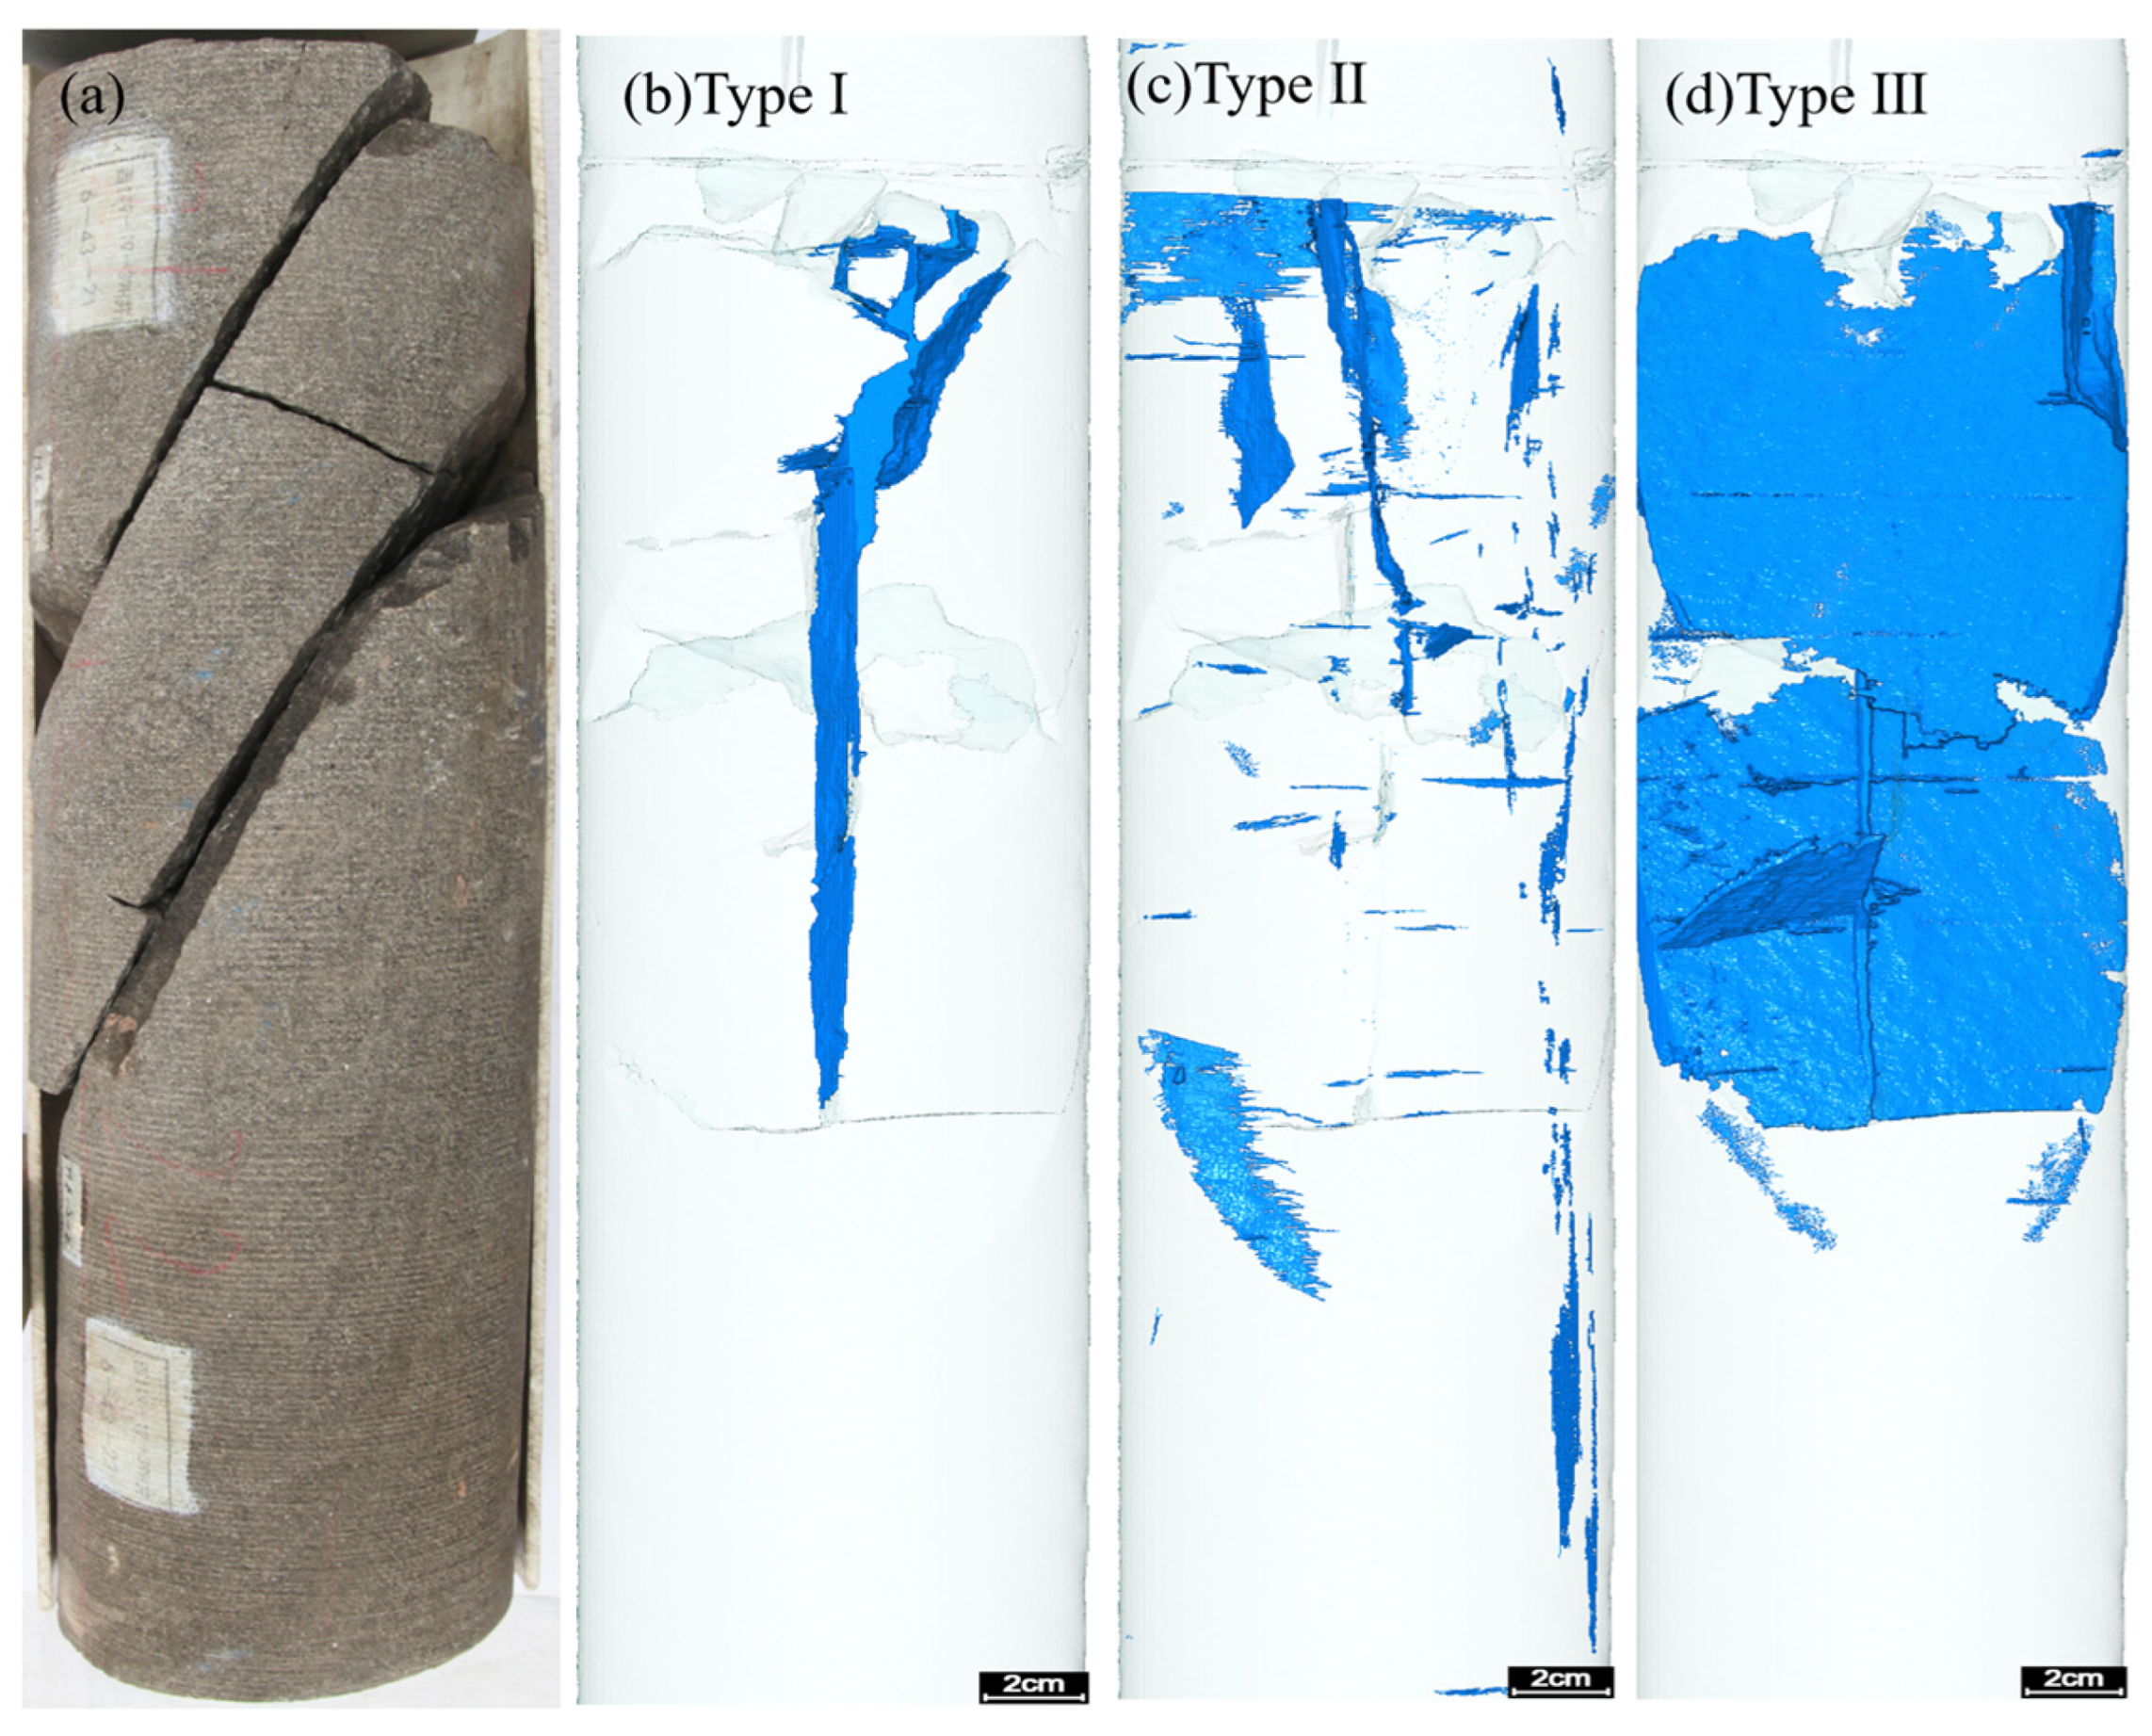
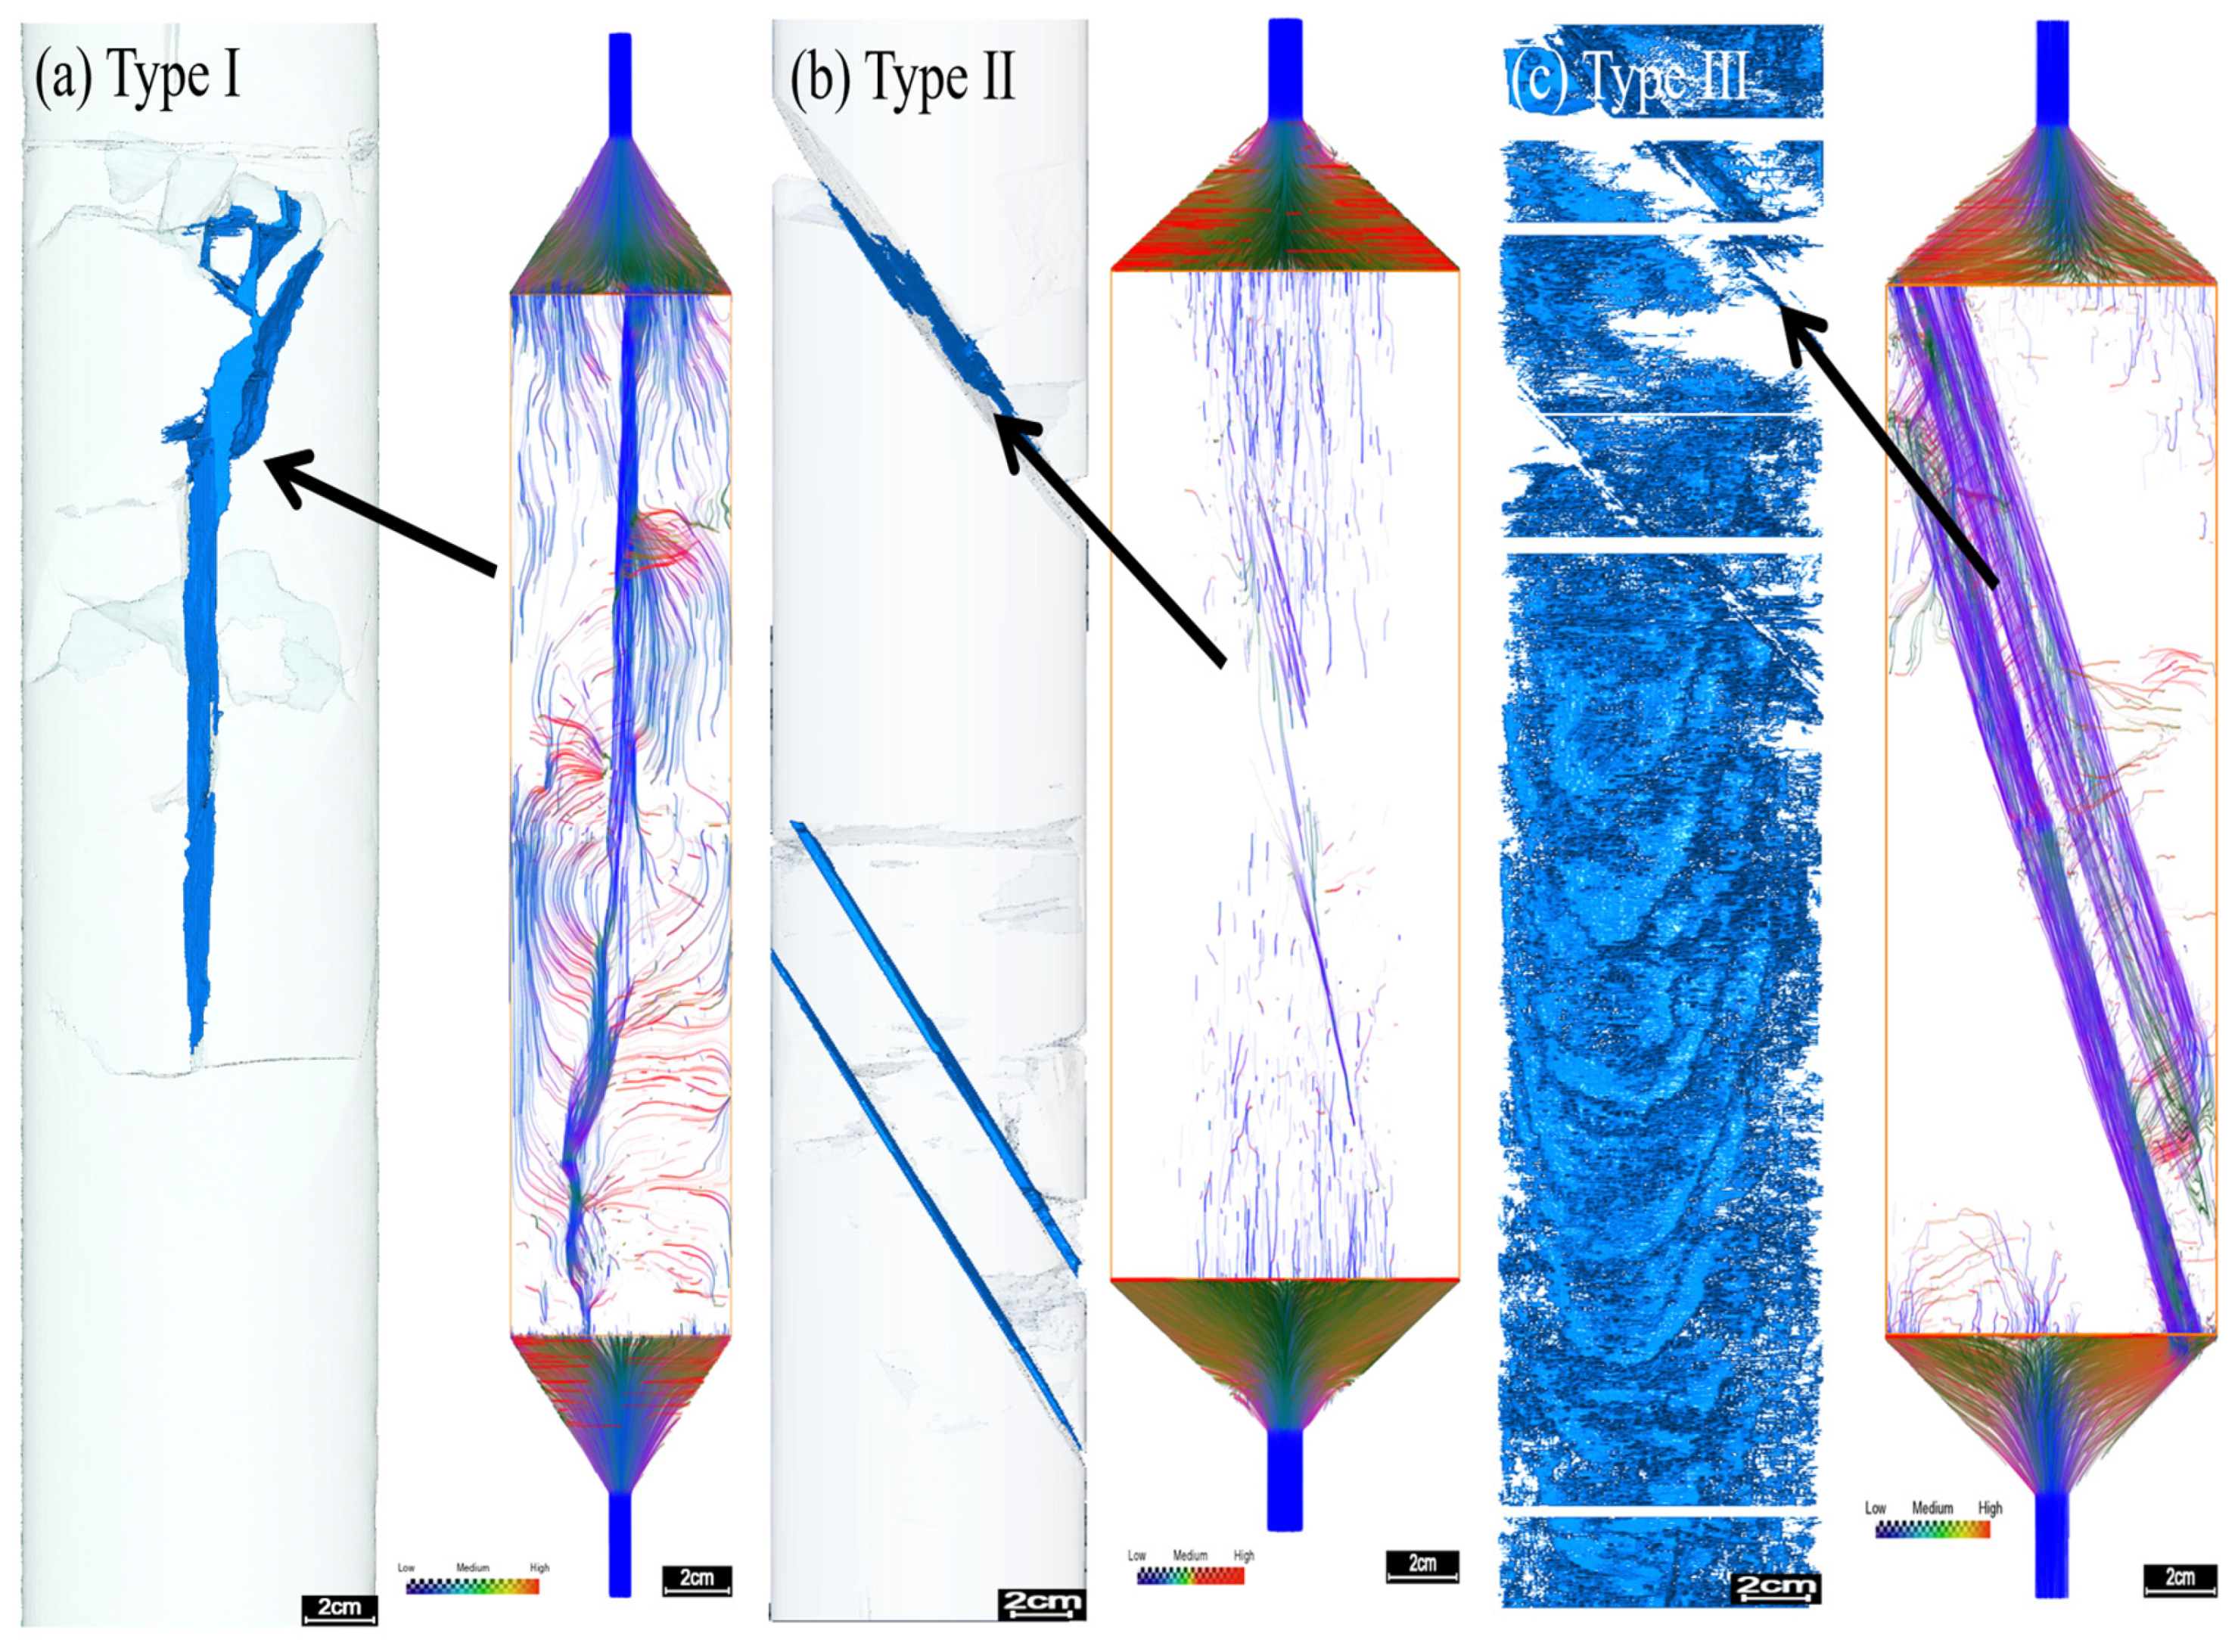
The first type is single hydraulic-fracture type (Type I), whose fracture network skeleton is a single straight hydraulic main fracture without obvious diverted branches and fails to effectively communicate with surrounding natural fractures. This type of fracture network is mainly formed in areas with undeveloped natural fractures, strong reservoir lithology homogeneity or far from the fracturing well. The core quantitative parameters are fracture linear density of 2–4 fractures/m, fracture connectivity <20% and equivalent permeability <200 mD. Fluid seepage shows unidirectional linear flow characteristics, the supply range of matrix to fractures is limited, the overall seepage capacity is poor, and the development value is low. On core surfaces, this type appears as a single penetrating main fracture with few secondary fracture traces.
The second type is single main fracture–diverted fracture–natural fracture type (Type II), which takes a single hydraulic main fracture as the core. Diverted fractures generated during the propagation of main fractures bifurcate and extend, and communicate with some reactivated natural fractures, forming a three-level primary grid structure of “main fracture–diverted fracture–natural fracture”. This type of fracture network is formed under the geological conditions where natural fractures are moderately developed and fracturing fluid energy is sufficient to support the propagation of main fractures and activate some natural fractures. The core quantitative parameters are fracture linear density of 5–8 fractures/m, fracture connectivity of 20–60% and equivalent permeability of 200–350 mD. The fluid seepage path changes from unidirectional linear to multi-branch network, the matrix supply range is significantly expanded, and the overall seepage capacity is good. This type is the most widely distributed fracture network type in the study area, accounting for about 65% of the total length of fracture-bearing intervals in the 87.56 m scanned core, and also the most valuable fracture network type for development at present. Core observations show distinct branching and deflection of the main fracture, with partial connection to bedding-parallel natural fractures.
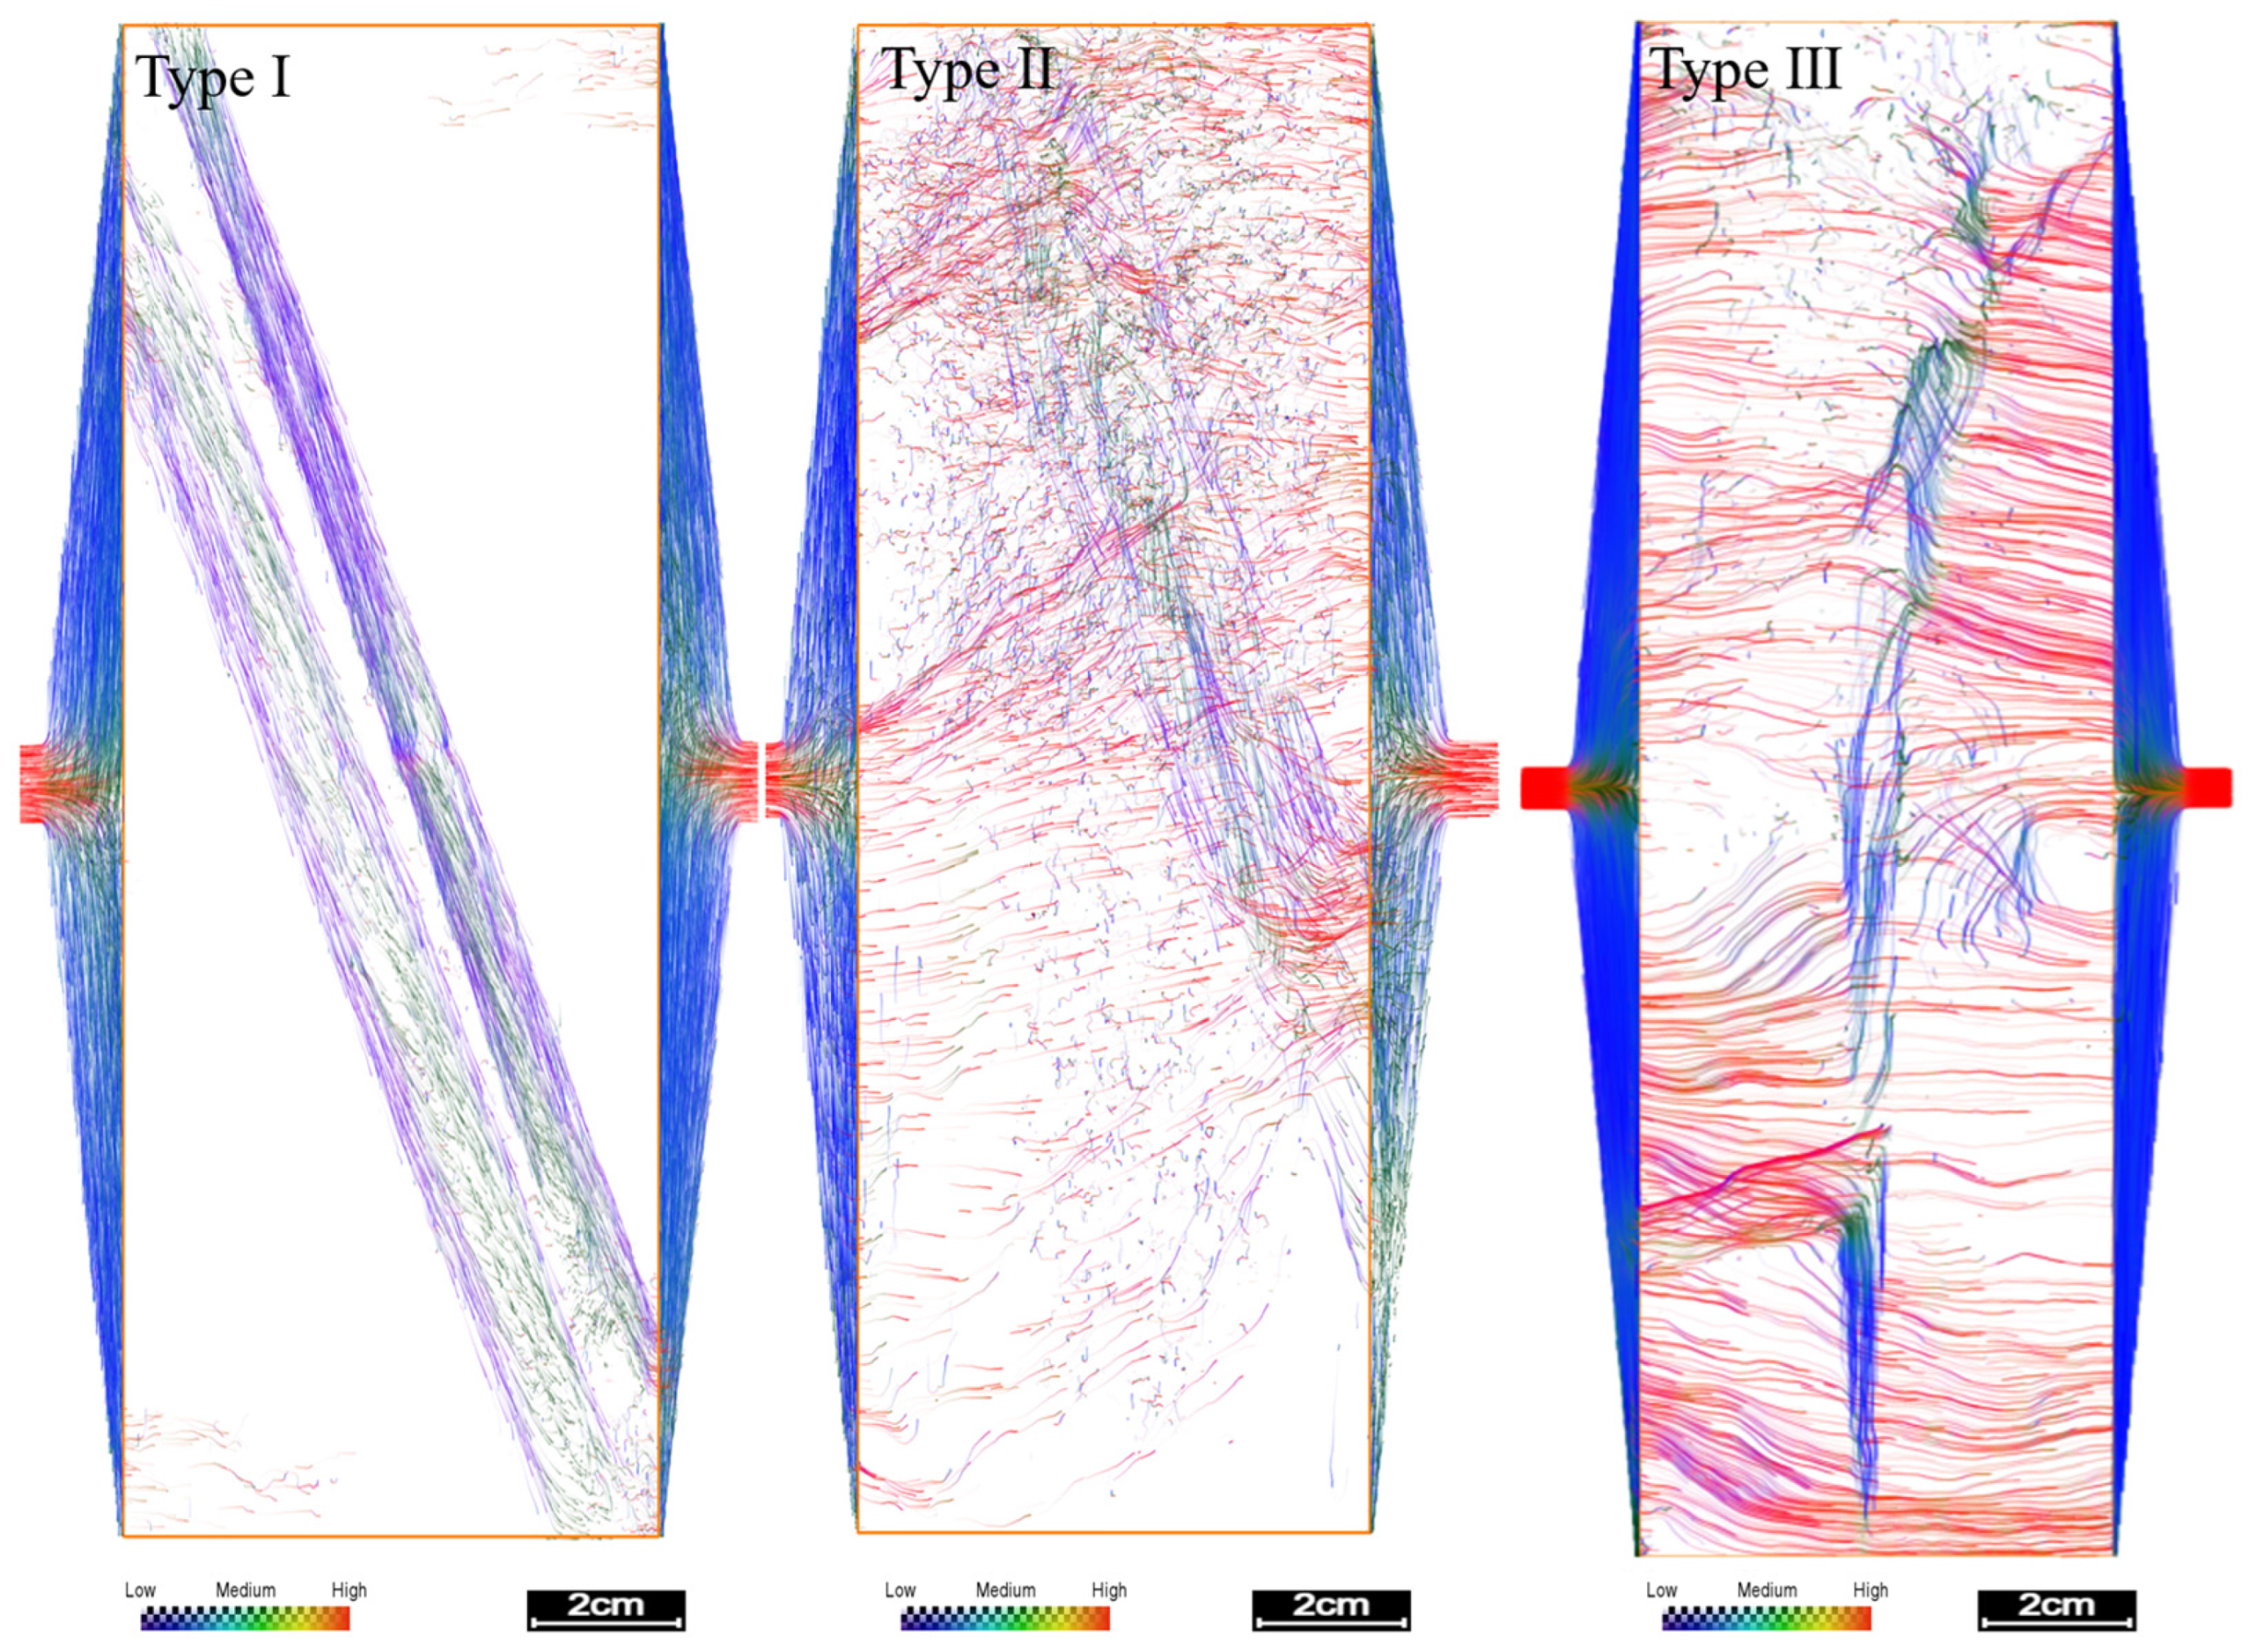
The third type is dual main fractures–diverted fractures–natural fractures type (Type III), which takes two nearly parallel or intersecting hydraulic main fractures as the skeleton. Diverted fractures widely connect the two main fractures and interweave with a large number of reactivated natural fractures to form a three-dimensional complex fracture network system. This type of fracture network is mainly formed in areas with densely developed natural fractures, strong reservoir heterogeneity, close to the fracturing well and sufficient fracturing fluid energy. The core quantitative parameters are fracture linear density >8 fractures/m, fracture connectivity >60% and equivalent permeability >350 mD. Fluid seepage shows dual-channel high-efficiency conductivity characteristics, multi-level branch fractures cover the entire stimulation area, and the overall seepage capacity is optimal (CT numerical simulation permeability can reach 586 mD), which is the preferred fracture network target area for efficient development of tight sandstone reservoirs. Core photographs show two distinct main fracture surfaces accompanied by abundant secondary fractures and activated bedding fractures, with widespread intersection and branching.
From Type I to Type III, the equivalent permeability of the fracture network increases from 155 mD to 345 mD and then to 586 mD, and the complexity of the fracture network and the overall seepage capacity show a stepwise increasing positive correlation. Figure 5 presents the CT-based 3D reconstruction models of these three typical coupling types, providing intuitive evidence for their structural differences.

3.3. Digital-Core-Based Evaluation of Stimulation Effects

Post-fracturing stimulation effects were quantitatively evaluated by comparing stimulated intervals with adjacent unstimulated intervals across four dimensions (Table 5): pore–fracture structural modification, fracture volume increase, aperture improvement and seepage-capacity enhancement. The calculation methods, change trends and geological interpretation significance of each evaluation index are shown in Table 5.
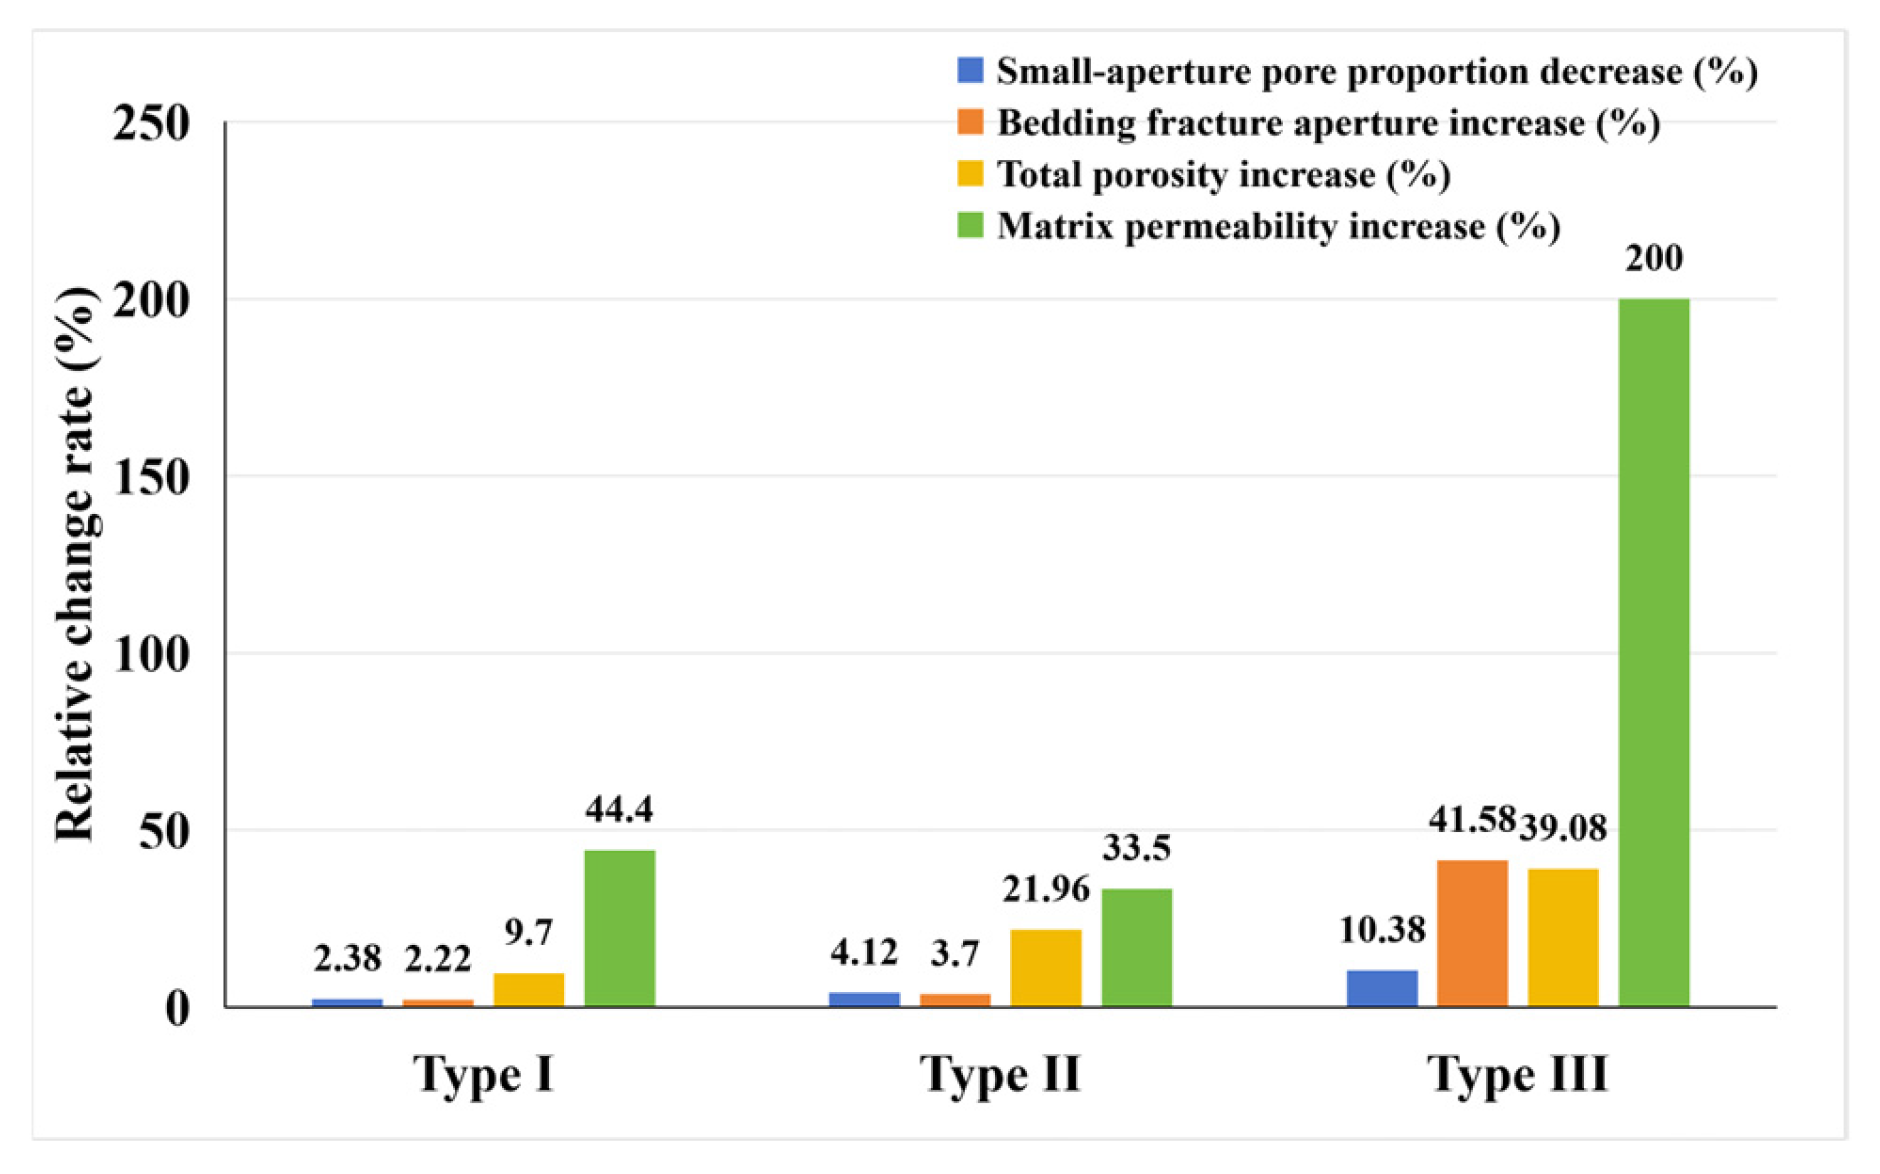
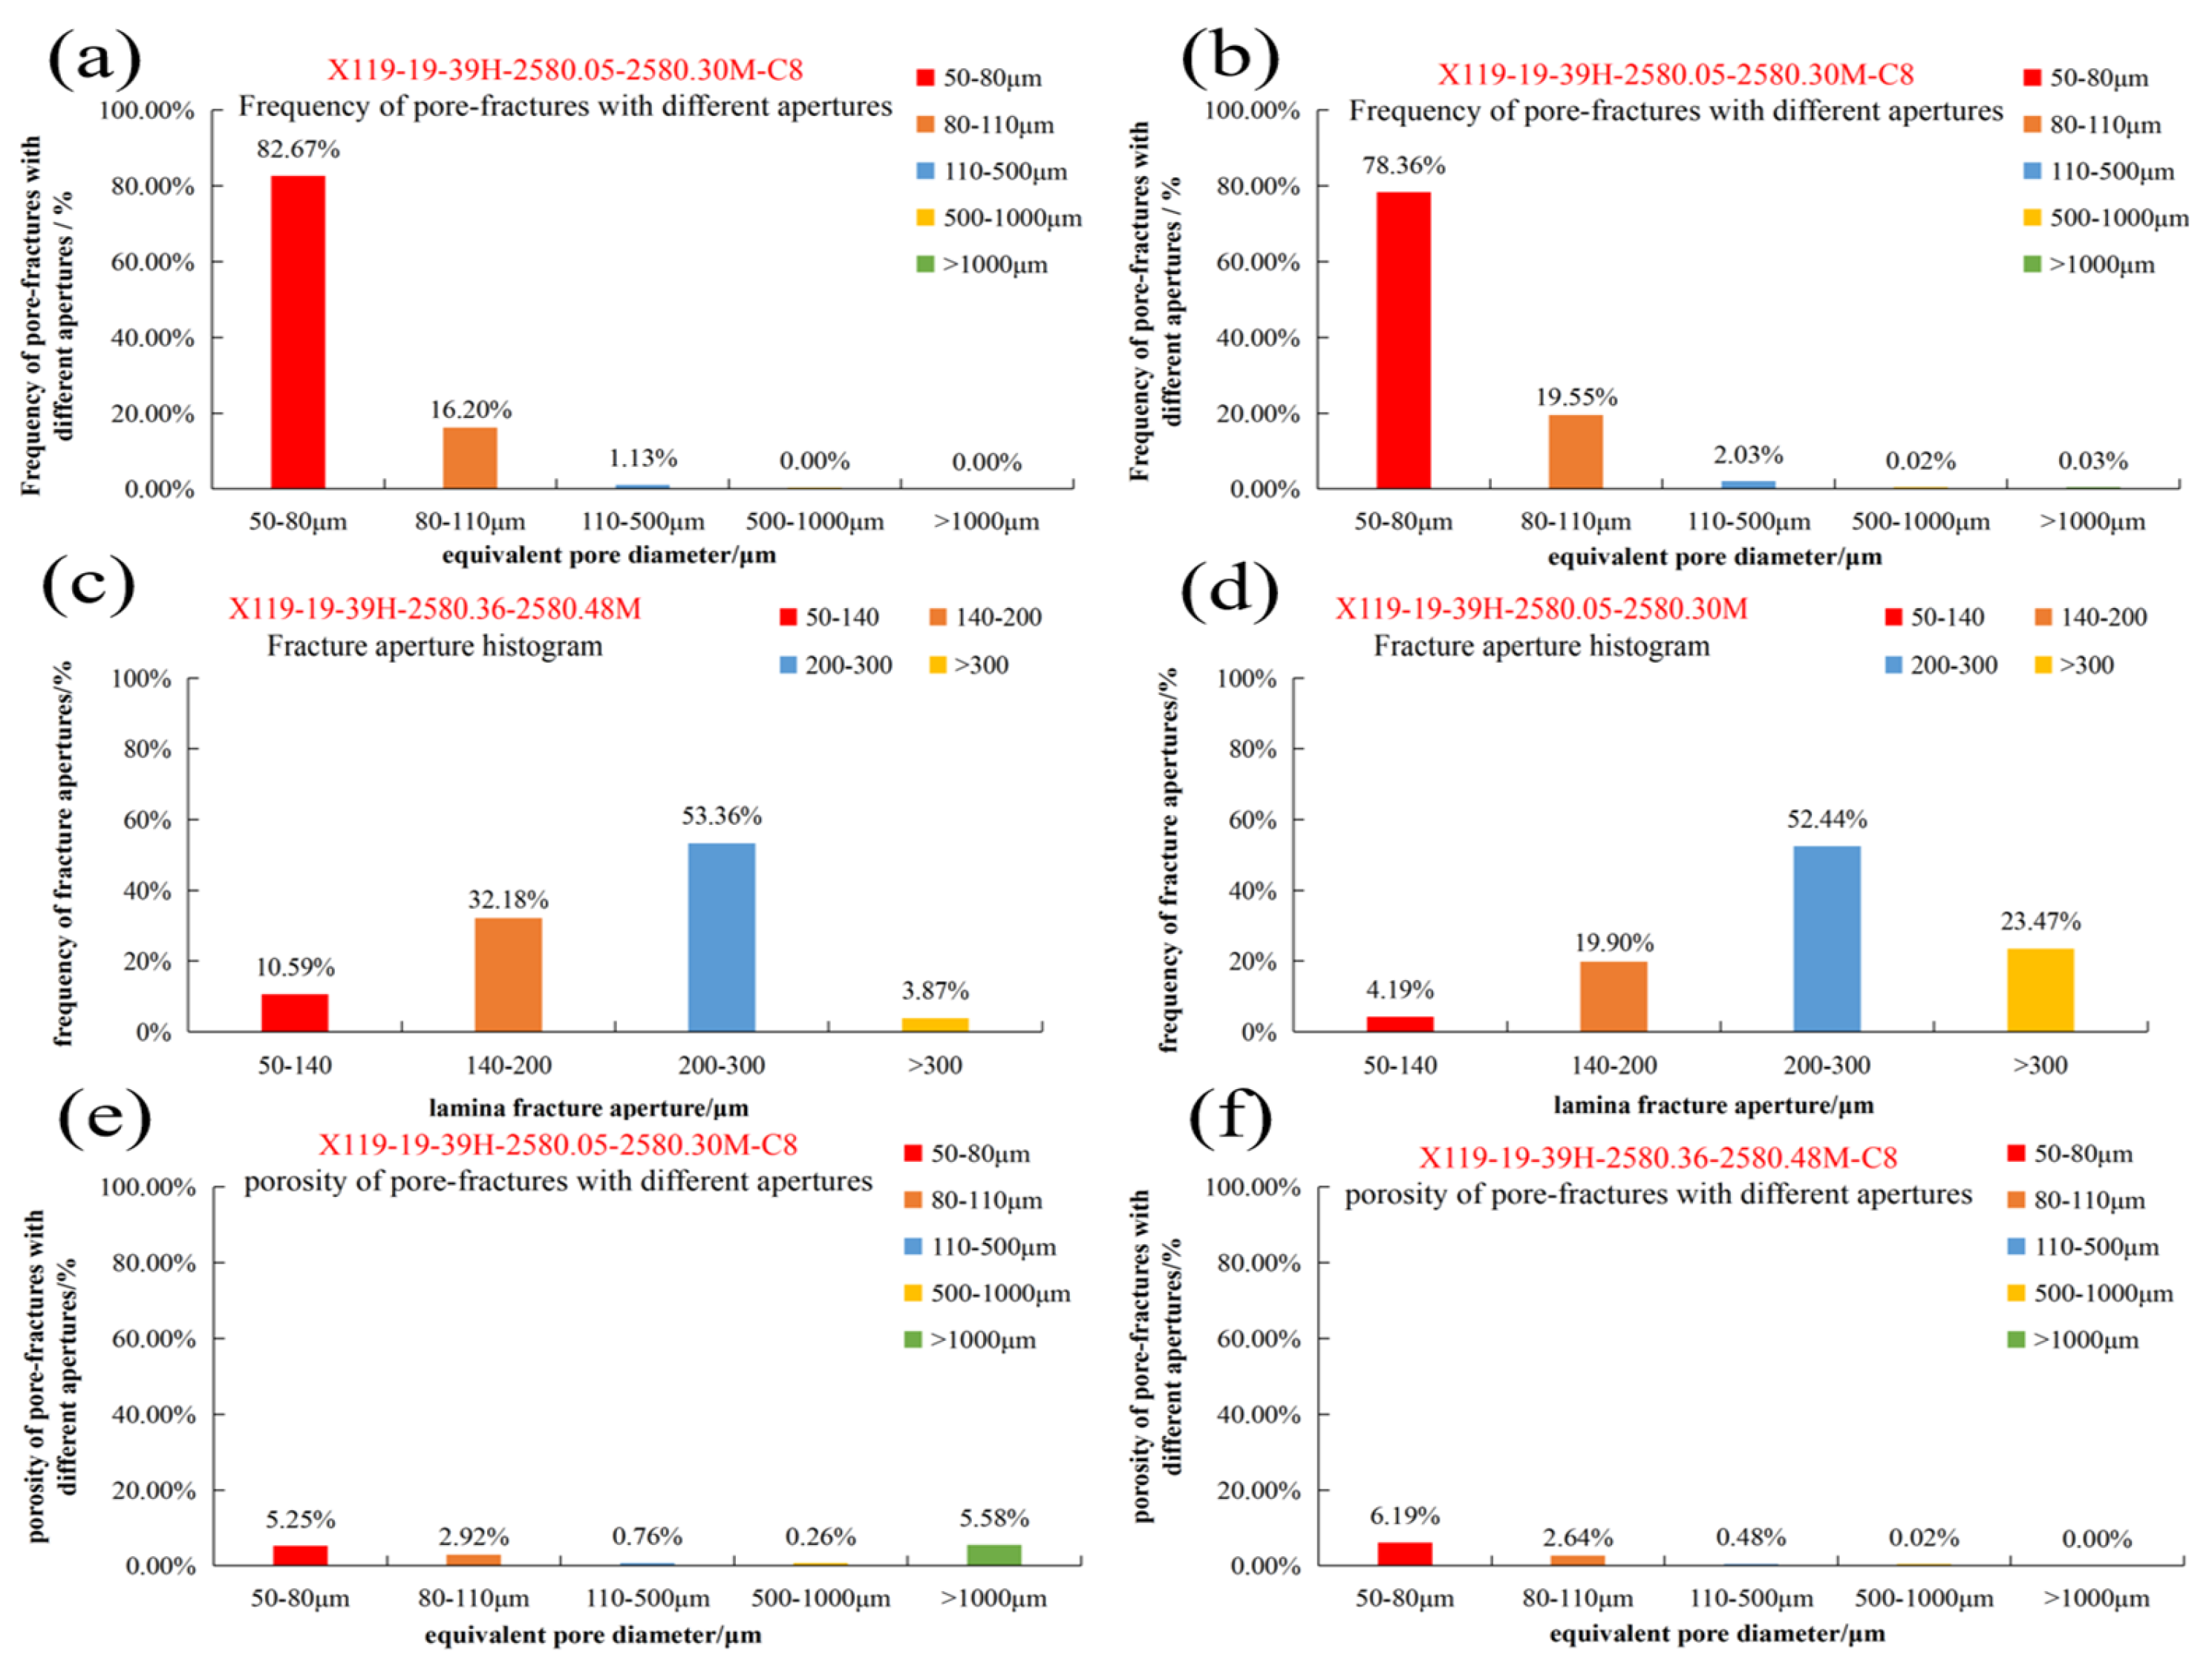
In terms of pore–fracture structural modification, taking the volume proportion of pores with aperture less than 80 μm as the evaluation index, the proportion of small-aperture pores in all three types of fracture networks decreases after fracturing, and the decrease amplitude increases with the increase in fracture-network complexity. Among them, Type I fracture network decreases by 1.86 percentage points (relative decrease of 2.38%), Type II fracture network decreases by 2.82 percentage points (relative decrease of 4.07%), and Type III fracture network decreases by 6.43 percentage points (relative decrease of 8.91%). This result indicates that complex composite fracture networks can effectively communicate and expand micro-pores inside the reservoir and significantly improve pore–throat connectivity. The modification intensity of Type III fracture network on micro-pore structure is about 4.4 times that of Type I fracture network.
In terms of aperture improvement, taking the average aperture increase of bedding fractures with aperture less than 200 μm as the evaluation index, the average aperture of bedding fractures in Type III fracture network increases from 140.81 μm before fracturing to 199.37 μm after fracturing, with an absolute expansion of 58.56 μm and a relative increase of 41.58%, which is much higher than that of Type II fracture network (3.70%) and Type I fracture network (2.22%). This confirms that multi-fracture synergistic propagation has a significant expansion effect on bedding fractures, and the improvement amplitude of Type III fracture network on bedding fracture aperture is about 18.7 times that of Type I fracture network.
In terms of fracture volume increase (characterized by total porosity enhancement), the total porosity of Type III fracture network increases from 11.08% before fracturing to 15.41% after fracturing, with an absolute increase of 4.33 percentage points and a relative increase of 39.08%; Type II fracture network increases from 11.20% to 13.66%, with a relative increase of 21.96%; and Type I fracture network only increases from 6.60% to 7.24%, with a relative increase of 9.70%. Composite fracture networks have an obvious optimization effect on reservoir space, and the relative increase in total porosity of Type III fracture network is about four times that of Type I fracture network.
In terms of seepage-capacity enhancement, the matrix permeability of Type III fracture network increases from 1.93 mD before fracturing to 5.79 mD after fracturing, with an absolute increment of 3.86 mD and a relative increase of 200%; Type II fracture network increases from 2.00 mD to 2.67 mD, with a relative increase of 33.5%; and Type I fracture network increases from 0.09 mD to 0.13 mD, with a relative increase of 44.4%. Type III fracture network has the most significant improvement effect on matrix permeability, with its absolute increment about 5.8 times that of Type II fracture network and relative increase about six times that of Type II fracture network. The seepage capacity differences among the three coupling types are further visualized in Figure 6, where the simulated flow fields clearly show the more efficient and extensive conductive paths in Type III networks.
Based on the four evaluation indicators, it can be seen that the complexity of the fracture network has a significant positive correlation with the reservoir fracturing stimulation effect, and the Type III dual main fractures–diverted fractures–natural fractures coupling type represents the optimal configuration for improving seepage capacity in tight sandstone reservoirs. The quantitative comparison of all four indicators is summarized in Figure 7, which intuitively demonstrates the stepwise improvement of stimulation effectiveness with increasing fracture-network complexity.

4. Discussion

4.1. Relationships Among Lithological Structure, Fracture Coupling, and Stimulation Effect

The conceptual model (Figure 8) illustrates a hierarchical causal chain where lithological structure exerts first-order control on hydraulic fracture–natural fracture coupling types, which in turn determine the final stimulation effect in tight sandstone reservoirs. This chain is validated by quantitative core CT data from the Chang 81 reservoir, revealing distinct lithology-dependent fracture behaviors and their direct impacts on seepage-capacity enhancement.

4.1.1. Lithological Control on Hydraulic Fracture Surfaces and Coupling Potential

Lithological structure, defined by mineral composition, grain arrangement, and bedding characteristics, fundamentally governs hydraulic-fracture propagation behavior and the likelihood of natural-fracture activation. Three distinct lithological end-members identified in the study area exhibit markedly different fracture surface morphologies and coupling potentials:
Massive sandstone: Characterized by low clay content, high brittleness, and negligible bedding development, massive sandstone produces straight, continuous main hydraulic fractures with large apertures (200–500 μm) and strong cross-bed penetration. The weak bedding control limits fracture diversion and natural-fracture activation, resulting in relatively simple fracture networks dominated by single main fractures. While this lithology provides the highest individual fracture conductivity, its low network complexity restricts overall reservoir stimulation volume.
Argillaceous laminated sandstone: High clay content and well-developed horizontal laminae create strong mechanical anisotropy. Hydraulic fractures tend to propagate along laminae, forming discontinuous, wavy fracture surfaces with uneven apertures. The argillaceous laminae act as barriers to vertical fracture growth but promote the activation of bedding-parallel natural fractures. However, the poor continuity of these activated fractures limits effective network connectivity, requiring optimized fluid volume and proppant placement strategies to maintain conductivity.
Cross-bedded sandstone: This lithology represents an optimal balance between brittleness and bedding development. Cross-bedding interfaces provide preferential weak planes that induce fracture diversion and branching, while the moderate clay content maintains sufficient brittleness for main fracture propagation. The resulting fracture networks exhibit moderate complexity, with main fractures connected to abundant reactivated bedding fractures, creating a well-integrated conductive system.
These observations confirm that lithological heterogeneity is the primary geological control on fracture coupling. The degree of mechanical anisotropy, determined by bedding density and clay content, dictates whether hydraulic fractures will propagate as simple planar features or develop into complex interconnected networks through interaction with natural weak planes. This control mechanism arises from the combined effect of rock brittleness and weak plane distribution. Massive sandstone with high brittleness and negligible bedding allows fractures to propagate along the maximum principal stress direction with minimal deflection, forming simple planar fractures. Argillaceous laminated sandstone shows strong mechanical anisotropy, so fractures tend to propagate along laminae rather than cutting through vertically, resulting in poor continuity. Cross-bedded sandstone provides multi-directional weak planes while maintaining sufficient brittleness, which promotes fracture diversion and natural-fracture activation simultaneously, leading to the most complex coupled network.

4.1.2. Quantitative Relationship Between Fracture Coupling Types and Seepage Capacity

Based on fracture assemblage, spatial connectivity, and seepage behavior, three distinct hydraulic fracture–natural fracture coupling types were classified, each with characteristic quantitative parameters and seepage performance:
The stepwise increase in seepage capacity from Type I to Type III is essentially controlled by the transformation of flow patterns and the expansion of matrix supply scope.
For Type I networks with a single main fracture, fluid flow is dominated by linear channeling along the main fracture, and the matrix can only supply fluid to the fracture surface within a narrow range. This seepage mode results in limited effective drainage volume, even if the main fracture itself has high conductivity.
For Type II networks, diverted fractures and locally reactivated bedding fractures expand the contact area between the fracture system and the matrix, changing the flow pattern from single-channel linear flow to multi-branch network flow. The expanded matrix supply range is the core reason for the significant permeability improvement compared with Type I.
For Type III networks, dual main fractures provide two high-conductivity backbone channels, and a large number of reactivated natural fractures build a multi-level seepage grid covering a wider matrix area. This composite structure not only increases the total fracture volume, but more importantly, greatly improves the spatial uniformity of the seepage field, thus achieving the highest seepage efficiency.
The stepwise increase in seepage capacity with coupling complexity is driven by three synergistic mechanisms: (1) additional main fractures double the core conductive pathways; (2) diverted fractures expand the fracture network’s areal coverage; and (3) reactivated natural fractures establish critical connections between the artificial fracture system and the reservoir matrix. These mechanisms collectively transform isolated pore spaces into an interconnected seepage system. The formation of dual main fractures in Type III networks is mainly controlled by two factors: (1) the development of two sets of nearly orthogonal natural fracture systems in cross-bedded sandstone, which provide preferential propagation paths for hydraulic fractures; (2) local stress perturbation caused by adjacent fracture propagation, which induces the initiation of a secondary main fracture parallel to the primary one. This dual-main-fracture structure significantly expands the effective stimulation volume and provides dual high-conductivity pathways for fluid flow. Notably, the classification scheme established here differs fundamentally from previous fracture network frameworks. Most existing classifications are derived from numerical simulations, outcrop surveys or microseismic monitoring, which can only infer network morphology at the reservoir scale but cannot capture the actual coupling state at the core scale. By contrast, the three types defined in this work are built on direct observations of post-fracturing full-diameter cores, with quantitative permeability constraints from pore-scale simulations. Compared with core-based descriptions from North American test sites, which focus on geologically simpler marine reservoirs, this scheme explicitly accounts for the strong lithological heterogeneity of continental tight sandstones and establishes a quantitative link between fracture assemblage and seepage capacity, providing a more targeted basis for fracturing optimization in continental strata.

4.1.3. Multi-Dimensional Evaluation of Stimulation Effect

Core CT data allow quantitative dissection of stimulation effects across multiple interrelated dimensions, all of which exhibit consistent improvement with increasing complexity of hydraulic fracture–natural fracture coupling (Figure 9 and Figure 10).
The four evaluation dimensions do not change independently, but constitute a progressive causal chain: structural modification of pore–fracture systems → aperture enlargement of natural weak planes → increase in effective fracture volume → improvement of overall seepage capacity (Table 6).
Pore–fracture structural modification is the micro-scale foundation of stimulation. Hydraulic fracturing connects isolated micro-pores and redistributes pore volume to larger flow channels, which essentially improves the connectivity of the matrix pore–throat system. The degree of this modification is positively correlated with network complexity, because complex fracture networks can penetrate more matrix areas and activate more micro-scale pore spaces. Aperture enlargement of lamina fractures is the key link connecting structural modification and seepage improvement. In continental tight sandstones, bedding fractures are the most widely developed natural weak planes, but most of them are in a closed or semi-closed state before fracturing. The synergistic propagation of multistage fractures transmits fluid pressure into the surrounding rock, reopening these originally closed bedding fractures and converting them into effective seepage channels. This mechanism is particularly prominent in Type III networks with dual main fractures. The increase in total porosity reflects the net increment of effective reservoir space caused by fracturing, including both the volume of newly generated hydraulic fractures and the volume of reopened natural fractures. This storage space increment provides the material basis for seepage capacity improvement. The exponential growth of permeability is the comprehensive manifestation of the above three dimensions. Different from the simple superposition of fracture volume, the construction of a multi-level conductive network fundamentally changes the seepage mode of the reservoir, which is the core mechanism for the substantial improvement of flow capacity.
These core-scale quantitative observations complement existing stimulated reservoir volume (SRV) evaluation frameworks that rely predominantly on indirect monitoring data. Conventional SRV estimation based on microseismic interpretation or production data inversion characterizes stimulation effects at the reservoir scale, but cannot resolve millimeter-scale internal structural changes in pore–fracture systems. Relative to core-based studies from North American test sites, which focus largely on geologically simpler marine reservoirs, this work demonstrates that strong lithological heterogeneity in continental tight sandstones produces highly differentiated stimulation responses. In particular, the stepwise increase in permeability across the three coupling types highlights that interaction between hydraulic fractures and pre-existing bedding fractures is the dominant mechanism for seepage improvement in continental strata—a mechanism less prominent in more homogeneous marine reservoirs. This finding provides a core-scale geological explanation for the strong production heterogeneity commonly observed in fractured continental tight sandstone wells.

4.2. Application Significance and Limitations of the CT-Based Evaluation Method

4.2.1. Core Application Significance

The core CT-based evaluation method developed in this study addresses key limitations of conventional indirect stimulation assessment approaches, offering distinct advantages for tight sandstone reservoir characterization and fracturing optimization.
Most notably, the method enables direct, quantitative characterization of post-fracturing fracture systems. Unlike microseismic monitoring, production logging and numerical simulation, which yield indirect and often ambiguous estimates of fracture geometry, core CT scanning supports direct visualization and quantitative measurement of fracture aperture, density, orientation, connectivity and proppant distribution. This eliminates much of the uncertainty inherent to indirect interpretation, and provides ground-truth data for the calibration of hydraulic-fracture propagation models.
Beyond surface observation, CT imaging supports full three-dimensional reconstruction of internal fracture networks. This overcomes the constraints of two-dimensional core surface description, allowing accurate assessment of fracture topology, spatial distribution and internal connectivity—parameters critical to understanding fluid flow behavior in stimulated reservoirs that cannot be recovered from conventional core logging.
Complementing structural characterization, the proposed multi-dimensional evaluation framework provides a holistic assessment of stimulation effectiveness. By integrating pore–fracture structural modification, fracture volume increase, aperture improvement and equivalent seepage capacity, the framework moves beyond simple productivity metrics to quantify the fundamental geological changes induced by hydraulic fracturing, supporting a more mechanistic understanding of stimulation processes.
From an engineering perspective, the method underpins geology–engineering integrated optimization of fracturing design. The quantitative linkage established between lithological structure, hydraulic fracture–natural fracture coupling type and stimulation effect provides a geological basis for targeted design adjustment. For instance, massive sandstone intervals benefit from increased perforation cluster density to promote network complexity, whereas argillaceous laminated sandstone requires optimized fluid volume and proppant concentration to sustain fracture conductivity and prevent premature closure.
At the field scale, core CT datasets serve as a valuable calibration tool for downhole monitoring technologies. Core-derived fracture parameters can be used to constrain microseismic and distributed fiber optic sensing (DAS/DTS) interpretations, improving the accuracy of field-scale fracture characterization. This calibration function is particularly valuable for continental tight sandstone reservoirs, where strong lithological and mechanical heterogeneity reduces the reliability of indirect monitoring approaches relative to homogeneous marine systems.

4.2.2. Key Limitations

Despite its considerable strengths, the core CT-based evaluation framework is subject to a number of limitations that must be carefully weighed when extending findings to the reservoir scale.
A fundamental limitation stems from the inherent scale discrepancy between core-scale observations and reservoir-scale attributes. Core samples represent only a minute fraction of the stimulated reservoir volume, and while CT imaging delivers high-resolution data at the millimeter-to-centimeter scale, it is intrinsically unable to resolve large-scale fracture heterogeneities such as regional fracture trends, fault zones, and inter-well variations. Accordingly, the quantitative thresholds of coupling types and permeability values obtained in this study are more suitable for revealing the geological mechanism of fracture coupling, and cannot be directly used as field-scale design parameters. The core-scale results need to be calibrated and upscaled by combining with reservoir-scale numerical simulation and field monitoring data before engineering application. Consequently, the core-scale classification scheme and quantitative parameters developed in this study are best employed to calibrate reservoir-scale numerical models, rather than being adopted directly as field-scale design criteria.
A further constraint is that the method captures a static, post-fracturing snapshot of the fracture network, offering no direct insight into the dynamic behavior during production. Processes such as fracture closure under in situ stress, proppant embedment, and fines migration over long-term production can markedly degrade fracture conductivity and well performance. The permeability values reported herein reflect the initial, post-stimulation state; thus, long-term conductivity retention must be assessed through integration with field production data. Therefore, the permeability values in this paper reflect the initial state immediately after fracturing. For long-term production evaluation, the attenuation law of fracture conductivity under stress and production conditions needs to be further analyzed by combining core flow experiments and field production dynamic data.
The reliance on core material from a single cored well also introduces representativeness concerns. Post-fracturing coring is both costly and technically demanding, which restricted the present investigation to one well in the Xi 119 well block. Although the selected intervals encompass the typical lithologies and degrees of fracture development observed across the study area, the pronounced spatial heterogeneity of continental tight sandstone reservoirs means that fracture coupling types may differ in other blocks. The generality of the proposed classification scheme therefore requires validation against additional core datasets spanning different blocks and tight-reservoir types. Given the strong sedimentary heterogeneity of continental tight sandstones, the distribution proportion and development degree of the three coupling types may vary in different sedimentary facies belts and structural positions. The classification scheme proposed in this study is still applicable in terms of genetic mechanism, but the specific quantitative thresholds need to be adjusted according to actual core data of different blocks.
Potential bias in fracture-genesis classification represents another challenge. Determining fracture origin depends on the integrated interpretation of multiple evidence strands. While a three-step screening procedure was implemented to exclude engineering-induced fractures, and multi-evidence calibration was applied to hydraulic-fracture identification, a small probability of misclassification persists for fractures of ambiguous origin. In addition, sub-voxel microfractures below the CT detection limit cannot be quantified, which likely leads to a slight underestimation of total fracture volume and network connectivity. According to the multi-evidence identification process adopted in this study, the misclassification probability of fractures with clear genetic evidence is less than 5%; for ambiguous fractures, the possible deviation of quantitative parameters is about 5–10%. This deviation will not change the stepwise increasing trend of permeability from Type I to Type III, so the core conclusion of the study is robust.
Stress-state differences between recovered cores and the in situ reservoir constitute a further complication. Cores are retrieved under ambient pressure conditions, which deviate substantially from the in situ stress environment. Stress release during core recovery can alter fracture aperture and connectivity, potentially biasing the measurements. The aperture values presented in this study correspond to the ambient-pressure state, and in situ stress corrections are necessary when transferring these parameters to reservoir conditions. Existing studies show that stress release will cause the fracture aperture to increase by about 10–20% compared with the in situ state. When the results are applied to reservoir evaluation, in situ stress correction should be carried out according to the actual formation stress conditions to obtain more realistic fracture conductivity parameters.
Finally, the high temporal and financial cost of high-resolution core CT scanning renders it impractical for routine deployment across a large number of wells. Collectively, these limitations mean that core-scale results provide a geological basis for understanding fracture coupling mechanisms, but require calibration with field-scale monitoring data when applied to reservoir-scale fracturing design. The technique is more appropriately reserved for key test wells and mechanistic investigations, rather than serving as a tool for wide-scale implementation in oilfield development.

4.2.3. Future Improvements

To address the aforementioned limitations, future research should prioritize four key directions. First and foremost, bridging the gap between core-scale observations and reservoir-scale applications requires a multi-scale data integration approach. By combining core CT data with seismic, well logging, microseismic, and production data, a unified fracture characterization framework can be constructed to facilitate the transition from mechanistic understanding to engineering application. Furthermore, capturing the dynamic evolution of fracture conductivity is crucial; this involves integrating core CT characterization with long-term production monitoring and flow experiments to elucidate how stress closure, proppant embedment, and water flooding affect fracture networks over time. In parallel, advancements in intelligent interpretation are needed to handle large-volume datasets efficiently. Developing AI-driven algorithms for automated fracture identification and segmentation—constrained by geological knowledge—will significantly enhance both processing efficiency and interpretive consistency. Finally, to mitigate measurement biases caused by stress release, future studies should focus on in situ condition simulation. Conducting hydraulic fracturing physical simulations under realistic stress and temperature conditions during CT scanning will allow for a more accurate reproduction of actual fracture propagation processes in the reservoir.

5. Conclusions and Outlook

(1)
A core-scale workflow for identifying post-fracturing fracture networks was established by integrating full-diameter core CT images, core-surface observations, fracture-surface features and proppant/tracer evidence. Natural fractures, hydraulic fractures and engineering-induced fractures were distinguished according to their genetic evidence, CT expression, geometry and contribution to the effective fracture network.
(2)
Lithological structure strongly controls hydraulic-fracture surface morphology. Massive sandstone mainly develops straight, continuous and large-aperture main hydraulic fractures, forming high-conductivity but relatively simple fracture systems. Argillaceous laminated sandstone tends to generate bedding-controlled, discontinuous and uneven-aperture fractures, resulting in limited effective connectivity. Cross-bedded sandstone is more favorable for fracture diversion, branching and activation of bedding-related fractures, thereby promoting more complex fracture networks.
(3)
Three hydraulic fracture–natural fracture coupling types were classified based on fracture assemblage, spatial connectivity and seepage behavior: Type I, single hydraulic-fracture type; Type II, single main fracture–diverted fracture–natural fracture type; and Type III, dual main fractures–diverted fractures–natural fractures type. From Type I to Type III, fracture linear density, connectivity and equivalent permeability increase progressively, indicating that diverted fractures and reactivated natural fractures are key factors controlling seepage-capacity enhancement.
(4)
A CT-derived stimulation-effect evaluation framework was proposed by integrating pore–fracture structural modification, fracture volume increase, aperture improvement and seepage-capacity enhancement. The dual main fractures–diverted fractures–natural fractures type shows the strongest stimulation response and represents the most favorable fracture-network configuration at the core-scale. The proposed method provides direct geological evidence for optimizing perforation-cluster design, fracture-network regulation and well-pattern adjustment in tight sandstone oil reservoirs, although further integration with microseismic, logging and production data is still needed for reservoir-scale evaluation.

Author Contributions

Conceptualization, J.S. and W.H.; methodology, J.S. and J.W.; software, X.L. and Z.L.; validation, K.C. and X.H.; formal analysis, Y.Y. and Q.L.; investigation, J.W. and X.R.; resources, W.H.; data curation, X.L.; writing—original draft preparation, J.S.; writing—review and editing, W.H.; visualization, Z.L.; supervision, W.H.; project administration, J.S.; funding acquisition, W.H. All authors have read and agreed to the published version of the manuscript.

Funding

This research was supported by the National Oil and Gas Major Project of China under Grant No. 2025ZD1405400.

Institutional Review Board Statement

Not applicable.

Informed Consent Statement

Not applicable.

Data Availability Statement

The data presented in this study are available on request from the corresponding author.

Acknowledgments

We sincerely appreciate the technical team of the core CT scanning laboratory at Yangtze University for their professional guidance and technical support during core CT data acquisition, image preprocessing, and 3D fracture-network reconstruction. We also thank colleagues from the Exploration and Development Research Institute of PetroChina Changqing Oilfield Company for providing core samples, regional geological data, and valuable suggestions on hydraulic fracturing reservoir evaluation.

Conflicts of Interest

Authors Jianchao Shi, Jiwei Wang, Xiaoke Li, Kun Chen, Xu Han, Yizhuo Yang, Qiang Liu and Xinjiu Rao were employed by Exploration and Development Research Institute, PetroChina Changqing Oilfield Company. The remaining authors declare that the research was conducted in the absence of any commercial or financial relationships that could be construed as a potential conflict of interest. The authors declare that this study received funding from National Oil and Gas Major Project of China. The funder was not involved in the study design, collection, analysis, interpretation of data, the writing of this article or the decision to submit it for publication.

References

  1. Montgomery, C.T.; Smith, M.B. Hydraulic fracturing: History of an enduring technology. J. Pet. Technol. 2010, 62, 26–40. [Google Scholar] [CrossRef]
  2. King, G.E. Thirty years of gas shale fracturing: What have we learned? In Proceedings of the SPE Annual Technical Conference and Exhibition, Florence, Italy, 19–22 September 2010. Paper Number: SPE-133456-MS. [Google Scholar] [CrossRef]
  3. Cipolla, C.L.; Lolon, E.P.; Mayerhofer, M.J.; Warpinski, N.R. Fracture design considerations in horizontal wells drilled in unconventional gas reservoirs. In Proceedings of the SPE Hydraulic Fracturing Technology Conference, The Woodlands, TX, USA, 19–21 January 2009. Paper Number: SPE-119366-MS. [Google Scholar] [CrossRef]
  4. Mayerhofer, M.J.; Lolon, E.P.; Warpinski, N.R.; Cipolla, C.L.; Walser, D.W.; Rightmire, C.M. What is stimulated reservoir volume? SPE Prod. Oper. 2010, 25, 89–98. [Google Scholar] [CrossRef]
  5. Fisher, M.K.; Warpinski, N.R. Hydraulic-fracture-height growth: Real data. SPE Prod. Oper. 2012, 27, 8–19. [Google Scholar] [CrossRef]
  6. Gale, J.F.W.; Elliott, S.J.; Laubach, S.E. Hydraulic fractures in core from stimulated reservoirs: Core fracture description of HFTS slant core, Midland Basin, West Texas. In Proceedings of the Unconventional Resources Technology Conference, Houston, TX, USA, 23–25 July 2018. Paper Number: URTeC-2902624. [Google Scholar] [CrossRef]
  7. Gale, J.F.W.; Elliott, S.J.; Rysak, B.G.; Ginn, C.L.; Zhang, N.; Myers, R.D.; Laubach, S.E. Fracture description of the HFTS-2 slant core, Delaware Basin, West Texas. In Proceedings of the Unconventional Resources Technology Conference, Houston, TX, USA, 26–28 July 2021. Paper Number: URTeC-2021-5175. [Google Scholar] [CrossRef]
  8. Maity, D.; Ciezobka, J. Diagnostic assessment of reservoir response to fracturing: A case study from Hydraulic Fracturing Test Site (HFTS) in Midland Basin. J. Pet. Explor. Prod. Technol. 2021, 11, 3177–3192. [Google Scholar] [CrossRef]
  9. Kolawole, O.; Ispas, I. Interaction between hydraulic fractures and natural fractures: Current status and prospective directions. J. Pet. Explor. Prod. Technol. 2020, 10, 1613–1634. [Google Scholar] [CrossRef]
  10. Ma, Z.; Wang, Y.; Zheng, Y. In situ dynamic X-ray imaging of fluid-rock interactions inside tight sandstone during hydraulic fracturing: Fluid flow process and fracture network growth. J. Pet. Sci. Eng. 2022, 214, 110490. [Google Scholar] [CrossRef]
  11. Yang, B.; Wang, H.; Shen, Z.; Olorode, O.; Wang, B.; Zheng, Y.; Yan, W.; Jia, Z. Full-sample X-ray microcomputed tomography analysis of supercritical CO2 fracturing in tight sandstone: Effect of stress on fracture dynamics. Energy Fuels 2021, 35, 1308–1321. [Google Scholar] [CrossRef]
  12. Zhang, Y.; Ma, G. A hybrid deep learning framework to characterize 3D microfractures with high precision. Int. J. Rock Mech. Min. Sci. 2025, 165, 106317. [Google Scholar] [CrossRef]
  13. Caputo, A.; Calcagni, M.T.; Salerno, G.; Mammoliti, E.; Castellini, P. Measurement of Fracture Networks in Rock Sample by X-Ray Tomography, Convolutional Filtering and Deep Learning. Sensors 2025, 25, 4409. [Google Scholar] [CrossRef] [PubMed]
  14. Li, X.; Li, B.; Liu, F.; Li, T.; Nie, X. Advances in the application of deep learning methods to digital rock technology. Adv. Geo-Energy Res. 2023, 8, 5–18. [Google Scholar] [CrossRef]
  15. Jia, C.; Zheng, M.; Zhang, Y. Unconventional hydrocarbon resources in China and the prospect of exploration and development. Pet. Explor. Dev. 2012, 39, 139–146. [Google Scholar] [CrossRef]
  16. Yang, Z.; Zou, C. “Exploring petroleum inside source kitchen”: Connotation and prospects of source rock oil and gas. Pet. Explor. Dev. 2019, 46, 181–193. [Google Scholar] [CrossRef]
  17. Zou, C.; Yang, Z.; Sun, S.; Zhao, Q.; Bai, W.; Liu, H.; Pan, S.; Wu, S.; Yuan, Y. “Exploring petroleum inside source kitchen”: Shale oil and gas in Sichuan Basin. Sci. China Earth Sci. 2020, 63, 934–953. [Google Scholar] [CrossRef]
  18. Sun, H.; Cai, X.; Hu, D.; Lu, Z.; Zhao, P.; Zheng, A.; Li, J.; Wang, H. Theory, technology and practice of shale gas three-dimensional development: A case study of Fuling shale gas field in Sichuan Basin, SW China. Pet. Explor. Dev. 2023, 50, 651–664. [Google Scholar] [CrossRef]
  19. Sun, H.; Lu, Z.; Liu, L.; Fang, J.; Zheng, A.; Li, J.; Zhang, Y.; Xiao, J. Technology and understanding of post-fracturing coring in three-dimensional development zone of Fuling shale gas, Sichuan Basin, SW China. Pet. Explor. Dev. 2025, 52, 731–745. [Google Scholar] [CrossRef]
  20. Guo, Q.; Li, S.; Jin, Z.; Zhou, X.; Liu, C. Characteristics and exploration targets of Chang 7 shale oil in Triassic Yanchang Formation, Ordos Basin, NW China. Pet. Explor. Dev. 2023, 50, 878–893. [Google Scholar] [CrossRef]
  21. He, Y.; Xue, T.; Li, Z.; Bai, X.; Fan, J.; Zhang, X. Development technologies for Triassic Chang 7 shale oil in Ordos Basin: A case study of Qingcheng Oilfield, NW China. Pet. Explor. Dev. 2023, 50, 1426–1444. [Google Scholar] [CrossRef]
  22. Liu, H.; Huang, Y.; Cai, M.; Meng, S.; Tao, J. Practice and development suggestions of hydraulic fracturing technology in the Gulong shale oil reservoirs of Songliao Basin, NE China. Pet. Explor. Dev. 2023, 50, 688–698. [Google Scholar] [CrossRef]
  23. Meng, S.W.; Tao, J.P.; Li, T.J.; Li, D.X.; Wang, S.L.; Yang, L.; Liu, X.; Liang, L.H.; Liu, H. Mechanical characteristics and reservoir stimulation mechanisms of the Gulong shale oil reservoirs, the northern Songliao Basin. Pet. Sci. 2024, 21, 2023–2036. [Google Scholar] [CrossRef]
  24. Zhao, M. Field experiments and main understanding of shale oil hydraulic fracturing. Front. Earth Sci. 2024, 12, 1410524. [Google Scholar] [CrossRef]
  25. Zou, Y.; Shi, S.; Zhang, S.; Li, J.; Wang, F.; Wang, J.; Zhang, X. Hydraulic fracture geometry and proppant distribution in thin interbedded shale oil reservoirs. Pet. Explor. Dev. 2022, 49, 1185–1194. [Google Scholar] [CrossRef]
  26. Zang, C.; Jiang, H.; Shi, S.; Li, J.; Zou, Y.; Zhang, S.; Tian, G.; Yang, P. An analysis of the uniformity of multi-fracture initiation based on downhole video imaging technology: A case study of Mahu tight conglomerate in Junggar Basin, NW China. Pet. Explor. Dev. 2022, 49, 448–457. [Google Scholar] [CrossRef]
  27. Zhang, D.; Ma, S.; Zhang, J.; Zhu, Y.; Wang, B.; Zhu, J.; Fan, X.; Yang, H.; Liang, T. Field experiments of different fracturing designs in tight conglomerate oil reservoirs. Sci. Rep. 2022, 12, 3220. [Google Scholar] [CrossRef] [PubMed]
  28. Wang, J.; Hou, B.; Teng, W.; Li, X.; Liu, J.; Liang, B.; Zhang, Y.; Wei, Y. Research progress on mechanical characteristics and hydraulic fracture propagation mechanism of tight conglomerate reservoirs. Pet. Sci. Bull. 2024, 9, 972–990. [Google Scholar] [CrossRef]
  29. Shi, X.; Qin, Y.; Xu, H.; Feng, Q.; Wang, S.; Xu, P.; Han, S. Numerical simulation of hydraulic fracture propagation in conglomerate reservoirs. Eng. Fract. Mech. 2021, 248, 107738. [Google Scholar] [CrossRef]
  30. Wang, H.; Li, Z.; Guo, X. Quantitative characterization of stimulated reservoir volume (SRV) fracturing effects in naturally fractured unconventional hydrocarbon reservoirs. Front. Earth Sci. 2024, 12, 1419631. [Google Scholar] [CrossRef]
  31. Shi, J.; Cao, L.; Shi, B.; Shi, S.; Rao, X.; Liu, X.; Fan, W.; Chen, S.; Yu, H. Reservoir Characteristics of Tight Sandstone in Different Sedimentary Microfacies: A Case Study of the Triassic Chang 8 Member in Longdong Area, Ordos Basin. Processes 2025, 13, 3246. [Google Scholar] [CrossRef]
  32. Zhang, D.; Liu, Y.; Luo, H.; Cao, S.; Cao, J.; Li, X. Staged fracturing of horizontal wells in continental tight sandstone oil reservoirs: A case study of Yanchang Formation in western Ordos Basin, China. Front. Earth Sci. 2021, 9, 760976. [Google Scholar] [CrossRef]
  33. Xiao, G.; Hu, L.; Luo, Y.; Meng, Y.; Al-Salafi, A.B.T.; Liu, H. Multi-scale fractures formation and distribution in tight sandstones: A case study of Triassic Chang 8 Member in the southwestern Ordos Basin. Front. Earth Sci. 2022, 16, 483–498. [Google Scholar] [CrossRef]
  34. Zeng, L.; Lyu, W.; Zhang, Y.; Liu, G.; Dong, S. The effect of multi-scale faults and fractures on oil enrichment and production in tight sandstone reservoirs: A case study in the southwestern Ordos Basin, China. Front. Earth Sci. 2021, 9, 664629. [Google Scholar] [CrossRef]
  35. Liu, K.; Wang, R.; Shi, W.; Travé, A.; Martín-Martín, J.D.; Baqués, V.; Qi, R.; Lin, J.; Ye, H. Diagenetic controls on reservoir quality and heterogeneity of the Triassic Chang 8 tight sandstones in the Binchang area, Ordos Basin, China. Mar. Pet. Geol. 2022, 146, 105974. [Google Scholar] [CrossRef]
  36. Wang, H.; Gong, W.; Yuan, G.; Wang, X.; Zhao, J.; Su, Y.; Wang, Y. Effect of in-situ stress on hydraulic fracturing of tight sandstone based on discrete element method. Energies 2022, 15, 5620. [Google Scholar] [CrossRef]
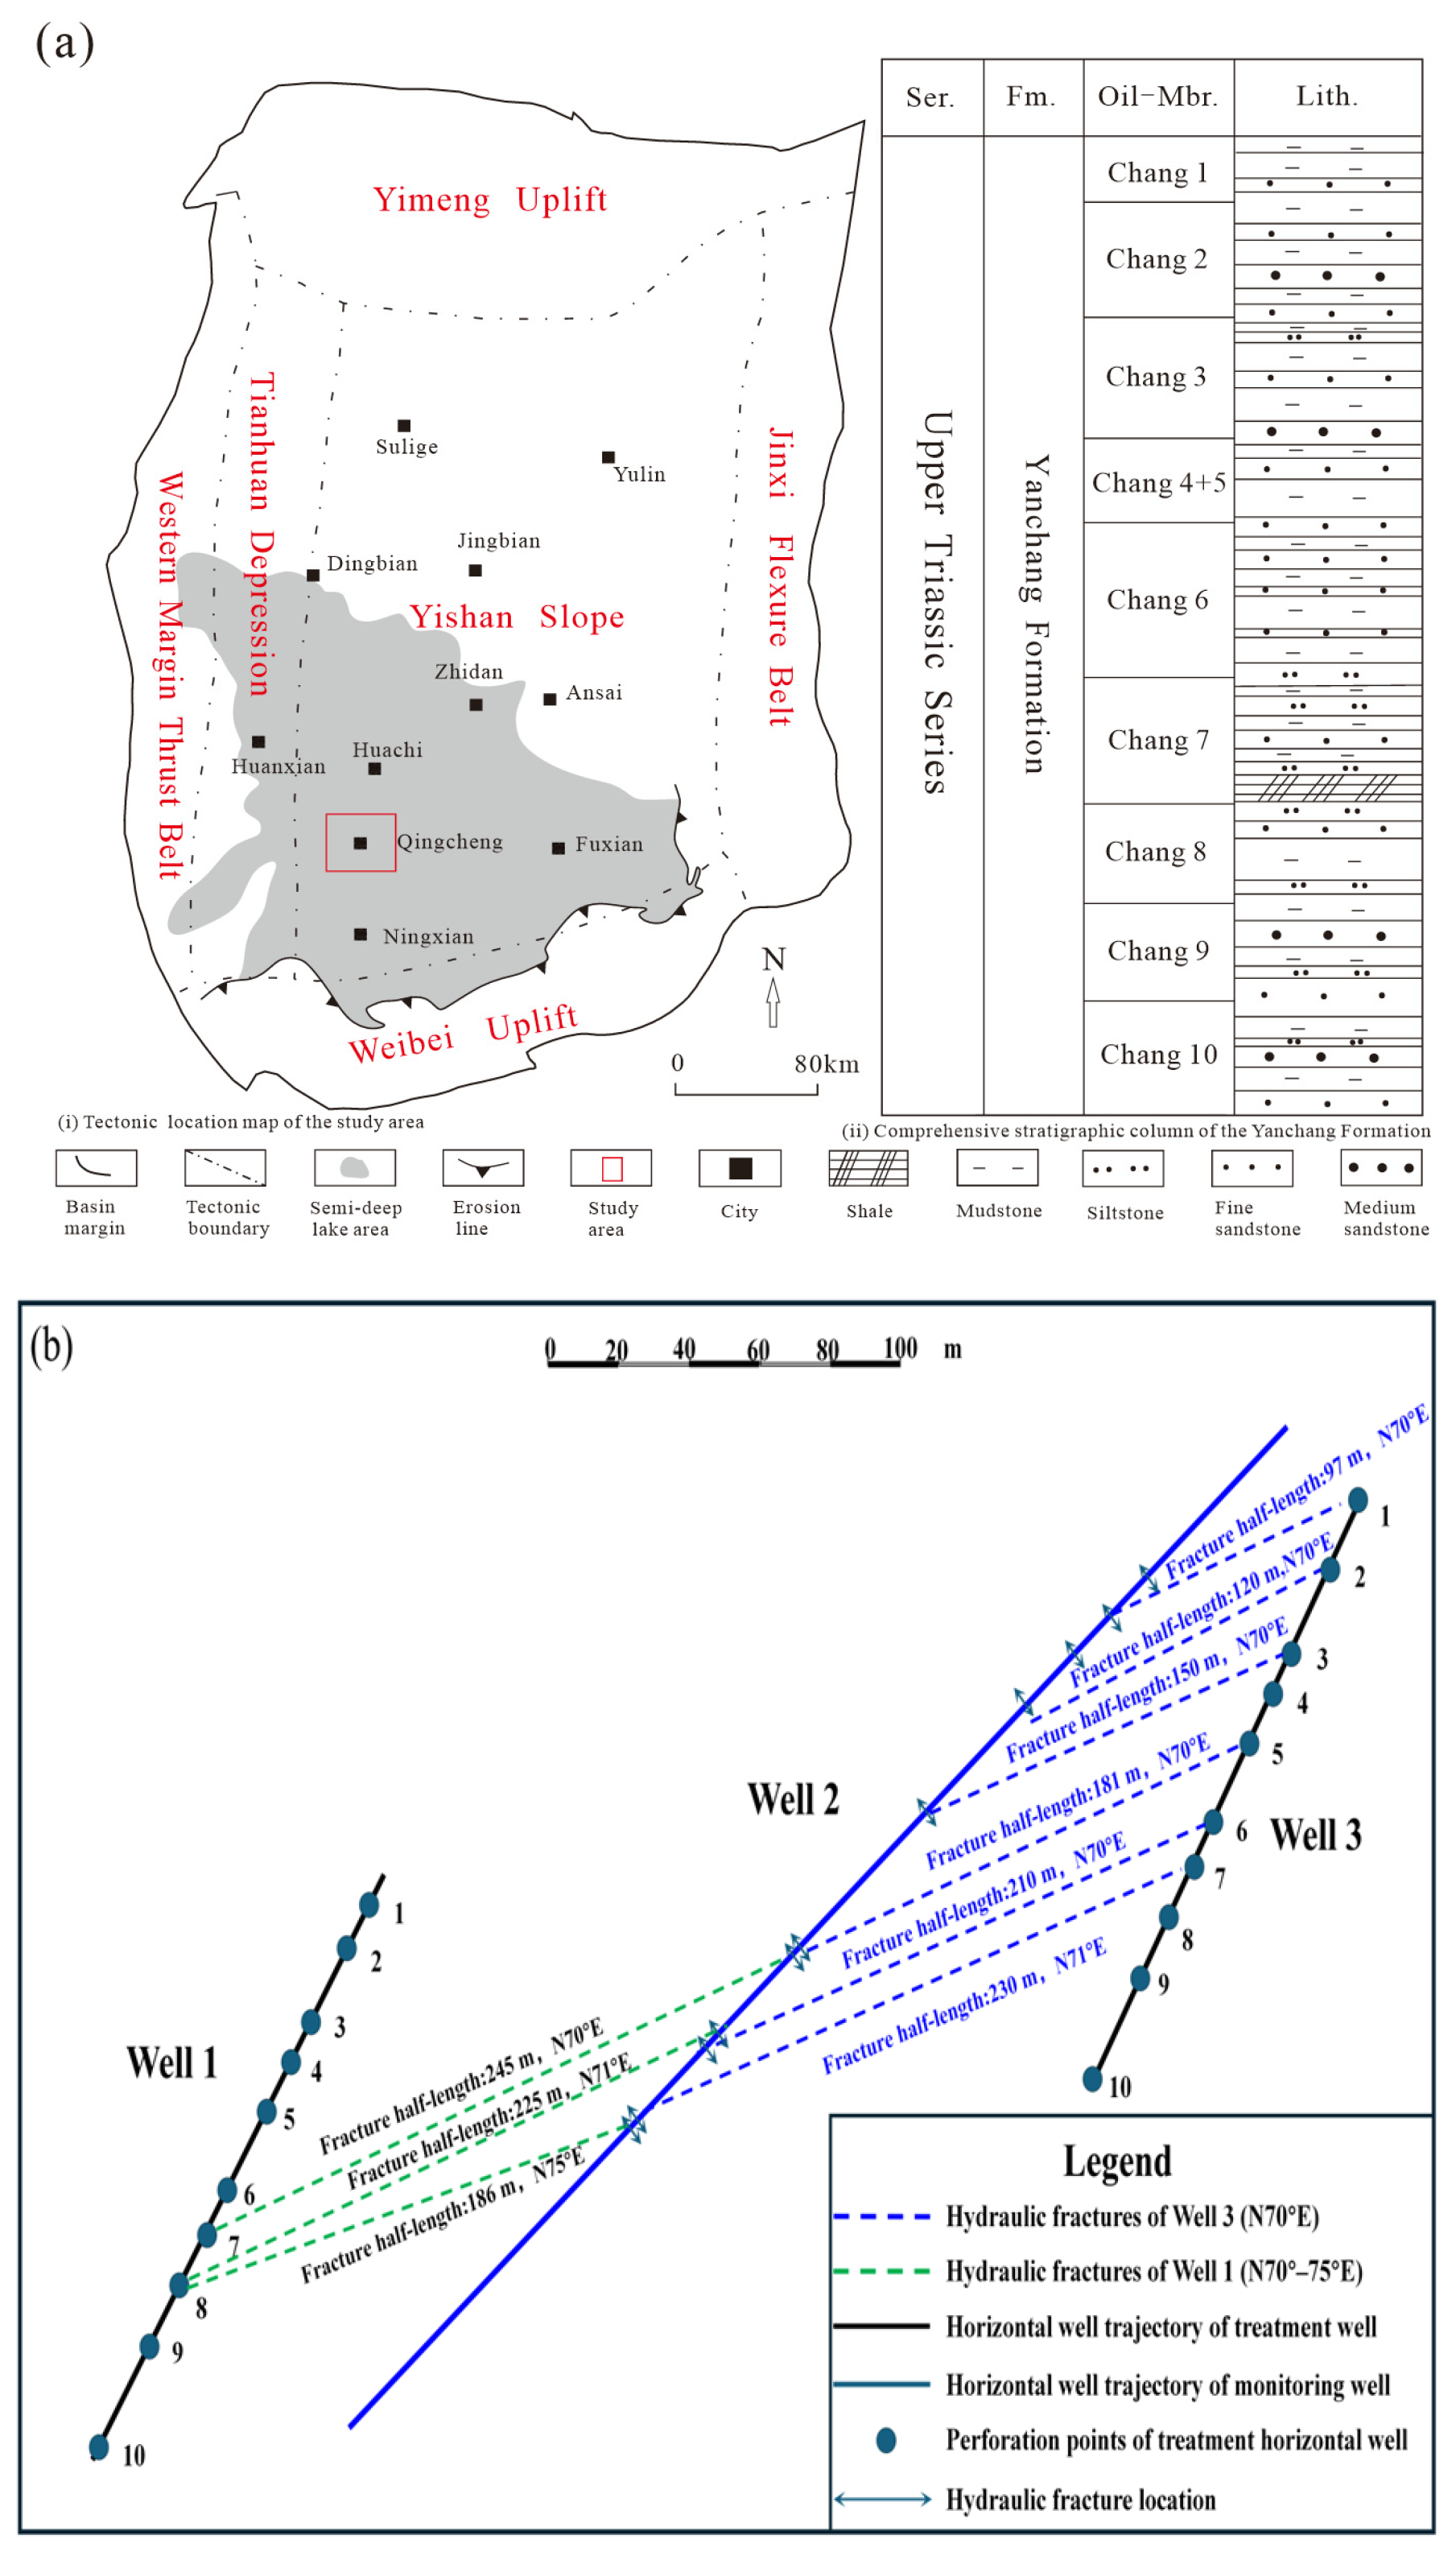
Figure 1. Geological setting and post-fracturing coring-well deployment of the Xi 119 well block. (a) Geological background, including (i) tectonic location of the study area and (ii) stratigraphic column of the Triassic Yanchang Formation; (b) deployment of the coring well and adjacent fractured horizontal wells in the Xi 119 well block.
Applsci 16 07767 g001
Figure 2. Core CT scanning dataset and image-processing workflow for full-diameter post-fracturing cores. (a) CT scanning system; (b) full-diameter core during scanning; (c) representative reconstructed CT slice; (d) interpreted fracture/lamina traces; (e) three-dimensional visualization of interpreted fracture features.
Applsci 16 07767 g002
Figure 3. Representative fracture features and source-determination evidence in post-fracturing cores. (a,b) Natural fracture; (c,d) hydraulic fracture; (e,f) engineering-induced fracture.
Applsci 16 07767 g003
Figure 4. Comparison of hydraulic fracture morphologies under different lithological structures in tight sandstone cores. Each panel pairs a core photograph (left) with the corresponding CT slice (right) from the same depth interval; blue areas in CT slices represent interpreted open fractures and bedding laminae. (a) Massive sandstone (depth: 2581.60–2582.40 m); (b) argillaceous laminated sandstone (depth: 2624.60–2625.40 m); (c) cross-bedded sandstone (depth: 2823.40–2824.30 m).
Applsci 16 07767 g004
Figure 5. Representative post-fracturing core photograph and CT-derived 3D fracture-network reconstructions for the three hydraulic fracture–natural fracture coupling types in the Chang 81 tight sandstone reservoir. (a) Macroscopic core image showing typical fracture development characteristics of post-fracturing full-diameter cores; (b) 3D reconstructed fracture network of the Type I coupling type; (c) 3D reconstructed fracture network of the Type II coupling type; (d) 3D reconstructed fracture network of the Type III coupling type. Blue regions in panels (bd) denote the interpreted open fractures.
Applsci 16 07767 g005
Figure 6. Seepage-capacity differences among three hydraulic fracture–natural fracture coupling types based on CT-derived fracture-network models. (a) Type I: single hydraulic-fracture type (depth: 2580.00–2580.48 m); (b) Type II: single main fracture–diverted fracture–natural fracture type (depth: 2823.40–2824.30 m); (c) Type III: dual main fractures–diverted fractures–natural fractures type (depth: 2599.15–2600.00 m).
Applsci 16 07767 g006
Figure 7. CT-derived multi-indicator evaluation of hydraulic-fracturing stimulation effects.
Applsci 16 07767 g007
Figure 8. Conceptual model linking lithological structure, hydraulic fracture–natural fracture coupling and stimulation effect in tight sandstone reservoirs. Single hydraulic-fracture-type fracture network (2599.36–2599.490 m); single main fracture–diverted fracture–natural fracture-type fracture network (2744.32–2744.44 m); dual main fractures–diverted fractures–natural fractures-type fracture network (2580.05–2580.30 m). The red arrows indicate the specific fracture types and propagation paths mentioned in the labels.
Applsci 16 07767 g008
Figure 9. Significant differences in seepage conductivity among the three hydraulic fracture–natural fracture coupling types simulated by CT-derived 3D digital fracture models. Type I: single hydraulic-fracture type; Type II: single main fracture–diverted fracture–natural fracture type; Type III: dual main fractures–diverted fractures–natural fractures type.
Applsci 16 07767 g009
Figure 10. Diagram of variations in key evaluation indicators of cores before and after hydraulic fracturing. (a,b) Changes in pore–fracture structure before and after fracturing; (c,d) changes in lamina-fracture aperture; (e,f) changes in total porosity before and after fracturing.
Applsci 16 07767 g010
Table 1. Core CT scanning and image-processing dataset.
FormationCore RunCumulative Scanned Length (m)Scanned Depth Interval (m)Voxel Size (μm)
Chang 8147.922557.10–2565.0250.62
68.632576.00–2584.63
89.332594.40–2603.73
99.012623.00–2632.01
139.302677.50–2686.80
172.932743.00–2745.93
189.262745.93–2755.19
219.342774.50–2783.84
229.062783.84–2792.90
243.462821.70–2825.16
259.322825.16–2834.48
Total 87.56
Table 2. Identification criteria and classification of fractures in post-fracturing cores.
Fracture CategorySubtypeKey EvidenceCT ExpressionGeometryNetwork Role
Natural fractureTectonic fractureSlickensides, cement/bitumen filling; consistent with regional fracture trend.Continuous or semi-continuous high-angle bands; cuts bedding.High angle; locally long.Natural weak plane; may be reactivated.
Bedding/lamina fractureFollows bedding or laminae; sedimentary control is obvious.Low-angle or bedding-parallel thin bands; commonly discontinuous.Low angle; variable continuity.Guides diversion and branching.
Diagenetic shrinkage fractureShrinkage/dehydration-related; small and irregular.Point-like, short-linear or reticulate low-gray anomalies.Small aperture; short extension.Minor connector in microfracture networks.
Hydraulic fractureMain fractureFresh tensile surface; proppant/tracer evidence; near maximum horizontal stress direction.High-gray, wide and continuous bands.Large aperture; strong continuity; good cross-bed penetration.Main conductive pathway.
Diverted fractureMain fracture deflected by bedding, natural fractures, lithologic interfaces or local stress.Curved, branched or zigzag bands.Oblique to main fracture; shorter extension.Connects main and natural fractures.
Reactivated fractureReopened or enlarged pre-existing natural fracture.Gray value and aperture increase along existing fracture.Inherits original attitude; uneven aperture.Couples hydraulic and natural fractures.
Engineering-induced fractureDrilling-induced fractureBorehole disturbance or stress release.Local short cracks near borehole or damaged zones.Small scale; orientation differs from geological fractures.Screen out from effective network assessment.
Table 3. Hydraulic-fracture surface characteristics in different lithological structures.
Rock-Structure TypeQualitative
Morphological
Description
Quantitative
Aperture & Continuity Features
CT Image
Characteristics
Role of Natural Weak Planes/
Bedding
Engineering
Implication
Massive sandstoneStraight and complete main fractures; little diversion or branching.Aperture: 80–2000 μm; single continuous main fracture; core-scale extension > 50 cm.High-gray continuous wide bands.Weak bedding control; low natural-fracture activation potential.High-conductivity main fracture; relatively low network complexity; suitable for increasing fracture density.
Argillaceous laminated sandstoneBending or discontinuous fractures along laminae; steps and irregular surfaces.Aperture: 20–600 μm, highly uneven; frequent interruption by argillaceous laminae; single segment length <30 cm.Low–medium-gray discontinuous bands along laminae.Strong lamina/argillaceous control; bedding fractures are easily activated but poorly connected.Limited continuity; optimize fluid volume, injection rate and proppant placement to maintain conductivity.
Cross-bedded sandstoneMain fracture diversion along bedding; branches and reactivated bedding fractures.Aperture: 40–1000 μm; multi-directional fracture intersection; local network structure.Medium–high-gray interlaced bands with clear branches.Cross-bedding provides preferential weak planes; high natural-fracture activation potential.Favors complex network development; focus on local connectivity maintenance and proppant transport.
Table 4. Classification of hydraulic fracture–natural fracture coupling types.
TypeFracture AssemblageQualitative
Identification Criteria
Key Quantitative
Characteristics
Seepage-Capacity CharacteristicsGrade
Type I: Single hydraulic-fracture typeSingle main hydraulic fracture; weak or absent natural-fracture coupling.Clear main fracture; few branches; weak diverted/reactivated fractures.Linear density 2–4 fractures/m; connectivity <20%; equivalent permeability <200 mD.Single-path flow; limited matrix supply.Weak
Type II: Single main fracture–diverted fracture–natural fracture typeOne main fracture linked to diverted fractures and local natural/lamina fractures.Distinct spatial intersections; local multi-branch conductive channels.Linear density 5–8 fractures/m; connectivity 20–60%; equivalent permeability 200–350 mD.Branching network flow; expanded matrix supply range.Moderate
Type III: Dual main fractures–diverted fractures–natural fractures typeTwo main hydraulic fractures plus diverted and abundant reactivated natural fractures.Coexisting parallel/intersecting main fractures; extensive natural fracture participation; high 3D connectivity.Linear density >8 fractures/m; connectivity >60%; equivalent permeability >350 mD.Composite conductive network with strongest seepage capacity.Strong
Table 5. CT-derived indicators and classification criteria for stimulation-effect evaluation.
Evaluation
Dimension
IndicatorCalculation/ExpressionDiagnostic TendencyInterpretive
Meaning
Pore–fracture structural modificationSmall-aperture pore/fracture proportionCompare fractured and adjacent non-fractured intervals; use <80 μm or original size classes.Lower small-aperture proportion and higher large-aperture proportion.Indicates dilation and connection of micro-scale pore–fracture structures.
Fracture volume increaseFracture porosity or total porosity changeCompare CT-derived porosity/fracture porosity between fractured and adjacent intervals.Increased porosity or fracture porosity.Indicates added or enlarged connected fracture volume.
Aperture improvementLamina-fracture aperture or mean fracture apertureCompare lamina/natural-fracture apertures; <200 μm can be used for lamina-fracture statistics.Aperture enlargement.Indicates activation/opening of natural weak planes; auxiliary evidence only.
Seepage-capacity enhancementEquivalent permeability changeCT-based 3D seepage simulation; compare X/Z or equivalent permeability under stated boundary conditions.Increased permeability.Indicates enhanced conductivity; state model scale, flow direction and boundary conditions.
Integrated classificationStimulation-effect gradeIntegrate structural modification, fracture volume, aperture and seepage-capacity response.Multiple indicators improve with higher coupling complexity.Classify as weak/moderate/strong at the Chang 81 core-scale; not a universal standard.
Table 6. Variations in key parameters for hydraulic fracturing stimulation-effect evaluation.
Evaluation DimensionIndicatorType IType IIType III
Pore–fracture structure (pores/fractures with aperture <80 μm)Pre-fracturing proportion78.30%68.37%71.96%
Post-fracturing proportion76.44%65.55%64.49%
Absolute change (pre–post)1.86%2.82%6.43%
Relative change ((pre–post)/pre)2.38%4.07%8.91%
Bedding fracture aperture (fractures with aperture <200 μm)Pre-fracturing mean aperture131.92 μm140.02 μm140.81 μm
Post-fracturing mean aperture134.85 μm145.20 μm199.37 μm
Absolute change (post–pre)2.93 μm5.18 μm58.56 μm
Relative change ((post–pre)/pre)2.22%3.70%41.58%
Total porosityPre-fracturing6.60%11.20%11.08%
Post-fracturing7.24%13.66%15.41%
Absolute change (post–pre)0.64%2.46%4.33%
Relative change ((post–pre)/pre)9.70%21.96%39.08%
Matrix permeabilityPre-fracturing0.09 mD2.00 mD1.93 mD
Post-fracturing0.13 mD2.67 mD5.79 mD
Absolute change (post–pre)0.04 mD0.67 mD3.86 mD
Relative change ((post–pre)/pre)44.44%33.50%200%
Disclaimer/Publisher’s Note: The statements, opinions and data contained in all publications are solely those of the individual author(s) and contributor(s) and not of MDPI and/or the editor(s). MDPI and/or the editor(s) disclaim responsibility for any injury to people or property resulting from any ideas, methods, instructions or products referred to in the content.