Article

Tail Risk Assessment of Coal Mine Roof Instability Under Small-Sample Constraints Based on D-Vine Copula and TVAE Modeling

1
Key Laboratory of Transparent Mine Geology and Digital Twin Technology, National Mine Safety Administration, Beijing 100039, China
2
General Prospecting Institute of China National Administration of Coal Geology, Beijing 100039, China
3
State Key Laboratory of Intelligent Construction and Healthy Operation & Maintenance of Deep Underground Engineering, School of Mechanics and Civil Engineering, China University of Mining and Technology, Xuzhou 221116, China
4
School of Civil Engineering and Architecture, Hainan University, Haikou 570228, China
*
Author to whom correspondence should be addressed.
Appl. Sci. 2026, 16(15), 7753; https://doi.org/10.3390/app16157753
Submission received: 8 July 2026 / Revised: 27 July 2026 / Accepted: 28 July 2026 / Published: 4 August 2026
(This article belongs to the Section Civil Engineering)

Abstract

Ensuring the stability of coal mine roofs is a critical technical prerequisite for safe underground operations and the structural stability of underground engineering systems in mining areas. However, roof instability is governed by the variability and dependence structure of multiple geotechnical parameters, including elastic modulus, Poisson ratio, cohesion, and internal friction angle. To address the challenges of insufficient modeling accuracy for multivariate joint distributions and the difficulty of tail-risk assessment under small-sample constraints, this study proposes reproducible data generation methods using the D-Vine Copula and Tabular Variational Autoencoder (TVAE) for assessing the reliability risk of coal mine roof structures from multiple sources. Based on 192 sets of measured data, the performance of both methods in simulating the multivariate joint distribution of geotechnical parameters is systematically compared. The results indicate that the key geotechnical parameters of the coal mine roof exhibit pronounced non-normal marginal distributions, nonlinear inter-variable dependence, and sparse data coverage in high-value regions. Both simulation methods are capable of effectively characterizing the asymmetric dependency structures among the parameters. Nevertheless, D-Vine Copula exhibits considerable statistical uncertainty in tail parameter estimation, resulting in substantial extrapolation of simulation samples for elastic modulus and cohesion. In contrast, TVAE provides a more robust statistical basis than the Copula approach for tail risk assessment under extreme parameter combinations. The proposed methodology offers a critical data foundation for stability analysis in complex geological conditions, thereby supporting disaster prevention and providing a reliable engineering basis for the structural design and risk control of underground mining systems.

1. Introduction

Coal mine roof instability ranks among the most severe geohazards in underground mining operations, and its failure mechanism is governed by the combined effects of multiple physical and mechanical parameters of the overlying geotechnical structure [1,2,3]. Under mining-induced disturbances, the original stress equilibrium of the roof geotechnical structure is disrupted, and the structure undergoes a progressive damage evolution process from elastic deformation to fracture propagation [4,5]. As the goaf continuously expands, localized roof falls or large-scale overall collapse may eventually be triggered. Within this failure mechanism, the mechanical parameters of the geotechnical structure are influenced by multiple geological factors, including depositional environment, lithological variation, and tectonic stress, exhibiting significant spatial heterogeneity and stochastic variability. The intrinsic correlations and couplings further amplify the uncertainty in the roof instability mechanism [6,7,8,9]. Coal mine roof failure not only poses a direct threat to the safety of underground workers but also induces a series of environmental consequences, including surface subsidence and groundwater contamination, thereby constituting a serious threat to the structural safety and long-term serviceability of underground mining engineering systems [10,11]. Consequently, developing roof reliability analysis methods capable of adequately characterizing the probabilistic information and dependency structures of multidimensional geotechnical parameters holds considerable scientific significance and engineering value for the prevention of coal mine roof disasters and the structural safety design of underground mining engineering.
Within the probabilistic analysis framework for coal mine roof stability, the accurate construction of a multivariate joint distribution model for mechanical parameters is an essential prerequisite for reliability assessment [12]. However, owing to the complexity of the underground testing environment, the number of measured geotechnical parameter samples obtainable from a single mine is typically very limited. Constructing high-dimensional joint distribution models directly from small-sample data presents severe challenges of the curse of dimensionality and statistical uncertainty. Integrating multi-source measured samples from multiple coal mines with diverse geological backgrounds represents an effective strategy to expand the parameter space coverage and enhance the representativeness of the distribution model under limited sample constraints. Meanwhile, existing studies on roof reliability analysis frequently assume mutual independence among mechanical parameters or adopt multivariate normal distributions for dependence modeling, thereby neglecting the widespread nonlinear and asymmetric dependency structures among parameters and their consequent influence on failure probability estimation [13,14,15,16]. Such simplifications may introduce systematic biases in instability risk assessment, particularly under extreme loading conditions. Copula theory has attracted considerable attention in the field of geotechnical reliability analysis in recent years, owing to its capacity to decouple marginal distributions from dependency structures and to flexibly characterize joint distributions of arbitrary form [17,18,19,20]. Among these, Vine Copula decomposes a high-dimensional joint probability density function (PDF) into a series of bivariate Copula functions, thereby overcoming the restriction of conventional elliptical Copulas to symmetric dependency structures. This decomposition allows flexible selection of the optimal bivariate Copula for each parameter pair, enabling precise characterization of the complex nonlinear dependencies among multi-source roof geotechnical parameters [21,22].
On this basis, further improving the statistical robustness of the joint distribution model under small-sample constraints remains a key challenge for reliable roof engineering design and risk control. In recent years, deep generative models have provided a novel, reproducible technical pathway for the probabilistic augmentation of multidimensional parameters [23,24]. Compared with Generative Adversarial Networks (GANs), which rely on adversarial training, Variational Autoencoders (VAEs) are built upon a likelihood estimation framework that maximizes the Evidence Lower Bound (ELBO). This formulation offers more stable training convergence under small-sample constraints, and the KL divergence regularization term effectively mitigates the risks of overfitting and mode collapse [25,26,27]. In particular, TVAE (Tabular Variational Autoencoder), specifically designed for tabular multivariate data, incorporates a variational Gaussian mixture preprocessing mechanism that accurately captures the multimodal skewed distributions and nonlinear boundary constraints of geotechnical parameters [28,29,30,31,32]. By strictly preserving the statistical characteristics of the measured data, TVAE achieves effective augmentation of the multivariate joint probability space. This process provides a statistically sound and transparent sample basis for subsequent high-precision Monte Carlo Simulation (MCS) reliability calculations. Consequently, the proposed method serves as an advanced computational tool that effectively supports risk mitigation and reliability-based structural design in underground mining engineering.
Probabilistic roof reliability analysis under small-sample constraints can be summarized as two challenges. First, conventional multivariate joint-distribution models, particularly those based on independence assumptions or multivariate normal distributions, fail to adequately capture the non-normal marginals and the nonlinear, asymmetric dependence structures inherent in key roof geotechnical parameters. This inadequacy leads to systematic biases in failure probability estimation, especially under extreme loading conditions. Second, the sparse coverage of extreme parameter combinations in limited field data renders tail-risk estimation highly uncertain. Direct application of small-sample measurements to MCS produces unstable failure probability estimates that lack statistical robustness. These two challenges together undermine the reliability of current risk assessment frameworks for coal mine roof stability in complex geological conditions.
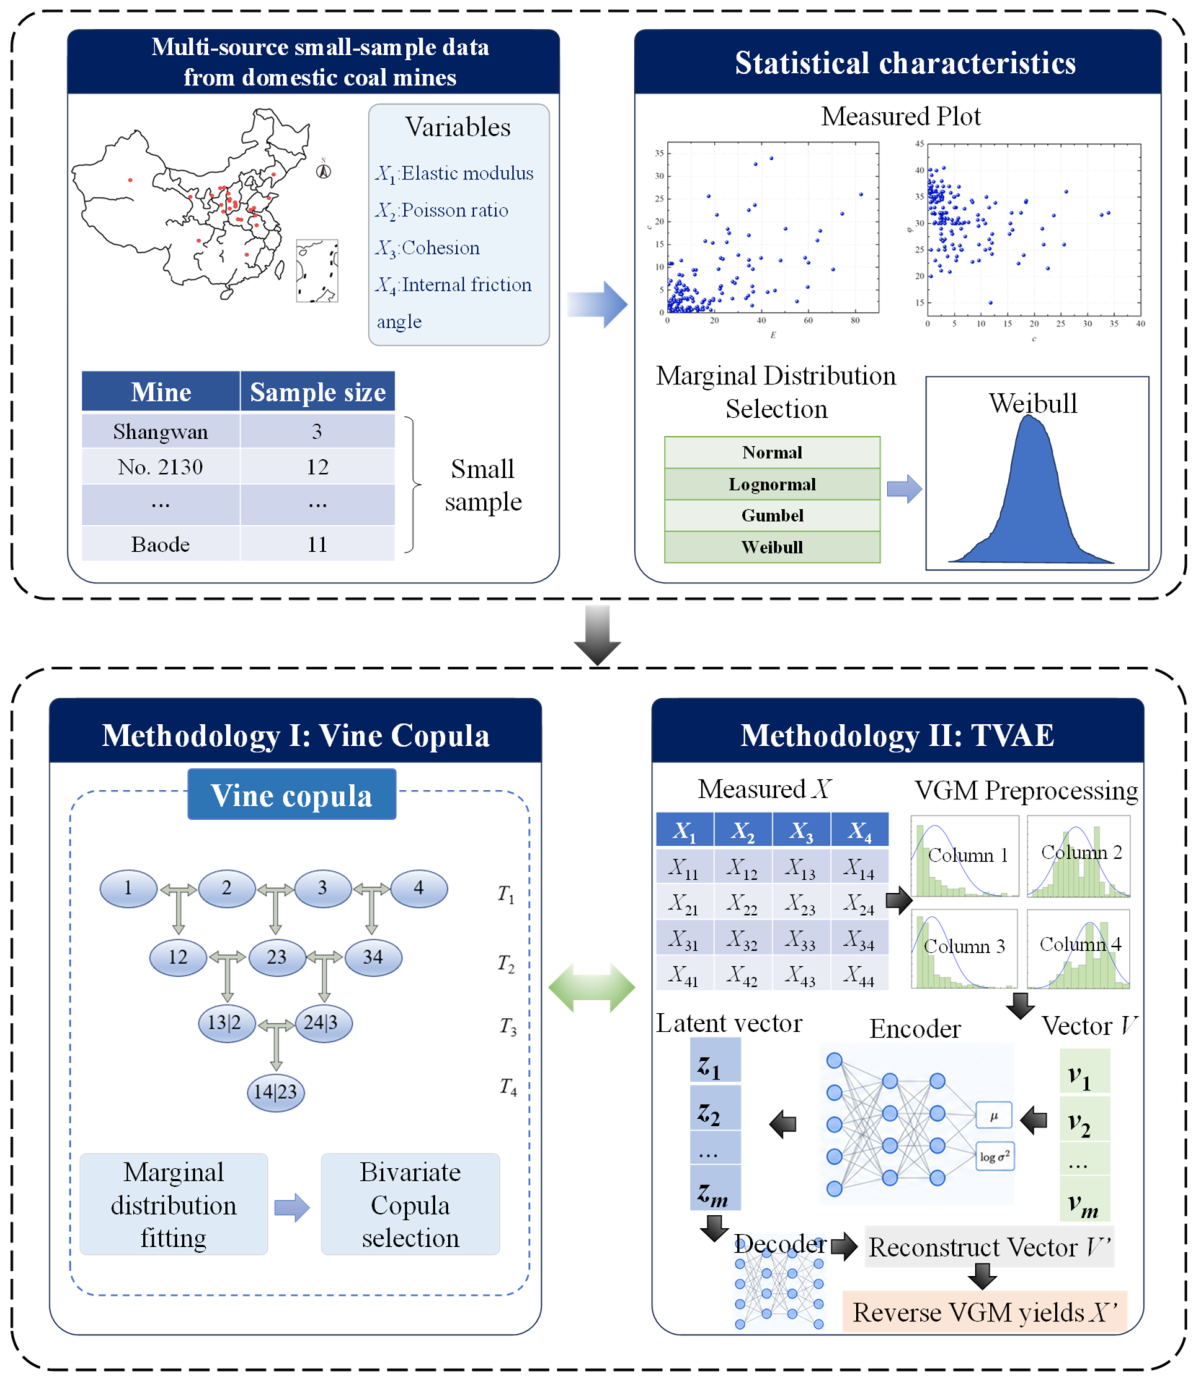
To address the above challenges, this study establishes and systematically compares two reproducible data-generation approaches based on 192 sets of multi-source field measurements collected from 31 domestic coal mines. Employing the D-Vine Copula, which flexibly characterizes asymmetric dependence through bivariate Copula selection, and the TVAE, which learns high-dimensional joint distributions through deep generative modeling, the research process is illustrated in Figure 1. The investigation focuses on four key geotechnical variables governing roof stability, including elastic modulus (E), Poisson’s ratio (ν), cohesion (c), and internal friction angle (φ), and evaluates their performance in simulating multivariate joint distributions and assessing tail risk under extreme parameter combinations. The reliability results are quantified through plane-model safety factors, and the CVaR tail-risk metric is introduced to compare the performance of the two methods in reliability analysis under extreme parameter combinations, thereby providing a methodological reference for coal mine roof reliability assessment under small-sample constraints.

2. Methods of Reliability Analysis for Coal Mine Roof Structures with Small Samples and Multiple Data Sources

In this section, the reliability analysis methods applied to measured data from multiple domestic coal mines are examined using reliability analysis models for coal mine roof stability derived from existing research. A plane-model reliability analysis function for coal mine roofs is first introduced to identify the key geotechnical parameters governing the reliability model. Subsequently, the Vine Copula model capable of constructing various correlation structures is introduced. Finally, the TVAE generative model is introduced.

2.1. Reliability Analysis Model for Coal Mine Roof Structures

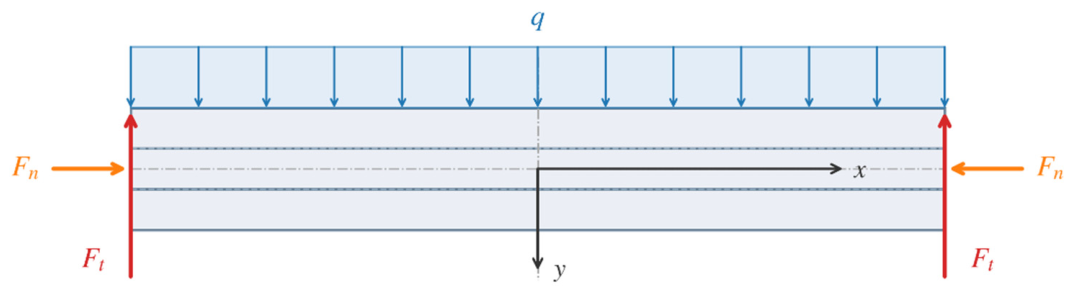
The plane model for coal mine roof stability adopts the Mohr–Coulomb analytical framework proposed by Cao et al. [33], in which the horizontal rock mass is treated as isotropic and the effects of excavation height and in situ stress are neglected. The force diagram of the roof is illustrated in Figure 2, where q denotes the uniformly distributed load applied to the upper surface of the roof, Fn represents the lateral pressure acting on the analyzed section, Ft is the supporting force provided by the coal pillar, and the positive directions are defined as horizontally rightward and vertically downward.
By combining the semi-inverse method with the stress function, as described by Cao et al. [33], analytical expressions for the safety factors of a planar roof in its top, bottom, and side regions can be derived.
F S 1 = γ h 0 2 tan φ k 0 + 1 + 3 4 n 2 + a 10 b c + γ h 0 2 f s cos φ + sin φ tan φ k 0 1 + 3 4 n 2 + a 10 b F S 2 = γ h 0 2 tan φ k 0 3 4 n 2 a 10 b c + γ h 0 2 f s cos φ + sin φ tan φ k 0 3 4 n 2 a 10 b F S 3 = γ h 0 2 f s cos φ + sin φ tan φ 1 4 + 3 4 n 2 3 γ h 0 4 tan φ c
where fs is the specified safety factor, c is the cohesion, φ is the angle of internal friction, a = 1/G − 2ν(1 − ν)/E, b = (1 − ν2)/E, E is the elastic modulus of the soil, ν is the Poisson ratio, G is the shear modulus, h0 is the depth of the roof, n is the roof collapse thickness ratio, and k0 is the lateral pressure coefficient. FS1, FS2 and FS3 represent the safety factors at the top, bottom, and side regions of the roof, respectively. The corresponding region is considered to have failed when any safety factor is greater than 0. Among these, cohesion c directly determines the shear strength of the roof in a linear form; a smaller c yields a lower safety factor and thus a higher failure risk. The internal friction angle φ regulates the critical condition of slip failure through the frictional effect, while the elastic modulus E and Poisson’s ratio ν jointly determine the deformation response of the roof under loading. A smaller E corresponds to lower roof stiffness, resulting in larger deformation under the same load and a more pronounced boundary stress concentration effect. According to the study by Cao et al. [33], the bottom region (FS2) is the dominant location governing the failure of the roof system, and therefore FS2 is adopted as the core indicator in the subsequent reliability analysis. Furthermore, among the uncertain geotechnical variables involved in the above reliability performance function, E, ν, c, and φ are selected as the key variables for the reliability assessment of the plane roof structure in this study.

2.2. Multidimensional Geotechnical D-Vine Copula Model for Roof Structures

Unlike conventional multivariate elliptical Copula families, Vine Copula is not restricted to a single dependence structure or a uniform tail dependence pattern, allowing flexible selection of the optimal dependence structure for each pair of variables. By constructing vine trees with specified topological structures, such as C-Vine and D-Vine, the complex high-dimensional joint PDF is decomposed into a product of a series of bivariate Copulas and marginal cumulative distribution functions (CDFs). This study employs the D-Vine Copula, which is applicable to asymmetric geotechnical structures, to establish a joint distribution model. The functional expression for this model can be represented as [34,35]:
f 1 , 2 , , n x 1 , x 2 , , x n = f 1 x 1 f 2 1 x 2 x 1 f 3 1 , 2 x 3 x 1 , x 2 f n 1 , 2 , , n 1 x n x 1 , x 2 , , x n 1
Expanding the conditional PDFs, the expression can be further rewritten as:
f 1 , 2 , , n x 1 , x 2 , , x n = i = 1 n f i x i × j = 1 n 1 k = 1 n j D k , j + k k + 1 , , k + j 1 ( F k k + 1 , , k + j 1 x k x k + 1 , , x k + j 1 , F k + j k + 1 , , k + j 1 x k + j x k + 1 , , x k + j 1 ; θ )
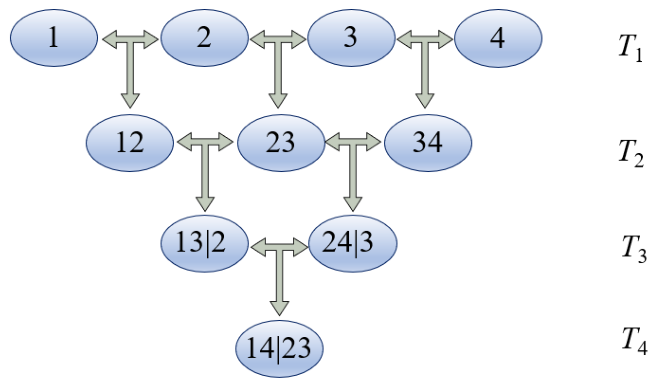
where fi(xi) is the PDF of variable xi; θ is the correlation parameter; n is the number of dimensions of the variable; j represents the layer number of the Vine Copula; k is the kth link in the tree of the jth layer, where k = nj. In this study, Figure 3 shows a schematic diagram of a four-dimensional D-Vine Copula, corresponding to j = 4. When j = 1, this corresponds to a T1-layer tree with a total of k = 3 links. This study considers the commonly used Gaussian copula, t-copula, Clayton copula, and Gumbel-Frank copula as candidate bivariate copulas for the Vine copula. Table 1 lists the PDF, CDF, and the range of values for the parameter θ for these five copula functions [22].

2.3. A TVAE-Based Method for Generating Geotechnical Small-Sample Data

TVAE is a deep generative model specifically optimized for tabular data. Its core principle is to learn the latent probability distribution of real geotechnical parameters through a probabilistic encoder–decoder architecture, thereby generating synthetic samples that closely reproduce the statistical characteristics of the measured data. The training objective of TVAE is to maximize the ELBO of the marginal likelihood. Equivalently, the loss function is defined as the minimization of the negative ELBO, expressed as:
L TVAE ( θ , φ ; x ) = Ε q φ ( z | x ) [ log p θ ( x | z ) ] + D KL ( q φ ( z | x ) p ( z ) )
where L TVAE(θ′, φ′; x) is the total loss function of the model. To distinguish between soil parameters and correlation parameters, θ′ and φ′ are adopted to denote the network weight parameters of the encoder and decoder, respectively. −E′(z|x)[·] is the reconstruction loss, which measures the accuracy of the decoder in reconstructing the input. DKL(·) is the Kullback–Leibler (KL) divergence, which measures the difference between the posterior distribution and the prior distribution.
In the task of geotechnical data generation under small-sample conditions, TVAE offers the following notable advantages over GAN and conventional VAE. (1) TVAE exhibits superior training stability. GAN relies on adversarial training strategies, which are susceptible to mode collapse and vanishing gradients under small-sample constraints. TVAE, by contrast, is grounded in a likelihood estimation framework in which the KL divergence term acts as a natural regularizer. This ensures stable convergence even under small-sample conditions and allows the model to accurately capture parameter boundaries. (2) TVAE achieves higher accuracy in modeling multimodal and nonlinearly distributed data. Conventional VAE assumes that input data follows a simple unimodal Gaussian distribution, making it incapable of handling the skewed, multimodal, and boundary-constrained distributions commonly observed in geotechnical parameters. By incorporating variational Gaussian mixture preprocessing, TVAE substantially improves the fidelity of the generated data relative to the observed distribution. (3) TVAE effectively suppresses overfitting and noise amplification. TVAE achieves effective probabilistic mapping by outputting the mean and variance of the distribution rather than specific numerical values.

3. Illustrative Example

3.1. Correlation Characteristics of Geotechnical Parameters of Multi-Source Roof Structures

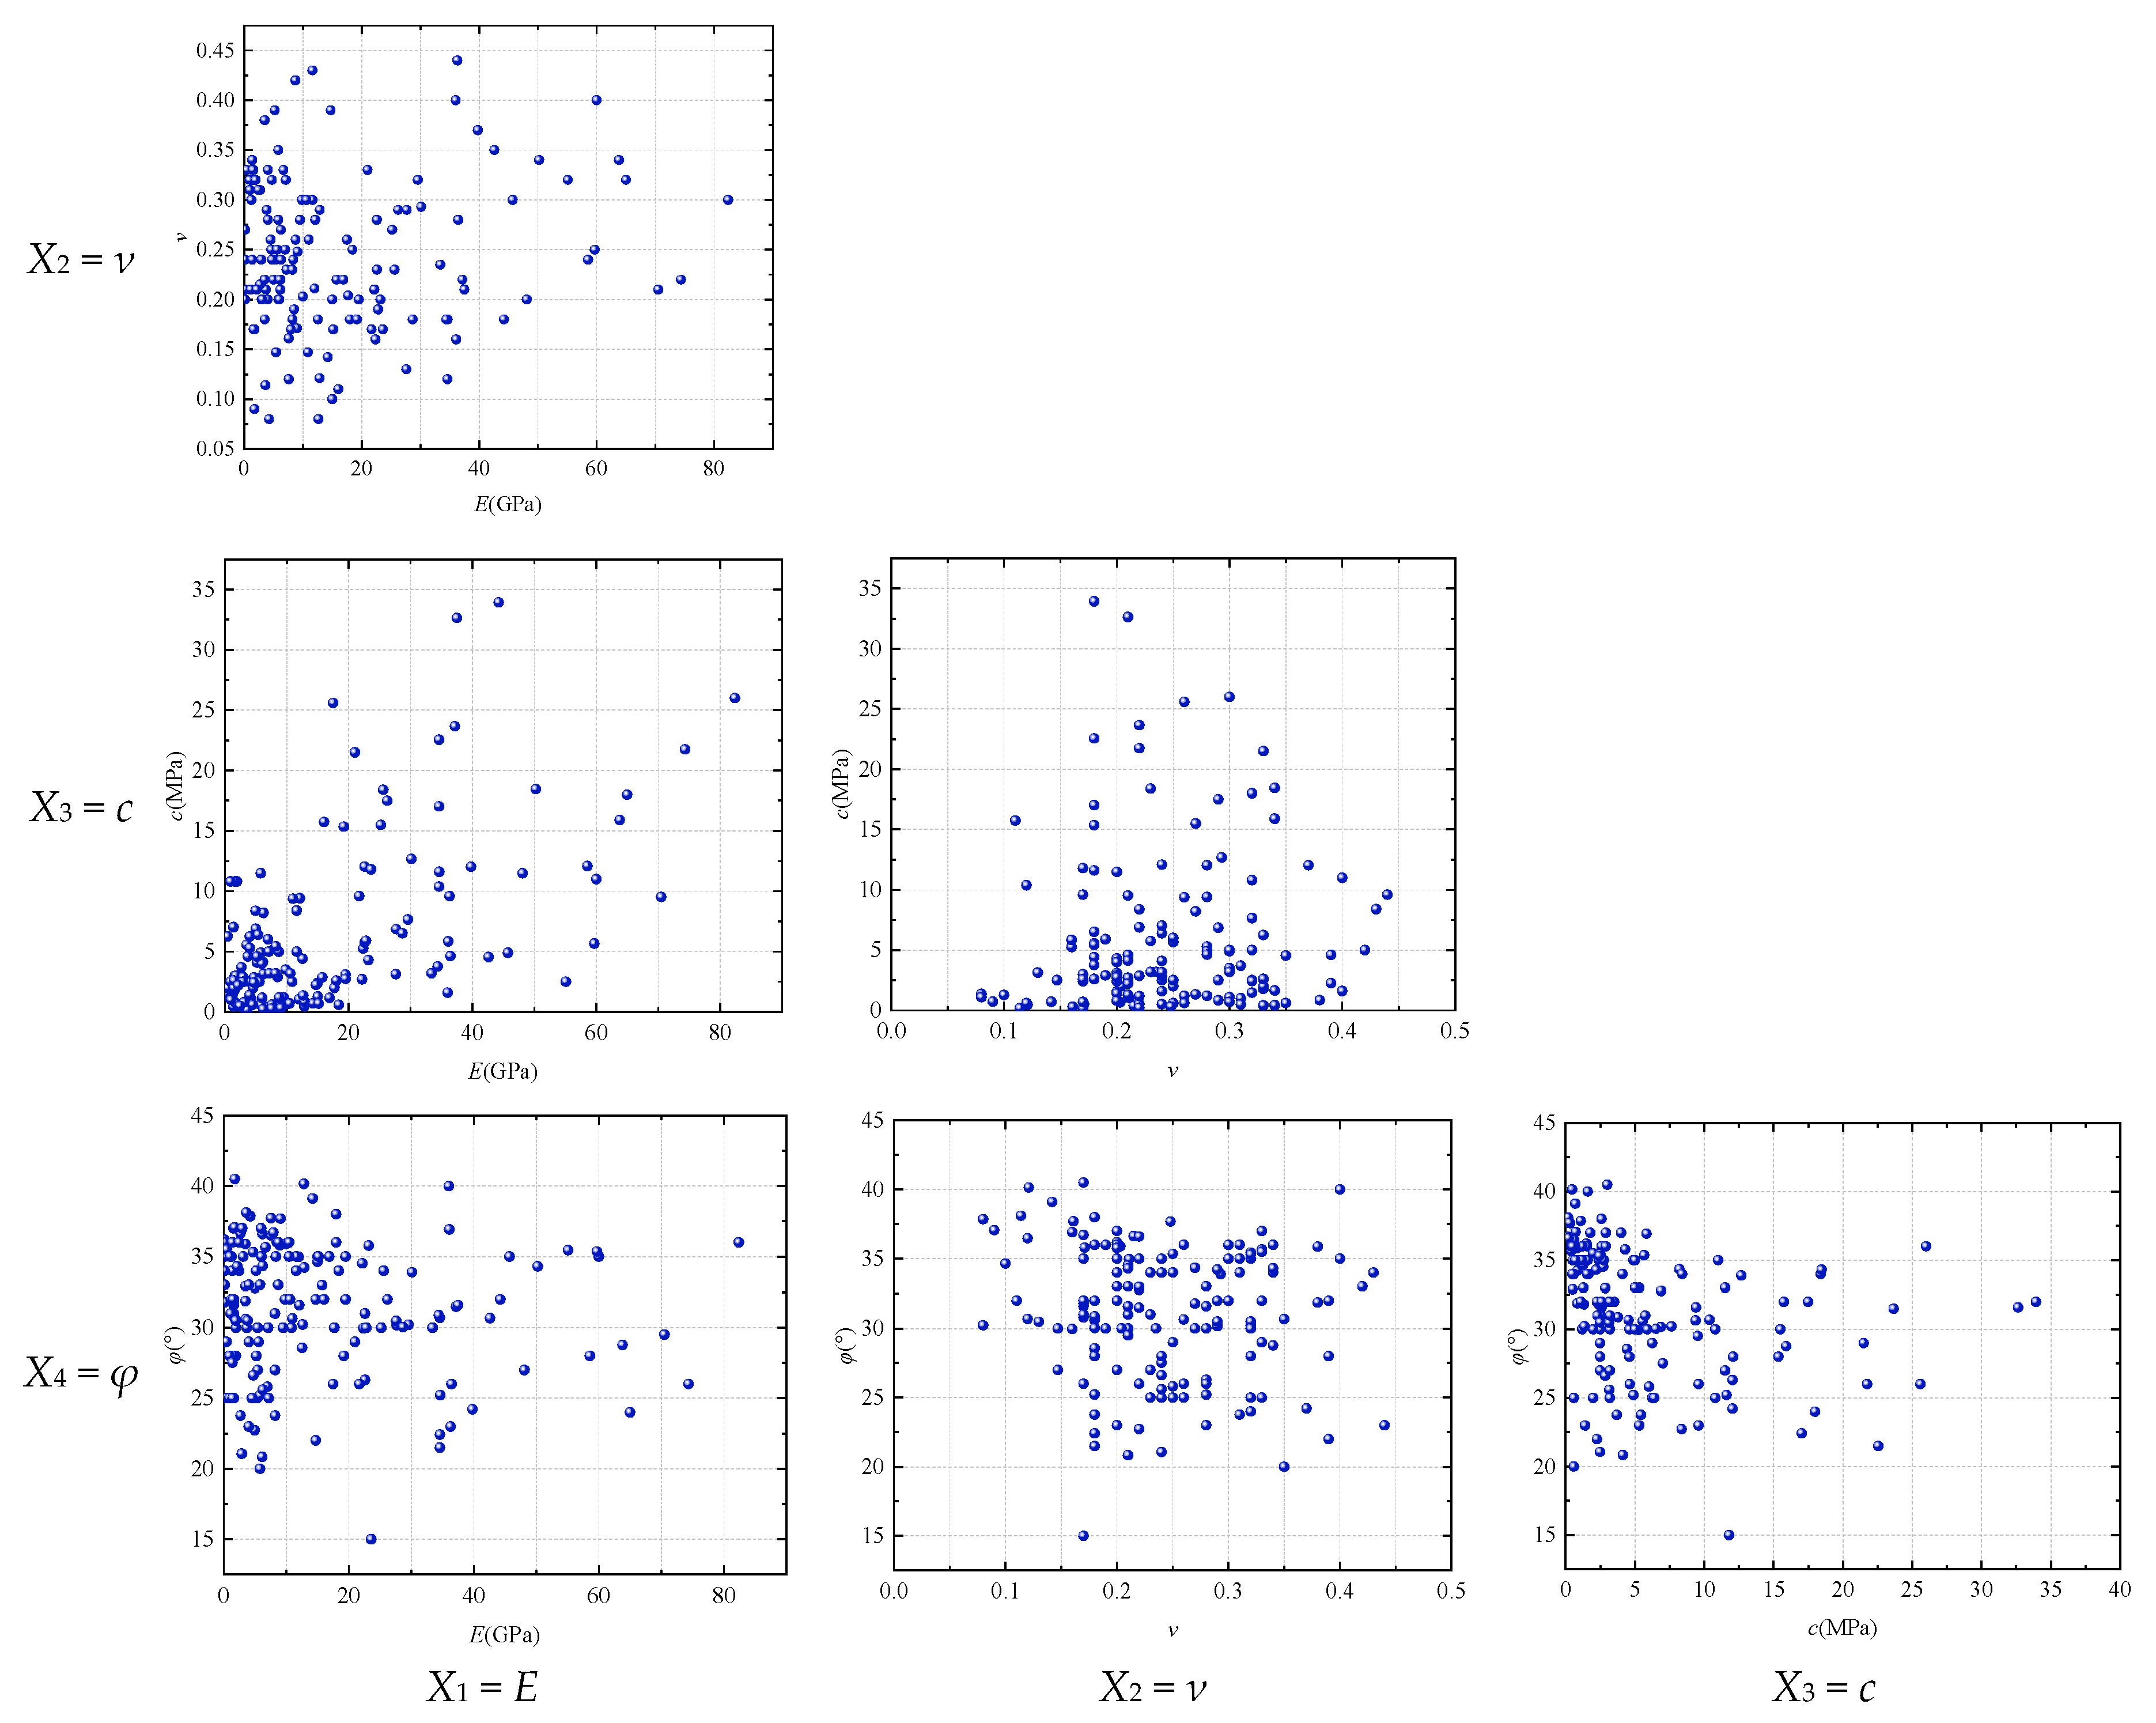
Using the 192 sets of coal mine roof data from 31 domestic mines with varying stratigraphic conditions summarized by Cao et al. [33], each set of samples includes four key variables describing the roof structures. For different coal mines, specific roof conditions, testing methods, and measured data can be found in the literature compiled in Reference [33]. Figure 4 shows the two-dimensional distribution of these four parameters based on measured data.
The pairwise distribution results reveal that all four key variables exhibit pronounced non-normal marginal characteristics. In high-value regions, the data points of each parameter are notably sparse. In particular, E and c are concentrated in low-value intervals, exhibiting typical skewed distributions with heavy tails. Regarding the dependency structure, a significant positive correlation is observed between E and c, while a pronounced negative correlation exists between c and φ. In particular, the E-c joint distribution exhibits evident lower tail dependence. In the pairwise distributions involving ν and the other parameters, no prominent global correlation is apparent. However, localized asymmetric clustering is observed. Specifically, in the ν-c and ν-E distributions, high values of c and E tend to concentrate in the intermediate range of ν. These distributional characteristics indicate that conventional Copula models possess limited capacity to characterize the complex dependency structures of the heterogeneous multidimensional parameters. Furthermore, the 192 field samples provide insufficient coverage of the extreme parameter space, and their direct use in MCS reliability calculations would result in highly uncertain failure probability estimates. Therefore, methods capable of more accurately simulating the probability distribution characteristics of heterogeneous parameters are required.

3.2. Development and Simulation of the D-Vine Copula Model

The construction of the D-Vine Copula model proceeds through the following steps: (1) Determine the marginal distribution functions for each key variable using the Akaike Information Criterion (AIC) [36]. (2) Determine the optimal copula functions for each link in the T1-level tree shown in Figure 3. (3) Determine the optimal copula functions for each link in the T2-level tree shown in Figure 3. Taking the link C13|2 between C12 and C23 as an example, first, substitute the CDFs F1(x1) and F2(x2) of parameters X1 and X2 as inputs into the first-order derivatives h1,2(F1(x1), F2(x2); θ) of the already determined C1,2(F1(x1), F2(x2); θ) to obtain the conditional probability F1|2(x1|x2). Similarly, obtain the conditional probability F3|2(x3|x2) for C23. Consider F1|2(x1|x2) and F3|2(x3|x2) as ordinary variables Y1 and Y2 to determine the optimal copula function between them, namely C13|2. (4) After obtaining C24|3 in step (3) using the same method, determine C14|23 using the identical approach as in step (3). Substituting the results into Equation (3) yields the joint distribution model for the four-dimensional Vine Copula. In determining the CDF of the key parameter and the bivariate Copulas linked at each level, the expression for the AIC is as follows:
AIC = 2 i = 1 N ln f x i ; ε + 2 k
AIC = 2 i = 1 N ln D u 1 i , u 2 i ; θ + 2 k
where ε is the vector of distribution parameters, k is the number of distribution parameters, and N is the number of measured samples. Table 2 shows the candidate marginal CDF types considered in this study and the corresponding AIC calculation results. The bolded numbers indicate the optimal marginal CDF results.
The AIC results in Table 2 indicate that the optimal marginal distribution for all four key variables is the Weibull distribution. By applying Equation (6) to calculate the Copula functions for each link in the trees from layer T1 to layer T3, the AIC values shown in Table 3 are obtained. The Copula functions corresponding to the bolded numbers are the optimal Copula functions for those links. The calculation results show that the optimal Copula functions vary significantly depending on the linkage. All five candidate Copula functions appear as optimal Copula functions in the correlation structures associated with different linkages.
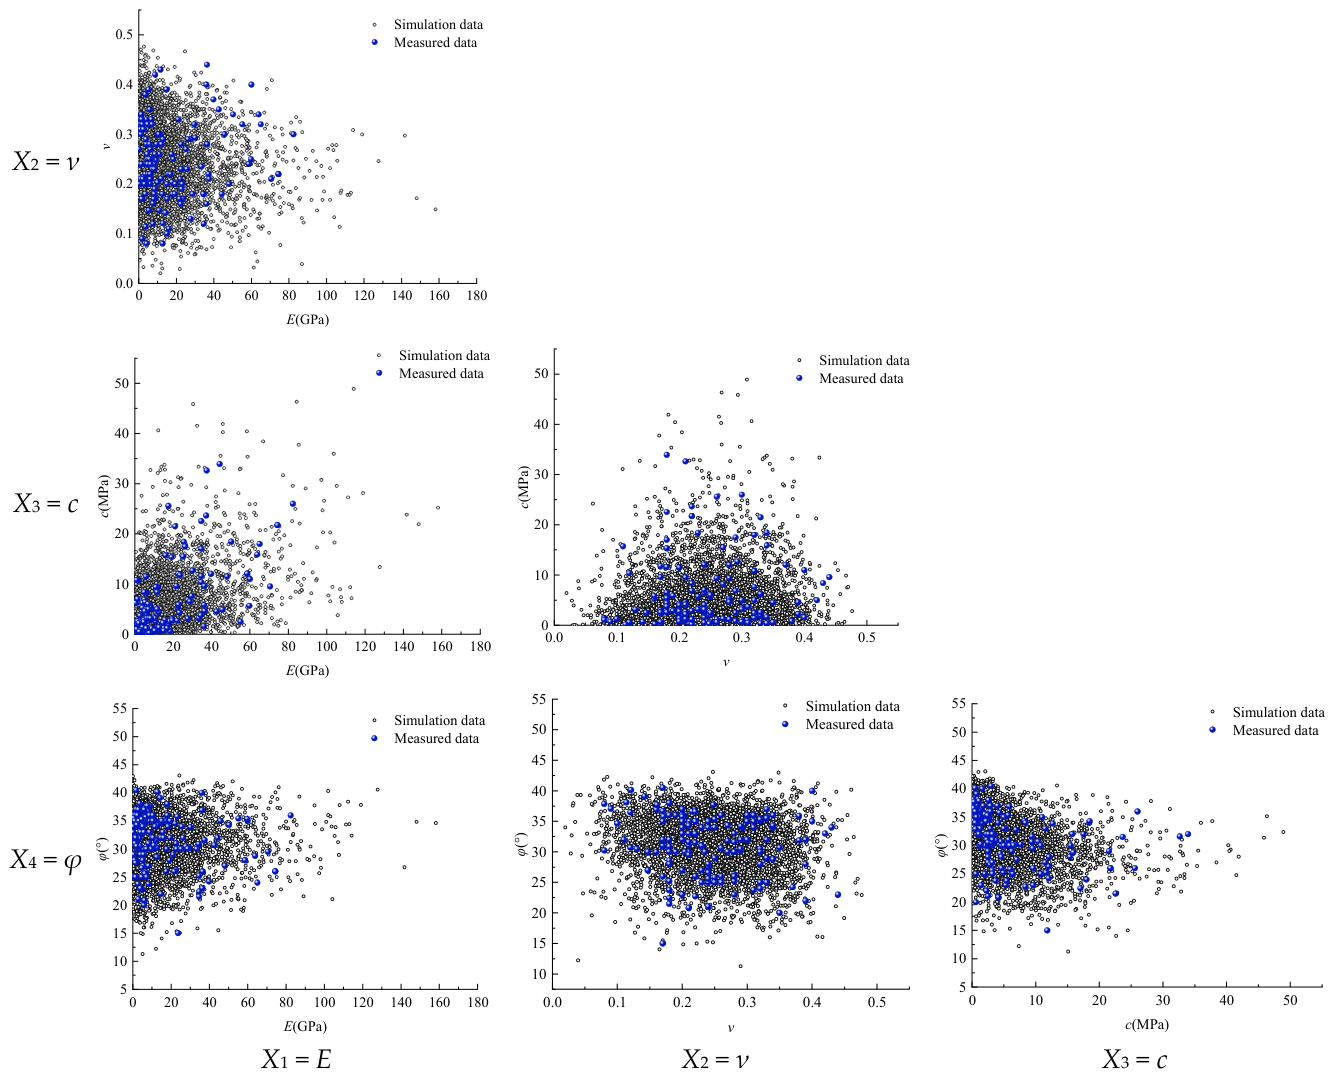
Once the Vine Copula joint distribution with its heterogeneous dependency structures is established, the Rosenblatt transformation is applied to generate synthetic samples conforming to the fitted distribution [37]. Analogous to the construction procedure, simulation begins from the first variable and progressively recovers each subsequent parameter by sequentially inverting the h-functions corresponding to the fitted dependency structure. Figure 5 presents the comparison between 5000 MCS samples and the measured samples, where blue filled circles denote the observed data and black open circles represent the simulated samples.
Overall, the simulated samples fully envelope the measured data across all pairwise parameter subspaces, demonstrating that D-Vine Copula adequately characterizes the multivariate joint distribution of the key roof parameters. Specifically, in the subspace defined by X1 = E and X3 = c, the simulated samples accurately reproduce the clustering of measured data in the low-value region. Furthermore, in the ν-c and ν-E planes, high values of c and E are concentrated in the intermediate range of ν, reflecting meaningful probabilistic extrapolation rather than mere repetition of or random perturbation around the original data. This confirms that D-Vine Copula can accurately capture the tail dependence among parameters. This characteristic is crucial for reliability calculations of roof structures. By simulating extreme parameters, the model is able to effectively highlight the impact of small-sample extreme values on roof reliability while preserving the nonlinear correlation structure.

3.3. TVAE Model Training and Sample Generation

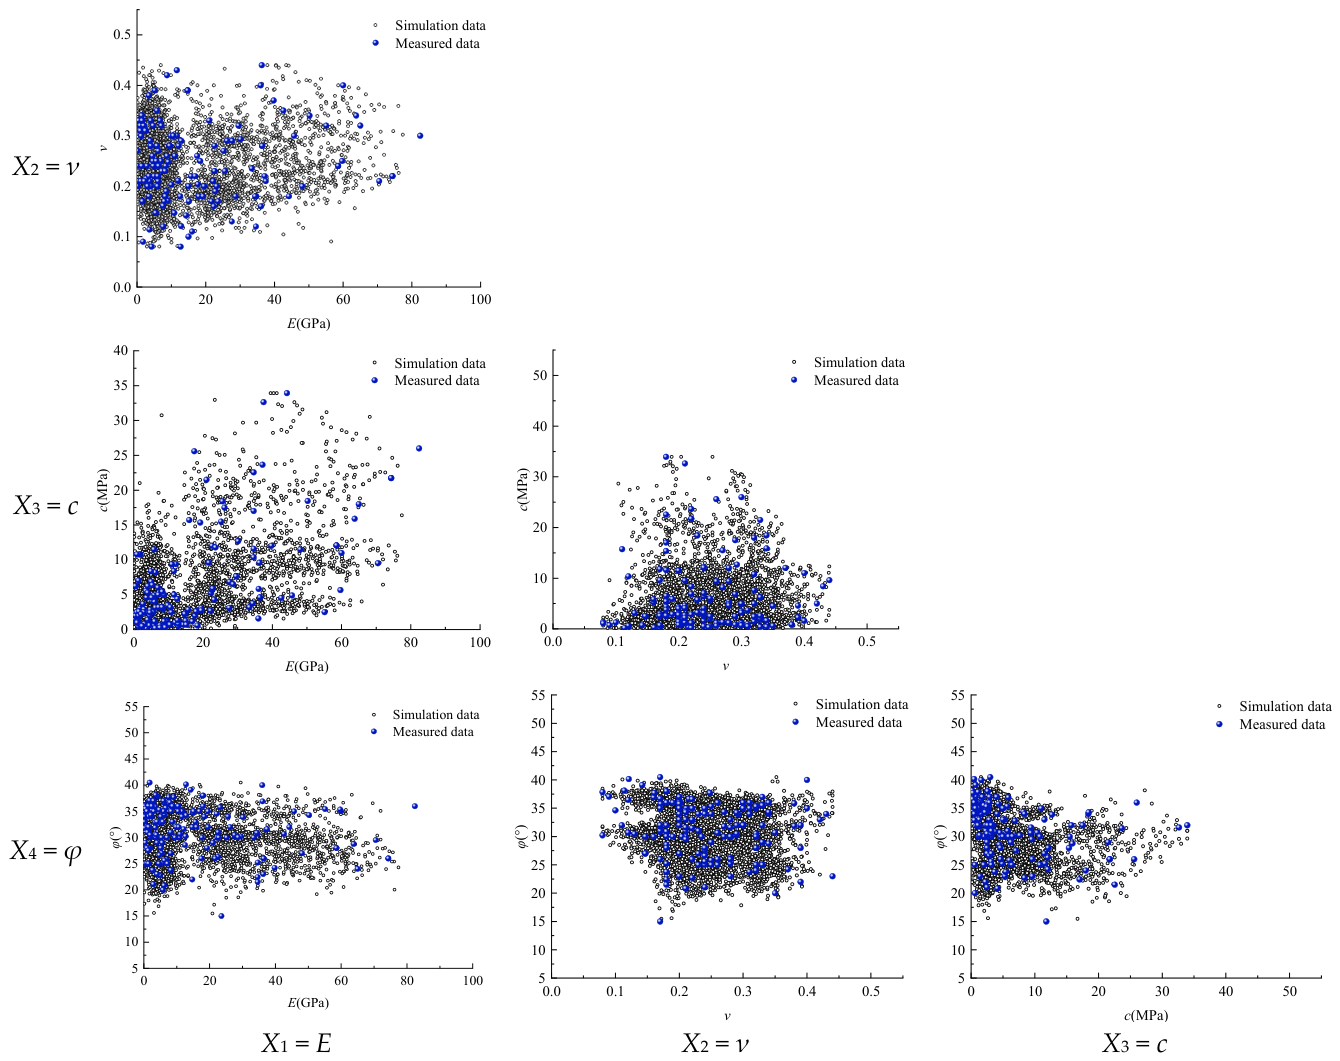
In addition to the D-Vine Copula model, TVAE is employed in this section to learn the joint distribution of key coal mine roof parameters through deep learning under small-sample conditions. A batch size of 32 is adopted to prevent excessively coarse weight updates, ensuring stable gradient estimation while mitigating the risk of mode collapse that can arise from overly large batch sizes. The number of training epochs is set to 104 to ensure sufficient convergence of the encoder and decoder network parameters under small-sample conditions, enabling the model to accurately learn the nonlinear dependence structures and asymmetric marginal distribution characteristics among the parameters. Figure 6 presents the comparison between 5000 TVAE-generated synthetic samples and the measured samples, where blue filled circles represent the measured data and black open circles denote the simulated samples.
The comparison results indicate that the TVAE-generated samples align closely with the measured data in terms of overall envelope geometry, with only a small number of simulated points falling outside the region occupied by the measured samples. Compared with the D-Vine Copula simulation results in Figure 5, the TVAE-generated sample distribution is markedly closer to the measured data. Specifically, all simulated samples in the subspace of X1 = E are confined within the range E < 90 GPa. In contrast, the D-Vine Copula simulations extend the maximum value of E to approximately 160 GPa, substantially exceeding the upper bound of the measured data. This phenomenon stems from the considerable statistical uncertainty in tail parameter estimation inherent to D-Vine Copula under small-sample conditions, which causes the model to over-extrapolate in the sparse high-value tail region. Furthermore, the TVAE-generated distribution is notably more realistic than that produced by D-Vine Copula. In the low-value core clustering region of the E subspace in particular, the density center of the TVAE-simulated points closely overlaps the clustering contour of the measured data, and the asymmetric correlation is accurately captured. By contrast, the density distribution of the Vine Copula is slightly more uniform in the core clustering region. It demonstrates weaker ability to capture the skewed distribution of the measured data, which is characterized by a high density of low values. Based on the overall distributional characteristics of the simulated samples, TVAE outperforms the Vine Copula in terms of both parameter constraints within physical boundaries and fidelity to the clustering of low values. It more accurately reflects the true statistical characteristics of small-sample measured data, thereby providing a more reliable sample basis for MCS reliability calculations.

3.4. Comparison of Small-Sample Simulation Methods and Assessment of Tail Risk in Roof Reliability

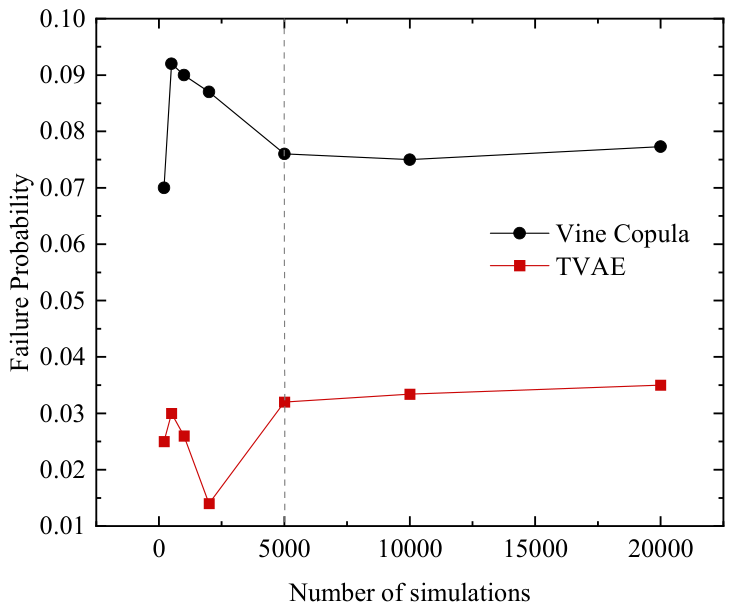
To quantitatively compare and evaluate the two multivariate parameter simulation methods, the appropriate number of simulations must first be determined in order to minimize the error introduced by simulation sample size on the reliability assessment. As shown by the results of Cao et al. [33], failure at the bottom of the roof is the dominant factor in roof system failure. Therefore, two methods are selected to analyze how the safety factor at the bottom of the roof in Equation (1) varies with the number of simulations, as shown in Figure 7.
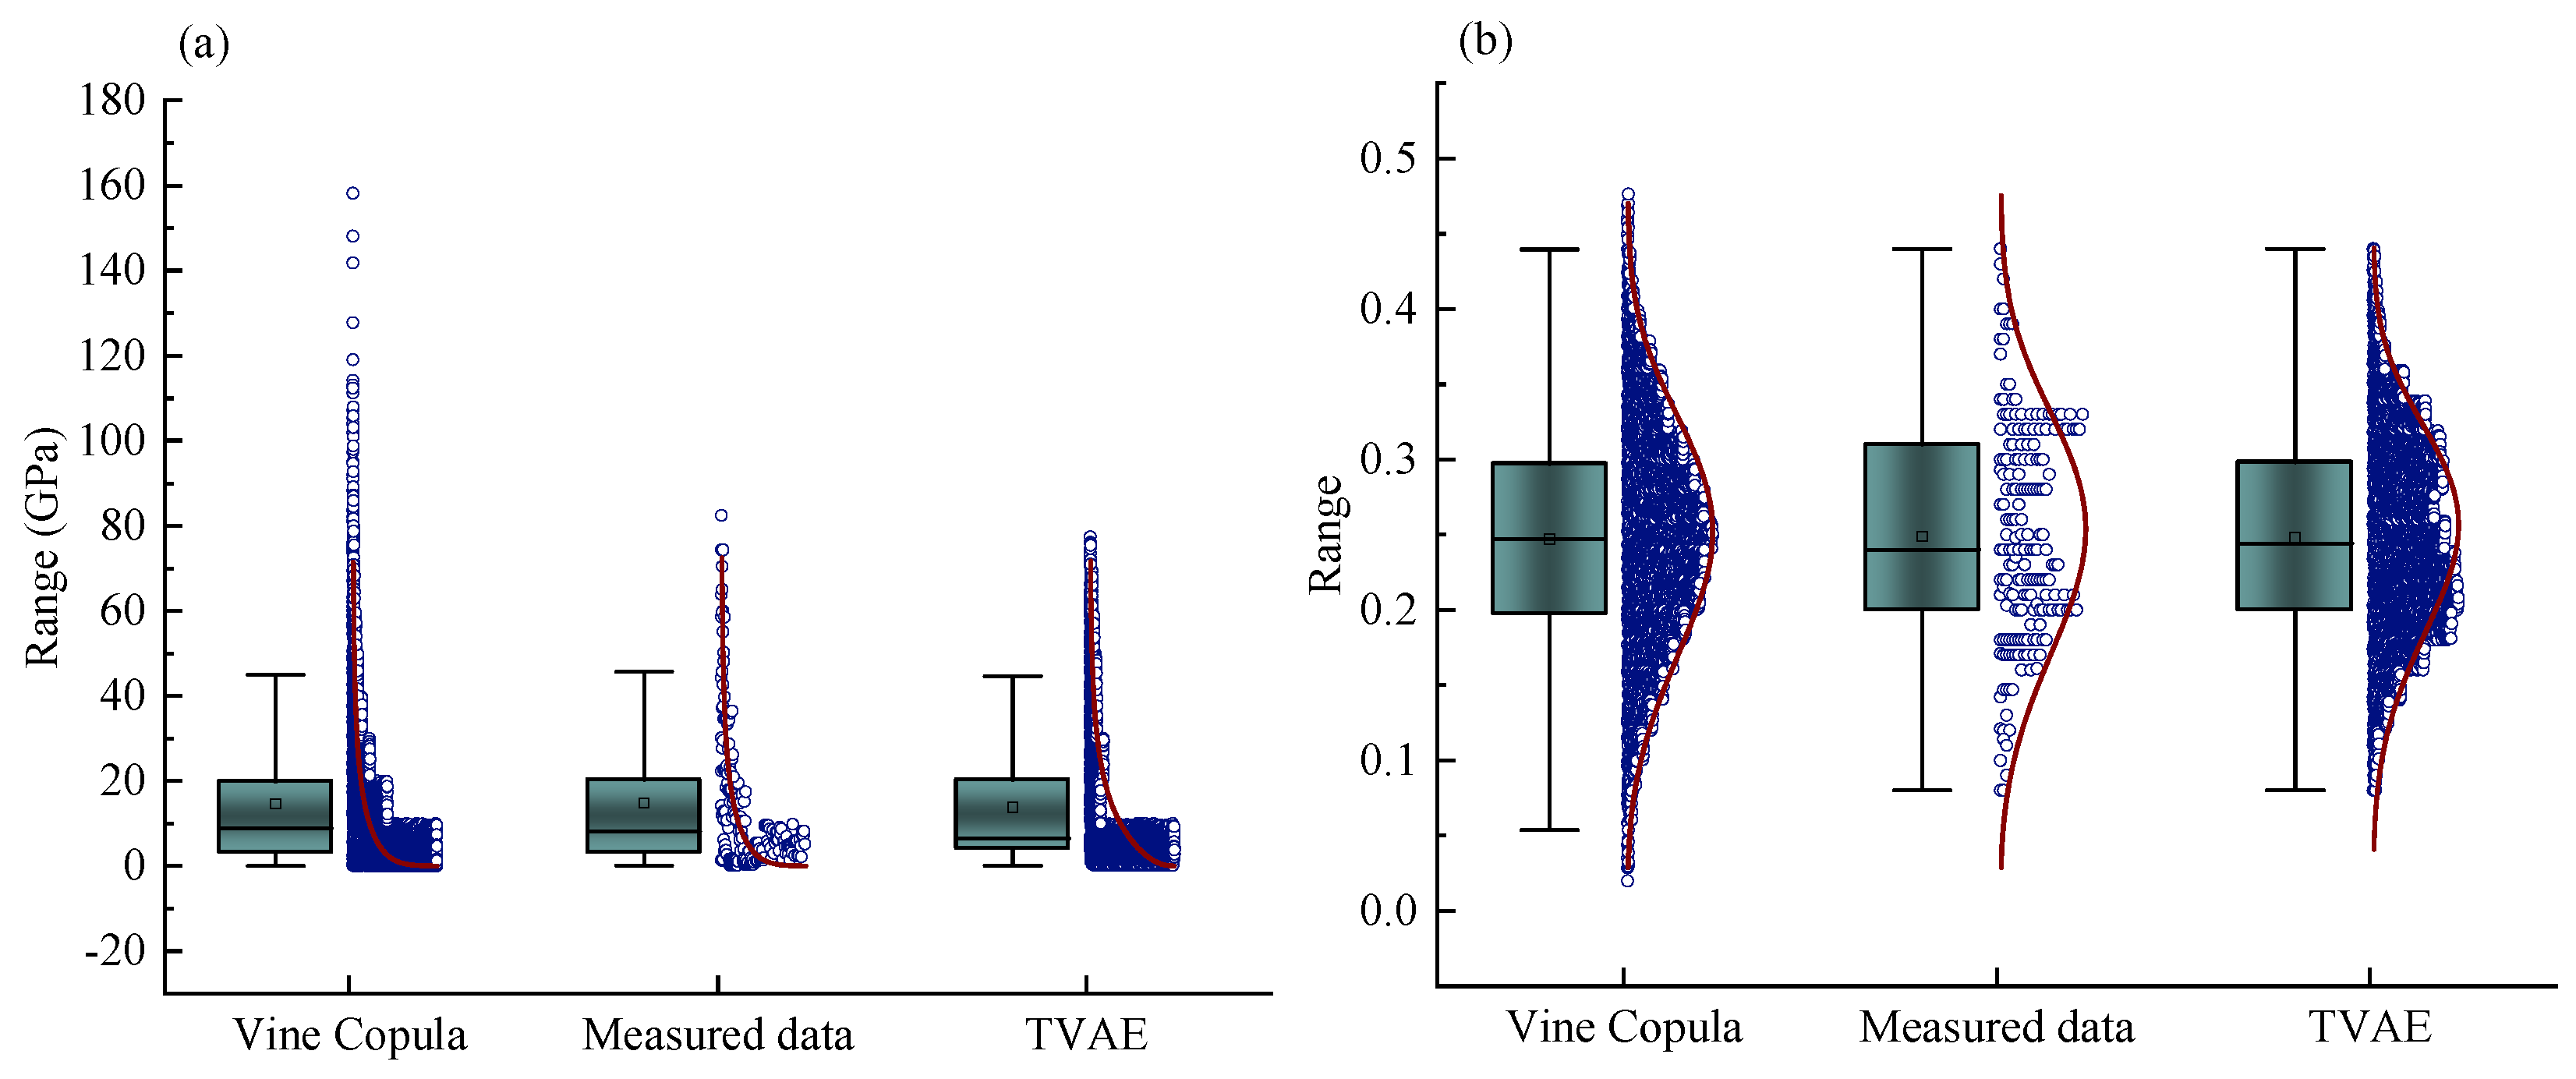
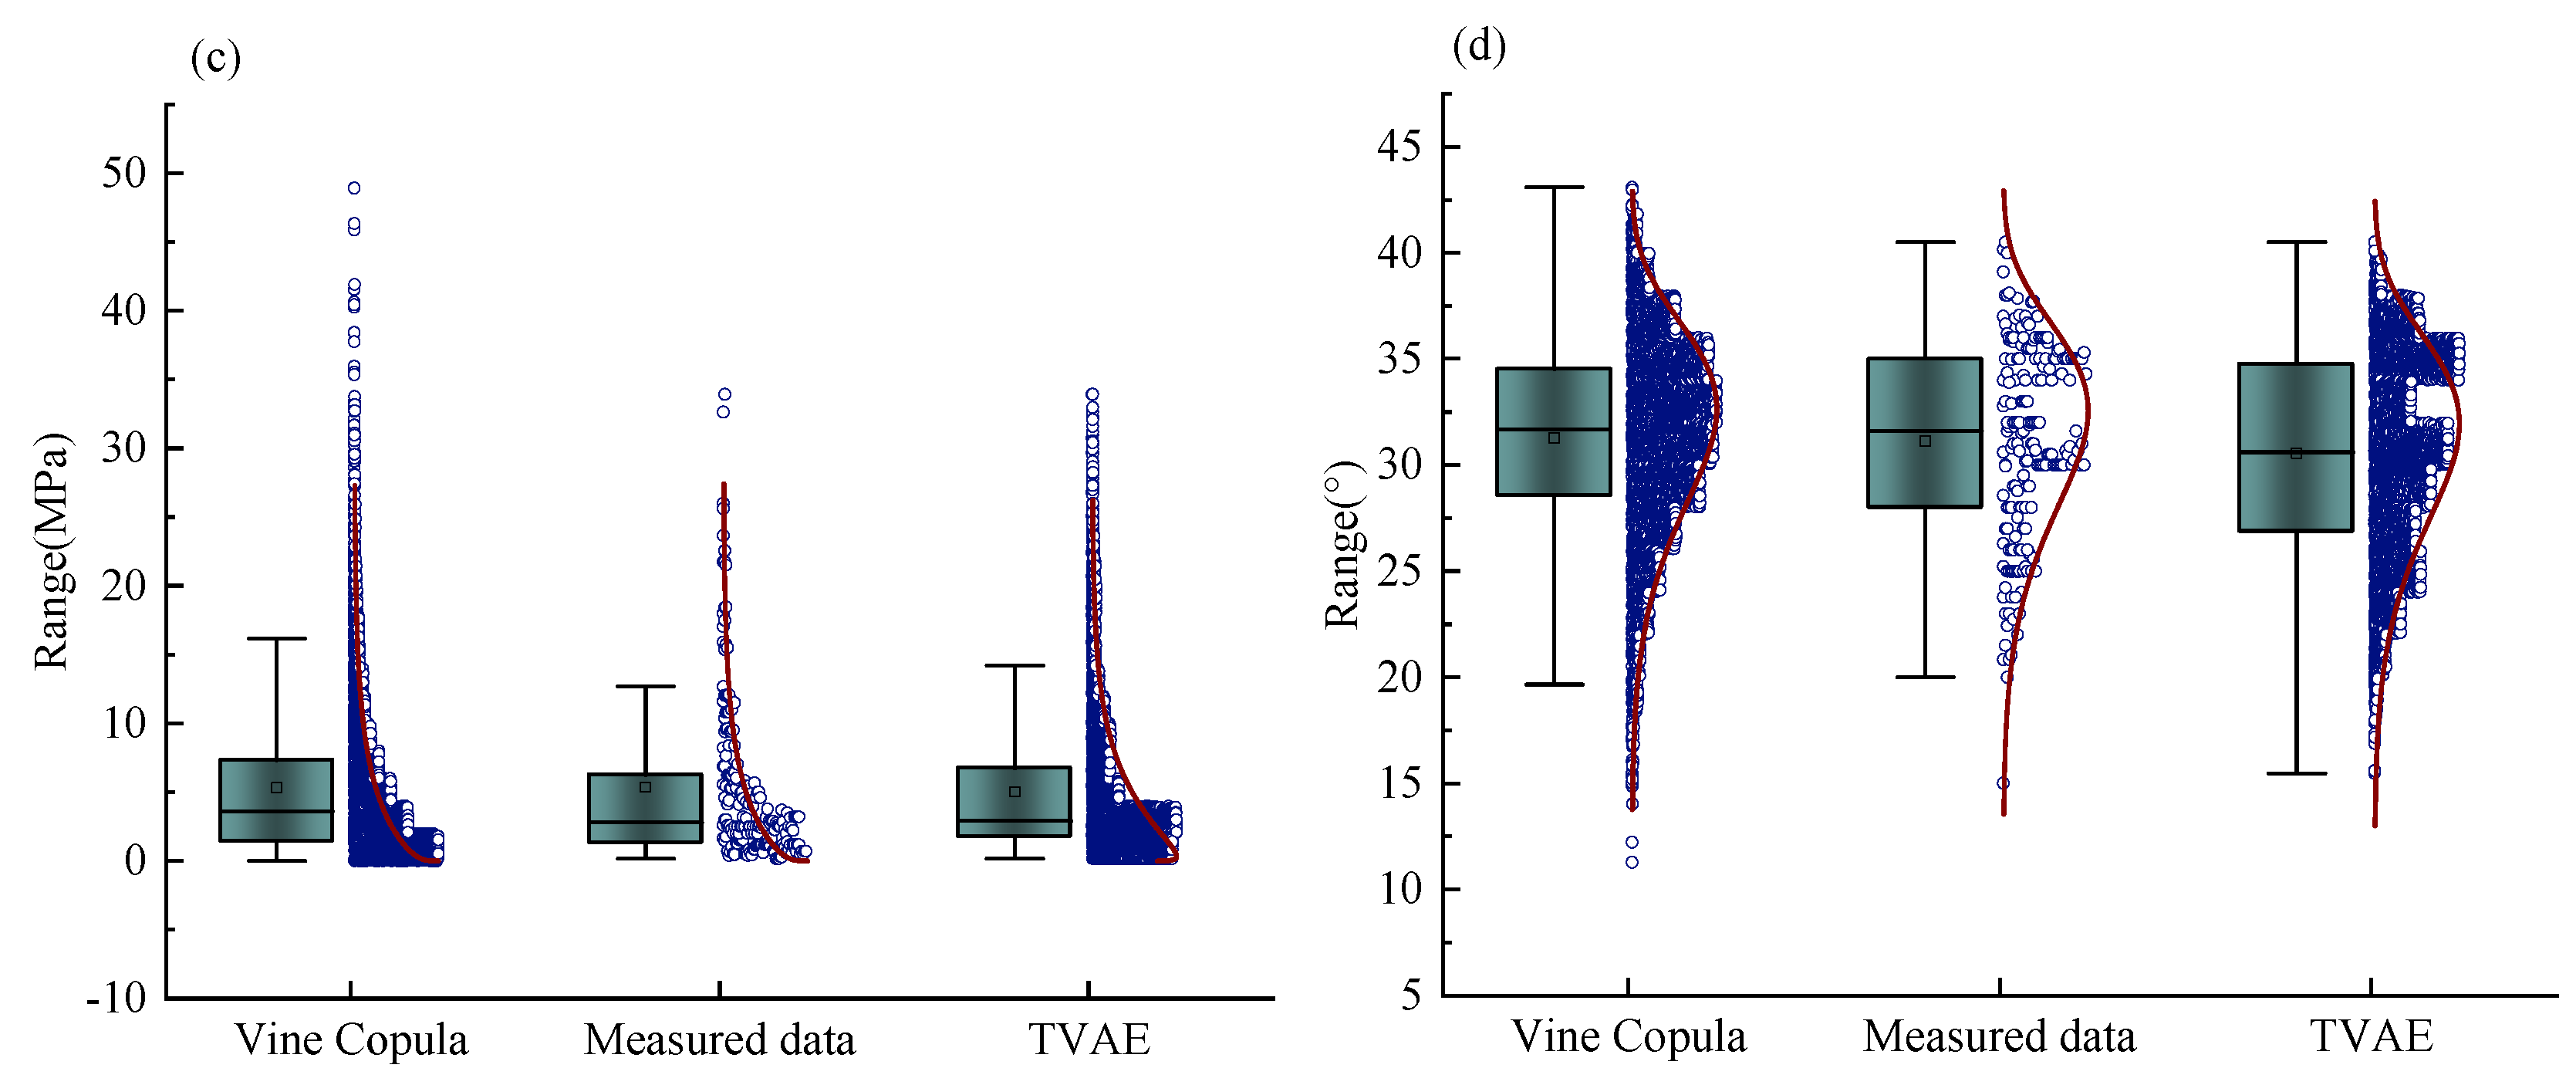
As shown by the results of the safety factor variations for FS2 in Figure 7, the failure probability exhibits significant fluctuations within the simulation range of 0 to 5000 cycles. When the number of simulations exceeds 5000, the failure probability trends for both simulation methods tend to stabilize. Accordingly, N = 5000 is adopted as the simulation sample size for subsequent reliability evaluations. Figure 8 presents the box plot comparison between the simulated samples from the two methods and the measured data, where the red curve represents the Weibull fit of the scatter plot.
The overall box plot comparison of the four parameters demonstrates that TVAE achieves superior agreement with the measured data in terms of median, interquartile range, and density distribution shape. Its advantages are particularly pronounced in the boundary constraints for strongly skewed parameters (E, c) and the accuracy of the distribution shape. D-Vine Copula performs comparably in capturing the central box characteristics. However, its tendency to over-extrapolate in the extreme tails under small-sample conditions represents a primary limitation. Specifically, in the box plots for ν and φ, the measured data exhibit evident bimodal characteristics in the central region. TVAE successfully reproduces this bimodal pattern with higher accuracy in terms of distributional symmetry and the location of density concentrations. The density distribution generated by D-Vine Copula is comparatively diffuse, though it remains within a physically reasonable range overall.
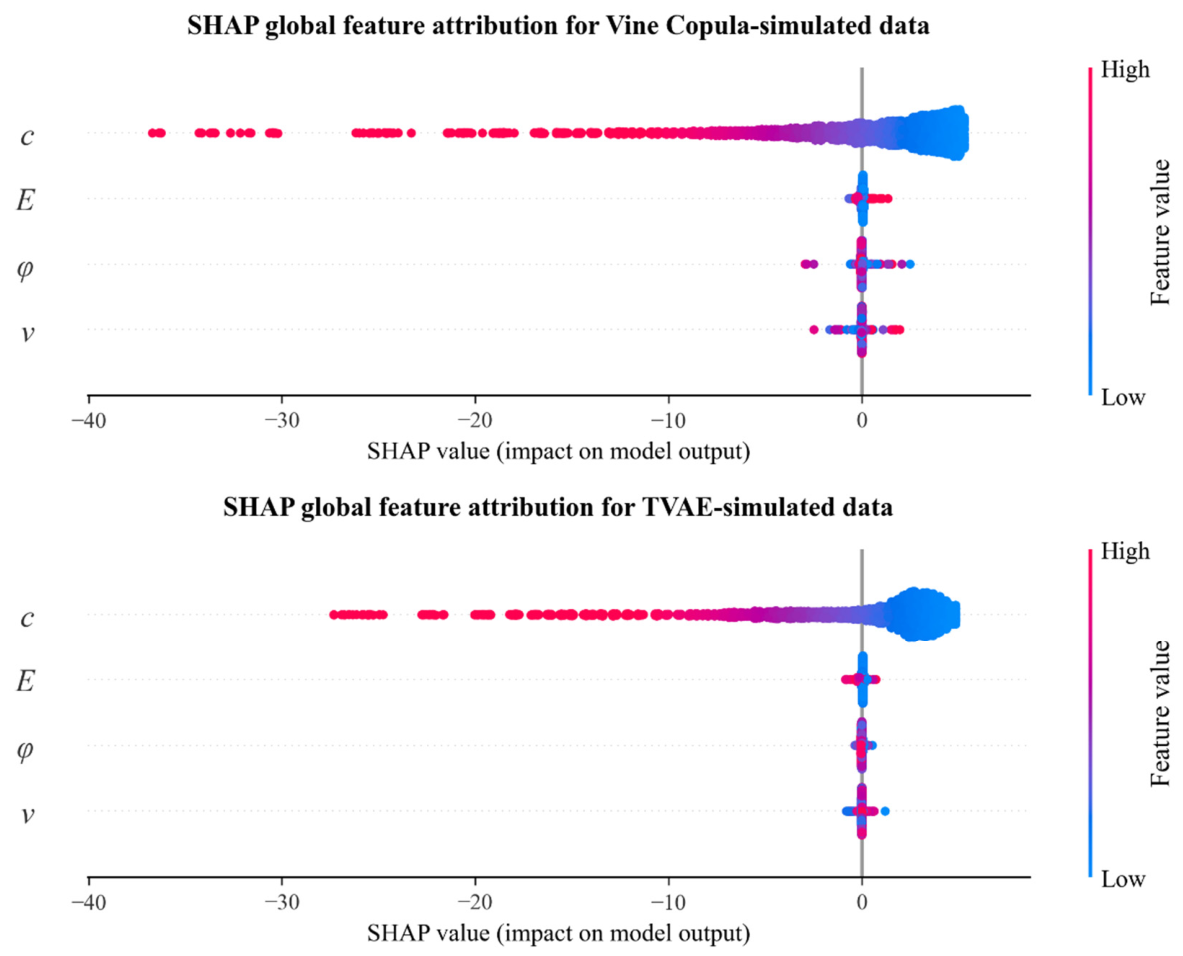
To further quantitatively evaluate the simulation performance of the two models from the perspective of how parameters influence the safety factor, SHAP (SHapley Additive exPlanations) global feature attribution analysis is employed to analyze the physically driven features of the samples generated by Vine Copula and TVAE. The results are depicted in Figure 9. For both models, the feature importance ranking from highest to lowest is c, E, φ, and ν, which is consistent with the analytical expression for the safety factor in Equation (1). As a direct parameter characterizing the shear strength of geotechnical structures, c is directly incorporated into the calculation of the safety factor in a linear form and exerts the strongest overall driving effect on the safety factor. The most significant difference between the two models lies in the range of SHAP values for cohesion. In the SHAP plot of the Vine Copula, the negative SHAP values for samples with low eigenvalues corresponding to c extend to approximately −40. The distribution is extremely dispersed, and there are a large number of discrete, sparse points in the interval (−35, −5), indicating that the Vine Copula generates a relatively large number of samples with extremely low cohesion. These samples exert a strong negative influence on the safety factor, further corroborating the issue of extreme samples caused by the excessive tail extension of the Vine Copula in the high-value tail, as identified in the previous scatter plot and box plot analyses. In contrast, although the distribution of SHAP values for c in TVAE also extends into negative territory (down to approximately −33), its distribution curve is smoother and more continuous. The point cloud density exhibits a natural, gradual gradient transition from the core cluster to the outlier regions, which better aligns with the skewed distribution characteristics observed in the measured data.
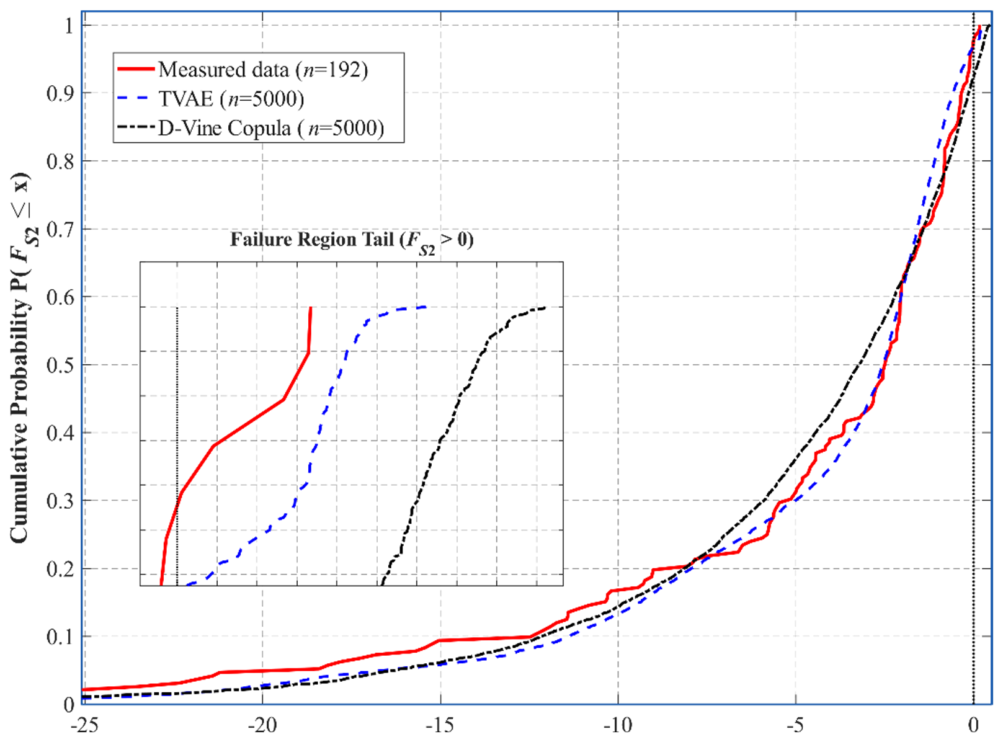
The SHAP attribution results confirm that c is the dominant contributing variable to FS2. However, SHAP analysis reflects the average contribution of each variable to the safety factor and cannot specifically characterize the tail risk of roof instability under extreme parameter combinations. Figure 10 presents the comparison of the CDF curves of FS2 for the two models and the measured data. Based on the distribution results, both the D-Vine Copula and TVAE are able to simulate the CDF of FS2 quite well. Specifically, in the region where FS2 = [−25, −10], the blue CDF curve of TVAE closely follows the black curve of the D-Vine Copula. However, after the three curves first intersect in the range FS2 = [−10, −5], the blue CDF curve of TVAE is noticeably closer to the red curve representing the measured data than the black curve of the D-Vine Copula, exhibiting a consistent trend. When FS2 > 0, instability occurs at the top and bottom positions. At this point, the failure tail of the TVAE is only slightly shifted to the right relative to the measured tail, whereas the failure tail of the D-Vine Copula deviates more significantly. This indicates that TVAE is better able to learn high-dimensional physical boundary constraints and is more effective than the D-Vine Copula at characterizing the probability distribution in the instability boundary region. Samples simulated using the D-Vine Copula systematically overestimate the risk of roof failure.
In practical coal mine roof engineering, even samples of extreme parameters with low probability can lead to unmanageable engineering risks. Therefore, it is also necessary to quantitatively characterize the extremity of safety factors within the failure region. The CVaR metric is introduced to characterize the tail-risk properties of FS2 in the failure region for simulated samples from both models and the measured data [38,39]. CVaR is defined at a confidence level of α as:
CVaR α ( F S 2 ) = E F S 2 F S 2 > VaR α ( F S 2 )
where VaRα is the quantile threshold corresponding to the given confidence level. Table 4 presents the CVaR values and error results for different models under extreme conditions at α = 0.05.
As shown in Table 4, the CvaR0.05 value calculated by TVAE is 0.0651, with an error of only 0.0404 compared to the measured benchmark of 0.0247. This indicates that the most hazardous 5% of extreme parameter combinations generated by TVAE, after being mapped via the nonlinear reliability function equation FS2, can effectively reproduce the actual ultimate failure characteristics of the roof structure. By contrast, the CvaR0.05 value from D-Vine Copula is 0.2865, with an error of 0.2618, which is 6.48 times that of TVAE and deviates from the observed benchmark by approximately one order of magnitude. This indicates that although the D-Vine Copula can select tail-dependent Copula functions (such as the Clayton Copula or Gumbel Copula) using the AIC, it is essentially a probabilistic model based on extrapolation using fixed mathematical formulas. In the context of multi-source data with small samples and complex geological conditions, the D-Vine Copula generates a large number of physically implausible extreme parameter combinations when extrapolating to the tails of the marginal distributions. For example, an arbitrary combination of an extremely low E and an extremely high φ results in an overestimation of FS2, which ultimately inflates the CVaR value. Accordingly, compared to the D-Vine Copula, TVAE provides a more reliable statistical foundation for assessing extreme sample risks in small-sample, multi-source roof conditions. Considering both the fidelity of distribution shape reconstruction and the tail CVaR error metric, TVAE outperforms the D-Vine Copula in terms of overall statistical accuracy under small-sample, multi-source data conditions, and can therefore be recommended as the preferred parameter-generation method in engineering practice. Nevertheless, the efficiency and accuracy of the D-Vine Copula in constructing joint distributions of small-sample, multidimensional geotechnical parameters cannot be denied. The analytical expressions of the D-Vine Copula endow the statistical meaning of the parameters (such as Kendall’s rank correlation coefficient and the tail dependence coefficient) with a clear mathematical interpretation, facilitating sensitivity analysis and uncertainty traceability for engineering practitioners. Compared with TVAE, which requires training a deep neural network, the D-Vine Copula involves a lower computational cost in fitting and simulation, offering a practical advantage in scenarios requiring rapid in situ assessment. Moreover, when the dependency structure among parameters is relatively simple (e.g., approximately linear correlation or symmetric tails), the performance gap between the D-Vine Copula and TVAE narrows, and the former may be preferred to ensure the interpretability of the results.

4. Discussion

The comparative results between the D-Vine Copula and TVAE presented in this study offer a new methodological perspective for coal mine roof disaster prevention. In conventional deterministic safety factor evaluation systems, engineering decisions often rely on a single threshold judgment. This approach can hardly reflect the cumulative effect of parameter uncertainty under extreme conditions. The CVaR-based tail-risk quantification extends the probabilistic information of roof instability to the most hazardous parameter combination intervals. It allows monitoring and early warning to be established upon critical thresholds with probabilistic significance. This drives the transformation of roof warning from passive response toward active early warning. It is worth noting that the D-Vine Copula overestimates the failure risk in the tail region by a factor of 6.48. If directly applied to support design, this would lead to overly conservative schemes and unnecessary engineering costs. Conversely, an underestimation of the tail risk would compromise operational safety. Since TVAE strictly constrains the physical boundaries of the parameters, its generated samples are closer to the statistical characteristics of the measured data. This provides more reasonable data support for support optimization and achieves a balance between safety and economy. In addition, the importance ranking of c, E, φ, and ν revealed by the SHAP attribution analysis indicates the priority sampling directions for the limited in situ investigation and monitoring resources. With the aid of the multi-source data fusion strategy, the proposed method can be extended to newly developed mining areas where investigation data are scarce. This provides support for early-stage disaster assessment under limited information.
Nevertheless, several aspects of this study remain to be improved. The current reliability analysis is built upon the plane Mohr–Coulomb model. This model simplifies the rock mass as an isotropic medium and neglects the effects of excavation height and in situ stress. Its physical fidelity remains to be enhanced through three-dimensional failure models that are closer to engineering reality. Meanwhile, the model assumes that the parameters are spatially homogeneous. In reality, the mechanical parameters of actual roof rock masses often exhibit pronounced spatial variability. Coupling the generation methods proposed in this study with random field theory and stochastic finite element methods would more comprehensively reveal the influence of spatial autocorrelation on roof reliability. Moreover, the parameter samples adopted are all static data. They can hardly reflect the progressive time-dependent degradation of rock mass properties under mining-induced disturbances. Therefore, the introduction of time-dependent reliability analysis is also a direction worth exploring. It should further be noted that the conclusions of this study are derived from 192 sets of measured data from 31 mines. Although this is sufficient to support the comparison between the two methods, it still calls for further verification of the generalization capability of TVAE across broader geological backgrounds and larger sample sizes. Combining deep generative models with numerical simulation in the future is expected to further enhance the physical plausibility of failure probability estimates under extreme conditions. This would provide a more reliable analytical tool for roof disaster prevention in complex geological conditions. Finally, since only 192 sets of measured data are employed in this study, the results evaluated by the two methods verify that TVAE possesses certain advantages. However, as the sample size is further expanded, the uncertainty in the tail parameter estimation of the D-Vine Copula will decrease significantly. Its flexible bivariate Copula selection mechanism can more precisely characterize asymmetric dependence structures. In this case, the evaluation accuracy of the Copula method may become superior to that of TVAE. Therefore, how to determine the additional sample size required for method transition also constitutes a problem worthy of investigation in future work.

5. Conclusions

Based on small-sample measured data from multiple coal mines, this study proposes a D-Vine Copula-based joint distribution modeling approach and a TVAE-based small-sample augmentation method for the key geotechnical parameters of coal mine roofs. Using the MCS, the performance of the two approaches in simulating multivariate joint distributions is systematically compared, and tail risk evaluation is conducted for the dominant failure region of roof instability. The main conclusions are as follows.
(1)
The proposed D-Vine Copula and TVAE data generation methods provide effective approaches for modeling the joint distribution of multidimensional geotechnical variables in coal mine roof conditions under small-sample constraints. Without relying on large amounts of measured data, these methods preserve the nonlinear correlation structure among parameters and the constraints imposed by physical boundaries, thereby enabling reliability analysis and providing a crucial data foundation for stability analysis of coal mine roofs with complex geological conditions.
(2)
The measured data indicate that key geotechnical parameters of the roof exhibit a significantly non-normal distribution, nonlinear correlations, and a sparse distribution in high-value regions. Specifically, the E-c parameter exhibits pronounced lower-tail correlation and clustering characteristics, while the c-φ parameter exhibits negative correlation constraints. Neither traditional copula models nor multivariate normal distributions can effectively characterize the dependency structure of these multidimensional parameters.
(3)
D-Vine Copula can effectively characterize the asymmetric correlation structure among parameters through the flexible selection of bivariate copulas. However, under small-sample conditions, statistical estimates of tail parameters are subject to high uncertainty, leading to significant outliers in the simulated samples of E and c. Extreme parameter combinations result in a systematic overestimation of the lower bound FS2, deviating from the measured benchmark by a factor of 6.48.
(4)
TVAE achieves efficient expansion of small-sample multidimensional joint distributions while strictly preserving the physical boundaries of the parameters. The shape of the CDF tail in the safety factor for roof-dominated regions is highly consistent with measured data. The CVaR error is only 0.0404, indicating that TVAE has a more robust statistical foundation than Copula methods for assessing tail risks under extreme parameter combinations.

Author Contributions

Conceptualization, J.Z. and T.W.; methodology, J.Z. and T.W.; software, J.Z., T.W. and J.C.; validation, J.Z. and F.N.; formal analysis, J.Z. and J.C.; investigation, J.C., F.N.; resources, T.W. and J.H.; data curation, J.Z., T.W.; writing—original draft preparation, J.Z. and J.H.; writing—review and editing, J.Z. and T.W.; visualization, J.Z. and J.C.; supervision, J.C. and J.H.; project administration, T.W. and J.Z.; funding acquisition, T.W. All authors have read and agreed to the published version of the manuscript.

Funding

This research was supported by the Open Fund of Key Laboratory of Transparent Mine Geology and Digital Twin Technology (Grant No. SYSKT-2025-4).

Institutional Review Board Statement

Not applicable.

Informed Consent Statement

Not applicable.

Data Availability Statement

The raw data supporting the conclusions of this article will be made available by the authors on request.

Conflicts of Interest

The authors declare no conflicts of interest.

References

  1. Li, J.; Jiang, L.; Xiong, Y.; Chen, M. Coupling Time-Dependent Effect Mechanism of Failure Instability of Roof-Pillar Bearing System in Goaf Groups. Rock Mech. Rock Eng. 2026, 1–25. [Google Scholar] [CrossRef]
  2. Li, Q.; Yang, S.; Zhao, Y.; Yue, H.; Wei, W. Study on Instability Criterion of Roof and Floor Toppling-Slumping in Near-Vertical Coal Seams Mining. Min. Metall. Explor. 2025, 43, 69–94. [Google Scholar] [CrossRef]
  3. Zhang, J.; Rui, Q.; Yang, Y.; Chen, J.; Shen, W.; Yuan, Y.; Wang, C.; Liu, W. Roof movement and instability fracture characteristics in shallow-buried thin coal seam conventional mining faces. Geomech. Geophys. Geo-Energy Geo-Resour. 2024, 10, 27. [Google Scholar] [CrossRef]
  4. Hosseini, M.; Azhari, A.; Lotfi, R.; Baghbanan, A. Safety analysis of Sormeh underground mine to improve sublevel stoping stability. Deep. Undergr. Sci. Eng. 2023, 2, 173–187. [Google Scholar] [CrossRef]
  5. Liu, Y.; Kong, D.; Li, P.; Wen, Z.; Li, F.; Zuo, Y.; Wu, H. The migration and evolution law of overlying strata and the instability and failure characteristics of end face roof under the condition of ascending mining in close distance coal seam: Case study. Eng. Fail. Anal. 2024, 165, 108809. [Google Scholar] [CrossRef]
  6. Wang, T.; Liu, Y.; Wang, J.; Wang, D. Assessment of spatial variability of hydraulic conductivity of seasonally frozen ground in Northeast China. Eng. Geol. 2020, 274, 105741. [Google Scholar] [CrossRef]
  7. Wang, T.; Cao, J.; Liu, J.; Xu, J.; Zhou, G. Characterizing anisotropic spatial variations of uncertain mechanical parameters for clay layer using incomplete probability data. Probabilistic Eng. Mech. 2024, 76, 103623. [Google Scholar] [CrossRef]
  8. Bagińska, I.; Kawa, M.; Rainer, J.; Szabowicz, H. On reduction of uncertainty in mine waste heap stability analysis: GMM-driven CPTu data segmentation approach. Int. J. Coal Sci. Technol. 2026, 13, 27. [Google Scholar] [CrossRef]
  9. Su, Z.; Fu, Y.; Sun, M.; Ding, K.; Zhao, Y. Random finite element analysis on ground subsidence caused by tunnel excavation in karst regions with spatial variable soil. Deep. Undergr. Sci. Eng. 2025, 5, 615–632. [Google Scholar] [CrossRef]
  10. Yue, W.; Feng, X.; Wang, E.; Zhang, Q.; Ding, Z.; Kong, X. Interface damage mechanisms and homogeneity-dependent effects in layered composite coal-rock: A new perspective for mining-induced roof disaster prevention. J. Cent. South Univ. 2026, 33, 1260–1279. [Google Scholar] [CrossRef]
  11. Zou, Y.; Cao, Y.; Guo, J.; Tian, F. Roof Fracture Dynamics and Synergistic Control Strategies for Mitigating Coal Mine Gas Disasters in Goaf Regions. Min. Metall. Explor. 2025, 42, 2343–2361. [Google Scholar] [CrossRef]
  12. Kiureghian, A.; Liu, P. Structural reliability under incomplete probability information. J. Eng. Mech. 1986, 112, 85–104. [Google Scholar] [CrossRef]
  13. Wang, Y.; Li, F.; Cheng, Y.; Yu, X.; Wu, H.; Wang, G. Stability Analysis of Long-Span Temporary Support Roofs in Coal Mine Roadways Using Multistation Parallel Excavation Technology. Geofluids 2026, 2026, 8899704. [Google Scholar] [CrossRef]
  14. Xu, G.; Lai, X.; Shan, P.; Liu, J.; Xu, H.; Wang, H. Stability analysis of the false roof made of cemented tailings backfill in deep mine: A case study. Case Stud. Constr. Mater. 2024, 21, e04046. [Google Scholar] [CrossRef]
  15. Ma, Z.; Wang, Y.; Huang, L.; Wang, H.; Wang, J.; Wang, Z.; Wang, Y.; Wang, B. Research on the Stability Mechanism of the Surrounding Rock of Gob-Side Entry Retaining by Roof Cutting in Dianping Coal Mine. Minerals 2022, 12, 965. [Google Scholar] [CrossRef]
  16. Shi, Q.; Mishra, B.; Zhao, Y. DEM Analysis of the Effect of Lamination Properties on the Stability of an Underground Coal Mine Entry with Laminated Shale Roof. Min. Metall. Explor. 2022, 39, 495–506. [Google Scholar] [CrossRef]
  17. Cao, J.; Wang, T.; Zhou, G.; Feng, X.; Zhu, C. Parameter estimation of grouting pressure and surface subsidence on the reliability of shield tunnel excavation under incomplete probability information. Comput. Geotech. 2024, 173, 106530. [Google Scholar] [CrossRef]
  18. Song, Y.; Wang, T.; Zhou, G.; Cao, J.; Li, H.; Li, R. Probabilistic modeling of multivariate clay parameters for subway-adjacent construction with multi-source incomplete data. Transp. Geotech. 2026, 62, 102152. [Google Scholar] [CrossRef]
  19. Tang, X.; Huang, H. A KL-copula method for modeling 3-D cross-correlated random fields for slope risk assessment. Comput. Geotech. 2026, 190, 107724. [Google Scholar] [CrossRef]
  20. Xu, Y.; Liu, L. Copula-based conditional reliability analysis of slopes in spatially variable soils. Reliab. Eng. Syst. Saf. 2026, 265, 111522. [Google Scholar] [CrossRef]
  21. Li, H.; Wang, T.; Zhou, G.; Cao, J.; Song, Y.; Chen, K. Impact of uncertainty in cross-correlation structures of thermal properties on stochastic hydro-thermal processes in artificial ground freezing. Comput. Geotech. 2026, 197, 108276. [Google Scholar] [CrossRef]
  22. Tang, X.; Wang, M.; Li, D. Modeling multivariate cross-correlated geotechnical random fields using vine copulas for slope reliability analysis. Comput. Geotech. 2020, 127, 103784. [Google Scholar] [CrossRef]
  23. Zeng, J.; Cao, Z. Flow matching-guided adaptive Markov Chain Monte Carlo with deep generative proposals for Bayesian model updating in structural health monitoring. Reliab. Eng. Syst. Saf. 2026, 276, 112917. [Google Scholar] [CrossRef]
  24. Dodig, A.; Stankovic, V.; Stankovic, L.; Stojkovic, M. Enhancement of hydrological time series prediction with Real-World Time Series Generative Adversarial Network-based synthetic data and deep learning models. Environ. Model. Softw. 2026, 204, 107037. [Google Scholar] [CrossRef]
  25. Kazapoe, R.; Kwayisi, D.; Alidu, S.; Sagoe, S.; Umaru, A.; Amuah, E.; Addai, M.; Fynn, O. Advanced analysis of soil pollution in southwestern Ghana using Variational Autoencoders (VAE) and positive matrix factorization (PMF). Environ. Sustain. Indic. 2025, 26, 100627. [Google Scholar] [CrossRef]
  26. Zhang, Z.; Hou, G.; Jing, S.; Liu, Z.; Meng, X.; Li, Y. VAE assisted generative design optimization based on deep Gaussian processes. Struct. Multidiscip. Optim. 2026, 69, 156. [Google Scholar] [CrossRef]
  27. Sampaio, M.; Ranazzi, P.; Blunt, M. Enhancing the parameterization of reservoir properties for data assimilation using deep VAE-GAN. Comput. Geosci. 2026, 214, 106196. [Google Scholar] [CrossRef]
  28. Kumar, A.; Abbas, A.; Nehdi, M. Innovative uncertainty-aware probabilistic framework for quantification of fiber-reinforced cementitious matrix-concrete bond. Adv. Eng. Inform. 2026, 74, 104717. [Google Scholar] [CrossRef]
  29. Aju, C.; Singh, B.; Achu, A.; Ingale, M.; Goswami, M.; Raicy, M.; Elango, L. Bridging data scarcity in groundwater quality studies: A systematic evaluation of statistical and deep learning-based generators. Phys. Chem. Earth 2026, 143, 104327. [Google Scholar] [CrossRef]
  30. Hu, J.; Deng, C.; Zhang, Q.; Pang, A. Physics-informed neural networks enhanced by data augmentation: A novel framework for robust soil moisture estimation using multi-source data fusion. J. Hydrol. 2025, 663, 134320. [Google Scholar] [CrossRef]
  31. Kumar, A.; Marani, A.; Abbas, A.; Nehdi, M. Hybrid generative-probabilistic machine learning approach for predicting residual tensile strength and elastic modulus of FRP coupons under environmental exposure. Mech. Syst. Signal Process. 2026, 248, 114033. [Google Scholar] [CrossRef]
  32. Song, Z.; Zhang, C.; Lu, Y. Prediction of ultimate bearing capacity for rubberized concrete filled steel tube columns based on Tabular Variational Autoencoder method and Stacking ensemble strategy. Structures 2024, 70, 107667. [Google Scholar] [CrossRef]
  33. Cao, J.; Wang, T.; Huang, Y.; Zhu, B.; Li, R.; Zhou, G. Novel evaluation methodology for mechanical behaviour and instability risk of roof structure using limited investigation data. Georisk Assess. Manag. Risk Eng. Syst. Geohazards 2024, 18, 668–686. [Google Scholar]
  34. Lü, T.; Tang, X.; Li, D.; Qi, X. Modeling multivariate distribution of multiple soil parameters using vine copula model. Comput. Geotech. 2020, 118, 103340. [Google Scholar] [CrossRef]
  35. Bao, X.; Li, J.; Shen, J.; Chen, X.; Zhang, C.; Cui, H. Comprehensive multivariate joint distribution model for marine soft soil based on the vine copula. Comput. Geotech. 2025, 177, 106814. [Google Scholar] [CrossRef]
  36. Akaike, H. A new look at the statistic model identification. IEEE Trans. Autom. Control 1974, 19, 716–723. [Google Scholar] [CrossRef]
  37. Rosenblatt, M. Remarks on a multivariate transformation. Ann. Math. Stat. 1952, 23, 470–472. [Google Scholar] [CrossRef]
  38. Yuan, M.; Guo, X.; Hu, J.; Yang, Y. Multi-agent reinforcement learning for competitive-cooperative inter-city water resources allocation: A dynamic strategy optimization framework. J. Hydrol. 2026, 677, 135782. [Google Scholar] [CrossRef]
  39. Liu, L.; Jiang, L.; Fu, Y. Dynamic predictive maintenance optimization of offshore wind turbines considering aleatory and epistemic uncertainties. Ocean Eng. 2026, 362, 126330. [Google Scholar] [CrossRef]
Figure 1. Flowchart of reliability analysis methods for small-sample and multi-source coal mine roof conditions.
Applsci 16 07753 g001
Figure 2. Schematic diagram of forces in a plane roof.
Applsci 16 07753 g002
Figure 3. The vine-tree structure of the four-dimensional D-Vine Copula.
Applsci 16 07753 g003
Figure 4. Distribution results of two-dimensional measured data.
Applsci 16 07753 g004
Figure 5. Comparison of simulated and measured data using the Vine Copula.
Applsci 16 07753 g005
Figure 6. Comparison of simulated and measured data using TVAE.
Applsci 16 07753 g006
Figure 7. The relationship between the number of simulations and variations in the safety factor at the bottom of the roof.
Applsci 16 07753 g007
Figure 8. Box plots of simulated and measured samples. (a) E; (b) ν; (c) c; (d) φ.
Applsci 16 07753 g008aApplsci 16 07753 g008b
Figure 9. SHAP feature importance analysis for the two models.
Applsci 16 07753 g009
Figure 10. CDF curves for the safety factor at the bottom of the roof for the two models.
Applsci 16 07753 g010
Table 1. CDFs and PDFs of candidate Copulas.
CopulaC(u1, u2; θ)D(u1, u2; θ)Range of θ
Gaussian Φ 1 u 1 Φ 1 u 2 1 2 π 1 θ 2 × exp x 1 2 2 θ x 1 x 2 + x 2 2 2 1 θ 2 d x 1 x 2 1 1 θ 2 exp ς 1 2 2 θ ς 1 ς 2 + ς 2 2 2 1 θ 2 where   ς 1 = Φ 1 u 1 , ς 2 = Φ 1 u 2 [−1,1]
t T v 1 u 1 T v 1 u 2 1 2 π 1 θ 2 × 1 + x 1 2 2 θ x 1 x 2 + x 2 2 v 1 θ 2 ( v + 2 ) 2 d x 1 d x 2 1 1 θ 2 Γ v + 2 2 Γ v 2 Γ v + 1 2 2 × 1 + ς 1 2 2 θ ς 1 ς 2 + ς 2 2 ( v + 2 ) / 2 i = 1 2 1 + ς i 2 v ( v + 1 ) / 2 where   ς 1 = Φ 1 u 1 , ς 2 = Φ 1 u 2 0 , \ 1
Gumbel exp ln u 1 θ + ln u 2 θ 1 / θ e S 1 / θ ln u 1 ln u 2 θ 1 S 1 / θ + θ 1 u 1 u 2 S 2 1 / θ where   S = ln u 1 θ + ln u 2 θ [ 1 , )
Clayton u 1 θ + u 2 θ 1 1 / θ 1 + θ ( u 1 u 2 ) θ 1 u 1 θ + u 2 θ 1 2 1 / θ ( 0 , )
Frank 1 θ ln 1 + e θ u 1 1 e θ u 2 1 e θ 1 θ e θ 1 e θ u 1 + u 2 e θ 1 + e θ u 1 1 e θ u 2 1 2 , \ 0
Note: Φ(·) is the standard normal distribution function, and Φ−1(·) is its inverse function; Γ(·) is the gamma function. Tv−1(·) represents the inverse of the t-distribution function with v degrees of freedom.
Table 2. Statistical results for candidate marginal CDFs.
ParameterX1 = EX2 = νX3 = cX4 = φ
Normal1638.9−455.661247.71142.4
Lognormal1537.9−435.621036.91166.3
Gumbel1662.6−405.051268.41209.8
Weibull1414.2−456.451031.31129.8
Table 3. Statistical results of the optimal Copula for hierarchical tree linkage.
ParameterC12C23C34C13|2C24|3C14|23
Gaussian0.991.09−39.88−62.330.2−3.75
t2.993.08−39.24−60.45−0.85−1.75
Clayton2−1.042−23.8220.74
Gumbel222−61.311.99−5.32
Frank−1.841.49−47.51−55.340.01−4.02
Table 4. CVaR results for different models.
Data SourcesCVaR0.05Absolute ErrorError Ratio
Measured data0.02470.0000-
TVAE0.06510.04041.00
D-Vine Copula0.28650.26186.48
Disclaimer/Publisher’s Note: The statements, opinions and data contained in all publications are solely those of the individual author(s) and contributor(s) and not of MDPI and/or the editor(s). MDPI and/or the editor(s) disclaim responsibility for any injury to people or property resulting from any ideas, methods, instructions or products referred to in the content.