Article

Three-Dimensional Identification of In Situ and Migrated Organic Matter in Shale Based on Micro-CT


1
Institute of Geomechanics, Chinese Academy of Geological Sciences, Beijing 100081, China
2
Shaanxi Key Laboratory of Lacustrine Shale Gas Accumulation and Exploitation, Xi′an 710075, China
3
Bohai Rim Energy Research Institute, Northeast Petroleum University, Qinhuangdao 066004, China
*
Author to whom correspondence should be addressed.
Appl. Sci. 2026, 16(15), 7749; https://doi.org/10.3390/app16157749
Submission received: 9 July 2026 / Revised: 30 July 2026 / Accepted: 3 August 2026 / Published: 4 August 2026

Featured Application

The findings of this study can be applied to microstructural interpretation in shale micro-CT imaging. By calibrating micro-CT volume data with high-resolution SEM images, the identification and three-dimensional characterization of shale organic matter types can be significantly improved.

Abstract

Accurate differentiation of in situ organic matter (IOM) from migrated organic matter (MOM) and their three-dimensional characterization are fundamental for understanding hydrocarbon generation, migration, and accumulation in shale reservoirs. However, conventional micro-computed tomography (micro-CT) cannot distinguish organic matter subtypes due to insufficient resolution. This study establishes a novel workflow integrating micro-CT with high-resolution scanning electron microscopy (SEM) through image registration. A cubic sample with parallel opposite faces facilitated ion milling and SEM-CT registration. Under SEM supervision, IOM, MOM, and pore–fracture space were interpreted in the micro-CT volume. Applied to the Chang 7 Member shale in the Ordos Basin, results reveal IOM occupies the largest volume fraction (6.96%), followed by MOM (0.94%), while pore–fracture space accounts for only 0.13%. MOM exhibits four morphological types interconnected by throat-like bridges at the ~3.7 μm scale. MOM and pore–fracture components share similar thickness distributions peaking at ~3.7 μm, reflecting their common inheritance from the pore–throat system, whereas IOM is controlled by sedimentary and compactional processes, favoring finer fractions (<3.5 μm). MOM volume far exceeds current pore space, indicating early hydrocarbons predominantly filled connected networks. This workflow overcomes conventional micro-CT limitations, providing a more objective approach for micro-component identification in shale micro-CT data.

1. Introduction

Organic matter (OM) in shale is the core element controlling hydrocarbon generation, storage, and migration. For a long time, as the material basis of source rocks, systematic evaluation systems have been established for their type, abundance, maturity, and hydrocarbon generation potential [1,2,3]. In recent years, with the commercial breakthrough of shale oil and gas, academic attention to organic matter has undergone a significant extension, focusing more on its dual role as a reservoir space carrier and a tracer of migration pathways [4,5,6]. On one hand, the numerous nanoscale organic pores developed within solid organic matter serve as critical storage spaces for oil and gas fluids [4,7,8]; on the other hand, the occurrence and spatial distribution of migrated organic matter can provide microscopic tracing evidence for hydrocarbon expulsion directions and preferred migration pathways [9,10].
In this context, based on whether organic matter has undergone significant migration and re-precipitation, it can be clearly classified into in situ organic matter (IOM, i.e., kerogen or sapropel that was originally deposited and thermally evolved in place) and migrated organic matter (MOM, i.e., solid bitumen or pyrobitumen derived from liquid hydrocarbons that were expelled from source rocks, migrated along pore–fracture systems, and secondarily precipitated). It should be noted that the genesis of solid bitumen is complex, encompassing both in situ origins (e.g., pre-oil bitumen formed from retained hydrocarbons) and migrated origins, and not all solid bitumen necessarily represents migrated organic matter [11,12]. The MOM addressed in this study is therefore operationally defined as the portion of solid bitumen whose migrated origin is confirmed by occurrence criteria, including a pore- and fracture-filling habit, an association with authigenic minerals, and flow textures (Section 3.1). These two types of organic matter exhibit significant differences in genetic sources, chemical compositions, thermal evolution behaviors, internal pore development characteristics, and their contributions to reservoir properties [2,10,13]. Accurate differentiation and 3D characterization of these two types of organic matter are not only a key scientific issue for deepening the understanding of shale oil generation, storage, and migration but also a practical requirement for sweet-spot evaluation.
However, existing characterization methods face significant technical bottlenecks. Optical microscopy, atomic force microscopy, and confocal laser scanning microscopy can effectively identify organic matter types, morphologies, and compositional differences, but their imaging dimensions are essentially two-dimensional or quasi-three-dimensional, making it difficult to obtain statistically representative 3D spatial distribution information [14,15]. Scanning electron microscopy (SEM) possesses higher image resolution, and systematic organic matter identification methods have been established on this basis [4,6,10], enabling fine-scale resolution of organic matter–mineral contact relationships and nanoscale pore structures. However, SEM is still limited to two-dimensional fields of view and cannot fully characterize the structural distribution and connectivity features of organic matter in three-dimensional space. Micro-computed tomography (micro-CT), as a non-destructive 3D imaging technique, can acquire millimeter- to centimeter-scale shale sample volume data at sub-micron resolution, serving as an ideal bridge connecting microscopic mechanisms and macroscopic reservoir evaluation [16,17,18]. However, in practical applications, micro-CT faces two inherent challenges: first, organic matter and pores in shale both exhibit low-density characteristics in CT grayscale, with highly overlapping grayscale ranges, making conventional threshold segmentation methods ineffective [19,20]; second, due to resolution limitations (typically 0.5–5 μm), micro-CT cannot directly identify organic matter subtypes, nor can it resolve nanoscale pores [17,18,21]. Therefore, relying solely on grayscale differences in micro-CT volume data cannot directly achieve organic matter type differentiation and pore–organic matter decoupling.
To address these challenges, this study establishes an integrated micro-CT and SEM workflow, in which high-resolution SEM imaging first identifies and calibrates IOM, MOM, and pore–fracture components on the same shale sample, and the calibration results are then reversely mapped into the 3D micro-CT volume through voxel-based connectivity analysis. This approach retains the large-field-of-view and three-dimensional imaging advantages of micro-CT while leveraging SEM calibration to overcome the inherent ambiguity of single-technique imaging in distinguishing shale organic matter subtypes. Based on this method, this study takes the Yanchang Formation shale in the Ordos Basin as an example to carry out 3D identification and characterization of IOM and MOM, quantitatively revealing the spatial distribution, volume fractions, morphological characteristics, and spatial relationships with the mineral matrix of the two types of organic matter. The research results provide a reproducible technical workflow for cross-scale characterization of multi-type organic matter in shale oil reservoirs, offering important methodological support for deepening the understanding of shale oil and gas enrichment mechanisms and reservoir characterization.

2. Materials and Methods

2.1. Sample Preparation and Experimental Workflow

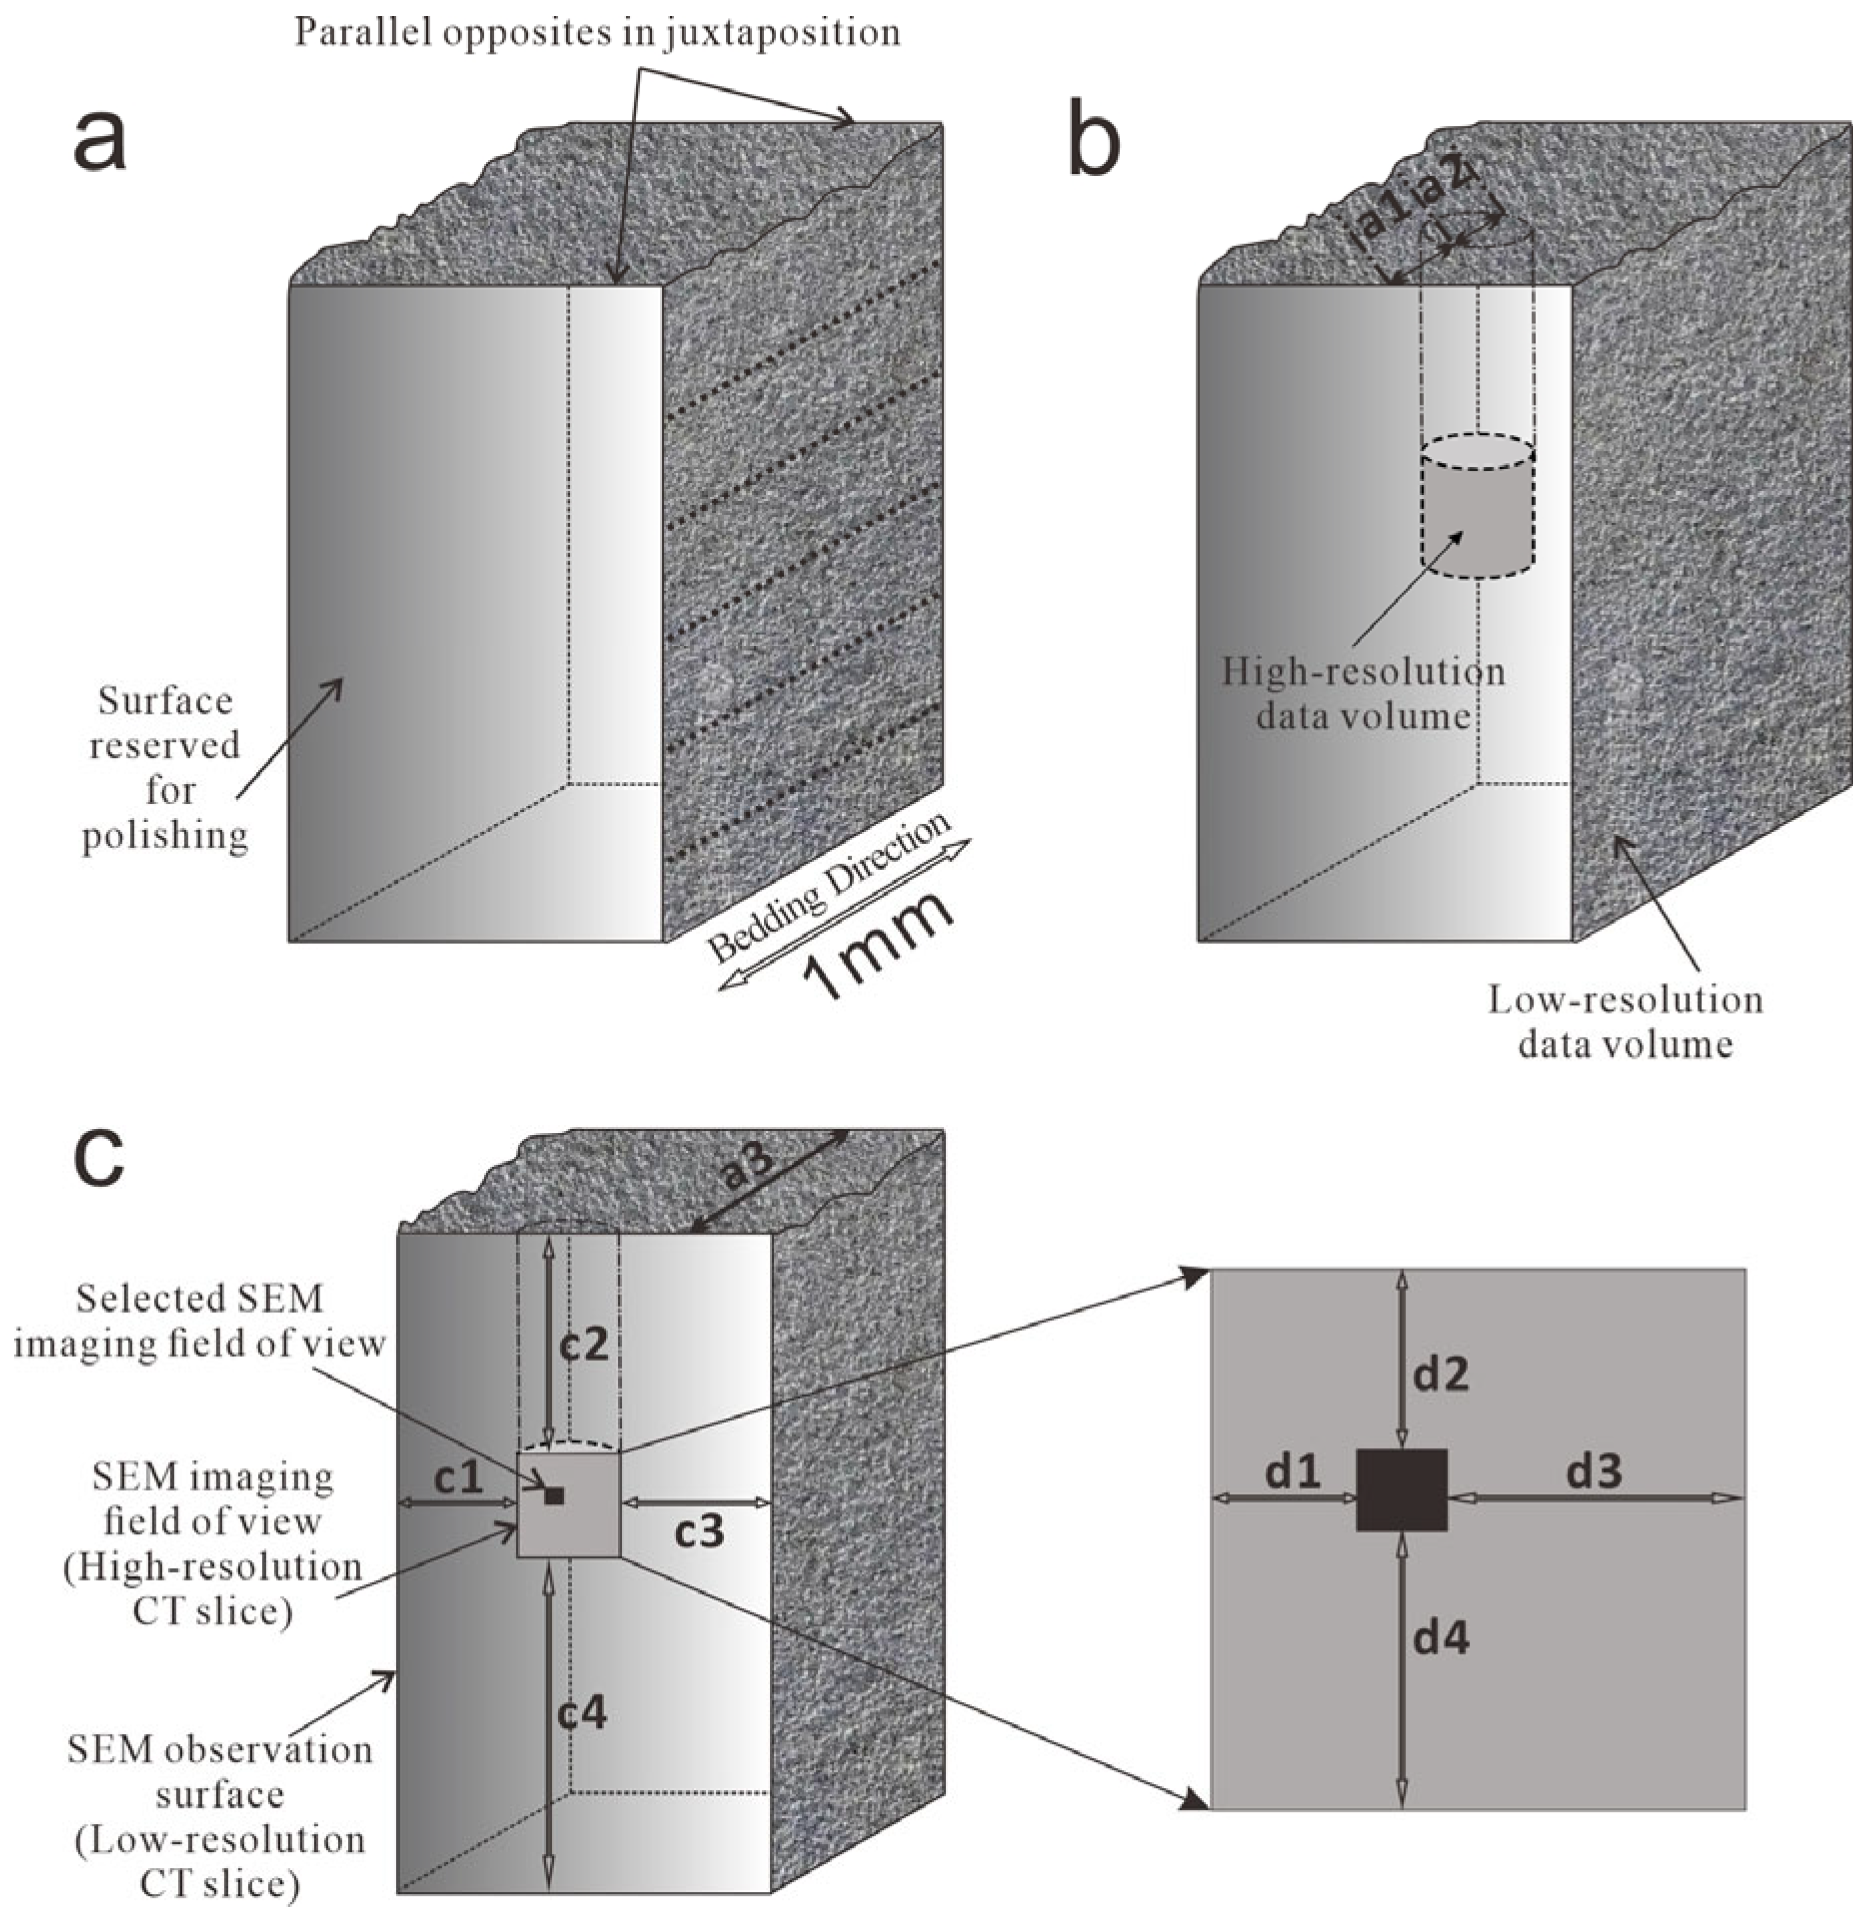
The sample used in this study is a core of the Zhangjiatan shale from the Chang 7 Member of the Yanchang Formation, Ordos Basin. This black shale exhibits high organic matter abundance, mid- to late-oil window thermal maturity, and contains a certain amount of solid bitumen derived from early oil generation [22]. First, the sample was cut into cubes with edge lengths of 1–2 mm using wire cutting. One set of cross-sections perpendicular to the shale bedding direction was selected for fine grinding to ensure high parallelism, with one surface finely polished using 4000-grit sandpaper to facilitate subsequent argon ion milling. The ion milling direction was perpendicular to this parallel opposite surface (Figure 1a). Compared with traditional small cylindrical or irregular block samples, this cubic sample with a reserved polished surface can be directly used for ion milling and SEM scanning after CT scanning, minimizing internal structural damage caused by sample preparation between the two scans. More importantly, the parallel surface direction in the CT reconstructed volume data can be quickly identified in the imaging analysis system to determine the ion milling direction, and the approximate depth of the SEM observation surface in the CT volume data can be rapidly located based on the milling thickness, thereby greatly reducing the data analysis workload required for SEM image registration.
The prepared sample was mounted upright on the sample stage of a 3D X-ray scanner (ZEISS Xradia 510 Versa, ZEISS, Oberkochen, Germany). First, a scan was performed at 1.3 μm resolution using a 4× objective lens (50 kV, 79 μA, 3001 projections), covering the entire sample; then, an internal scan of the central field of view was performed at 0.65 μm resolution (theoretical maximum resolution of 300 nm) using a 20× objective lens (80 kV, 88 μA, 4501 projections). After scanning, the data were reconstructed using ZEISS-developed software (XMReconstructor Version 9.1.12862) to obtain two 3D data volumes (Figure 1b): the low-resolution volume is a cube with an edge length of approximately 1.1 mm, and the high-resolution volume is a cylinder with a height of 0.6 mm and a diameter of 0.6 mm.
After CT scanning, the sample was removed and fixed to a stub with conductive silver adhesive. The reserved polished surface faced upward for argon ion milling (Leica EM TIC3X, Leica, Vienna, Austria), with the milling thickness measured. After ion milling, the sample surface was carbon-coated, and large-area SEM imaging was performed on the selected region. The SEM field of view was 690 μm × 570 μm at a resolution of 10 nm. The SEM instrument was a Sigma 300, with SEM image stitching performed using ATLAS software (Version 5.2.1.25).
To ensure that the SEM imaging area fell within the high-resolution CT volume, the high- and low-resolution CT data volumes were first registered to determine the spatial position of the latter, yielding the thickness bounds a1 and a2 (Figure 1b) and the c1~c4 span distances (Figure 1c). The sample was then polished to a thickness greater than a1 but less than a1 + a2. Finally, based on the measured c1~c4 parameters, the scannable SEM range was identified, and the imaging field of view was selected accordingly (i.e., the inset area bounded by offsets d1~d4 in Figure 1c).

2.2. Image Registration Method

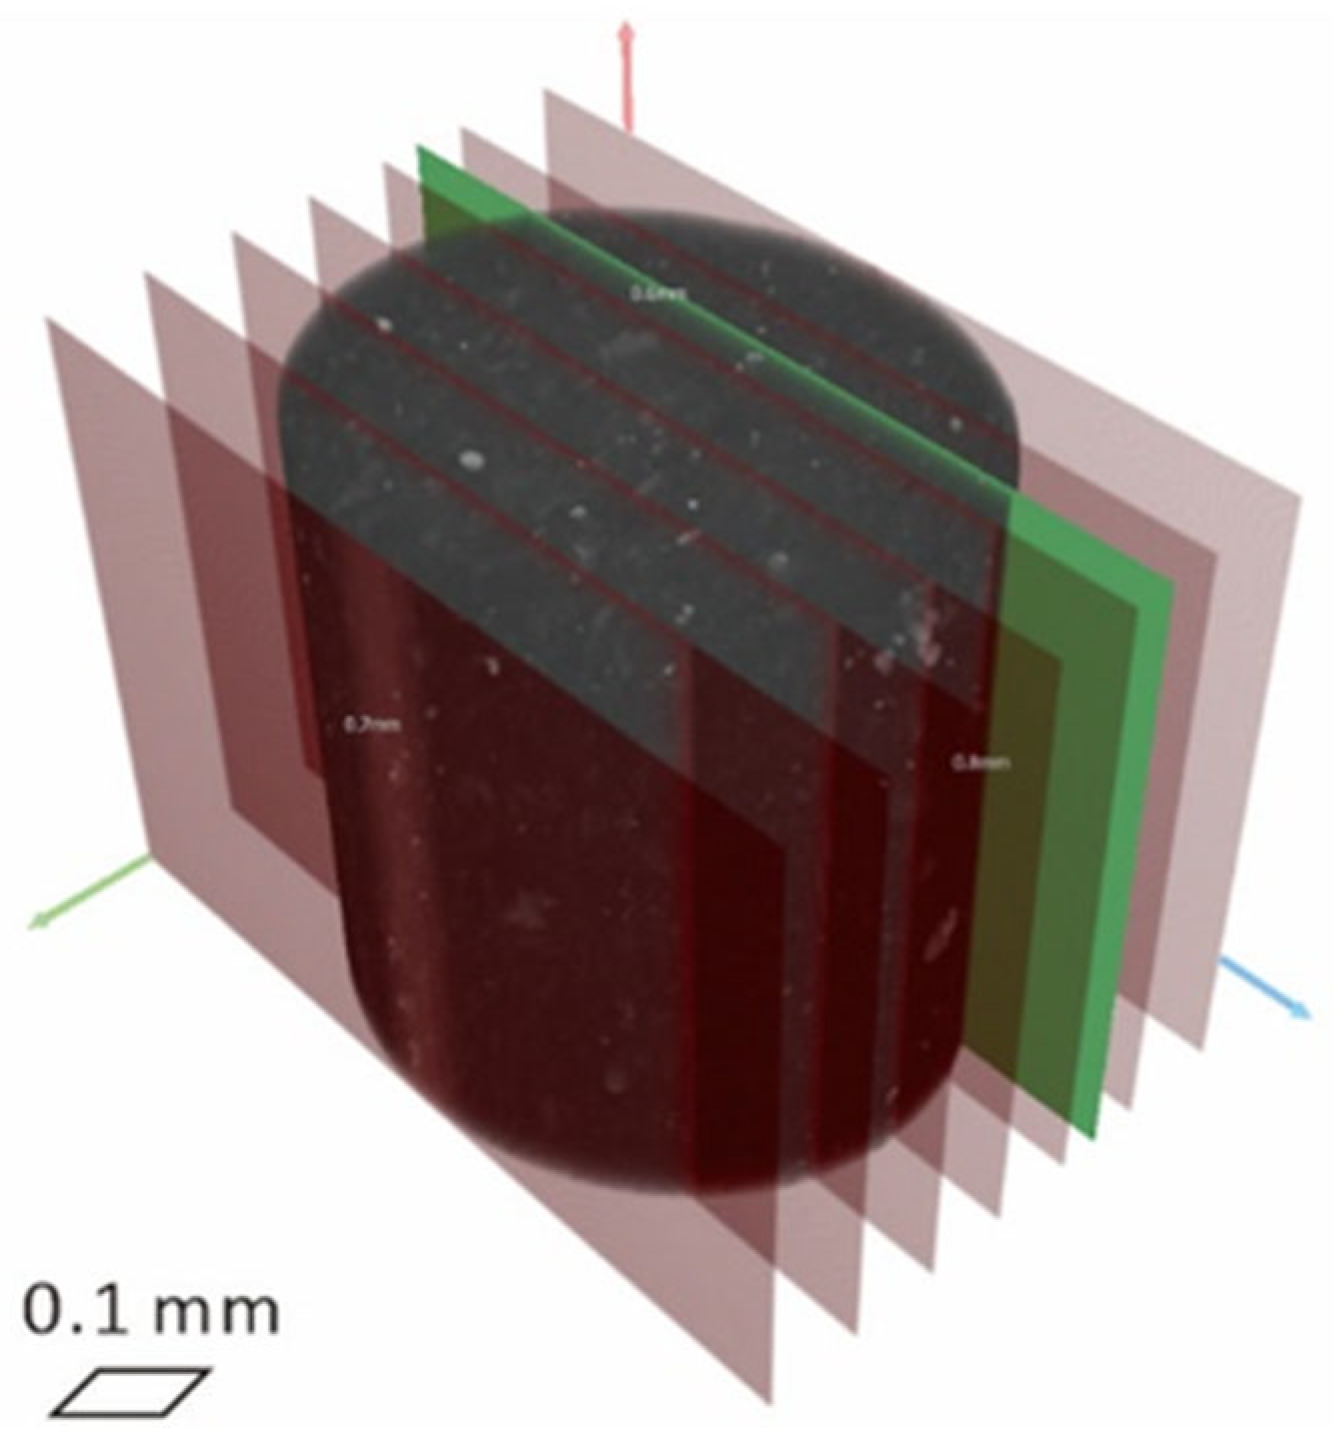
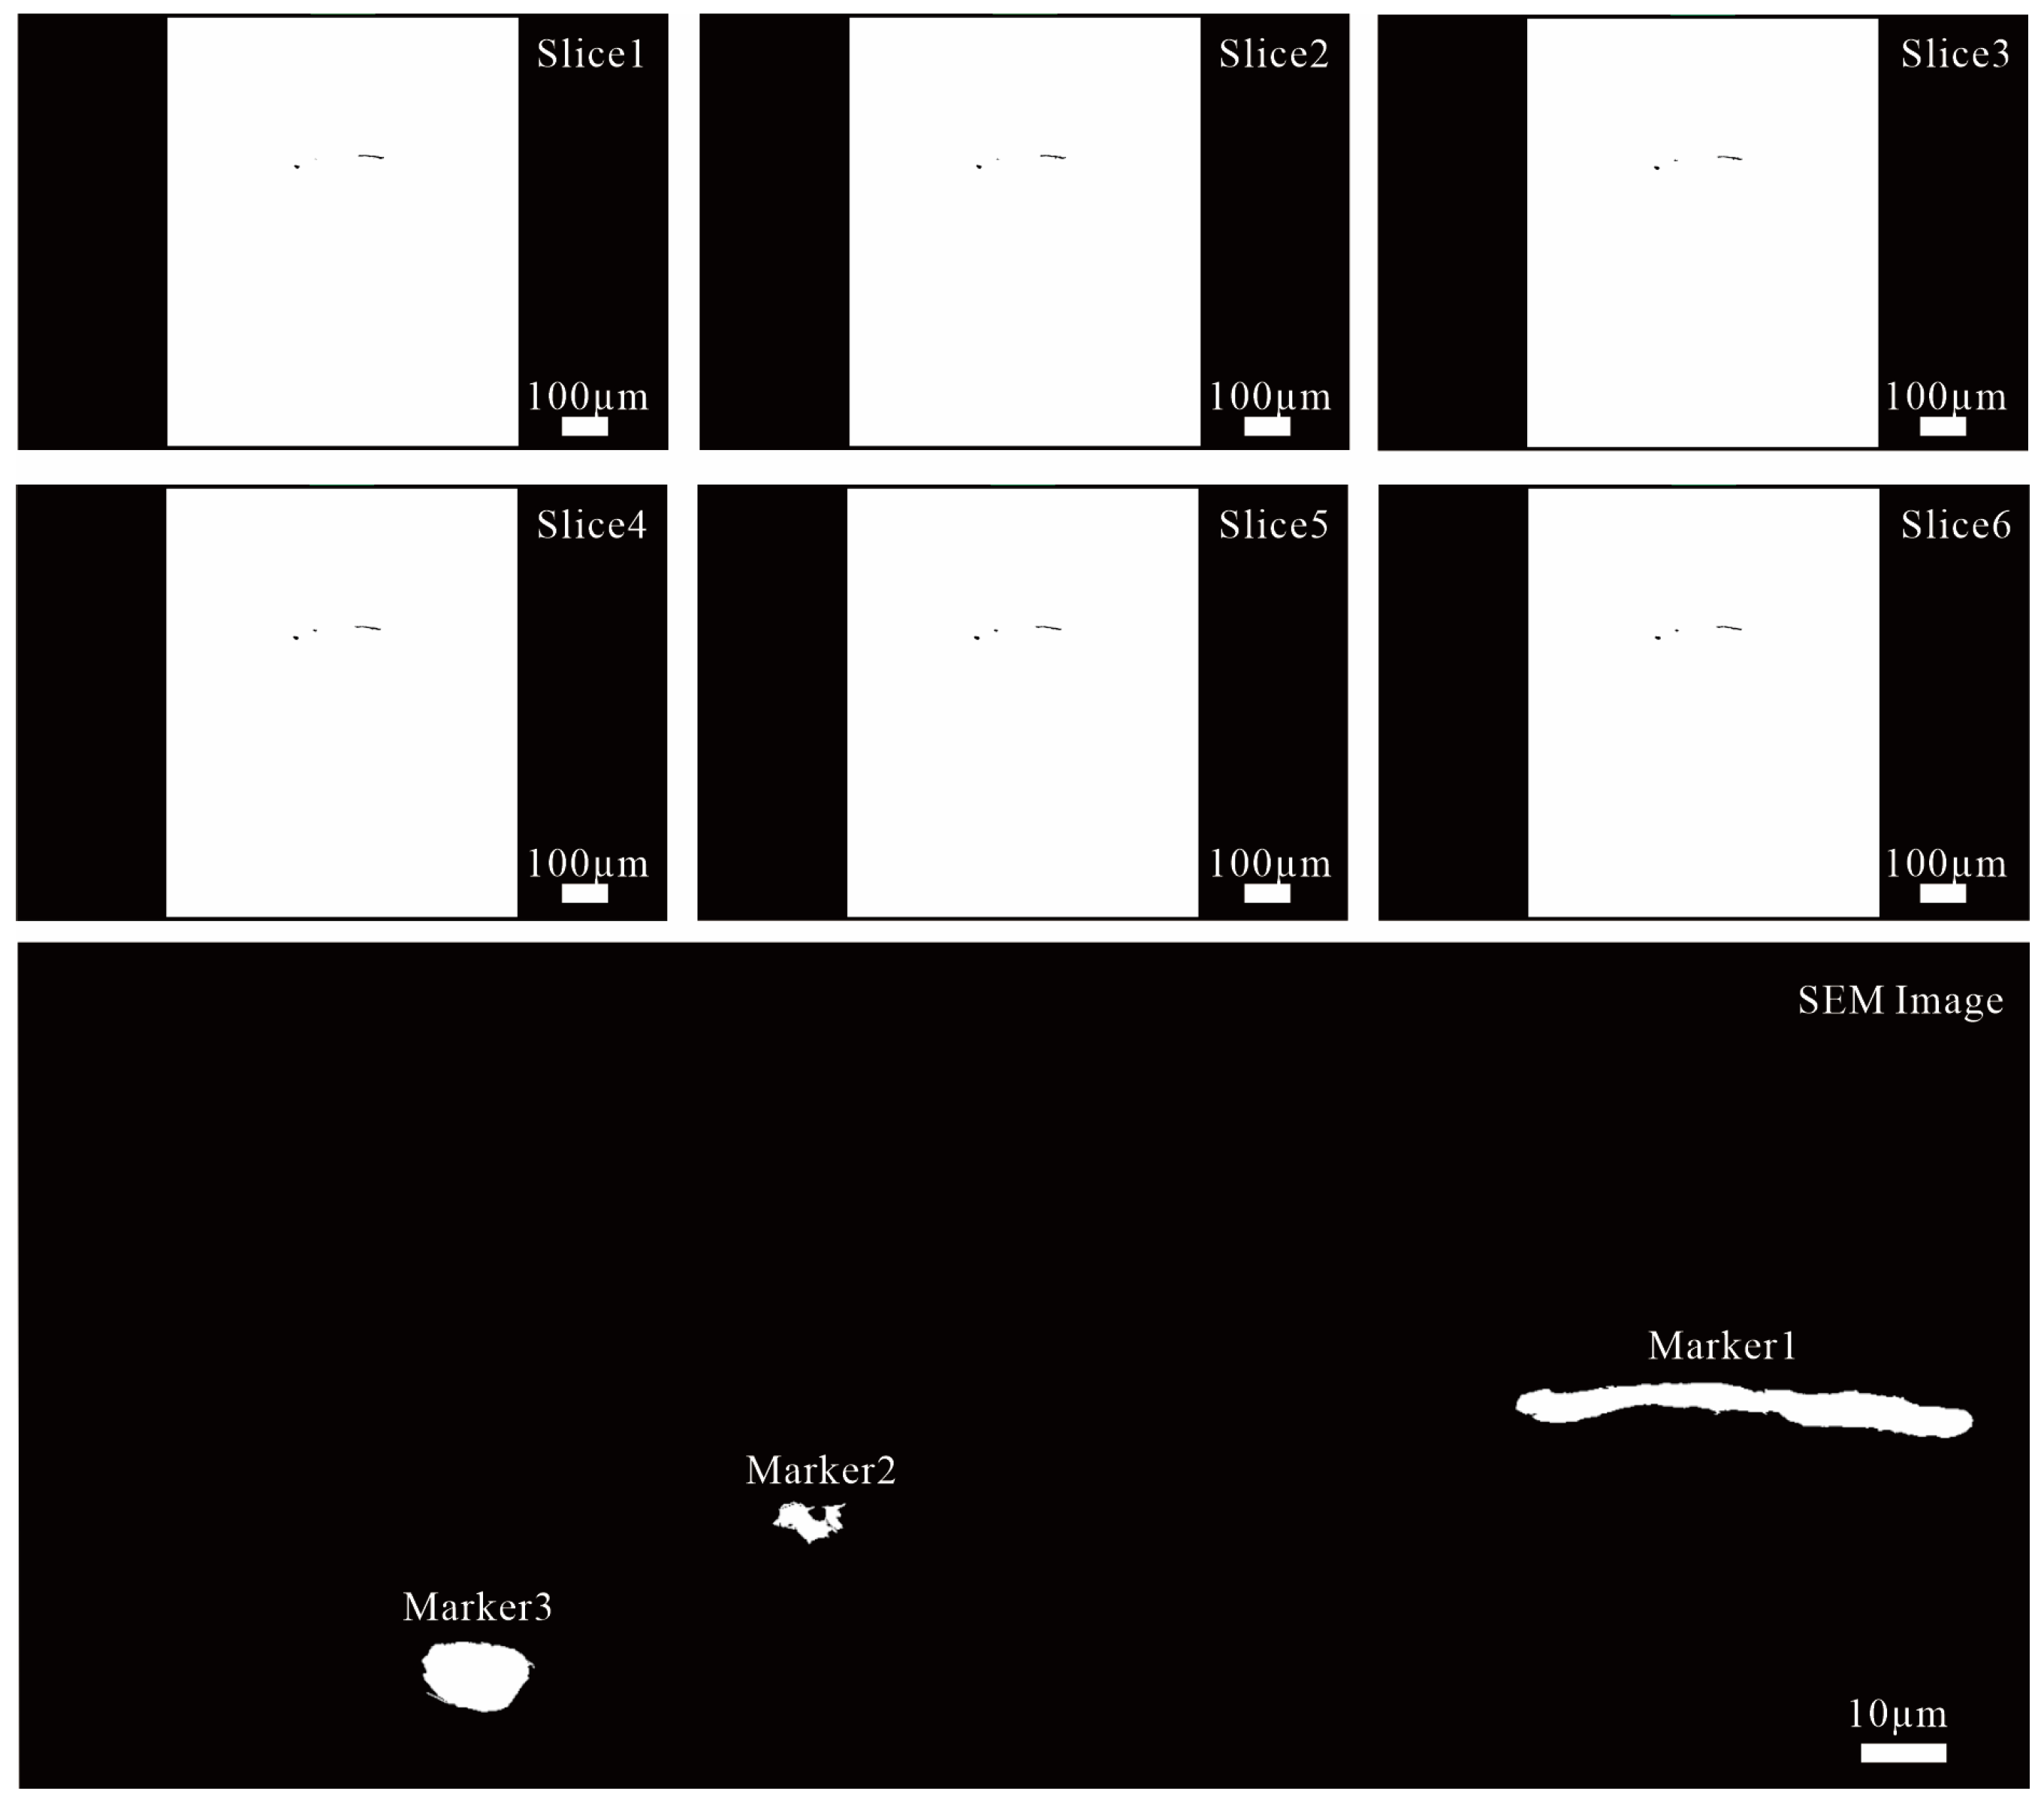
To determine the spatial position of the virtual slice in the high-resolution CT volume data corresponding to the acquired SEM image, an image registration technique was established for rapid localization. First, the high- and low-resolution CT data volumes were registered. In Dragonfly software (v2022.1.0.1259), the two CT data volumes were imported, and the imaging plane slices were moved and adjusted until they coincided, thereby achieving registration of the two different resolution data volumes in a 3D coordinate system (Figure 1b). Then, the ion milling direction was determined in this coordinate system. Using the low-resolution CT volume data, the parallel opposite surface marked by polishing was identified; the direction perpendicular to this surface is the ion milling direction. This direction was applied as a virtual slicing direction to the cylindrical high-resolution data volume, and slices were exported (Figure 2). Finally, based on the actual milling thickness (marked as a3 in Figure 1c), the approximate depth range of the SEM observation surface in the high-resolution data volume was determined, and a set of slices containing the SEM observation surface was extracted. Registration was performed based on the pixel area of image markers. The localized high-resolution CT volume slice set, i.e., the candidate slice set with a similar field of view to the SEM image, was extracted using a uniform threshold to identify low-grayscale components (using the Moments method in ImageJ v1.53q). Several discrete distributed units were selected as markers (Figure 3), and the area of each selected marker in each candidate CT slice was calculated. In the SEM image, the low-grayscale components corresponding to each marker in the candidate slices were located and extracted using appropriate thresholds (using the IJ IsoData method in ImageJ), and the area of each marker in the SEM image was calculated. Using the SEM image marker area as the standard, the relative error between the corresponding marker area in each candidate CT slice and the standard area was calculated. The average relative error of all marker areas in each candidate CT image was statistically analyzed, and the candidate CT slice with the minimum average relative error was selected as the registration target. As shown in Table 1, Slice 3 in this example best matches the SEM image. Thus, the depth plane of the SEM observation surface in the high-resolution CT volume data was determined (marked as the green slice in Figure 2). In the registration field of view, the centroid of the aforementioned marker was used as the registration reference point, and this CT slice was registered with the SEM image through translation and rotation in Dragonfly software (Figure 4).

2.3. Component Calibration and 3D Interpretation Method

Due to the different resolutions and observation scales of micro-CT and SEM images, the resolution of the SEM image component identification results needs to be reduced to match the CT slice resolution when calibrating CT image components. In this study, the dataset sampler tool in Dragonfly software was used to downsample the component identification result label maps, i.e., region of interest (ROI). The downsampling employed nearest-neighbor interpolation, which uses the closest original pixel value as the output. This avoids non-integer labels from linear interpolation and preserves the category purity of each pixel in the downsampled image. As shown in Figure 5, the process of using high-resolution SEM component identification results to calibrate corresponding components in micro-CT slices is demonstrated. Figure 5a shows the component identification results in the SEM image (including three types: IOM, MOM, and pore–fracture space). Figure 5b overlays this identification result directly onto the registered CT slice, intuitively displaying the correspondence between the two images in component identification. Figure 5c shows the downsampled high-resolution identification results at CT resolution, achieving pixel-by-pixel component calibration in CT slices, providing supervised information for micro-component differentiation in micro-CT 3D volume data.
The components identified in the SEM images were discriminated against following the seven occurrence-based criteria summarized by Loucks and Reed [10], with the diagnostic features compiled in Table 2. Identification was not based on any single feature but followed a hierarchical decision sequence: occurrence mode (bedding-parallel and dispersed versus pore- or fracture-filling) was considered first, followed by contact relationships with authigenic minerals, internal textures, edge morphology, and associated shrinkage pores or fractures. Only components identified with high confidence under these criteria were used to supervise the calibration of the micro-CT data.
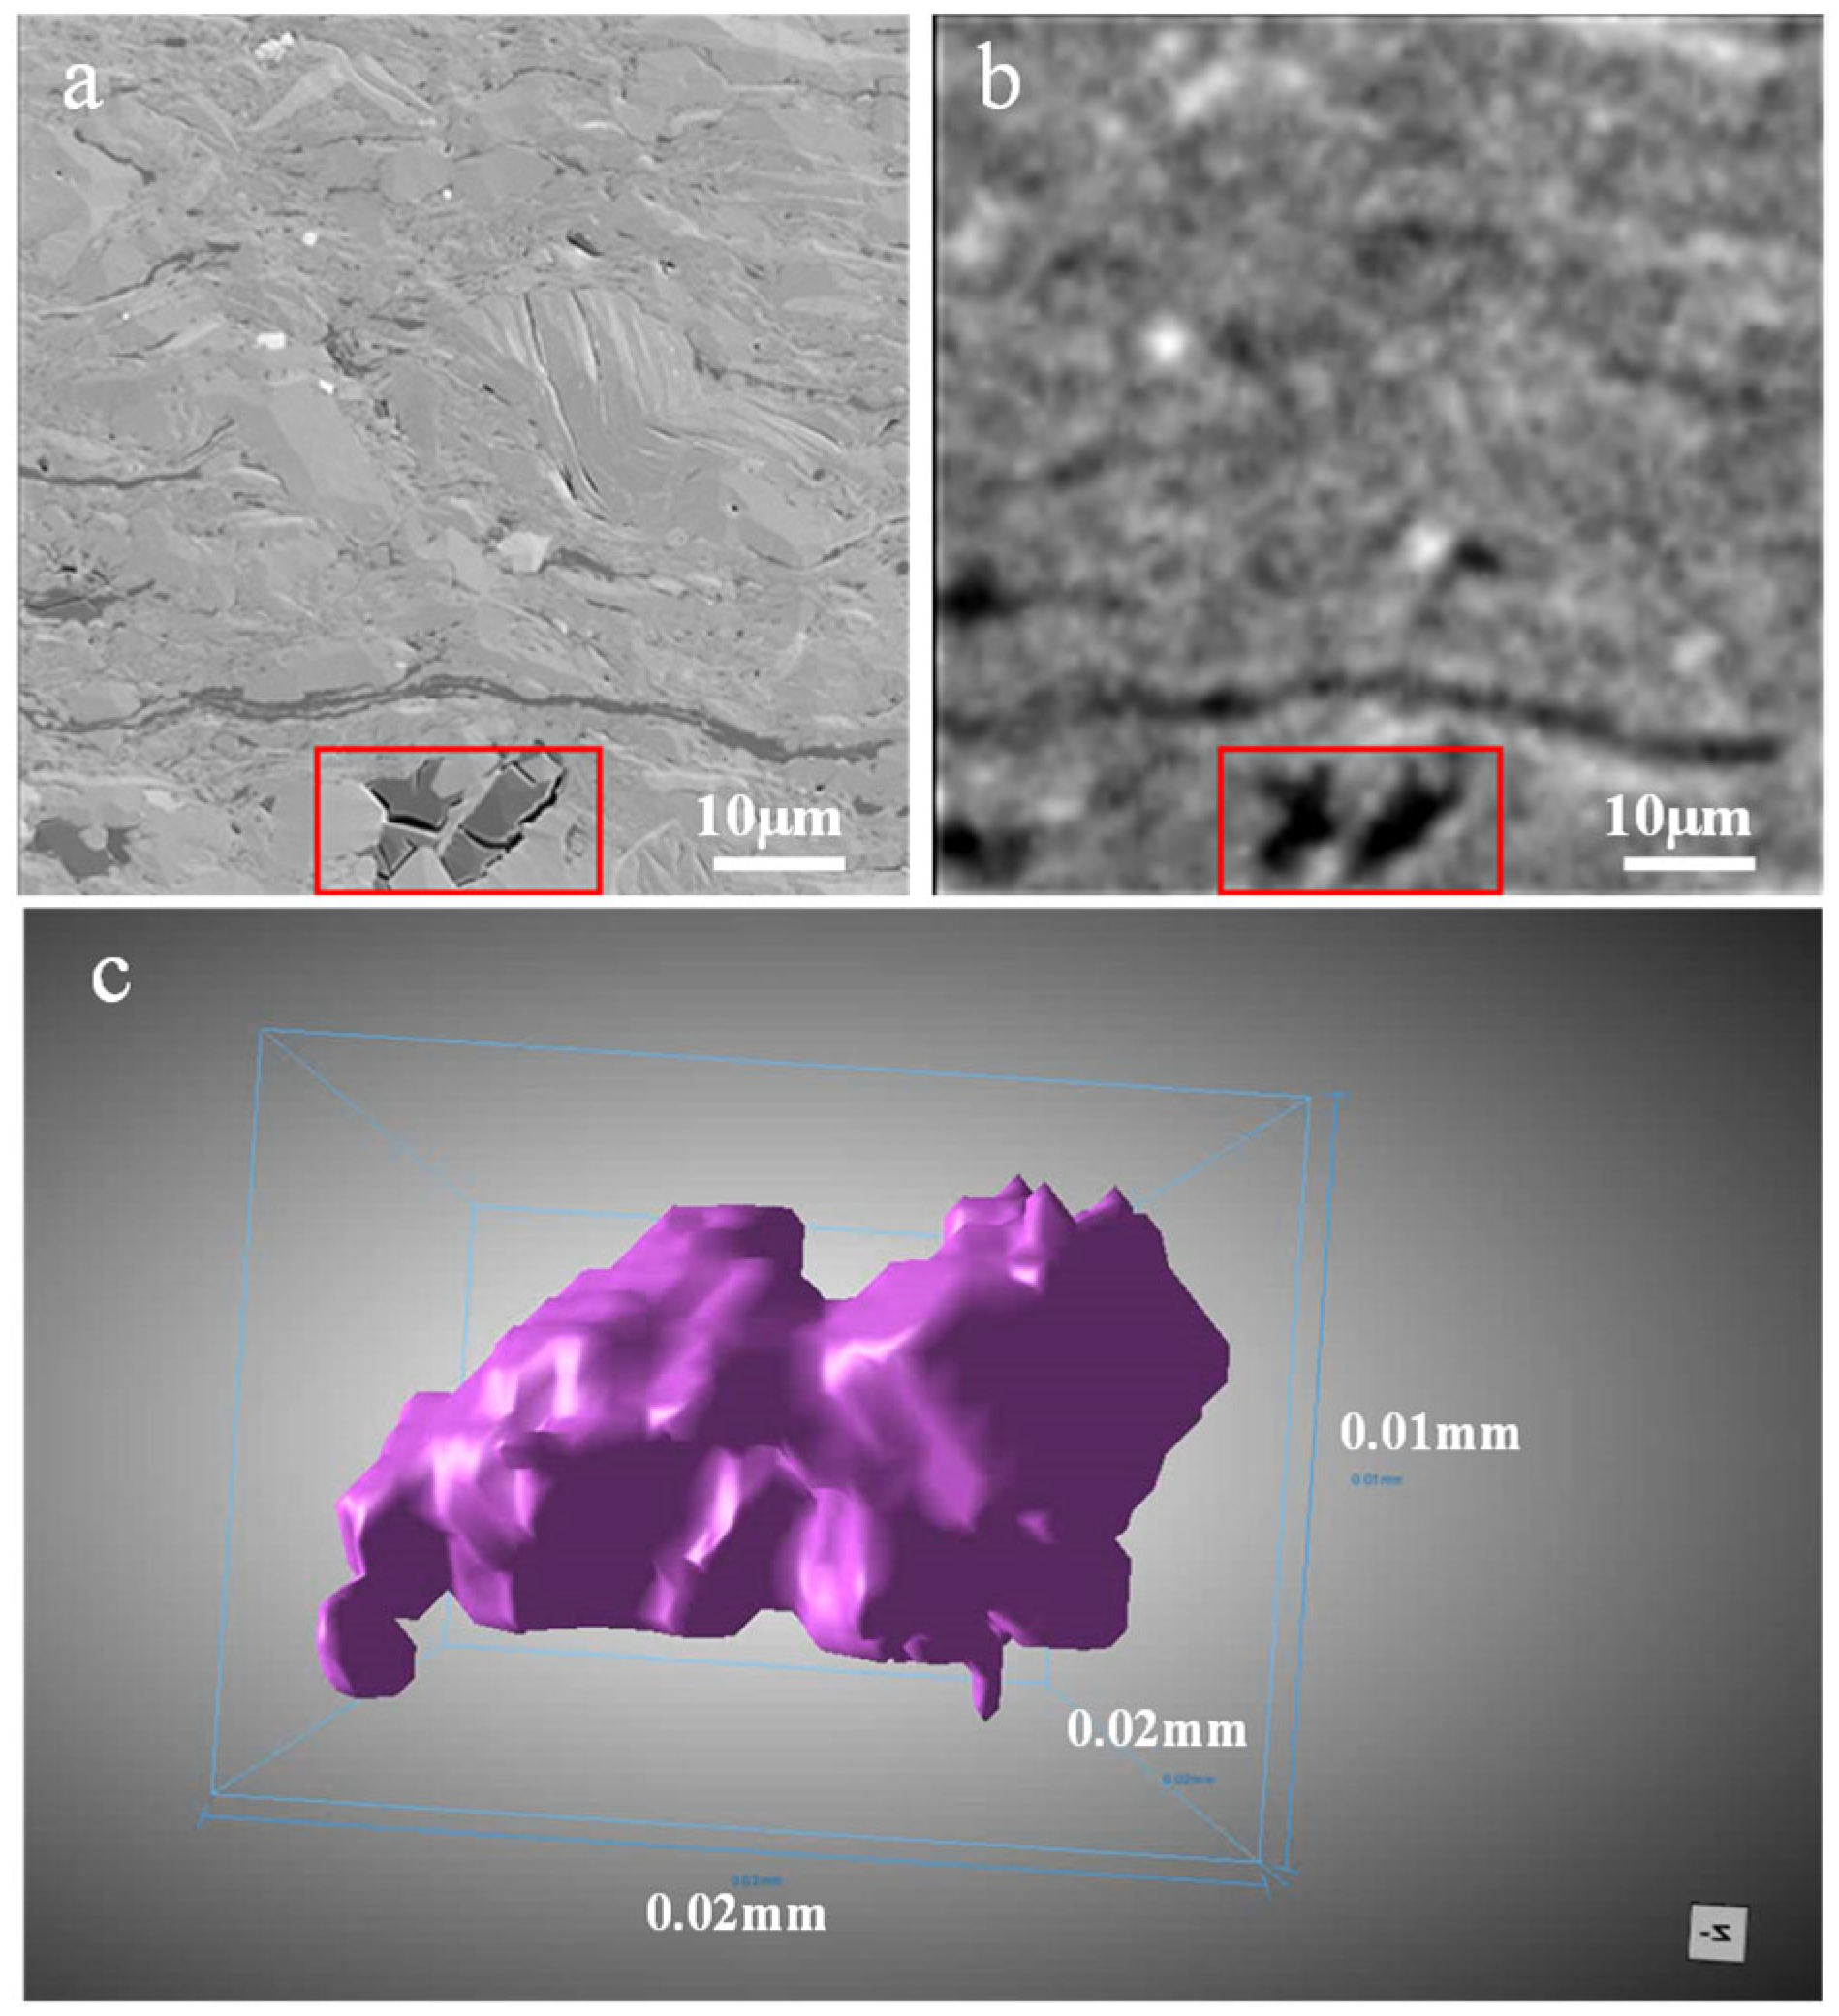
To achieve 3D spatial characterization of micro-components, based on the slice calibration results, an appropriate threshold was selected for the CT volume data so that the identification results on the registered slices best matched the calibration results. On this basis, voxel connectivity analysis was performed on the segmented target objects. This study employed the 6-connectivity rule (i.e., two voxels are considered connected only when they share a face) to distinguish mutually independent component units. After connectivity analysis, quantitative parameters such as volume, equivalent diameter, shape factor, and spatial position of each connected object can be obtained for subsequent quantitative characterization of different components. As shown in Figure 6, a migrated organic matter component unit identified in the SEM image and its calibration result in the CT-registered slice are displayed. Under the constraint of slice component calibration results, voxel-based grayscale connectivity analysis was used to obtain and extract the spatial morphology of this component in the CT volume data, achieving the transformation from 2D image calibration to 3D component identification and segmentation extraction.

3. Results

3.1. Identification and Characterization of In Situ and Migrated Organic Matter in SEM Images

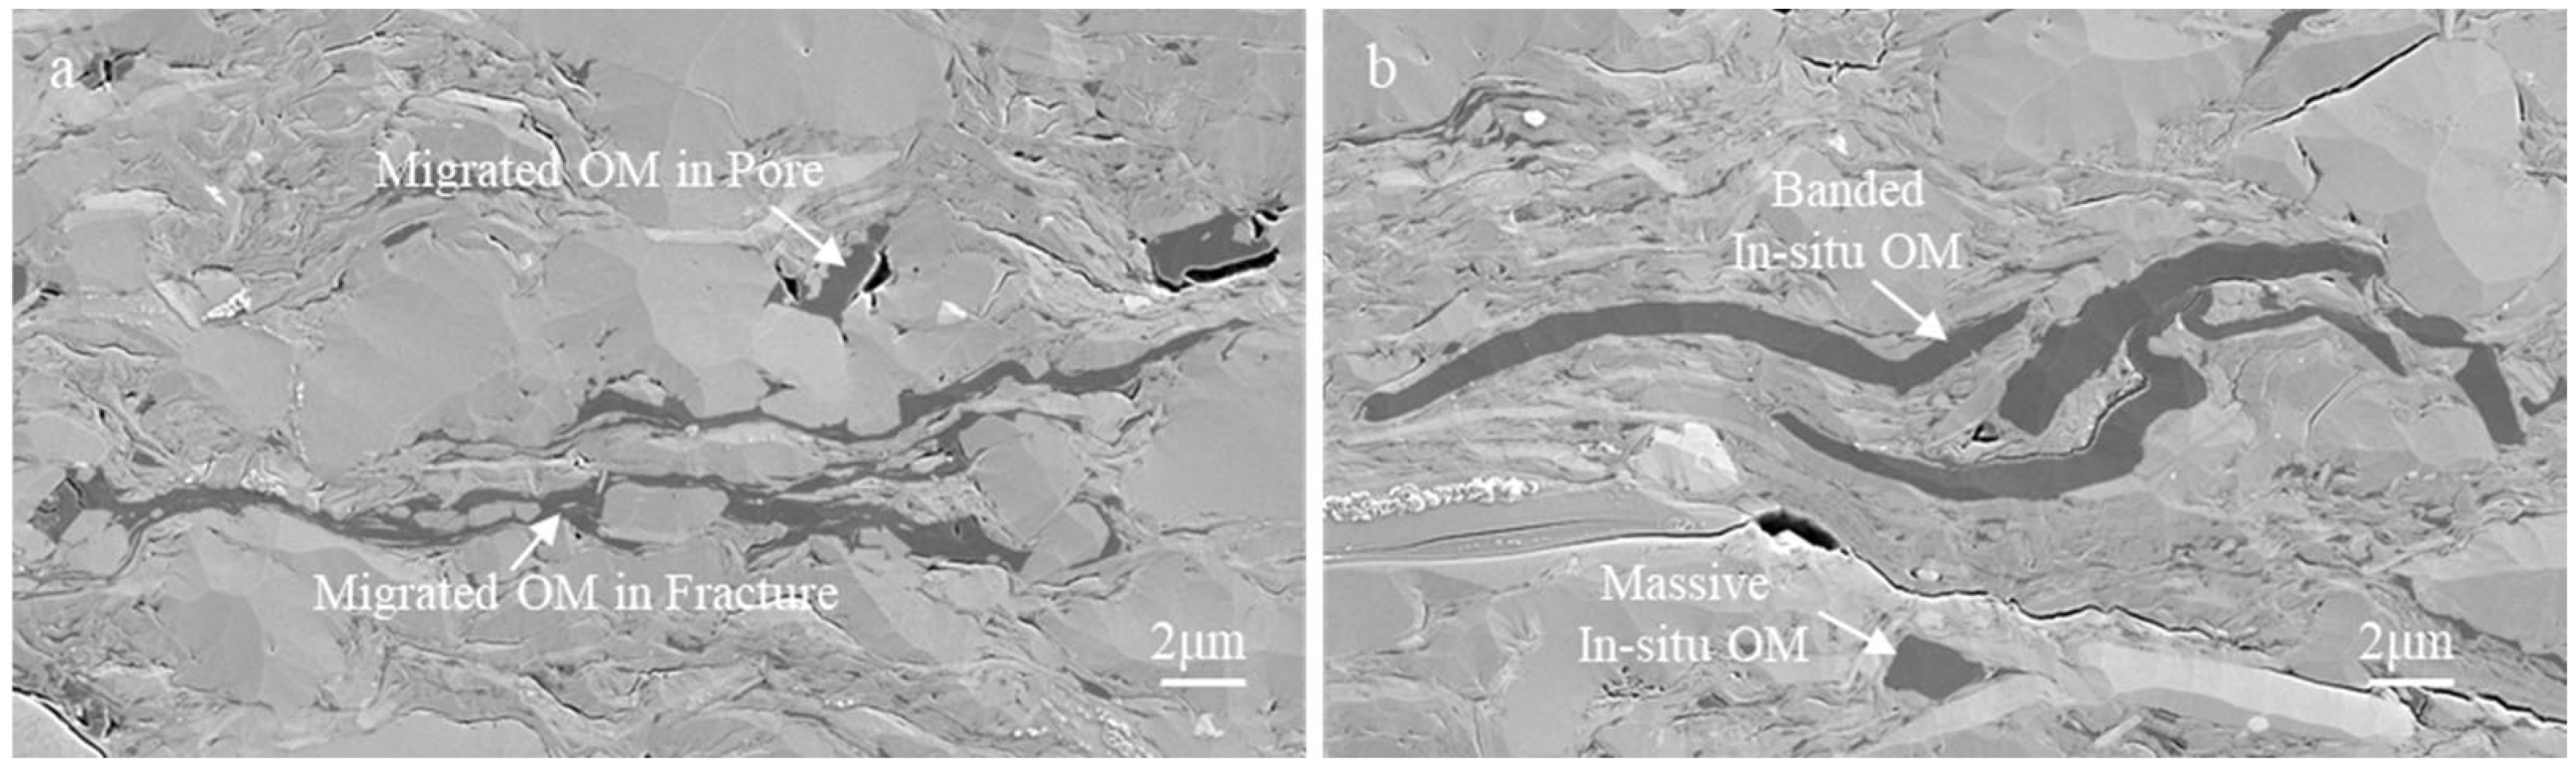
At the SEM scale, organic matter and pore–fracture components can be directly distinguished based on grayscale differences in high-resolution images. On this basis, combined with the seven identification criteria summarized by Loucks and Reed [10] based on the occurrence characteristics of MOM and IOM, organic matter types were discriminated against. In practice, identification ambiguities arise mainly for fine-grained organic matter particles because smaller particles provide less diagnostic information: for particles below ~1 μm, the occurrence mode, contact relationships, internal textures, and edge morphology can rarely be resolved simultaneously. Such fine-grained organic matter is also below the effective identification limit of the micro-CT data used for calibration (approximately 1.3–2.6 μm, i.e., 2–4 voxels [17,18]) and therefore cannot be identified or calibrated in the CT volume in any case. The identification and subsequent characterization in this study thus focus on relatively large, micron-scale organic matter particles for which the mineral contact relationships, internal structures, edge morphologies, and pore–fracture development are clearly displayed, so that the classification basis of each identified component is explicit and reproducible. As shown in Figure 7a, MOM exhibits filling characteristics and is in contact with secondary minerals (e.g., authigenic quartz). This indicates that the space was originally an open pore–fracture network, later infilled by liquid hydrocarbons, which subsequently converted to solid bitumen during thermal evolution. The detrital minerals dispersed within the solid bitumen also exhibit distinct flow-induced textures. In contrast, the IOM in Figure 7b shows more obvious compaction characteristics, dispersed and intercalated in the depositional mineral fabric along the shale bedding, exhibiting syndepositional characteristics. Previous studies have shown that MOM (e.g., pyrobitumen) is more porous than IOM, with its pores originating from secondary cracking of crude oil during thermal maturation [7,8,9].
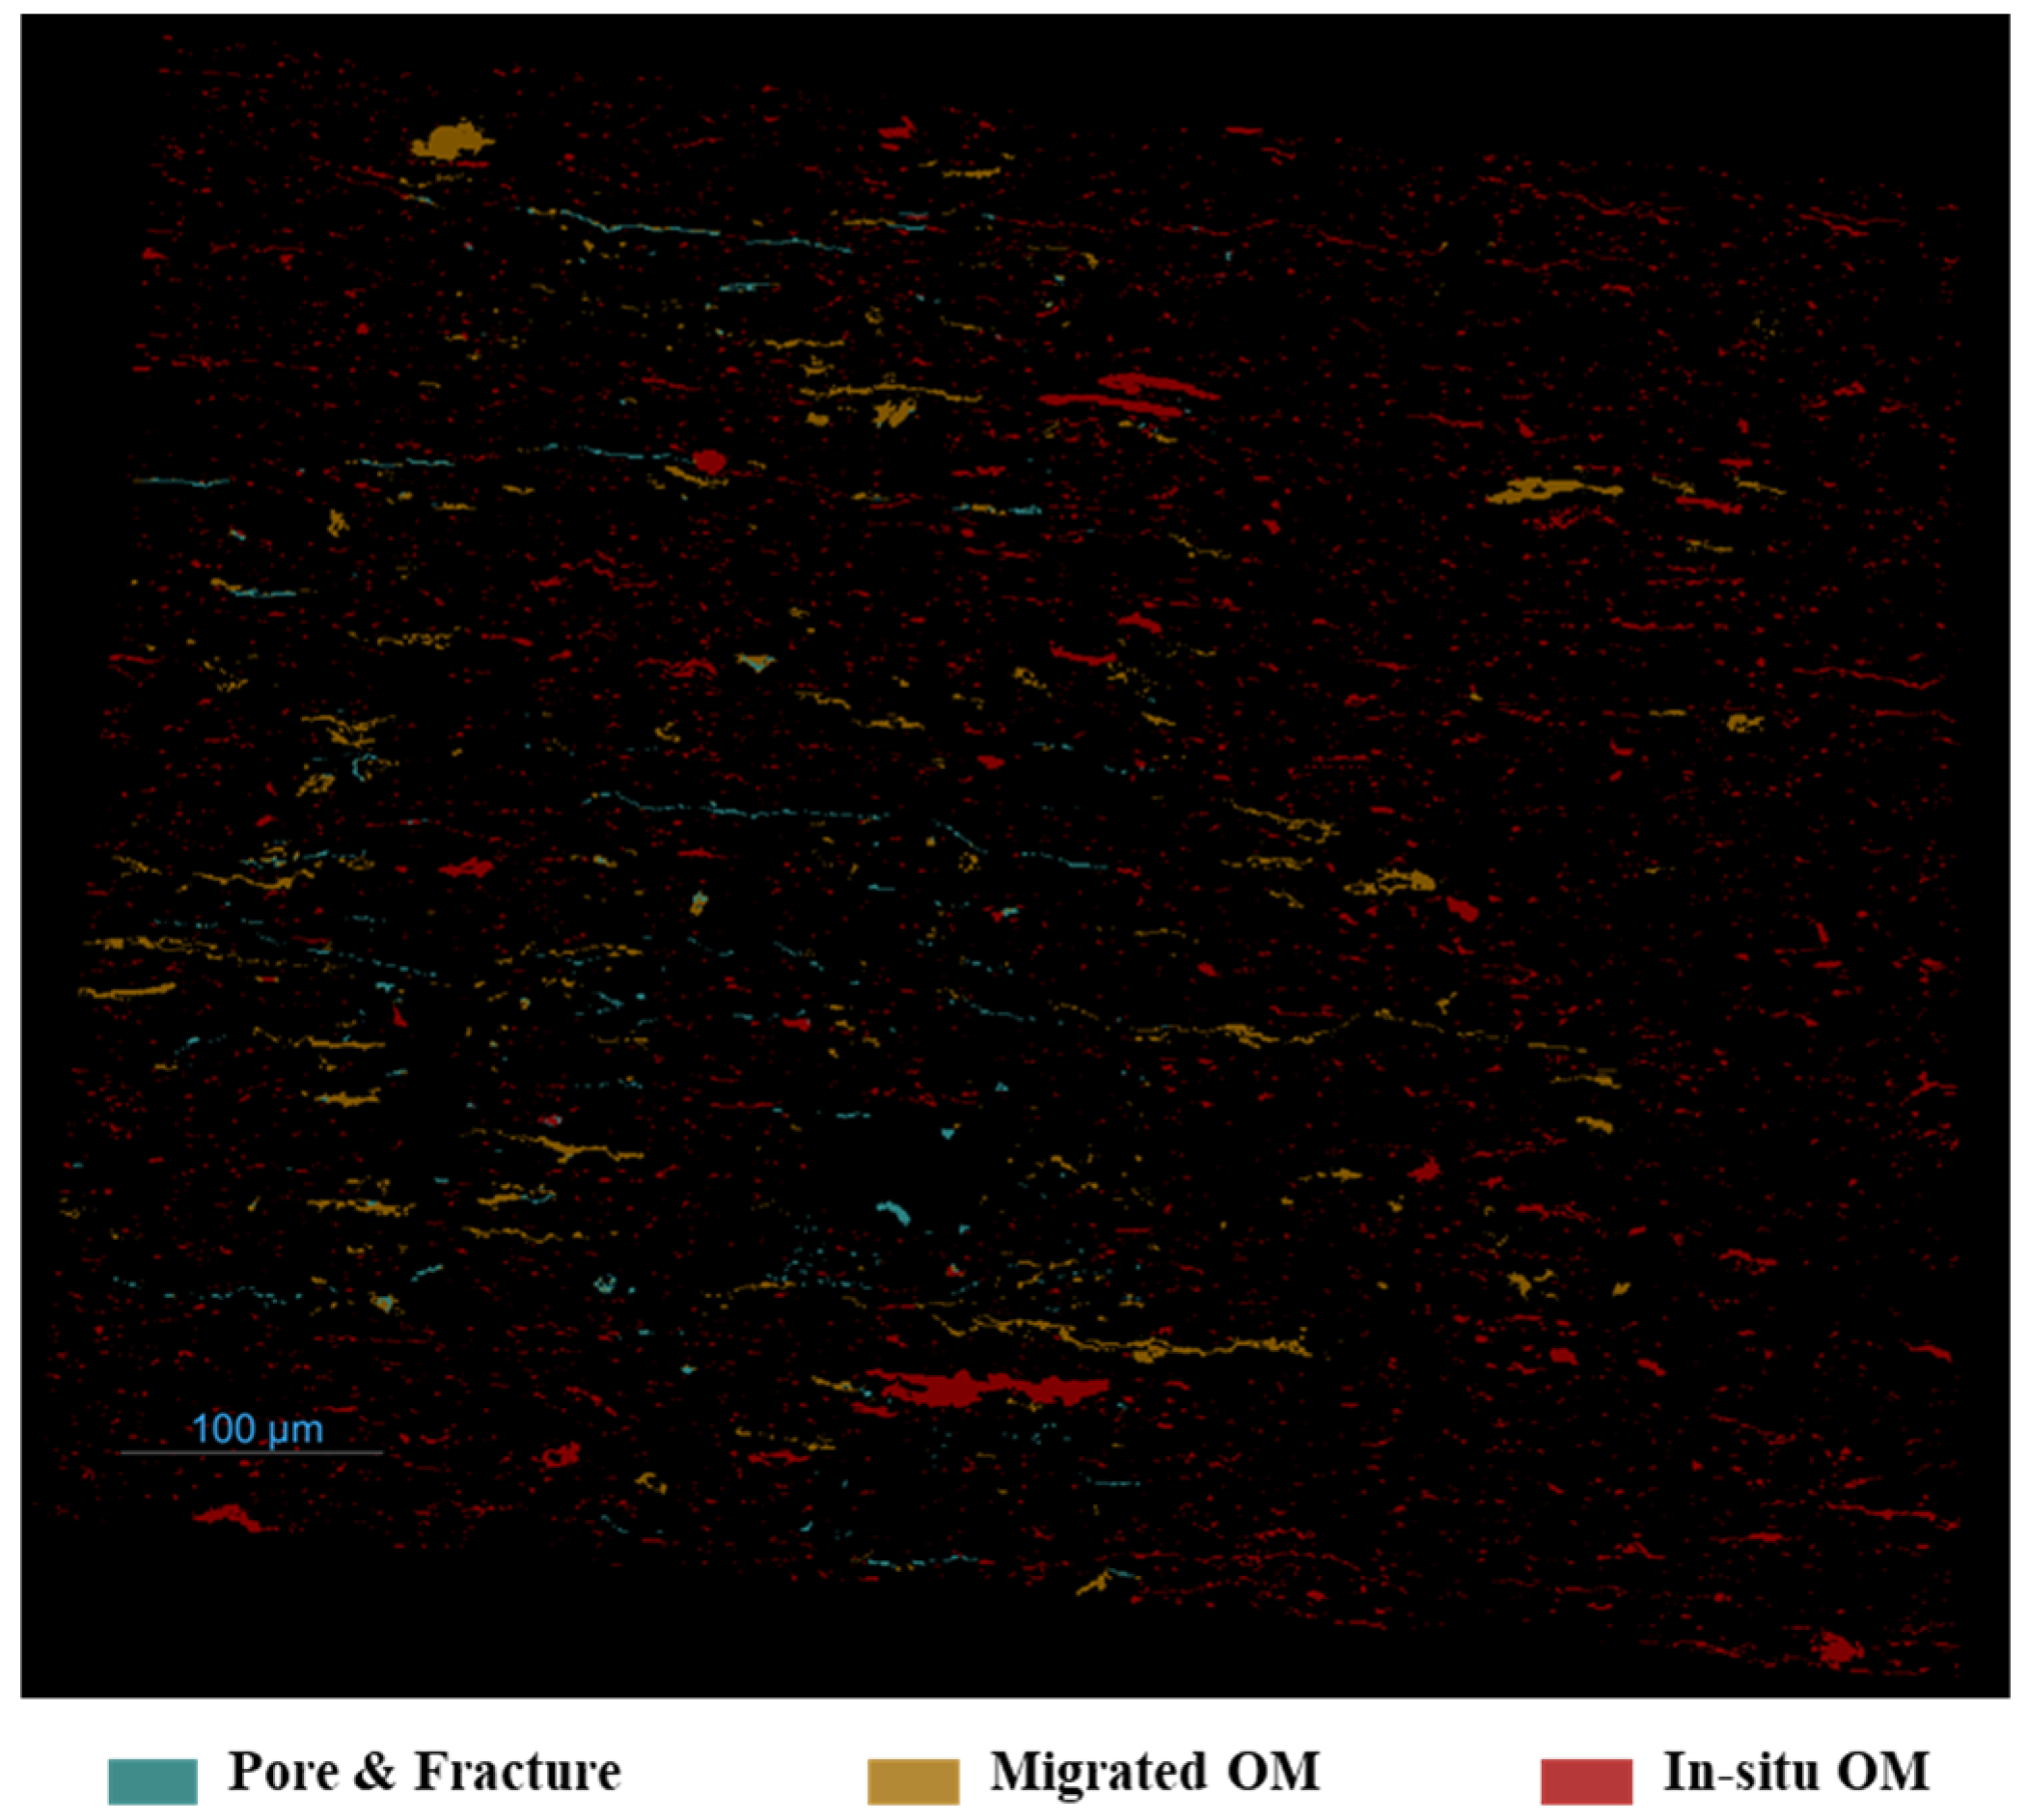
Based on the discrimination principles for organic matter types in 2D images, organic matter types and pore–fracture spaces in the high-resolution SEM image with a field of view of 690 × 570 μm2 were identified. As shown in Figure 8, IOM (such as alginite and vitrinite) exhibits smooth, straight edges in 2D morphology, with abundant fragmented blocky particles of several microns in diameter, as well as some banded particles extending up to ~100 μm in length. In contrast, MOM, due to injection along pores and microfractures, has uneven, tortuous edges, and its overall irregularity is higher due to the constraints of various authigenic mineral boundaries. Among them, MOM filling pores mostly appears patchy, with particle sizes generally below 10 μm, while MOM filling fractures mostly appears banded, with extension lengths up to approximately 100 μm. Compared with IOM, MOM often develops shrinkage fractures or pores at the contact edges with minerals or within the organic matter, indicating that the filling degree of MOM in reservoir spaces is often incomplete. The formation of these pores and fractures in MOM may be partly caused by sample processing and polishing or SEM observation vacuum, or may be related to hydrocarbon generation, or indicate spaces occupied by gas and water in pores [4,6,23].

3.2. SEM-Guided Micro-CT Component Identification and Characterization

Based on the SEM registered image shown in Figure 8 and its component identification results, using the component calibration and 3D interpretation methods described in Section 2.3, the IOM (Figure 9a), MOM (Figure 9b), and pore–fracture space (Figure 9c) in the CT volume data under supervision were identified and characterized. The interpreted CT volume has dimensions of 0.6 × 0.4 × 0.1 mm3, with the long axis of the cube parallel to the shale depositional bedding direction (yellow arrow in Figure 9d). The SEM image used for component calibration is located at the center of this volume (yellow dashed line in Figure 9d). Constrained by voxel connectivity, the SEM component 2D calibration results can control a data volume thickness below 100 μm, which is consistent with the maximum extension distance of general organic matter observed in 2D images.
Micro-CT volume component characterization results show that IOM has the highest content in this shale sample, with a volume fraction of 6.96%, followed by MOM at 0.94%. Current studies generally believe that the Chang 7 Member shale is mainly located within the oil window [24,25], and large-scale MOM formation mainly occurs in the middle-to-late stages of the oil window, where retained liquid hydrocarbons in the shale matrix gradually transform into post-oil solid bitumen with increasing thermal evolution maturity. The much higher IOM content relative to MOM is consistent with, but not uniquely diagnostic of, the medium-to-low thermal maturity of the Yanchang Formation shale in the Ordos Basin because the abundance of MOM is collectively controlled by hydrocarbon generation efficiency, expulsion and migration efficiency, retention capacity within the shale, and potentially by hydrocarbons sourced from adjacent intervals. Moreover, this ratio derives from a single sample and a single imaged volume, and components below the CT resolution limit (1.3–2.6 μm) are not captured; it should therefore be regarded as a site-specific observation rather than a direct maturity proxy.
As shown in Figure 9c, the pore–fracture component identified in the micro-CT volume accounts for only 0.13%, which is far less than the gas-measured porosity of general shale samples. The main reason is the limitation of CT resolution, which theoretically can only identify objects with pore diameters greater than 1.3–2.6 μm, i.e., objects above 2–4 voxels [17,18]. Therefore, the porosity interpreted from the micro-CT volume represents the porosity contributed by micron-scale macropores, generally from intergranular pores, intragranular pores, and microfractures.

4. Discussion

4.1. Types and Characteristics of Migrated Organic Matter Based on 3D Configurations

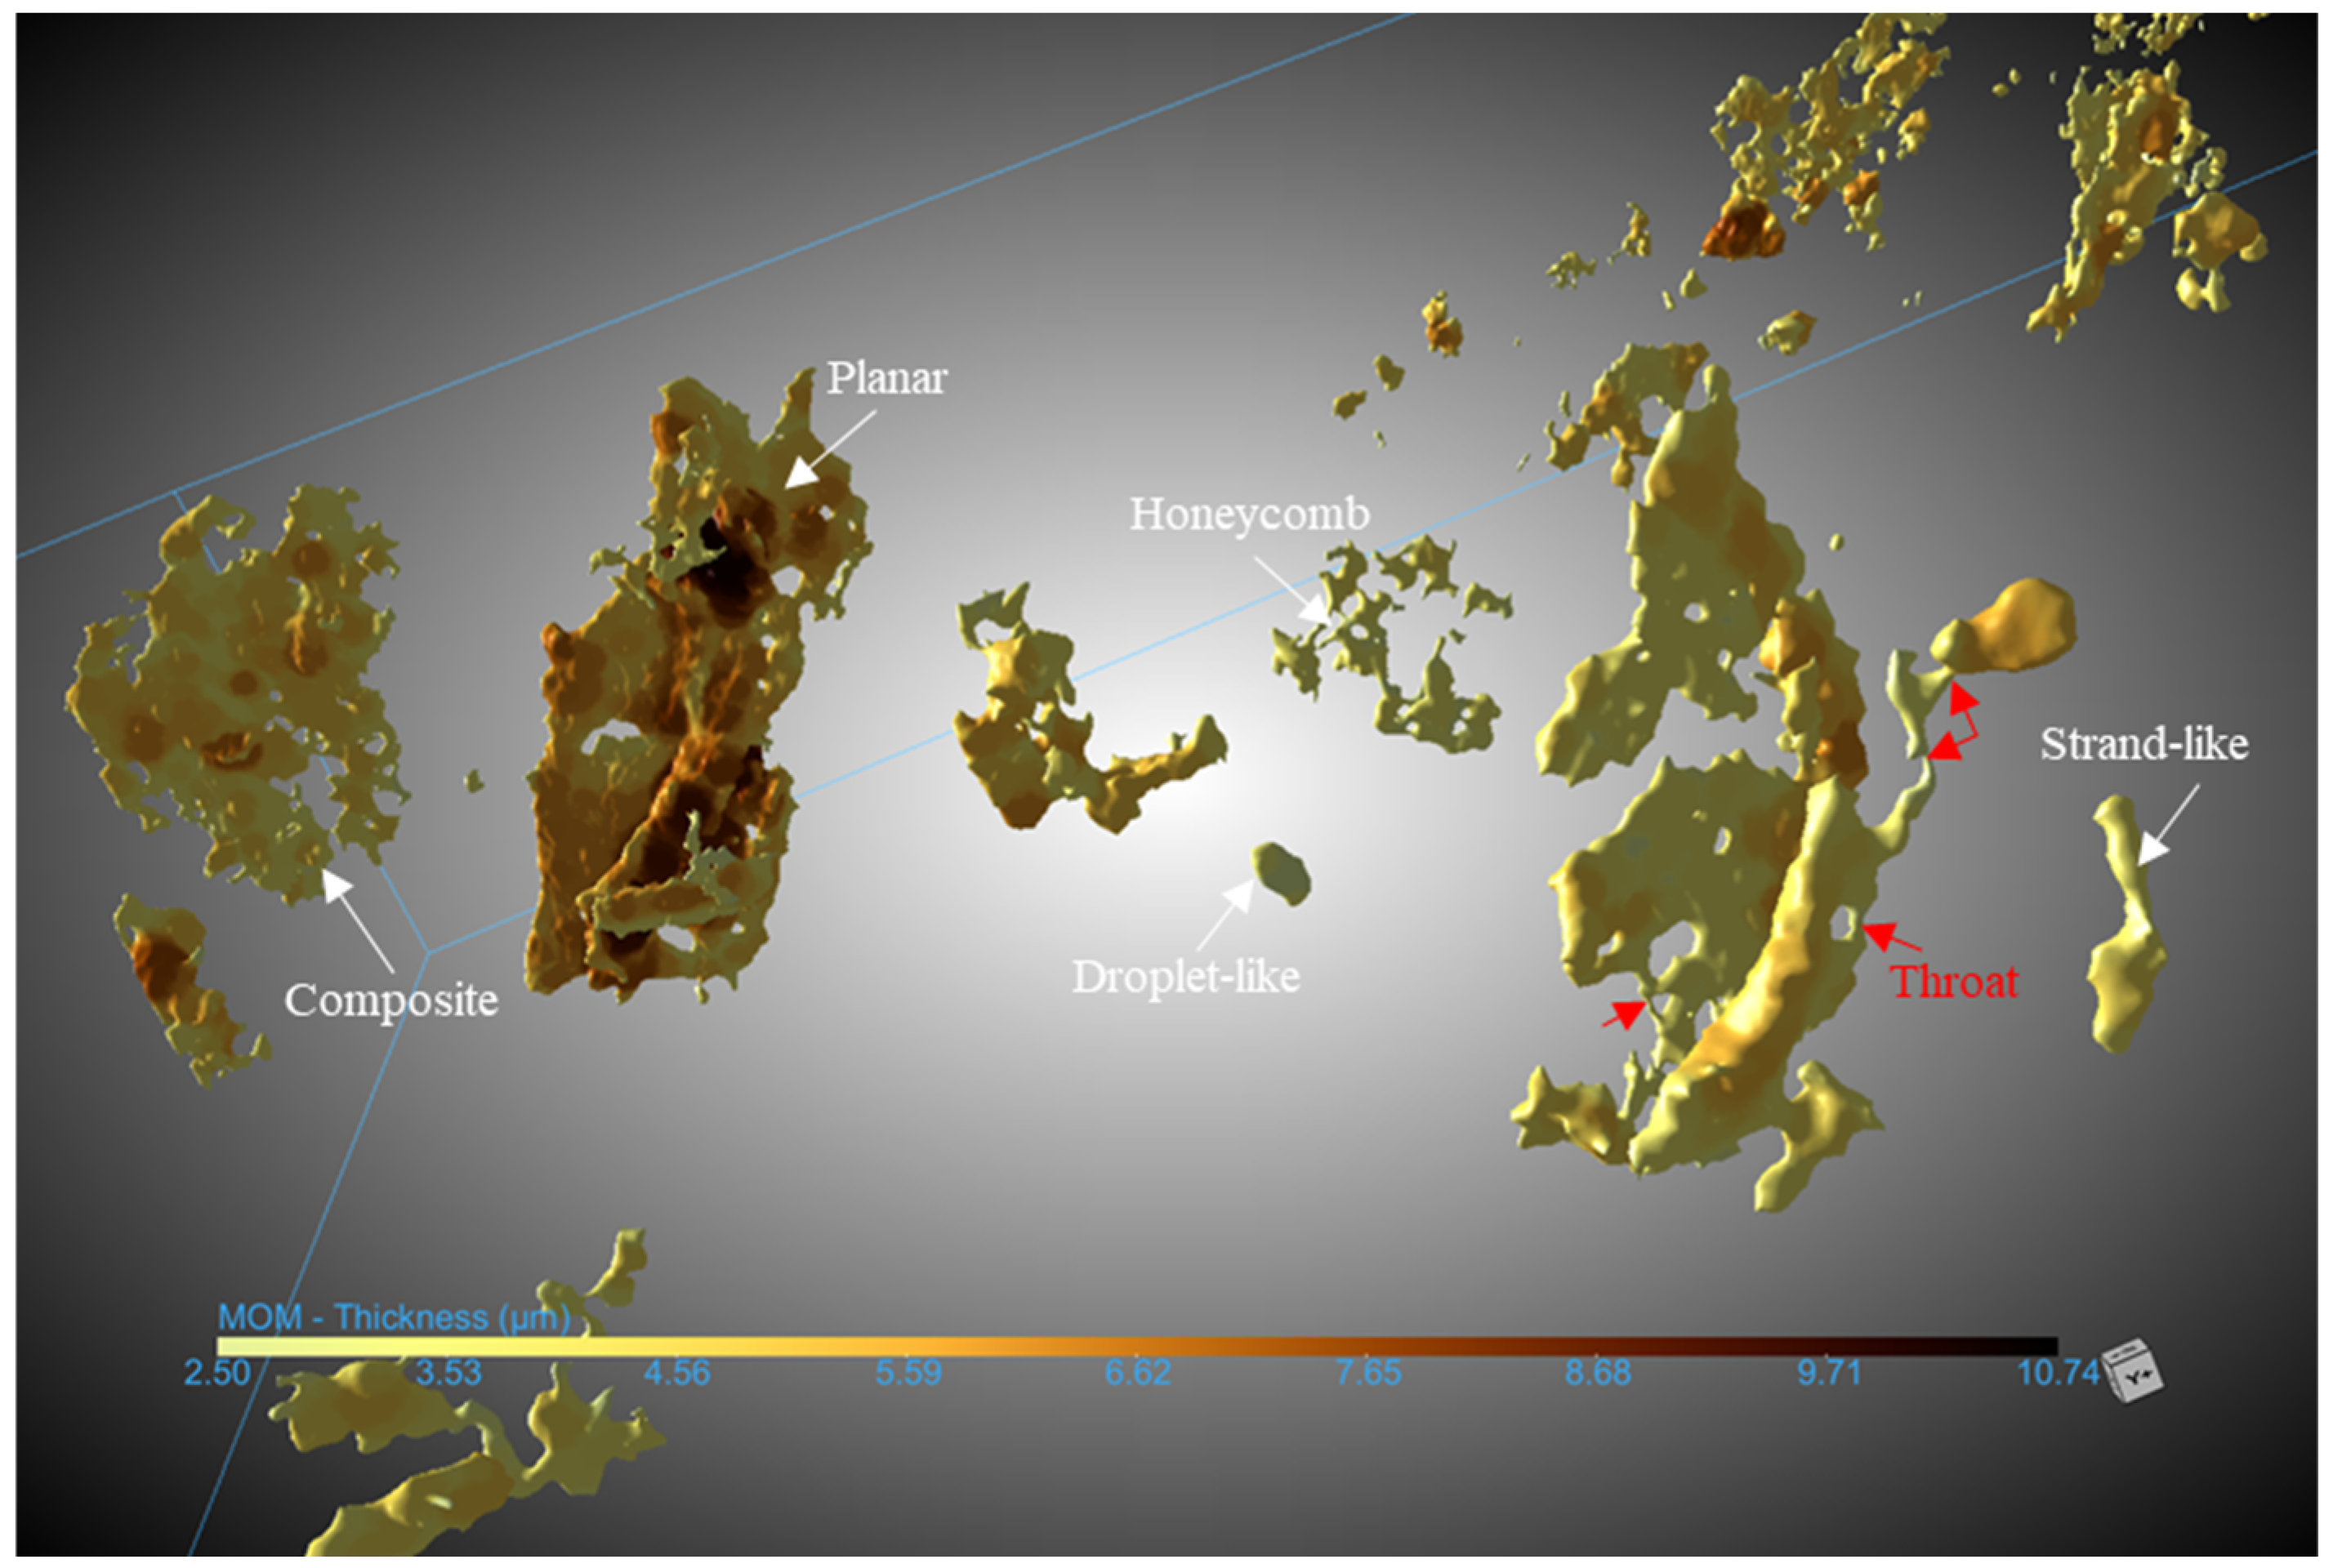
This study represents the first attempt to characterize MOM in three-dimensional space, classifying it into four types based on its three-dimensional morphological features (Figure 10): (1) planar MOM, typically indicating formerly open microfractures, with long extension distances and large areal distribution; (2) honeycomb MOM, typically indicating intergranular pore networks resulting from rigid grain support, with relatively complex three-dimensional structures; (3) composite types of the above two, typically with planar MOM as the core of the composite and honeycomb MOM at its edges, exhibiting good spatial connectivity and large coverage, indicating complex pore–fracture systems formed by microfractures connecting nearby pore networks in the shale matrix during hydrocarbon generation and expulsion; and (4) simple droplet-like and strand-like MOM, typically indicating intragranular dissolution pores, large intergranular pores, or poorly connected microfractures, which are the smallest in scale and mostly discretely distributed in the shale matrix.
Analysis of the three-dimensional assemblage characteristics of complex composite MOM reveals that different types of MOM are frequently interconnected by thin, throat-like organic matter. As shown by the red arrows in Figure 10, this throat-like organic matter effectively connects the droplet-like MOM and the planar-honeycomb MOM. The existence of these throats significantly enhances the connectivity between different types of MOM and also serves as a critical hub in the MOM network identifiable at the micro-CT scale.

4.2. Comparative Analysis of Multi-Component Quantitative Characterization Results

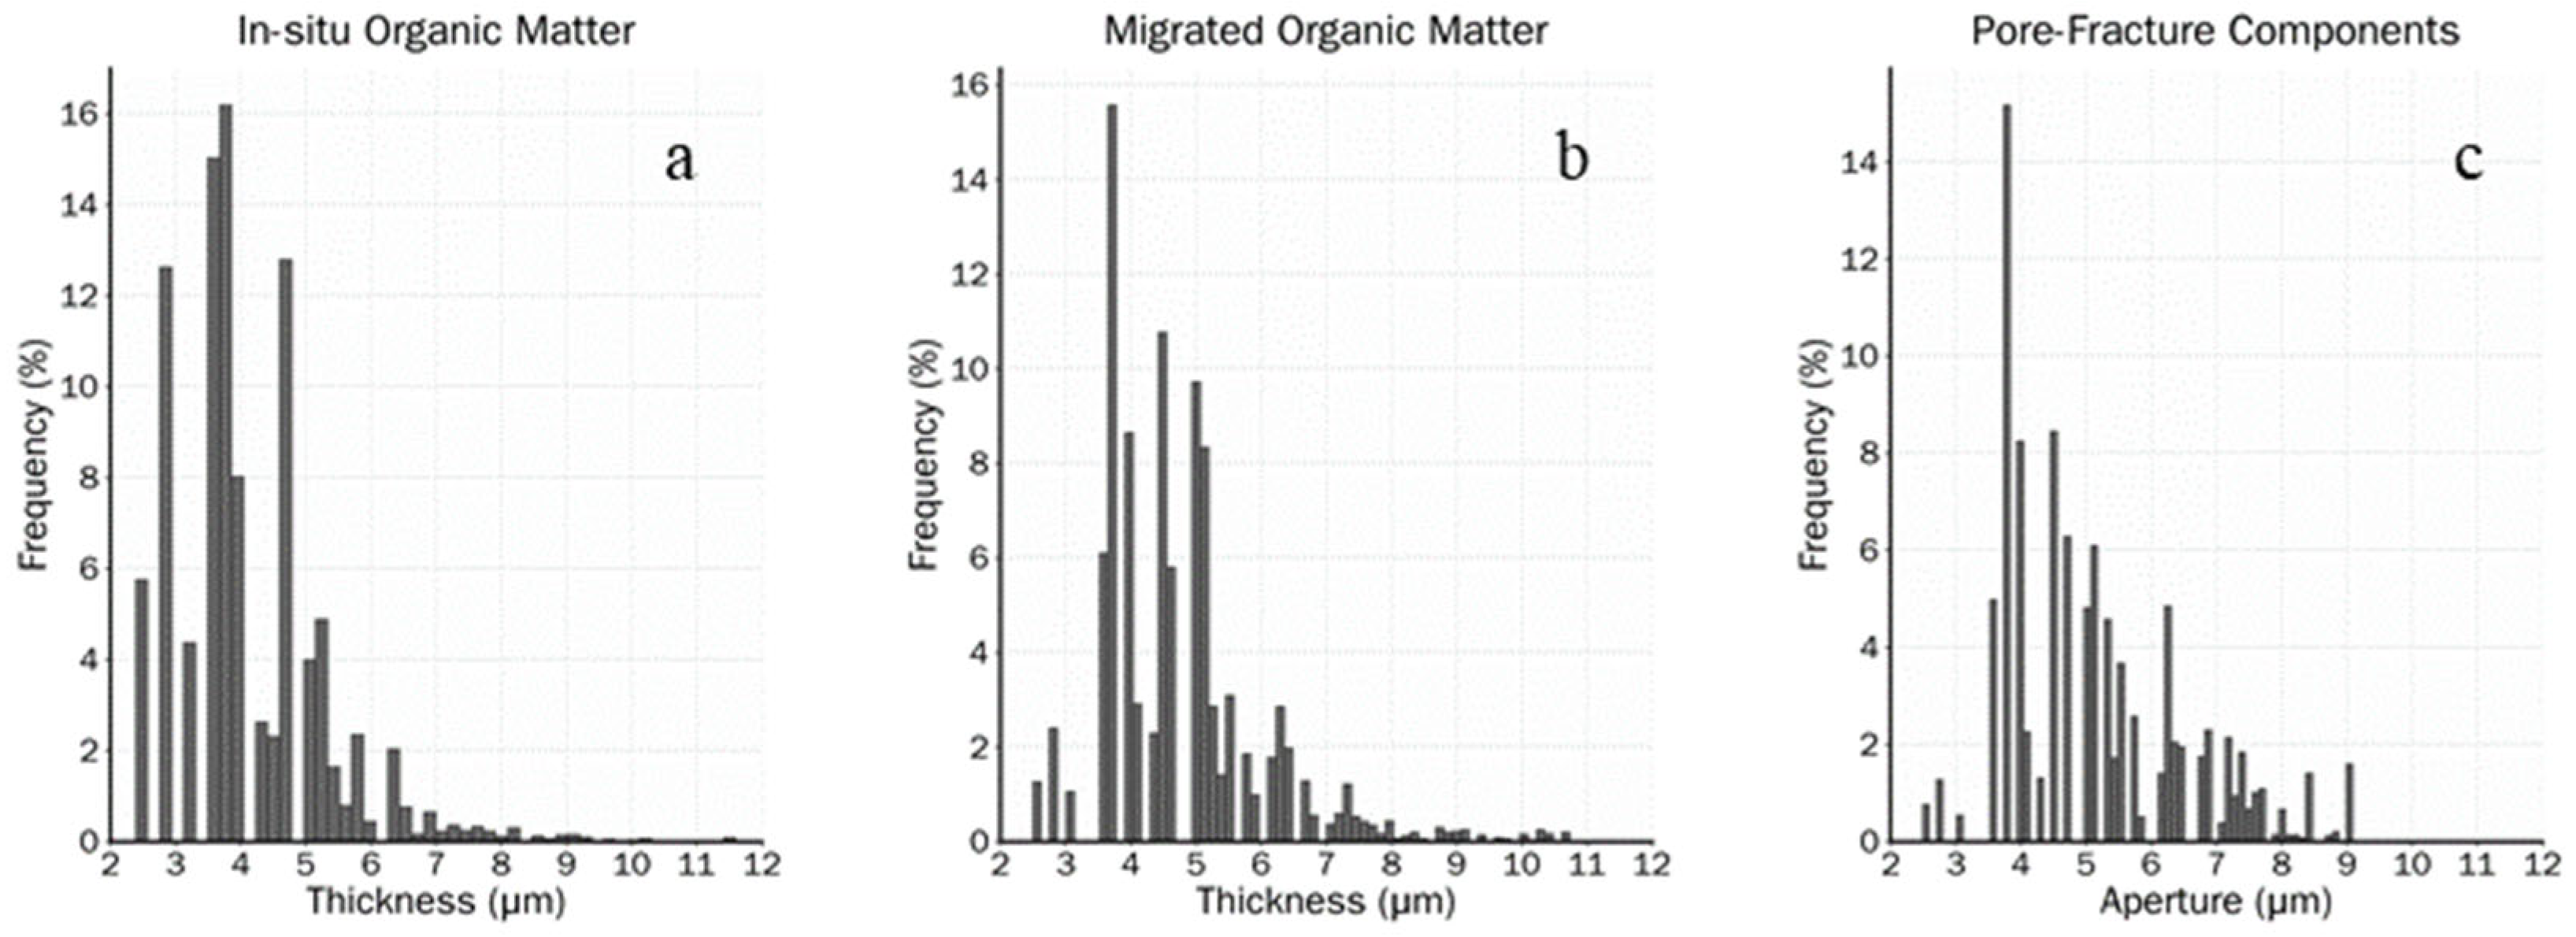
This study employs the maximum inscribed circle method, defining organic matter particle thickness as the maximum inscribed circle diameter and pore–fracture aperture as the maximum inscribed circle diameter, to quantitatively characterize the microstructural parameters of each component. To ensure the accuracy of characterization results, image data with fewer than 4 voxels were eliminated as noise, yielding a minimum identifiable target object thickness/aperture of 2.6 μm. As shown in Figure 11, the thickness/aperture parameter distribution characteristics and ranges of the three components are generally similar overall, with the probability distribution patterns of MOM and pore–fracture components being more closely matched. The thickness distribution of IOM is relatively concentrated, with the main peak at 3.77 μm. Significantly different from the other two, IOM exhibits a higher frequency distribution in the low-value region (2.6~3.5 μm) to the left of the main peak. The thickness distribution of MOM and the aperture distribution of pore–fracture components show highly similar morphologies. Both exhibit right-skewed distributions with prominent peaks and trailing right tails, with peak positions at 3.72 μm and 3.79 μm, respectively. Both maintain obvious frequency proportions in the medium-to-high value range of 6~9 μm, forming significant trailing effects.
Quantitative comparison further corroborates this understanding. The mean (4.80 μm) and median (4.49 μm) of MOM are both intermediate between IOM and pore–fracture components, and closer to the pore–fracture components (mean 5.15 μm, median 5.02 μm), reflecting the “inherited” filling characteristics of MOM in pore–fracture spaces. IOM, due to its concentrated distribution, has a closer mean (4.13 μm) and median (3.77 μm) values, with D90 of only 5.43 μm, far below MOM (6.43 μm) and pore–fracture components (7.29 μm), indicating limited development of its large-thickness end members.
This similarity of thickness/aperture distribution reveals the genetic association between MOM and pore–fracture components. The formation of MOM is mainly controlled by the active charging process driven by hydrocarbon generation and expulsion dynamics. Its peak at 3.72 μm corresponds to the well-developed pore–throat connectivity structures in shale (as indicated by the red arrows and corresponding color scale in Figure 10), suggesting that hydrocarbon charging occurred primarily along well-connected throat networks rather than through arbitrary pore spaces. Constrained by the pore–throat network, MOM rarely exhibits high-frequency distributions in the fine pore size range; its thickness distribution inherits the structural attributes of the pore–throat system, resulting in patterns highly consistent with those of pore–fracture components. The latter, owing to their complex genesis and strong heterogeneity, naturally extend toward larger pore sizes. In contrast, IOM represents primary organic matter formed during deposition, with its thickness governed by depositional environments and early diagenetic compaction. This allows IOM to develop extensively in fine pore size regions, independent of the later pore–throat connectivity system, thus distinctly differentiating it from the other two types.
This structural similarity, however, highlights the necessity of calibrating micro-CT interpretations with higher-resolution SEM images. In micro-CT data, the grayscale contrast between MOM and pore–fracture components is insufficient for reliable identification, as MOM inherits the morphology and structure of the pore–fracture space it fills. This makes MOM particularly prone to misclassification as unfilled residual pores when using only microstructural and grayscale features, underscoring the value of SEM information for accurate component differentiation.

4.3. Implications for Shale Oil and Gas Research

The 3D identification and characterization of IOM and MOM hold significant importance for shale reservoir evaluation and intra-source migration and accumulation mechanism research.
As a residual marker product of paleo-liquid hydrocarbons after thermal evolution, MOM not only indicates shale oil micro-migration pathways but also allows inference of charging conditions and accumulation environments based on its morphological features. For example, when shale develops a composite MOM network dominated by planar types, it can be inferred that at this scale, liquid hydrocarbons were primarily transported through microfractures into the pore networks in the matrix. Furthermore, quantitative statistical analysis of MOM content and structural parameters can help extract deeper-level multi-dimensional geological information. For instance, comparative analysis of relative contents of MOM and IOM can assist in determining organic matter evolution stages; analysis of MOM thickness distribution characteristics, particularly thickness variations in “throat” locations that serve connectivity functions, can reveal the configuration relationships between fluid pressure and capillary resistance during liquid hydrocarbon charging. Temperature and pressure are the fundamental drives of organic matter thermal evolution and hydrocarbon migration. MOM is essentially the solid residue of paleo-liquid hydrocarbons that were generated, expelled, and re-precipitated under specific thermal maturity and overpressure conditions. Therefore, MOM abundance, distribution range, and 3D morphology directly encode ancient temperature–pressure information. By applying this workflow to samples of varying maturity, statistical relationships between thermal history and IOM/MOM 3D parameters can be established, indirectly revealing temperature controls on migration.
The relationship between MOM and currently open pore–fracture spaces is also a key focus in current shale oil and gas research. On one hand, MOM formed by secondary cracking of liquid hydrocarbons is also known as post-oil bitumen, which generally transforms into pyrobitumen during the dry gas generation stage, with numerous gas pores developed internally. These pores are connected at the nanoscale and serve as main migration channels for shale gas, also providing new storage spaces for shale gas occurrence [7,8]. Accurate estimation of pore volumes within IOM and MOM is limited by the resolution gap. A multi-scale joint strategy is needed. SEM identifies nanoscale organic pores in 2D, while FIB-SEM serial sectioning on the registered ROI can reconstruct 3D nanopore networks. The micro-CT–SEM registration framework established here can be extended to embed FIB-SEM nanopore data into the micron-scale matrix, enabling multi-scale digital core reconstruction. On the other hand, higher degrees of MOM filling in pore–fracture systems are less conducive to the preservation of large pores in the matrix. As shown in Figure 9b,c, the MOM volume in this sample is more than seven times the volume of currently open pore–fracture space, and the spatial distribution range and extension distance of MOM are significantly greater than those of residual pore fractures, which are distributed in point and line patterns and exhibit scattered distribution. This indicates that early-generated liquid hydrocarbons predominantly occupied well-connected, larger-aperture pore–fracture spaces, leaving only a small amount of discrete, poorly connected micron-scale matrix pore–fracture spaces. Thus, the spatial distribution characteristics of MOM have important implications for current fluid occurrence and physical properties, serving as an important entry point for evaluating shale oil and gas reservoirs and understanding the formation mechanisms of high-quality reservoirs.
Future research on organic matter type identification and characterization should further focus on their multi-scale features, fully leveraging multi-resolution digital core technology, and reconstructing shale oil and gas micro-migration processes from dynamic perspectives such as MOM episodes [14,15,21,26]. The 3D MOM morphologies and their spatial configuration with residual pore fractures obtained in this study can be converted into digital core models to serve as geometric boundary conditions for lattice Boltzmann method (LBM) simulations. This enables modeling of paleo-liquid hydrocarbon filling processes and present-day hydrocarbon flow in residual pore spaces. At this micron scale, micro-CT resolution is sufficient. For simulating transport inside nanopores within IOM or MOM, FIB-SEM or stochastic reconstruction is required to generate nanoscale digital cores, and multiphase LBM or coupled molecular dynamics/continuum methods are needed to capture Knudsen diffusion, surface adsorption/desorption, and multiphase flow effects. This will provide reliable geological evidence for elucidating shale reservoir fluid occurrence and distribution mechanisms and accumulation processes.

5. Conclusions

This study establishes a three-dimensional identification workflow for in situ and migrated organic matter in shale based on the joint calibration of micro-CT and high-resolution SEM. The main conclusions are as follows:
(1)
The proposed method utilizes SEM to identify and calibrate the characteristics of in situ organic matter, migrated organic matter, and pore–fracture components, which are then mapped into the 3D micro-CT volume through voxel-based connectivity analysis. This effectively overcomes the bottleneck of single-technique micro-CT in distinguishing organic matter subtypes.
(2)
In this sample, in situ organic matter occupies the highest volume fraction (6.96%), followed by migrated organic matter (0.94%), while the pore–fracture component is the lowest (0.13%), consistent with the medium-to-low maturity characteristics of the Yanchang Formation.
(3)
Migrated organic matter is characterized in three-dimensional space for the first time and classified into four morphological types: planar, honeycomb, composite, and discrete. Different types are interconnected by throat-like organic matter bridges at the ~3.7 μm scale, which appear to link otherwise discrete MOM bodies and may play an important role in maintaining the connectivity of the MOM network at the micro-CT scale.
(4)
Migrated organic matter and pore–fracture components show similar thickness distributions with peaks at ~3.7 μm, which is consistent with, though not by itself proof of, a genetic association with the pore–throat system, as independently supported by their occurrence characteristics observed under SEM. In contrast, IOM is governed by depositional environment and diagenetic compaction, allowing its preferential development in the finer fraction (<3.5 μm).
(5)
The volume of migrated organic matter is far higher than that of currently open pore–fracture space. One plausible interpretation is that early-generated liquid hydrocarbons preferentially occupied well-connected, larger-aperture pore–fracture spaces, although alternative explanations cannot be excluded on the basis of the present-day distribution alone; this relationship may exert important constraints on current fluid storage and permeability. This method provides methodological support for reconstructing shale oil micro-migration pathways and enrichment mechanisms.

6. Patents

The method described in this paper has been granted a Chinese invention patent (Patent No. ZL 2023 1 0293901.3), titled “An Image Registration Method Based on Shale Component Calibration,” with inventors Yuxi Yu, Ming Cheng et al. The patent was authorized on 28 November 2023.

Author Contributions

Conceptualization, Y.Y. and M.C.; methodology, Y.Y. and M.C.; software, Y.Y.; validation, Y.Y. and M.C.; formal analysis, Y.Y.; investigation, Y.Y.; resources, C.G.; data curation, Y.Y.; writing—original draft preparation, Y.Y.; writing—review and editing, M.C. and J.Y.; visualization, Y.Y.; supervision, C.G. and J.Y.; project administration, C.G.; funding acquisition, Y.Y. and M.C. All authors have read and agreed to the published version of the manuscript.

Funding

This study was supported partly by the Opening Foundation of Shaanxi Key Laboratory of Lacustrine Shale Gas Accumulation and Exploitation (No. YJSYZX25SKF0014), the Chinese National Natural Science Foundation (Grant No. 41902136 and No.41802178), the Scientific Research Startup Fund of Northeast Petroleum University (No. 13051202306) and the China Geological Survey (Grant No. DD20190085).

Institutional Review Board Statement

Not applicable.

Informed Consent Statement

Not applicable.

Data Availability Statement

The data used to support the findings of this study are available from the corresponding author upon request.

Conflicts of Interest

The authors declare no conflicts of interest.

Abbreviations

The following abbreviations are used in this manuscript:
IOMIn Situ Organic Matter
MOMMigrated Organic Matter
CTComputed Tomography
SEMScanning Electron Microscopy
OMOrganic Matter

References

  1. Jarvie, D.M.; Hill, R.J.; Ruble, T.E.; Pollastro, R.M. Unconventional shale-gas systems: The Mississippian Barnett Shale of north-central Texas as one model for thermogenic shale-gas assessment. AAPG Bull. 2007, 91, 475–499. [Google Scholar] [CrossRef]
  2. Hackley, P.C.; Cardott, B.J. Application of organic petrography in North American shale petroleum systems: A review. Int. J. Coal Geol. 2016, 163, 8–51. [Google Scholar] [CrossRef]
  3. Sanei, H. Organic petrology of shale: A review of applications in petroleum geoscience. Int. J. Coal Geol. 2020, 223, 103484. [Google Scholar]
  4. Loucks, R.G.; Reed, R.M.; Ruppel, S.C.; Hammes, U. Spectrum of pore types and networks in mudrocks and a descriptive classification for matrix-related mudrock pores. AAPG Bull. 2012, 96, 1071–1098. [Google Scholar] [CrossRef]
  5. Slatt, R.M.; O’Brien, N.R. Pore types in the Barnett and Woodford gas shales: Contribution to understanding gas storage and migration pathways in fine-grained rocks. AAPG Bull. 2011, 95, 2017–2030. [Google Scholar] [CrossRef]
  6. Pommer, M.; Milliken, K. Pore types and pore-size distributions across thermal maturity, Eagle Ford Formation, southern Texas. AAPG Bull. 2015, 99, 1713–1744. [Google Scholar] [CrossRef]
  7. Curtis, M.E.; Cardott, B.J.; Sondergeld, C.H.; Rai, C.S. Development of organic porosity in the Woodford Shale with increasing thermal maturity. Int. J. Coal Geol. 2012, 103, 26–31. [Google Scholar] [CrossRef]
  8. Bernard, S.; Wirth, R.; Schreiber, A.; Schulz, H.M. Formation of nanoporous pyrobitumen residues during maturation of the Barnett Shale (Fort Worth Basin). Int. J. Coal Geol. 2012, 103, 3–11. [Google Scholar] [CrossRef]
  9. Cardott, B.J.; Landis, C.R.; Curtis, M.E. Post-oil solid bitumen network in the Woodford Shale, USA—A potential primary migration pathway. Int. J. Coal Geol. 2015, 139, 106–113. [Google Scholar] [CrossRef]
  10. Loucks, R.G.; Reed, R.M. Scanning-electron-microscope petrographic evidence for distinguishing organic-matter pores associated with depositional organic matter versus migrated organic matter in mudrocks. GCAGS J. 2014, 3, 51–60. [Google Scholar]
  11. Sanei, H. Genesis of solid bitumen. Sci. Rep. 2020, 10, 15595. [Google Scholar] [CrossRef] [PubMed]
  12. Mastalerz, M.; Drobniak, A.; Stankiewicz, A.B. Origin, properties, and implications of solid bitumen in source-rock reservoirs: A review. Int. J. Coal Geol. 2018, 195, 14–36. [Google Scholar] [CrossRef]
  13. Liu, B.; Schieber, J.; Mastalerz, M. Petrographic and micro-FTIR study of organic matter in the Upper Devonian New Albany Shale during thermal maturation: Implications for kerogen transformation. In Mudstone Diagenesis: Research Perspectives for Shale Hydrocarbon Reservoirs, Seals, and Source Rocks; American Association of Petroleum Geologists: Tulsa, OK, USA, 2019; Volume 120, pp. 1–17. [Google Scholar]
  14. Ma, L.; Fauchille, A.L.; Dowey, P.J.; Courtois, L.; Taylor, K.G.; Lee, P.D. Correlative multi-scale imaging of shales: A review and future perspectives. Geol. Soc. Lond. Spec. Publ. 2017, 454, 175–199. [Google Scholar] [CrossRef]
  15. Ma, L.; Dowey, P.J.; Rutter, E.; Taylor, K.G.; Lee, P.D. A novel upscaling procedure for characterizing heterogeneous shale porosity from nanometer- to millimetre-scale in 3D. Energy 2019, 181, 1285–1297. [Google Scholar] [CrossRef]
  16. Cnudde, V.; Boone, M.N. High-resolution X-ray computed tomography in geosciences: A review of the current technology and applications. Earth-Sci. Rev. 2013, 123, 1–17. [Google Scholar] [CrossRef]
  17. Arif, M.; Mahmoud, M.; Zhang, Y.; Iglauer, S.; Lebedev, M. X-ray tomography imaging of shale microstructures: A review in the context of multiscale correlative imaging. Int. J. Coal Geol. 2021, 233, 103641. [Google Scholar] [CrossRef]
  18. Chandra, D.; Vishal, V. A critical review on pore to continuum scale imaging techniques for enhanced shale gas recovery. Earth-Sci. Rev. 2021, 217, 103556. [Google Scholar] [CrossRef]
  19. Iassonov, P.; Gebrenegus, T.; Tuller, M. Segmentation of X-ray computed tomography images of porous materials: A crucial step for characterization and quantitative analysis of pore structures. Water Resour. Res. 2009, 45, W09415. [Google Scholar] [CrossRef]
  20. Ketcham, R.A.; Carlson, W.D. Acquisition, optimization and interpretation of X-ray computed tomographic imagery: Applications to the geosciences. Comput. Geosci. 2001, 27, 381–400. [Google Scholar] [CrossRef]
  21. Gou, Q.; Xu, S.; Hao, F.; Yang, F.; Zhang, B.; Shu, Z.; Chen, Y. Full-scale pores and micro-fractures characterization using FE-SEM, gas adsorption, nano-CT and micro-CT: A case study of the Silurian Longmaxi Formation shale in the Fuling area, Sichuan Basin, China. Fuel 2019, 253, 167–179. [Google Scholar] [CrossRef]
  22. Yu, Y.; Luo, X.; Cheng, M.; Lei, Y.; Wang, X.; Zhang, L.; Jiang, C.; Zhang, L. Study on the distribution of extractable organic matter in pores of lacustrine shale: An example of Zhangjiatan Shale from the Upper Triassic Yanchang Formation, Ordos Basin, China. Interpretation 2017, 5, SF109–SF126. [Google Scholar] [CrossRef]
  23. Wood, J.M.; Sanei, H.; Haeri-Ardakani, O.; Curtis, M.E.; Akai, T.; Currie, C. Solid bitumen in the Montney Formation: Diagnostic petrographic characteristics and significance for hydrocarbon migration. Int. J. Coal Geol. 2018, 198, 48–62. [Google Scholar] [CrossRef]
  24. Zhang, Y.; Li, X.; Zhang, S.; Wang, Y.; Li, Y. Pore structure evolution of lacustrine organic-rich shale from the second member of the Kongdian formation in the Cangdong Sag, Bohai Bay Basin, China. Pet. Sci. 2020, 17, 1501–1514. [Google Scholar]
  25. Feng, Z.; Li, X.; Zhang, S.; Wang, Y.; Li, Y. Characteristics of micro- and nano-pores in shale oil reservoirs. Pet. Sci. 2020, 17, 1191–1204. [Google Scholar]
  26. Goral, J.; Andrew, M.; Olson, T.; Deo, M. Correlative core- to pore-scale imaging of shales. Mar. Pet. Geol. 2020, 111, 886–904. [Google Scholar] [CrossRef]
Figure 1. Sample preparation and multi-resolution CT data volume configuration for SEM imaging area localization. (a) Cubic sample with reserved polished surface. (b) Spatial relationship between high- and low-resolution CT data volumes with thickness constraints for ion milling. (c) Parameter definition for SEM imaging field localization.
Applsci 16 07749 g001
Figure 2. Schematic of high-resolution micro-CT slice orientations (red: parallel to the thinning direction, and green: SEM observation plane in the CT volume).
Applsci 16 07749 g002
Figure 3. Selection of the CT slice best matching the SEM image based on marker area error.
Applsci 16 07749 g003
Figure 4. Registered SEM image (cropped) and CT slice image.
Applsci 16 07749 g004
Figure 5. High-resolution SEM segmentation results and downsampling-based calibration of components in registered CT images. (a) Segmentation result on SEM image. (b) Segmentation overlaid on registered CT slice. (c) Downsampled segmentation calibrating CT slice components.
Applsci 16 07749 g005
Figure 6. Characterization results of specific components (enclosed in a box) in SEM 2D image (a), CT slice (b), and 3D data volume (c), revealing that MOM components that appear disconnected in 2D are actually connected in 3D.
Applsci 16 07749 g006
Figure 7. SEM images showing characteristics of different organic matter types. (a) Migrated organic matter. (b) In situ organic matter.
Applsci 16 07749 g007
Figure 8. Identified organic matter and pore–fracture components in high-resolution SEM images.
Applsci 16 07749 g008
Figure 9. 3D characterization of in situ organic matter (a), migrated organic matter (b), pore–fracture network (c), and their composite system (d). The yellow arrow indicates the bedding direction, and the dashed box marks the spatial location of the SEM-registered image.
Applsci 16 07749 g009
Figure 10. Typical types and connectivity characteristics of migrated organic matter in three-dimensional space.
Applsci 16 07749 g010
Figure 11. Probability distribution of thickness/aperture parameters for in situ organic matter (a), migrated organic matter (b), and pore–fracture components (c).
Applsci 16 07749 g011
Table 1. Statistics of marker area and registration error between candidate slices and corresponding SEM images.
ImageMarker 1Marker 2Marker 3Mean
Error
Area
(mm2)
Relative
Error
Area
(mm2)
Relative
Error
Area
(mm2)
Relative
Error
SEM1.80 × 10−4-2.03 × 10⁻⁵-8.41 × 10⁻⁵--
Slice 11.61 × 10−411%3.50 × 10−683%5.80 × 10−531%41%
Slice 21.60 × 10−411%8.90 × 10−656%6.20 × 10−526%31%
Slice 31.50 × 10−417%1.70 × 10−516%6.30 × 10−525%19%
Slice 41.50 × 10−417%2.70 × 10−533%6.40 × 10−524%25%
Slice 51.50 × 10−417%3.00 × 10−548%6.70 × 10−520%28%
Slice 61.50 × 10−416%2.60 × 10−528%6.40 × 10−524%23%
Table 2. Diagnostic criteria for distinguishing in situ organic matter (IOM) from migrated organic matter (MOM) in SEM images, compiled from [4,6,10,23].
CriterionIn Situ Organic Matter (IOM)Migrated Organic Matter (MOM)
Occurrence modeDispersed and intercalated along bedding, integrated with the depositional fabricFills pores or fractures; geometry conforms to the host pore–fracture space
Contact with mineralsEnclosed and compacted by detrital minerals; syndepositional contactsIn contact with authigenic (secondary) minerals, e.g., authigenic quartz
Internal textureCompaction-related fabric; relatively homogeneousFlow-induced textures; dispersed detrital grains enclosed
Edge morphologySmooth and straight edgesUneven, tortuous edges constrained by authigenic mineral boundaries
Associated pores/fracturesRelatively fewShrinkage fractures or pores at mineral contacts or within the organic matter
Typical morphology and sizeFragmented blocky particles of several μm and banded particles up to ~100 μmPatchy (generally <10 μm) in pores; banded (up to ~100 μm) in fractures
Disclaimer/Publisher’s Note: The statements, opinions and data contained in all publications are solely those of the individual author(s) and contributor(s) and not of MDPI and/or the editor(s). MDPI and/or the editor(s) disclaim responsibility for any injury to people or property resulting from any ideas, methods, instructions or products referred to in the content.