3.4. Clustering Results
In order not to advertise a particular car model, the individual cars and their presence in one or another cluster will be discussed only under their index number from 1 to 37, which does not correspond to their alphabetical order. The following clustering and multidimensional-scaling analyses are exploratory and hypothesis-generating. With three a priori categories and only 37 objects, the choice of k = 3 and k = 8 clusters is partly determined by the categories and dimensions the analysis was designed to test; these results should not be interpreted as confirmatory.
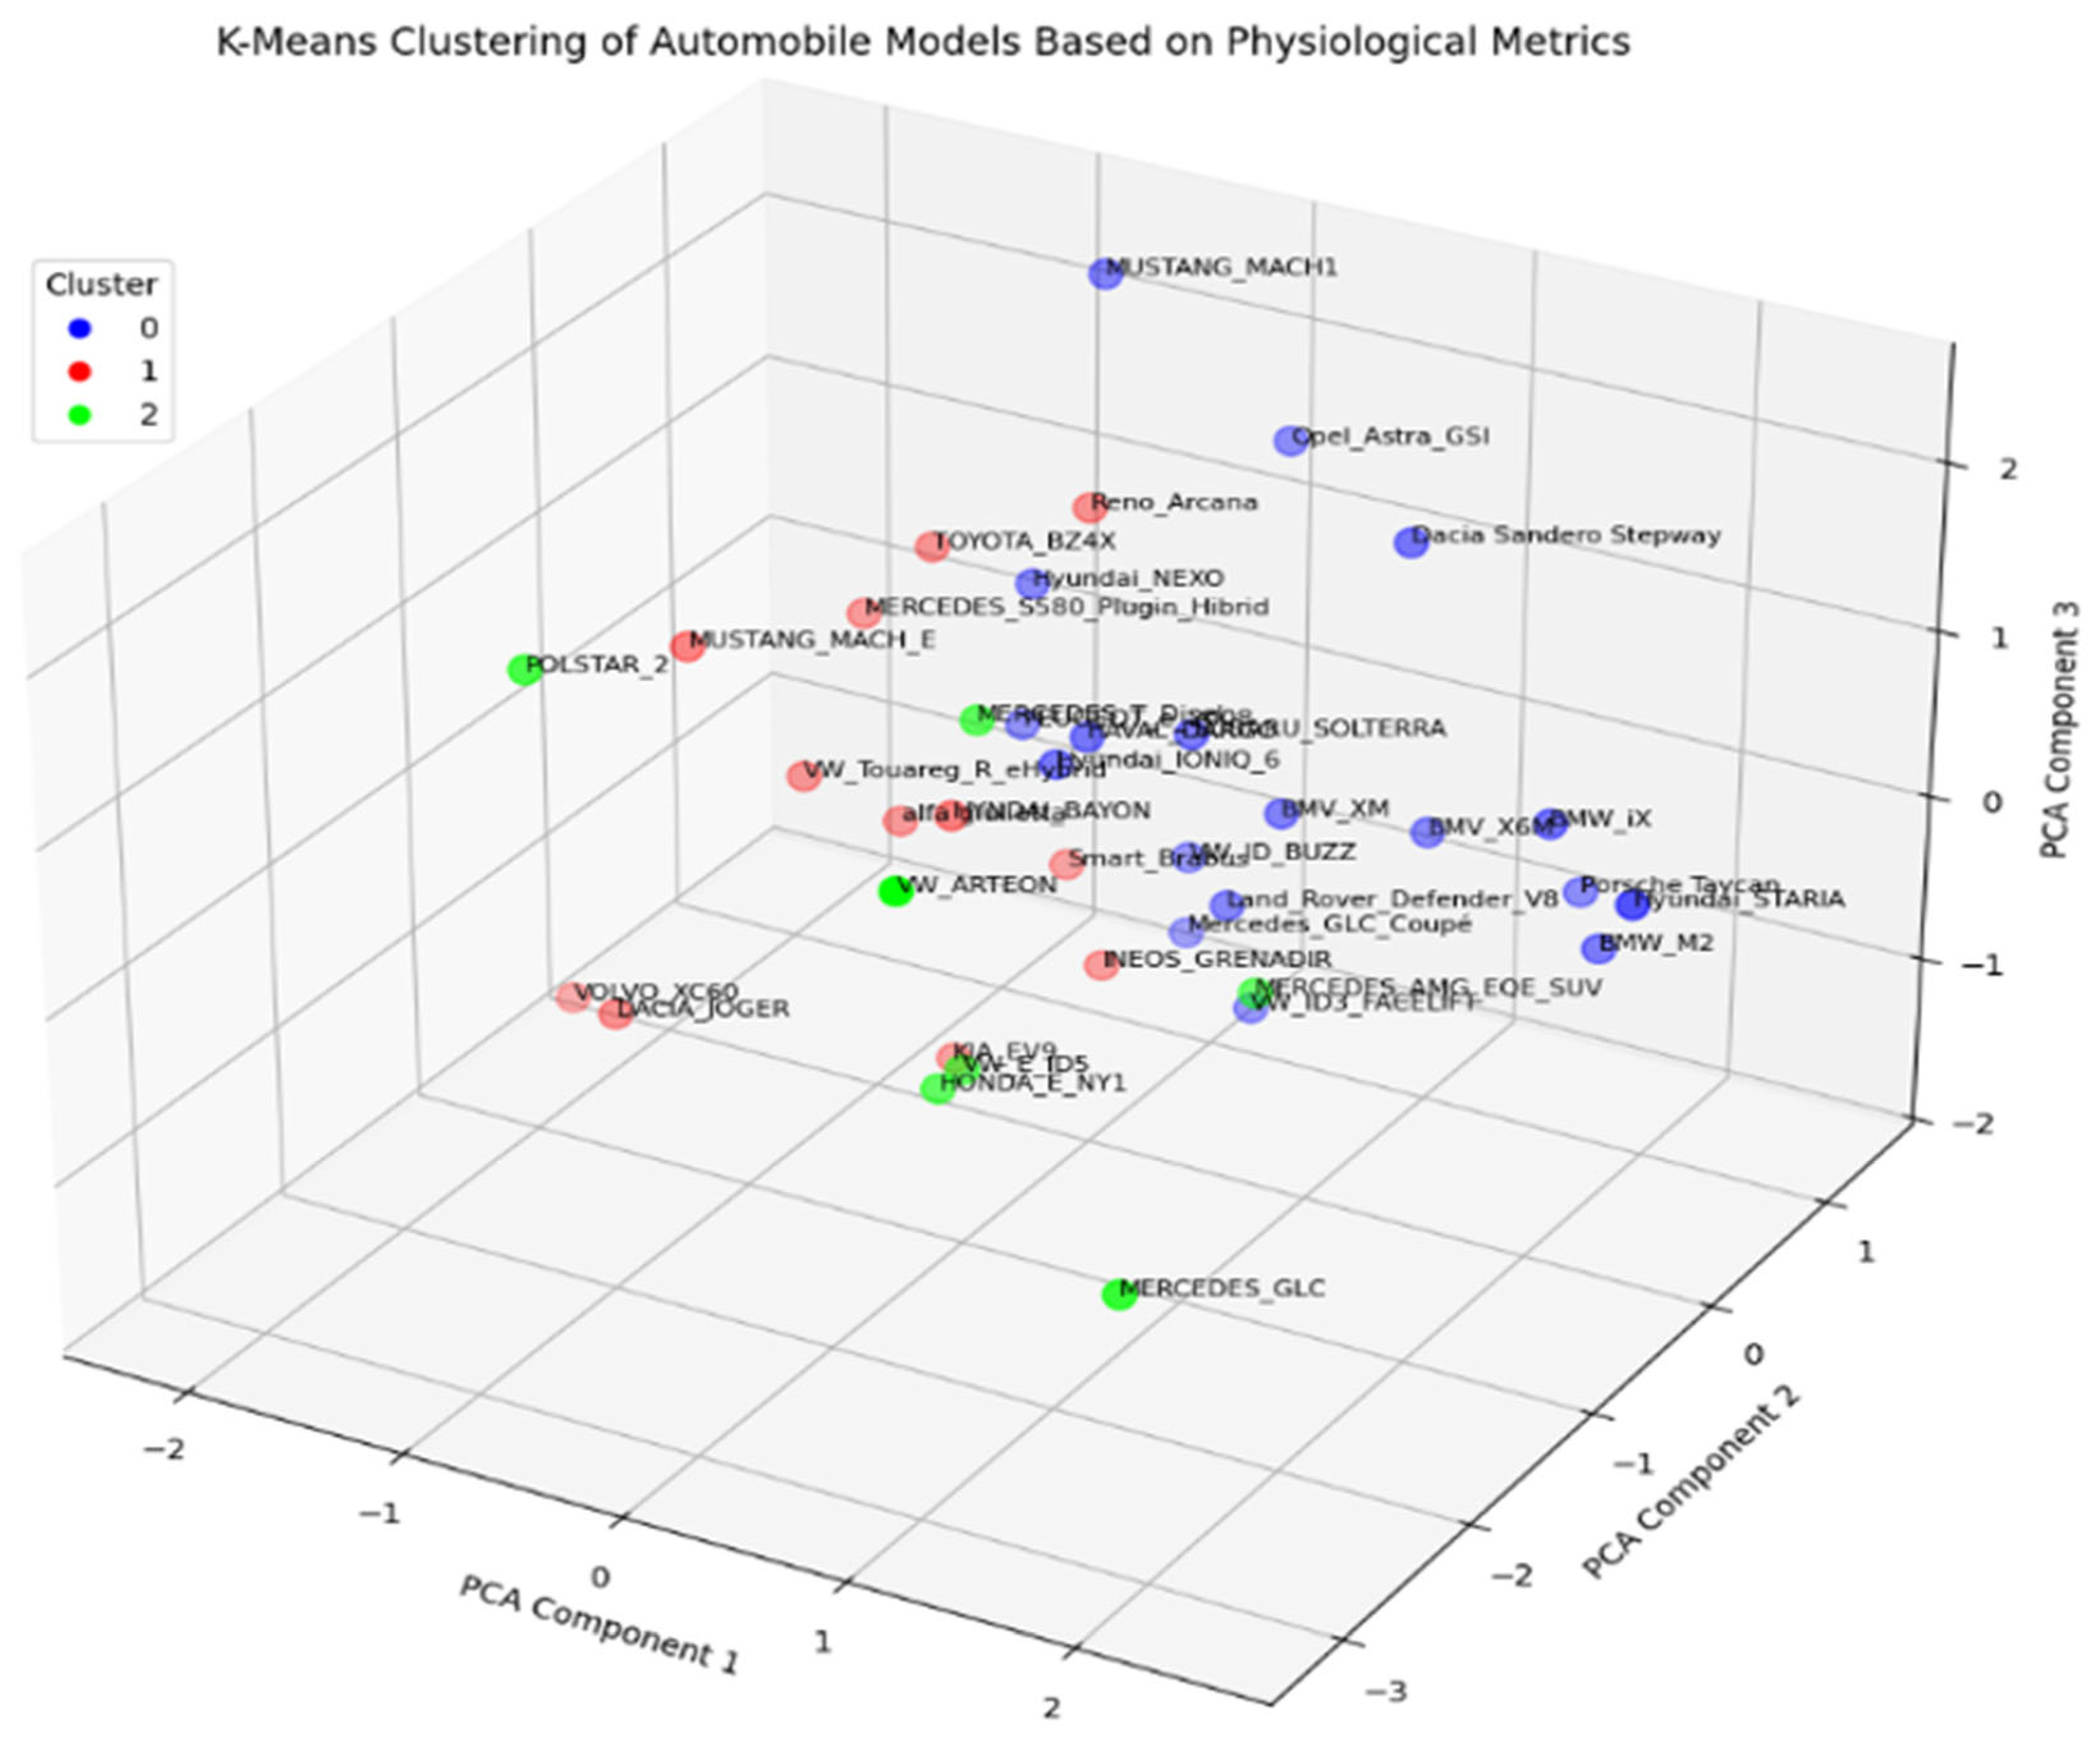
Clustering into 3 clusters:
Engine Type known clusters: EV (3,4,9,10,11,12,14,19,21,22,27,29,30,31,33,37), ICE (1,2,5,6,7,8,13,15,17,20,23,24,25,26,28), Hybrid (16,18,32,34,35,36) [corrected from an earlier version of this list, which had misclassified Hyundai NEXO (idx. 3), Mercedes T-Diesel (idx. 7), Mercedes GLC Coupe (idx. 32), and Renault Arcana (idx. 34), inconsistent with the fleet composition reported in
Section 2.1].
After Agglomerative clustering in the first cluster comprised cars with indexes (3,5,7,8,10,12,13,14,16,21,23,25,26,27,28,33,34,35,36) in the second cluster (1,4,11,15,17,18,19,20,22,24,30,31,32,37) and in third cluster (2,6,9,29).
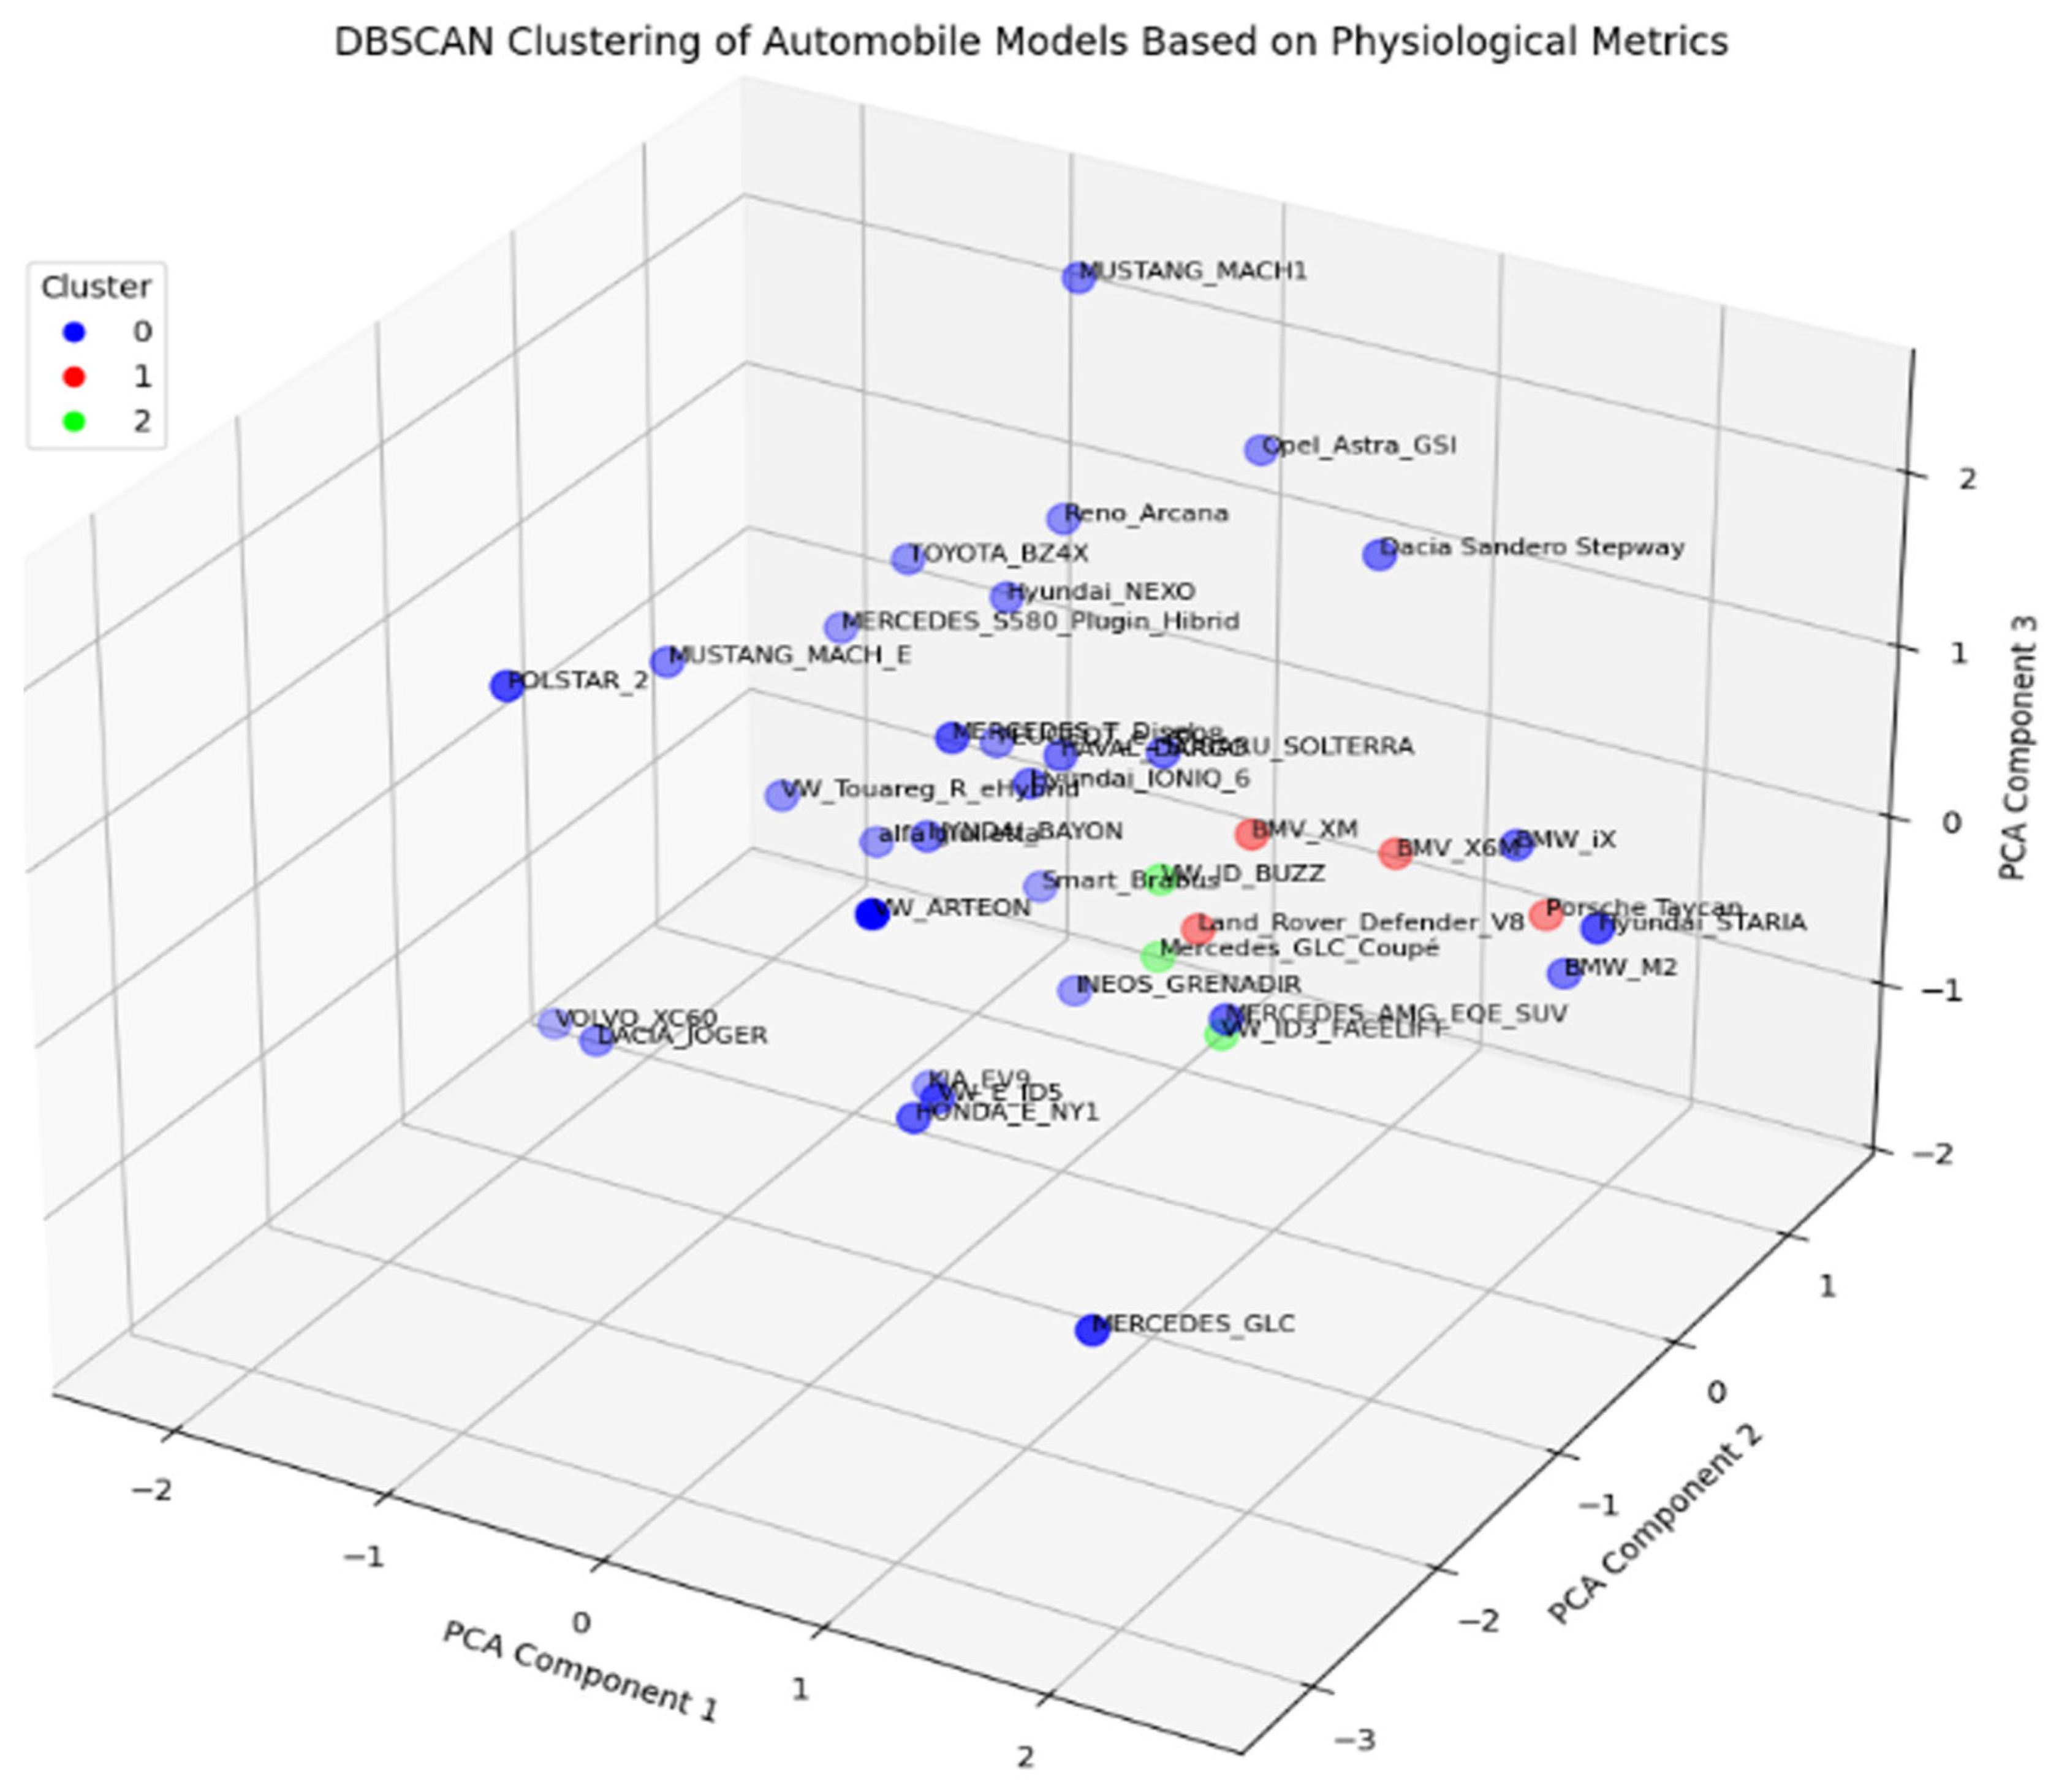
For DBSCAN in the first cluster we found cars with indexes (1,2,3,5,6,7,8,9,10,11,12,13,14,15,16, 20,21,23,25,26,27,28,29,30,31,33,34,35,36,37), for the second (17,18,22,24), and for the third (4,19,32).
For Gaussian clustering–1 cluster (1,3,4,5,10,11,14,15,18,19,20,22,23,24,25,26,28,33,37), second cluster (13,16,27,30,34,35,36) and third cluster (2,6,7,8,9,12,17,21,29,31,32).
For K-Means clustering in the first cluster we have (1,3,4,5,11,14,17,18,19,20,21,22,23,24,26,28,32,33), in the second (8,10,13,15,16,25,27,30,34,35,36,37) and in the third (2,6,7,9,12,29,31).
From just inspecting the clusters: K-Means and Gaussian Mixture seem most similar—both cluster (2,6,7,9,12,29,31) together as a cluster, and both frequently group (1,3,4,5,11,14,15,18,20,22,23, 24,25,26,28,33,37) together. Agglomerative and K-Means overlap somewhat, especially for clusters that include (1,3,5,14,23,26,33). DBSCAN is most different—its first cluster includes almost all points, acting more like a dense core grouping.
We estimated pairwise similarity between clustering results by comparing how many pairs of cars are clustered together in each pair of methods. To do that we calculated the Rand Index by counting how many pairs of elements (i, j) are in the same cluster in both A and B (SS) and in different clusters in both A and B (DD), then we computed:
A similarity score between 0 and 1 indicating how similarly the two algorithms clustered the data is presented in
Table 8.
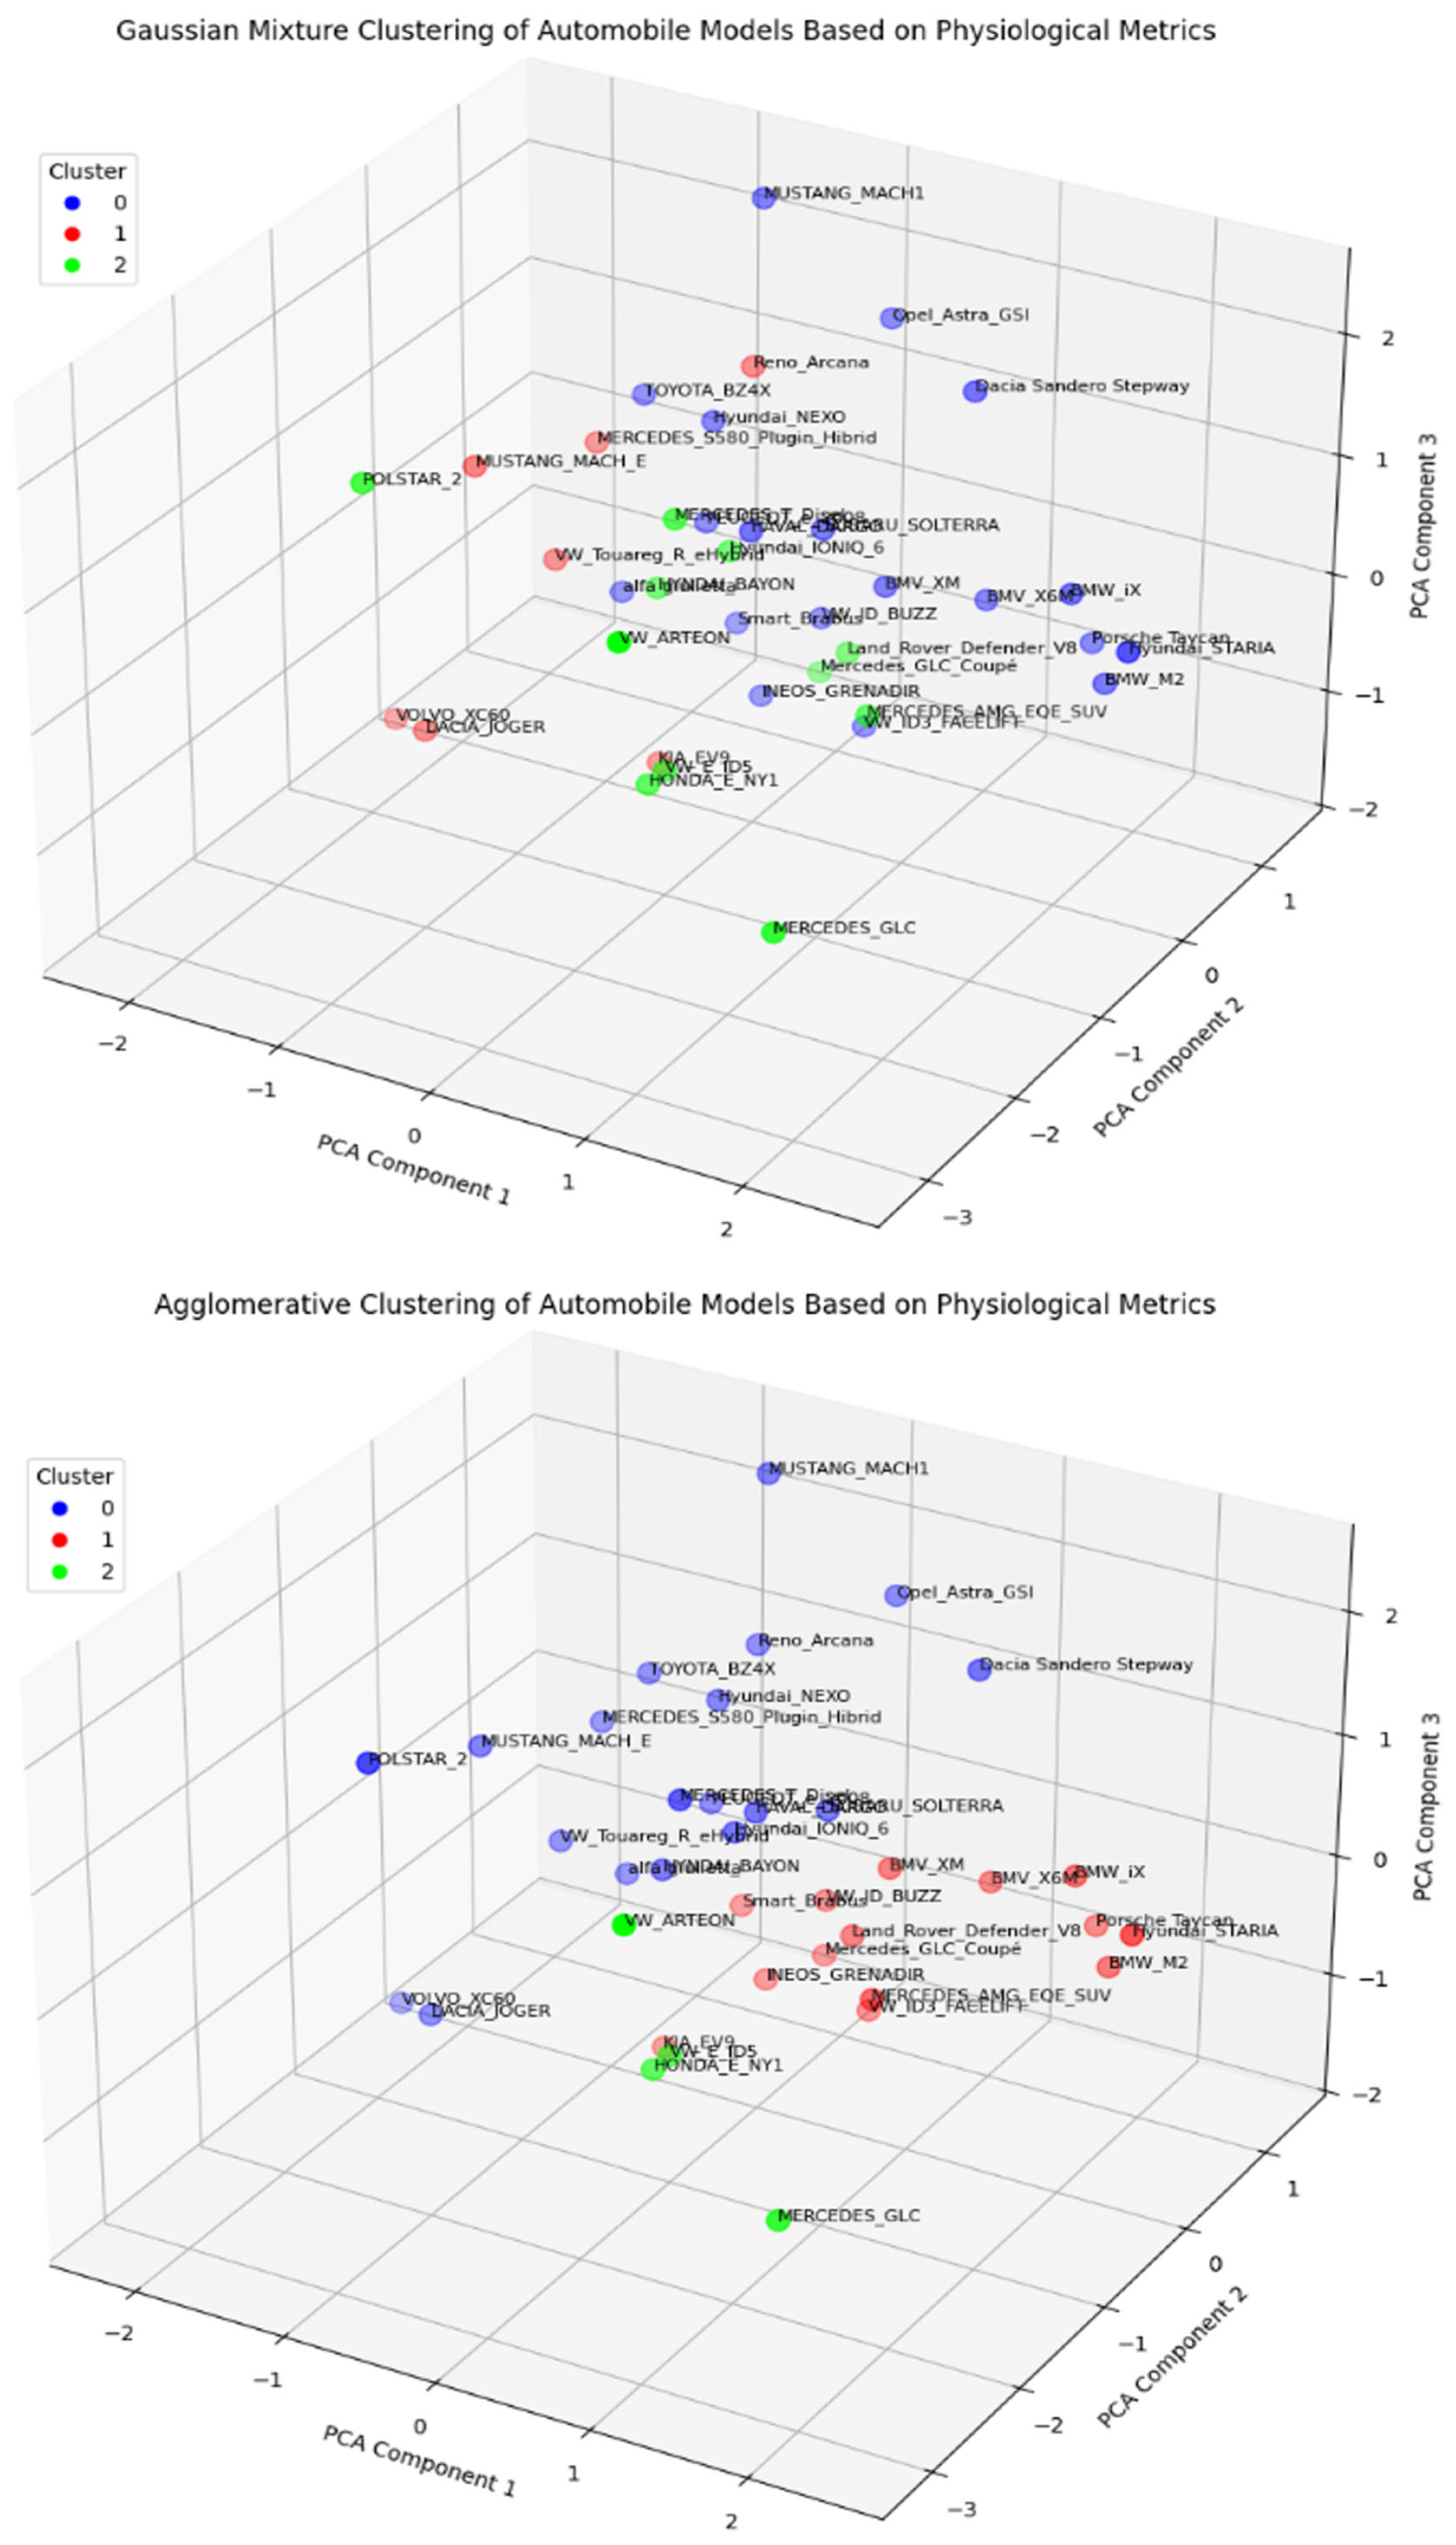
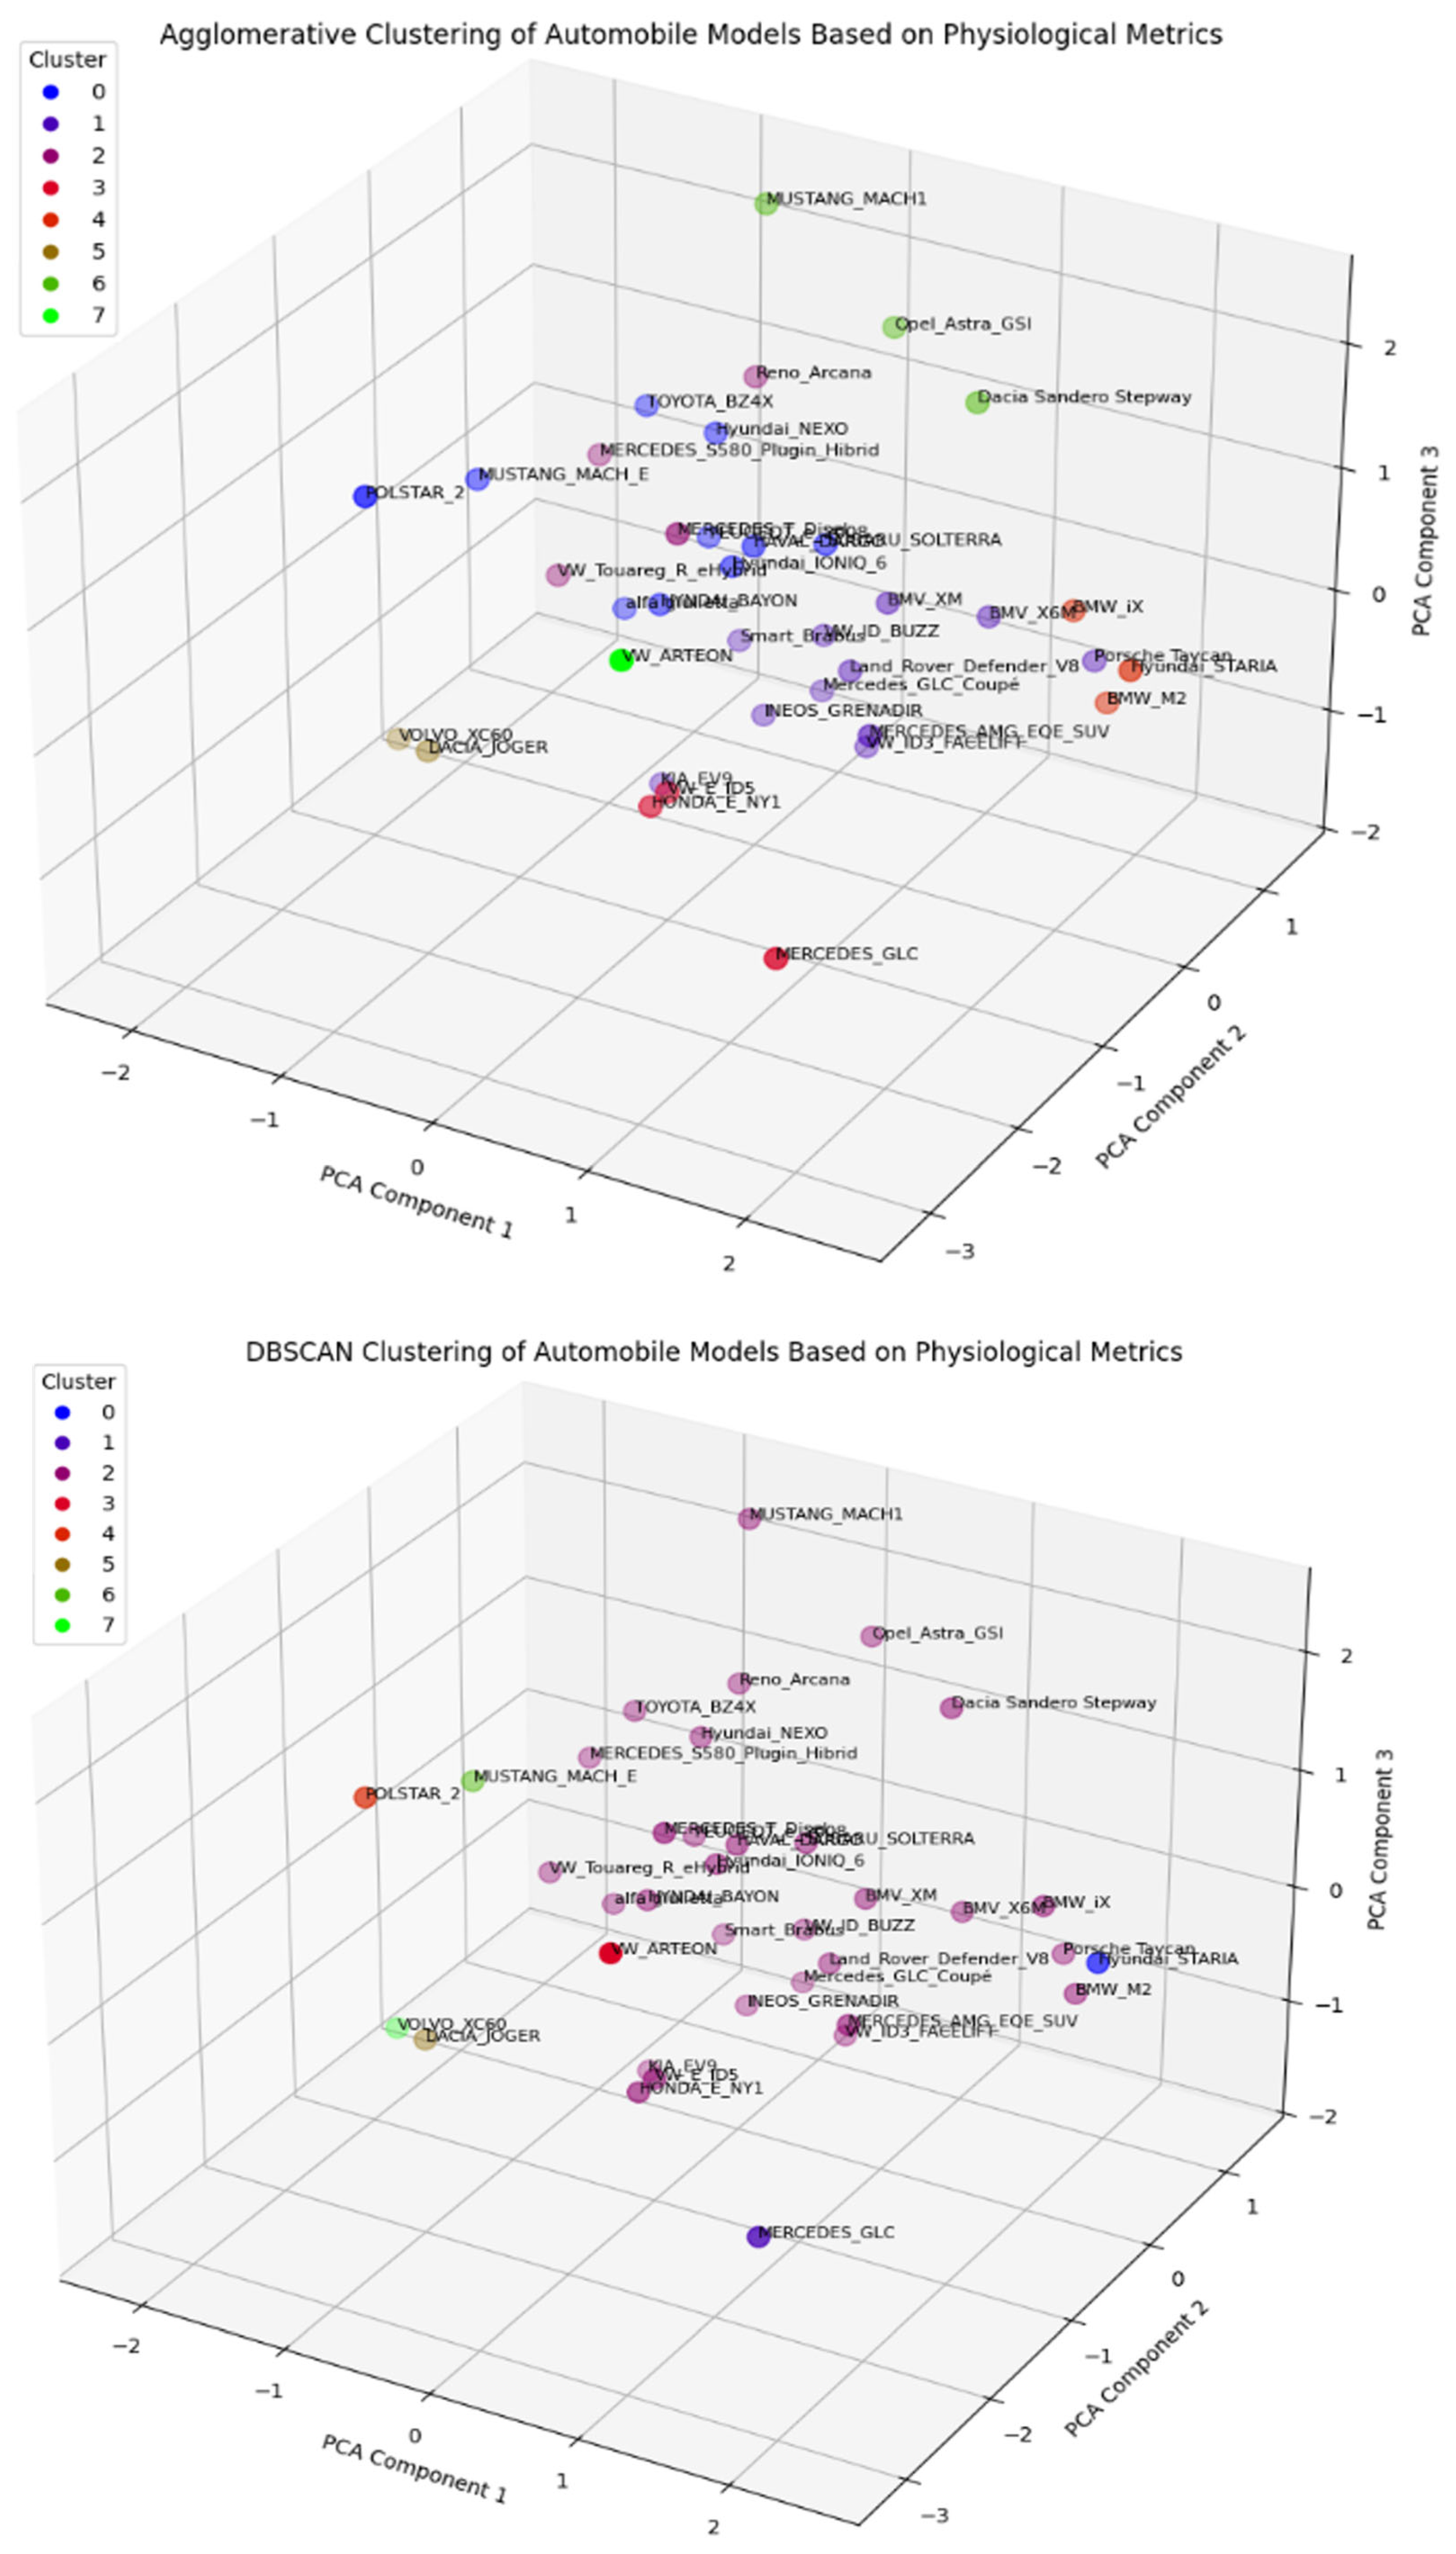
The results of the three-cluster solution obtained using K-Means, Gaussian Mixture, Agglomerative, and DBSCAN clustering are visualized in
Figure 13.
The clusters overlap significantly, but each algorithm defines them differently due to their inherent logic. Most similar clustering algorithms (in order of similarity): K-Means & Gaussian Mixture—high overlap in cluster structure. Agglomerative & K-Means—moderate overlap. Agglomerative & Gaussian—some overlap. DBSCAN & others—least similar to all others; DBSCAN clusters are broader or more noise-tolerant.
Also, neither of the clustering method overlapped highly with the expected three clusters (ICE, Hybrid, EV). The highest similarity was obtained with the Gaussian Mixture Model (0.566), which is insufficient. From this we can conclude that the engine type factor is not of great importance for the current way in which the studied cars are naturally clustered differently, and that we need to look for another, currently hidden factor that influences more how the different cars are perceived by the driver.
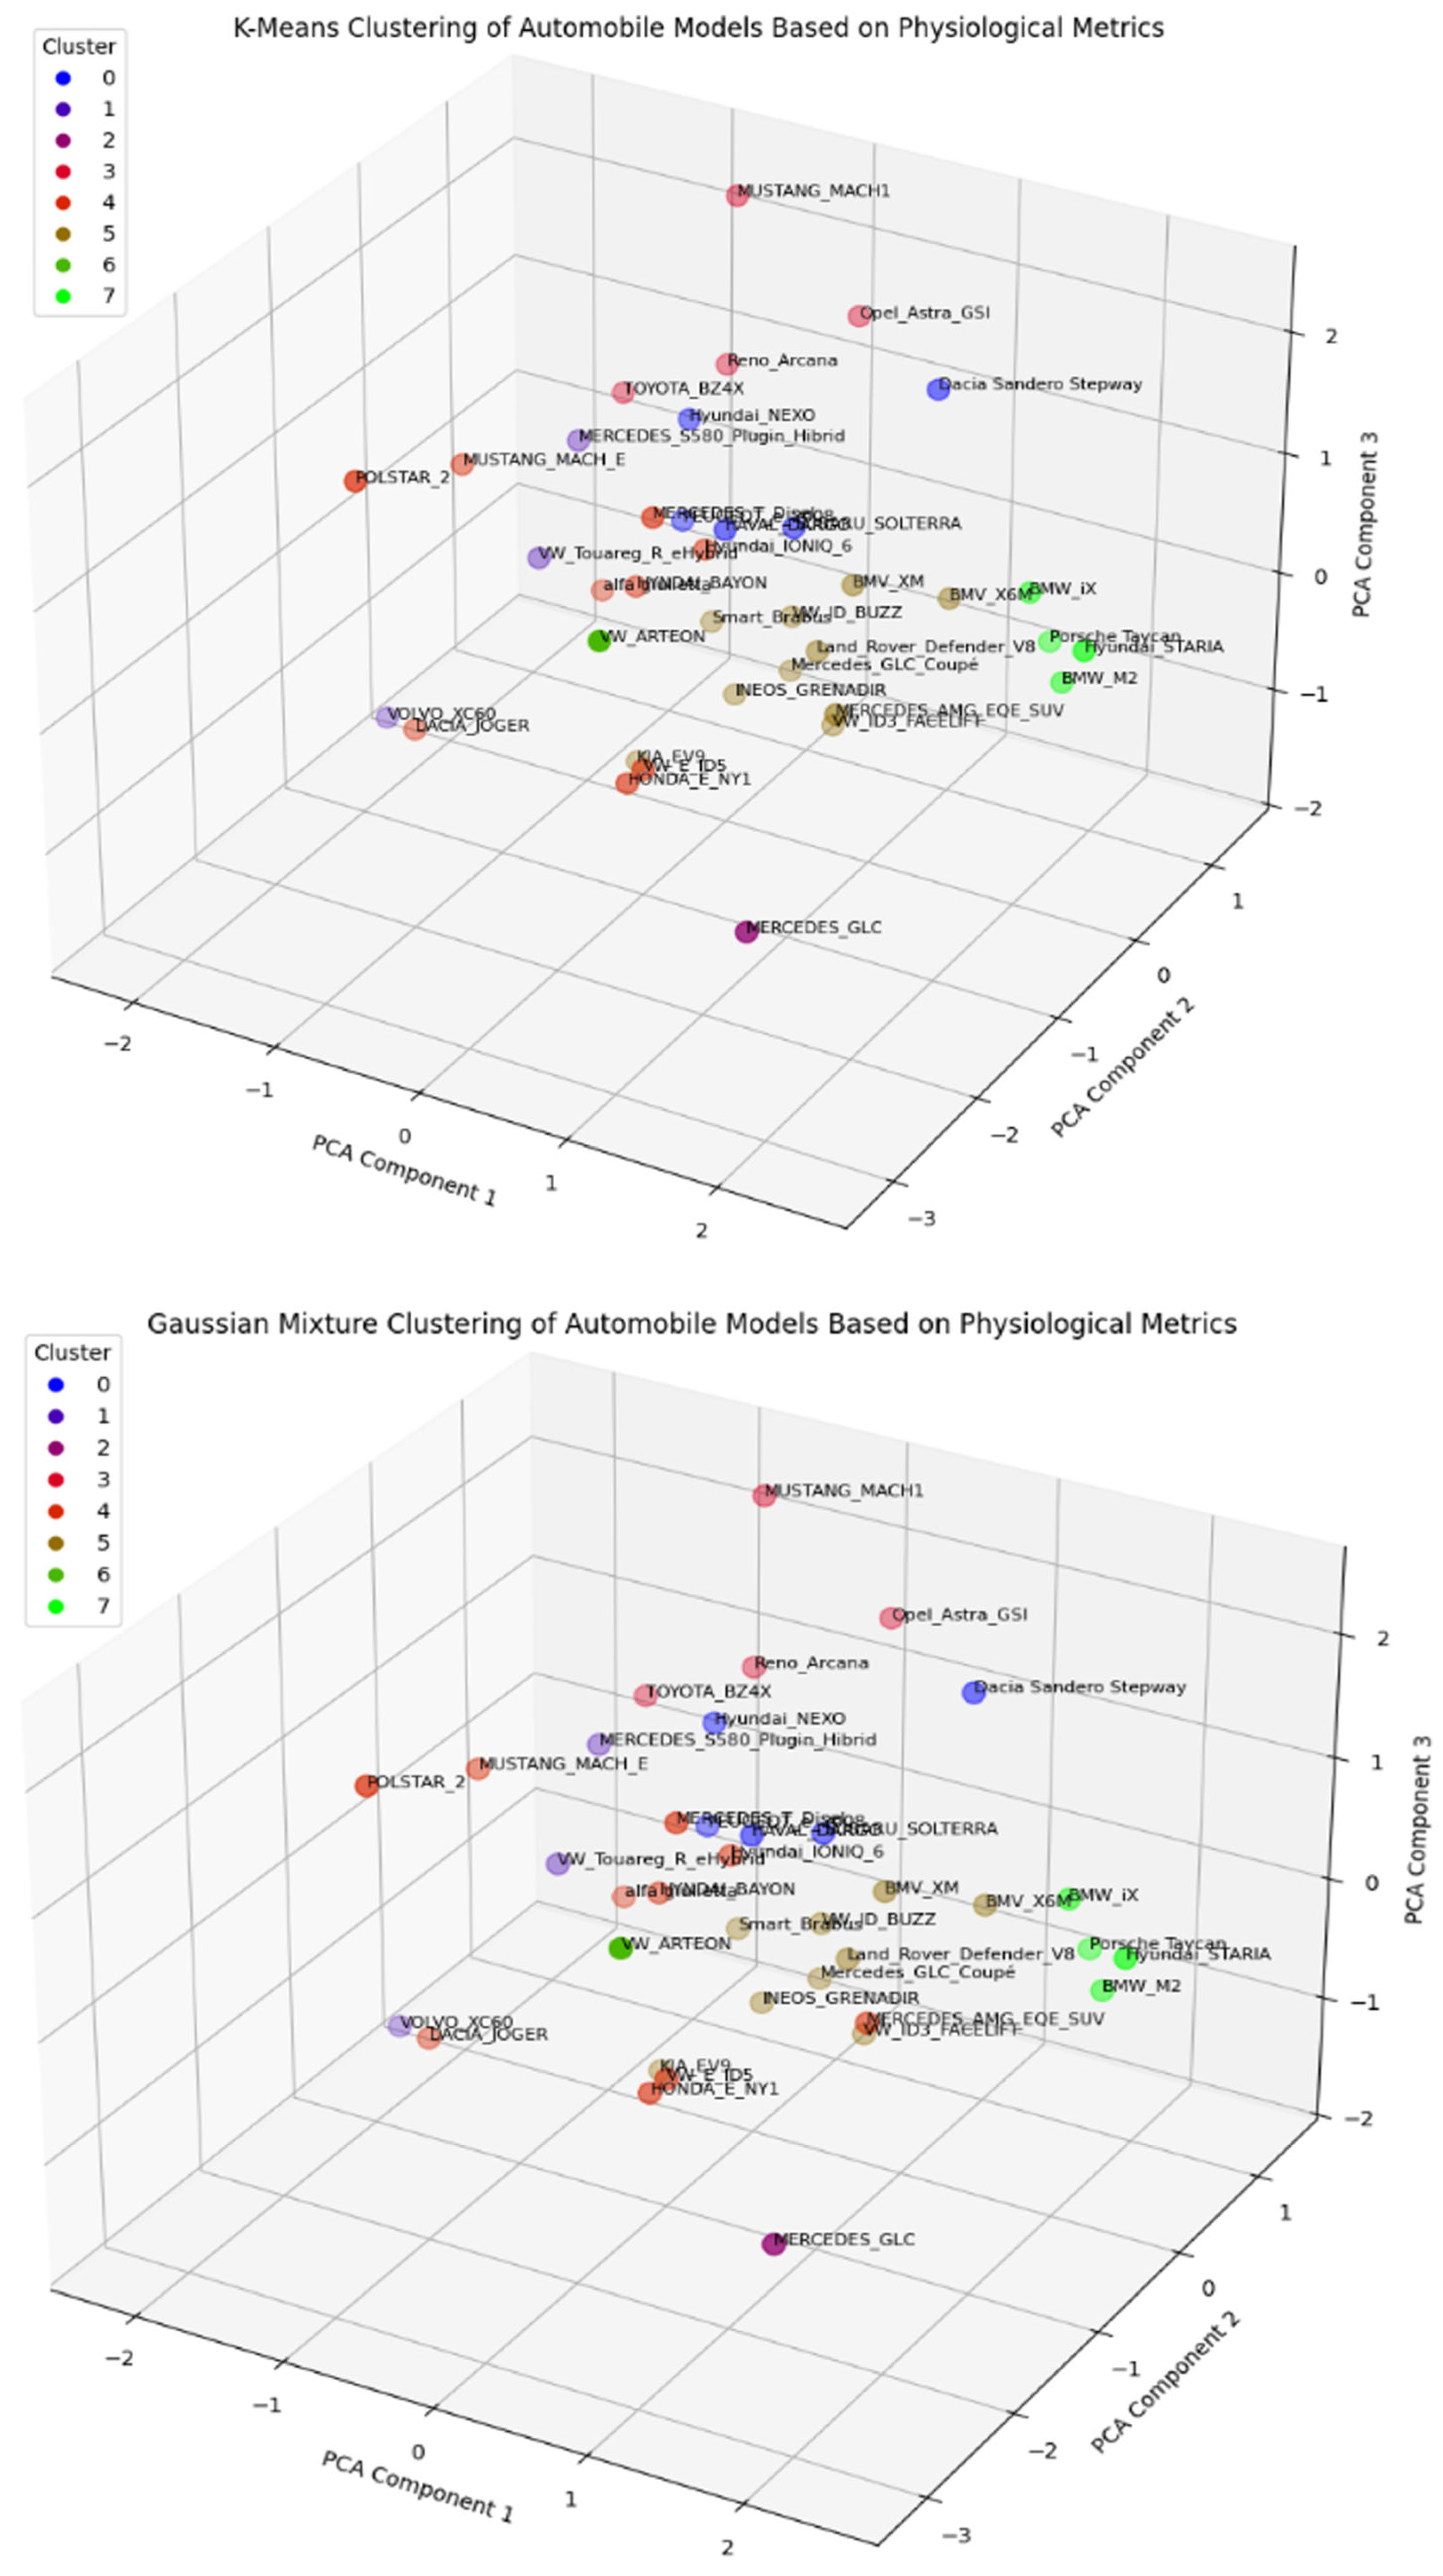
Clustering into 8 clusters.
Based on the Theta/Alpha EEG increase or decrease, pulse rate increase or decrease and GSR increase or decrease we subdivided the vehicles in eight categories: CL1 (1,11,13,18,22,24), CL2 (5,6,12,14), CL3 (2,4,19,20,31,32), CL4 (9,29,33), CL5 (7,16,23,34), CL6 (3,10,21,26,27), CL7 (15,17,30,37), CL8 (8,25,28,35,36).
After Agglomerative clustering cars the following indexes fell into the relevant clusters CL1(15,17,30,37), CL2(8,13,25,35,36), CL3(7,16,23,34), CL4(3,10,21,26,27), CL5(2,4,19,20,31,32), CL6(9,29,33), CL7(1,11,18,22,24,28), CL8(5,6,12,14).
With DBSCAN we subdivided the car indexes as follows: CL1(1), CL2(2), CL3 (3,4,5,7,8,9,10,11,14,15,16,17,18,19,20,21,22,23,24,25,26,28,29,30,31,32,33,34,36,37), CL4(6), CL5(12), CL6(13), CL7(27), CL8(35).
After Gaussian clustering we obtained CL1(3,5,14,28,33), CL2(16,35,36), CL3(2), CL4(10,23,26,34,7), CL5(8,9,12,13,21,25,27,29,31), CL6(4,15,17,18,19,24,30,32,37), CL7(6), CL8(1,11,20,22).
For K-Means clustering our clusters were CL1(3,5,14,28,33), CL2(16,35,36), CL3(2), CL4(10,23,26,34), CL5(7,8,9,12,13,21,25,27,29), CL6(4,15,17,18,19,24,30,31,32,37), CL7(6), CL8(1,11,20,22). The resulting similarity scores are presented in
Table 9.
Unsupervised clustering into eight clusters showed that agglomerative clustering comes closest to the initial expectation of how the cars should be distributed. In addition, the table shows that the other two methods K-Means and Gaussian also give high similarities to the expectations and only DBSCAN subdivides the cars in a different way as presented on
Figure 14.
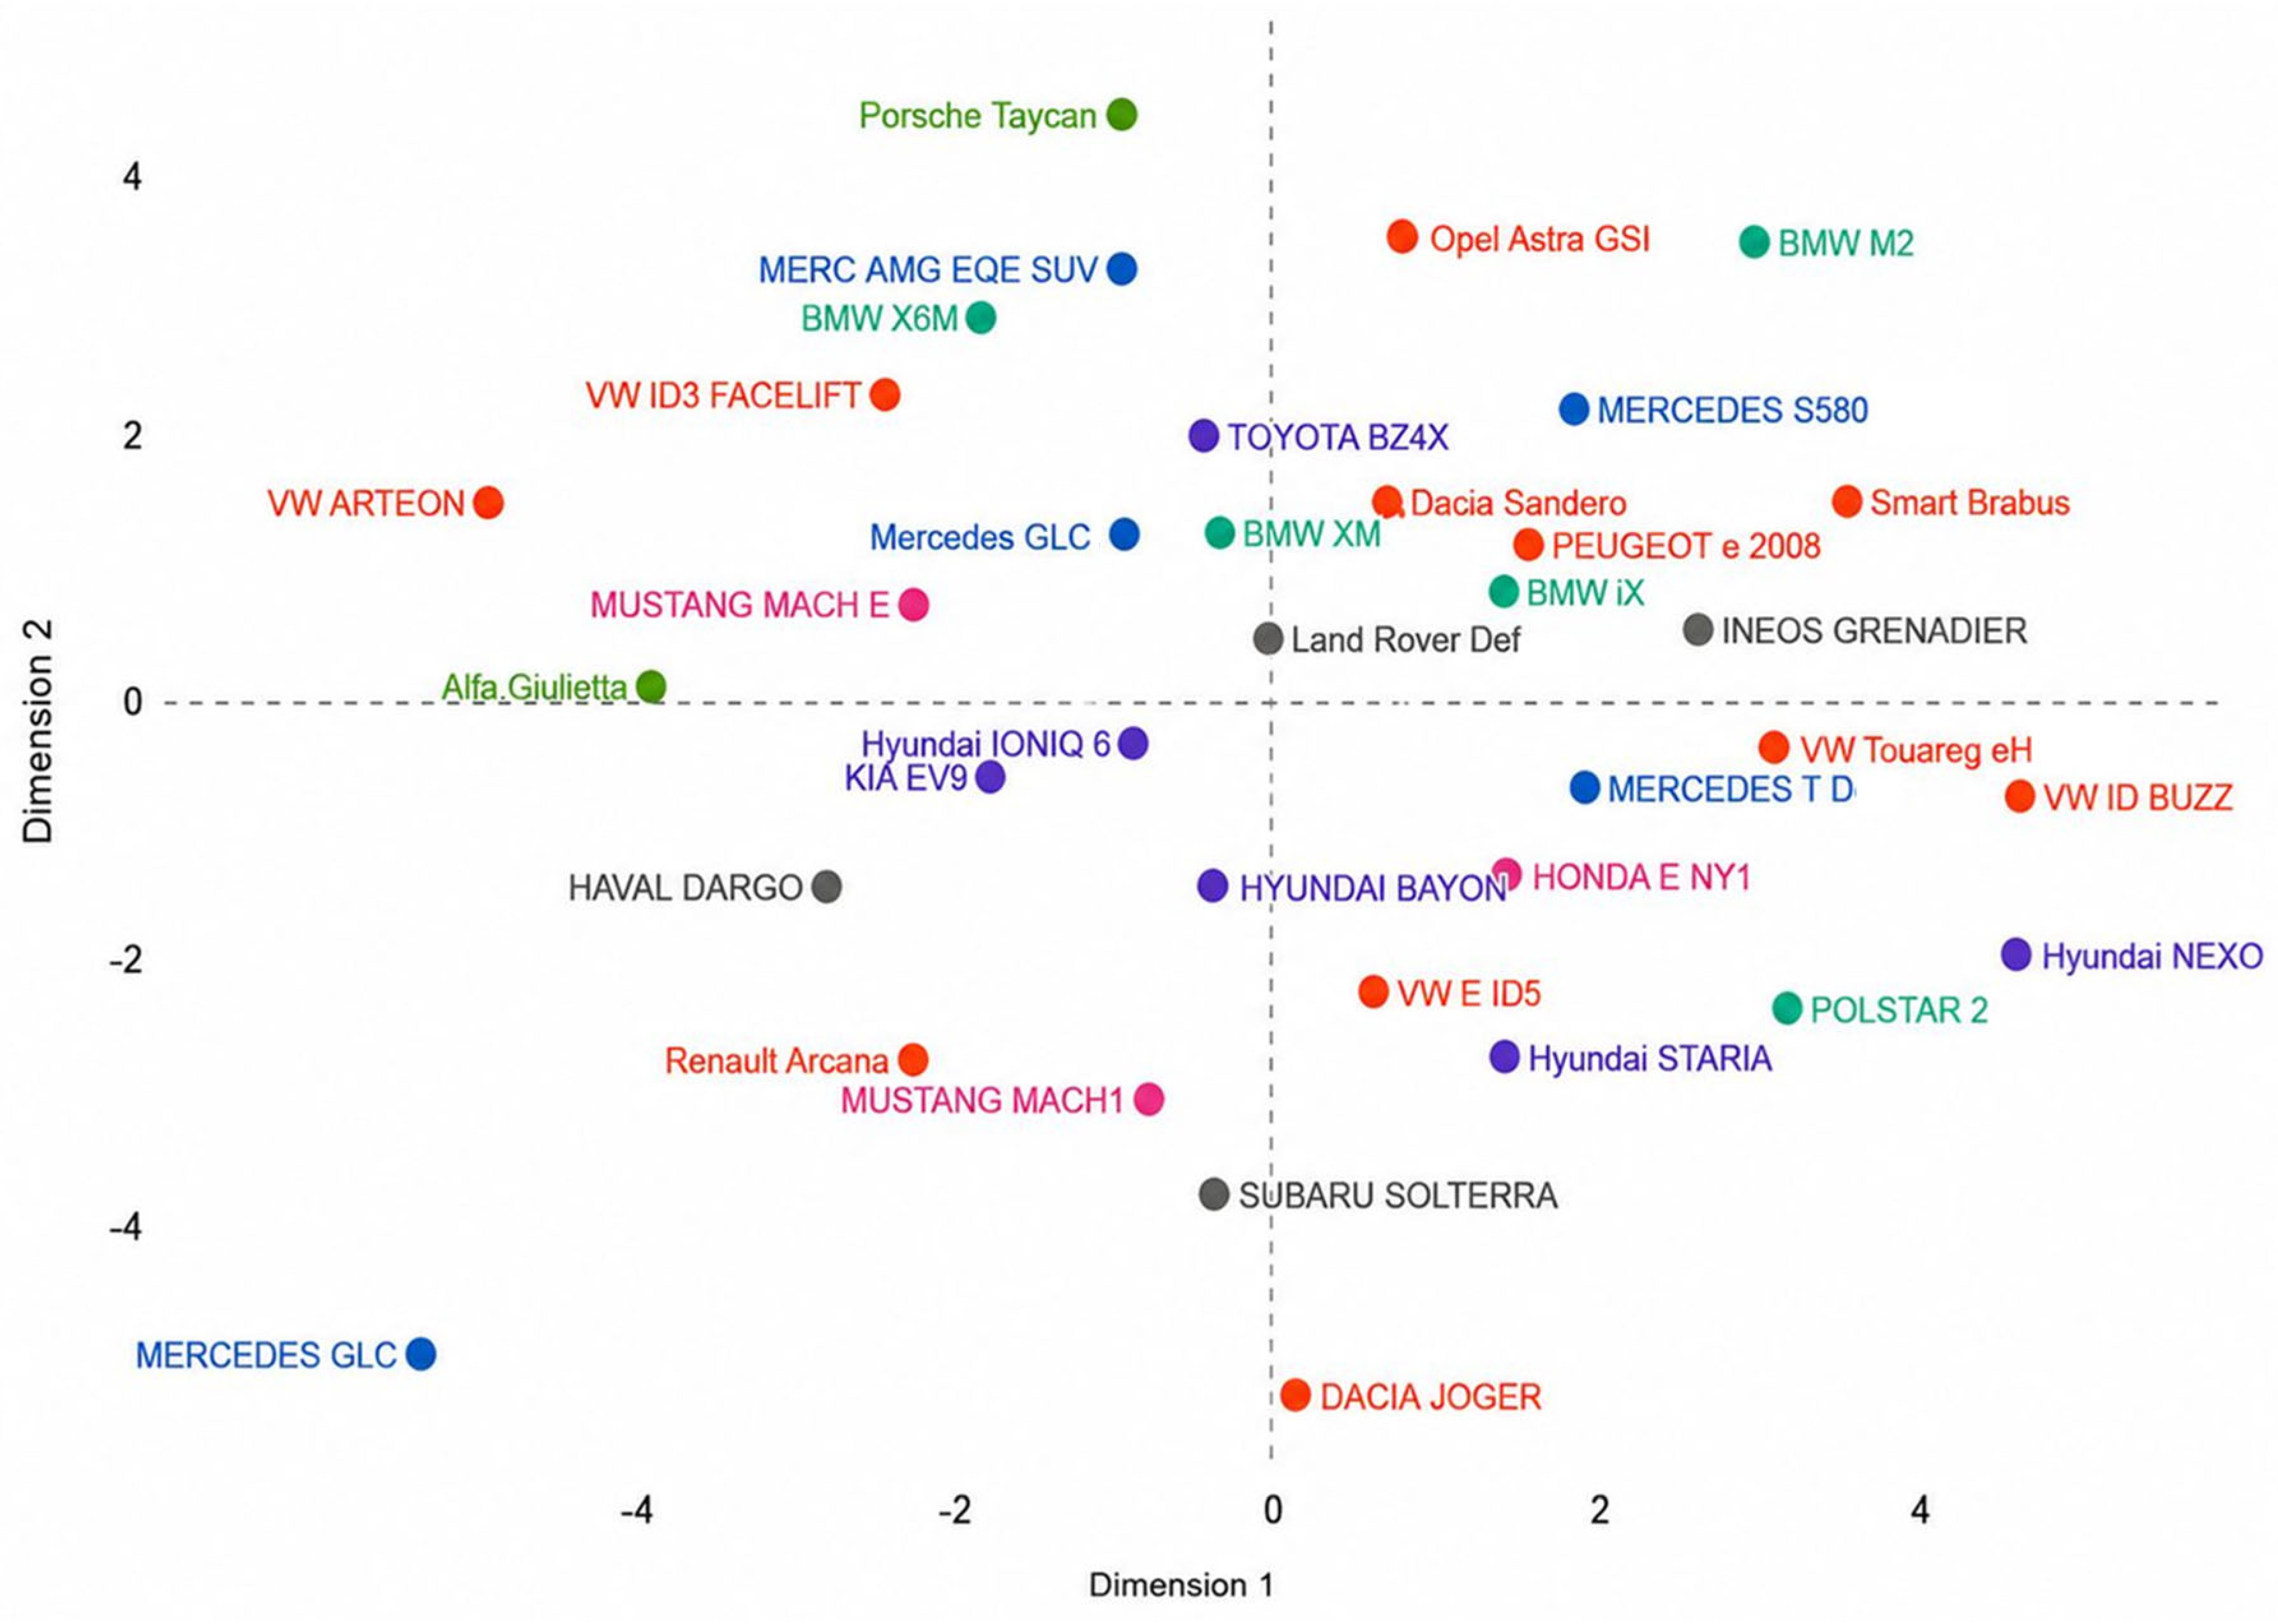
We have also performed multidimensional scaling by using the resulting similarity matrix for all of the 37 cars tested. The visualization of the scaling is presented on
Figure 15. We have found that the quality of the solution (Kruskal Stress-1) is that with two dimension Stress 1 index is 0.238 or poor—expected for 37 objects and with three dimension Stress 1 index is 0.135 or Fair/Good. With 37 objects, a value of around 0.24 in two dimensions is typical—the reduction to 0.14 in three dimensions the result confirms that the third dimension carries additional information. Working with the three dimension solution is recommended. The key observations are expanded on below.
In the two dimensional map (Dimension 1 × Dimension 2), several clear groupings emerge. On the right side of the lower quadrant, Hyundai NEXO and VW ID BUZZ are very close together—indicating a similar neurophysiological profile. In the upper right corner, Porsche Taycan, Opel Astra GSI, and BMW M2 form a cluster associated with high emotional activation. Strong outliers are DACIA JOGER and MERCEDES GLC, both positioned in the lower left corner—displaying a very different profile compared to the remaining objects. KIA EV9 and Renault Arcana are nearly overlapping, which is noteworthy given their very different market positioning—they likely elicit a similar autonomic response in respondents. In
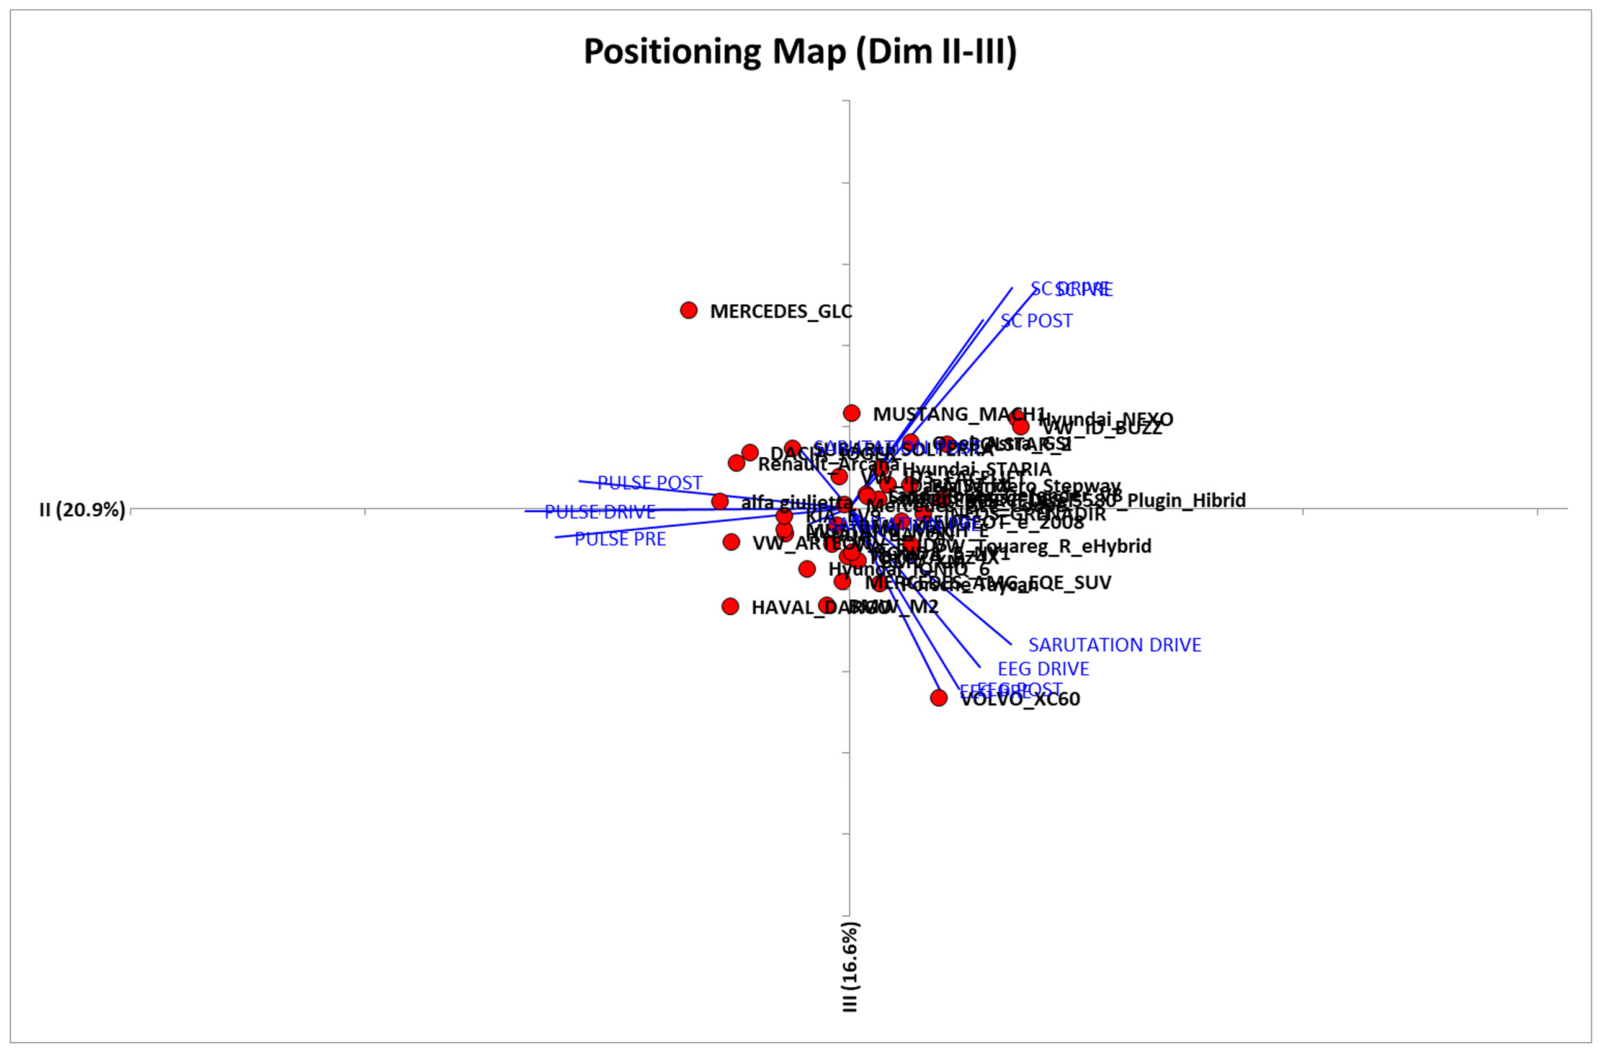
Figure 16 an analysis of the Positioning Map (Dimension II × Dimension III) is presented.
The map shows the projection of the MDS solution onto the second (20.9% explained variance) and third (16.6%) dimensions, together with attribute vectors. We can provide the following axes interpretation. Axis II (horizontal, 20.9%) is dominated by the PULSE vectors (PRE, DRIVE, POST), pointing to the left. This means that brands positioned on the left side elicit higher heart rate—greater physiological arousal. The axis can be interpreted as “physiological activation/stress”.
Axis III (vertical, 16.6%) is dominated by the skin-conductance (galvanic skin response) vectors pointing upward, and the EEG and SpO2 (oxygen-saturation) vectors pointing downward. The upper zone corresponds to higher electrodermal activity, while the lower zone corresponds to higher EEG power and higher oxygen saturation. The axis can therefore be described as “electrodermal activity vs. cortical/oxygenation activity”. These are physiological descriptions only; no subjective or affective measures were collected. Regarding the quadrant analysis, we found the following groups.
Upper right quadrant is with high SC, low PULSE:
The SC PRE, SC DRIVE, and SC POST vectors point directly into this region. Sessions located here showed a strong electrodermal response without concurrent heart-rate elevation. This quadrant includes Hyundai NEXO, VW ID BUZZ, Hyundai STARIA, MUSTANG MACH1, DACIA JOGER, and SUBARU SOLTERRA. Without concurrent subjective measures, the affective meaning of this physiological pattern cannot be established.
Upper left quadrant is with high SC + high PULSE:
The MERCEDES GLC session was a strong outlier, combining high electrodermal response with elevated heart rate—a pattern of high overall autonomic activation. Without a concurrent subjective measure, this cannot be interpreted as reflecting ‘excitement’ versus ‘stress’; it indicates only that this single session elicited unusually high sympathetic activation on both channels.
Lower left quadrant is with high PULSE, low SC:
HAVAL DARGO, BMW M2, VW ARTEON, Alfa Giulietta, KIA EV9, Renault Arcana, Hyundai IONIQ 6, and MERCEDES AMG EQE SUV—these sessions showed elevated pulse with a weak skin-conductance response. In the absence of subjective ratings, this physiological pattern cannot be labelled as tension, anxiety, or excitement.
Lower right quadrant is with high EEG + SpO2, low PULSE:
The VOLVO XC60 session was an outlier at the bottom of this projection, dominated by the EEG DRIVE, EEG POST, and SpO2 DRIVE vectors, indicating comparatively high EEG power and oxygen saturation during and after driving with low cardiovascular loading. This is a physiological observation only and was not linked to any subjective measure.
Central zone quadrant (around the origin):
A large cluster of vehicles is concentrated near the center—Porsche Taycan, BMW iX, POLSTAR 2, Mercedes GLC Coupé, PEUGEOT e 2008, HONDA E NY1, VW Touareg, INEOS GRENADIER, MERCEDES S580, Smart Brabus, VW ID3, BMV XM, and others. These sessions display a mediocre, undifferentiated neurophysiological profile along axes II and III—they do not stand out meaningfully on either attribute vector.
The key findings from the analysis are the following:
The MERCEDES GLC session was the only one with simultaneously high activation on both axes.
The VOLVO XC60 session was an outlier on the EEG/oxygen-saturation dimension; this is a physiological observation only and was not linked to any subjective or preference measure.
Most sessions clustered near the centre of the map, indicating limited differentiation in their neurophysiological profile across these two dimensions.
Hyundai NEXO and VW ID BUZZ remain close to each other in this projection as well—a consistently similar profile across all three dimensions, which is a strong signal of competitive overlap.