1. Introduction
Renewable energy capacity has grown rapidly in response to climate change and increasing global energy demand. However, the intermittent nature of renewable electricity remains a major limitation, as production from wind and solar fluctuates depending on weather conditions and temporal availability [
1,
2]. The Power-to-Gas (P2G) concept offers a route to store surplus renewable electricity by converting it into gaseous energy carriers, such as H
2 or CH
4, which can be integrated with existing energy infrastructure [
3,
4]. Among these options, Power-to-Methane (PtM) is particularly attractive because H
2 can be biologically or catalytically converted with CO
2 into CH
4, a gaseous fuel with higher volumetric energy density than hydrogen and wider compatibility with existing gas systems [
5].
However, it presents significant challenges due to limited infrastructure for H
2 storage and transportation. Consequently, the most promising approach for H
2 utilization and storage is the Power-to-Methane (PtM) method, in which H
2 is combined with CO
2 to produce CH
4 via the Sabatier reaction (Equation (1)). The methane produced can be injected directly into the natural gas distribution grid to substitute fossil fuels, providing a calorific value (CH
4 ≈ 35.8 kJ NL
−1) higher than (H
2 ≈ 10.8 kJ NL
−1) on a volume basis [
5].
PtM technologies are categorized into two main pathways: catalytic and biological methanation. In the catalytic methanation pathway, typically, methane is synthesized from CO
2 and H
2 using catalysts such as nickel or ruthenium [
6]. Catalytic methanation is characterized by high reaction rates, compact reactor design, and high methane selectivity. However, this process operates at elevated temperatures (200–600 °C) and pressures (up to 40 bar), leading to high energy consumption and degradation of catalyst stability over time [
7,
8]. In contrast, biological methanation occurs in mesophilic (38 °C) or thermophilic (50–65 °C) conditions and atmospheric pressure, facilitated by methanogenic microorganisms, making it a more energy-efficient and sustainable alternative. Nevertheless, its performance can be limited by gas–liquid H
2 mass transfer, lower volumetric productivity, and sensitivity to changes in microbial operating conditions [
9].
Biological methanation can be implemented through two configurations: in situ and ex situ processes, both aimed at increasing the CH
4 content above 90% [
10,
11]. In in situ biomethanation, H
2 is directly injected into the anaerobic digester, where methanogens convert CO
2 to CH
4 while degrading organic substrates. In contrast, in ex situ biomethanation, H
2 and CO
2 react in a separate reactor by hydrogenotrophic methanogens; however, the additional bioreactor increases capital costs and may limit economic feasibility [
12,
13].
A key advantage of the ex situ configuration is the improved control over H
2 injection, as hydrogen is supplied to a dedicated reactor rather than directly into the anaerobic digeste [
13]. This allows better regulation of H
2 partial pressure, minimizing disturbances to syntrophic microbial interactions and limiting changes in the CO
2/HCO
3− equilibrium and pH, thereby enhancing process stability and controllability compared to in situ systems [
14]. Furthermore, ex situ systems favor the hydrogenotrophic pathway (Equation (1)), which provides a higher Gibbs free energy yield for methane formation than acetolactic methanogenesis (Equation (2)) [
15].
In recent years, invaluable efforts have been made to better understand the performance of ex situ biomethanation to improve CH
4 production, highlighting that operational parameters such as temperature, pH, pressure, and reactor configuration critically affect microbial activity and overall methane yield [
13,
16]. Among these factors, temperature and pH are particularly important because they influence the balance between hydrogenotrophic methanogenesis and competing pathways such as homoacetogenesis, in which homoacetogenic bacteria convert H
2 and CO
2 into acetate [
17]. This pathway competes directly with hydrogenotrophic methanogens for the same substrates, potentially reducing methane production efficiency and promoting volatile fatty acid accumulation, which can affect pH stability and overall reactor performance [
18].
Temperature plays a key role in shaping the competition between hydrogenotrophic methanogens (HM) and homoacetogens (HAC). Laguillaumie et al. reported that at 35 °C, acetate formation via HACs was not detected, with Methanobacterium species dominating, whereas at 25 °C, HACs prevailed under favorable mass-transfer conditions [
18]. Other studies have shown that mesophilic conditions can support hydrogenotrophic methanogenic activity by maintaining favorable microbial kinetics and enabling effective H
2 consumption under stable pH conditions [
19]. In contrast, lower temperatures may slow methanogenic activity and create conditions in which HACs can compete more successfully for H
2 and CO
2, leading to acetate formation [
20,
21]. Similarly, pH directly affects microbial activity, enzyme function, and pathway stability. Most methanogenic microorganisms exhibit optimal growth within the pH range of 6 to 8, which ensures maximal enzymatic activity and methane production. pH values outside this range may reduce methanogenic activity, alter microbial community structure, and promote the buildup of volatile fatty acids (VFAs), all of which can destabilize the process [
22].
Beyond these physicochemical factors, reactor configuration plays a crucial role in biomethanation. The performance of different types of reactors has been investigated, including continuous stirred tank reactors (CSTRs), plug-flow, bubble column, and immobilized bed bioreactors (IBBR) [
23,
24]. Previous studies indicate that fed-batch operation can be advantageous because it improves process control and gas–liquid transfer efficiency, while avoiding the high energy demand typically associated with CSTRs [
25,
26]. However, gas–liquid mass-transfer resistance, particularly the limited dissolution of H
2 in the liquid phase, remains a key rate-limiting factor in ex situ biomethanation and highlights the need for pressure-based control strategies. Nevertheless, fed-batch operation under controlled mesophilic and pressurized conditions remains insufficiently investigated.
Hydrogen availability is a critical constraint in ex situ biomethanation because H
2 must transfer from the gas phase to the liquid phase before becoming available to hydrogenotrophic methanogens. This process is commonly described using Henry’s law and the two-film mass-transfer model [
27]. According to the solubility form of Henry’s law, the equilibrium dissolved hydrogen concentration can be expressed as
; where
is the H
2 solubility constant and
is the gas-phase hydrogen partial pressure. The volumetric gas–liquid transfer rate (
can be described by
where
is the volumetric gas–liquid mass-transfer coefficient and
is the actual dissolved H
2 concentration in the liquid phase. Therefore, increasing
increases the equilibrium dissolved H
2 concentration and the mass-transfer driving force, whereas
is primarily governed by hydrodynamic conditions, including mixing intensity, gas flow rate, bubble size, interfacial area, and liquid properties [
9,
28].
This study evaluated ex situ H2 biomethanation in an anaerobic, completely mixed fed-batch reactor operated under mesophilic conditions (38 °C) and within a pressure range of 1100–1400 mbar(a). The reactor employed an integrated control strategy in which pressure thresholds regulated H2 feeding and headspace gas discharge, while CO2 addition was adjusted based on continuous measurements of dissolved CO2 in the liquid phase. The pressure-based H2 control was designed to enhance H2 dissolution and minimize residual H2 in the outlet gas, whereas dissolved CO2 regulation enabled the progressive control of inorganic carbon availability and pH stability. Unlike conventional ex situ systems operated with a fixed gas composition, this approach allowed substrate availability to be adjusted dynamically during reactor operation. Since CO2 is considerably more soluble in water than H2, the system could be operated at relatively low and stable CO2 partial pressures while maintaining methanation performance.
Previous fed-batch ex situ biomethanation systems have demonstrated promising methane-upgrading performance; however, gas injection and headspace discharge were generally performed at fixed time intervals, independently of process dynamics and substrate consumption rates, as reported by Voelklein et al. [
13] and Thapa et al. [
29]. In addition, these systems were commonly operated under atmospheric pressure and fixed H
2:CO
2 feeding ratios, often with continuous gas recirculation during each batch cycle. In contrast, the present study employed a pressurized, completely mixed fed-batch reactor in which combined pressure-regulated H
2 feeding and gas discharge with dissolved CO
2 regulation allowed substrate availability to be adjusted according to process dynamics rather than fixed feeding conditions.
The novelty of this study therefore lies in integrating pressure-driven H2 feeding, pressure-triggered gas discharge, dissolved CO2 regulation, and process-stability assessment under progressively decreasing inorganic carbon availability. It was hypothesized that dissolved CO2 regulation would support pH stability by maintaining adequate carbonate buffering and thereby limiting excessive VFA accumulation, while pressure-based H2 control would enhance methane production and hydrogen utilization.
2. Materials and Methods
2.1. Reactor Setup
The ex situ H
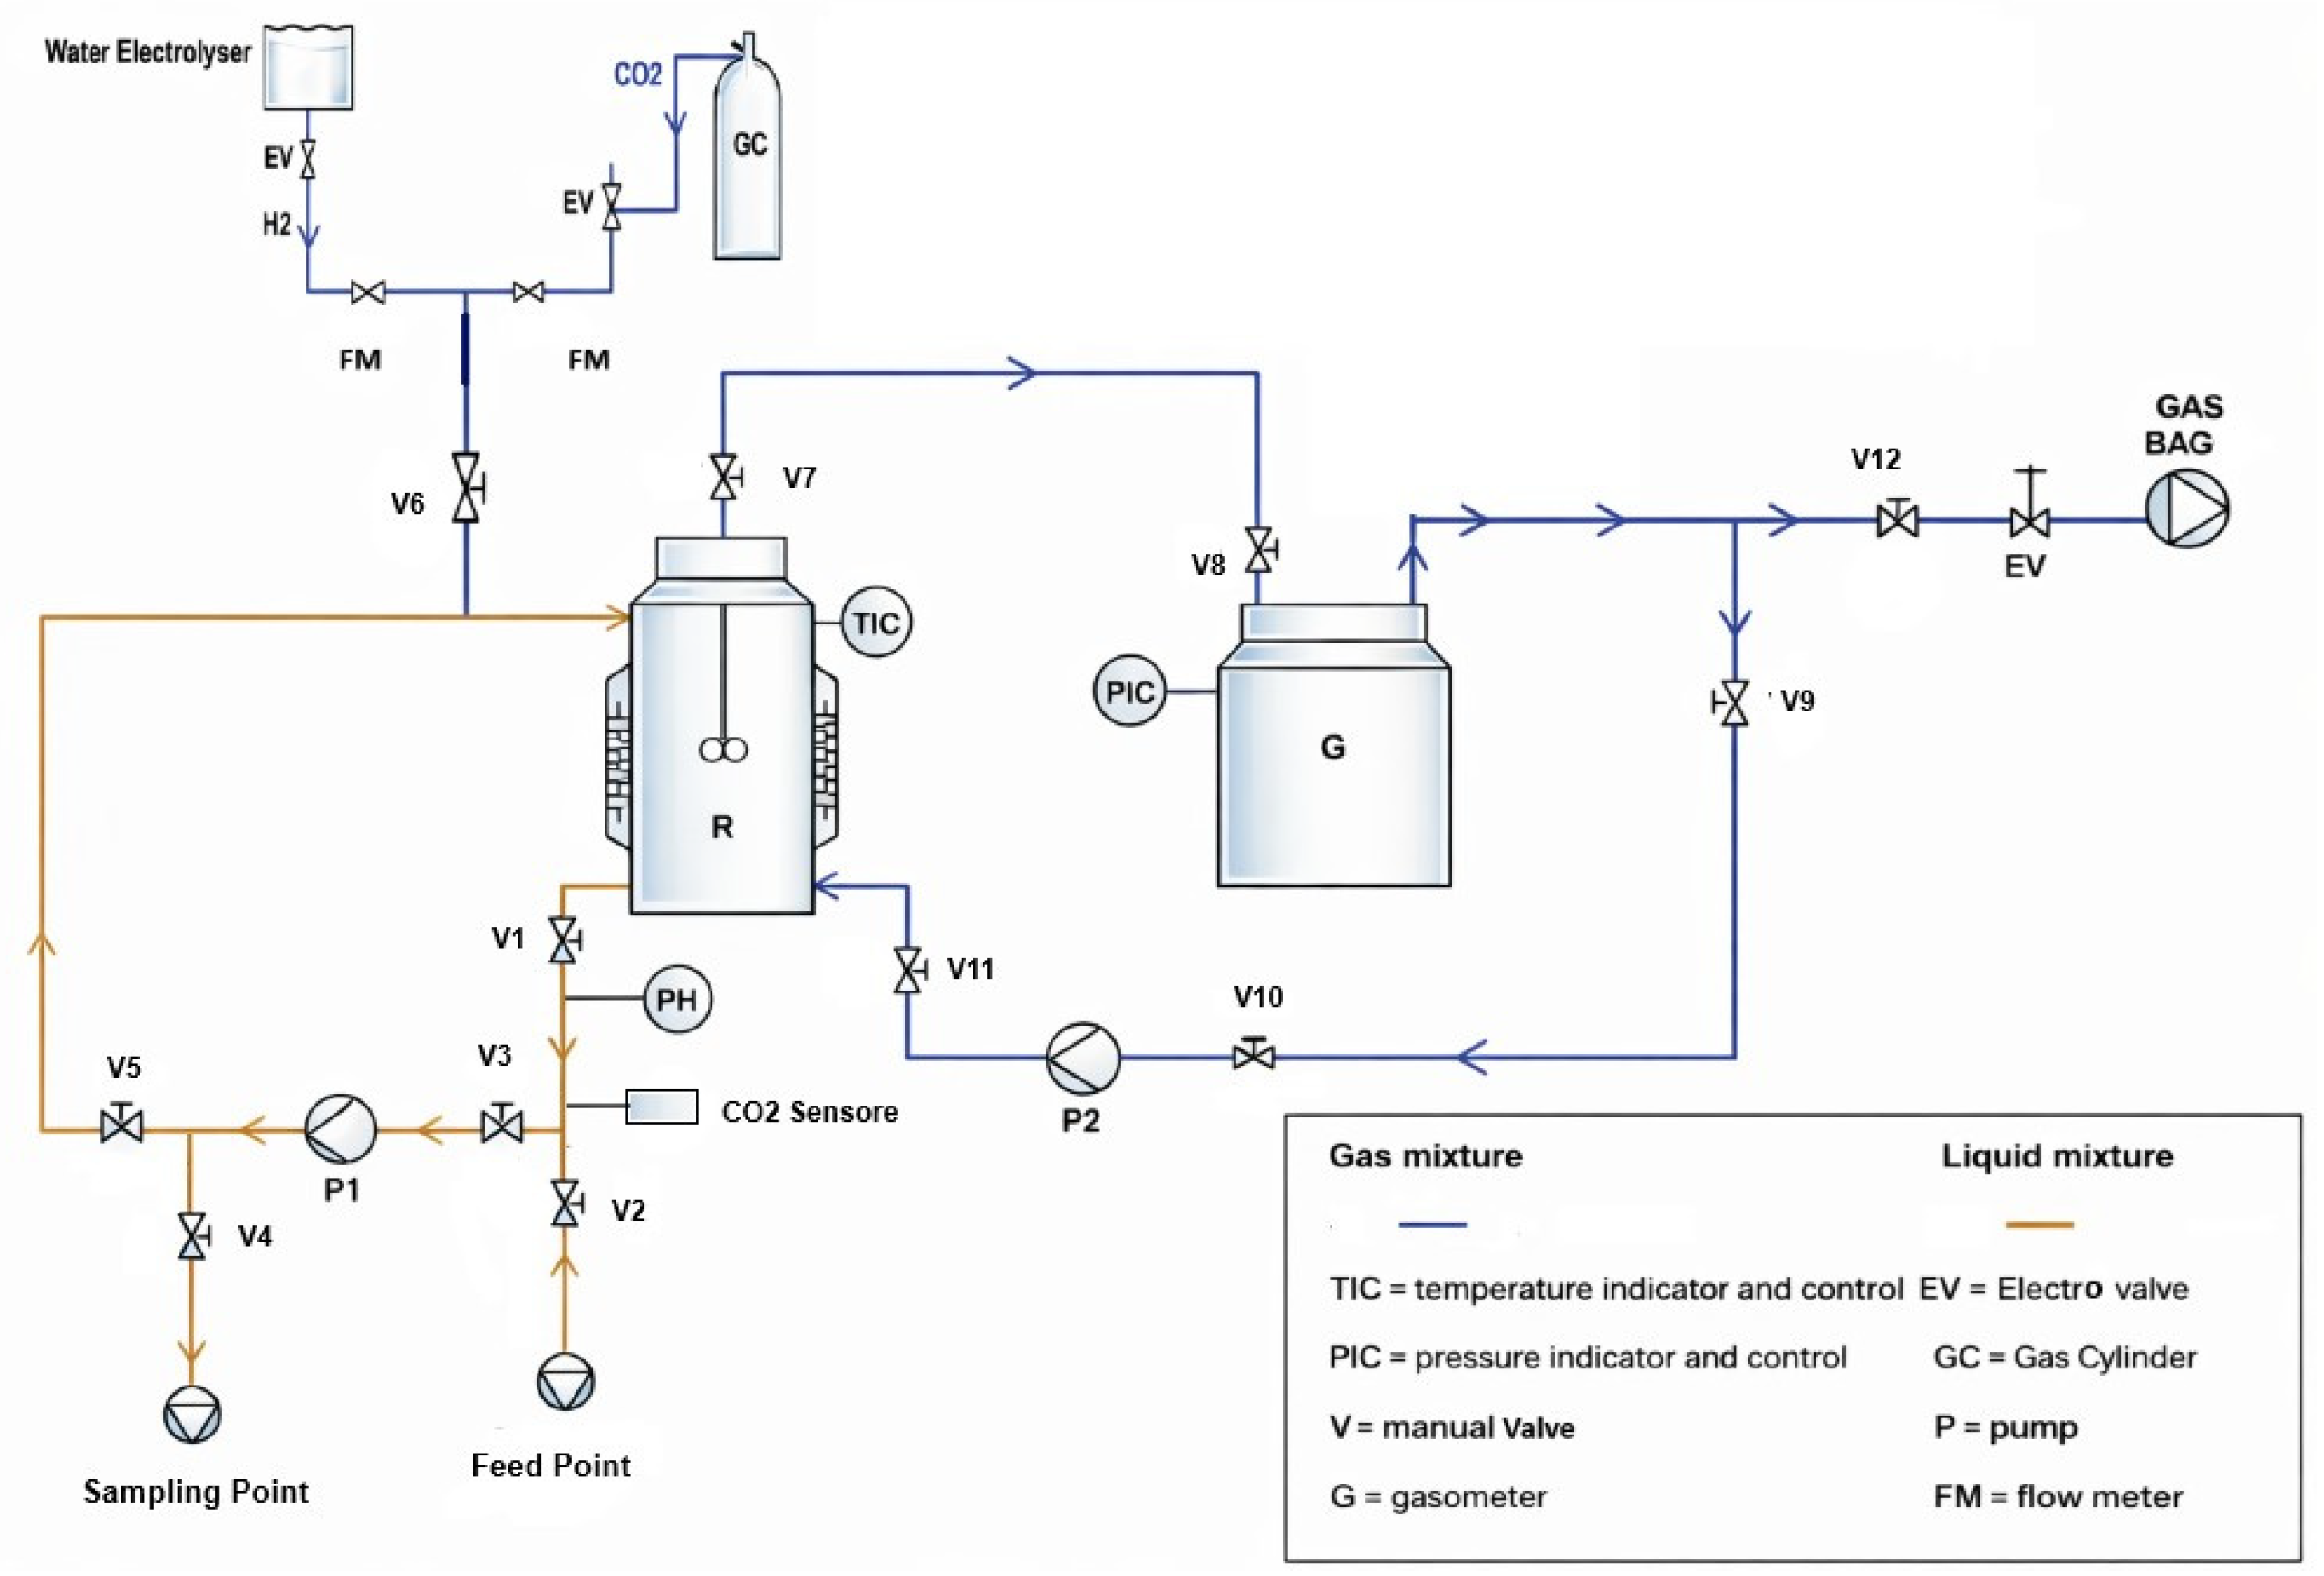
2 biomethanation system was designed to operate as a fed-batch anaerobic reactor. It was structured into two main functional compartments: a fully mixed and biologically active liquid phase, and a gaseous phase. The reactor was operated throughout the experimental period under mesophilic conditions (38 ± 1 °C), using an electric resistance heater controlled by a thermostat. A schematic diagram of the reactor setup and its associated laboratory-scale equipment is presented in
Figure 1.
The anaerobic reactor (R) consisted of a 2.6 L DURAN
® glass bottle (DWK Life Sciences GmbH (formerly part of the DURAN Group/SCHOTT, Mainz, Germany)) fitted with a GL 80 cap containing five GL 15 ports, with a liquid working volume of 1.4 L. The liquid phase was continuously recirculated through a dedicated tubing circuit using a SEAFLO membrane pump for liquid aspiration and recirculation. This configuration ensured complete and homogeneous mixing of the reactor content. The remaining reactor volume, not occupied by the liquid phase, constituted the headspace, forming part of the gaseous phase. The gas was partially stored in a 0.3 L auxiliary bottle acting as a gasometer (G,
Figure 1), which was connected to the main reactor through a tubing system. The gasometer acted as a separation device for removing condensate and foam generated in the digester during the process, while protecting the membrane pump used for gas recirculation. Gas recirculation was ensured by a membrane pump manufactured by KNF (KNF Neuberger GmbH, Freiburg-Munzingen, Germany), operating continuously. This configuration enabled gas transfer and recirculation between the biological reactor and the auxiliary volume, allowing control of the gas-phase composition and ensuring effective gas mixing.
The gas supply system consisted of two red-y Vögtlin® mass flow controllers, enabling independent dosing of hydrogen and carbon dioxide, and an electro-valve used for controlled discharge of the methane-rich product gas. Hydrogen was generated by a water electrolyzer (purity grade 4.0, O2 < 1 ppm, according to manufacturer specifications), while carbon dioxide (purity grade 5.0) was supplied from a compressed gas cylinder (SIAD S.p.A, Bergamo, Italy). Both gases were delivered to the reactor at an operating pressure of 2 bars.
Dissolved CO2 concentration was continuously monitored using a Hamilton CO2NTROL RS485 probe (Hamilton Bonaduz AG, Bonaduz, Switzerland), an optical sensor based on mid-infrared absorption, according to the manufacturer’s specifications. Both gases were introduced into the system through the liquid-recirculation line, downstream of the mixing pump and the in-line sensors installed along the circuit.
2.2. Substrate and Inoculum Media
The reactor was inoculated with digested sludge obtained from a full-scale anaerobic digester located at the wastewater treatment plant of Castiglione Torinese (SMAT S.p.A., Turin, Italy). The collected sludge was stored at 4 °C before use. Before reactor inoculation, the sludge was centrifuged at 5000 rpm for 15 min to separate the solid and liquid fractions. Subsequently, 50% of the recovered solid fraction was remixed with the corresponding centrifuged liquid to prepare the reactor inoculum, thereby partially retaining active biomass while reducing the solids content to prevent clogging of the recirculation lines. During reactor operation, the system was fed daily with the centrate obtained by centrifugation of digestate produced by a laboratory-scale anaerobic digester, without external additives. The total solids (TS), volatile solids (VS), and other physicochemical characteristics of the digestate used in this study as inoculum and reactor feedstock are summarized in
Table 1. The analytical procedures used for inoculum and feedstock characterization are provided in the
Supplementary Method S2.
2.3. Operating Conditions
At the beginning of the process, after inoculation, the reactor was purged with nitrogen (purity grade 4.0) for 5 min to remove oxygen from the gas phase and establish anaerobic conditions favorable for methanogenic microorganisms. No scheduled purge specifically intended to remove N2 or other inert gases was performed after reactor start-up. Nevertheless, the pressure-triggered discharge phase partially renewed the headspace during each cycle and removed a fraction of the inert gases potentially present. The system was operated in a sequential fed-batch mode consisting of repeated operational cycles involving gas injection, biological conversion, and gas discharge.
The gas–liquid mixture was continuously recirculated into the reactor and distributed through a ceramic diffuser located at the bottom of the digester. This configuration enhanced hydrogen dissolution and its availability in the liquid phase, thereby improving substrate accessibility for hydrogenotrophic methanogens and promoting the efficient biological conversion of H2 and CO2 into methane. Throughout the experiments, the reactor was operated within an absolute pressure range of 1100–1400 mbar(a). This range was selected to enhance gas–liquid mass transfer by increasing the hydrogen partial pressure and, consequently, hydrogen solubility in the liquid phase according to Henry’s law, while maintaining moderate energy demand and safe operating conditions. Since the reactor was designed to operate at pressures up to approximately 2 bar(a), the applied pressure range ensured stable and safe performance under laboratory-scale conditions.
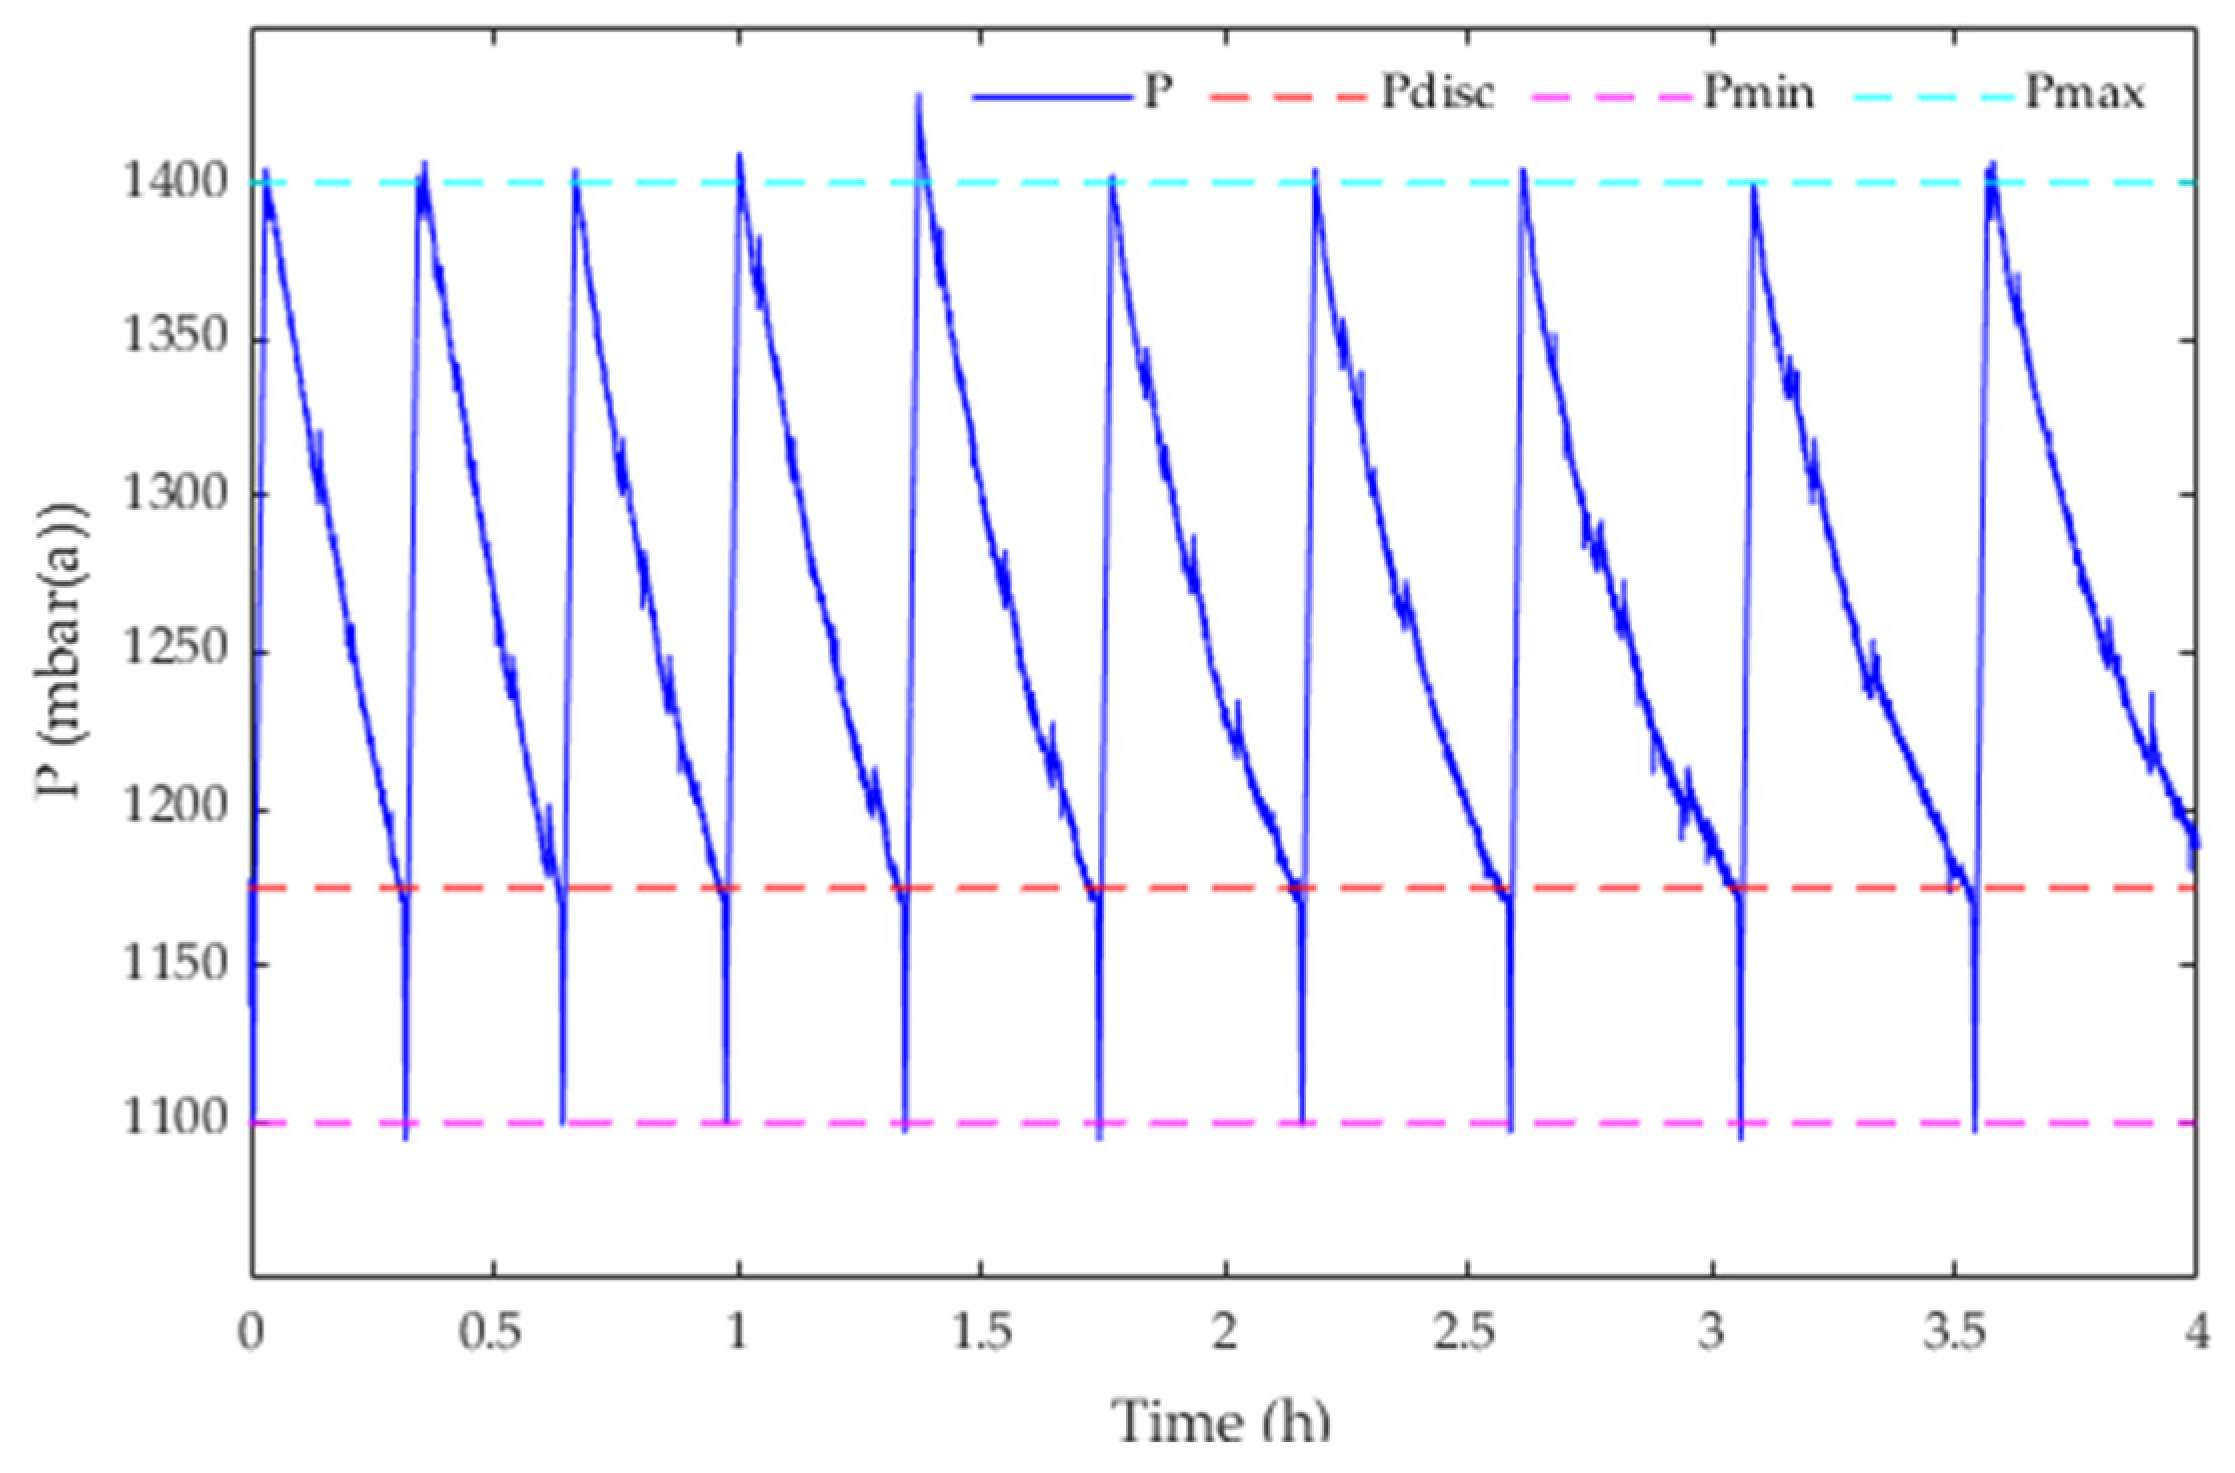
The minimum operating pressure of 1100 mbar(a) marked the beginning of each cycle. The control system then initiated hydrogen injection until the maximum pressure of 1400 mbar(a) was reached, after which the H2 supply was stopped. Meanwhile, CO2 dosing was dynamically controlled using real-time measurements of dissolved CO2 in the liquid phase. Specific dissolved CO2 setpoints (25, 17, and 2 mg L−1) were defined for each operational stage, and a hysteresis-based control strategy was applied to regulate CO2 injection around the selected operating reference. The setpoints of 25 and 17 mg L−1 were adopted as the initial and intermediate operating conditions, respectively, whereas the subsequent reduction to 2 mg L−1 was introduced following the VFA accumulation observed during Stage II, to reduce the acidifying contribution of molecular dissolved CO2 and promote pH recovery.
The relationship between molecular dissolved CO
2 concentration and the corresponding equilibrium gas-phase partial pressure was estimated using the solubility form of Henry’s law. Based on a CO
2 solubility constant of 0.0246 mol L
−1 bar
−1 at 38 °C, dissolved CO
2 concentrations of 25, 17, and 2 mg L
−1 correspond to nominal equilibrium CO
2 partial pressures of approximately 23.1, 15.7, and 1.85 mbar, respectively. These values were not selected as universal biological thresholds derived from the literature, but as sequential operating conditions used to evaluate reactor performance under progressively lower molecular dissolved-CO
2 availability. This definition refers specifically to molecular CO
2(aq) and does not imply limitation of the total inorganic carbon pool, which also includes HCO
3− and CO
32− and depends on pH and alkalinity. In addition, regulating dissolved CO
2 concentration enabled indirect control of reactor pH, thereby preventing excessive alkalinization commonly associated with hydrogen injection during ex situ biomethanation [
19].
This strategy enabled the reactor response to be evaluated under progressively lower molecular dissolved-CO2 conditions while limiting excessive fluctuations around the selected operating references. This operating strategy linked gas injection to reactor pressure and gas-consumption dynamics, allowing an H2:CO2 molar ratio close to 4:1 to arise from the process rather than being imposed as a fixed control parameter. This ratio is consistent with the stoichiometric requirements of hydrogenotrophic methanogenesis (4 mol H2 + 1 mol CO2 → 1 mol CH4 + 2 mol H2O), which defines the theoretical optimum for complete substrate conversion.
Pressure thresholds regulated H
2 injection, whereas CO
2 dosing was controlled independently through the dissolved-CO
2 operating references. This configuration allowed the two gas feeds to respond to different process signals while limiting excessive H
2 accumulation and maintaining the selected dissolved-CO
2 condition. During biomethanation, the consumption of gaseous substrates resulted in a gradual decrease in gas-phase pressure. Since the gas volume remained constant and part of the water vapor condensed due to supersaturation, the pressure decrease was accompanied by a progressive increase in methane concentration in the gas phase. When the pressure decreased to 1175 mbar(a), corresponding to a 225 mbar(a) reduction from the maximum operating pressure (1400 mbar(a)), the control system initiated the discharge of the produced gas. The discharge valve was subsequently closed once the pressure reached 1100 mbar(a), thereby starting a new operational cycle (
Figure 2).
The produced gas was collected in 10 L Tedlar® bags. Daily gas production was calculated as the sum of the gas volume recovered in the bags and the residual gas volume present in the gasometer at the end of each measurement interval. To ensure uninterrupted operation over weekends, three 10 L bags were installed every Friday to accommodate the expected gas production. Starting from Monday, daily measurements of the produced gas volume and its volumetric composition were carried out for all cycles occurring during that day.
Regarding liquid-phase operation, the reactor was operated in a sequential fed-batch regime with an average hydraulic retention time (HRT) of 10 days to minimize biomass washout. Digestate withdrawal and replenishment were adjusted during weekdays to maintain a constant working volume throughout the experiment. Although liquid feeding was temporarily interrupted during weekends, continuous gas supply and recirculation were maintained. The potential influence of this discontinuous feeding regime on reactor stability and VFA accumulation was considered during data interpretation. Both the feed hopper and the digestate discharge valve were integrated into the liquid recirculation circuit, which also housed the sensors for pH and dissolved CO2 monitoring.
All process parameters were monitored and controlled through an integrated automation system. Sensors for the online measurement of temperature, dissolved CO2 concentration, and pH were directly connected to a PC via the Modbus RS-485 communication protocol. The analog pressure sensor and gas-discharge valve were connected to and controlled through an Arduino board, which was also interfaced with the same PC.
The mass flow controllers used for hydrogen and carbon dioxide injections were also connected to the PC through the Modbus RS-485 communication protocol. The entire monitoring and process control system, including the Arduino-based hardware, was managed by a MATLAB (R2024a)-based control script that ran continuously in a loop to enable real-time supervision and automatic regulation of operating conditions. All measured data were recorded, and the control script is provided as
Supplementary Materials.
The MATLAB code provided as
Supplementary Method S1 corresponds to the control script used during Stage III. The same control structure was used during Stages I and II, with the dissolved-CO
2 reference and the corresponding switching thresholds adjusted to 25 and 17 mg L
−1, respectively. The numerical interval implemented around the 2 mg L
−1 reference represented a switching condition within the control logic and should not be interpreted as the analytical accuracy or as a validated control tolerance. According to the manufacturer’s specifications, the sensor measurement range is 5–1000 mbar CO
2, corresponding to approximately 7.5–1500 mg L
−1 in water at 25 °C and 101.3 kPa. The nominal accuracy at 25 °C is ±5 mbar within the range of 5–100 mbar and ±5% at values above 100 mbar. The Hamilton CO
2NTROL RS485 sensor was calibrated once per week according to the manufacturer’s instructions, and the dissolved-CO
2 signal was acquired by the control system at a frequency of 1 Hz. Because the 2 mg L
−1 reference was below the stated lower measurement range, this value was treated as a nominal control reference defining a low-dissolved-CO
2 operating regime rather than as an accurately quantified concentration. The operating conditions used throughout the experiment are reported in
Table 2.
The experimental period was structured into three operational stages to evaluate reactor performance under progressively lower molecular dissolved-CO2 operating references. This stepwise strategy avoided abrupt changes in the control reference and allowed the response of the reactor to decreasing molecular dissolved-CO2 availability to be assessed. Stage I (Days 1–18), with the dissolved CO2 setpoint maintained at 25 mg L−1, represented the start-up period and focused on activating and acclimating the hydrogenotrophic methanogenic community. Stage II (Days 19–38), with the CO2 setpoint lowered to 17 mg L−1, served as the adaptation stage, during which the system response to dynamic H2/CO2 feeding and pressure-based control was evaluated. Stage III (Days 39–58), operated using a nominal dissolved-CO2 reference of 2 mg L−1, corresponded to the stable operation stage and allowed the assessment of methane-production stability.
2.4. Gas and Liquid Analysis
At the end of each feeding–conversion cycle, the decrease in reactor pressure to the discharge threshold triggered the release of the produced gas. Because discharge was controlled by total pressure rather than by confirmed complete H2 depletion, residual hydrogen could remain in the headspace and discharged gas.
The produced gas was then discharged, and fresh process gases were introduced to start the next cycle. Total daily gas production was calculated from the sum of the volume collected in the gas bag and the volume remaining in the gasometer. All measured volumes were normalized to standard temperature and pressure conditions (273.15 K, 1 atm). Daily gas samples were analyzed in duplicate to ensure accuracy and reproducibility. The composition of the produced gas was analyzed using a micro gas chromatograph (Fusion micro-GC system with three columns). The system was equipped with a Backflush 1.0 µL Rt-Molsieve 5A column (10 m) for the quantification of H2, O2, N2, CH4, and CO, and an Rt-Q-Bond column (12 m) for CO2 analysis.
Liquid-phase samples were collected daily to measure VFAs and alkalinity (expressed as mg CaCO3 eq/L) using the Fos/Tac method (HACH LANGE). These parameters were monitored daily to ensure effective reactor operation and process control. The pH was measured daily using a pH meter (Thermo Orion 4 Star, Beverly and Waltham, MA, USA).
All parameters mentioned above were measured in duplicate.
2.5. Analytical Methods and Calculations
2.5.1. Methane Evolution Rate
The MER quantifies the volume of methane produced over a specified timeframe relative to the reactor volume and is calculated using Equation (3).
where Q
gas is the total daily normalized biogas volume expressed daily (NL d
−1), CH
4 is the methane concentration in the produced gas (%
v/
v), and V
R is the liquid reactor volume (L).
2.5.2. H2 Utilization Efficiency
H
2 utilization efficiency was calculated as follows:
ƞ
h: Hydrogen Utilization efficiency (%), R
H in: Total hydrogen supplied to the system (mL/L
VR/d), R
H out: Discharged hydrogen (mL/L
VR/d).
3. Results and Discussion
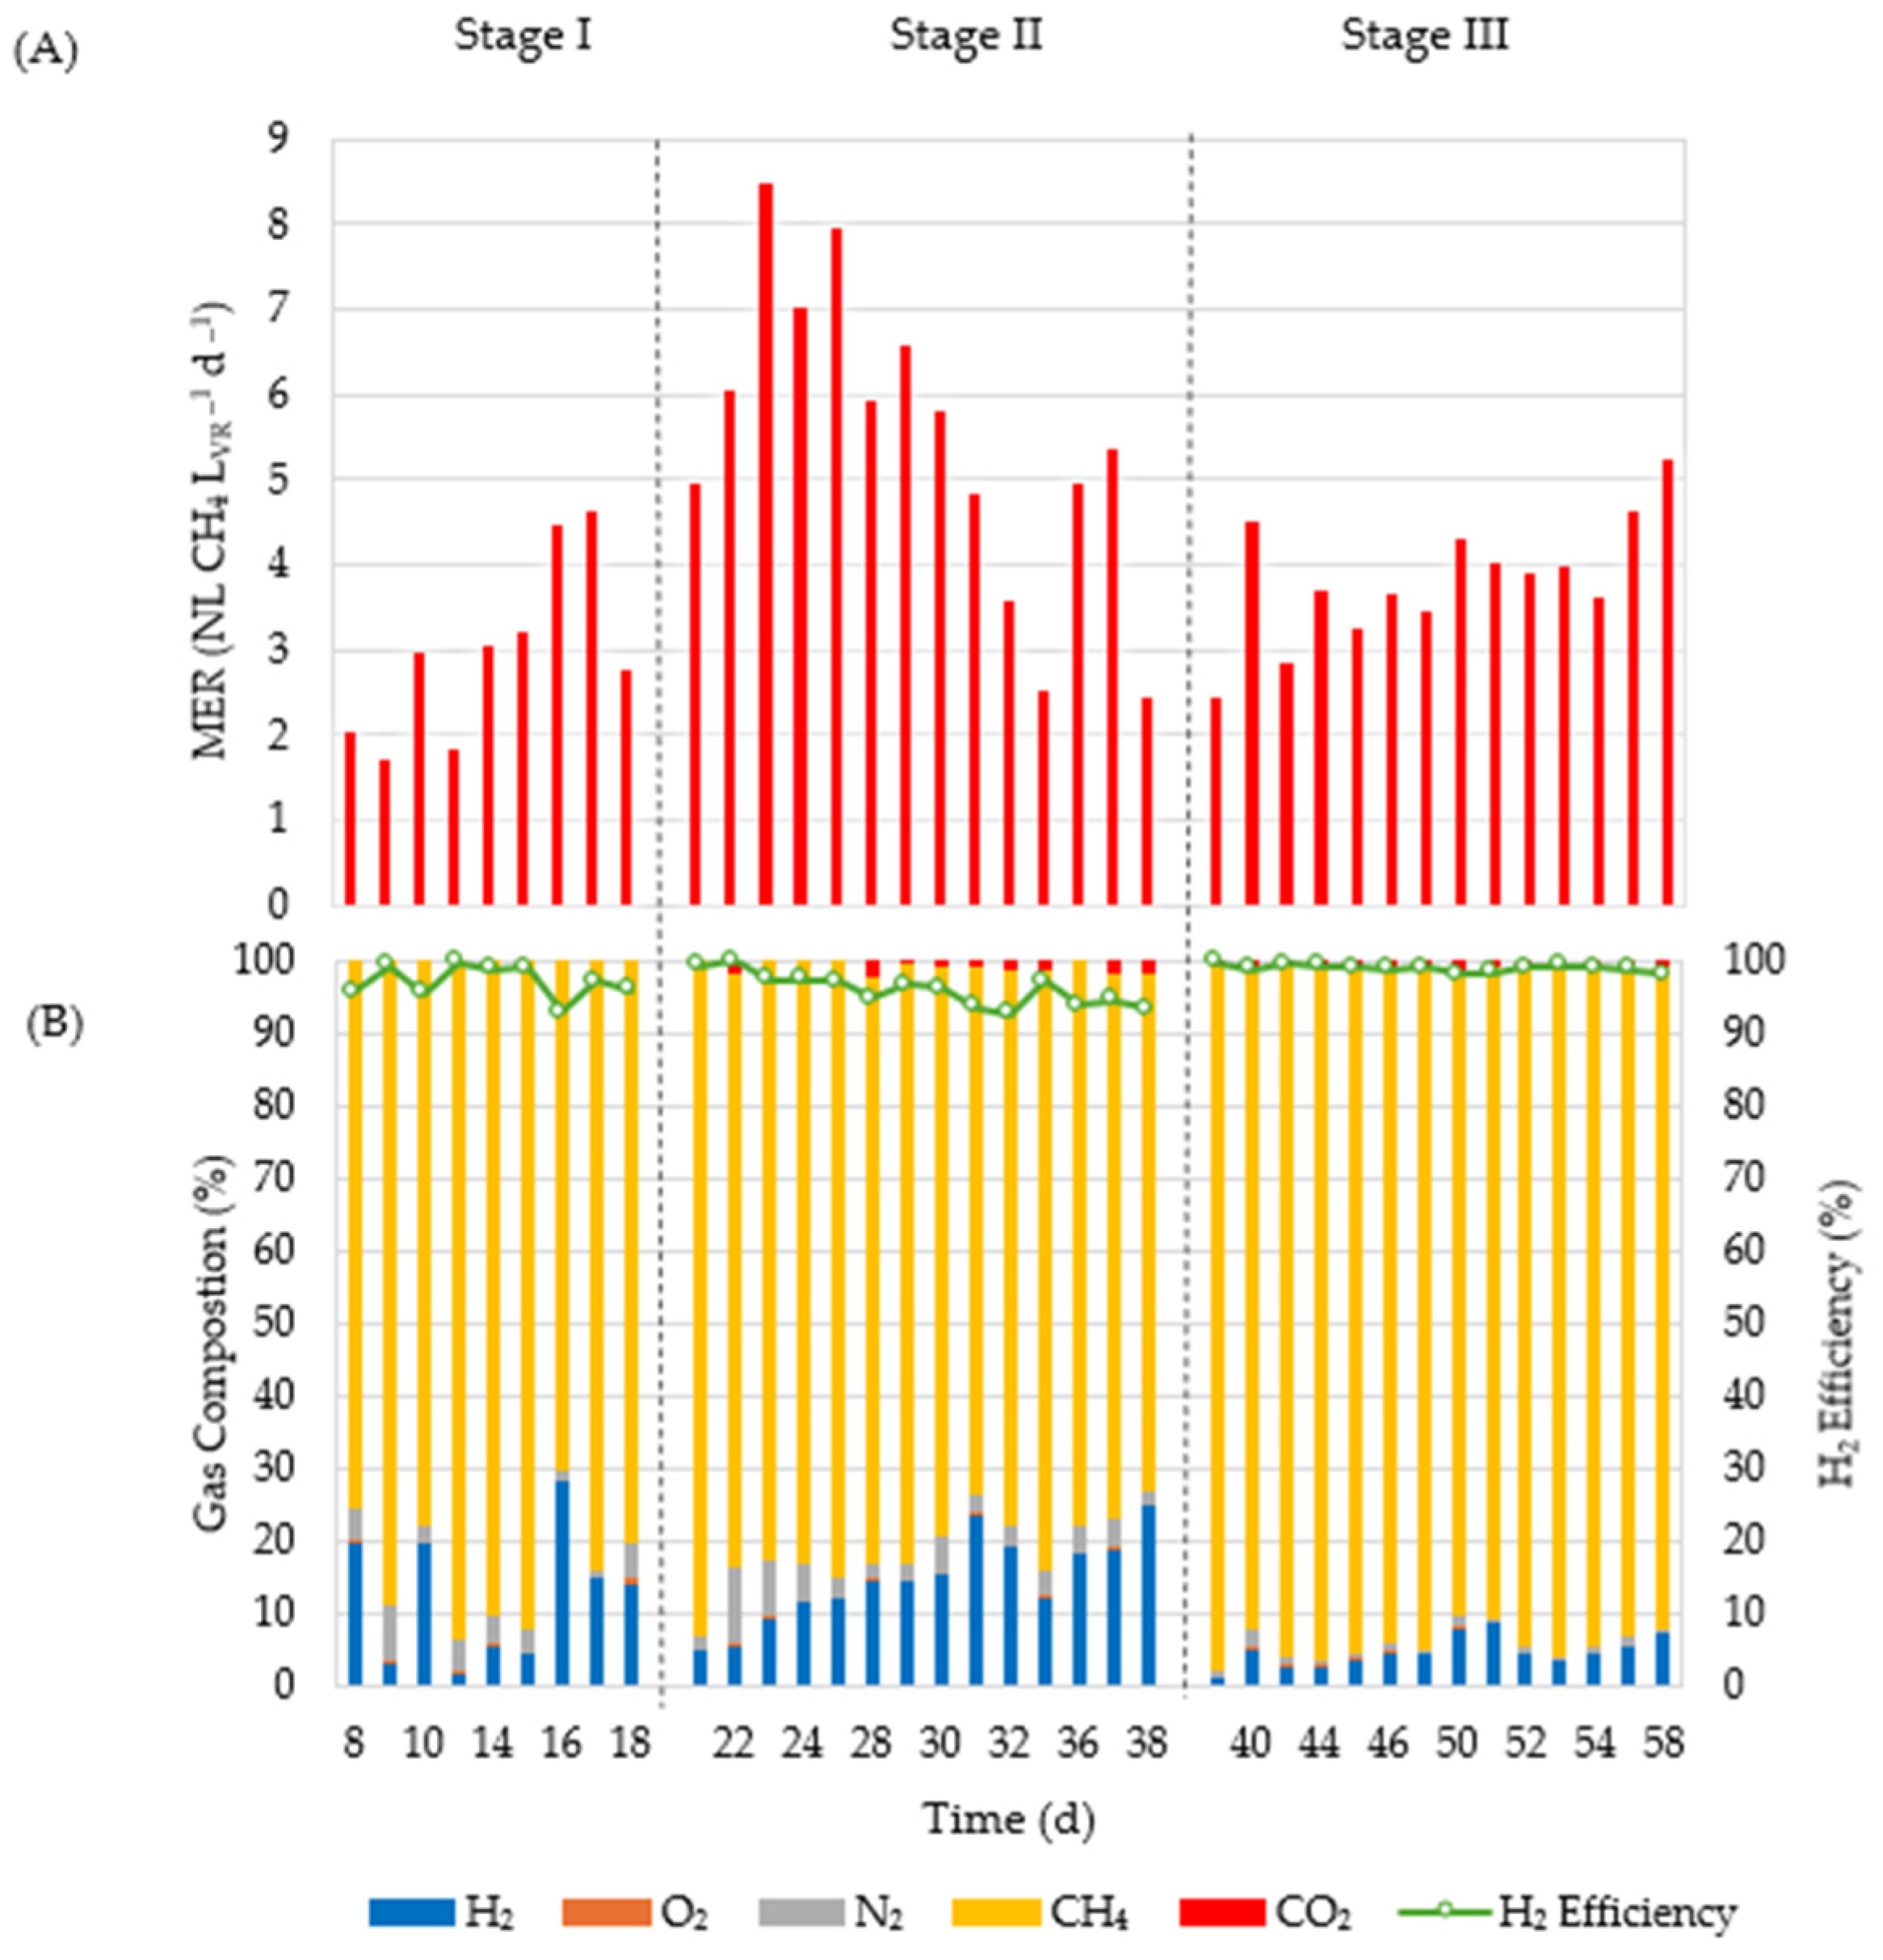
Reactor performance and stability were evaluated throughout the experimental period by monitoring the MER (NLCH
4 L
VR−1 d
−1) and outlet gas composition, shown in
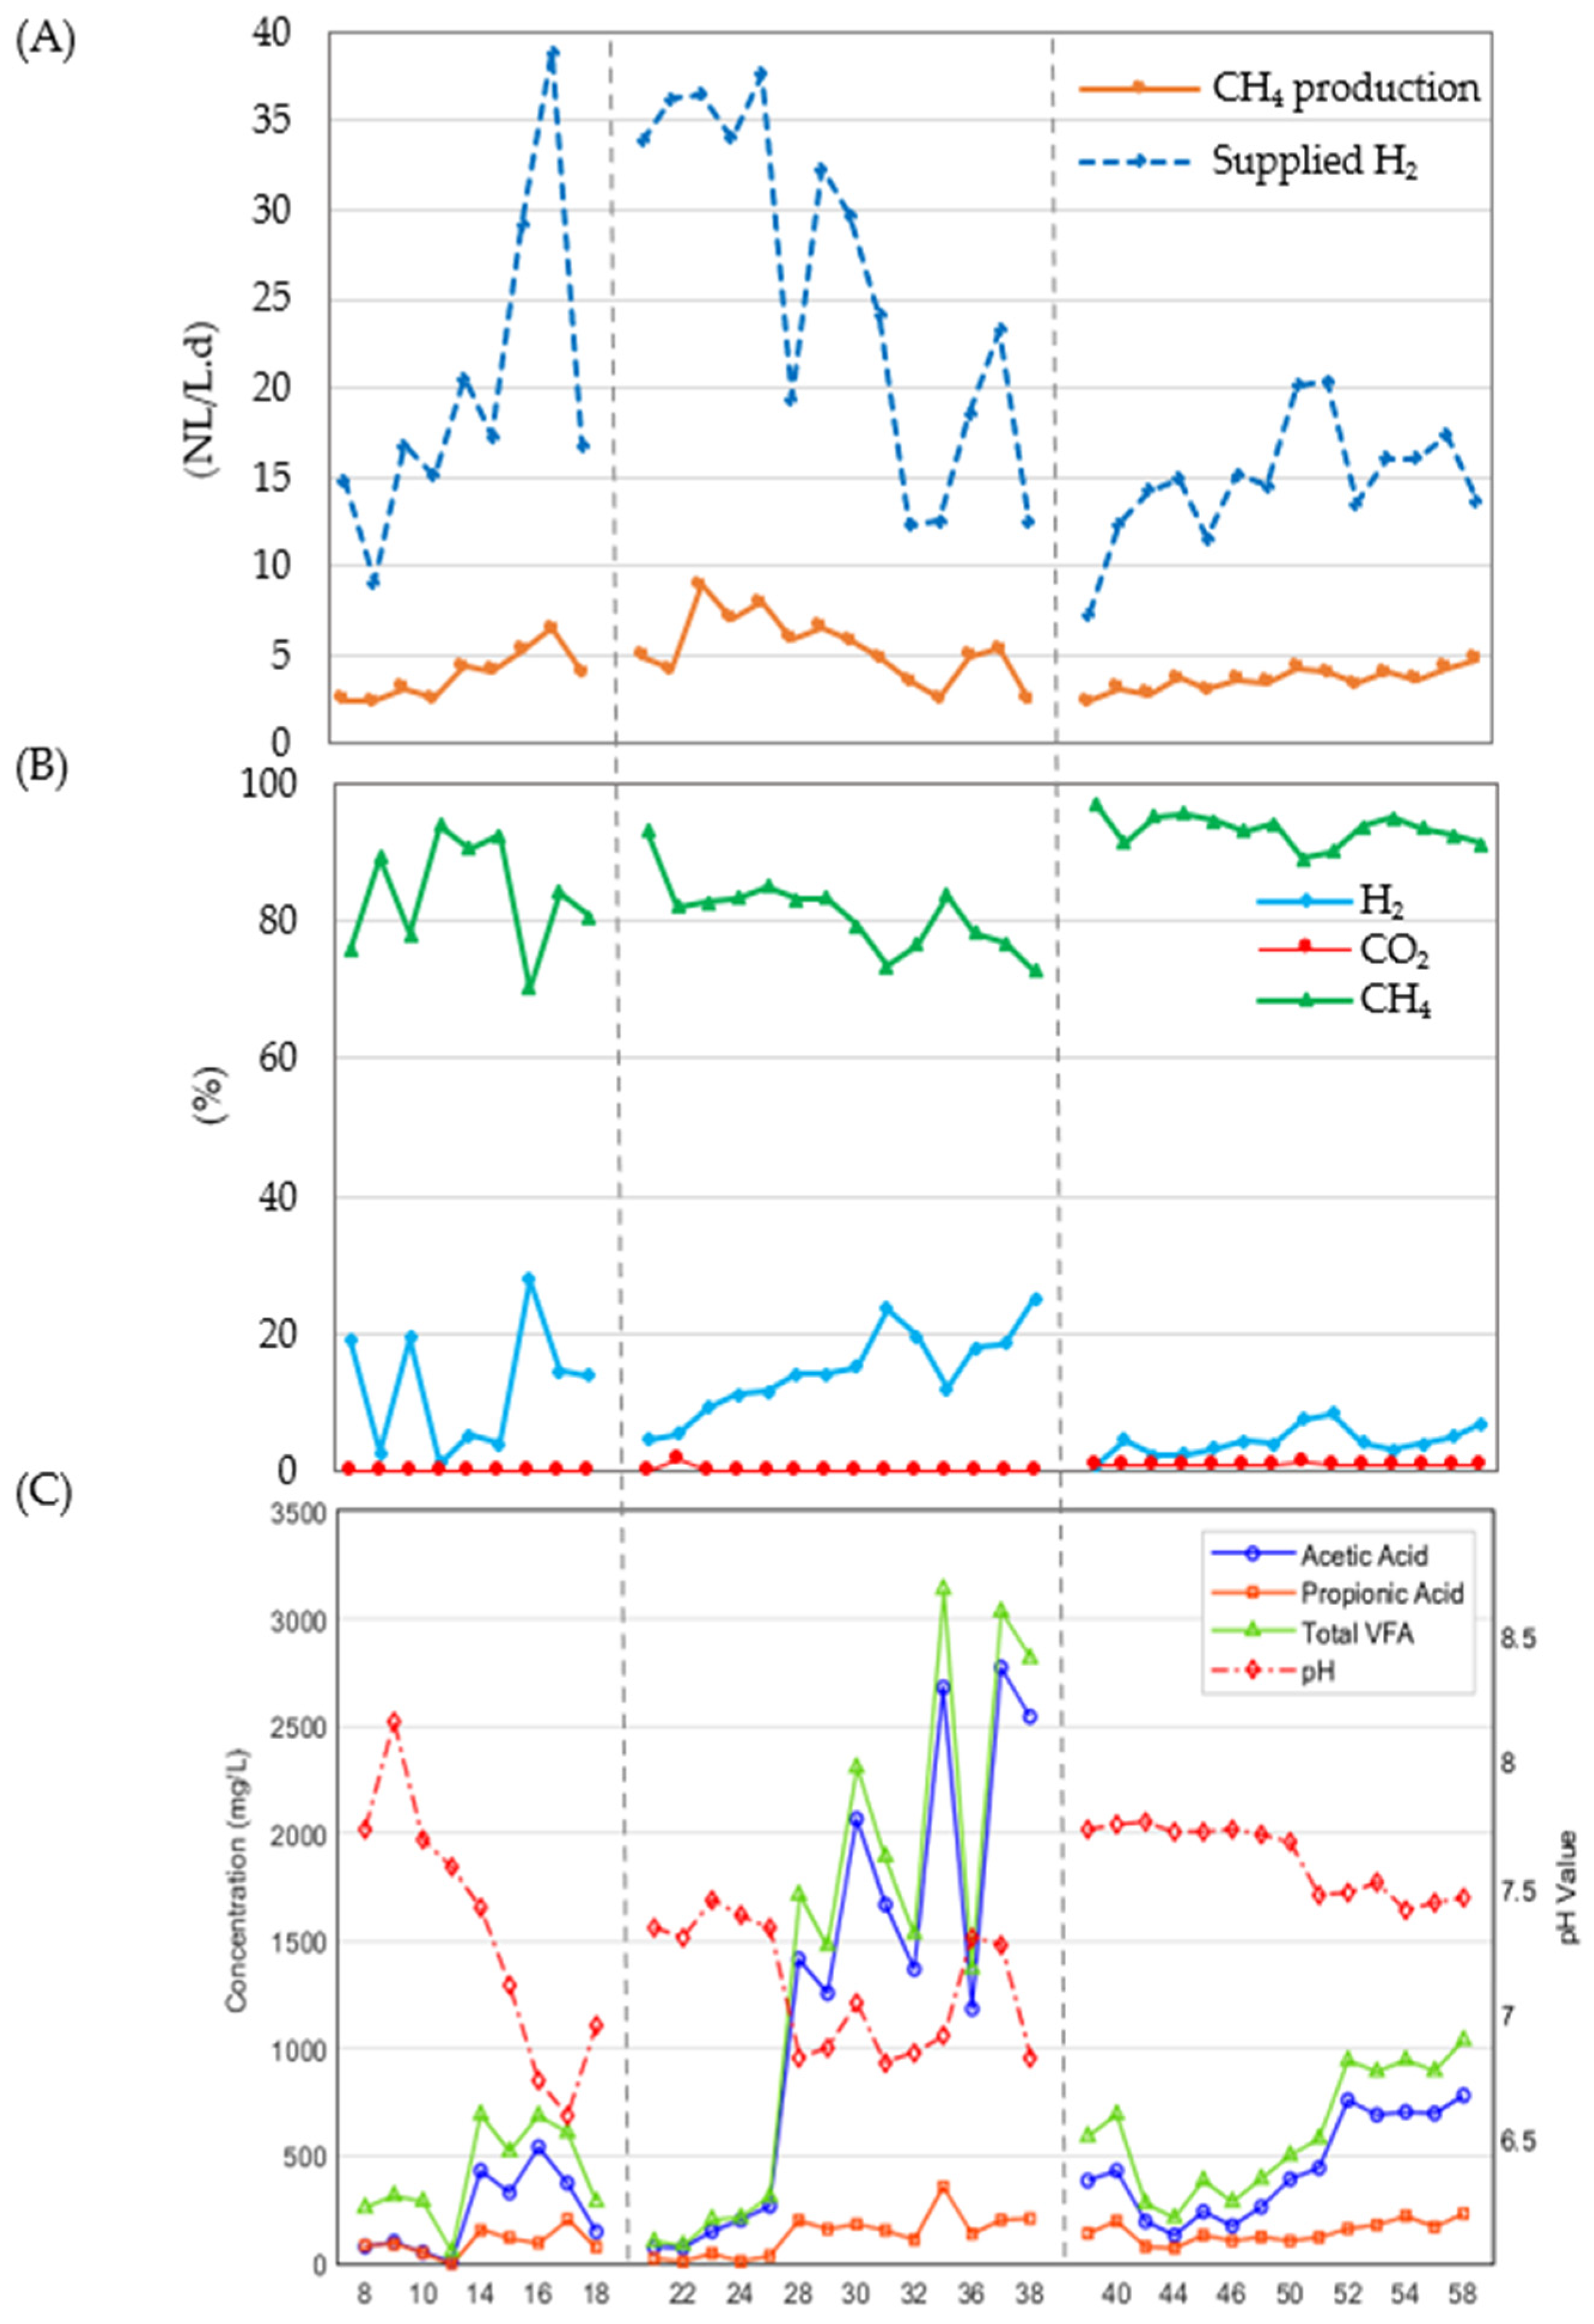
Figure 3. The operational cycle profile presented in
Figure 2 showed cycle durations ranging from approximately 0.5 to 1 h, depending on microbial activity and gas consumption rates. Each cycle consisted of three sequential phases: (i) gas injection, (ii) biological conversion under sealed conditions, and (iii) gas release. Variations in cycle duration reflected changes in the net rate of gas consumption and were therefore used as an operational indicator of reactor activity rather than as a pathway-specific measure of microbial conversion efficiency.
3.1. Stage I—Start-Up Phase (Microbial Acclimation)
The start-up phase was conducted at a dissolved CO2 setpoint of 25 mg L−1 to support the initial microbial acclimation and establish stable biomethanation activity. During Days 1–7, the reactor showed unstable performance, characterized by variable hydrogen feeding and limited methane production, as expected under start-up conditions. This behavior is consistent with a start-up period during which stable H2-consuming methanogenic activity had not yet been established. Therefore, data from the first seven days were excluded from the subsequent performance analysis.
After approximately day 8, the reactor performance began to stabilize, with methane concentration increasing to around 75% and the MER reaching approximately 2 NLCH
4 L
VR−1 d
−1. During this transitional period, MER still exhibited noticeable fluctuations, ranging between 2 and 4.6 NLCH
4 L
VR−1 d
−1 (
Figure 3A). The observed fluctuations in MER and the residual H
2 concentration in the outlet gas are consistent with incomplete stabilization of H
2 conversion during the early operational period, resulting in lower methane concentrations and higher residual H
2 in the discharged gas [
26]. Although the observed increase in MER was temporary, methane production progressively stabilized during the following operational period. By the end of the stage, methane concentration in the outlet gas stabilized at approximately 83%. Residual hydrogen accounted for about 12% of the outlet gas composition, corresponding to an overall hydrogen utilization efficiency of approximately 97% (
Figure 3B). Applying Equation (4) to the cumulative supplied and discharged H
2 volumes of 249.78 and 8.20 NL, respectively, yielded a hydrogen utilization efficiency of 96.72%. The 12% residual H
2 represents the instantaneous volumetric composition of the discharged gas and is therefore not directly complementary to the hydrogen utilization efficiency, which is based on the cumulative supplied and discharged H
2 volumes. At this relatively high dissolved CO
2 level (25 mg L
−1), the pH and alkalinity profiles did not indicate severe inorganic-carbon limitation or loss of buffering capacity during the acclimation period.
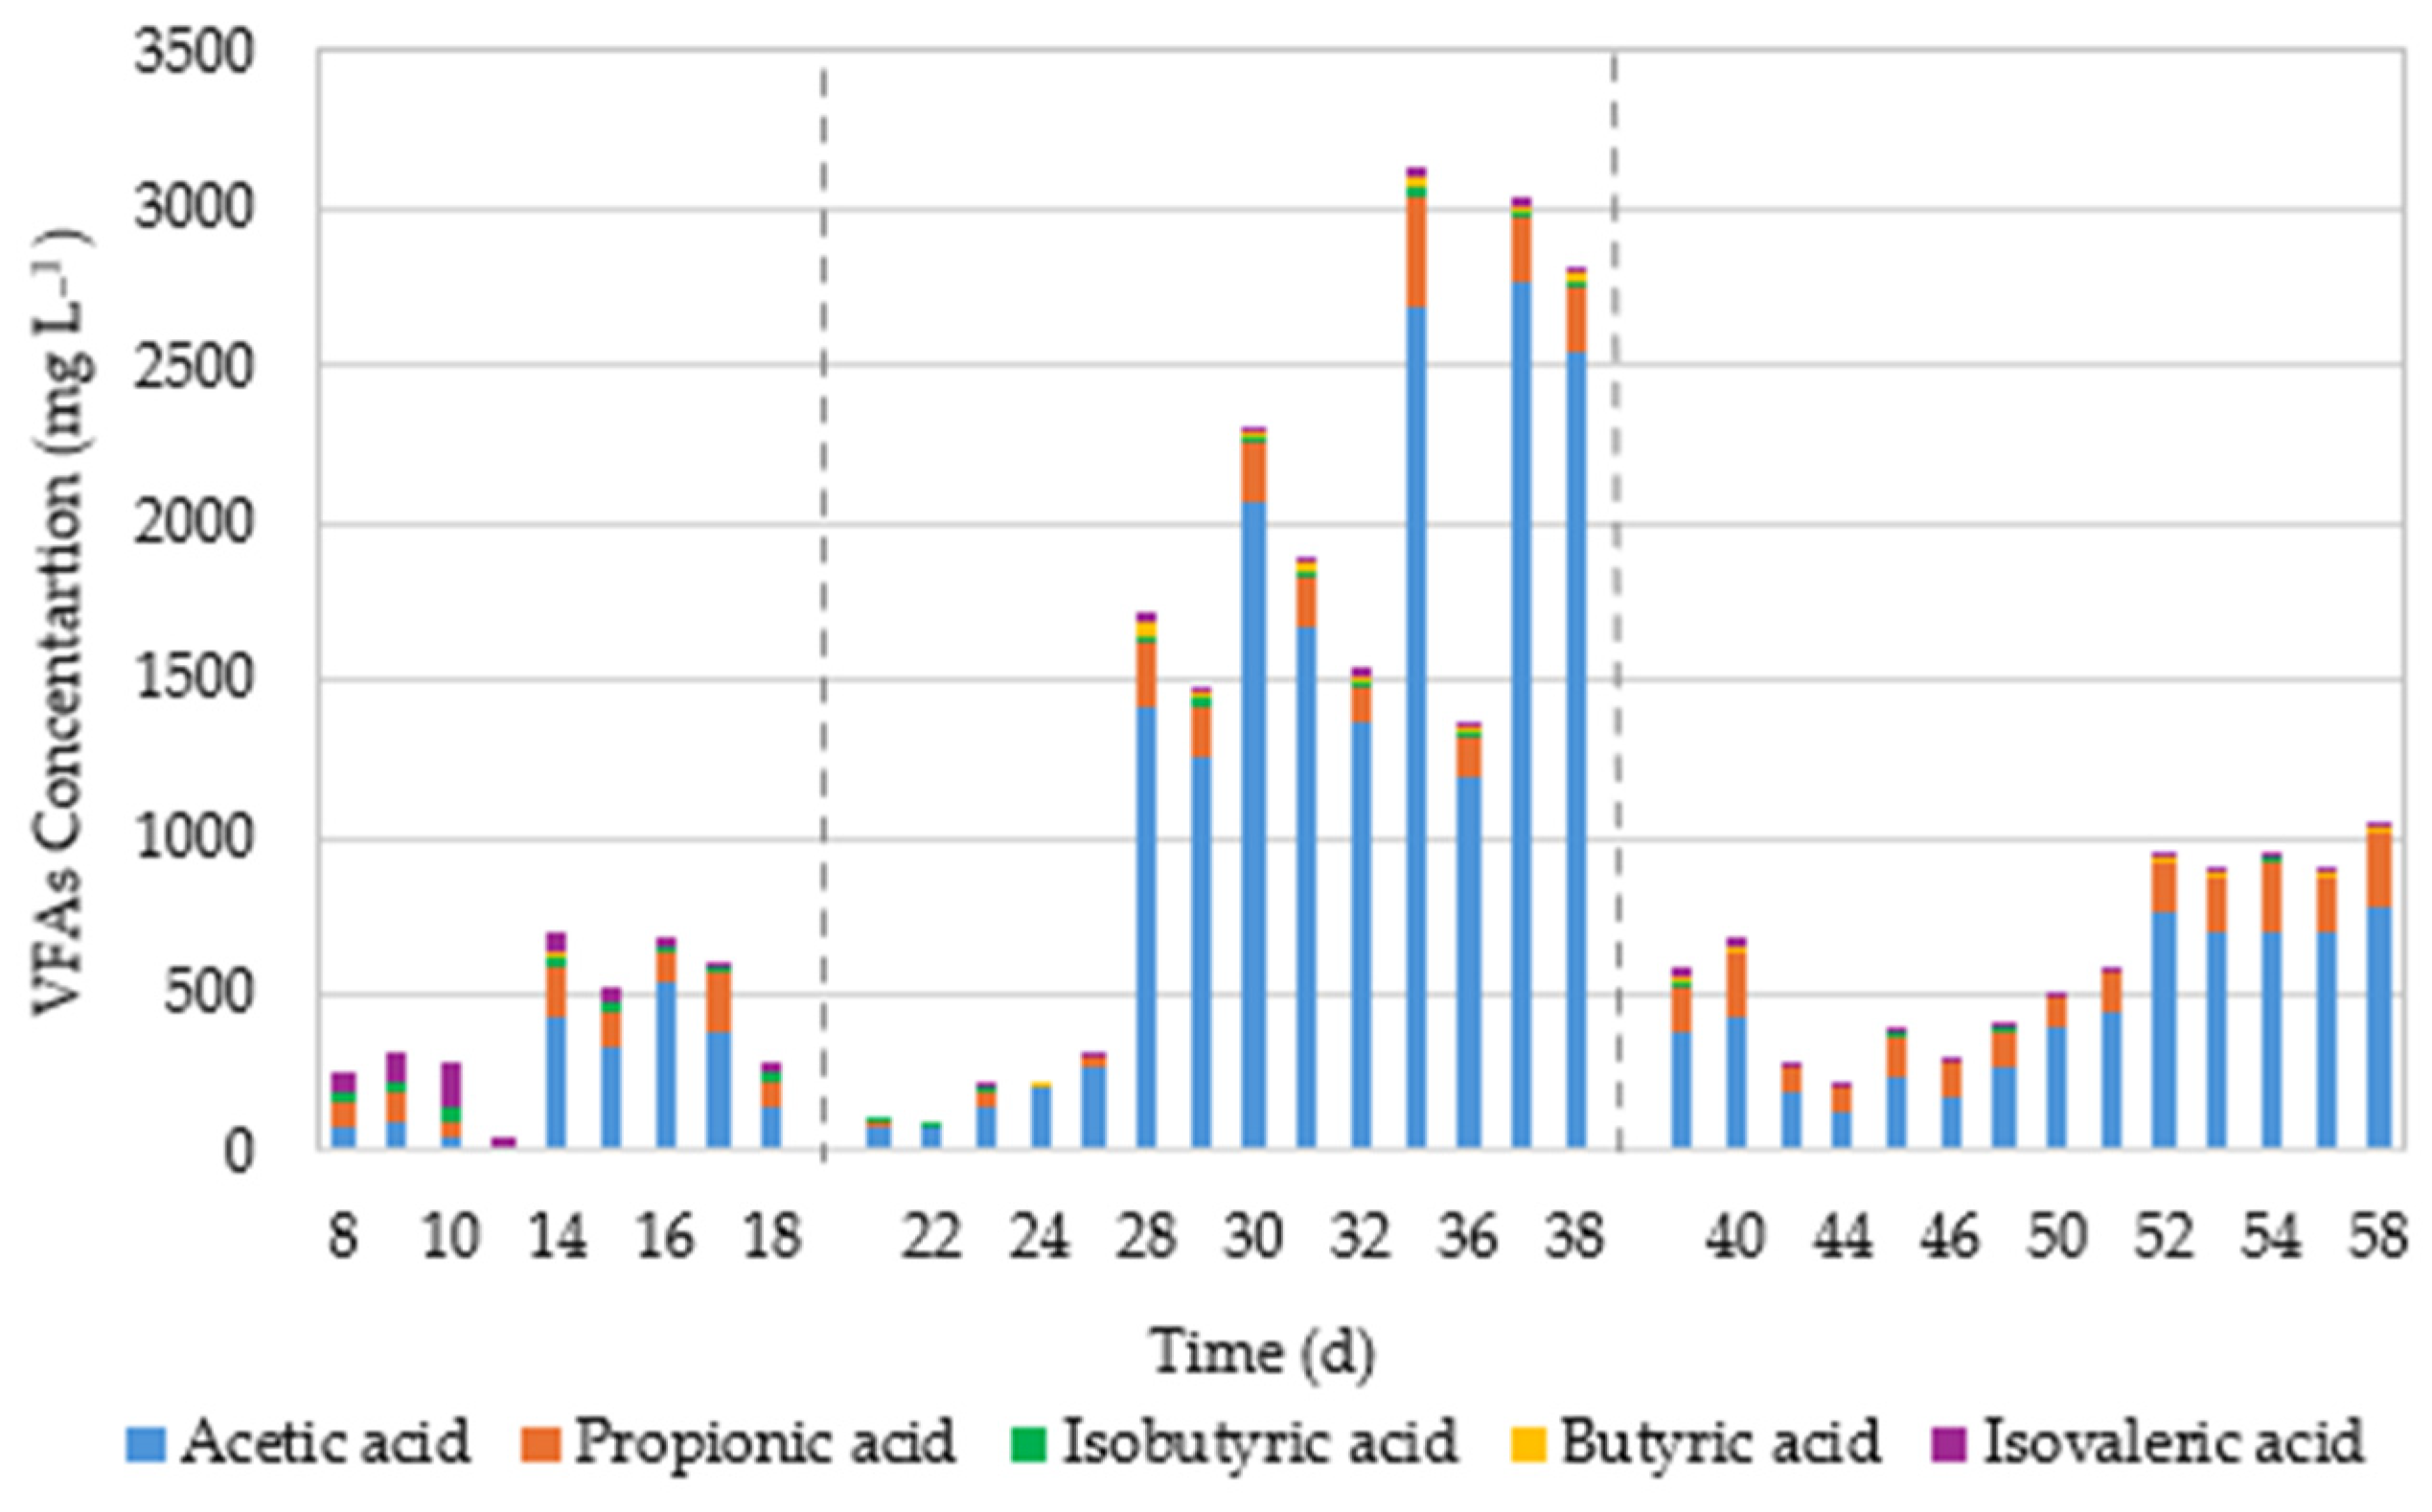
During this stage, the total VFA concentration remained relatively low, averaging 412 ± 222 mg L
−1. This moderate level indicated that start-up was not accompanied by the excessive accumulation of organic intermediates and supported the overall stability of the reactor [
22,
30]. Acetic acid was the dominant VFA, accounting for approximately 56% of the total concentration (229 mg L
−1), followed by propionic acid at 24% (97 mg L
−1) and isovaleric acid at 15% (62 mg L
−1) (
Figure 4). The average pH during this stage was approximately 7.31 (
Figure 5C), which remained within a suitable range for methanogenic activity.
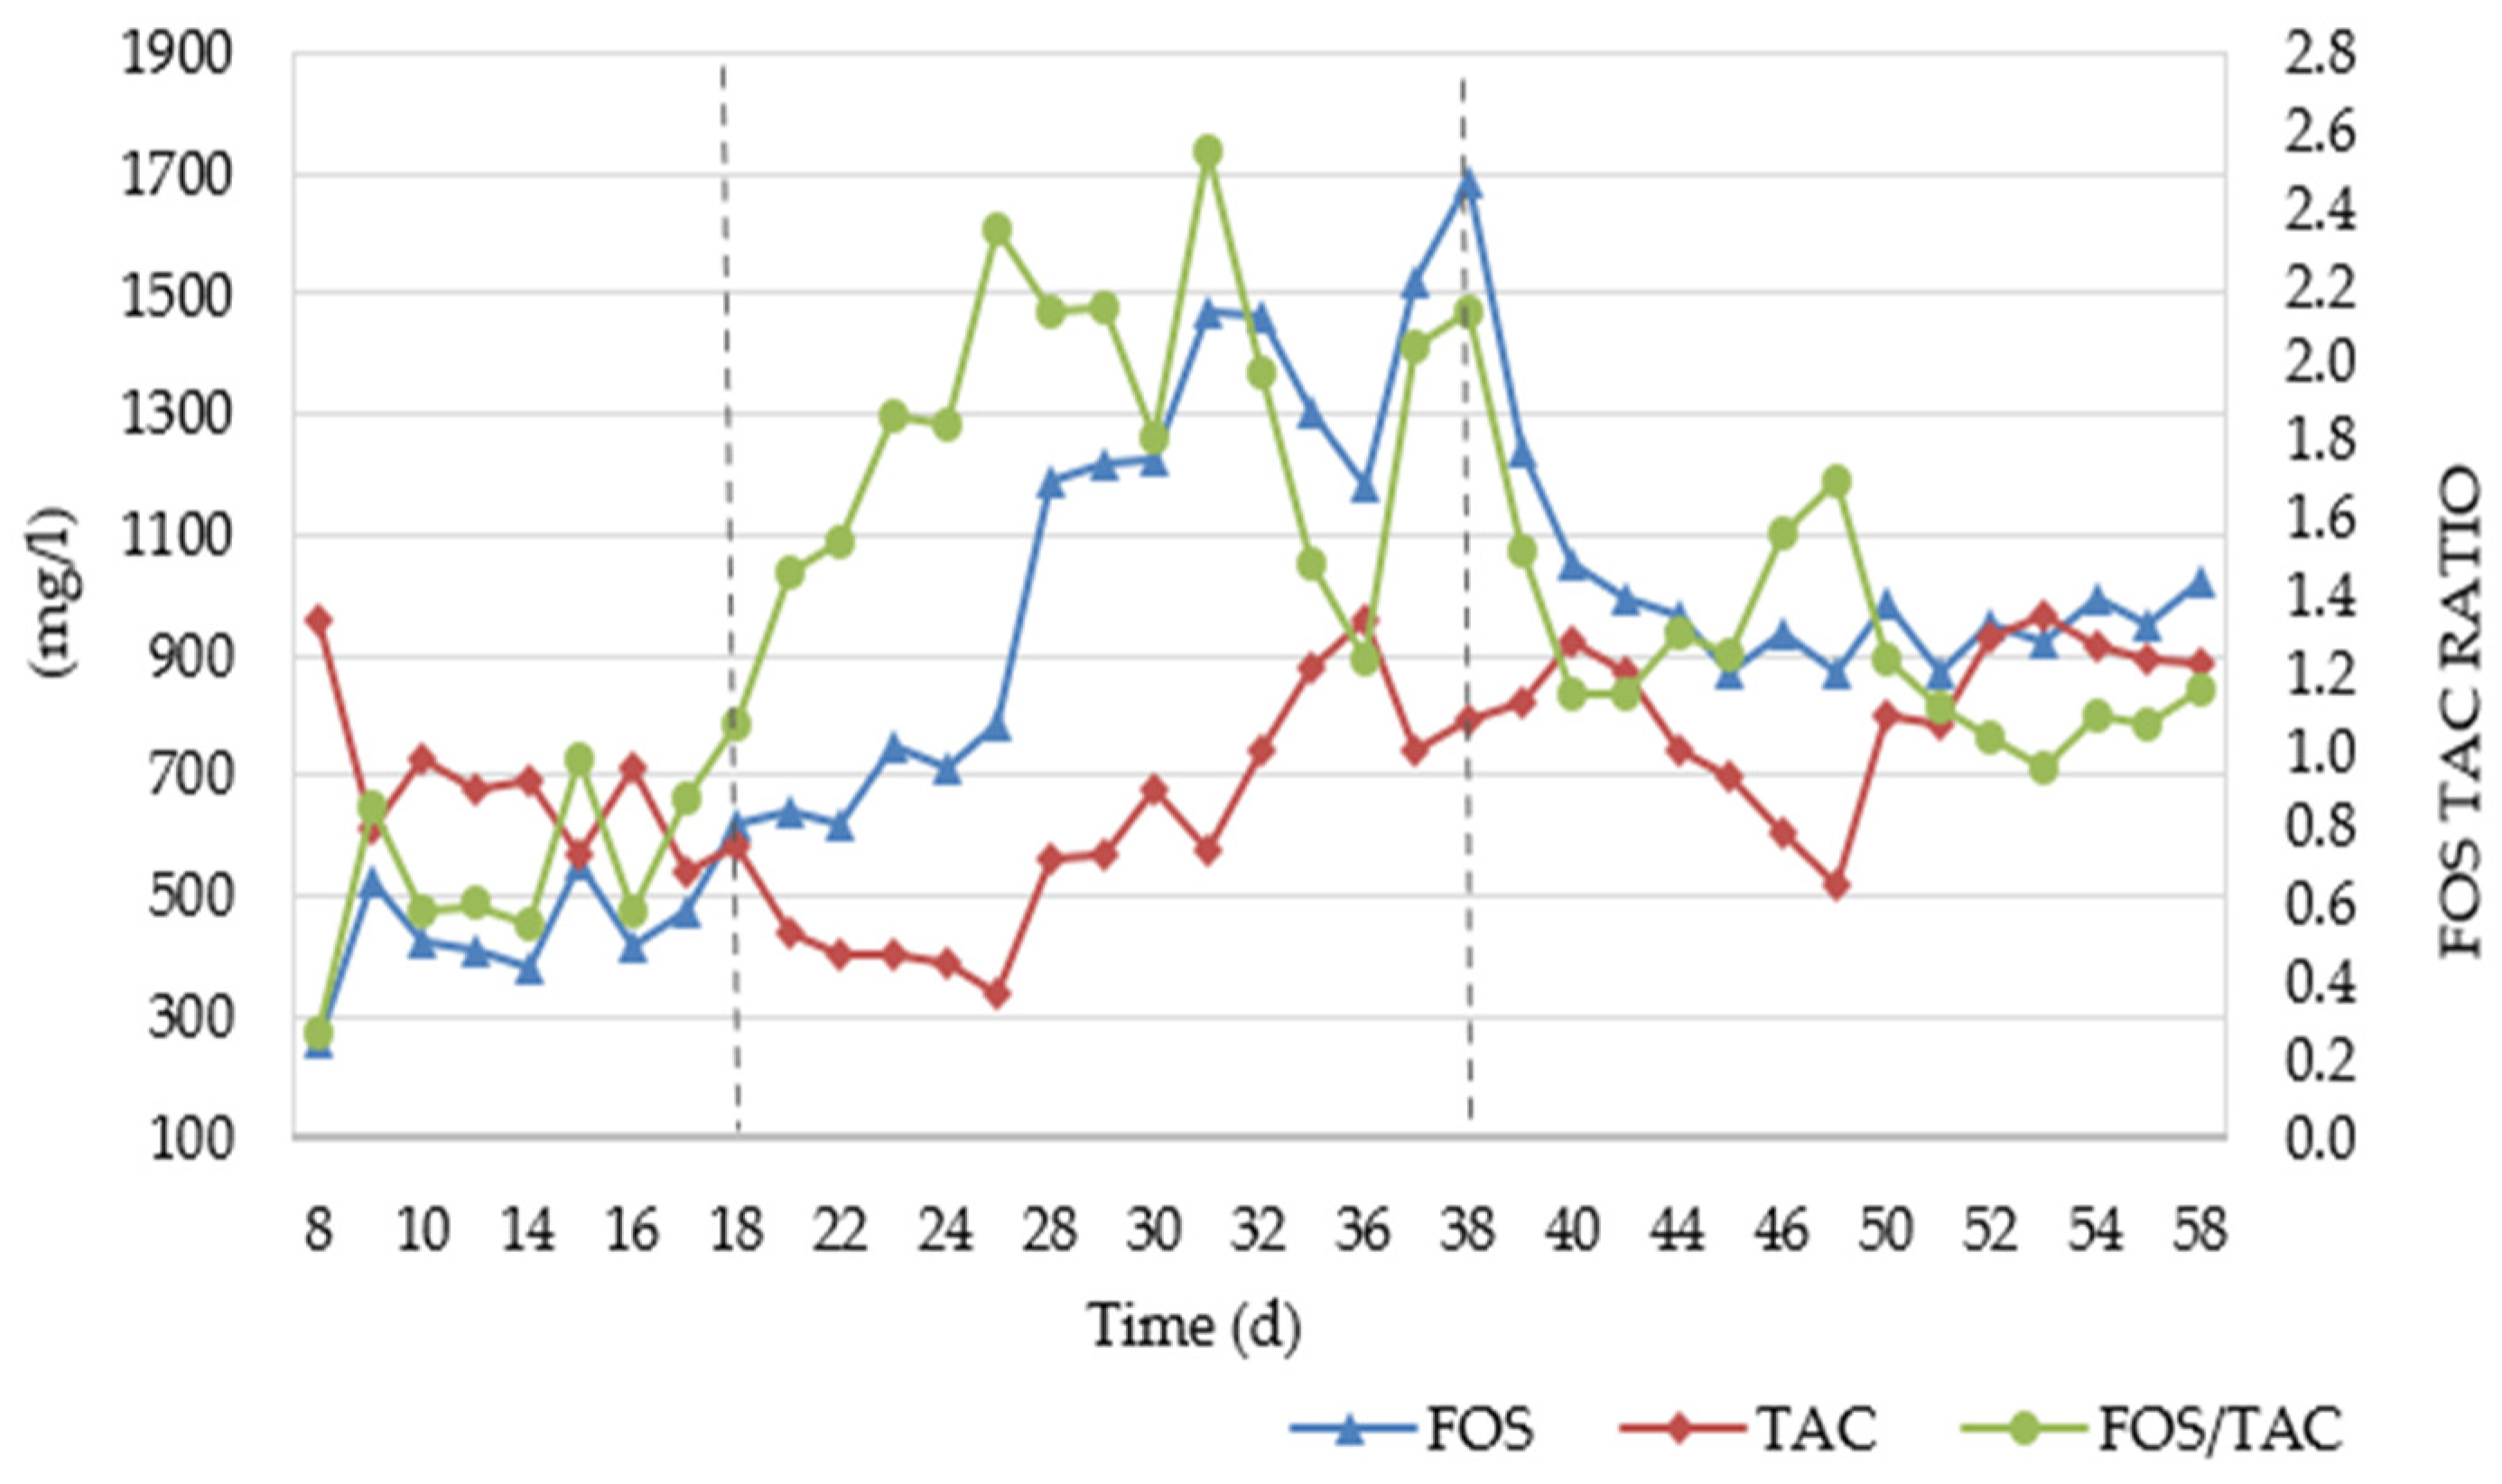
As shown in
Figure 6, total alkalinity (TAC) decreased progressively, accompanied by a decline in bicarbonate concentration. This pattern indicated gradual depletion in the bicarbonate-buffering capacity, potentially because of biological CO
2 conversion and changes associated with microbial acclimation. Consequently, the FOS/TAC ratio gradually increased but generally remained below 1.0, suggesting that sufficient alkalinity and buffering capacity were still maintained despite moderate VFA accumulation and temporary fluctuations in the methanogenic activity. The relatively stable pH observed throughout this period further confirms that bicarbonate alkalinity effectively prevented severe acidification.
Overall, CH4 production stabilized during Stage I without evidence of severe VFA accumulation or acidification. Following this acclimation period, dissolved CO2 concentration was reduced to 17 mg L−1, marking the transition to Stage II reactor operation.
3.2. Stage II—Adaptation Phase
During Stage II (days 19–38), the dissolved CO
2 concentration was maintained at 17 mg L
−1. Under this lower setpoint, the MER initially increased as H
2 loading, and CH
4 production rose. As shown in
Figure 5A, during Stage II, the H
2 loading rate averaged 29.2 ± 9.6 NL H
2 L
VR−1 d
−1. A peak daily value of 34.5 NL H
2 L
VR−1 d
−1 was recorded on Day 23 and coincided with a peak MER of approximately 8.5 NL CH
4 L
VR−1 d
−1, while the CH
4 concentration remained around 83%. Following this peak, the H
2 loading rate decreased, while the MER gradually declined and stabilized between 5.5 and 6.0 NL CH
4 L
VR−1 d
−1. Although CH
4 productivity remained relatively high, its concentration in the outlet gas decreased progressively to approximately 79.4%, accompanied by a reduction in H
2 utilization efficiency to 96.18% (
Figure 3B).
The decrease in CH
4 concentration coincided with the accumulation of VFAs, particularly acetic and propionic acids, together with a temporary decrease in pH (
Figure 5C). These changes suggest that the reactor experienced a temporary imbalance between VFA-forming and methane-forming processes during Stage II [
25]. A clear manifestation of this effect occurred during the weekend, when liquid feeding and digestate withdrawal were interrupted, whereas H
2 and CO
2 supply and gas recirculation continued. During this period, the liquid phase therefore operated under batch conditions.
As a result, total VFA concentration increased from 310 mg L
−1 on Day 25 (Friday) to 1717 mg L
−1 on Day 28 (Monday), as shown in
Figure 5C. Simultaneously, the pH decreased from above 7.3 to 6.9, indicating temporary acidification and reduced buffering capacity. Because no liquid exchange occurred during the weekend, the observed concentration increase may have resulted from both net VFA formation and the absence of VFA dilution and removal. The increase cannot therefore be attributed exclusively to homoacetogenesis. Nevertheless, continued gas feeding, decreasing pH, and possible pH-related inhibition of methane-forming activity may have allowed competing H
2-consuming pathways, including homoacetogenesis, to contribute to acetate accumulation [
31]. This interpretation remains a mechanistic hypothesis because the activities of the relevant microbial groups were not directly measured.
Elevated VFA concentrations persisted throughout stage II, reaching a peak value of 3136 mg L
−1 on day 35. The marked increase in acetate concentration is consistent with a possible contribution of homoacetogenic activity, according to the following reaction:
The FOS and TAC profiles also indicated temporary process instability. As VFA accumulation intensified, FOS increased substantially, while TAC decreased or fluctuated, causing the FOS/TAC ratio to exceed 2.0 (
Figure 6). This increase closely corresponded with reductions in pH and CH
4 concentration, suggesting that acid formation temporarily exceeded the methanogenic conversion capacity of the reactor. The elevated FOS/TAC ratio therefore indicated stress on the bicarbonate-buffering system and reduced process stability during Stage II.
Although changes in VFA concentration coincided with variations in MER and outlet-gas composition, these temporal relationships do not identify the responsible metabolic pathway. Methane and acetate formation could affect the pressure-controlled cycle differently because of the different stoichiometry and phase partitioning of their products. Methane has low aqueous solubility and rapidly contributes to the gas phase, whereas acetate remains predominantly in the liquid phase under the operating conditions [
31].
The corresponding net reduction in the dry-gas inventory is approximately four moles. By contrast, homoacetogenesis consumes four moles of H
2 and two moles of CO
2 and produces acetate and water, both of which remain predominantly in the liquid phase. Its corresponding net reduction in the dry-gas inventory is therefore 6 moles. These calculations assume that consumed dissolved CO
2 is replenished from the gas supply. For an equivalent amount of H
2 consumption, acetate formation could therefore produce a greater decrease in total reactor pressure than methanogenesis [
28].
Gas discharge was triggered when the total reactor pressure reached 1175 mbar(a), rather than after confirmed depletion of H2. A more rapid pressure decrease could therefore cause the discharge threshold to be reached after a smaller amount of H2 had been consumed, resulting in a higher residual H2 fraction in the headspace and discharged gas. This mechanism could have contributed to the lower CH4 concentration and higher residual H2 fraction observed during Stage II and may also have affected the duration and frequency of the operational cycles. However, it does not independently explain the variation in MER and cannot be considered direct evidence of homoacetogenesis. The increase in MER is therefore reported as an operational observation rather than being mechanistically attributed to acetate formation.
This mechanistic interpretation is consistent with previous studies showing that H
2 partial pressure, gas–liquid mass transfer, and thermodynamic constraints can affect the competition between hydrogenotrophic methanogenesis and homoacetogenesis [
13]. However, neither time-resolved gas-phase H
2 partial pressure nor dissolved H
2 concentration was measured in the present study. Dissolved H
2 availability depends not only on gas-phase H
2 partial pressure, but also on gas–liquid mass transfer, the volumetric mass-transfer coefficient (kLa), reactor hydrodynamics, and the biological H
2 uptake rate [
9]. Consequently, the Gibbs free energy of the competing pathways could not be determined under the actual reactor conditions. The weekend effect should therefore be interpreted as the possible combined result of continued gas supply, interruption of liquid feeding and digestate withdrawal, absence of VFA dilution and removal, pH decreases and possible pH-related inhibition, microbial kinetics, gas–liquid mass transfer, and competition among H
2-consuming pathways. The individual contributions of these factors could not be resolved from the available data.
Previous studies have reported that when the total VFA concentration exceeds approximately 1500 mg L
−1, metabolic pathways may shift toward alternative hydrogen-consuming routes such as homoacetogenesis [
32]. In the present system, the rapid increase in acetate concentration coincided with a decrease in pH to about 6.9, slightly below the optimal range for methanogenic activity. This decrease in pH indicates temporary buffering limitations and mild acidification of the liquid phase [
30]. At the same time, the CH
4 concentration decreased from approximately 83% to 79%. This pattern was consistent with temporarily reduced methanogenic performance and the accumulation of liquid-phase intermediates. Nevertheless, these measurements do not establish carbon partitioning between the gas and liquid phases or quantify the relative contributions of hydrogenotrophic methanogenesis, homoacetogenesis, and other biological pathways.
To restore pH stability and limit further acetate accumulation, dissolved CO2 regulation was modified as a corrective operational measure. The nominal setpoint was reduced from 17 to 2 mg L−1, marking the transition from Stage II to the low-dissolved-CO2 operating conditions of Stage III.
3.3. Stage III—Stable Operation Phase
Following the reduction in the dissolved CO2 setpoint from 17 to 2 mg L−1, the reactor progressively recovered, as indicated by increases in pH, CH4 concentration, and H2 utilization efficiency, together with a decrease in VFA concentration. The 2 mg L−1 value should be interpreted as a nominal control reference defining a low-dissolved-CO2 operating condition. Because this value was below the sensor’s validated measurement range, the system could not verify that dissolved CO2 was accurately maintained at 2 mg L−1 during Stage III.
From a stoichiometric and thermodynamic perspective, the reduction in dissolved CO2 availability may have affected both hydrogenotrophic methanogenesis and homoacetogenesis, because CO2 is a substrate for both pathways. However, homoacetogenesis requires 2 mol of CO2 per mole of acetate produced, whereas hydrogenotrophic methanogenesis requires 1 mol of CO2 per mole of CH4 produced. On a stoichiometric basis, lower CO2 availability may therefore have constrained acetate formation more strongly than methane formation. However, this difference alone does not establish the relative thermodynamic competitiveness of the two pathways. This interpretation could not be quantitatively verified because dissolved H2 concentration was not measured and the Gibbs free energy of the competing reactions could not be calculated under the actual reactor conditions. It cannot therefore be concluded that homoacetogenesis has become thermodynamically unfavorable.
The transition to the low-dissolved-CO
2 operating condition was accompanied by a decrease in total VFA concentration from 2800 mg L
−1 at the end of Stage II to about 618 mg L
−1 during Stage III (
Figure 5C). The average acetic acid concentration decreased to around 450 mg L
−1, while propionic acid declined to below 145 mg L
−1. At the same time, pH recovered and stabilized at 7.61. Concurrent increases in CH
4 concentration and H
2 utilization efficiency were consistent with improved methanogenic performance.
The observed process recovery likely resulted from the combined effects of lower dissolved CO2 availability, pH recovery, reduced H2 loading, consumption or removal of accumulated VFAs, and progressive adaptation of reactor activity. The individual contributions of these factors could not be distinguished using the available experimental data.
Under the stabilized Stage III conditions, hydrogen was supplied at an average loading rate of 15.9 NL L
VR−1 d
−1 (
Figure 5A), while the average MER reached 3.95 NLCH
4 L
VR−1 d
−1. This methane production rate corresponds to approximately one quarter of the hydrogen supply rate, on the same normalized volumetric basis, close to the theoretical maximum of 25% defined by hydrogenotrophic methanogenesis. The reactor achieved a methane concentration above 93.3% and an H
2 utilization efficiency of 99.2%, indicating low residual H
2 in the product gas. Although these results demonstrate the production of a CH
4-rich gas, assessment of compliance with gas-grid or vehicle-fuel standards would require characterization of the complete gas-quality profile [
13]. The operating conditions and overall reactor performance during the experimental period are summarized in
Table 3.
During this stage, the pH remained within the commonly reported range of 7.4–7.6 for methanogenic activity, supporting consistent CH
4 production [
33,
34]. The FOS/TAC profile (
Figure 6) also indicated improved process conditions compared with Stage II. The ratio declined to an average of 1.2, reflecting partial process recovery. TAC was relatively stable and generally higher than during Stage II, suggesting the partial recovery of bicarbonate-buffering capacity. In parallel, reduced fluctuations in FOS were consistent with lower VFA accumulation and an improved balance between VFA-forming and methane-producing processes. The decrease in the FOS/TAC ratio, together with pH recovery, coincided with the overall improvement observed after transition to the low-dissolved-CO
2 condition. However, the relative effects of CO
2 regulation, reduced H
2 loading, liquid exchange, and reactor adaptation could not be separated.
3.4. Cross-Stage Performance Assessment and Study Limitations
The values reported in
Table 3 were obtained from a single reactor and therefore describe temporal variability within the experimental run. Duplicate gas- and liquid-phase analyses were used to assess analytical repeatability and should not be considered independent biological replicates. Accordingly, the reported variability represents temporal and analytical variation rather than between-reactor variability.
MER is reported as the total measured methane evolution rate. Similarly, H2 utilization efficiency quantifies the fraction of supplied H2 that was not detected in the discharged gas and should not be interpreted as a pathway-specific H2-to-CH4 conversion yield. The overall average gas-phase H2 utilization efficiency calculated from the daily experimental data was 97.3%. The maximum potential contribution of organic matter supplied with the centrate was estimated using total chemical oxygen demand (tCOD), thereby accounting for VFAs as well as other soluble and particulate organic fractions in the feed. Given a tCOD concentration of 1.425 ± 0.254 g L−1, a reactor working volume of 1.4 L, and an average hydraulic retention time of 10 d, the mean liquid feed rate was 0.14 L d−1. This corresponded to an organic loading rate of 0.200 ± 0.036 g COD d−1. Assuming, as an upper-bound condition, that all supplied tCOD was biodegradable and completely converted into methane, the maximum methane production attributable to the centrate was 0.070 ± 0.012 NL CH4 d−1. By comparison, the measured methane production rates were 4.13, 7.69, and 5.53 NL CH4 d−1 during Stages I, II, and III, respectively. The theoretical maximum contribution of centrate-derived organic matter therefore represented 1.7%, 0.9%, and 1.3% of the measured methane production in the corresponding stages. Even under the conservative assumption of complete COD conversion, organic matter supplied with the centrate could therefore account for less than 2% of the measured methane production. Because COD is an electron-equivalent parameter, this calculation also provides an upper-bound estimate of the reducing equivalents introduced with the centrate. This estimate constrains the potential contribution of feed organic matter but does not constitute a closed carbon or electron balance.
No abiotic, inoculum-only, or feedstock-only control reactors were included. Consequently, the individual contributions of hydrogenotrophic methanogenesis, acetoclastic methanogenesis, homoacetogenesis, and endogenous metabolism could not be experimentally resolved. Nevertheless, the COD-based upper-bound estimate indicates that methane potentially derived from centrate organic matter represented only a minor fraction of the total measured production.
Biological methanation is primarily evaluated through MER and CH
4 concentration, which reflect methane productivity and product gas quality and are influenced by reactor type, operating conditions, and substrate characteristics [
35]. Previous studies investigating different reactor configurations, including up-flow reactors, bubble column reactors, and continuous stirred tank reactors, have reported outlet methane concentrations typically in the range of 88–96%, as summarized in
Table 4. However, systems operating under continuous or semi-continuous gas-feeding regimes, with elevated residual H
2 concentrations and significant gas–liquid mass-transfer limitations, are frequently observed. Moreover, shear forces in these reactor types may inhibit microbial growth, which can adversely affect methane purity and reduce the MER [
32,
33].
Previous studies have shown that intermittent H
2 supply can support flexible methane production, while standby phases allow microbial and process recovery, promote the degradation of accumulated VFAs, and help reactor conditions return toward baseline levels [
34]. In the present reactor, intermittent cyclic H
2 feeding was associated with low residual H
2 concentrations and stable performance during Stage III. Comparisons with continuous and semi-continuous systems should nevertheless be interpreted cautiously because reactor configuration, gas loading, working volume, mixing conditions, and analytical procedures differed among the studies.
As summarized in
Table 4, although some batch-operated systems reported slightly higher CH
4 concentrations under comparable conditions (e.g., temperature and gas feeding strategy), their MER values remained lower than those achieved in the present study. This comparison highlights the effectiveness of the implemented operational strategy in balancing methane purity and volumetric productivity.
Notwithstanding the promising performance observed under laboratory-scale conditions, several aspects require further investigation before plant-scale implementation. Long-term operation at low dissolved CO2 setpoints should be assessed carefully. However, a low concentration of molecular dissolved CO2 does not necessarily correspond to low total inorganic carbon availability in the liquid phase. Total inorganic carbon depends on carbonate-system speciation, which is mainly governed by pH and alkalinity through the equilibria among CO2 (aq), HCO3−, and CO32−. Therefore, the possible occurrence of inorganic-carbon limitation for methanogenic archaea cannot be inferred from the dissolved CO2 setpoint alone and should be assessed through the combined monitoring of total inorganic carbon, alkalinity, pH, and biological performance.
An additional limitation of the present setup was the interruption of liquid feeding and digestate withdrawal during weekends while gas supply and recirculation continued. Consequently, the transient VFA increase observed during these periods reflected both biological transformations and the absence of liquid-phase dilution and removal. Future studies should compare continuous and interrupted liquid-feeding conditions under otherwise equivalent operating conditions. Before progressing towards plant-scale implementation, a mechanistic model integrating gas–liquid mass transfer, carbonate-system speciation, pressure dynamics, microbial kinetics, and competition among metabolic pathways should be developed and validated. Such a model would help define appropriate operating ranges, assess the risk of inorganic-carbon limitation, and optimize the control strategy.
An integrated control strategy based on reactor pressure and dissolved CO2 concentration, with pH used as a monitored and indirectly regulated process variable, does not in itself represent a substantial barrier to scale-up. Sensors, automated valves, and automation systems for monitoring and controlling these variables are mature technologies that can be implemented in high-efficiency reactors. Nevertheless, reactor configuration, pressure-cycle management, the integration of pressure, dissolved CO2, and pH control, the energy demand associated with gas compression and recirculation, and the robustness of the control logic should be evaluated through dedicated techno-economic feasibility studies and pilot-scale experimental validation.
4. Conclusions
This study evaluated an ex situ biological H2 methanation process in a single fed-batch mesophilic reactor operated under intermittent gas-feeding conditions without external additives. Under the tested conditions, the combined implementation of pressure-controlled H2 injection and dissolved CO2 regulation was associated with stable methane production during Stage III. The results support the hypothesis that the combined regulation of dissolved CO2 concentration and pressure-controlled H2 feeding can maintain substrate availability while limiting sustained VFA accumulation and the associated acidification of the system under the operating conditions investigated in this study.
Although temporary VFA accumulation and pH reduction were observed during Stage II, the subsequent adjustment of the dissolved CO2 control condition was followed by the recovery of pH, VFA stability, methane concentration, and H2 utilization. Under stabilized conditions, methane concentrations reached 93.3%, with a hydrogen utilization efficiency of approximately 99.2% and an average MER of 3.95 NLCH4 LVR−1 d−1. The recovery of methane production, pH, and H2 utilization after the Stage II disturbance is consistent with the restoration of methane-forming activity. However, the individual contributions of hydrogenotrophic methanogenesis, acetoclastic methanogenesis, homoacetogenesis, and other biological processes could not be experimentally separated.
Overall, the results support the laboratory-scale feasibility of the proposed operating strategy for producing methane from H2 and CO2 under the tested conditions.
Given that the present study was conducted at 38 °C, further investigations under thermophilic conditions (50–60 °C) are warranted to evaluate potential improvements in reaction kinetics and methane productivity. In addition, the development and evaluation of high-pressure reactor configurations (>2000 mbar) should be explored, as elevated pressure may enhance gas–liquid mass transfer and improve overall conversion efficiency. A comprehensive assessment of heat integration and energy recovery will also be essential for optimizing system-level efficiency and supporting large-scale implementation.