1. Introduction
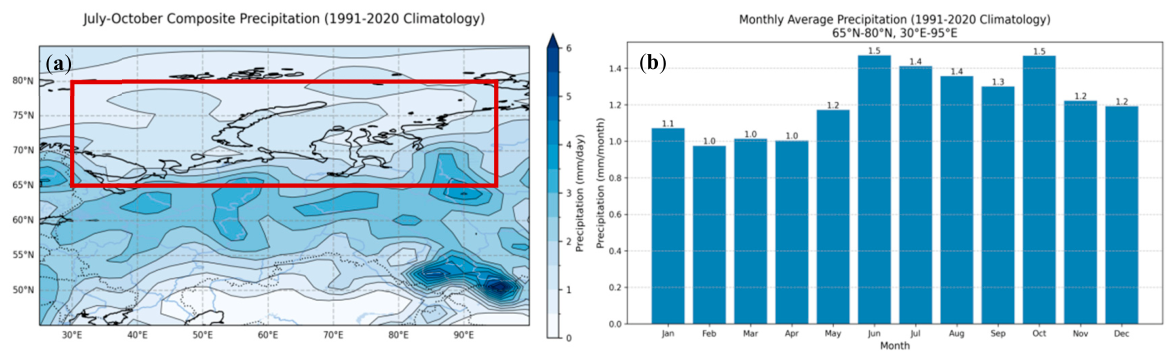
The Arctic Northeast Passage (Northern Sea Route, NSR), extending from Norway’s North Cape to the Bering Strait, is the shortest sea route between Northeast Asia and Europe. Owing to Arctic amplification, the region is warming at nearly four times the global average rate, which has extended the navigable window from fewer than 30 days in the 1980s to roughly 120 days in recent years and reduced fuel costs by ~28% compared with the Suez Canal route [
1,
2,
3,
4]. However, alongside ice retreat, Arctic atmospheric circulation is undergoing profound adjustments that increase the frequency of extreme weather, posing serious hazards to shipping. The Barents–Kara Sea sector (65–80° N, 30–95° E), the western entry to the NSR, is a critical chokepoint where heavy precipitation, sea fog, and extreme cyclones frequently cause vessel delays and economic losses [
5,
6,
7,
8,
9,
10]. Such precipitation events not only impair visibility and induce icing but also feed back onto the climate system through altered oceanic stratification and air–sea fluxes, modulating freeze–thaw cycles. Understanding their initiation is therefore essential for improving short-term forecasts and climate adaptation strategies.
Previous research on the NSR has largely focused on sea-ice physical parameters and navigability assessments, using satellite remote sensing and climate models to quantify ice thickness, concentration, and age, and employing ice-risk indices such as POLARIS to predict sailing windows for different ice classes [
11,
12,
13,
14]. Risk assessment has evolved from a single-ice emphasis to integrated frameworks that include life-safety and environmental consequences [
15], and more recent work has incorporated wind, fog, and ocean-current data, revealing nonlinear “ice–ocean–atmosphere” coupling effects [
6,
16,
17,
18,
19,
20,
21,
22,
23,
24,
25]. Despite this progress, these studies remain operational in nature, concentrating on consequence evaluation and window prediction, while the dynamical triggers of hazardous weather—heavy precipitation, gales, extreme cyclones—and their large-scale circulation drivers are poorly understood. In particular, against the backdrop of recent extreme sea-ice anomalies, knowledge of moisture transport pathways and energy propagation specific to the NSR entry sector is notably scarce.
In the broader context, mid- and low-latitude teleconnection studies have demonstrated how quasi-stationary Rossby waves excited over the Mediterranean propagate along the westerly jet and modulate Meiyu rainfall [
26], and how the North Atlantic tripole SST pattern influences Eurasian blocking and downstream drought/flood patterns. For the high Arctic, recent work shows that Barents–Kara sea-ice loss can excite Rossby wave trains that propagate downstream to the Northwest Pacific, affecting East Asian summer precipitation [
27], and that extreme cyclones from the North Atlantic transport warm, moist air poleward through tropopause potential vorticity descent and baroclinic conversion, inducing heavy precipitation and accelerating ice melt [
28]. Synergistic SST–sea-ice effects are also known to alter Rossby wave breaking frequency and extreme-weather probability [
29]. However, these findings have not yet been synthesized into a quantitative diagnostic framework focused on the NSR starting segment. The specific roles of high-latitude Rossby wave energy paths, Ural blocking–polar vortex interactions, and the coupled sea-ice–SST feedback loop in generating heavy precipitation there remain largely unexplored. Moreover, existing hazardous-weather thresholds rely on static 1991–2020 climatologies and are ill suited to capture the rapid intensification of recent extremes.
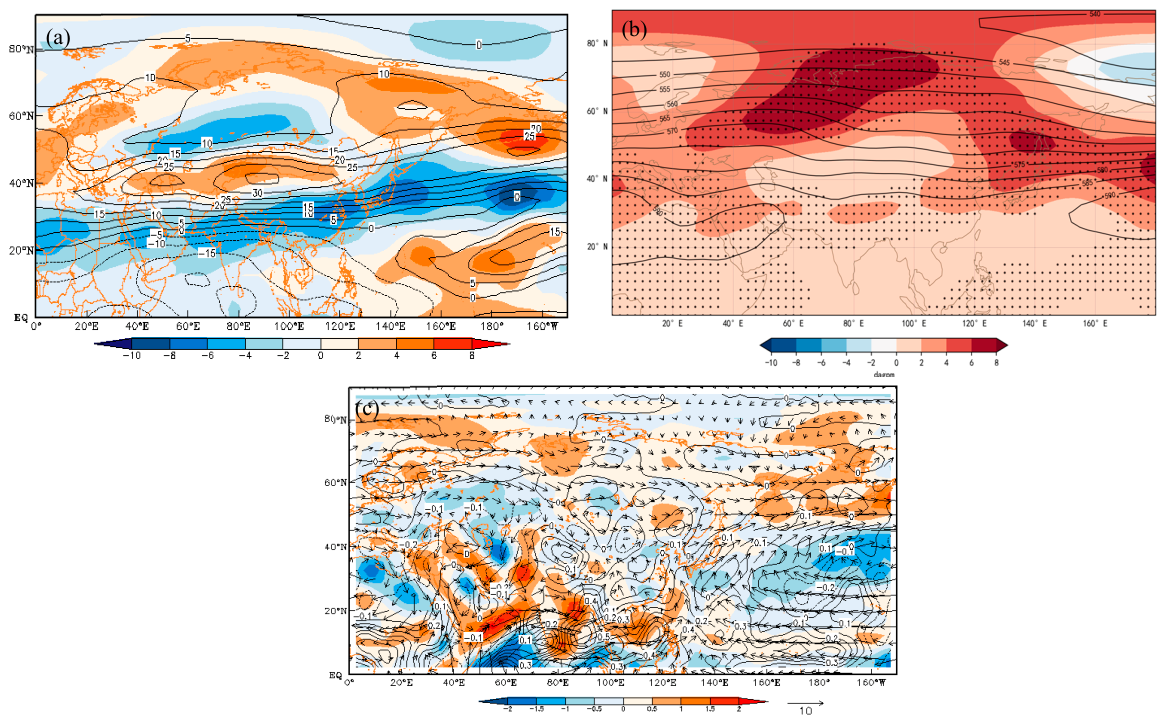
To address these gaps, this study concentrates on the NSR entry sector (65–80° N, 30–95° E) and, for the first time, integrates 2021–2024 high-resolution precipitation data with NCEP reanalysis. Our objective is to overcome static-threshold limitations and to elucidate the anomalous circulation mechanisms and energy propagation pathways responsible for heavy precipitation during the navigation season (July–October). Specifically, we (i) implement a dynamic 90th-percentile threshold that captures the recent escalation in event intensity; (ii) apply wave activity flux and vorticity diagnostics to quantify the synergistic effect of the eastward-shifted Ural blocking high and the southward-extended polar vortex, and their driving of a mid-tropospheric “tripole” teleconnection pattern; and (iii) construct a complete teleconnection chain linking mid-latitude wave excitation, Rossby wave propagation, sea-ice feedback, and baroclinic maintenance. Through a cross-seasonal case study (August 2023), we demonstrate the sequential unfolding of these processes.
While Yang et al. [
27] showed that BK sea-ice anomalies influence East Asian precipitation via Rossby wave trains, and other studies have documented individual SSTA and sea-ice effects on Arctic circulation [
28,
29], our study differs in three key aspects. First, the dynamic 90th-percentile threshold from recent data better represents current extreme-precipitation intensification. Second, we explicitly trace the full teleconnection chain from North Atlantic SSTA in April through Rossby wave excitation in June to sea-ice feedback in July and final precipitation in August, providing a mechanistic rather than correlational link. Third, the cross-seasonal case analysis of August 2023 demonstrates stepwise process development, offering a template for future event prediction. This integrated approach is essential for building operational forecasting tools for the Arctic Northeast Passage.
2. Data and Methods
2.1. Data Description
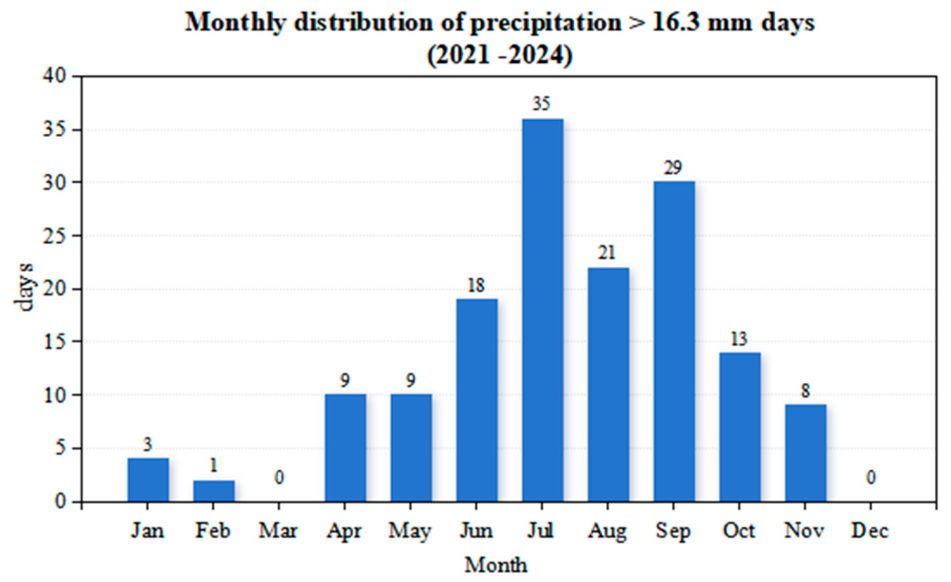
The data used in this paper include (1) Global daily reanalysis data provided by the National Centers for Environmental Prediction (NCEP/NCAR), including geopotential height field H, temperature field T, wind field (zonal wind U, meridional wind V), vertical velocity field (ω), and precipitation rate, with a horizontal resolution of 2.5° × 2.5°. (2) High-resolution sea surface temperature and sea ice density fields provided by the National Oceanic and Atmospheric Administration (NOAA), with a horizontal resolution of 0.25° × 0.25°. The study period covers July to October (the navigation period of the Arctic Northeast Passage) from 2021 to 2024, and the climate baseline period is 1991–2020. The threshold for heavy precipitation events is determined by the dynamic percentile method, taking the 90th percentile of daily precipitation from 2021 to 2024 (16.3 mm/d).
The NCEP/NCAR reanalysis data with 2.5° × 2.5° resolution were selected because of their real-time availability and long-term continuity, which are critical for operational forecasting in Arctic shipping routes. While this resolution is adequate for diagnosing large-scale circulation patterns including blocking highs, Rossby wave trains, and jet stream variations, we acknowledge that it may underrepresent mesoscale convective structures and orographic precipitation enhancement. Higher-resolution products such as ERA5 (0.25°) would likely refine the spatial distribution of precipitation extremes, particularly in coastal and marginal ice zones, but are not expected to materially alter the large-scale teleconnection mechanisms and energy propagation pathways identified in this study. Future work will incorporate ERA5 data to validate the robustness of these findings at finer scales.
2.2. Research Methods
The heavy precipitation threshold was determined by pooling all daily precipitation values across all grid points within the study area (65° N–80° N, 30° E–95° E) and all days from 2021 to 2024, and computing the 90th percentile, which yields 16.3 mm d−1. This pooled approach ensures a uniform threshold for identifying heavy precipitation events across the entire domain. A day is classified as a heavy precipitation day if the daily precipitation exceeds 16.3 mm d−1 at any grid point within the study area. The spatial coefficient of variation (CV) is computed for each heavy precipitation day based on the precipitation values across all grid points, and the mean CV of 0.95 indicates strong spatial inhomogeneity.
2.2.1. Filtering Method
Atmospheric disturbances encompass multiple spatial scales. To isolate the planetary-scale circulation features relevant to teleconnections and Rossby wave propagation, we apply Fourier harmonic decomposition to the daily anomaly fields and retain zonal wavenumbers 1–7. This bandpass filtering removes synoptic-scale noise and preserves the quasi-stationary wave structures that dominate the large-scale flow configuration over the Eurasian–Arctic sector.
2.2.2. Vorticity Source Equation
Since the large-scale divergent wind field in the atmosphere is mainly related to uneven diabatic heating and large topography, the anomalous vorticity source S’ basically represents the forcing of stationary external forcing sources on atmospheric stationary planetary waves [
30]. The vorticity source generated by the stationary divergent wind field in the upper troposphere can be expressed as
where
is the climatological mean divergent wind,
is the climatological anomalous divergent wind,
is the climatological mean relative vorticity,
is the climatological anomalous relative vorticity,
is the climatological mean divergence, and
is the climatological anomalous divergence, respectively.
2.2.3. Wave Activity Flux Diagnostic Equation
By comparing the characteristic differences and practicality of three Rossby wave diagnostic methods in atmospheric dynamics, it was found that the Plumb wave activity flux is more suitable for complex circulation background fields and can better describe large-amplitude Rossby wave disturbances in the westerly belt. It is a measure of wave energy propagation, and its horizontal component can indicate the horizontal propagation direction of Rossby wave energy and the magnitude of the energy [
31].
In this formula,
W is the wave activity flux,
is the quasi-geostrophic perturbation stream function,
and
are the basic flow field of the mean airflow,
is the air pressure divided by 1000 hPa,
is the climatological value of horizontal wind speed, and
S2 is the static stability parameter.
Under westerly wind conditions, the wave activity flux is expressed as a vector. The direction of this vector is consistent with the propagation direction of Rossby wave energy as well as with the vector direction of wave group velocity. Its absolute value is proportional to the propagation speed of wave energy. When W > 0, the wave activity flux diverges, indicating the output of wave activity, and the mean westerly wind intensifies. This forms the basis of the westerly acceleration trend generated by the Coriolis force. Conversely, when W < 0, the wave activity flux converges, and the mean westerly wind weakens.
2.2.4. Significance Testing
To assess the statistical significance of composite anomalies, a two-tailed Student’s t-test was performed at each grid point by comparing the composite mean on heavy precipitation days against the climatological mean for the same calendar days during 1991–2020. Grid points exceeding the 95% confidence level (p < 0.05) are indicated by black stippling in the composite maps. This test provides a measure of confidence that the observed anomalies are distinguishable from internal climate variability.
5. Teleconnection Mechanism of Sea Temperature–Sea Ice–Heavy Precipitation (Taking the August 2023 Heavy-Precipitation Event as an Example)
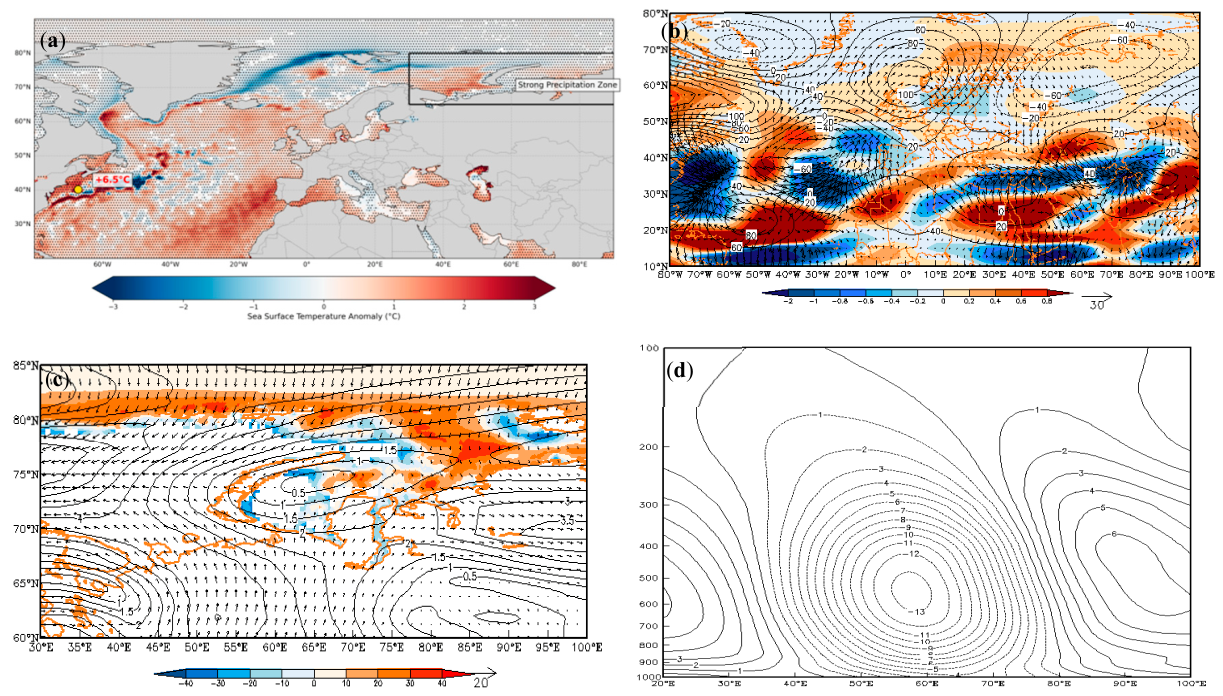
The 16–19 August 2023 event was selected for detailed case analysis because it represents the most extreme heavy precipitation event during the study period. With a duration of 4 days, it was the longest event among the 87 identified events (73% lasted only 1 day). Its total accumulated precipitation of 99.2 mm ranks at the 99th percentile of all events, and the maximum daily precipitation of 39.7 mm falls at the 98th percentile. The spatial extent of precipitation exceedance was approximately 2.3 times the median event area. Furthermore, the circulation anomaly intensity, quantified by the 500 hPa geopotential height anomaly magnitude averaged over the study area (+12.4 dagpm), places this event in the top 2% of all heavy precipitation events.
It can be seen from the spatial distribution of North Atlantic sea surface temperature anomalies in April 2023 (
Figure 5a) that an anomalous warm SST patch is located at 40° N in the North Atlantic, near Bermuda. This warm patch humidifies and warms the lower atmosphere by enhancing local evaporation and transporting heat and water vapor to the atmosphere, which may induce an anomalous ascending airflow. A cold SST anomaly is located near the Norwegian Sea, which combined with the warm anomaly forms a strong meridional sea surface temperature gradient, strengthening atmospheric baroclinicity and promoting the generation of cyclones or the development of blocking highs. The warm sea surface temperature anomaly can enhance northward water vapor transport in the North Atlantic and direct more water vapor to the study area (the region in the black box). The heavy precipitation observed in August requires a sustained water vapor supply, and the warm patch, the existence of which persists, could be a key source region. The warm patch can excite a Rossby wave train, which forms a blocking high in the upstream area (e.g., northern Europe), forcing cold air to move southward and converge with warm and moist air over the Barents Sea–Kara Sea, triggering heavy precipitation. The extreme warm SST patch (+6.5 °C) and the corresponding spatial distribution of sea surface temperature anomalies in the North Atlantic in April 2023 provide key background conditions for the heavy precipitation observed in August over the Barents Sea–Kara Sea, through the synergistic effects of sustained water vapor transport, atmospheric circulation adjustment and the Arctic amplification effect.
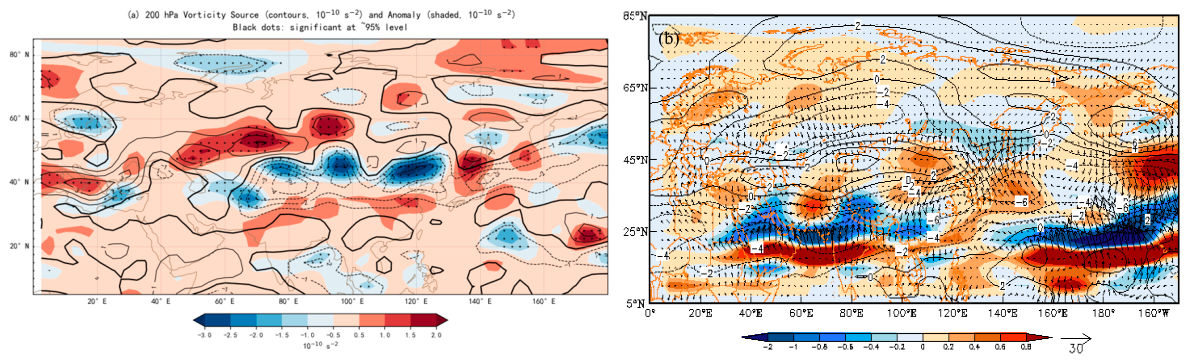
According to the spatial distribution characteristics in
Figure 5b (the 200 hPa geopotential height anomaly and wave activity flux anomaly field in June 2023), the influencing mechanism of this pattern on the heavy-precipitation event in August is as follows: First, a high-pressure ridge develops east of North America (80° W–40° W, 35° N–65° N; central value + 120 dagpm). This anomalous positive-geopotential-height center corresponds to anomalous anticyclonic circulation, and the area of positive wave activity flux (>0.8 m
2/s
2) on its east side (west of 40° W) indicates that this is a key source region for the eastward propagation of Rossby wave energy. The anomaly of a negative divergence in the wave activity flux (80° W–60° W, 20° N–40° N; central value < −2 × 10
−6 m/s
2) shows that wave energy converges here, enhancing its transport to mid-high latitudes through nonlinear interactions. Second, the wave flux radiates from the east of North America toward Northeast Europe (arrows pointing northeast), forming a typical quasi-stationary wave train with alternating positive and negative geopotential height anomalies (positive center +100 dagpm at 20° W–30° E, 50° N–80° N in the northeast; negative center −60 dagpm at 30° E–100° E, 50° N–80° N in the east). The positive geopotential height anomaly over Northeast Europe (20° W–30° E) reflects the development of a blocking high, and the negative geopotential height anomaly on its south side (50° W–0° W, 30° N–50° N) leads to the formation of a meridional pressure gradient, forcing cold air to move southward along the western edge of the blocking high. Third, the study region (Barents Sea–Kara Sea) exhibits a positive divergence anomaly (wave energy divergence) corresponding to the anomalous area of ascending motion, which is directly coupled with the dynamic lifting conditions required for heavy precipitation. The northwest–southeast-oriented wave flux vector shows that wave energy is transported from the North Atlantic high-pressure ridge to the Arctic region, further maintaining the stability of the blocking high. Finally, the wave train structure in June inherits the circulation adjustment triggered by the warm spot in April, and the North Atlantic high-pressure ridge continues to guide warm, moist air northward (as observed in April). The blocking high forces cold air to converge in the Barents Sea–Kara Sea, forming a strong baroclinic zone. The anomalous area of negative wave activity flux (low latitudes of the North Atlantic) corresponds with the weakening of the subtropical jet stream, which may enhance the efficiency of meridional warm, moist air transport.
It can be seen from
Figure 5c that the core area of the abnormal negative sea ice in July 2023 is located at 60° E–80° E, 70° N–80° N. This indicates that the decrease in sea ice coverage reduces surface albedo, increases the absorption of solar radiation, and leads to a significant increase in local sea surface temperature (SST), which enhances sensible and latent heat transport to the atmosphere. The anomalous warm sea surface warms the lower atmosphere and forms a local low-pressure anomaly (corresponding to a counterclockwise wind anomaly at 850 hPa), further weakening the Arctic cold high. The anomalous wind field drives a positive sea ice–atmosphere feedback cycle, with the wind field presenting a double-vortex structure. The anomaly of counterclockwise wind in the southern vortex (30° E–50° E, 60° N–70° N) reflects a cyclonic circulation anomaly; the southerly wind anomaly on its south side transports mid-latitude warm, moist air northward to the area with reduced sea ice. The anomaly of the counterclockwise wind in the northern vortex (50° E–85° E, 70° N–80° N) overlaps with the negative sea ice area, indicating wind convergence and ascending motion, which promotes the formation of clouds and precipitation. The southerly (south of the negative sea ice area) and northerly (north of this area) wind anomalies form low-level convergence, converging water vapor from the Atlantic Ocean and Eurasia to the Barents Sea–Kara Sea. Coupled with the earlier circulation conditions, the thermal forcing in the reduced-sea-ice area in July may strengthen the blocking high established in June (the positive geopotential height anomaly over Northeast Europe in
Figure 5b), forming a sustained atmospheric blocking situation. The low-level flow of warm, moist air and the southward-moving cold air (guided by the blocking high) converge in the Barents Sea–Kara Sea, providing baroclinic energy and water vapor conditions for the heavy precipitation in August. This reflects the Arctic amplification effect: sea ice reduction → local warming → cyclonic circulation enhancement → further fragmentation and retreat of sea ice → more intrusion of warm and moist air, forming a self-reinforcing cycle. The sea ice anomaly in July continuously affects the atmospheric circulation in August by changing the surface energy balance, prolonging the duration of the heavy precipitation event.
Figure 5d shows the vertical circulation structure along 75° N during the heavy precipitation event in the Barents Sea–Kara Sea (16–19 August 2023). It can be seen that the core area of ascending motion is located near 600 hPa at 40–75° E, which corresponds to this heavy precipitation area. The strong ascending motion (negative ω value) indicates the development of deep convection, which is coupled with low-level convergence of warm, moist air (water vapor transport from the July reduced-sea-ice area) and upper-level divergence (influenced by the blocking high). The ascending motion tilts westward with height (contours lift westward), reflecting the vertical propagation characteristics of the baroclinic wave train, which may correspond to the rise of warm and moist air along the isentropic surface (warm conveyor belt). Meanwhile, the descending motion (positive ω value) on both the east and west sides of the area of ascending motion (20° E–40° E and 80° E–100° E) forms a “squeezing” structure that enhances the intensity of this central ascending motion. The descending motion on the east side (80° E–100° E) is probably affected by the Eurasian high-pressure ridge (the area of anomalous negative geopotential height in the June wave train): cold air sinks and moves westward, forming a closed circulation with the ascending area. In addition, the west-tilting structure of ascending motion observed in the figure indicates the release of baroclinic unstable energy, which is associated with the combined effect of the Rossby wave train triggered by the North Atlantic warm spot (
Figure 5b) and reduction in Arctic sea ice (
Figure 5c): low-level warm, moist air (from the North Atlantic and the open water of the Barents Sea) converges near 60° E and is forced upwards. The disturbance of the upper-level westerly jet, combined with the matching of the tilted ascending motion and the trough–ridge configuration in the upper westerly belt, enhances the persistent ascending motion. The European blocking high established in June (
Figure 5b) may still have a residual influence in August, and its east side (near 60° E) guides cold air southward, which converges with warm and moist airflow and triggers a strong ascending motion. The reduction in sea ice in the Barents Sea in July (
Figure 5c) leads to low-level warming and increases atmospheric instability, further strengthening the ascending motion in August (the negative ω center reaches −13 Pa/s).
In summary, taking the extreme heavy precipitation event in August 2023 as an example, the teleconnection mechanism of sea temperature–sea ice–heavy precipitation is determined as follows: The warm anomaly in the North Atlantic (+6.5 °C) in April enhanced evaporation and excited the Rossby wave train, leading a European blocking high in June. The abnormal reduction in Arctic sea ice (60° E–80° E) in July led to local warming and the development of cyclonic circulation, which promoted the northward transport of warm, moist air; by August, the cold air, guided by the blocking high, had converged with the warm, moist air flow in the Barents Sea. Combined with the strong ascending motion (central ω = −13 Pa/s) and baroclinic lifting, this ultimately promped persistent extreme precipitation. This cross-seasonal “sea temperature–wave train–sea ice–precipitation” teleconnection mechanism reflects the synergistic effects of the ocean–sea ice–atmosphere system under the Arctic amplification effect.
7. Discussion
Our composite analysis reveals that heavy precipitation days in the NSR entry sector are characterized by an eastward-shifted Ural blocking high and a southward-extended polar vortex. This configuration is consistent with earlier studies of Eurasian blocking dynamics, which documented that Ural blocking often shifts downstream and couples with quasi-stationary Rossby wave trains [
32,
33]. The Rossby wave energy traced to the Mediterranean–Black Sea region aligns with the subtropical wave source concept of Scaife et al. [
34], who demonstrated that convective outflows over the Mediterranean can excite Rossby waves that project onto higher-latitude circulation anomalies via the westerly waveguide. Our application of wave activity flux diagnostics quantifies this pathway specifically for the Barents–Kara Sea sector, providing geographic precision that complements previous hemispheric-scale analyses.
The observed northward displacement and intensification of the 200 hPa westerly jet are in agreement with the jet–waveguide trapping theory reviewed by Wirth et al. [
35]. As noted by Röthlisberger et al. [
36], regional jet waviness can modulate the occurrence of midlatitude weather extremes; our results extend this concept by showing that the enhanced jet over the Eurasian sector acts as an efficient conduit for wave energy towards the Arctic, thereby facilitating baroclinic development and extreme precipitation in the NSR entry region.
The cross-seasonal sequence identified—warm North Atlantic SST anomaly in April, wave train development in June, sea ice reduction in July, and heavy precipitation in August—echoes the ice–atmosphere coupling mechanisms described by Screen and Simmonds [
37], who demonstrated the central role of diminishing sea ice in Arctic amplification. Furthermore, the large-scale air–sea interaction patterns underlying such teleconnections have been discussed by Deser et al. [
38]. While these studies established the individual components (SST forcing, sea ice feedback, Rossby wave propagation), our study connects them into a unified observational chain for the NSR region. Notably, this work, for the first time, unveils the complete mechanism chain of “wave source excitation—energy propagation—sea ice feedback” specifically for heavy precipitation events in the Arctic Northeast Passage. It is crucial to emphasize that this chain is derived from diagnostic associations and does not constitute proof of physical causality. As cautioned by Cohen et al. [
39] in their review of Arctic–midlatitude linkages, attribution of extreme events to specific Arctic forcings remains challenging due to large natural variability and the difficulty of isolating cause and effect in observational data. Therefore, the hypothetical teleconnection pathway proposed here must be tested with dedicated model sensitivity experiments, such as SST/sea-ice nudging or partial masking simulations, to quantify the relative contributions of individual forcings.
Several additional limitations should be considered. The 2.5° × 2.5° NCEP/NCAR reanalysis used in this study adequately resolves the large-scale teleconnection patterns but may underrepresent mesoscale convective systems and local topographic effects that can modulate precipitation extremes. Future work will incorporate higher-resolution reanalyses (e.g., ERA5 at 0.25°) to evaluate the robustness of these findings and to assess sub-synoptic-scale contributions. The dynamic 90th-percentile threshold, while capturing recent intensification, is sensitive to the relatively short 2021–2024 sample; longer records with sustained Arctic warming will allow more stable threshold estimates. Finally, this study focused exclusively on heavy precipitation; however, the same circulation regimes likely influence other navigation hazards such as sea fog and extreme wind events, which merit parallel investigation.
Beyond these technical refinements, several scientific questions remain open for future exploration. First, regarding the temporal and spatial variation in wave train paths, the accelerated melting of sea ice after 2021 may alter the propagation routes of Rossby waves, and higher-resolution models are needed to verify their nonlinear responses. Second, the synergistic contribution of North Atlantic SST anomalies and Arctic sea ice variability requires further quantification through dedicated sensitivity experiments (e.g., SST/sea-ice masking or nudging simulations). Third, beyond heavy precipitation, the impact mechanisms of sea ice reduction on other navigation-related hazards—such as fog and storm surges—urgently need systematic investigation. Moreover, the application of coupled climate models and the optimization of forecast indicators (e.g., precursor signals and lead times) represent important directions for translating these diagnostic findings into operational subseasonal-to-seasonal forecasting tools for the Arctic Northeast Passage.
Overall, these findings provide a physically consistent diagnostic framework that can inform the development of such forecasting tools, while the causal mechanisms underpinning the proposed teleconnection chain remain a subject for future modeling studies.