1. Introduction
Chronic kidney disease (CKD) is a major public health issue. It is defined as a progressive loss of kidney function that may lead to renal failure if left untreated [
1]. Early diagnosis of CKD is important to delay disease progression, avoid significant consequences, and minimize healthcare costs [
2,
3]. However, early diagnosis of mild, asymptomatic, and heterogeneous CKD remains difficult because its initial symptoms are difficult to detect [
4]. Existing diagnostic techniques, such as laboratory testing and ultrasound, give only limited insight into kidney function and may easily overlook the nuanced changes that signal the development of the illness [
5,
6]. If CKD is diagnosed early, clinicians have the opportunity to initiate treatment promptly to minimize disease progression, reduce patient discomfort, and improve survival. In this respect, knowledge-based systems may be of great use. These systems can mimic a clinician’s cognitive processes, recognize risk factors, and help patients make timely treatment decisions by integrating clinical knowledge and patient-specific data [
7]. Unlike traditional diagnostic tools [
8], they can track patient data over time, recognize patterns, and recommend diagnostic or therapeutic measures even when nonspecific symptoms are present.
The increasing availability of advanced technology has made AI an important tool in diagnostics, especially for classifying disease. Knowledge-based expert systems are an important type of AI that stands out because they can accurately classify conditions and make their reasoning clear, which helps clinicians understand and support CKD diagnosis [
9,
10]. Machine learning (ML) algorithms have significantly improved prediction accuracy, allowing the prediction of disease development and the implementation of treatment measures. Despite this, conventional machine learning methodologies, such support vector machines (SVMs) and decision trees, possess fundamental limitations. Their dependence on static feature-label relationships constrains their ability to perform automated feature selection, and they encounter difficulties handling the complexity of high-dimensional medical datasets [
11]. These models are affected by overfitting, especially in cases where the data is limited or unbalanced. A significant weakness is their failure to accurately capture highly complex non-linear interactions among clinical indicators, which are essential for the early detection of CKD [
12].
In recent years, deep learning (DL) architectures, such as Convolutional Neural Networks, have garnered interest because of their ability to extract complex features from high-dimensional biological data. In contrast to conventional ML techniques, DL techniques eliminate the need for extensive manual preprocessing and can reveal biologically significant patterns, maintaining robustness even with very small labeled datasets. Nevertheless, the use of deep learning in clinical practice is still limited because it needs greater computational resources and more extensive training datasets, thereby limiting its application in real-time healthcare environments and increasing the risk of data leakage and overfitting. Furthermore, its advanced feature learning does not consistently result in improved performance in relatively simple tasks, such as CKD detection [
4,
11,
13].
CKD is a significant public health concern, as its early stages are often silent, leading to delayed diagnosis and increased risks of irreversible kidney damage [
14,
15]. Early detection is critical to slow disease progression, prevent complications, and reduce healthcare costs [
3,
16]. Common diagnostic tools, including routine laboratory tests and visual examinations, provide only a limited view of renal function and may not identify minor early changes [
5,
6]. These constraints can be addressed using knowledge-based systems and ML techniques that utilize multiple clinical parameters, monitor patient data continuously, identify risk factors, and provide prompt treatment [
7,
8]. All existing research is limited by accuracy and precision-based measurements. Although such biomarkers are useful, they may suffer from model confidence. A model might be fairly precise but not accurately calibrated, resulting in overconfident mistakes that are not acceptable in clinical practice. Moreover, medical datasets are always imbalanced, which causes traditional classifiers to prefer the majority class, raising the danger of missing important positive instances [
17,
18].
In particular, modern ML using explicit biomarkers like eGFR, serum creatinine, and BUN as predictive features can lead to significant target leakage in modern predictive frameworks that result methodological errors in the early diagnosis of CKD [
19,
20]. On the other hand, gradient boosting ensembles achieving great classification accuracy tend to be overconfident in borderline clinical situations. Additionally, traditional static ensemble approaches combine base learner outputs naively, ignoring both epistemic uncertainty and inter-model disagreement, which leads to weakness, large false-positive rates, and poor model calibration [
21].
To overcome these clinical and computational limitations, we propose the Hyper-Fidelity Dynamic Ensemble framework for CKD diagnosis (HFDE–CKD). The proposed methodology introduces a clinical handicap by exchanging primary renal biomarkers, such as eGFR, urine-albumin, and serum creatinine, with secondary ones, such as age, phosphorus, bicarbonate, uric acid, and calcium, to discover hidden and early metabolic signals for CKD. To ensure numerical stability, min–max normalization is applied to isolate the most discriminative features using random forest out-of-bag (OOB) permutation errors as information gain [
22]. This is followed by using probability vectors from heterogeneous base learners (MLP, XGBoost, LightGBM, and KNN) instead of static soft-voting to determine their epistemic contradiction. This data is used to train a logistic meta-learner to build a dynamic decision boundary capable of high-performance classification and probabilistic reliability for use as a proactive CKD screening tool.
The following is an outline of the proposed contributions and new features:
Variance Feature Optimization: We utilize a Random Forest OOB permutation method to generate a highly selective feature subspace, which minimizes noise and overfitting while keeping key signals.
Target Leakage for Early Detection: In order to reduce data leakage, we implement a novel clinical constraint by replacing fundamental GFR and their related biomarkers with secondary systemic indicators. Therefore, the proposed system is transformed from a repetitive diagnostic analyzer to an early-warning screening tool. Uncertainty-Injected Meta-Stacking: We substituted random weighting methods and fixed soft-voting with a dynamic logistic meta-learner. This design employs predictive uncertainty to resolve inconsistent clinical scenarios by applying Shannon entropy and inter-model prediction variance as distinct characteristics.
Probabilistic Calibration with Imbalance Awareness: We develop a robust quad-fold data isolation approach combined with the Synthetic Minority Oversampling Technique (Standard SMOTE). The proposed HFDE–CKD enhances diagnostic safety through probability calibration and CKD-specific instance weighting, resulting in exceptional expected calibration errors (ECEs) and Brier scores while significantly minimizing false positives.
End-to-End Clinical Interpretability: We establish a comprehensive meta-stacking architecture using an experimental SHAP framework, demonstrating that HFDE’s diagnostic outcomes are affected by early metabolic indicators (e.g., age, phosphorus, calcium) rather than trivial diagnostic artifacts.
The rest of this paper is organized as follows:
Section 2 reviews state-of-the-art methods, considering the diagnosis of CKD through numerous diverse methods. The proposed methodology is introduced in
Section 3. Experimental results and related discussion are provided in
Section 4. Finally, this paper concludes in
Section 5.
2. Literature Review
Recent advances in kidney disease have shown the rising relevance of machine learning, deep learning, and optimization-based approaches in improving diagnostic accuracy, predicting outcomes, and assisting clinical decision-making.
In particular, machine leaning models, including KNN, SVM, logistic regression, naive Bayes, random forest, and AdaBoost, were evaluated for reaching accuracy rates ranging from
to
for CKD prediction. The CNN-LSTM model attained and gained a high accuracy value of
in CKD diagnosis [
23]. In Ref. [
24], many ML classifiers were employed, revealing that gradient boosting achieved an accuracy of around
. In addition, earlier studies that are relevant to classical classifiers focus on high accuracy, precision, recall, and primary biomarkers as main indicators for CKD diagnosis [
11,
25]. Numerous studies have recognized intrinsic constraints in conventional machine learning methodologies with high accuracy [
26,
27,
28]. Moreover, SVMs exhibit sensitivity to a dataset’s size and have significant computational costs for large-scale issues, whereas random forests can suffer from overfitting as a result of feature estimation [
9,
29].
Deep learning techniques mitigate some challenges by naturally learning hierarchical features and diminishing dependence on manual feature engineering [
11]. However, healthcare data frequently exhibit noise, high dimensionality, and imbalance, which hinder the learning process, especially for the early diagnosis of chronic kidney disease. In contrast, deep learning models show enhanced accuracy and scalability compared to ML methods [
30,
31,
32]. In Ref. [
33] they present challenges concerning computational costs, data preprocessing, and lower-level interpretability to address and highlight a trade-off between model complexity and clinical transparency.
Furthermore, optimization-based learning has attracted several research research studies with respect to CKD. They have used Bayesian optimization with XGBoost and tested it against logistic regression, random forest, KNN, and SVM. They have shown that XGBoost has the greatest performance with an accuracy of
[
34]. These models are useful to some level, but generally, their performance is limited when dealing with high-dimensional clinical data. An interpretation-based CKD prediction model is developed using the UCI dataset, and it applies min–max scaling, Z-score normalization, and Gini-based feature selection with primary biomarkers. Their method reached an accuracy of
, emphasizing the significance of interpretability in clinical situations [
35]. A wide range of ML algorithms and ensemble approaches were used to explore the importance of performing class imbalance, and they found that rotation forest outperformed the other models [
36].
Despite recently advancements, current ML and DL methods for CKD still have major drawbacks. Deep learning methods proficiently capture complex nonlinear correlations in medical data, which is fundamental for accurate diagnosis classification. Many proposed hybrid architectures are demonstrated by combining SVM with CNNs in order to establish a balance between computational efficiency and accuracy [
37,
38]. These models use the robust feature extraction of CNNs combined with the stable decision boundaries of SVMs, resulting in enhanced generalization across various datasets [
39,
40]. Nevertheless, hybrid models frequently prove to be computationally complex and challenging to scale, especially for complicated clinical datasets [
41].
Specifically, three major limitations were present in many studies that achieved the diagnosis of CKD. Initially, target leakage was a significant issue that most existing frameworks could not handle or solve. They employed direct diagnostic indicators (e.g., eGFR and serum creatinine) as prediction variables. And this results in distribution leakage, which increased due to the insufficient imbalance of data, transforming the models into irrelevant diagnostic tools instead of early-warning systems [
42]. Secondly, the majority of modern research is based on independent optimization or ensemble methodologies (e.g., fundamental soft or hard voting) that combine outcomes. These methodologies measure epistemic uncertainty, which leads to biased clinical situations. Third, the risk of false positives is increased, and the reliability of traditional models for safe clinical decision support is limited as they frequently provide overconfident probabilities without evaluating the uncertainty of base learners [
30,
37].
Mainly, the proposed Hyper-Fidelity Dynamic Ensemble (HFDE) framework addresses the problem of trade-offs between discriminative capacity and probabilistic reliability by leveraging uncertainty meta-learning and dynamic probability calibrations. The HFDE–CKD architecture is provided via a multistage pipeline: imposing a high-level clinical handicap to prevent target leakage, converting clinical vectors into an optimized feature subspace, and producing a balanced manifold under data isolation. Ultimately, calibrated predictions from base learners are combined with epistemic uncertainty (Shannon entropy and variance). They are integrated through a logistic meta-learner, leading to an optimum decision threshold that maximizes both diagnostic sensitivity and F1 scores.
The proposed HFDE–CKD framework concurrently solves various issues, which has been mentioned earlier. It employs a rigid handicap constraint to prevent target leakage and takes advantage of random forest feature selection to identify early metabolic biomarkers. Then, the framework utilizes an uncertainty-injected meta-learner to dynamically integrate four heterogeneous base learners according to their epistemic uncertainty. At the end, the proposed HFDE–CKD framework addresses the methodological gap between isolated optimized models and static ensemble approaches, providing protection from data leakage and overconfidence for high-dimensional datasets. Also, it provides a highly reliable solution for the early screening and diagnosis of CKD.
3. The Proposed Methodology: HFDE Architecture
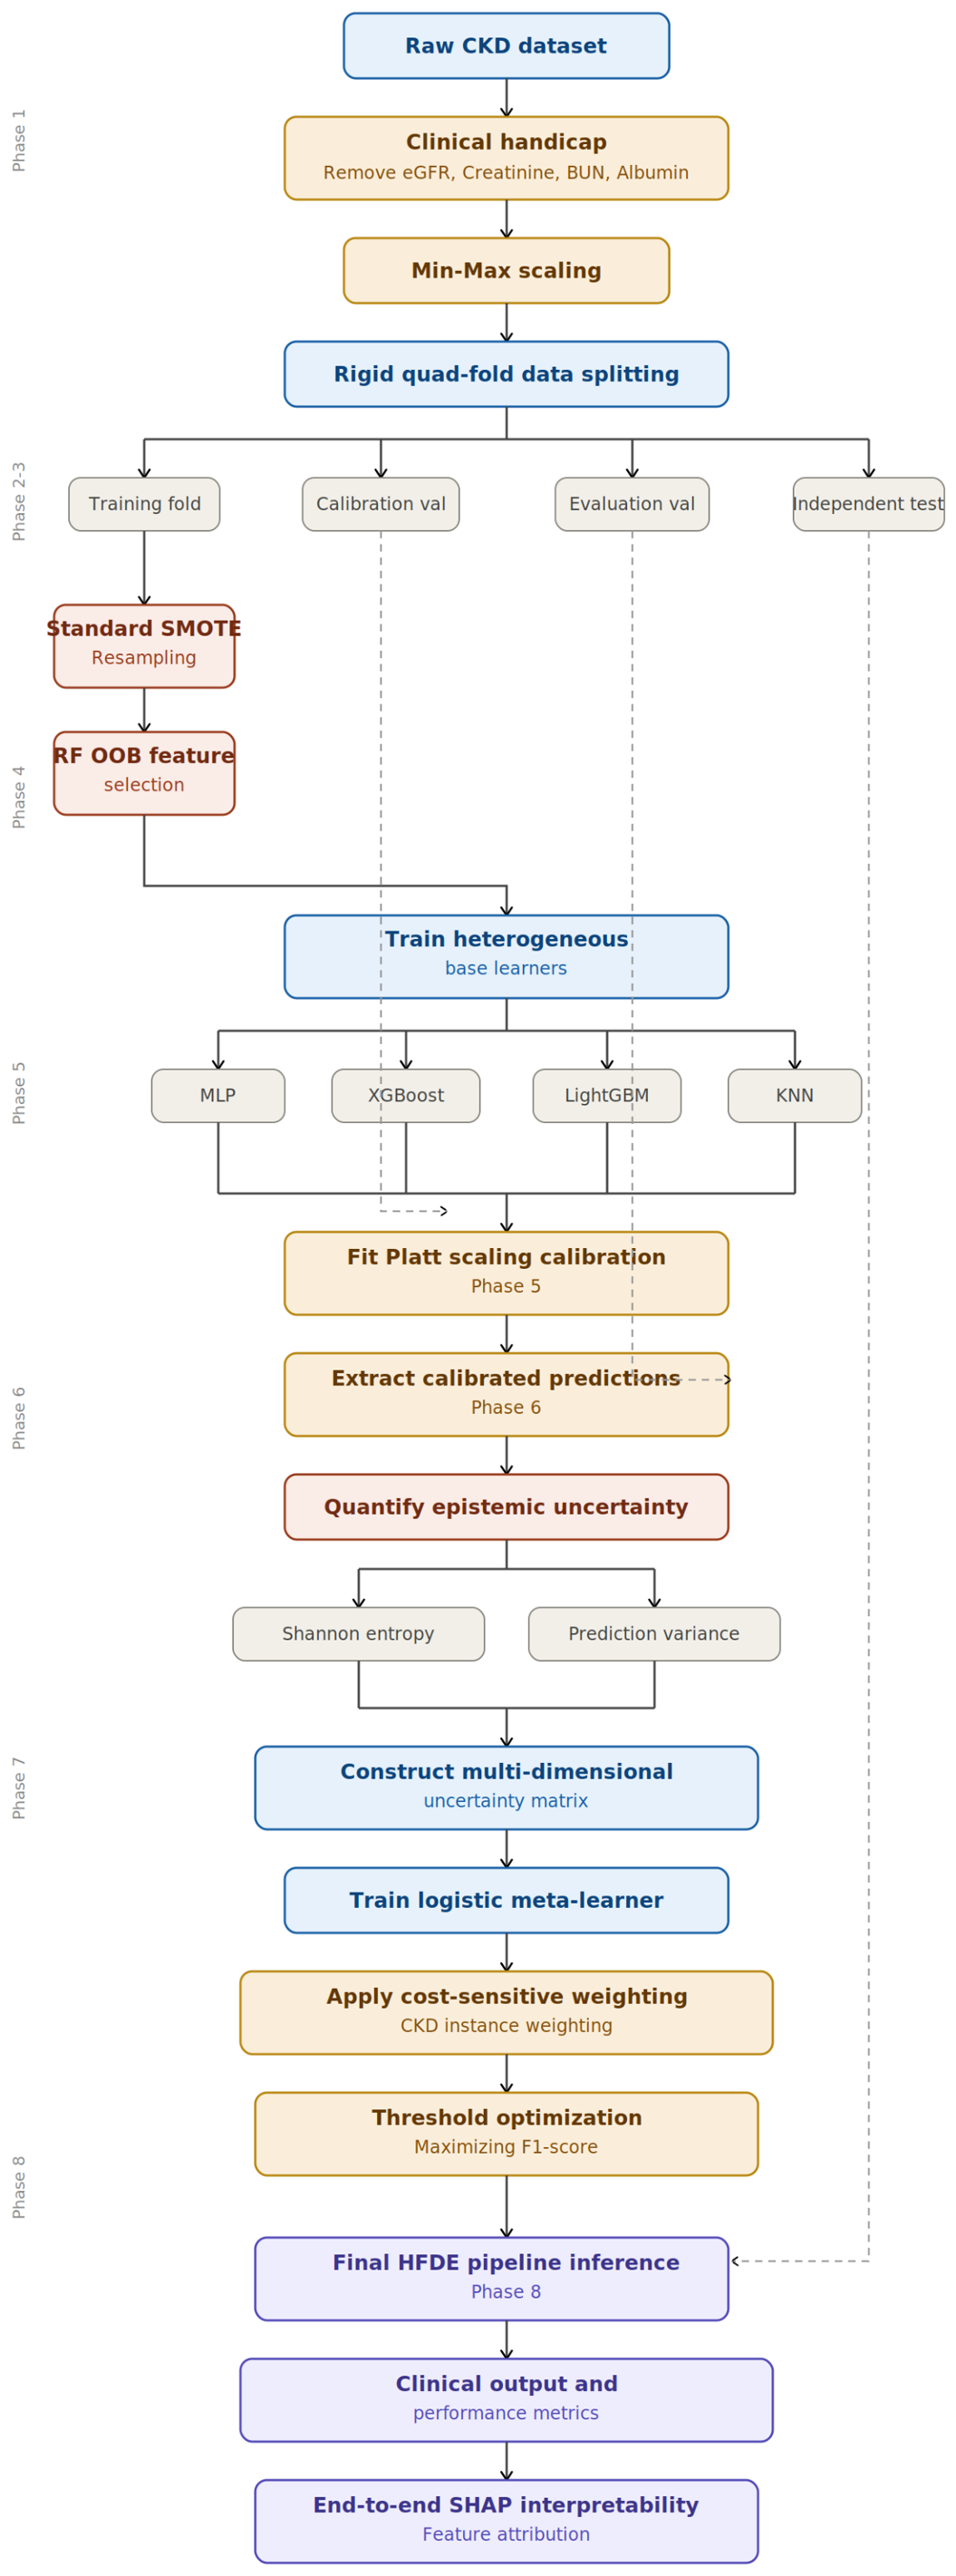
This section defines the primary phases of the Hyper-Fidelity Dynamic Ensemble (HFDE) architecture, as seen in
Figure 1. The methodology employs a multistage procedure. Initially, to address target leakage, the main renal indicators (e.g., eGFR, serum creatinine, BUN, albumin) are removed from the raw dataset
to impose high constraints. Then, the data passes through a quad-fold isolation protocol, partitioning it into training (
), calibration validation (
), evaluation validation (
), and testing (
) sets to guarantee geometric isolation before the calibration phase. This is succeeded by numerical adjustments, including min–max normalization, which is exclusively based on
and subsequently applied to the next folds to maintain geometric isolation. Secondly, an optimum, low-dimensional feature subspace
is derived by maximizing Gini impurity reduction using a non-parametric random forest assessment [
43], which is important for mitigating the effect of multidimensional and decreasing variance. Third, the
set is subjected to SMOTE resampling [
44] to ensure boundary separation in the presence of significant clinical class imbalance while preserving the validation geometry.
Subsequently, a highly heterogeneous set of base hypothesis functions
—incorporating tree-based, neural, and distance-based topologies (KNN)—is trained across this optimized topological space. Fourth, we extract the calibrated predictions (
) from all base estimators evaluated on
and combine them with precise indicators of their uncertainty, namely, prediction variance (
) and systemic Shannon entropy (
H). Together, these metrics form a comprehensive, multidimensional feature space. Instead of relying on simple averaging, we feed this entire uncertainty matrix into the HFDE’s final manifold stacking, using ridge regularization combined with cost-sensitive CKD instance weighting to penalize false negatives for accurate predictions [
45,
46]. Unlike standard linear weighting, this uncertainty-injected meta-learner autonomously learns to suppress epistemic ambiguity and dynamically identify the failure modes of the individual base learners. Furthermore, the clinical decision boundary is established by locating the optimal threshold
that maximizes the F1 score, ensuring maximal sensitivity for imbalanced diagnostics [
47,
48]. Finally, the fully optimized architecture is evaluated on the independent test set
to generate final clinical classifications,
. The probabilistic reliability of this uncertainty-injected meta-learner is rigorously validated against objective continuous penalty functions, including the Brier score, negative log-likelihood (NLL), and expected calibration error (ECE) [
49,
50]. All structural and functional mechanisms of this sequence are formalized in Algorithm 1.
| Algorithm 1 HFDE: Hyper-Fidelity Dynamic Ensemble Algorithm |
- 1:
Input: Dataset , feature constraint K, four base learners . - 2:
Output: Final classifications , calibrated probabilities , optimal threshold , evaluation metrics. - 3:
Phase 1: Strict Data Isolation (Quad-Fold) - 4:
Provide Clinical Handicap: Remove GFR biomarkers (e.g., eGFR, creatinine, albumin) from . - 5:
Partition dataset into , , and . - 6:
Derive min-max scaling parameters on ; apply for all splits. - 7:
Phase 2: Manifold Generation (Pre-Feature Selection) - 8:
Apply SMOTE resampling strictly to scaled to achieve class balance. - 9:
Phase 3: Subspace Optimization - 10:
Compute Gini-impurity reduction on the balanced to extract optimal subspace (top-K). - 11:
Filter , , , and to retain only . - 12:
Phase 4: Base Model Training & Heterogeneous Calibration - 13:
for each learner do - 14:
Train hypothesis function on . - 15:
Generate raw probability vectors . - 16:
Fit continuous Platt Scaling (binomial GLM) on . - 17:
Apply fitted calibration functions to generate and . - 18:
end for - 19:
Phase 5: Uncertainty Injection & Manifold Stacking - 20:
Extract all base predictions: - 21:
Compute Shannon Entropy: - 22:
Compute Prediction Variance: - 23:
Form uncertainty meta-vector: - 24:
Compile meta-vectors into matrix . - 25:
Train Ridge-regularized Logistic Meta-Learner on utilizing CKD-focused instance weights. - 26:
Generate final ensemble probabilities: . - 27:
Phase 6: Clinical Boundary Optimization - 28:
Locate maximizing F1-score on the independent manifold. - 29:
for each test instance do - 30:
Project final diagnosis: - 31:
end for - 32:
Phase 7: Statistical Calibration Metrics - 33:
Compute Brier score, NLL, ECE, and McNemar’s significance on . - 34:
Return , BS, NLL, ECE, Accuracy, Sensitivity, Specificity, F1-Score.
|
Figure 1.
An overview of the proposed HFDE–CKD framework.
Figure 1.
An overview of the proposed HFDE–CKD framework.
3.1. Data Isolation and Scaling Protocol
Data leakage is a primary cause of generalization failure in clinical machine learning prediction diseases, as it artificially impacts model performances [
51]. To avoid this, the proposed HFDE–CKD imposes a clinical handicap by removing primary biomarkers (e.g., eGFR, serum creatinine, BUN, albumin) from the dataset so that the model learns early persistent indicators. Thus, the proposed HFDE–CKD initializes quad-fold data partitions: a training fold (
), a calibration validation fold (
), a meta-stacking evaluation fold (
), and an independent testing fold (
).
To achieve numerical stability, min–max normalization maps the continuous feature space to a narrow, limited interval
. Crucially, the scaling parameters are locked and derived exclusively from the native
distribution. These locked parameters are subsequently applied to
,
, and
, thereby completely preventing global distribution leakage as follows:
3.2. Synthetic Manifold Generation Under Strict Isolation
Medical datasets inherently exhibit severe clinical class imbalance, causing conventional classifiers to mathematically bias toward the majority class (non-CKD). To resolve this, the proposed HFDE architecture intervenes in the latent data manifold using the Synthetic Minority Over-sampling Technique (SMOTE) [
52]. After that, interpolation is implemented on the training set
, while the validation and testing datasets remain in their unbalanced clinical conditions to maintain diagnostic validity and prevent data leakage. In the isolated
space, minority instances are represented, and vectors
are generated using interpolation along the line segments connecting
k-nearest minority neighbors as follows:
where
indicates a minority instance, and
represents its
k-nearest minority neighbors. Unlike hybrid resampling techniques that aggressively decimate majority class samples to artificially separate decision boundaries, HFDE relies exclusively on this standard SMOTE generation. This approach successfully balances the training density of the minority class while deliberately preserving the native, complex overlapping structures of the majority class, which often contain vital borderline clinical edge cases necessary for robust meta-learner generalization.
3.3. Subspace Optimization and Base Learner Training
Focusing on a compact set of meaningful clinical variables leads to more interpretable, robust, and accurate predictions, thereby supporting clinically decision-making for CKD patients. Accordingly, random-forest-based feature selection is adopted to preserve discriminative information while controlling a model’s complexity. Let
denote the reduction in Gini impurity contributed by clinical feature
j at node split
t. The global importance of feature
j is illustrated as follows:
By defining a constraint to select only the top-
K features that maximize
, the framework extracts a low-dimensional, highly discriminative subspace
. A highly heterogeneous set of probabilistic base learners,
, are then independently trained on
. Incorporating distance-based (KNN) topologies alongside trees and neural networks reduces estimator variance, injects architectural diversity, and mitigates overfitting for achieving high-dimensional medical datasets as follows:
3.4. Heterogeneous Probability Calibration Routing
Standard ML architectures optimize for classification loss but frequently yield uncalibrated probability distributions. A critical vulnerability in modern ensembles is the application of global parametric calibration to diverse models, which do not produce normally distributed uncalibrated margins. HFDE solves this by establishing heterogeneous calibration routing constraints. The framework evaluates the architectural origin of the base learner to map its output through the mathematically appropriate calibration function. For models generating roughly Gaussian margin distributions (e.g., MLP, KNN), outputs are mapped through a continuous Platt scaling function by minimizing the negative log-likelihood on
, where
HFDE–CKD logically unifies the probability through a continuous scaling function for all base learners, ensuring that all prediction vectors are calibrated accurately and are similar before meta-integration.
3.5. Instance Dynamic Fusion and Manifold Stacking
The fundamental flaw of conventional heterogeneous ensembles is the assumption of uniform classifier competence across all local data manifolds. Deriving a static weighting vector from global metrics, such as PR-AUC, mathematically fixes ensemble parameters, preventing them from adapting to out-of-distribution (OOD) geometries at the patient level. The HFDE architecture breaks away from the limitations of standard static weighting or arbitrary pruning mechanisms. Instead, for any given patient
i, we directly quantify the underlying epistemic uncertainty across all base learners using Shannon entropy (
) and prediction variance (
):
where
represents the total number of base estimators, and
is their mean predicted probability for instance
i. Then, the proposed HFDE–CKD concatenates the calibrated predictions (
) directly with the Shannon entropy (
) and prediction variance (
) to form a rich, multidimensional uncertainty matrix. This matrix is injected into a ridge-regularized logistic meta-learner. Cost-sensitive instance weighting is utilized to impose significant penalties on false negatives (missed CKD patients) and address clinical imbalance. So, the final stacking method exploits epistemic ambiguity and identifies multivariate failure scenarios that are systematically ignored.
3.6. Statistical Calibration Metrics
The proposed methodology assesses calibration quality by evaluating three metrics: Brier score (BS), negative log-likelihood (NLL), and expected calibration error (ECE) [
53]. BS covers discrimination and calibration, with lower levels indicating superior probabilistic accuracy, hence targeting both overconfident and underconfident predictions. It measures the average squared divergence between estimated probabilities and actual results, and it is defined as follows:
where
signifies the calibrated ensemble probability for sample
i, and
represents the appropriate truth label. Furthermore, NLL assesses the probabilistic coherence of forecasts by imposing penalties on erroneous confident predictions. This characteristic makes NLL highly good at detecting overconfident errors, which are risky in clinical settings. NLL is defined as follows:
where
N represents the total number of samples.
corresponds to the ground-truth label of the
i-th instance.
indicates the predicted probability for the positive class, and
is a small constant introduced for numerical stability to avert the evaluation of
. Moreover, ECE measures the divergence between predicted probability and actual results. A reduced ECE value signifies that the model’s projected probabilities align more closely with empirical accuracy, indicating enhanced reliability and the confidence of probabilistic outputs. ECE is defined as follows:
where
B represents the total number of confidence bins that estimated probabilities throughout the interval
. The set
comprises the samples for which their predicted probability resides inside the
b-th bin, and
indicates the total number of samples in that bin. The accuracy of samples in bin
is defined as follows:
where
is the predicted binary class label, and
is the indicator function. The mean predicted confidence for bin
is computed as follows:
As a result, each calibration metric reflects a different aspect of probabilistic reliability. The BS examines overall probability accuracy, NLL penalizes overconfident wrong predictions. ECE measures how well expected confidence corresponds with observed accuracy [
54]. The BS examines overall probability accuracies, and NLL penalizes overconfident wrong predictions. ECE measures how well expected confidence corresponds with observed accuracy [
54]. Besides probabilistic calibration, understanding statistical significance is critical. To this end, the McNemar test is applied to examine the prediction accuracy of matched models. It is a non-parametric test applied to a
probability table of paired nominal data between two classifiers. The test statistic integrates Yates’ continuity corrections. It is defined as follows [
55]:
where
b represents the quantity of samples incorrectly assigned by the first model but correctly classified by the second.
c represents the quantity of samples classified by the first model but misclassified by the second. So, the variance in performance is not related to random chance between two models.
3.7. F1-Manifold Threshold Optimization and Uncertainty
One suggested drawback of current methods is their dependence on fixed decision thresholds (e.g.,
). The proposed HFDE–CKD describes threshold selection as a restricted optimization problem. The framework provides a calibrated probability manifold to identify the appropriate threshold,
, that optimizes precision and sensitivity [
56]:
3.8. Performance Evaluation Metrics
The following performance metrics were calculated based on a confusion matrix for the positive class (’ckd’) [
6]:
The area under the ROC curve (AUC-ROC) quantifies the model’s capacity to differentiate between classes at all classification levels. True Positive (TP): The model accurately forecasts the positive class. True Negative (TN): The model accurately identifies the negative class. False Positive (FP): The model incorrectly predicts the positive class when the real class is negative. False Negative (FN): The model incorrectly predicts the negative class when the actual class is positive [
57].
4. Experimental Results and Discussion
The experiments were executed using MATLAB2024b on a system equipped with a 16 GB of RAM and an Intel Core i9 10th Generation CPU. In this section, we conducted a comprehensive experimental analysis of all heterogeneous base learners (MLP, XGBoost, LightGBM, and KNN) using the proposed HFDE–CKD architecture to evaluate their effectiveness in both No-SMOTE and Standard-SMOTE contexts. The experimental investigation was conducted to evaluate the prediction robustness, calibration reliability, and decision stability of the proposed architecture. We offer a comprehensive assessment of performance that incorporates both conventional classification metrics and uncertainty-aware calibration methodologies. Additionally, gains were observed in the normal metrics and in the calibrated functions, including BS, NLL, and ECE. Furthermore, we evaluate and analyze statistical significance and ablation analysis to ensure reliability for CKD in the early stages. Finally, we conduct a SHAP interpretability analysis to evaluate the clinical feature importance, which led to verifying the robustness and consistency of the proposed HFDE–CKD framework with respect to clinical knowledge of CKD.
4.1. Dataset Description and Clinical Features
The dataset utilized in this study was constructed for CKD risk classification using open-source data from the National Health and Nutrition Examination. Additionally, the dataset known as CKD-NHANES 2021-2023 Kaggle [
58] was used. Raw CDC post-pandemic releases can be problematic with missing variables, However, the dataset integrates data into 36 strong clinical and demographic characteristics, representing a complete population of 11,933 patient records. It was analyzed and pre-processed. Additionally, the dataset provides a highly reliable and consistent ground truth for ML evaluation by classifying the severity of kidney disease according to the most recent KDIGO recommendations 2024 and estimated glomerular filtration rate (eGFR). NHANES continues as an ongoing, nationally representative study that gathers cross-sectional data on the health and nutritional status of the U.S. population. The primary features and attributes extracted from this dataset are categorized and detailed in
Table 1. To ensure clinical validity in our proposed HFDE–CKD early-warning framework, these variables are divided into secondary systemic biomarkers (used for predictive modeling) and primary diagnostic proxies (which are utilized for formal KDIGO staging but explicitly excluded from training to prevent target leakage).
In this section, we provide a baseline assessment on the No-SMOTE distribution to demonstrate a fundamental weakness in traditional gradient boosting ensembles. So, the following subsections analyze and discuss the performance of the proposed HFDE–CKD framework using the No-SMOTE procedure.
4.2. Classification Metrics and Probabilistic Calibration
As illustrated in
Table 2, the performance metrics with (Acc, Sens, Spec, and F1 Score) all heterogeneous base models (MLP, XGBoost, LightGBM, and KNN) and the proposed HFDE–CKD was evaluated on the No-SMOTE dataset. The outcomes indicate the significant weakness of gradient boosting methods in the presence of a clinical handicap (i.e., without eGFR, creatinine and albumin). Despite LightGBM’s and XGBoost’s ability to obtain high sensitivities of
and
, respectively, they were at a low level of specificity:
and
, respectively. Thus, these static base models suffered from probabilistic overconfidence, which leads to the production of a lot of false-positive alerts, resulting in significant alert loss in clinical situations. In contrast, the proposed HFDE–CKD framework achieved a trade-off dynamically using epistemic uncertainty. As mentioned in
Table 2, the proposed HFDE–CKD obtained the maximum overall accuracy value of
and a peak F1 score of
. Specifically, the uncertainty-injected meta-learner enhanced diagnostic safety, increasing specificity up to
while maintaining a high sensitivity of
. Moreover, the proposed framework also showed its probabilistic superiority, with the lowest Brier score of
and a very competitive NLL of
. This illustrates that HFDE–CKD is not just guessing by measuring predicted uncertainty, but instead, it delivers highly reliable, high-fidelity probabilities that are safe for proactive clinical decision support.
However, while HFDE demonstrates superior calibration under severe class imbalance, it must be highly stress-tested throughout a stable clinical manifold. So, we evaluate the proposed HFDE–CKD framework under the Standard SMOTE dataset in the next discussion.
As demonstrated in
Table 3, the performance metrics (Acc, Sens, Spec, and F1 score) of all heterogeneous base models and the proposed HFDE–CKD was evaluated on the Standard SMOTE dataset. The outcomes indicate the significant weakness of gradient boosting methods in the presence of a clinical handicap. Despite LightGBM’s and XGBoost’s ability to obtain high sensitivities of
and
, respectively, they were exhibited a low level of specificity:
and
, respectively. Thus, these static base models suffered from probabilistic overconfidence, which led to the production of a lot of false-positive alerts, resulting in significant alert loss in clinical situations. In contrast, the proposed HFDE–CKD framework achieved a trade-off dynamically using epistemic uncertainty. As mentioned in
Table 2, the proposed HFDE–CKD exhibited the maximum overall accuracy of
and peak F1 score of
. Specifically, the uncertainty-injected meta-learner enhanced diagnostic safety, increasing specificity up to
while maintaining a high sensitivity of
. Moreover, the proposed framework also showed its probabilistic superiority, with the lowest Brier Score of
and a very competitive NLL of
. So, the proposed HFDE–CKD framework is not just guessing by measuring predicted uncertainty but instead delivers reliable, high-fidelity probabilities that are safe for clinical decision support.
4.3. Sensitivity–Specificity Stabilization Analysis
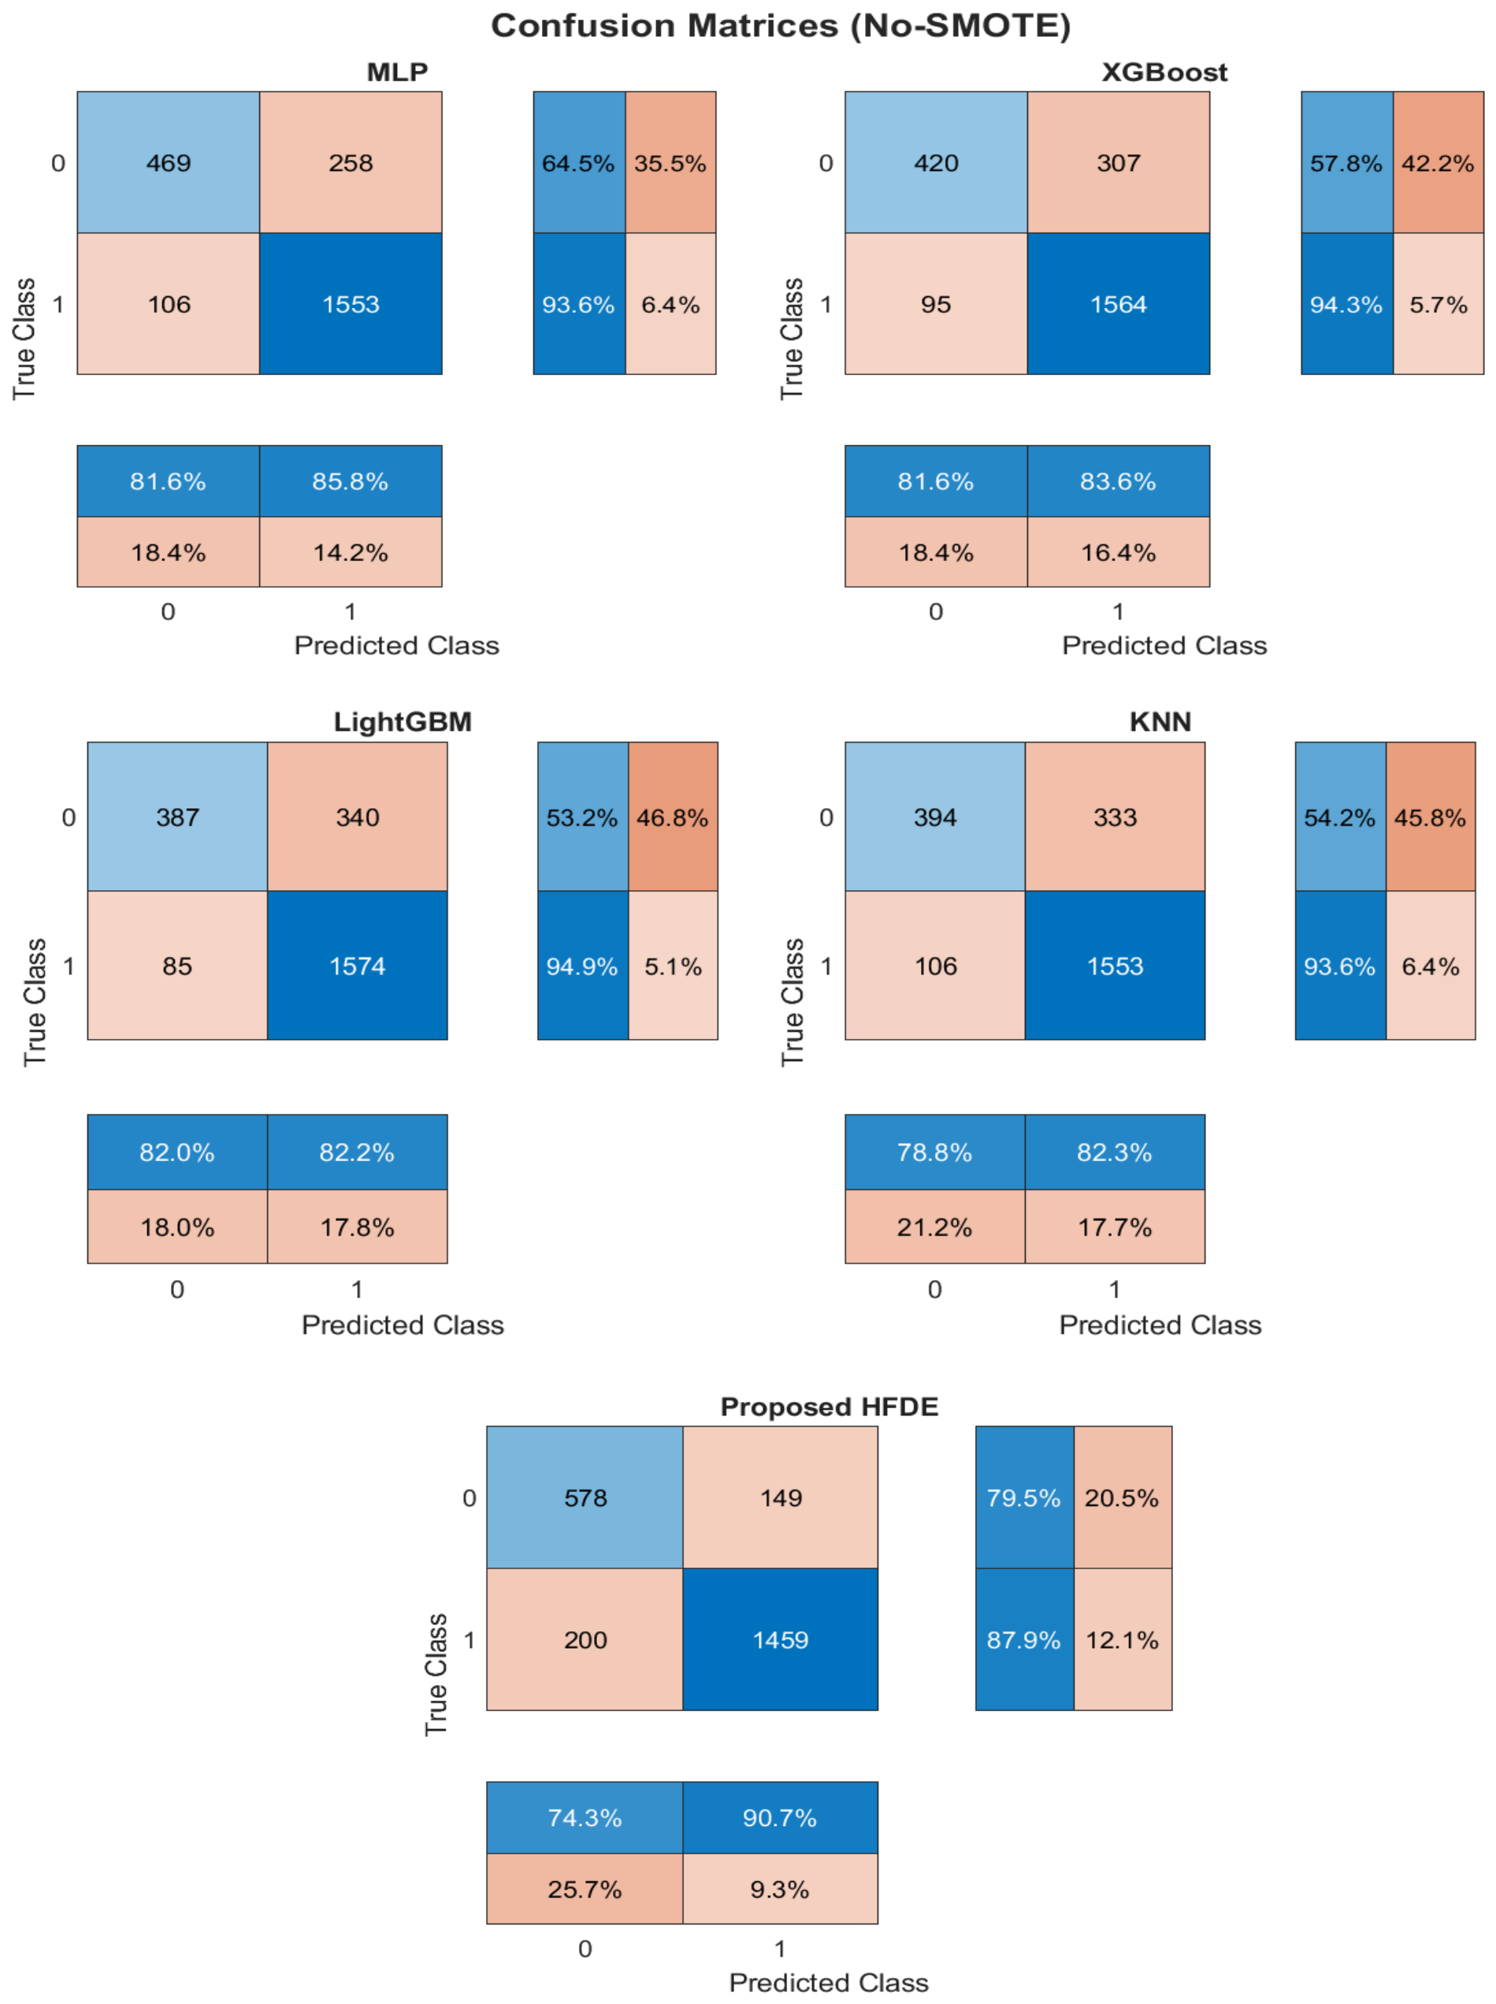
As mentioned in
Figure 2, the confusion matrices of four base learners (MLP, XGBoost, LightGBM, and KNN) and the proposed HDFE-CKD is evaluated. Clearly, models like LightGBM and XGBoost are strongly biased towards the positive class, as they correctly identify most of the real CKD patients but do so by substantially over-predicting the disease and yielding 340 and 307 false positives, respectively. On the other hand, MLP and KNN have the same diagnosis, yielding 258 and 333 false positives, respectively. Thus, the obtained results lead to probabilistic overconfidence and sensitivity and may cause significant alert loss in a real-world situation. As shown in
Figure 2, the proposed HFDE–CKD approach provided significant results by leveraging epistemic uncertainty to reduce false positives and recover 149 and 578 true negatives, respectively, leading to a specificity of
. Moreover, by applying penalizing epistemic uncertainty, the proposed framework effectively halts the base learners from making predictions about ambiguous healthy profiles. Hence, the proposed HFDE–CKD framework has a reliable and trustworthy diagnostic scheme and can be an early screen tool for CKD.
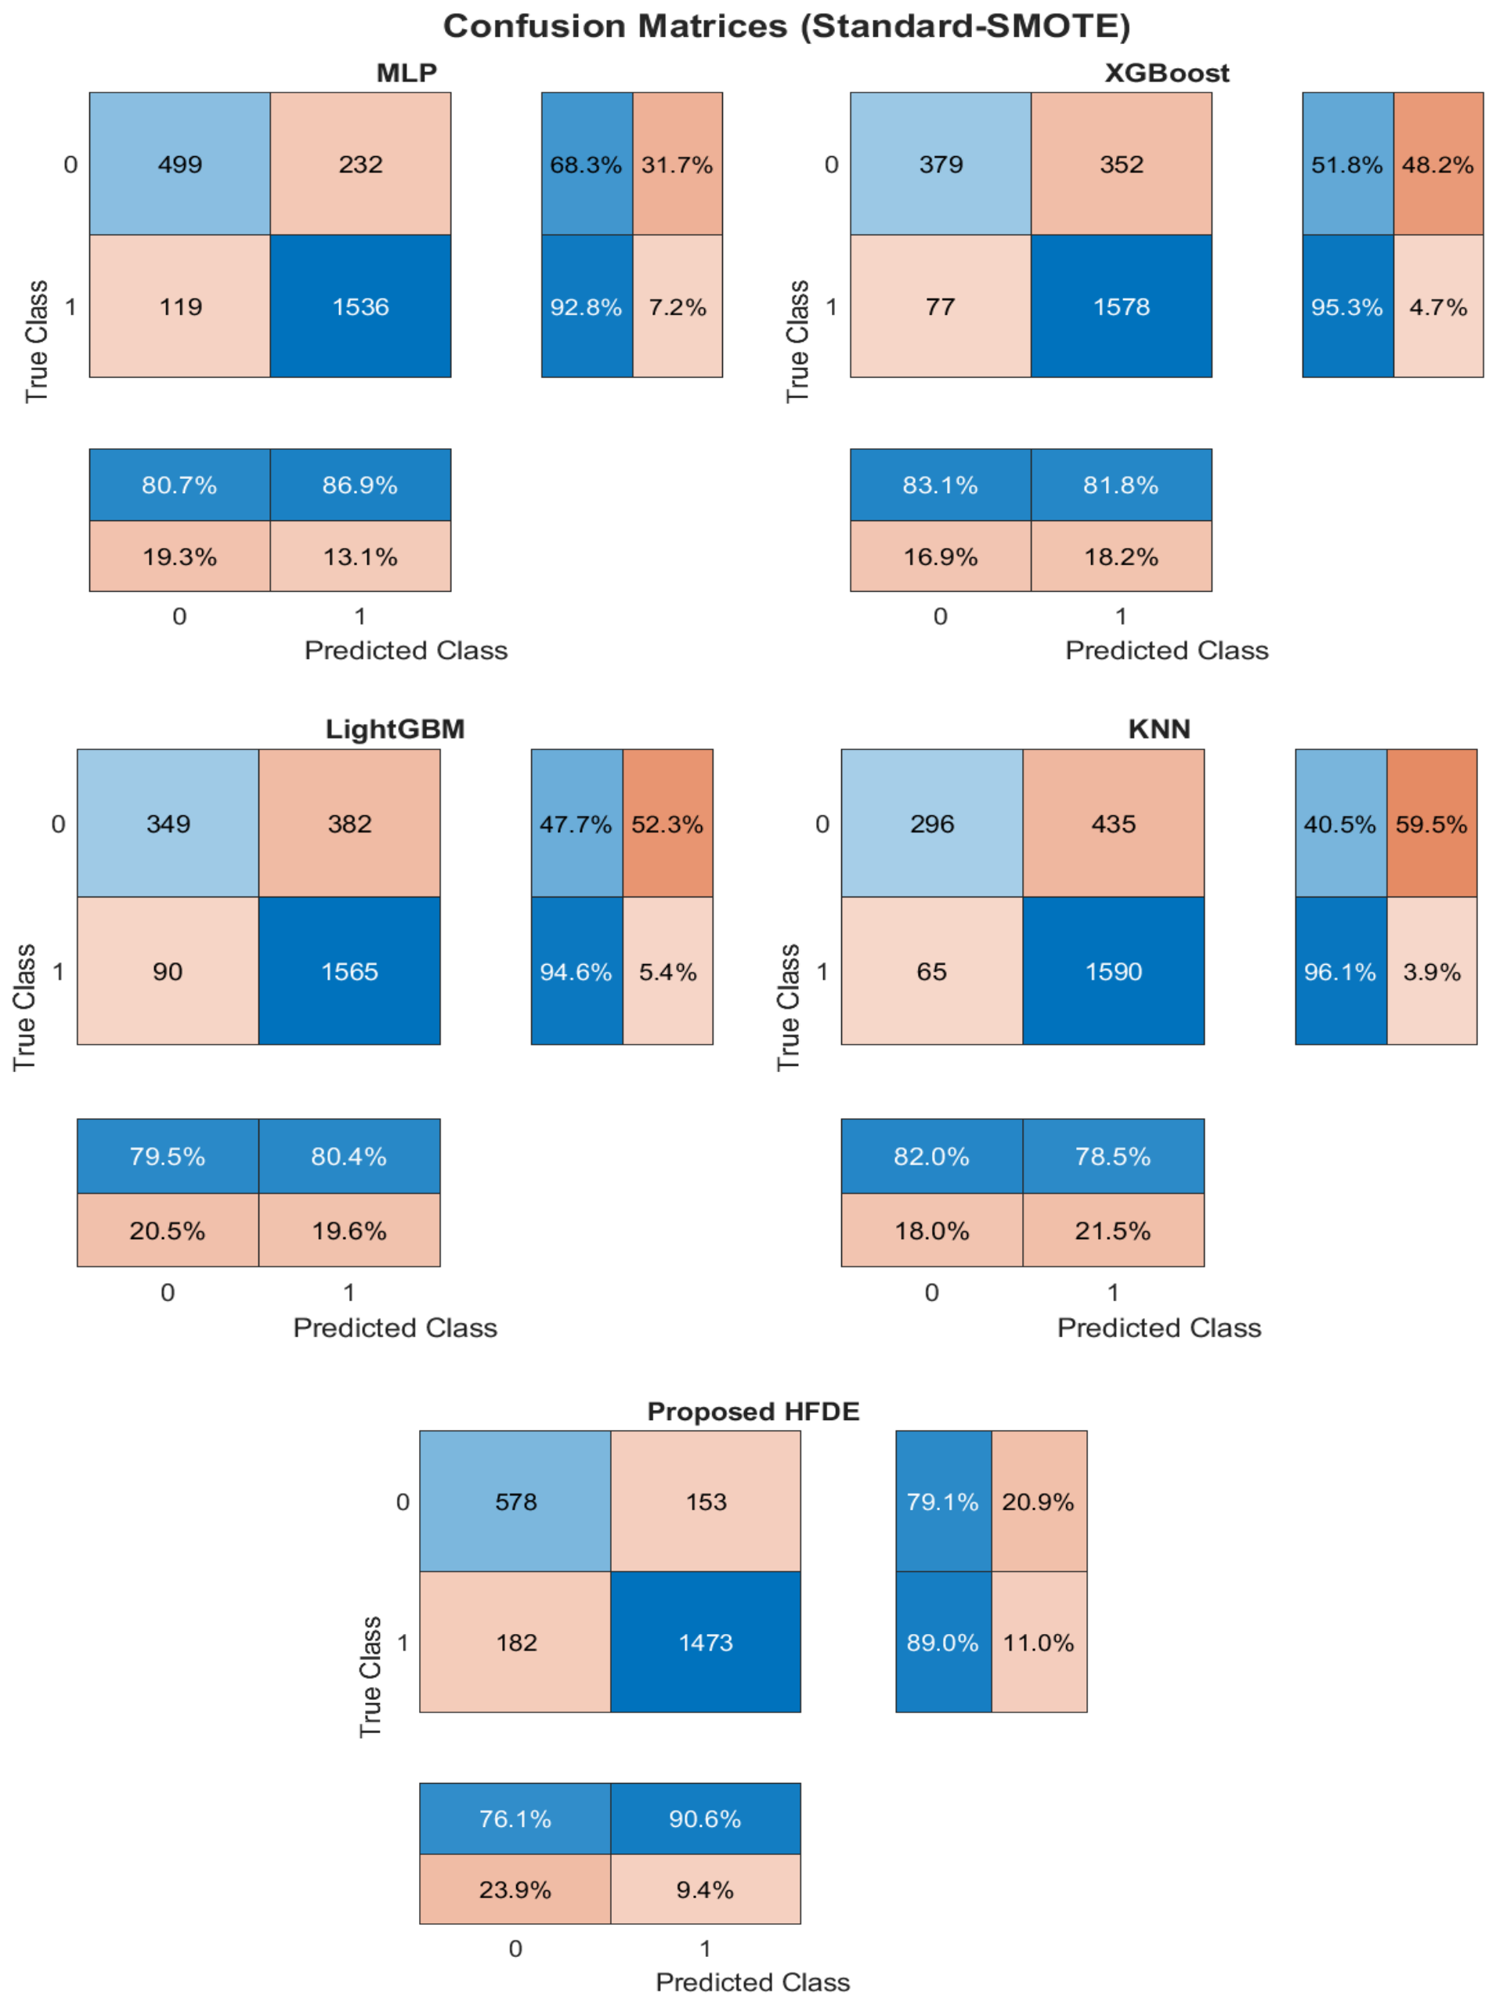
As mentioned in
Figure 3, the confusion matrices of four base learners (MLP, XGBoost, LightGBM, and KNN) and the proposed HFDE–CKD are evaluated. Clearly, models like LightGBM and XGBoost are strongly biased towards the positive class; they correctly identify most of the real CKD patients but do so by substantially over-predicting the disease, yielding 382 and 352 false positives, respectively. On the other hand, MLP and KNN exhibit similar diagnostic skews, yielding 232 and 435 false positives, respectively. Thus, these static base models suffer from probabilistic overconfidence, artificially inflating sensitivity, which would cause significant alert fatigue in a real-world clinical situation. As shown in
Figure 3, the proposed HFDE–CKD approach provides significant improvements by leveraging epistemic uncertainty to reduce false positives to 153 and recover true negatives to 578, leading to a specificity of
. Moreover, by actively penalizing epistemic uncertainty, the proposed framework effectively halts the base learners from making predictions for ambiguous healthy profiles. Hence, the proposed HFDE–CKD framework offers a reliable and trustworthy diagnostic scheme to serve as an early screening tool for CKD.
4.4. ROC and Precision–Recall Analysis
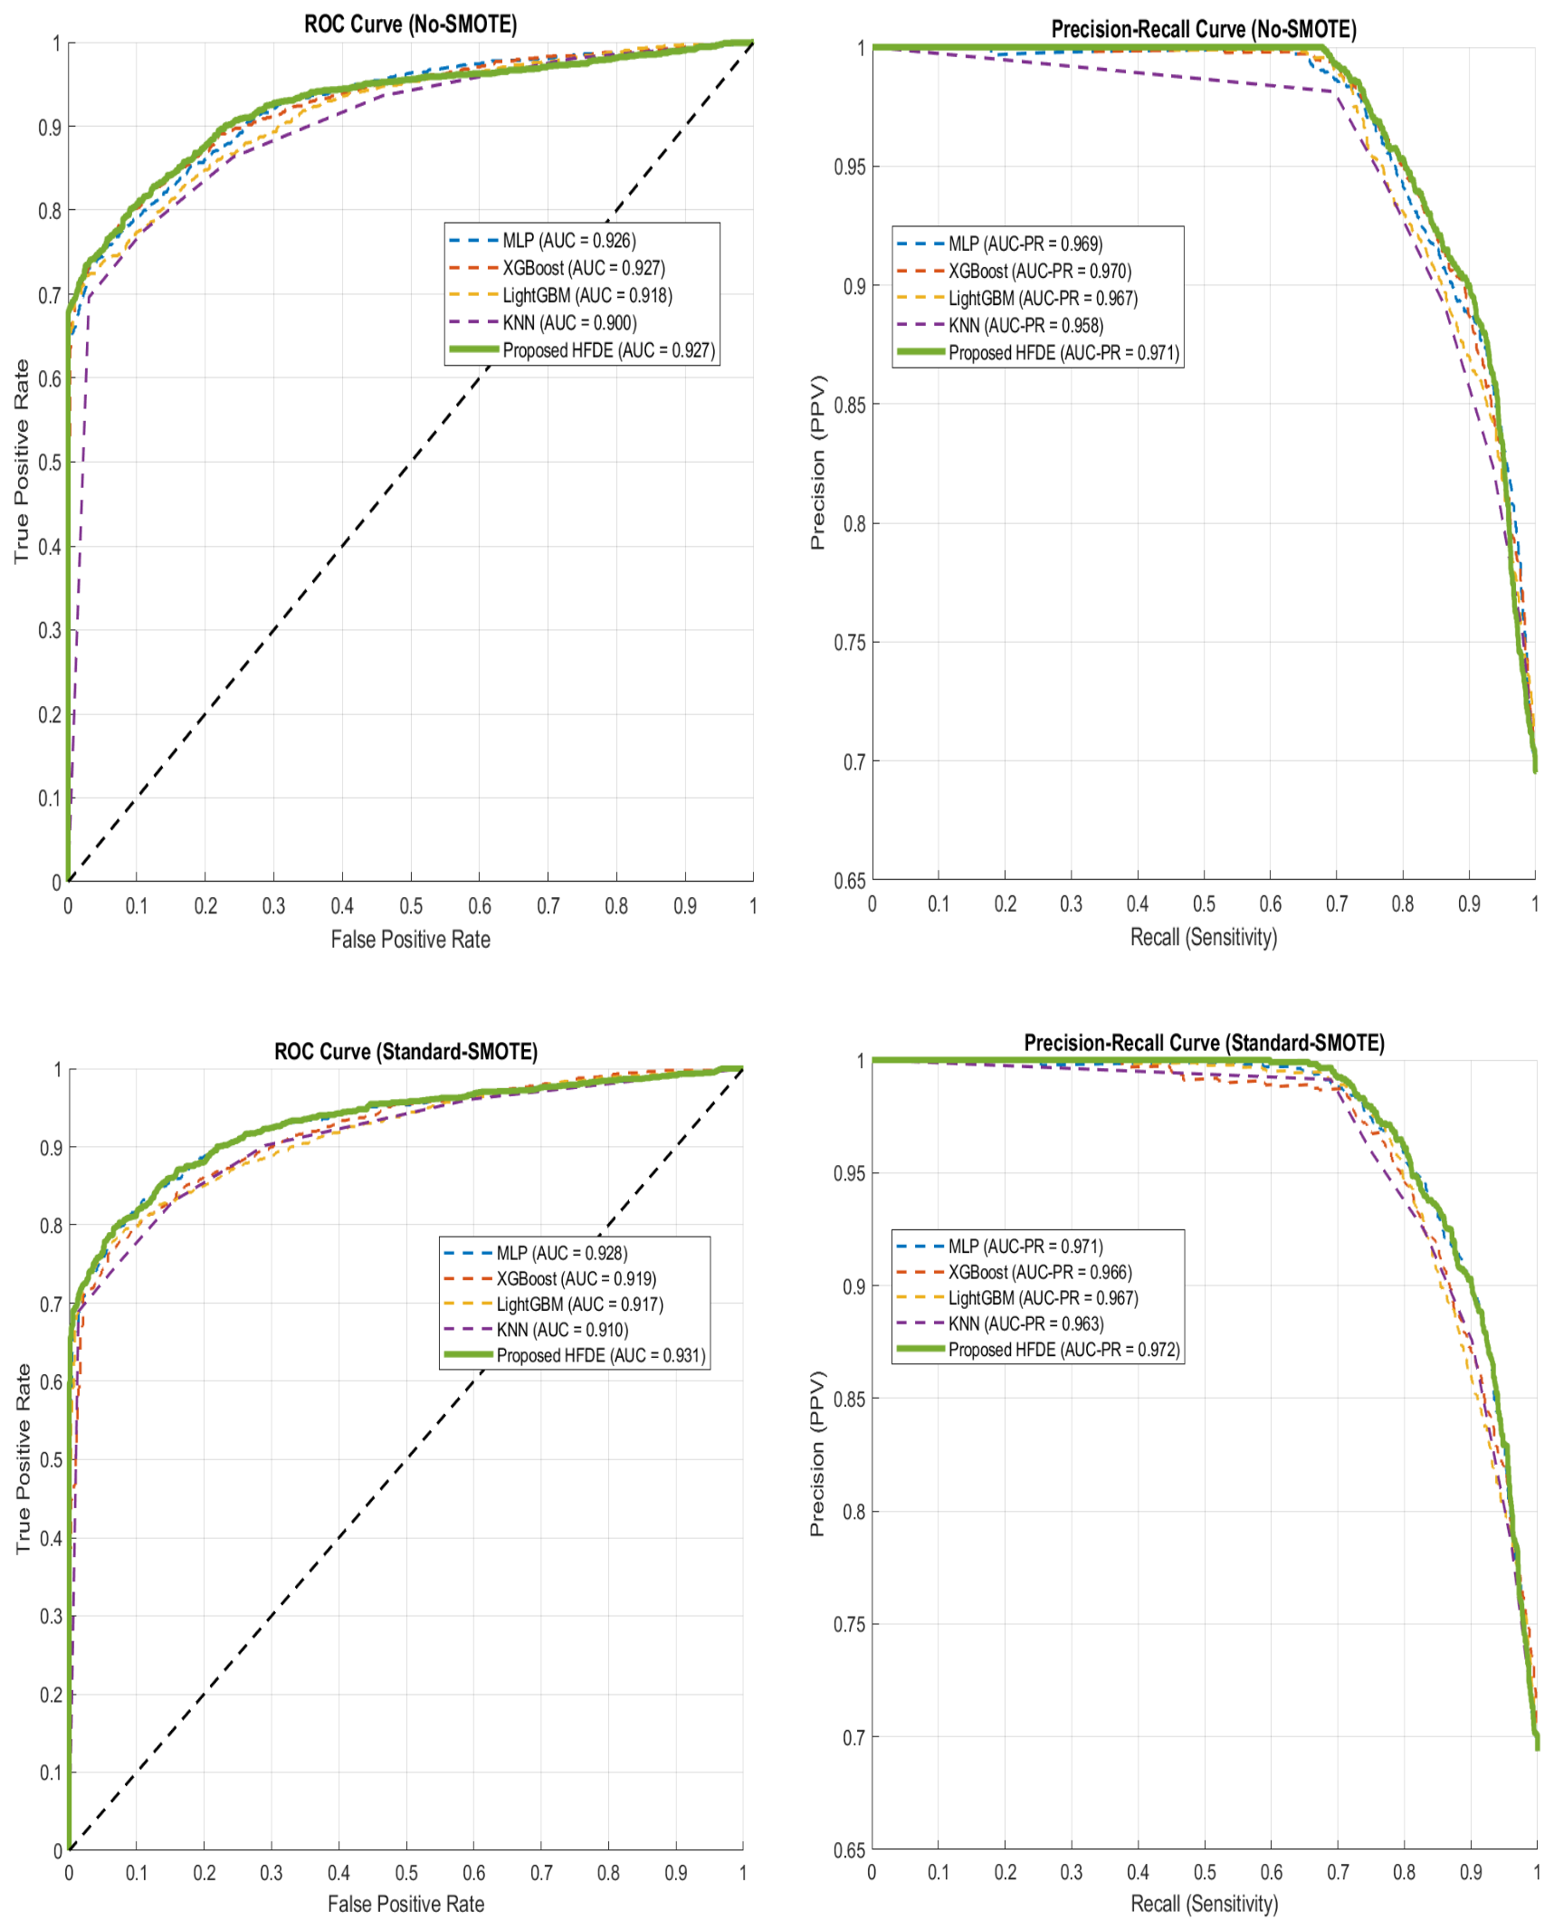
As shown in
Figure 4, receiver operating characteristic (ROC) and precision–recall (PR) curves were analyzed under both No-SMOTE and Standard SMOTE conditions. The obtained results of our proposed framework showed that ROC curves can frequently provide positive performance, with an AUC value of
, which is related to the high proportion of true negatives according to the No-SMOTE scenario. Additionally, the PR curve is a significantly increasing measure. The proposed HFDE architecture effectively fixes this No-SMOTE data and achieves the maximum PR-AUC of
. This indicates that the uncertainty-injected meta-learner retains excellent prediction accuracy throughout the whole probability range, even without synthetic augmentation. In addition, after switching to the balanced Standard SMOTE distribution, traditional gradient boosting techniques like XGBoost and LightGBM suffer when forced to learn from the generated manifold that was adjusted, as illustrated in
Figure 4. Thus, XGBoost’s ROC-AUC is lowered from
to
, and LightGBM follows suit. Meanwhile, the proposed HFDE–CKD framework depends on balanced geometry and improves performance by dynamically translating the variance between these weak base estimators, producing a peak ROC-AUC and PR-AUC of
and
, respectively. So, the HFDE–CKD approach not only optimizes a single classification threshold but also incorporates uncertainty-aware fusion, which indicates superior discrimination between CKD and non-CKD cases without data leakage.
Figure 2.
The confusion matrices of all base learner models and the proposed HFDE–CKD according to the No-SMOTE dataset.
Figure 2.
The confusion matrices of all base learner models and the proposed HFDE–CKD according to the No-SMOTE dataset.
Figure 3.
The confusion matrices of all base learner models and the proposed HFDE–CKD according to the Standard SMOTE dataset.
Figure 3.
The confusion matrices of all base learner models and the proposed HFDE–CKD according to the Standard SMOTE dataset.
Therefore, these outcomes confirm that the proposed HFDE–CKD is highly reliable and effective in handling class separation, providing the strongest predictive stability among the evaluated classifiers.
4.5. Clinical Feature Correlation and Redundancy
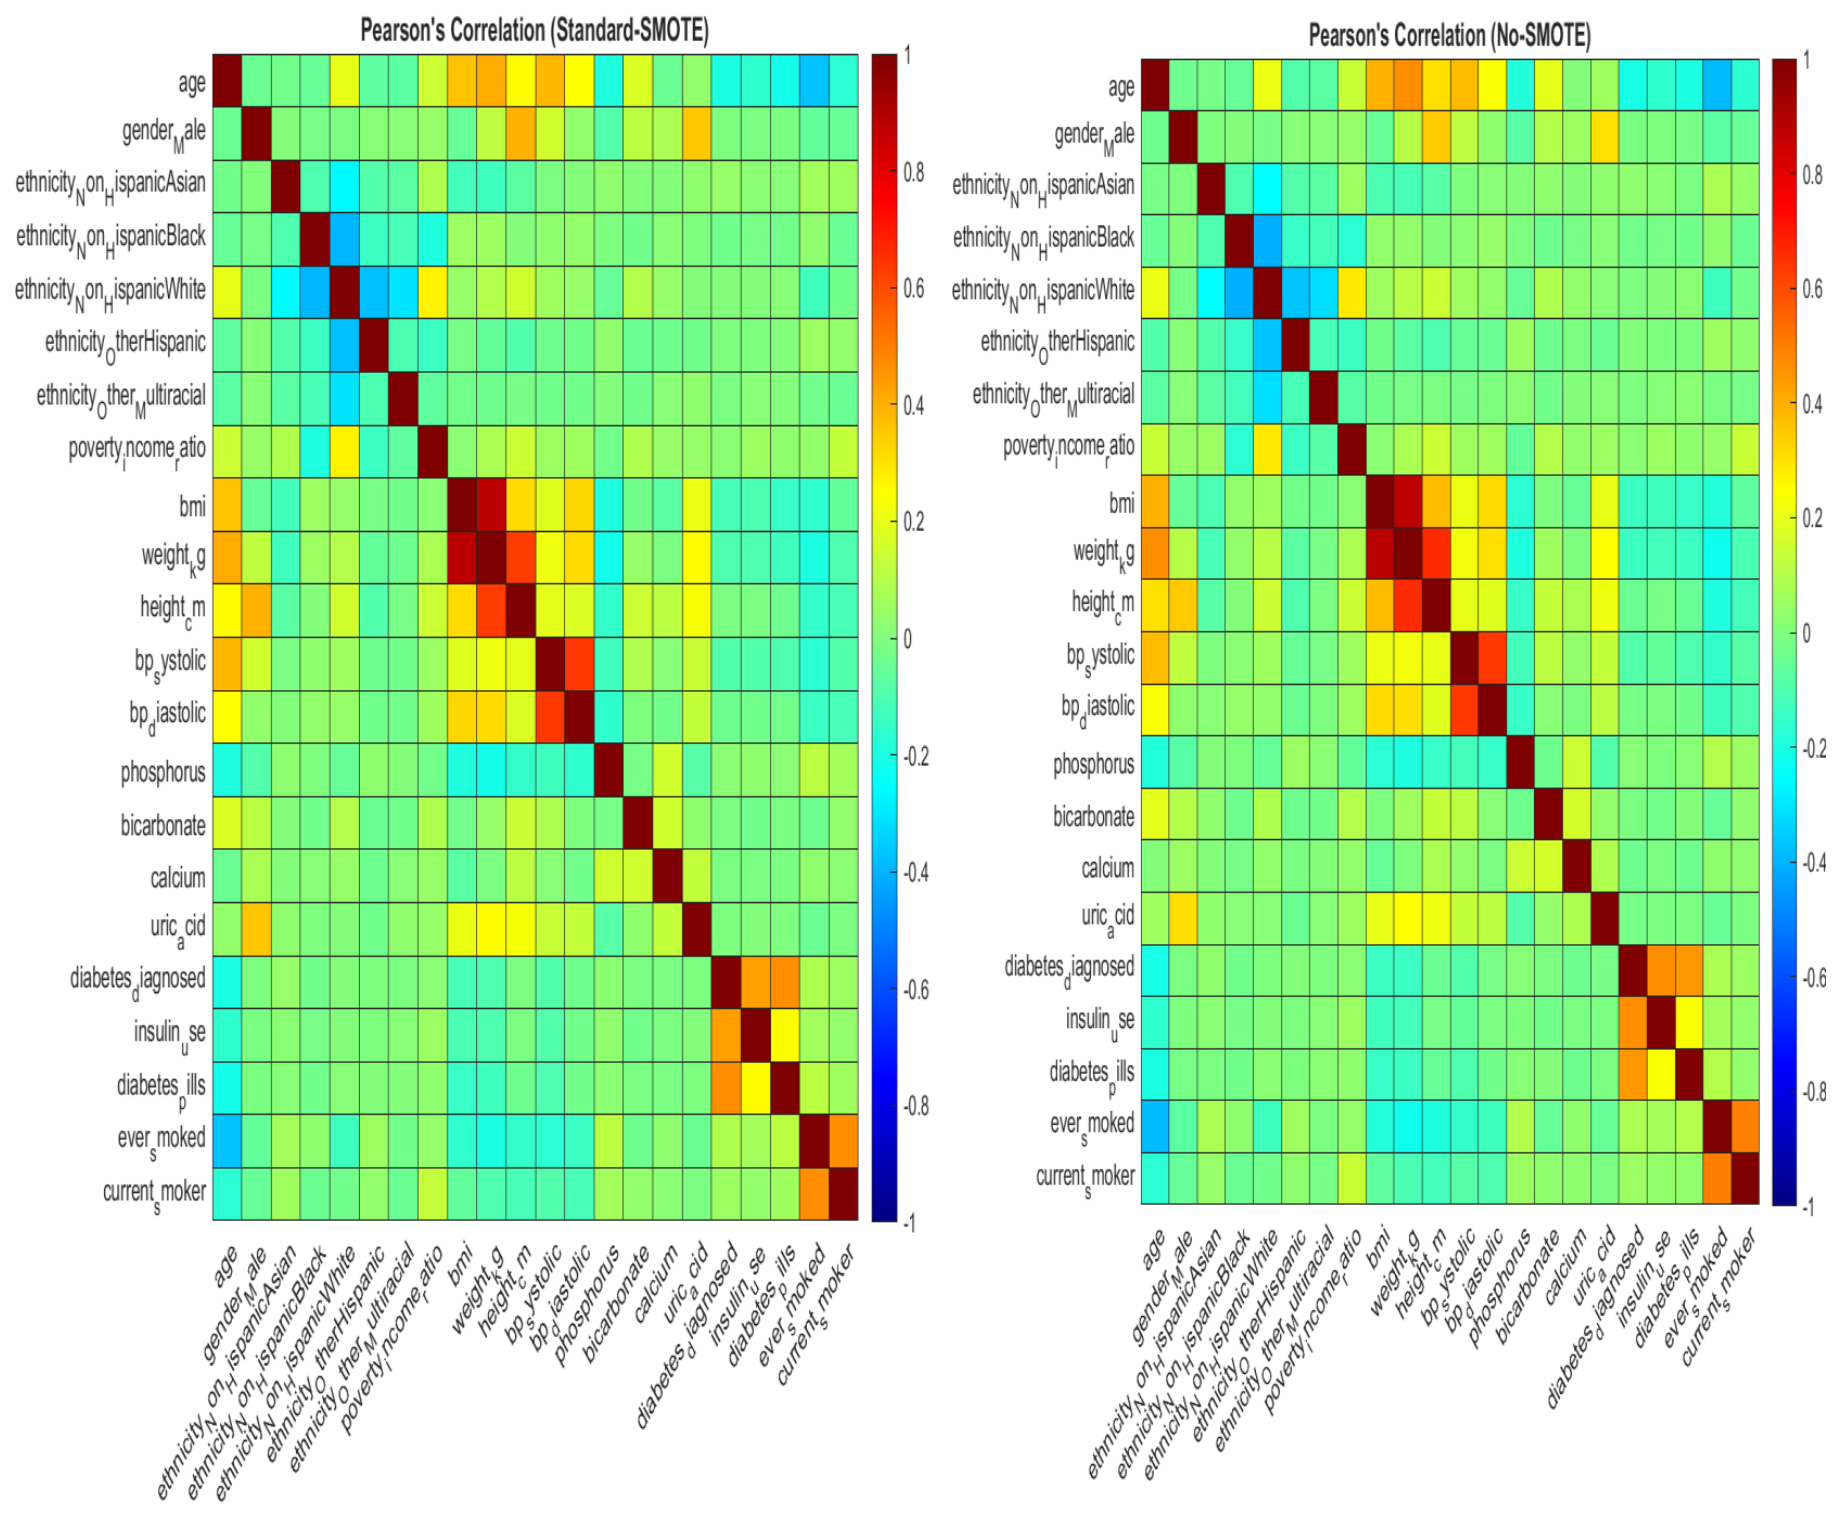
As shown in
Figure 5, a Pearson correlation matrix [
59] was generated to evaluate the linear dependencies between clinical features within the No-SMOTE and Standard SMOTE datasets. Clearly, the feature importance rankings exhibit strong consistency across the baseline learners and the proposed HFDE framework. Despite minor variations in ordering, a stable subset of predictors consistently dominates the attribution profiles. The correlation matrix evaluates how strongly features are related to each other. High positive values (red) indicate strong direct relationships, while negative values (blue) indicate inverse relationships. Most features show weak to moderate correlations, but strong associations are clearly visible among anthropometric attributes, such as body mass index (bmi) and weight (weight-kg), as well as among metabolic markers, including diagnosed diabetes (diabetes-diagnosed), insulin use (insulin-use), and diabetes medication (diabetes-pills). This highlights the inherent redundancy between certain physical and metabolic parameters and reinforces the importance of selecting only the most informative clinical variables for robust CKD predictions.
Figure 4.
The RoC and PR-AUC curves of all base learners according to No-SMOTE and Standard SMOTE datasets.
Figure 4.
The RoC and PR-AUC curves of all base learners according to No-SMOTE and Standard SMOTE datasets.
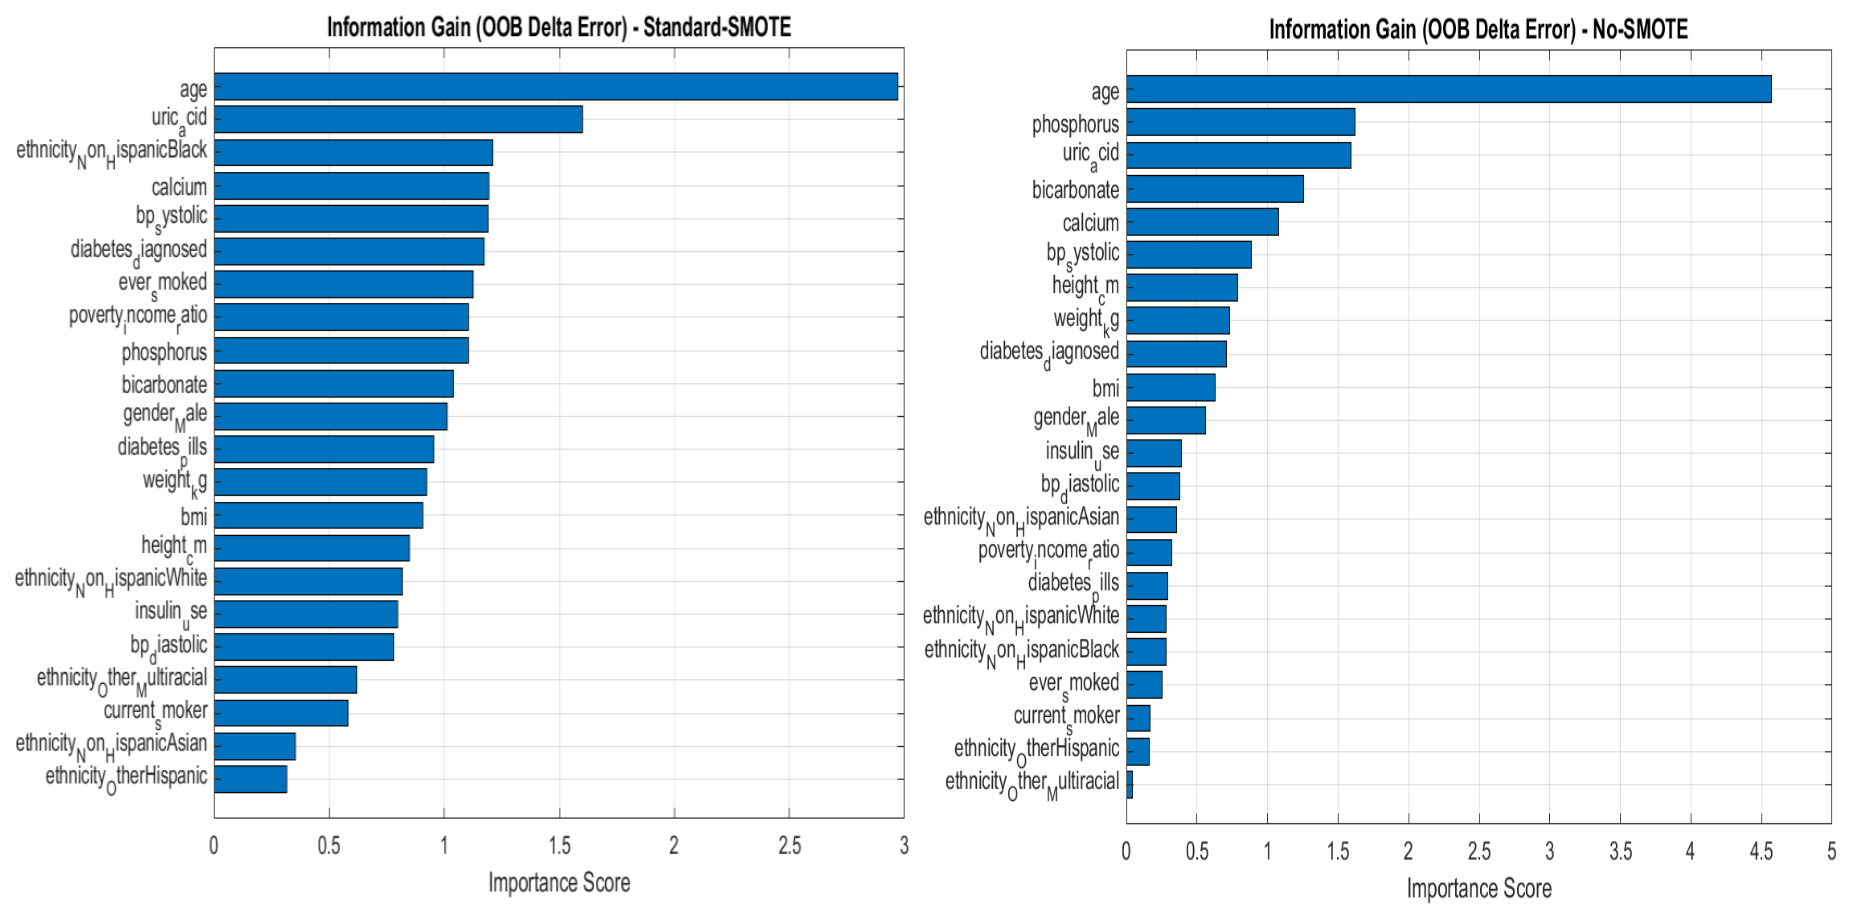
As demonstrated in
Figure 6, we illustrate the feature importance used in the underlying drivers of the proposed HFDE–CKD framework. It was evaluated using the OOB permutation error extracted from the random forest base estimators. The OOB delta error provides an unbiased estimate of feature relevance by measuring the drop in predictive accuracy when a specific variable is randomly shuffled. Consequentially, we compared clinical feature information gain under the No-SMOTE and Standard SMOTE features. The obtained results demonstrate that the age feature is overwhelmingly the strongest independent predictor of CKD across all data distributions, supported by uric acid and calcium. Furthermore, the No-SMOTE model emphasizes late-stage metabolic collapse signs like phosphate and bicarbonate when assessing the unbalanced clinical manifold. Meanwhile, when trained on the balanced Standard SMOTE dataset, which includes more borderline and early-stage cases, the model prioritizes systemic and demographic vulnerabilities, increasing the predictive power of features like Non-Hispanic Black ethnicity. This shows that the proposed HFDE–CKD framework does not rely on a static rule set frequently; rather, it dynamically adjusts its feature priority to capture the most significant clinical signals depending on patient distribution complexity.
Figure 5.
Feature selection analysis using a Pearson correlation matrix according to the No−SMOTE and Standard−SMOTE datasets.
Figure 5.
Feature selection analysis using a Pearson correlation matrix according to the No−SMOTE and Standard−SMOTE datasets.
Figure 6.
Feature selection analysis of the proposed HFDE–CKD framework using information gain according to the No-SMOTE and Standard SMOTE datasets.
Figure 6.
Feature selection analysis of the proposed HFDE–CKD framework using information gain according to the No-SMOTE and Standard SMOTE datasets.
4.6. Ablation Analysis and Statistical Significance
We performed an ablation study with the obtained results in
Table 4 to evaluate and validate the independent usage of the uncertainty-aware fusion process. The proposed HFDE–CKD architecture was assessed on a simple baseline ensemble without the epistemic uncertainty quantification module. We also used McNemar’s test, which was utilized to evaluate the prediction differences between our proposed HFDE–CKD model and LightGBM, ensuring that the observed performance gains were not a result of random variations. The addition of the uncertainty module significantly improves the native, unbalanced No-SMOTE distribution, with the F1 score increasing from
to
. Additionally, the McNemar test (
) shows that the improvement is statistically significant. The variance matrix shows that HFDE effectively corrected 218 misclassifications by LightGBM (
), which shows the capacity of HFDE to prevent the probabilistic overconfidence of gradient boosting methods. Furthermore, McNemar’s test reveals a substantial and very significant shift in diagnostic behavior (
,
). This HFDE–CKD design reclassified 240 patients that LightGBM missed in this manifold, but it only created 103 additional mistakes (
). This shows that while synthetic augmentation improves the stability of the global metrics of the baseline models, the theoretical uncertainty module actively reshapes the decision boundary at the patient level, trading arbitrary false positives for a much safer and more reliable clinical diagnostic footprint.
4.7. Local Interpretability and SHAP Analysis
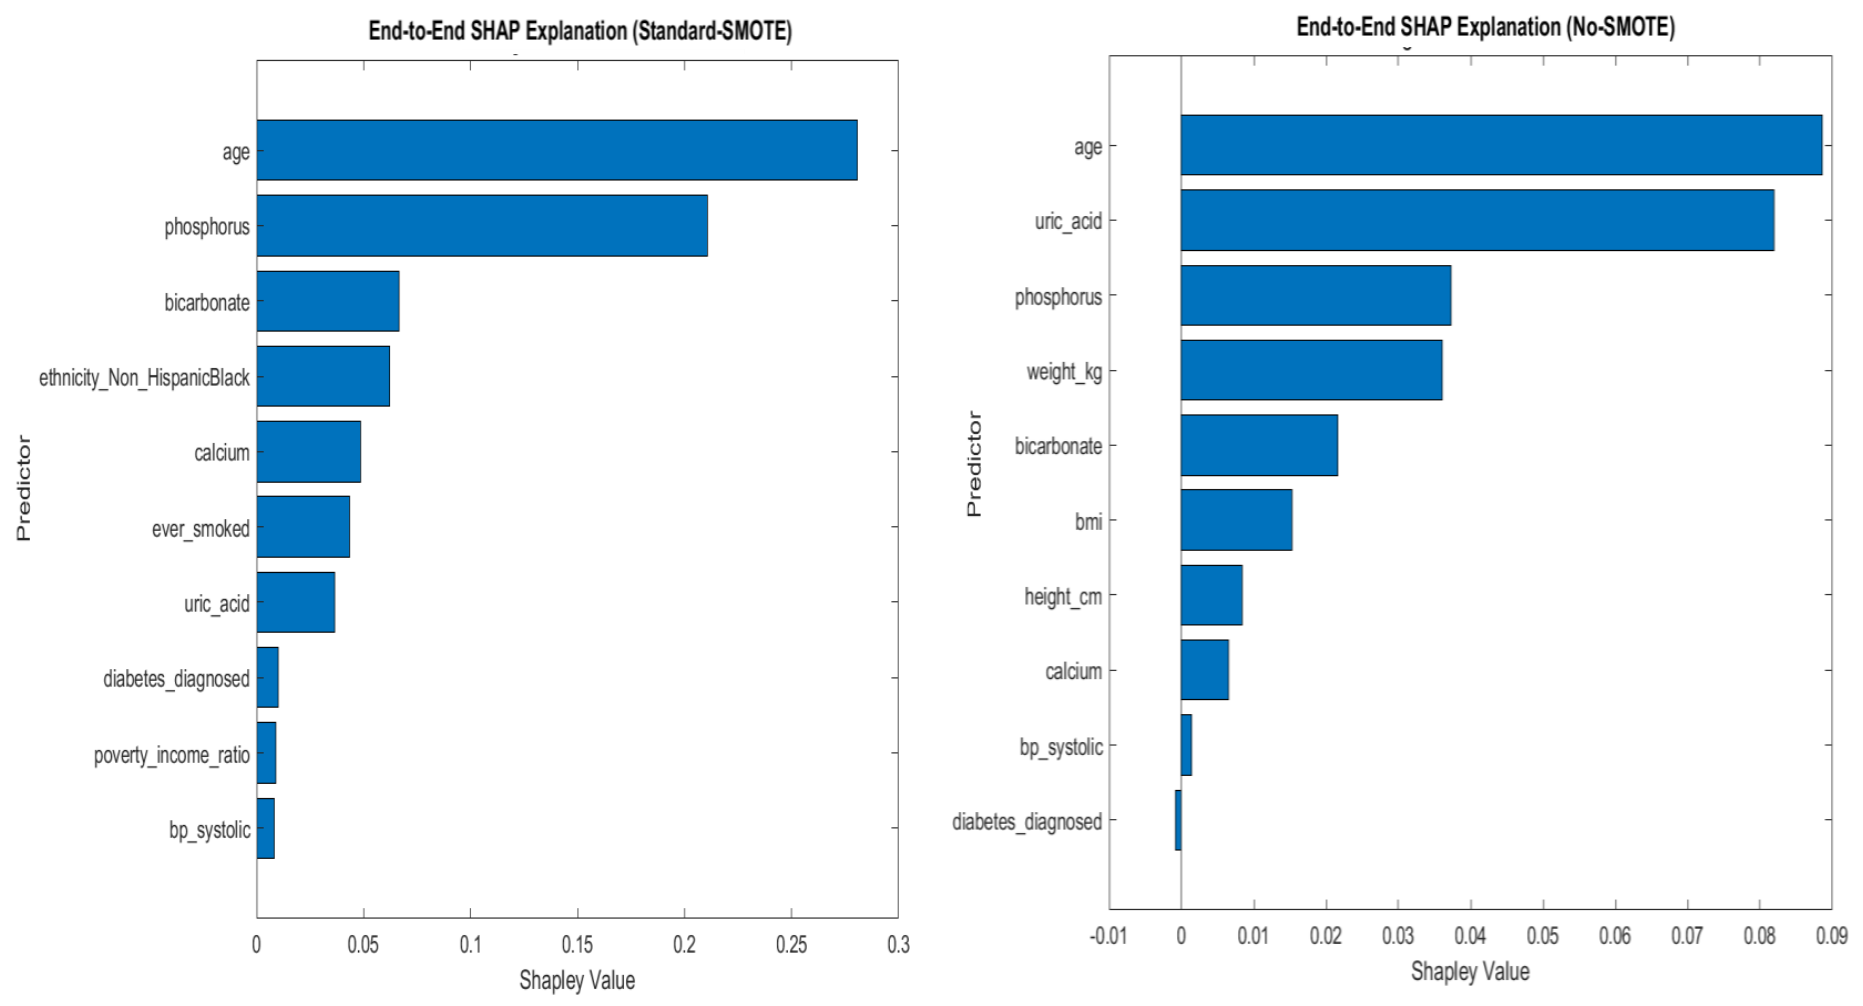
As shown in
Figure 7, SHapley Additive Explanations (SHAPs) [
60] were created to simplify the HFDE–CKD framework decision-making process for high-risk queries according to No-SMOTE and Standard SMOTE datasets. SHAP measures exactly how much each clinical feature influenced the final decision, turning a complex algorithm into an interpretability framework that matches real-world medical knowledge. Across both the native No-SMOTE and Standard SMOTE datasets, age and phosphorus consistently serve as the primary drivers for a positive CKD diagnosis. Nevertheless, the adaptability of the HFDE–CKD architecture is its fundamental advantage. For instance, the model was significantly influenced by physical indicators such as weight and BMI when evaluating a patient in the No-SMOTE dataset, resulting in a positive prediction. In contrast, the model’s focus in the balanced Standard SMOTE dataset was to extensively consider demographic hazards, such as Non-Hispanic Black ethnicity and lifestyle history (for example, having ever smoked). This proves that the HFDE–CKD framework does not rely on rigid, one-size-fits-all rules. Instead, it creates a personalized, transparent risk profile for every patient, allowing clinicians to see exactly why a specific diagnostic alert was triggered.
Table 4.
Ablation study and McNemar’s statistical test evaluating the impact of epistemic uncertainty injection under No-SMOTE and Standard SMOTE datasets.
Table 4.
Ablation study and McNemar’s statistical test evaluating the impact of epistemic uncertainty injection under No-SMOTE and Standard SMOTE datasets.
| Data Condition | Ablation Configuration | F1 Score | McNemar’s Test (HFDE vs. LightGBM) |
|---|
| | Statistic
|
-Value
|
|---|
| No−SMOTE | Baseline (No Uncertainty) | 0.9011 | 218 | 142 | 15.625 | <0.001 *** |
| Proposed HFDE (With Uncertainty) | 0.9332 |
| Standard−SMOTE | Baseline (No Uncertainty) | 0.8981 | 240 | 103 | 53.924 | <0.001 *** |
| Proposed HFDE (With Uncertainty) | 0.8999 |
Figure 7.
Local interpretability of the HFDE–CKD framework using SHAP according to the No−SMOTE and Standard−SMOTE datasets.
Figure 7.
Local interpretability of the HFDE–CKD framework using SHAP according to the No−SMOTE and Standard−SMOTE datasets.
5. Conclusions
This study introduces the Hyper-Fidelity Dynamic Ensemble (HFDE–CKD) framework for chronic kidney disease (CKD) diagnosis to overcome probabilistic overconfidence and data leakage—major flaws in modern diagnostic models. We present a novel meta-learning framework that outperforms standard ensemble models by functioning as a dynamic cognitive gatekeeper, measuring the epistemic uncertainty of heterogeneous base learners (MLP, XGBoost, LightGBM, and KNN). The proposed HFDE–CKD outperforms conventional standalone algorithms on the NHANES dataset, particularly in clinical scenarios where late-stage renal indicators (e.g., eGFR, serum creatinine) are excluded. Evaluated across No-SMOTE and Standard SMOTE distributions, the framework effectively reduces epistemic uncertainty to enhance true negative recovery. Dynamic stabilization maintains a robust specificity of approximately , significantly decreasing false alarms while preserving peak F1 scores up to and a PR-AUC of . The framework exhibits high clinical dependability through enhanced probabilistic calibration, achieving Brier scores and NLL as low as and , respectively. Ablation analyses confirm statistical superiority (McNemar’s test, ), demonstrating that the uncertainty-injected meta-learner corrects base learner misclassifications. In addition to robust predictive accuracy, the framework’s clinical transparency was validated by comprehensive Pearson correlation, information gain, and SHAP evaluations. Furthermore, the model effectively addressed feature redundancies and dynamically adjusted its diagnostic based on metabolic indicators during No-SMOTE distributions while adaptively transitioning to demographic vulnerabilities and lifestyle risks to assess borderline cases under the Standard SMOTE distribution. Finally, we conclude that the HFDE–CKD framework provides a precisely calibrated, robust, and reliable decision-support tool for the early screening of CKD diagnosis.
Future research should focus on integrating other data modalities such as medical imaging, longitudinal laboratory measurements, and genomic information to enhance diagnostic accuracy even further. Moreover, interpretability could be improved by incorporating causal modeling and explainable attention mechanisms that would provide clinicians with deeper insights into the impact of individual features on diagnosis decisions.