Article

Differences in Physical Fitness Among Chinese National-Team Male Rugby Sevens Players by Position and Sprint Performance


1
School of Physical Education, Huazhong University of Science and Technology, Wuhan 430074, China
2
Department of Life Sciences, Graduate School of Arts and Sciences, The University of Tokyo, Tokyo 153-8902, Japan
3
School of Education and Welfare, Aichi Prefectural University, Nagakute 480-1198, Japan
*
Author to whom correspondence should be addressed.
These authors contributed equally to this work.
Appl. Sci. 2026, 16(15), 7529; https://doi.org/10.3390/app16157529
Submission received: 15 June 2026 / Revised: 22 July 2026 / Accepted: 23 July 2026 / Published: 29 July 2026

Abstract

Background: Rugby sevens demands distinct physical profiles across positions. This study investigated anthropometric and physical fitness characteristics of Chinese national team male rugby sevens players. Methods: Twenty-one players (forwards: n = 10, backs: n = 11) completed anthropometric measurements, linear sprints (10 m, 40 m, 50 m, and 60 m), agility tests (T-test, Illinois, 20 shuttle run), Wingate anaerobic test, Yo-Yo intermittent recovery test level 2, goalpost shuttle run, vital capacity, and VO2peak. Players were split into fast/slow groups by median 40 m time. Results: Forwards were significantly taller (adjusted p = 0.0022, d = 2.78), heavier (adjusted p = 0.0073, d = 1.76), and had greater muscle mass (adjusted p = 0.027, d = 1.47) with large effect sizes compared with backs. Backs showed significantly better agility with large effect sizes (Illinois: adjusted p = 0.018, d = 2.00). When players were classified into fast and slow sprint groups by median 40 m time, the fast group exhibited significantly better 10 m (adjusted p = 0.04, d = −2.00), 50 m (adjusted p = 0.017, d = −1.98), and 60 m (adjusted p = 0.017, d = −1.71) performance. Conclusion: Playing positions in Chinese rugby sevens present significantly different body size and agility profiles. When grouped by sprint speed, faster players possess superior multi-distance sprinting capacities. Both positional and sprint capabilities should guide training and selection.

1. Introduction

Rugby sevens is a team collision sport that integrates strength, speed, agility, and endurance. Its fast tempo, high collision intensity, and frequent transitions between attack and defense impose extremely high demands on sport-specific physical fitness [1]. Compared with rugby union fifteens, rugby sevens has a shorter match duration but a higher exercise intensity per unit of time, requiring athletes to possess superior repeated high-intensity exercise capacity and rapid recovery ability [2]. It also shows clear position-specific characteristics. In a standard seven-player team, there are typically three forwards and four backs. Forwards are mainly responsible for scrummaging, physical collisions, and advancing possession in contact situations, and therefore require high levels of absolute strength and body-contact capacity. Backs, in contrast, play a central role in passing, line breaks, counterattacks, and defensive transitions, placing greater demands on speed, agility, and explosive power [3]. These position-specific functions determine the distinct anthropometric and fitness characteristics of athletes in different playing positions. Previous studies have shown that rugby players in different positions showed significant differences in anthropometric characteristics and physical fitness [4,5], and that physical fitness characteristics were strongly related to match performance [6]. Other studies have found that fitness-test indicators could effectively predict high-intensity running performance in rugby players, with acceleration capacity and anaerobic power identified as key indicators [7]. It has been reported that the average running volume of rugby sevens players ranged from 86 to 120 m·min−1, with high-speed running distance ranging from 1 to 27 m·min−1 [8,9,10,11]. Compared with rugby union fifteens, relative running volume increases by approximately 45%, and high-speed running demand (>5 m·s−1) increases by approximately 135% among rugby sevens [10]. At present, a relatively mature sport-specific fitness testing system has been established in rugby, and methods such as the Wingate anaerobic test, Illinois Agility Run, and Yo-Yo Intermittent Recovery Test are widely used for sport-specific fitness assessment and monitoring [5,12,13,14]. However, research on position-specific physical fitness characteristics in Chinese male rugby sevens players remains limited, and existing data are insufficient to support the design and implementation of individualized sport-specific conditioning programs in China.
In addition, the 40 m linear sprint is a core standardized test for assessing rugby-specific speed. It reflects both starting acceleration and maximal sprinting speed, is closely related to key technical and tactical behaviors such as line breaks, chase defense, counterattacks, and wide-channel advancement, and is an important indicator for predicting high-intensity running and competitive performance [5,7,15]. Nevertheless, the physical fitness differences between sprinting fast and slow players in the 40 m sprint remain inadequately explored in the current literature. In elite sports science, performance-based stratification (e.g., median-split classification) has been successfully employed within small cohorts to identify subtle functional variations, such as distinguishing speed and agility profiles in professional rugby players [16]. However, the extent to which 40 m sprint capacity independently interacts with physical and physiological characteristics in rugby sevens has not been fully explored, particularly among Chinese national-level players. To address this, the present study adopted a dual-axis approach, grouping participants both by playing position and by 40 m sprint performance, offering preliminary data to support individualized training.
Therefore, this study was designed with two exploratory analysis aims: (1) to compare anthropometric and physical fitness characteristics between forwards and backs, and (2) to examine whether players with faster 40 m sprint times exhibit superior aerobic and anaerobic fitness compared to slower sprinters. The hypotheses were that (a) forwards would be taller, heavier, and have greater muscle mass and anaerobic power, whereas backs would demonstrate better agility and shuttle-run performance; and (b) players in the faster sprint group would show higher VO2peak, peak anaerobic power, and better performance in agility and repeated-shuttle tests, reflecting a general association between sprint speed and broader fitness capacity. Given the population-specific context of this study, these hypotheses serve to guide our empirical comparisons, with the findings positioned primarily as targeted, population-specific evidence for the elite Chinese national rugby sevens team.

2. Materials and Methods

2.1. Study Design

Twenty-one male Chinese rugby sevens players aged 17–25 years (age: 21.6 ± 2.6 years; height: 181.8 ± 6.6 cm; body mass: 82.5 ± 8.3 kg) volunteered to participate in this cross-sectional observational study. Testing was conducted during the preseason period (Tianjin, China, 2024). Participants were classified by playing position as forwards (n = 10) or backs (n = 11), with a mean rugby playing experience of 4.8 ± 2.6 years.
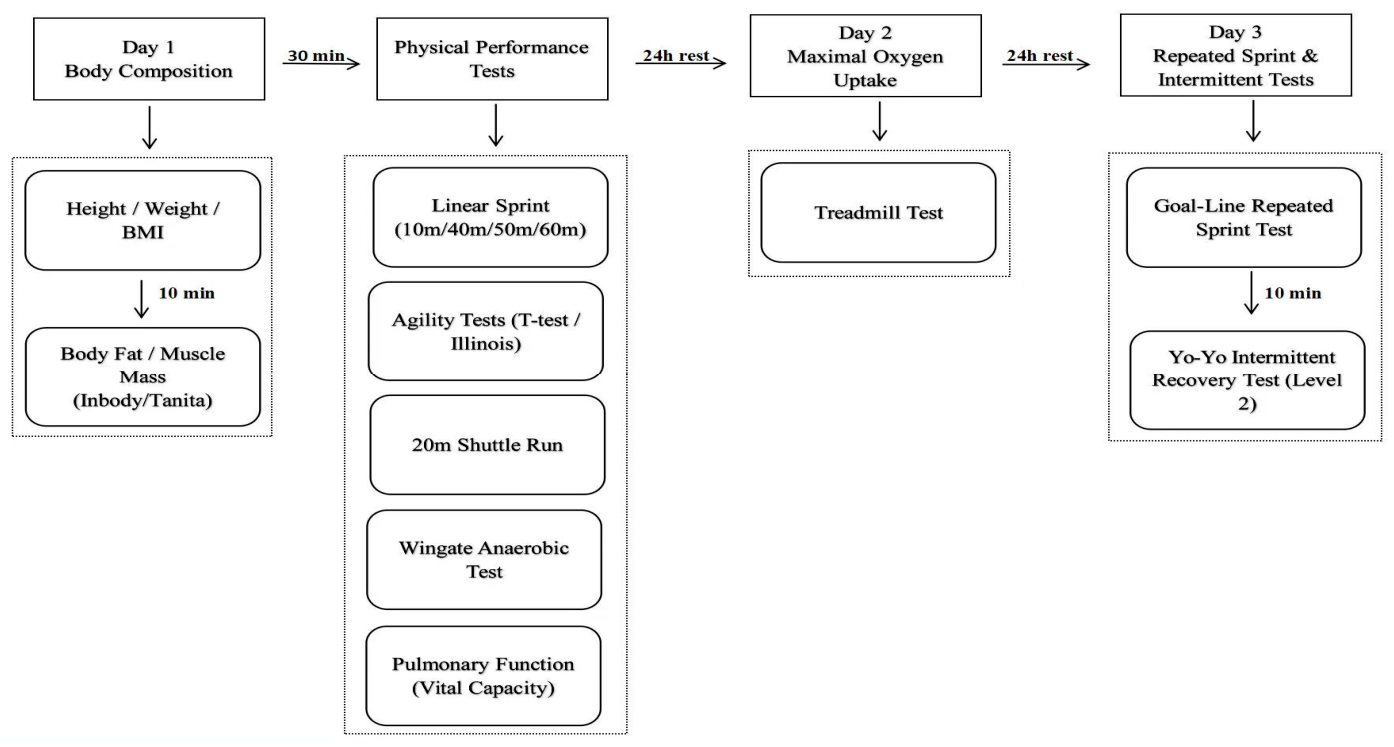
Anthropometric and physical performance data were collected from all the participants. The participants were instructed to maintain their usual diet during the testing week and to avoid alcohol and stimulants, including caffeine, for 24 h before each test. Before testing, the participants had not performed any training and had emptied their bowels and bladder. All assessments were completed over three testing days: anthropometric measurements and sprint testing were conducted in the morning; the remaining physical performance tests were conducted in the afternoon; and vital capacity was assessed in the evening. The complete testing schedule is presented in Figure 1. All tests were administered by two professional strength and conditioning testing specialists, each with more than 5 years of experience. Tests were conducted on separate days, with at least 24 h between testing sessions. Before each test, athletes completed a standardized warm-up consisting of a general warm-up (10 min of moderate-paced running followed by 3 min of active lower-limb stretching or dynamic stretching) and a test-specific warm-up involving maximal-effort practice trials of the relevant movement. Anthropometric measurements, vital capacity testing, and maximal oxygen uptake testing were performed in an indoor laboratory, whereas all other tests were conducted on a standard outdoor athletics track. Verbal encouragement was provided during the maximal oxygen uptake (VO2peak) test, the Wingate Anaerobic Test, and the Yo-Yo Intermittent Recovery Test Level 2 (YYIR2).

2.1.1. Day 1

  • Anthropometric Assessment
Anthropometric measurements were performed 2 h after a meal, between 09:30 and 10:00. Body height (BH) was measured using a portable stadiometer (Hengkang, Sanmen, China) to the nearest 0.1 cm, and body mass (BM) was measured to the nearest 0.1 kg. Body composition variables, including body mass and muscle mass, were assessed using an InBody multifrequency bioelectrical impedance analyzer (Biospace Co., Seoul, Republic of Korea), with a reported intraclass correlation coefficient of ≥0.98 [17]. If the difference between the first two measurements exceeded 5%, a third measurement was taken.
2.
Linear Sprint Test
After anthropometric assessment, sprint testing began at 10:30. Testing was conducted on the synthetic track of an outdoor athletics field. Athletes completed two linear sprint trials over 10, 40, 50, and 60 m. For repeated trials at the same distance, the rest interval was 40 s for the 10 m sprint, 2 min for both the 40 m and 50 m sprints, and 2.5 min for the 60 m sprint. Between different distance tests, the rest interval was 1.5 min when changing from 10 to 40 m and 2.5 min when changing from 40 to 50 m and from 50 to 60 m, to minimize accumulated fatigue. All athletes wore athletic shoes and completed all sprint trials on the same day.
Sprint times were recorded using a photoelectric timing system (SmartSpeed Pro, Fusion Sport, Brisbane, QLD, Australia), with timing gates positioned at the start line and at 10, 40, 50, and 60 m. The best performance at each distance was recorded as the final test result, and verbal encouragement was provided to motivate maximal effort. These distances were selected to assess initial sprint acceleration and maximal sprint-speed capacity [18]. The 40 m sprint time was used in subsequent analyses.
Each sprint began from a standing start, with the front foot placed behind the start line and 0.5 m behind the first timing gate. A marker was placed 5 m beyond the finish line, and athletes were instructed not to decelerate before passing this marker, ensuring maximal speed was maintained throughout the test. The warm-up included 15 min of joint mobility exercises, light jogging, progressive acceleration runs, and change-of-direction running. Participants were also instructed to avoid strenuous exercise on the day before testing and to finish their last meal at least 3 h before the scheduled test time. It should be noted that the rest intervals employed in this protocol were shorter than the 3–5 min typically recommended for near-complete phosphocreatine (PCr) restoration [19]. However, these intervals were selected to balance the need for maximal performance with the practical constraints of field-based testing, and the potential for residual fatigue should be considered when interpreting the sprint results.
3.
T-Test
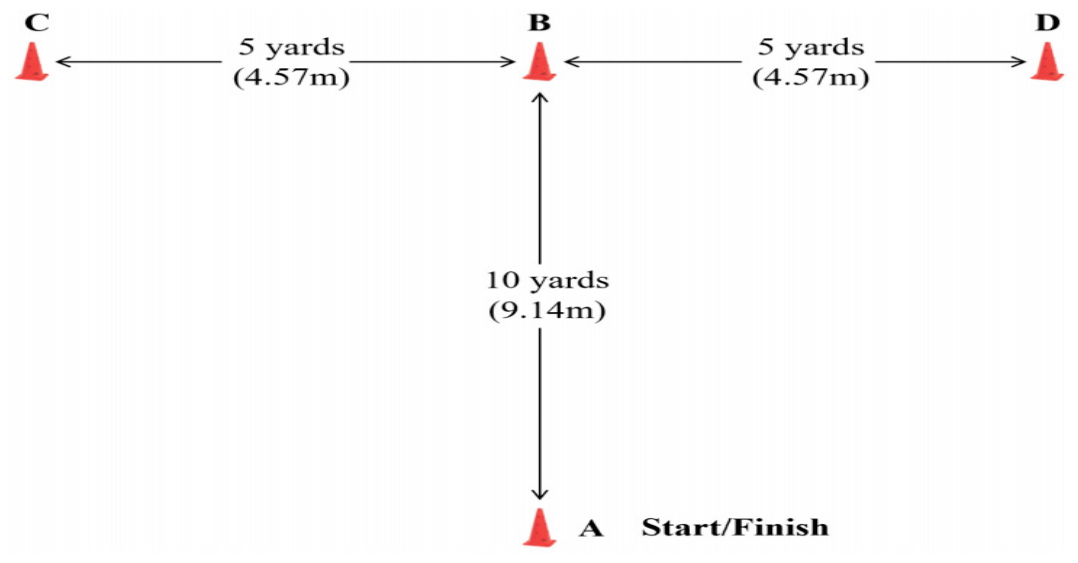
Following the linear sprint test, athletes rested for 10 min before completing the T-test. The T-test was used to assess agility during rapid change-of-direction movement on an outdoor athletics field [20]. Participants stood with both feet behind the starting line at cone A. They first sprinted forward to cone B and touched its base with the right hand. They then shuffled laterally to the left to cone C while keeping the body facing forward and avoiding leg crossing, touching its base with the left hand. Next, they shuffled to the right to cone D and touched its base with the right hand, then shuffled left back to cone B and touched its base again. Finally, they backpedaled as quickly as possible to the starting line at cone A (Figure 2). This modified test has demonstrated good reliability, with an intraclass correlation coefficient greater than 0.90 [21]. Each participant completed two trials, and the best performance was recorded using the photoelectric timing-gate system (SmartSpeed Pro, Fusion Sport, Brisbane, QLD, Australia).
4.
Illinois Agility Run
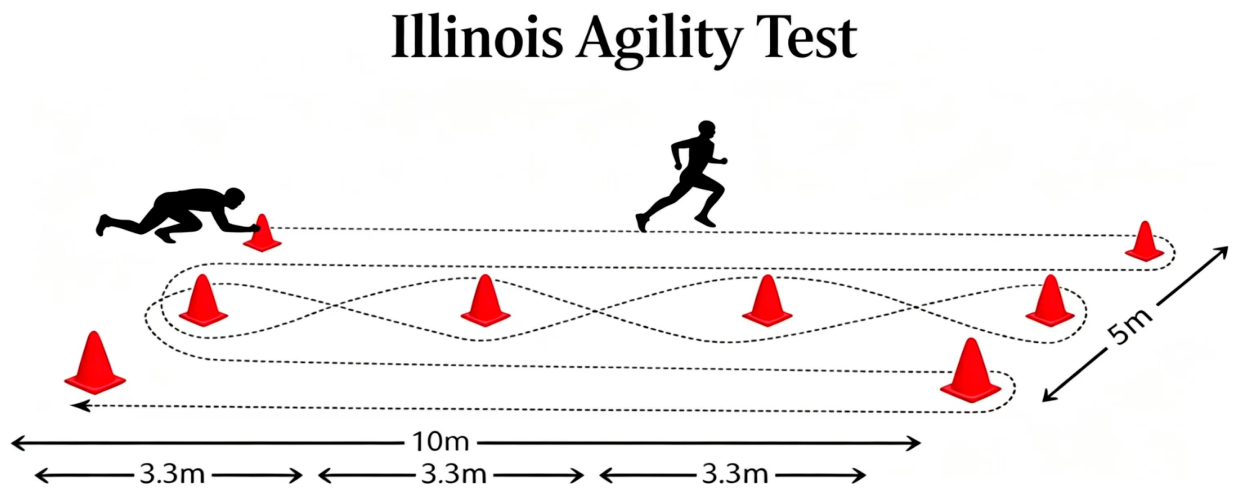
After the T-test, athletes rested for 10 min before completing the Illinois Agility Run, which was used as an additional assessment of agility (Figure 3). The Illinois Agility Run was conducted on a flat, non-slip surface over a standard course measuring 10 m in length and 5 m in width, with eight cones arranged as follows: four marking the start, finish, and two turning points, and the remaining four placed along the center line at 3.3 m intervals. The participant began lying face down at the start cone, with the head facing the start line and hands by the shoulders. Upon the “Go” command, the participant rose and sprinted 10 m forward to the first turning point, turned and ran 10 m back to the start area, then negotiated the slalom course by weaving through the four central cones (spaced 3.3 m apart) in the designated order, before weaving back through the same cones and finally sprinting 10 m forward to the finish line. Completion time was recorded using a handheld stopwatch to the nearest 0.01 s. Each participant completed two trials, and the best result was used as the agility score. The intraclass correlation coefficient for this test is 0.86, with a typical error of measurement of 2.02%, indicating acceptable test-retest reliability [22].
5.
20 m Shuttle Run
After the Illinois Agility Run, athletes rested for 10 min before completing the 20 m shuttle run test. Participants were required to run back and forth over a 20 m distance in synchrony with a series of auditory signals from an audio recording. The frequency of the auditory signals, and therefore running speed, increased every minute until participants voluntarily terminated the test because of fatigue [23].
6.
Wingate Anaerobic Test
After all morning tests had been completed, the Wingate Anaerobic Test (WAnT) was performed at 15:30. The WAnT is widely accepted as a reliable (r = 0.84–0.88) and valid (r = 0.94–0.98) method for assessing anaerobic capacity and power output [24]. The test protocol followed the procedures described by Inbar et al. [24]. The WAnT lasted 30 s and was completed as a single uninterrupted bout on a cycle ergometer, with only one valid trial collected and no rest pauses during the test. Once the participant maintained a stable pedaling cadence, a countdown was initiated, and the braking load was applied to indicate the start of the test. Participants’ feet were secured to the pedals with toe straps, and they were instructed to sprint maximally from the start and not to deliberately pace themselves during the test. Based on the test results, peak power, relative peak power, mean power, relative mean power, total work, relative total work, and fatigue index were calculated for each participant. The Wingate test has demonstrated good to excellent test-retest reliability in athletic populations, with intraclass correlation coefficients (ICC) consistently exceeding 0.90 for peak power and mean power outputs [25,26].
7.
Vital Capacity
At 19:00 on the same day, vital capacity was measured using a spirometer (Kaifuli, Changzhou, Jiangsu, China). The participants first inhaled deeply and then exhaled slowly through the mouthpiece until no further air could be expelled. Each participant completed three trials, and the highest value was recorded. Vital capacity was expressed in milliliters (mL) and recorded to the nearest whole number.

2.1.2. Day 2

  • Peak Oxygen Uptake
At 15:30, peak oxygen uptake (VO2peak) was assessed using a motorized treadmill (h/p/cosmos pulsar 3p, Nussdorf-Traunstein, Germany) with a standard incremental protocol. The test began at 6 km·h−1 with a 0% grade; speed was increased by 1 km·h−1 every 2 min (6, 7, 8, 9, and 10 km·h−1) with grade fixed at 0%, after which grade was increased by 2% every 2 min at a constant speed of 10 km·h−1 until volitional exhaustion. Pulmonary gas exchange was measured breath-by-breath using a Cortex metabolic measurement system with a compatible face mask, and heart rate was continuously recorded via a heart-rate monitor. Gas samples were analyzed via a sampling line after passing through a heated tube and mixing chamber, with the system continuously monitoring oxygen uptake (VO2), carbon dioxide output (VCO2), ventilation (VE), and respiratory exchange ratio (RER). Data were recorded as 15 s averages, and the highest 15 s average was taken as VO2peak, expressed in both absolute (mL·min−1) and relative (mL·kg−1·min−1) terms. To confirm that a true maximal effort was achieved, the following established criteria were applied: (1) a plateau in VO2 (increase < 150 mL·min−1) despite an increase in workload, (2) RER ≥ 1.10, and (3) heart rate ≥ 95% of age-predicted maximum (220-age). All participants met at least two of these criteria, confirming that the VO2peak values obtained represented a true maximal effort. The protocol has demonstrated good test-retest reliability in athletic populations, as evidenced by correlation coefficients for VO2 ranging from r = 0.82 to 0.88, with mean differences in VO2peak values of less than 1.4 mL/kg/min between repeated tests [27].

2.1.3. Day 3

  • Goalpost Shuttle Run
At 15:30, the participants completed a maximal-effort shuttle run around two rugby goalposts, consisting of two round trips. The distance between the two goalposts was 100 m, and the width between the two uprights of each goalpost was 5.6 m. Each athlete completed one trial, starting from a standing position and wearing rugby boots. The total completion time was recorded. A single trial was utilized for the goalpost shuttle run due to its high physiological demand (total distance of ~200 m with 180° turn). To prevent excessive neuromuscular fatigue that could compromise subsequent fitness testing, repeated maximal efforts were avoided. To lower the risk of submaximal effort or procedural errors during this single trial, all participants underwent a standardized familiarization session prior to testing, and received continuous, standardized verbal encouragement throughout the trial.
2.
Yo-Yo Intermittent Recovery Test Level 2
After the goalpost shuttle run, the participants rested for 10 min before completing the YYIR2 [28]. The test consisted of repeated 20 shuttle runs, with each running bout followed by a 10-s active recovery period. Running speed was controlled by audio beeps from a recording and increased progressively. The test was terminated when a participant failed to reach the finish line in time on two consecutive occasions, and the total distance completed was recorded as the test result. Testing was conducted on outdoor artificial turf on a 2-wide, 20-long running lane marked with cones at both ends, and participants wore soccer boots.

2.2. Statistical Analysis

All data were analyzed using SPSS 25.0 (SPSS Inc., Chicago, IL, USA). The Shapiro-Wilk test was first used to examine data normality, and all collected variables were confirmed to be normally distributed. Participant characteristics are presented as mean ± standard deviation (M ± SD). Independent-samples t tests were used to compare differences between forwards and backs and between the fast and slow groups. For further analysis of the differences in physical fitness among the participants with differences in sprinting performance, medians with interquartile range (IQR) were adopted for the 40 m sprinting speed. The actual median value of the 40 sprint times for our 21 elite players was exactly 5.40 s (range: 4.92–5.83 s; mean ± SD = 5.38 ± 0.25 s). The players were categorized as the <5.4 s group and the ≥5.4 s group according to the distribution. To control for the increased risk of Type I error due to multiple comparisons, Bonferroni correction was applied to all independent-samples t-tests. Cohen’s d effect sizes were calculated and were interpreted using descriptors for magnitudes of d as 0.2–0.5 = small, 0.5–0.8 = moderate, and >0.8 = large, respectively. Normality of continuous variables was assessed using the Shapiro-Wilk test. All variables satisfied the assumption of normal distribution (W-values ranged from 0.93 to 0.97, all *p* > 0.05; skewness and kurtosis values were within acceptable limits, with |skewness| < 1 and |kurtosis| < 2). Consequently, independent-samples *t*-tests were used for between-group comparisons. Statistical significance was set at p < 0.05.

3. Results

As shown in Table 1, forwards were significantly taller than backs (187.6 ± 3.6 cm vs. 177.0 ± 4.0 cm, adjusted p = 0.0022, Cohen’s d = 2.78) and had significantly greater body mass (88.3 ± 6.2 kg vs. 77.3 ± 6.3 kg, adjusted p = 0.0073, Cohen’s d = 1.76).
Table 2 presents the comparison of physical performance variables. Forwards showed significantly greater muscle mass (71.8 ± 4.8 kg vs. 64.2 ± 5.5 kg, adjusted p = 0.027, Cohen’s d = 1.47) compared with backs. Backs performed significantly better in the Illinois Agility Run (14.0 ± 0.4 s vs. 14.8 ± 0.4 s, p = 0.018, Cohen’s d = 2.00) than forwards.
As shown in Table 3, no significant anthropometric differences were observed between the fast and slow sprint groups classified by 40 sprint time (fast < 5.4 s, slow ≥ 5.4 s).
After adjusting p-values, Table 4 shows that no significant differences in physical fitness characteristics remained between the fast and slow groups. However, VO2peak (adjusted p = 0.082), relative VO2peak (adjusted p = 0.082), and peak anaerobic power (adjusted p = 0.082) showed a trend towards significant differences between the fast and slow groups.
Table 5 shows the results of running and agility performance by 40 m sprint performance. In the linear sprint tests, the fast group showed significantly better in 10 m (1.7 ± 0.1 s vs. 1.9 ± 0.1 s, p = 0.040, Cohen’s d = −2.00), 50 m (6.2 ± 0.3 s vs. 6.7 ± 0.2 s, p = 0.017, Cohen’s d = −1.98), and 60 m (7.4 ± 0.4 s vs. 8.0 ± 0.3 s, p = 0.017, Cohen’s d = −1.71) than the slow group. Goalpost shuttle run (adjusted p = 0.057), 20 shuttle run (adjusted p = 0.082), and T-test (adjusted p = 0.057) showed a trend towards significant differences between the fast and slow groups.

4. Discussion

This study investigated differences in the physical fitness characteristics among Chinese national-team male rugby sevens players by position and sprint performance. The findings were as follows: (1) significant differences between forwards and backs in height, body mass, muscle mass, and agility; (2) the fast group performed significantly better than the slow group in multi-distance linear sprint speed performance.
In this study, forwards were significantly taller and heavier than backs, which is consistent with previous studies on position-specific physical characteristics in international high-level rugby sevens players [4,5]. Studies on the German national rugby sevens team showed that forwards had a height of 184.01 ± 7.61 cm and a body mass of 91.72 ± 8.06 kg, whereas backs had a height of 173.29 ± 4.20 cm and a body mass of 79.28 ± 3.31 kg [4]. An Australian rugby sevens study reported that forwards and backs had an average height of 183.00 ± 6.00 cm and an average body mass of 89.7 ± 7.6 kg [5]. In the present study, forwards had a height of 187.6 ± 3.6 cm and a body mass of 88.3 ± 6.2 kg, whereas backs had a height of 177.0 ± 4.0 cm and a body mass of 77.3 ± 6.3 kg. Compared with international high-level athletes, the Chinese players in this study were slightly taller and slightly lighter on average in both forward and back positions.
The height and body-mass advantages of forwards are closely matched to their match responsibilities. In rugby sevens, forwards frequently perform tackles, defensive contests for possession, and ball-carrying collisions. Greater height and body mass can improve stability and contact capacity during physical collisions and are suited to the demands of high-intensity body contact and set-piece contests [3]. Backs, in contrast, are mainly responsible for ball carrying, passing organization, and attacking completion, and therefore place greater emphasis on mobility and movement efficiency; consequently, they tend to show lower height and body-mass values [6]. In the present study, forwards also had significantly greater muscle mass than backs (71.8 ± 4.8 kg vs. 64.2 ± 5.5 kg, p = 0.003), suggesting that forwards possessed a stronger physical basis for contact and a greater potential for force production. The body composition of the forward group appeared to be well controlled, as higher body mass did not seem to negatively affect movement ability. This is consistent with the ideal morphological profile of rugby sevens players, characterized by greater stature and higher body mass [5]. Muscle mass, which was significantly greater in forwards, is a key factor influencing sport-specific qualities such as strength, power, speed, and endurance. A tall body type with moderately high body mass and greater muscle reserve reflects strong contact capacity and is well matched to the sport-specific demands of high-intensity collisions and sustained high-speed repeated running. However, it is important to note that body fat percentage was not assessed in the present study. Although previous research has suggested that lower body-fat percentage is favorable for rugby sevens performance [5,9], we were unable to examine this relationship in our cohort. Future studies should include body fat percentage measurement using criterion methods (e.g., DXA or hydrostatic weighing) to provide a more complete characterization of body composition in Chinese rugby sevens players.
Anaerobic power is a core indicator of the ability to generate power during short-duration, high-intensity exercise. Higher anaerobic power indicates better explosive acceleration and instantaneous response capacity during match play. In this study, no significant differences in anaerobic power between the forwards and backs remained after adjusting p-values. Notably, the backs exhibited a 2.6-fold higher variance in mean anaerobic power than the forward group (SD: 32.9 W vs. 86.8 W). This pronounced heterogeneity likely reflects the diverse tactical sub-roles collapsed within the binary ‘backs’ classification in rugby sevens (e.g., explosive, high-speed wings/centres vs. playmaking halfbacks with different metabolic profiles). In contrast, the highly homogeneous profile of forwards aligns with their consistent, high-intensity set-piece and collision demands. While sample size limitations precluded statistical stratification of these sub-positions, this positional heterogeneity warrants more granular investigation in future research.
In rugby sevens, backs sprint more frequently and have greater demands for speed and agility [4]. This study showed that backs performed significantly better than forwards in the Illinois Agility Run, indicating superior change-of-direction agility and repeated shuttle-running ability. This is highly consistent with the tactical demands placed on backs, who must frequently link rapid changes of direction with sprinting actions during match play [29]. Backs are primarily responsible for creating attacking opportunities and finishing attacks. They repeatedly perform rapid direction changes, sudden stops and starts, and short-distance sprints, which require higher levels of neuromuscular control and lower-limb explosive power; consequently, they show better agility performance [29]. Some studies did not identify position-specific fitness differences among rugby sevens players, which may be related to the competitive level of the participants, the stage of sport development, or the choice of testing indicators [22,30]. The use of national-team level athletes in the present study may have contributed to the detection of position-specific differences, whereas studies with different participant levels or testing protocols may not have observed such distinctions. However, this interpretation remains speculative and requires confirmation in future research with diverse samples and standardized procedures. At the same time, the speed differences between the two position groups did not reach the expected level, suggesting that some degree of homogenization may still exist in the training of Chinese rugby sevens players and that speed and explosive-power training for backs requires further improvement. Combined with findings from other invasion and collision sports, speed performance is closely associated with neuromuscular control and lower-limb explosive power. Therefore, backs should strengthen speed-power training such as depth jumps and resisted sprints, whereas forwards should improve movement efficiency and change-of-direction agility while maintaining their strength and anaerobic advantages, thereby achieving more position-specific physical development [31].
Sprint time and maximal-speed characteristics show a linear trend, and the absolute differences increase as sprint distance increases [32]. Sprint acceleration fundamentally requires athletes to produce and apply substantial horizontal external force, and this mechanical capacity can be quantified using force-velocity profiling [33]. In this study, the significant advantage of the fast group over 10 m indicates that these athletes had higher explosive-power levels, faster neuromuscular response speed, and more efficient application of ground force. This advantage is directly related to starting speed, contesting possession, and escaping defenders during match play. Classification based on total 40 sprint time essentially reflects the combined contribution of acceleration capacity and maximal-speed capacity. The fast group not only accelerated more rapidly at the start, but also showed greater speed gain and a higher peak-speed level during the key transition from acceleration to maximal speed [34]. Although not directly assessed in this study, force-velocity profiling has shown that sprint performance differences are not determined solely by either acceleration or maximal speed, but rather by the trade-off between force-production and velocity-production capacities [32]. In this study, the ability of the fast group to maintain its advantage at 50 m and 60 m may be associated with a lower force-velocity slope in its force-velocity profile or with a higher theoretical maximal velocity. These hypotheses warrant testing in future studies that include direct force-velocity measurements.

5. Limitations

Several methodological limitations should be acknowledged. First, this study is the cross-section design with a small sample size (n = 21), which precludes causal inferences. The sample size was determined by the availability of national team players rather than by a priori power analysis. Although multiple-comparison correction and effect sizes enhanced statistical rigor, our analyses remain primarily descriptive. While multivariate approaches (e.g., regression) could better elucidate variable relationships, they were unfeasible for our cohort due to statistical power constraints and overfitting risks; future studies with larger cohorts should employ such comprehensive models. Moreover, the sample comprised players from a single national team assessed during one preseason period; therefore, the findings reflect a specific temporal and competitive context and may not be generalizable to other teams, training phases, or competitive levels. Second, the median-dichotomization of 40 sprint times, although convenient for group comparison and practical interpretation, discards continuous information and lowers analytical sensitivity; treating sprint performance as a continuous variable would have been more informative. Third, the Goalpost Shuttle Run is not a standardized fitness test that is widely used internationally, and there is insufficient literature supporting its reliability and validity. This may limit the direct comparability of our findings with those of other comparable external studies. Fourth, while the short rest intervals in our studies (40 s for 10 m, 2 min for 40/50 m, 2.5 min for 60 m) were shorter than the 3–5 min typically required for complete phosphocreatine resynthesis [19], they were practically selected to maintain physiological arousal (preventing cooling down) under field-testing conditions. Nonetheless, the potential influence of incomplete metabolic recovery on subsequent sprint performances should be acknowledged as a limitation. Fifth, vital capacity was tested at 19:00, approximately 3.5 h after the Wingate anaerobic test (performed at 15:30 on Day 1). It is acknowledged that the scheduling of vital capacity testing following maximal anaerobic exertion may have introduced a potential confound, as high-intensity exercise can induce transient reductions in respiratory muscle performance. Finally, environmental conditions (temperature, humidity, wind speed) during outdoor testing were not recorded; these factors may have influenced sprint, agility, and shuttle-run performance, particularly given the outdoor setting.

6. Conclusions

Chinese national-team male rugby sevens forwards showed significantly taller, heavier, and greater muscle mass, while backs showed significantly better agility running performance. When grouped by sprint speed, faster players possess superior multi-distance sprinting capacities. These preliminary observations, derived from a small-sample cross-sectional design, should be interpreted as cohort-specific rather than generalizable. Future studies with larger and more diverse samples are needed to inform broader talent identification and training recommendations.

Author Contributions

Conceptualization, S.L. and X.Z.; methodology, S.L., Z.M., K.I., and S.S.; validation, Q.L., K.I., and L.Z.; formal analysis, S.L., X.Z., Z.M., and Q.W.; investigation, S.L., X.Z., Z.M., Q.W., Q.L., and C.L.; resources, S.S.; data curation, Z.M., Q.W., Q.L., and C.L.; writing—original draft preparation, S.L. and X.Z.; writing—review and editing, K.I., S.S., L.Z., and X.Z.; supervision, C.L. and L.Z.; project administration, S.L. and X.Z.; funding acquisition, X.Z. All authors have read and agreed to the published version of the manuscript.

Funding

This work was supported by the Huazhong University of Science and Technology Double First-Class Funds for Humanities and Social Sciences (Grant Numbers: 2026WKQN034 and 2025WKQN011).

Institutional Review Board Statement

This study was reviewed and approved by the Institutional Ethics Board of Tongji Medical College, Huazhong University of Science and Technology, China (Notification Number [2023] IEC “(S172)”). The research protocol was conducted in accordance with the principles of the Declaration of Helsinki. All participants provided written informed consent.

Informed Consent Statement

Written informed consent for publication was obtained from all participants.

Data Availability Statement

The datasets used and/or analyzed during the current study are available from the corresponding author on reasonable request.

Conflicts of Interest

The authors declare no conflicts of interest.

References

  1. Peeters, A.; Carling, C.; Piscione, J.; Lacome, M. In-Match Physical Performance Fluctuations in International Rugby Sevens Competition. J. Sports Sci. Med. 2019, 18, 419–426. [Google Scholar] [PubMed]
  2. Ross, A.; Gill, N.; Cronin, J. The match demands of international rugby sevens. J. Sports Sci. 2015, 33, 1035–1041. [Google Scholar] [CrossRef] [PubMed]
  3. Suarez-Arrones, L.; Arenas, C.; López, G.; Requena, B.; Terrill, O.; Mendez-Villanueva, A. Positional differences in match running performance and physical collisions in men rugby sevens. Int. J. Sports Physiol. Perform. 2014, 9, 316–323. [Google Scholar] [CrossRef] [PubMed]
  4. Hohenauer, E.; Rucker, A.M.; Clarys, P.; Küng, U.M.; Stoop, R.; Clijsen, R. Anthropometric and performance characteristics of the German rugby union 7s team. J. Sports Med. Phys. Fit. 2017, 57, 1633–1641. [Google Scholar] [CrossRef] [PubMed]
  5. Higham, D.G.; Pyne, D.B.; Anson, J.M.; Eddy, A. Physiological, anthropometric, and performance characteristics of rugby sevens players. Int. J. Sports Physiol. Perform. 2013, 8, 19–27. [Google Scholar] [CrossRef] [PubMed]
  6. Ross, A.; Gill, N.; Cronin, J.; Malcata, R. The relationship between physical characteristics and match performance in rugby sevens. Eur. J. Sport Sci. 2015, 15, 565–571. [Google Scholar] [CrossRef] [PubMed]
  7. Sato, T.; Nalbandian, M.; Takeda, M. Physical Fitness Tests as Predictors of High-Intensity Running Performance in Rugby. Sports 2023, 11, 156. [Google Scholar] [CrossRef] [PubMed]
  8. Couderc, A.; Thomas, C.; Lacome, M.; Piscione, J.; Robineau, J.; Delfour-Peyrethon, R.; Borne, R.; Hanon, C. Movement Patterns and Metabolic Responses During an International Rugby Sevens Tournament. Int. J. Sports Physiol. Perform. 2017, 12, 901–907. [Google Scholar] [CrossRef] [PubMed]
  9. Ross, A.; Gill, N.; Cronin, J. Match analysis and player characteristics in rugby sevens. Sports Med. 2014, 44, 357–367. [Google Scholar] [CrossRef] [PubMed]
  10. Higham, D.G.; Pyne, D.B.; Anson, J.M.; Eddy, A. Movement patterns in rugby sevens: Effects of tournament level, fatigue and substitute players. J. Sci. Med. Sport 2012, 15, 277–282. [Google Scholar] [CrossRef] [PubMed]
  11. Suarez-Arrones, L.J.; Nuñez, F.J.; Portillo, J.; Mendez-Villanueva, A. Running demands and heart rate responses in men Rugby Sevens. J. Strength Cond. Res. 2012, 26, 3155–3159. [Google Scholar] [CrossRef] [PubMed]
  12. Pienaar, C.; Coetzee, B. Changes in selected physical, motor performance and anthropometric components of university-level rugby players after one microcycle of a combined rugby conditioning and plyometric training program. J. Strength Cond. Res. 2013, 27, 398–415. [Google Scholar] [CrossRef] [PubMed]
  13. Till, K.; Tester, E.; Jones, B.; Emmonds, S.; Fahey, J.; Cooke, C. Anthropometric and physical characteristics of english academy rugby league players. J. Strength Cond. Res. 2014, 28, 319–327. [Google Scholar] [CrossRef] [PubMed]
  14. Elloumi, M.; Makni, E.; Moalla, W.; Bouaziz, T.; Tabka, Z.; Lac, G.; Chamari, K. Monitoring training load and fatigue in rugby sevens players. Asian J. Sports Med. 2012, 3, 175–184. [Google Scholar] [CrossRef] [PubMed]
  15. Zabaloy, S.; Giráldez, J.; Gazzo, F.; Villaseca-Vicuña, R.; González, J.G. In-Season Assessment of Sprint Speed and Sprint Momentum in Rugby Players According to the Age Category and Playing Position. J. Hum. Kinet. 2021, 77, 274–286. [Google Scholar] [CrossRef] [PubMed]
  16. Loturco, I.; Pereira, L.A.; Moraes, J.E.; Kitamura, K.; Cal Abad, C.C.; Kobal, R.; Nakamura, F.Y. Jump-Squat and Half-Squat Exercises: Selective Influences on Speed-Power Performance of Elite Rugby Sevens Players. PLoS ONE 2017, 12, e0170627. [Google Scholar] [CrossRef] [PubMed] [PubMed Central]
  17. McLester, C.N.; Nickerson, B.S.; Kliszczewicz, B.M.; McLester, J.R. Reliability and Agreement of Various InBody Body Composition Analyzers as Compared to Dual-Energy X-Ray Absorptiometry in Healthy Men and Women. J. Clin. Densitom. 2020, 23, 443–450. [Google Scholar] [CrossRef] [PubMed]
  18. Barr, M.J.; Sheppard, J.M.; Gabbett, T.J.; Newton, R.U. Long-term training-induced changes in sprinting speed and sprint momentum in elite rugby union players. J. Strength Cond. Res. 2014, 28, 2724–2731. [Google Scholar] [CrossRef] [PubMed]
  19. Dawson, B.; Goodman, C.; Lawrence, S.; Preen, D.; Polglaze, T.; Fitzsimons, M.; Fournier, P. Muscle phosphocreatine repletion following single and repeated short sprint efforts. Scand. J. Med. Sci. Sports 1997, 7, 206–213. [Google Scholar] [CrossRef] [PubMed]
  20. Vandendriessche, J.B.; Vaeyens, R.; Vandorpe, B.; Lenoir, M.; Lefevre, J.; Philippaerts, R.M. Biological maturation, morphology, fitness, and motor coordination as part of a selection strategy in the search for international youth soccer players (age 15–16 years). J. Sports Sci. 2012, 30, 1695–1703. [Google Scholar] [CrossRef] [PubMed]
  21. Sassi, R.H.; Dardouri, W.; Yahmed, M.H.; Gmada, N.; Mahfoudhi, M.E.; Gharbi, Z. Relative and absolute reliability of a modified agility T-test and its relationship with vertical jump and straight sprint. J. Strength Cond. Res. 2009, 23, 1644–1651. [Google Scholar] [CrossRef] [PubMed]
  22. Gabbett, T.J. Physiological characteristics of junior and senior rugby league players. Br. J. Sports Med. 2002, 36, 334–339. [Google Scholar] [CrossRef] [PubMed]
  23. Australian Coaching Council. Multistage Fitness Test. A Progressive Shuttle-Run Test for the Prediction of Maximum Oxygen Uptake; Australian Sports Commission: Belconnen, Australia, 1988. [Google Scholar]
  24. Inbar, O.; Baror, O.; Skinner, J.S. The Wingate Anaerobic Test; Human Kinetics Publishers: Champaign, IL, USA, 1996. [Google Scholar]
  25. Ozkaya, O.; Balci, G.A.; As, H.; Vardarli, E. The Test-Retest Reliability of New Generation Power Indices of Wingate All-Out Test. Sports 2018, 6, 31. [Google Scholar] [CrossRef] [PubMed] [PubMed Central]
  26. Bringhurst, R.F.; Wagner, D.R.; Schwartz, S. Wingate Anaerobic Test Reliability on the Velotron with Ice Hockey Players. J. Strength Cond. Res. 2020, 34, 1716–1722. [Google Scholar] [CrossRef] [PubMed]
  27. Weltman, A.; Snead, D.; Stein, P.; Seip, R.; Schurrer, R.; Rutt, R.; Weltman, J. Reliability and validity of a continuous incremental treadmill protocol for the determination of lactate threshold, fixed blood lactate concentrations, and VO2max. Int. J. Sports Med. 1990, 11, 26–32. [Google Scholar] [CrossRef] [PubMed]
  28. Bangsbo, J. Fitness Training in Football—A Scientific Approach; HO+Storm: Bagsværd, Denmark, 1994; pp. 1–336. [Google Scholar]
  29. Ross, A.; Gill, N.D.; Cronin, J.B. Comparison of the Anthropometric and Physical Characteristics of International and Provincial Rugby Sevens Players. Int. J. Sports Physiol. Perform. 2015, 10, 780–785. [Google Scholar] [CrossRef] [PubMed]
  30. Gabbett, T.J. Physiological and anthropometric characteristics of amateur rugby league players. Br. J. Sports Med. 2000, 34, 303–307. [Google Scholar] [CrossRef] [PubMed]
  31. Hori, N.; Newton, R.U.; Andrews, W.A.; Kawamori, N.; McGuigan, M.R.; Nosaka, K. Does performance of hang power clean differentiate performance of jumping, sprinting, and changing of direction? J. Strength Cond. Res. 2008, 22, 412–418. [Google Scholar] [CrossRef] [PubMed]
  32. Watkins, C.M.; Storey, A.; McGuigan, M.R.; Downes, P.; Gill, N.D. Horizontal Force-Velocity-Power Profiling of Rugby Players: A Cross-Sectional Analysis of Competition-Level and Position-Specific Movement Demands. J. Strength Cond. Res. 2021, 35, 1576–1585. [Google Scholar] [CrossRef] [PubMed]
  33. Baena-Raya, A.; Rodríguez-Pérez, M.A.; Jiménez-Reyes, P.; Soriano-Maldonado, A. Maximizing Acceleration and Change of Direction in Sport: A Case Series to Illustrate How the Force-Velocity Profile Provides Additional Information to That Derived from Linear Sprint Time. Int. J. Environ. Res. Public Health 2021, 18, 6140. [Google Scholar] [CrossRef] [PubMed]
  34. Delecluse, C. Influence of strength training on sprint running performance. Current findings and implications for training. Sports Med. 1997, 24, 147–156. [Google Scholar] [CrossRef] [PubMed]
Figure 1. Experiment protocol.
Applsci 16 07529 g001
Figure 2. Schematic diagram of the T-test course.
Applsci 16 07529 g002
Figure 3. Schematic diagram of the Illinois Agility Run course.
Applsci 16 07529 g003
Table 1. Anthropometric characteristics by playing position.
VariableForwards
(n = 10)
Backs
(n = 11)
p ValueFDR-Adjusted
p Value
Cohen’s d95% CI
Age (years)22.2 ± 2.721.1 ± 2.50.3430.68600.42[−0.44, 1.29]
Training experience (years)5.2 ± 2.84.4 ± 2.50.5060.75310.30[−0.56, 1.16]
Height (cm)187.6 ± 3.6177.0 ± 4.0<0.001 **0.0022 **2.78[1.58, 3.98]
Body mass (kg)88.3 ± 6.277.3 ± 6.30.001 **0.0073 **1.76[0.75, 2.77]
BMI (kg/m2)25.1 ± 1.724.7 ± 2.20.6440.79980.20[−0.66, 1.06]
BMI: body mass index, calculated by weight and height. ** p-value < 0.01 indicates a statistically significant difference between two groups. Values are mean ± SD.
Table 2. Physical fitness characteristics by playing position.
VariableForwards
(n = 10)
Backs
(n = 11)
p ValueFDR-Adjusted
p Value
Cohen’s d95% CI
VO2peak (mL/min)4416.6 ± 440.94580.6 ± 960.50.6180.766−0.22[−1.08, 0.64]
Relative VO2peak (mL/kg/min)50.2 ± 5.859.6 ± 13.80.0570.205−0.87[−1.77,0.02]
Peak anaerobic power (W)1140.0 ± 147.61141.2 ± 242.80.9880.988−0.01[−0.86, 0.85]
Mean anaerobic power (W)778.7 ± 32.9710.7 ± 86.80.031 *0.1401.02[0.11, 1.93]
Minimum anaerobic power (W)413.6 ± 101.5389.0 ± 133.50.6380.7660.21[−0.65, 1.06]
Anaerobic power decrement (%)63.4 ± 9.665.3 ± 13.00.7120.801−0.17[−1.02, 0.69]
Vital capacity (mL)5350.6 ± 725.94724.5 ± 764.20.0700.2100.84[−0.05, 1.73]
Muscle mass (kg)71.8 ± 4.864.2 ± 5.50.003 **0.027 *1.47[0.50, 2.43]
Goalpost shuttle run (s)27.4 ± 2.028.4 ± 2.20.3030.606−0.47[−1.34, 0.39]
Vital capacity/height (mL/cm)28.5 ± 3.627.1 ± 4.60.4450.6830.34[−0.53, 1.20]
10 m (s)1.8 ± 0.11.8 ± 0.10.5760.7660.00[−0.86, 0.86]
40 m (s)5.4 ± 0.35.3 ± 0.20.2590.5830.40[−0.47, 1.26]
50 m (s)6.6 ± 0.36.4 ± 0.30.3550.6390.67[−0.21, 1.55]
60 m (s)7.8 ± 0.47.6 ± 0.50.4550.6830.44[−0.43, 1.31]
YYIR2 (s)2434.0 ± 666.32418.2 ± 708.20.9580.9880.02[−0.83, 0.88]
20 shuttle run (s)21.2 ± 0.320.7 ± 0.50.016 *0.0961.20[0.27, 2.13]
T-test (s)9.0 ± 0.38.8 ± 0.30.1640.4420.67[−0.21, 1.55]
Illinois Agility Run (s)14.8 ± 0.414.0 ± 0.4<0.001 **0.018 *2.00[0.95, 3.05]
VO2peak: peak oxygen uptake, * p-value < 0.05, ** p-value < 0.01, indicates a statistically significant difference between two groups. Values are mean ± SD.
Table 3. Anthropometric characteristics by 40 sprint performance.
VariableFast (n = 10)Slow (n = 11)p ValueFDR-Adjusted
p Value
Cohen’s d95% CI
Age (years)22.3 ± 2.121.0 ± 3.00.2560.3780.50[−0.39, 1.39]
Training experience (years)5.2 ± 2.64.5 ± 2.70.5550.5550.26[−0.61, 1.14]
Height (cm)180.3 ± 6.7183.6 ± 6.40.2590.378−0.50[−1.39, 0.39]
Body mass (kg)80.8 ± 8.284.1 ± 8.50.3780.378−0.39[−1.27, 0.49]
BMI (kg/m2)24.8 ± 1.524.9 ± 2.40.8790.879−0.05[−0.92, 0.82]
BMI: body mass index, calculated by weight and height. Values are mean ± SD.
Table 4. Physical fitness characteristics by 40 sprint performance group.
VariableFast (n = 10)Slow (n = 11)p ValueFDR-Adjusted p-ValueCohen’s d95% CI
VO2peak (mL/min)4843.0 ± 787.04193.0 ± 577.00.048 *0.0820.95[0.05, 1.85]
Relative VO2peak (mL/kg/min)61.0 ± 14.049.9 ± 5.20.037 *0.0821.07[0.16,1.99]
Peak anaerobic power (W)1232.2 ± 202.91057.4 ± 161.30.044 *0.0820.96[0.06, 1.86]
Mean anaerobic power (W)743.2 ± 51.0743.0 ± 92.70.9950.9990.03[−0.85, 0.86]
Minimum anaerobic power (W)435.4 ± 86.6369.2 ± 135.60.1960.2780.57[−0.30, 1.45]
Anaerobic power decrement (%)63.2 ± 11.565.4 ± 11.40.6650.808−0.19[−1.05, 0.67]
Vital capacity (mL)5161.0 ± 585.34897.0 ± 958.50.4520.5910.33[−0.53, 1.19]
Muscle mass (kg)67.2 ± 6.268.0 ± 6.90.9450.999−0.12[−0.98, 0.74]
Vital capacity/height (mL/cm)29.2 ± 3.026.5 ± 4.70.1340.2280.68[−0.20, 1.56]
VO2peak: peak oxygen uptake, * p-value < 0.05 indicates a statistically significant difference between two groups. Values are mean ± SD.
Table 5. Running and agility performance by 40 sprint performance group.
VariableFast (n = 10)Slow (n = 11)p ValueFDR-Adjusted
p Value
Cohen’s d95% CI
Goalpost shuttle run (s)26.8 ± 1.828.9 ± 1.90.017 *0.057−1.13[−2.06, −0.21]
10 m (s)1.7 ± 0.11.9 ± 0.10.007 **0.040 *−2.00[−3.05, −0.95]
50 m (s)6.2 ± 0.36.7 ± 0.2<0.001 **0.017 *−1.98[−3.03, −0.94]
60 m (s)7.4 ± 0.48.0 ± 0.30.002 **0.017 *−1.71[−2.71, −0.71]
YYIR2 (m)2426.0 ± 786.32425.5 ± 587.10.9990.9990.00[−0.86, 0.86]
20 shuttle run (s)20.7 ± 0.421.2 ± 0.50.033 *0.082−1.10[−2.02, −0.18]
T-test (s)8.7 ± 0.39.0 ± 0.30.016 *0.057−1.00[−1.91, −0.09]
Illinois Agility Run (s)14.2 ± 0.614.5 ± 0.60.1460.228−0.50[−1.37, 0.37]
* p-value < 0.05, ** p-value < 0.01, indicates a statistically significant difference between two groups. Values are mean ± SD.
Disclaimer/Publisher’s Note: The statements, opinions and data contained in all publications are solely those of the individual author(s) and contributor(s) and not of MDPI and/or the editor(s). MDPI and/or the editor(s) disclaim responsibility for any injury to people or property resulting from any ideas, methods, instructions or products referred to in the content.