1. Introduction
Geohazards frequently occur in human production and daily life. Due to their highly destructive force, they can not only alter landforms and topography but also cause casualties and property losses [
1]. Several studies have focused on the selection and delineation of mapping units in regional geological hazard assessment by using machine learning methods with different geological, hydrogeological and other pertinent variables [
2,
3,
4].The common evaluation units for geological disaster susceptibility include the following categories [
5]: grid cells [
6,
7], slope units [
8,
9], terrain units [
10], topological units [
11], and unique condition units [
12]. The grid cell is the most commonly used assessment unit, and it has the advantages of fast computing speed and convenient factor overlay analysis, but it may not be precise enough in reflecting changes in surface morphology. In contrast, the sub-watershed unit is often applied to the hazard zoning of floods, debris flows and other disasters; geomorphological units are well-suited for regional geohazard assessments targeting extensive areas at a small scale; and homogeneous condition units fail to take into account the discrepancies in geological environmental conditions across different regions. Slope units divide the assessment area into cartographic units delimited jointly by valley lines and ridge lines, which can effectively remedy the deficiency of being integrally cut by raster units [
13,
14,
15]. In addition, a slope unit serves as the fundamental unit for the development of geological disasters such as landslides, collapses, and debris flows and can comprehensively reflect regions where geological disasters incubate, occur, and are distributed, as well as the various disaster-inducing environmental factors within those areas. Therefore, slope units are widely adopted for large-scale landslide susceptibility assessments with relatively high accuracy. Each slope unit serves as an independent geomorphic evaluation unit that accurately captures local topographic, geomorphological, and geological structural features. Within an individual slope unit, consistent lithology, stratigraphic structure, slope gradient, and hydrological features are maintained, while clear geological and topographic differences exist between adjacent units. These uniform internal geological and terrain features within each unit and distinct inter-unit differences improve the pertinence and accuracy of geological disaster susceptibility evaluation [
16,
17].
In recent decades, due to the influence of human engineering activities, increasing attention has been paid to anthropogenic engineering disturbance as a critical conditioning factor in landslide risk modeling [
18]. Against the background of dense rural residential construction, several studies have proposed the concept of residential slope units for refined geohazard evaluation. Taking Xintian County in the southern Hunan mountainous area as an example, Qiu et al. completed multi-period geohazard risk zoning under different rainfall return periods based on residential slope units [
19]. A residential slope unit refers to a hillslope segment with a stable gradient, relief and catchment range closely coupled with human residential settlements [
18]. Its prominent advantage is that it screens out slopes unrelated to human activity, drastically reduces redundant calculation, and supports refined risk targeting for populated areas. Hence, high-precision disaster prevention demands more specialized settlement-oriented slope evaluation units.
Data-driven supervised machine learning has become the mainstream technical route for geohazard susceptibility assessment [
20]. Classic algorithms include Random Forest, Back Propagation Neural Networks, Logistic Regression and Support Vector Machines (SVMs). Random Forest exhibits outstanding performance in capturing complex nonlinear factor relationships and possesses strong anti-interference robustness, making it a mature evaluation tool [
21,
22]. To further boost prediction accuracy, scholars have widely introduced metaheuristic optimization algorithms to tune model hyperparameters. For instance, Wang et al. optimized the weight and threshold parameters of Elman neural networks via Genetic Algorithm and Particle Swarm Optimization (PSO), significantly improving the prediction precision of loess landslide deformation [
23].
Xiangtan County is a typical hilly region in Hunan Province, where extensive slope cutting for housing and road excavation prevails. Complex geological backgrounds coupled with intensive human engineering disturbances trigger frequent small-scale, widely distributed landslides and collapses, forming a representative research area for anthropogenic landslide susceptibility [
24,
25]. Existing local geohazard studies mostly focus on single disaster point mechanisms, deformation characteristics, and stability analyses, while systematic quantitative susceptibility evaluation covering the whole county is still insufficient. Based on a 1:10,000 field geohazard survey in the study area and preliminary qualitative susceptibility grading of residential slope units via expert scoring, all slopes were divided into 6388 low-susceptibility, 862 medium-susceptibility, and seven high-susceptibility units.
However, during the preliminary assessment of field surveys, significant discrepancies were found in the experience and expertise levels among the survey personnel. In particular, the comprehensive impacts of various evaluation factors were not fully considered. This resulted in inconsistent standards for the preliminary assessment, a lack of objectivity in the assessment process, and the need for further verification of the accuracy of the assessment results. Therefore, this study takes Xiangtan County as the research area and selects residential slope units as the evaluation units. By fully utilizing the data and information obtained from field surveys, the Pearson correlation coefficient method and multicollinearity analysis method were adopted to conduct statistical analysis on each evaluation factor, so as to determine the final set of evaluation factors. On the basis of the Particle Swarm Optimization (PSO) algorithm, the PSO-BP, PSO-RF and PSO-SVM hybrid models were constructed to separately carry out the geological disaster susceptibility assessment for the study area. After the assessment results were verified by the Kappa coefficient test, the rationality test of geological disaster point distribution, and the importance verification of geological disaster impact factors, they were compared and analyzed with the preliminary field assessment results. Compared with conventional statistical and qualitative evaluation methods that rely heavily on manual scoring and expert subjective judgment, this study adopts advanced machine learning algorithms to quantitatively calculate landslide susceptibility values based on standardized multi-source geospatial datasets. The modeling process is fully data-driven without artificial subjective weighting. This research is expected to obtain more objective and accurate results of geological disaster susceptibility assessment, providing a scientific reference for geological disaster risk assessment and prevention work.
2. Geological and Geographical Settings of the Study Area
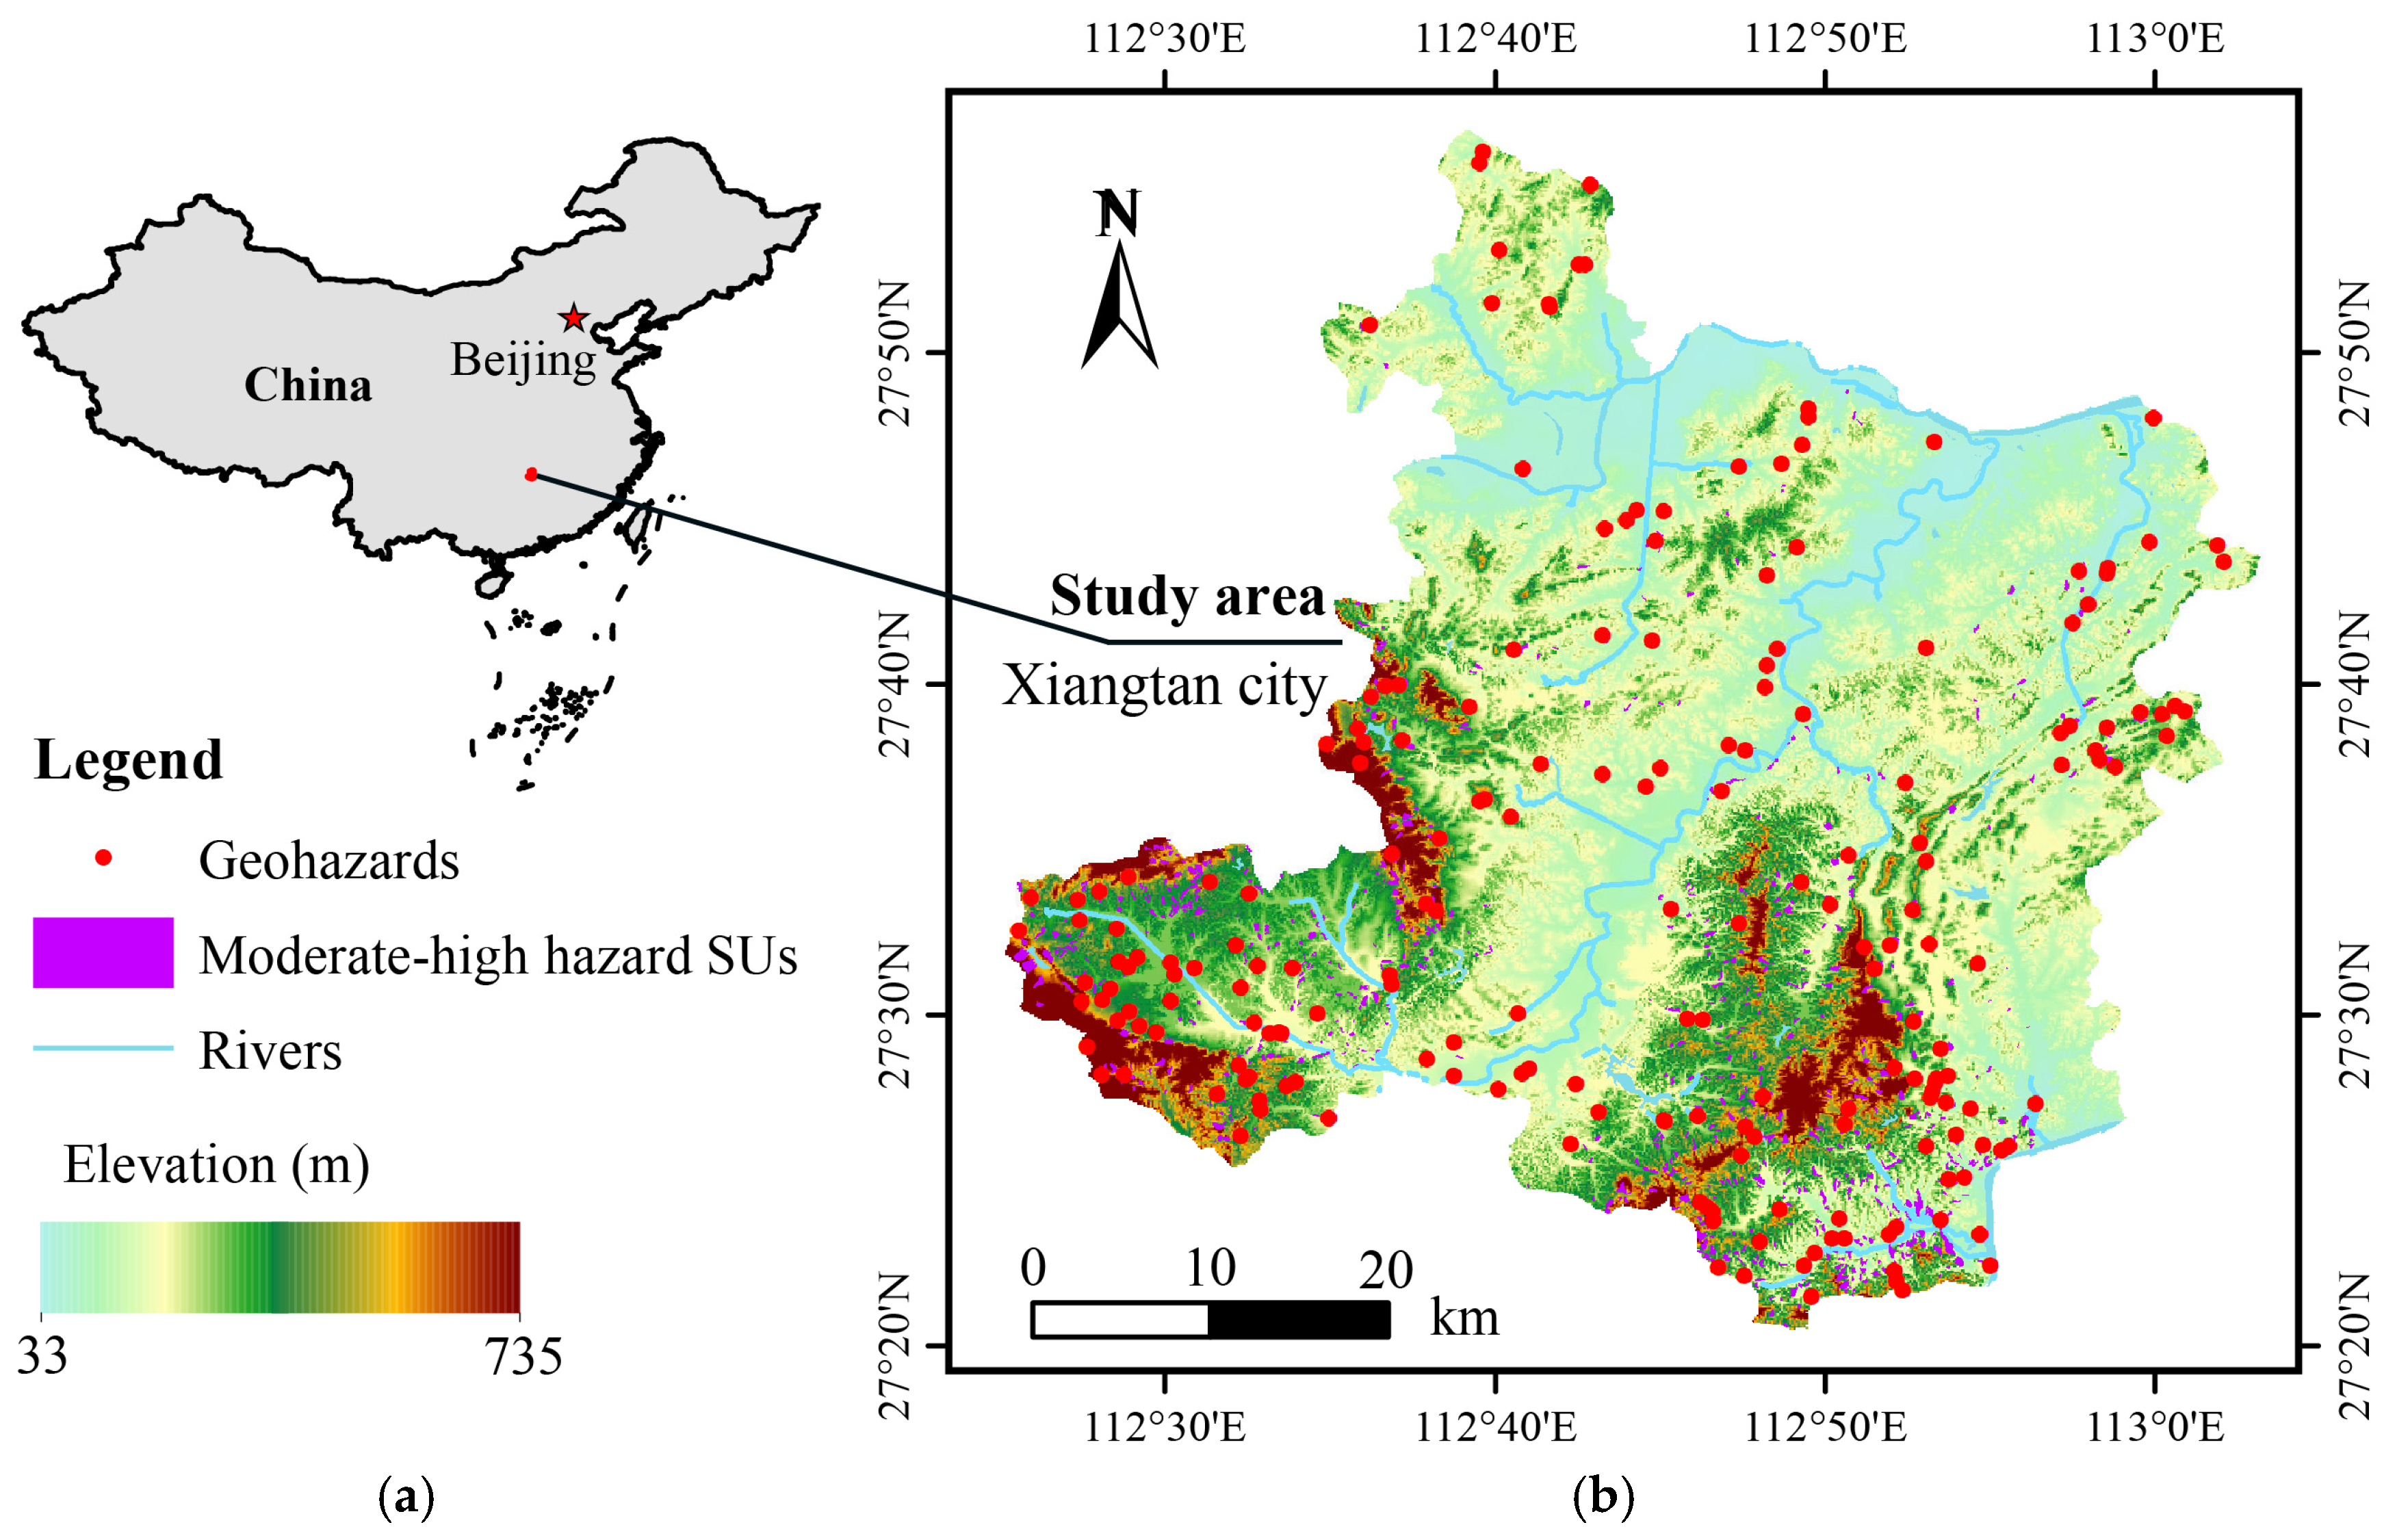
Xiangtan County is located in the middle reaches of the Xiangjiang River, in central-eastern Hunan Province, with a total area of 2136.71 km
2, as shown in
Figure 1. The county falls within the subtropical monsoon humid climate zone, with a multi-year average temperature ranging from 16.7 °C to 18.3 °C. The annual average number of rainy days in the county is about 150, and the precipitation distribution is uneven throughout the year. The rainy season generally starts in late March and ends in late July. The county seat is located in the central Hunan hilly basin. Its southwestern and southeastern parts are mountainous with relatively high terrain, while the central and northeastern parts lie along the banks of the Lianshui, Juanshui and Xiangjiang Rivers with flat terrain. The county’s topographic pattern is dominated by hills, accompanied by mountains and plains. The exposed strata within the county are relatively complete, and the strata with frequent geological hazard occurrences are mainly Cretaceous red-bed clastic rocks, Qingbaikouan shallow metamorphic rocks, and Indosinian granite.
3. Materials and Methods
3.1. Data
The occurrence of geological hazards is related to multiple factors, and collecting evaluation factor data is a prerequisite for geological disaster susceptibility assessments. The data involved in this study include residential slope unit data and geological hazard influencing factor data. The specific sources of the data are shown in
Table 1.
A total of 204 potential geohazards have been identified in Xiangtan County, including 153 landslides, accounting for 75% of the total number of hazard points; 34 ground collapses, accounting for 16.6%; 13 collapses, accounting for 6.4%; and 4 debris flows, accounting for 2%. Slope-type geological hazards account for 83.3% of the total. The neotectonic movement in this area is intense, with relatively developed rock joints and fissures and a relatively fragmented rock mass. The training and testing dataset contains 400 slope units, accounting for approximately 5.5% of all 7257 slope units within the study area. The sample size was determined for the following reasons: first, the quantity of recorded historical landslides in the region is limited, which restricts the available positive landslide samples. A sample set of 400 units was adopted to balance landslide and non-landslide samples and mitigate classification bias caused by extreme sample imbalance. Second, sampling a far larger number of slope units would generate numerous redundant samples with identical terrain and lithologic attributes, greatly increasing computational cost while yielding negligible improvement in model accuracy.
Stratified random sampling was implemented to guarantee spatial representativeness. Sampling strata were divided according to lithology types, elevation intervals, slope gradients and hazard zoning, ensuring that the 400 selected units were evenly distributed in the northern hilly regions, central river valleys, and southern mountainous areas. We further compared the statistical distributions of all conditioning factors between the sampled units and the full set of 7257 slope units. The results show that the factor statistics of the sample are highly consistent with those of the entire study area, demonstrating that the 400 samples can adequately capture the spatial variability of geological and topographic conditions across the study region.
3.2. Division of Residential Slope Units
A slope unit refers to a slope with a specific gradient, relative elevation difference, and catchment area. It is the smallest basic topographic and geomorphic unit in which geological hazards actually occur and is delineated by dividing the actual landform according to ridge lines, valley lines, and other terrain boundaries. It is usually obtained by means of hydrological analysis [
3,
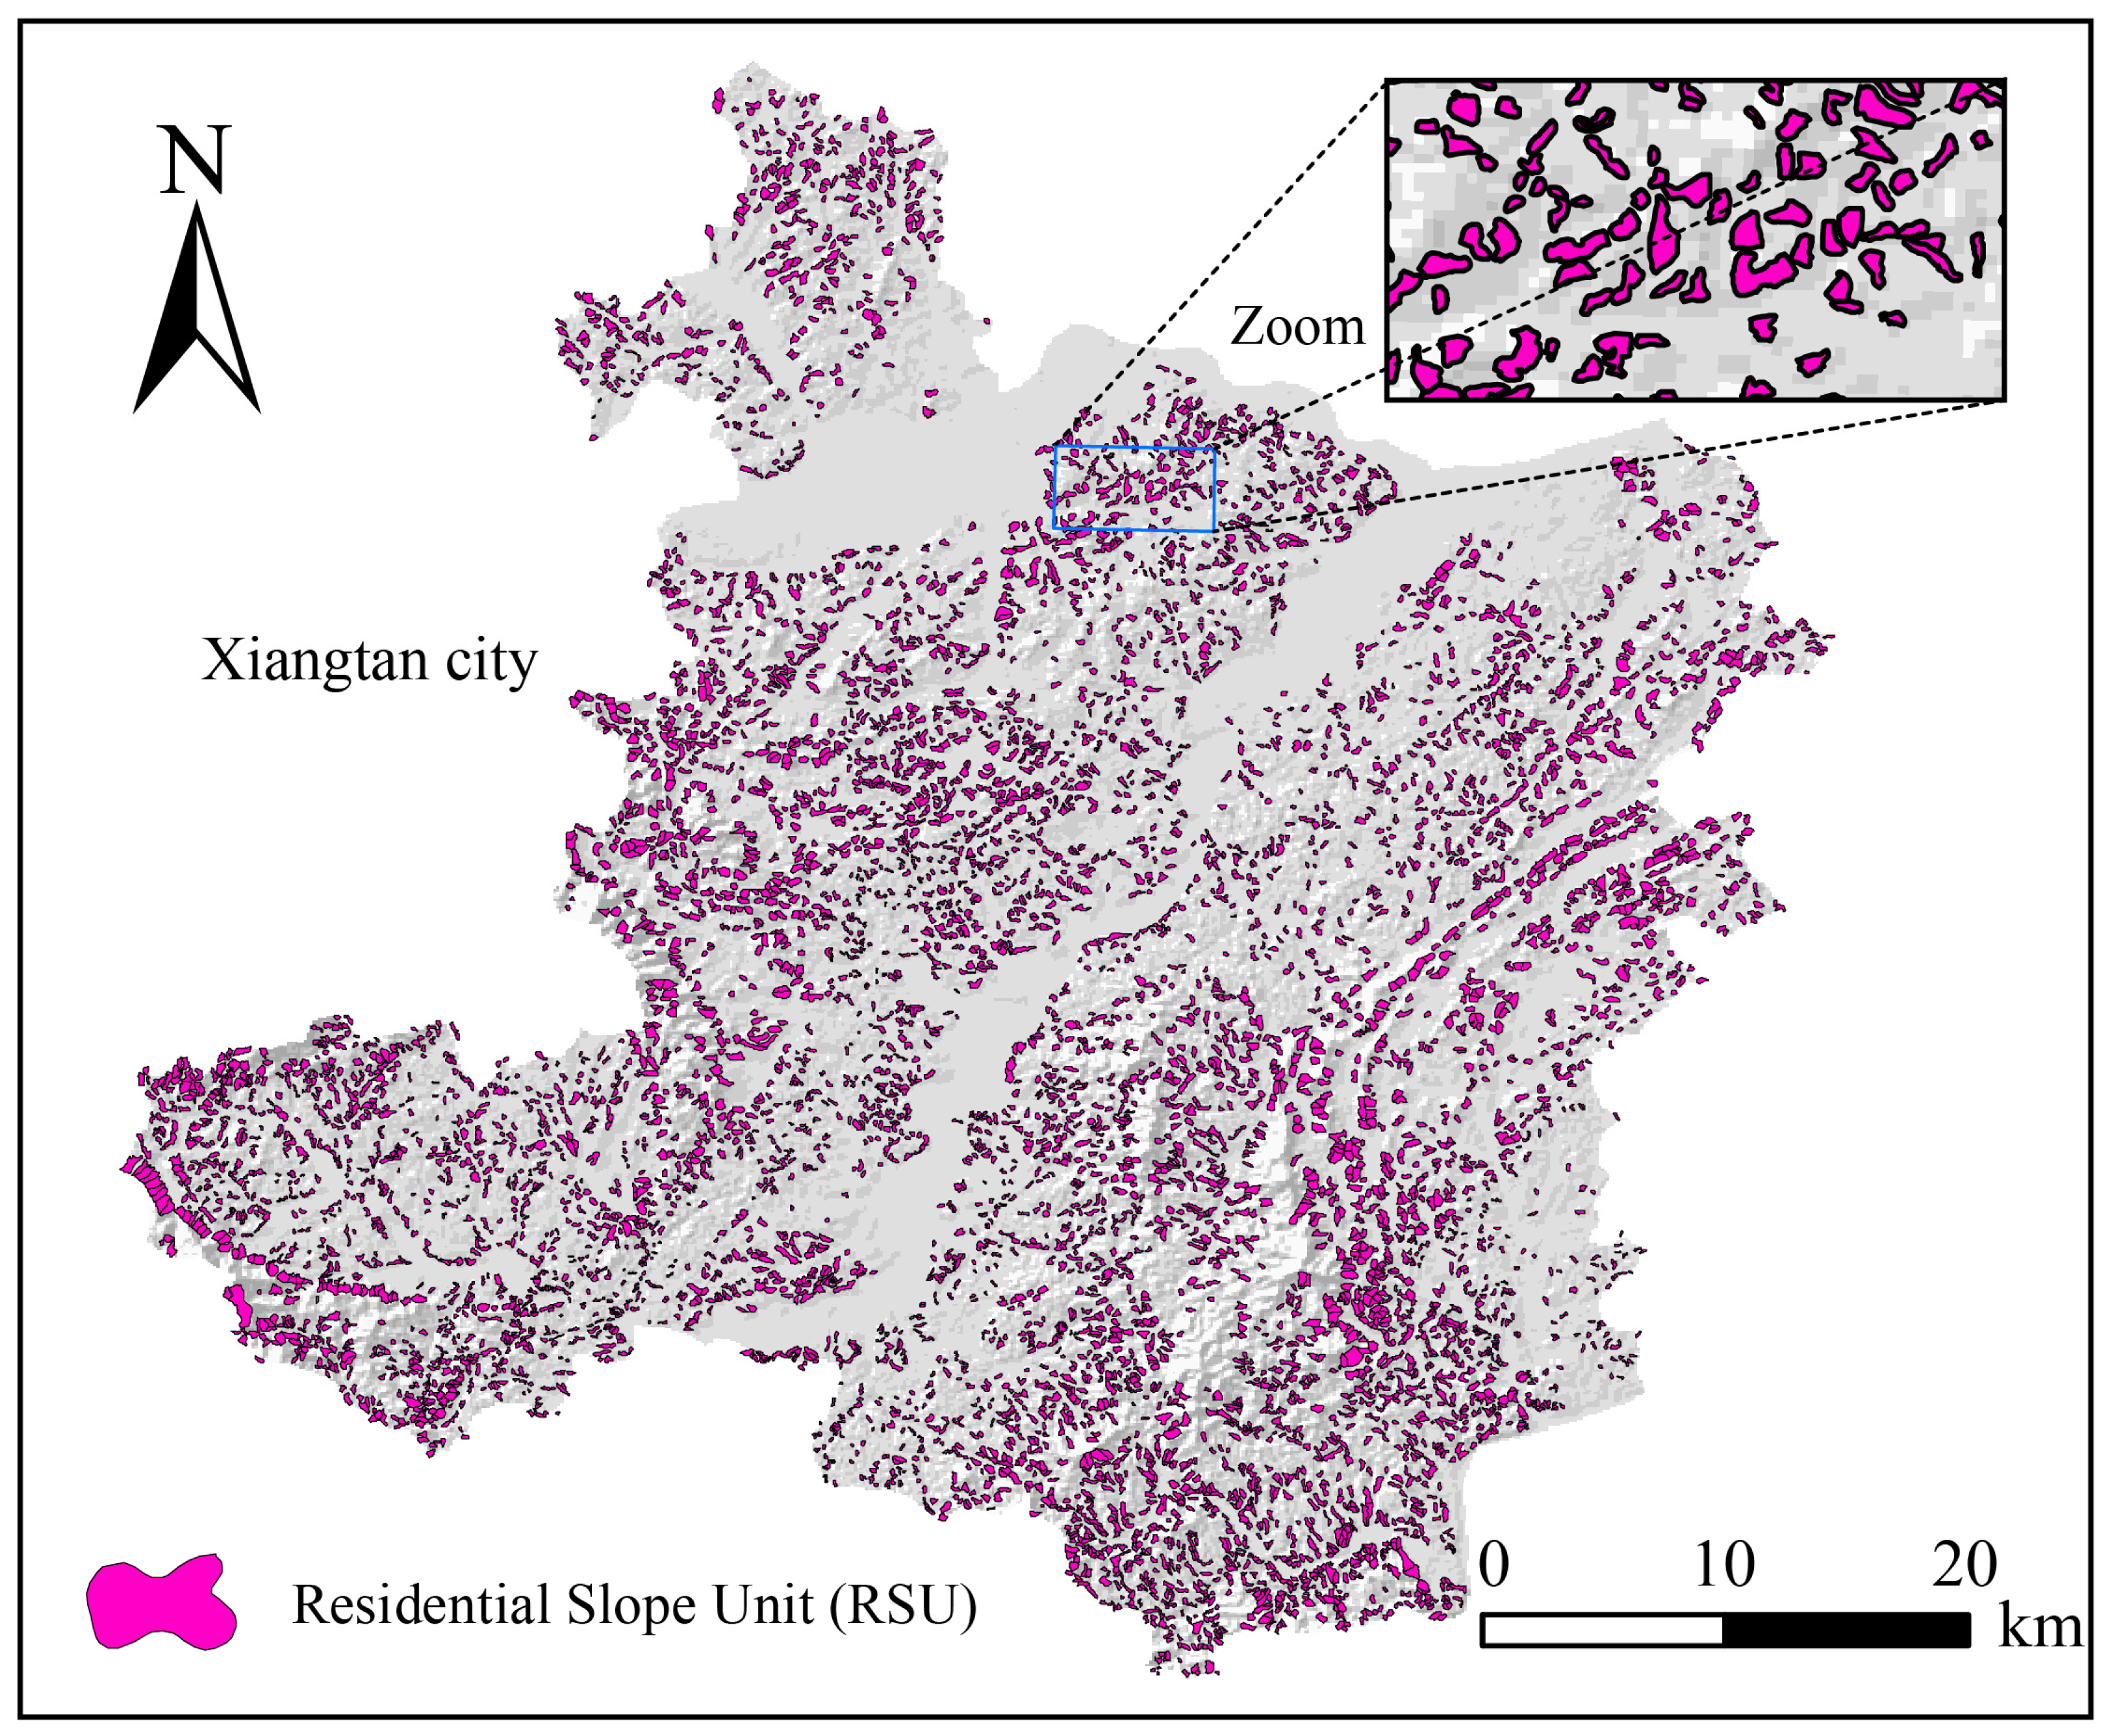
8]. However, the residential slope units adopted in this study were manually revised in terms of their morphology and size on the basis of slope unit division, with reference to remote sensing image data as well as slope structural characteristics including gradient, aspect, slope morphology and stratum lithology. Meanwhile, the delineation of residential slope units also needs to fully consider human settlement factors, and those slope units with fewer than three households or characterized by low and gentle terrain were excluded. On this basis, a total of 7257 residential slope units were delineated after processing and manual revision using ArcGIS software (10.7 version), with the coordinates uniformly converted to GCS_WGS_1984, as shown in
Figure 2. Compared with the initial slope units, the manually revised residential slope units avoid the waste of resources in mountainous uninhabited areas and flat plains without slopes, thus improving the evaluation efficiency of the susceptibility assessment model and the spatial accuracy of the evaluation area.
3.3. Analysis and Selection of Evaluation Factors
The construction of an evaluation factor system is crucial to the study of geological hazard susceptibility [
26]. According to the main types of geological hazards, topographic and geomorphic conditions, stratum lithology, human engineering activities, meteorological and hydrological characteristics, and other factors in the study area, a total of 12 evaluation factors were selected for the geological hazard susceptibility assessment of the study area, including relative elevation difference, average slope gradient, profile curvature, soil thickness, engineering geological rock group of rock and soil mass, distance to faults, annual average precipitation, Normalized Difference Vegetation Index (NDVI), Topographic Wetness Index (TWI), slope-cutting intensity, land use, and distance to roads.
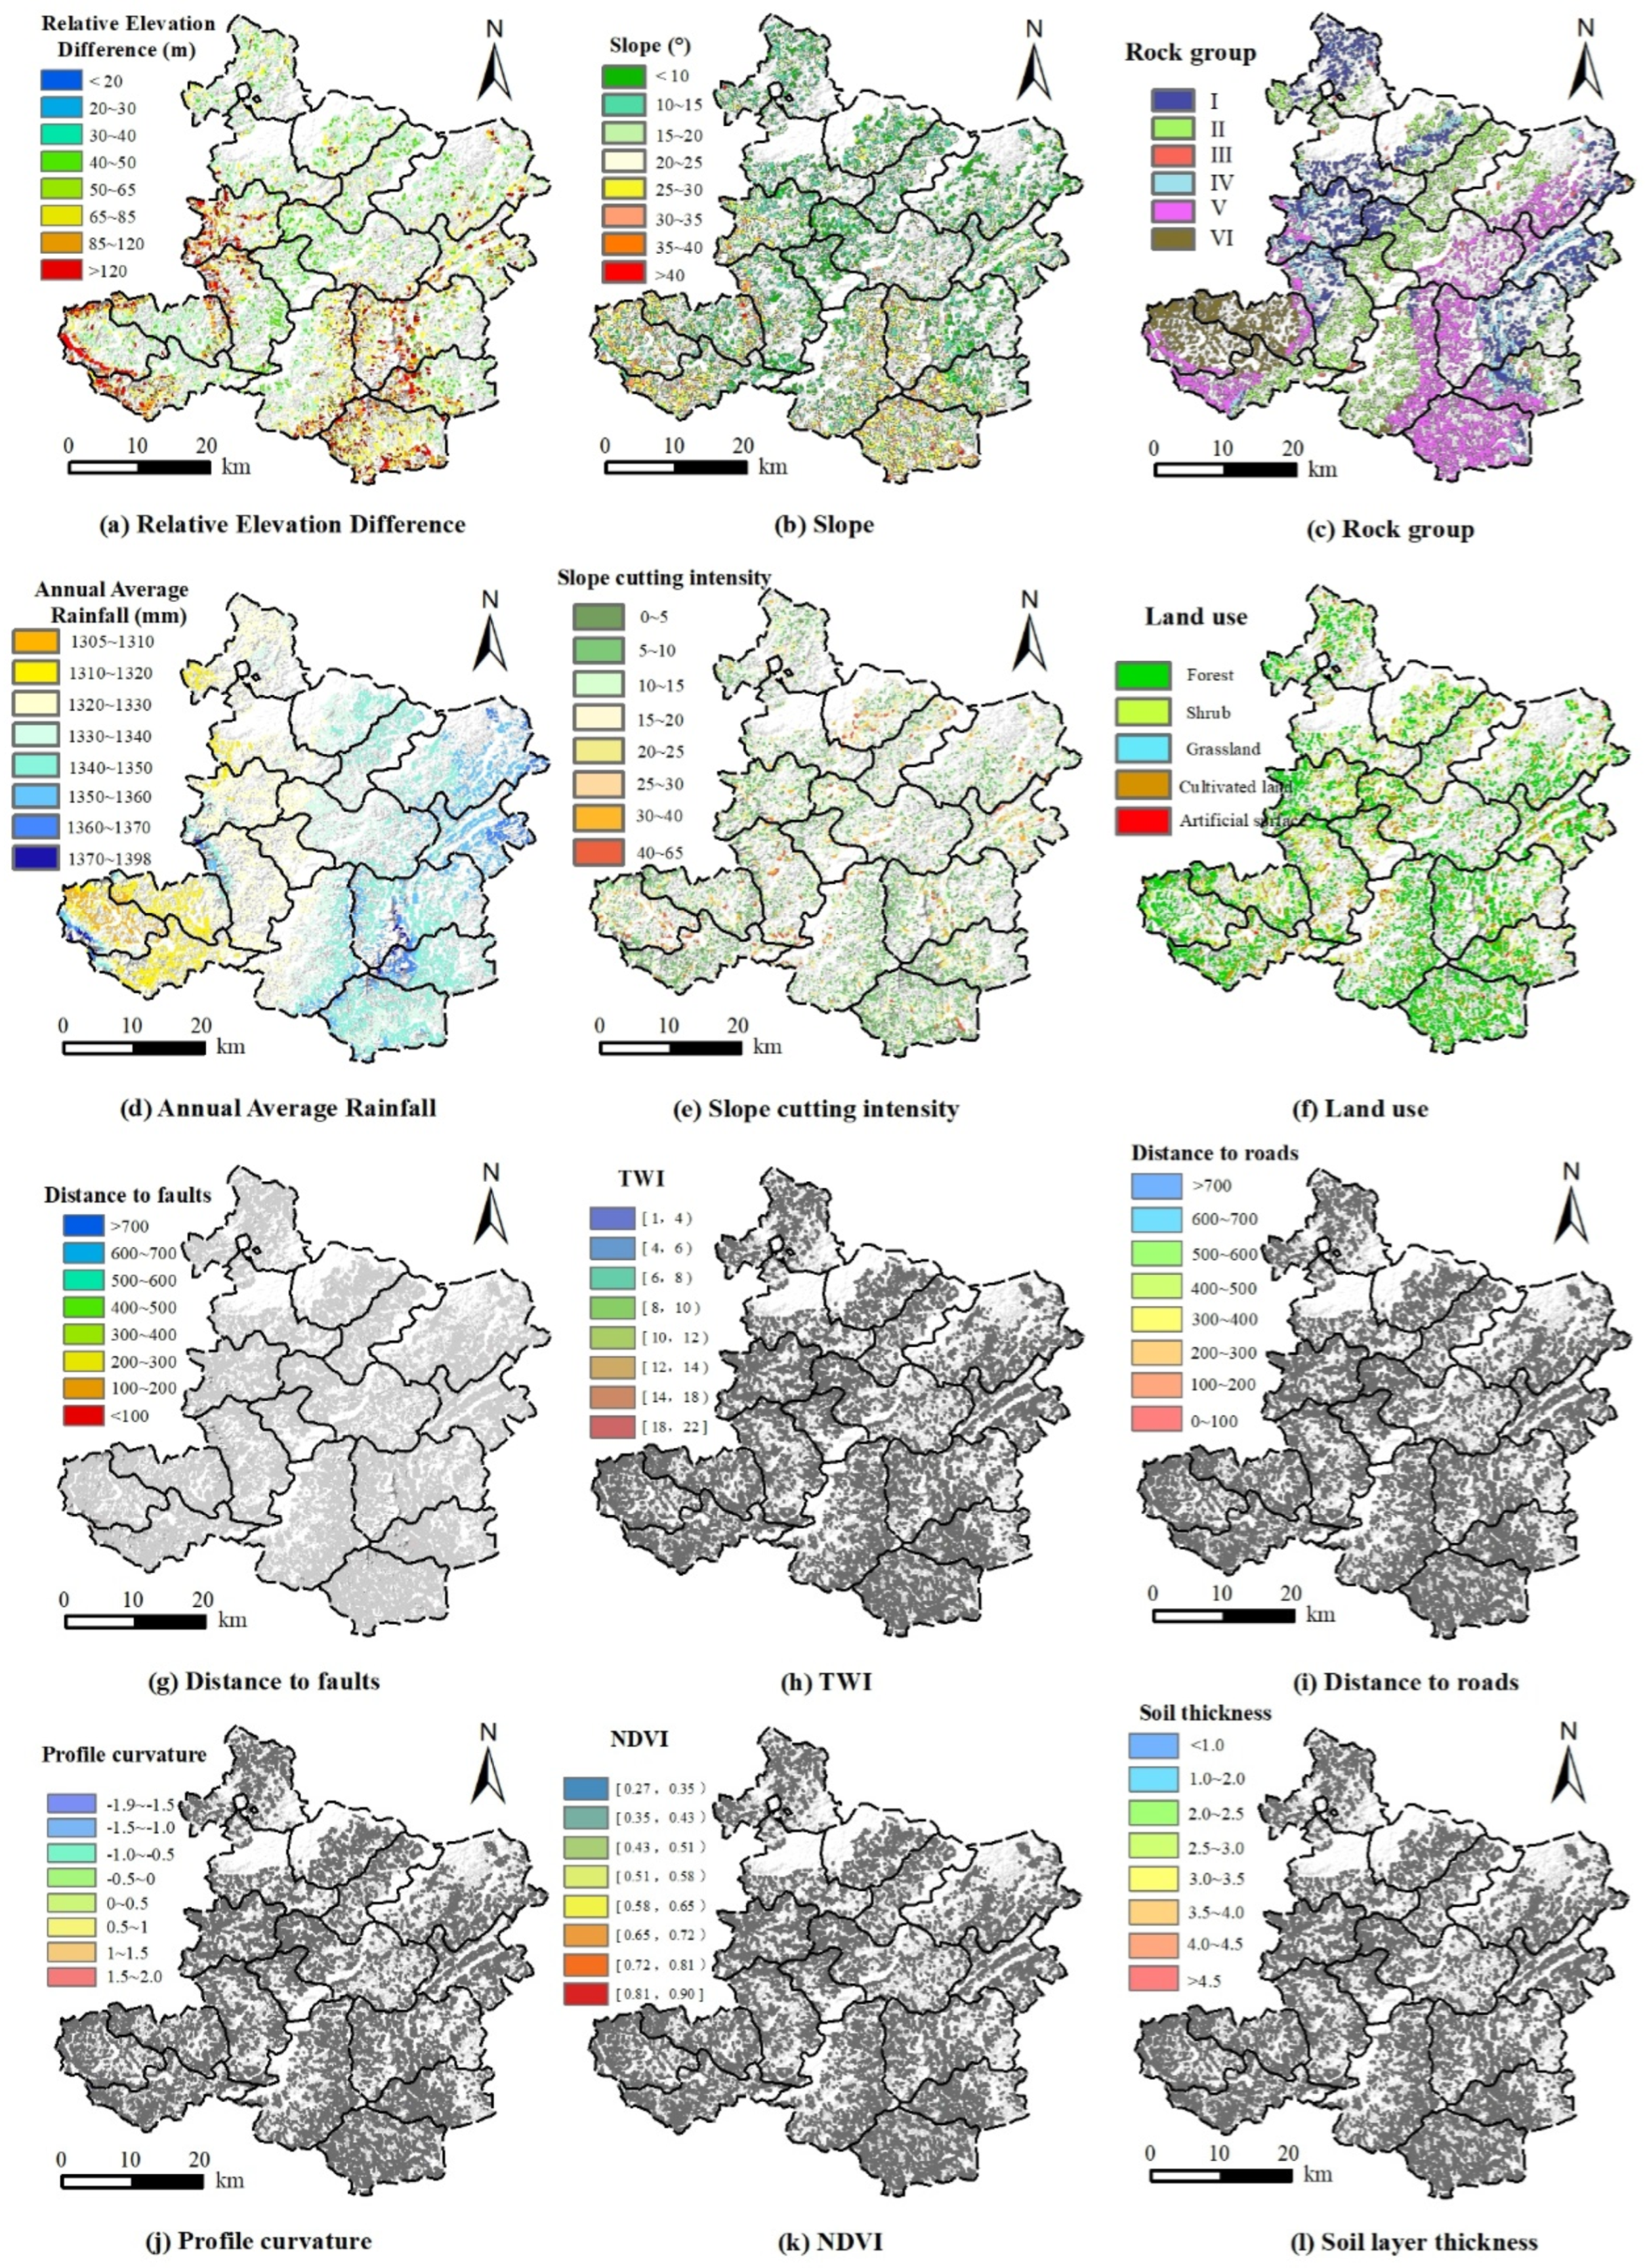
Relative Elevation Difference (RED): Relative elevation difference refers to the difference in elevation between two locations, and in this study, it specifically denotes the vertical distance between the crown height and the toe height of a residential slope unit. Generally speaking, regions with larger relative elevation differences are more prone to forming steep slopes, which in turn are more susceptible to geological hazards (see
Figure 3a).
Average Slope Gradient (ASG): Slope gradient is also a critical influencing factor of geological hazards, as well as an important indicator for assessing the susceptibility of geological hazards. During the preliminary field geological survey, the gradient of a slope can be determined by visual estimation, thereby enabling a rapid preliminary qualitative assessment of the geological hazard susceptibility of the corresponding residential slope unit (see
Figure 3b).
Engineering Geological Rock Group (EGRG): The engineering geological rock group of rock and soil mass serves as the material basis for the formation of various geological hazards. There are significant differences in the physical and mechanical properties (such as mineral composition, structural fabric, and weathering degree) among different rock groups, which control the type, scale, activity frequency, and spatial distribution pattern of geological hazards [
27]. The lithotype is shown in
Table 2 and
Figure 3c.
Annual Average Rainfall (AAR): Rainfall induces surface runoff on slope surfaces and alters the groundwater level within slope masses. The former exerts a scouring effect on slope surfaces, while the latter impairs the physical and mechanical properties of slope rock and soil masses. Moreover, rainfall often acts as a “catalyst” for the occurrence of landslides, especially in slope areas characterized by fragile geological conditions and loose rock-soil structures (see
Figure 3d).
Slope Cutting Intensity (SCI): The predominant human engineering activities in the study area are civil construction and urban development. Based on a study of historical landslide cases, it was found that geological hazards are mostly caused by damage to the original stress balance of slopes due to slope excavation during various human engineering activities, which are then triggered by rainfall [
28]. Therefore, this study mainly considers the impact of slope cutting for housing construction by residents within residential slope units on slope stability. The data were derived from field surveys of geological hazards in the study area, and the number of self-built houses by residents within each unit was used as the evaluation factor (see
Figure 3e).
Land Use (LU): Different land use types correspond to different soil properties, such as soil permeability and soil consolidation degree. In landslide disasters, different land use patterns affect the occurrence and stability of landslides through distinct mechanisms, and soil landslides account for a substantial proportion (see
Figure 3f).
Distance to Faults (DF): Faults are geological structures that are prone to inducing landslides. They tend to disrupt the continuity of rock and soil masses on slopes, thereby reducing the strength of slope bodies and creating favorable conditions for the sliding of rock and soil masses. Therefore, the closer the distance to a fault, the more developed structural planes such as joints and fractures are likely to be, and the more fragmented the rock mass will be (see
Figure 3g).
Topographic Wetness Index (TWI): This index is a physical parameter describing the impact of regional topography on runoff flow direction and accumulation. It is defined as the natural logarithm of the ratio of the unit catchment area within a grid cell to the tangent value of the local slope within the catchment area, reflecting the complex influence of topography on hydrological processes. The higher the value of this index, the higher the soil moisture content, and the greater the likelihood of triggering geological hazards such as landslides (see
Figure 3h).
Distance to Roads (DR): Slope cutting for road construction is one of the major human engineering activities in the study area. Highway construction involves excavation at slope toes, which increases the load on slopes, loosens the structure of rock and soil masses around highways, and reduces their physical and mechanical properties. Moreover, the high and steep slopes formed by slope cutting during road construction are typical areas prone to geological hazards (see
Figure 3i).
Profile Curvature (PC): Profile curvature refers to the curvature characteristics of terrain in the direction perpendicular to the horizontal plane. By quantifying the rate of bending variation in terrain in the vertical direction, it reveals the convex-concave morphology of the terrain in the region. The magnitude of profile curvature affects the morphology and stability of landslide and collapse masses; meanwhile, it is closely related to soil erosion and water loss. In areas with large profile curvature, the steep terrain leads to rapid surface runoff velocity, which accordingly increases the risks of soil erosion and water loss and reduces the slope stability (see
Figure 3j).
Normalized Difference Vegetation Index (NDVI): This index is a radiation quantitative value reflecting the relative abundance and activity of green living vegetation. By quantifying the growth status and coverage of vegetation, it calculates the ratio of the difference to the sum of the two parameters to highlight vegetation information, thereby reflecting the slope stability and soil erosion risk (see
Figure 3k).
Soil Layer Thickness (SLT): Soil thickness refers to the vertical distance from the ground surface to the bedrock or other soil layers. The completely weathered zone is the part of the rock mass most severely affected by weathering processes, with a relatively shallow depth. Generally, it refers to the weathered and fractured layer on the ground surface, where the rock mass is extremely fragmented and the rock structure is basically completely destroyed, only retaining the original rock structure locally in appearance. It has extremely low strength and can be crushed by hand. Therefore, in this study, soil layer thickness and the depth of the completely weathered zone are collectively referred to as soil layer thickness (see
Figure 3l).
Based on the preliminary susceptibility survey data of Xiangtan County, the relative height difference, average slope gradient, engineering rock group type of rock and soil mass, soil layer thickness, and intensity of human engineering activities of each residential slope unit were directly extracted. Using ArcGIS software, the 12 evaluation factors were classified according to their data attributes and the development characteristics of geological hazards in the study area. The distribution of each residential slope unit in the corresponding layer was extracted by means of the spatial analysis tools in ArcGIS, and the classification grades were assigned to the corresponding residential slope units. The natural breaks method was adopted for grading, and the dataset of residential slope units in the study area was constructed on this basis (see
Figure 3).
4. Data Pre-Processing
4.1. Multiple Correlation Test
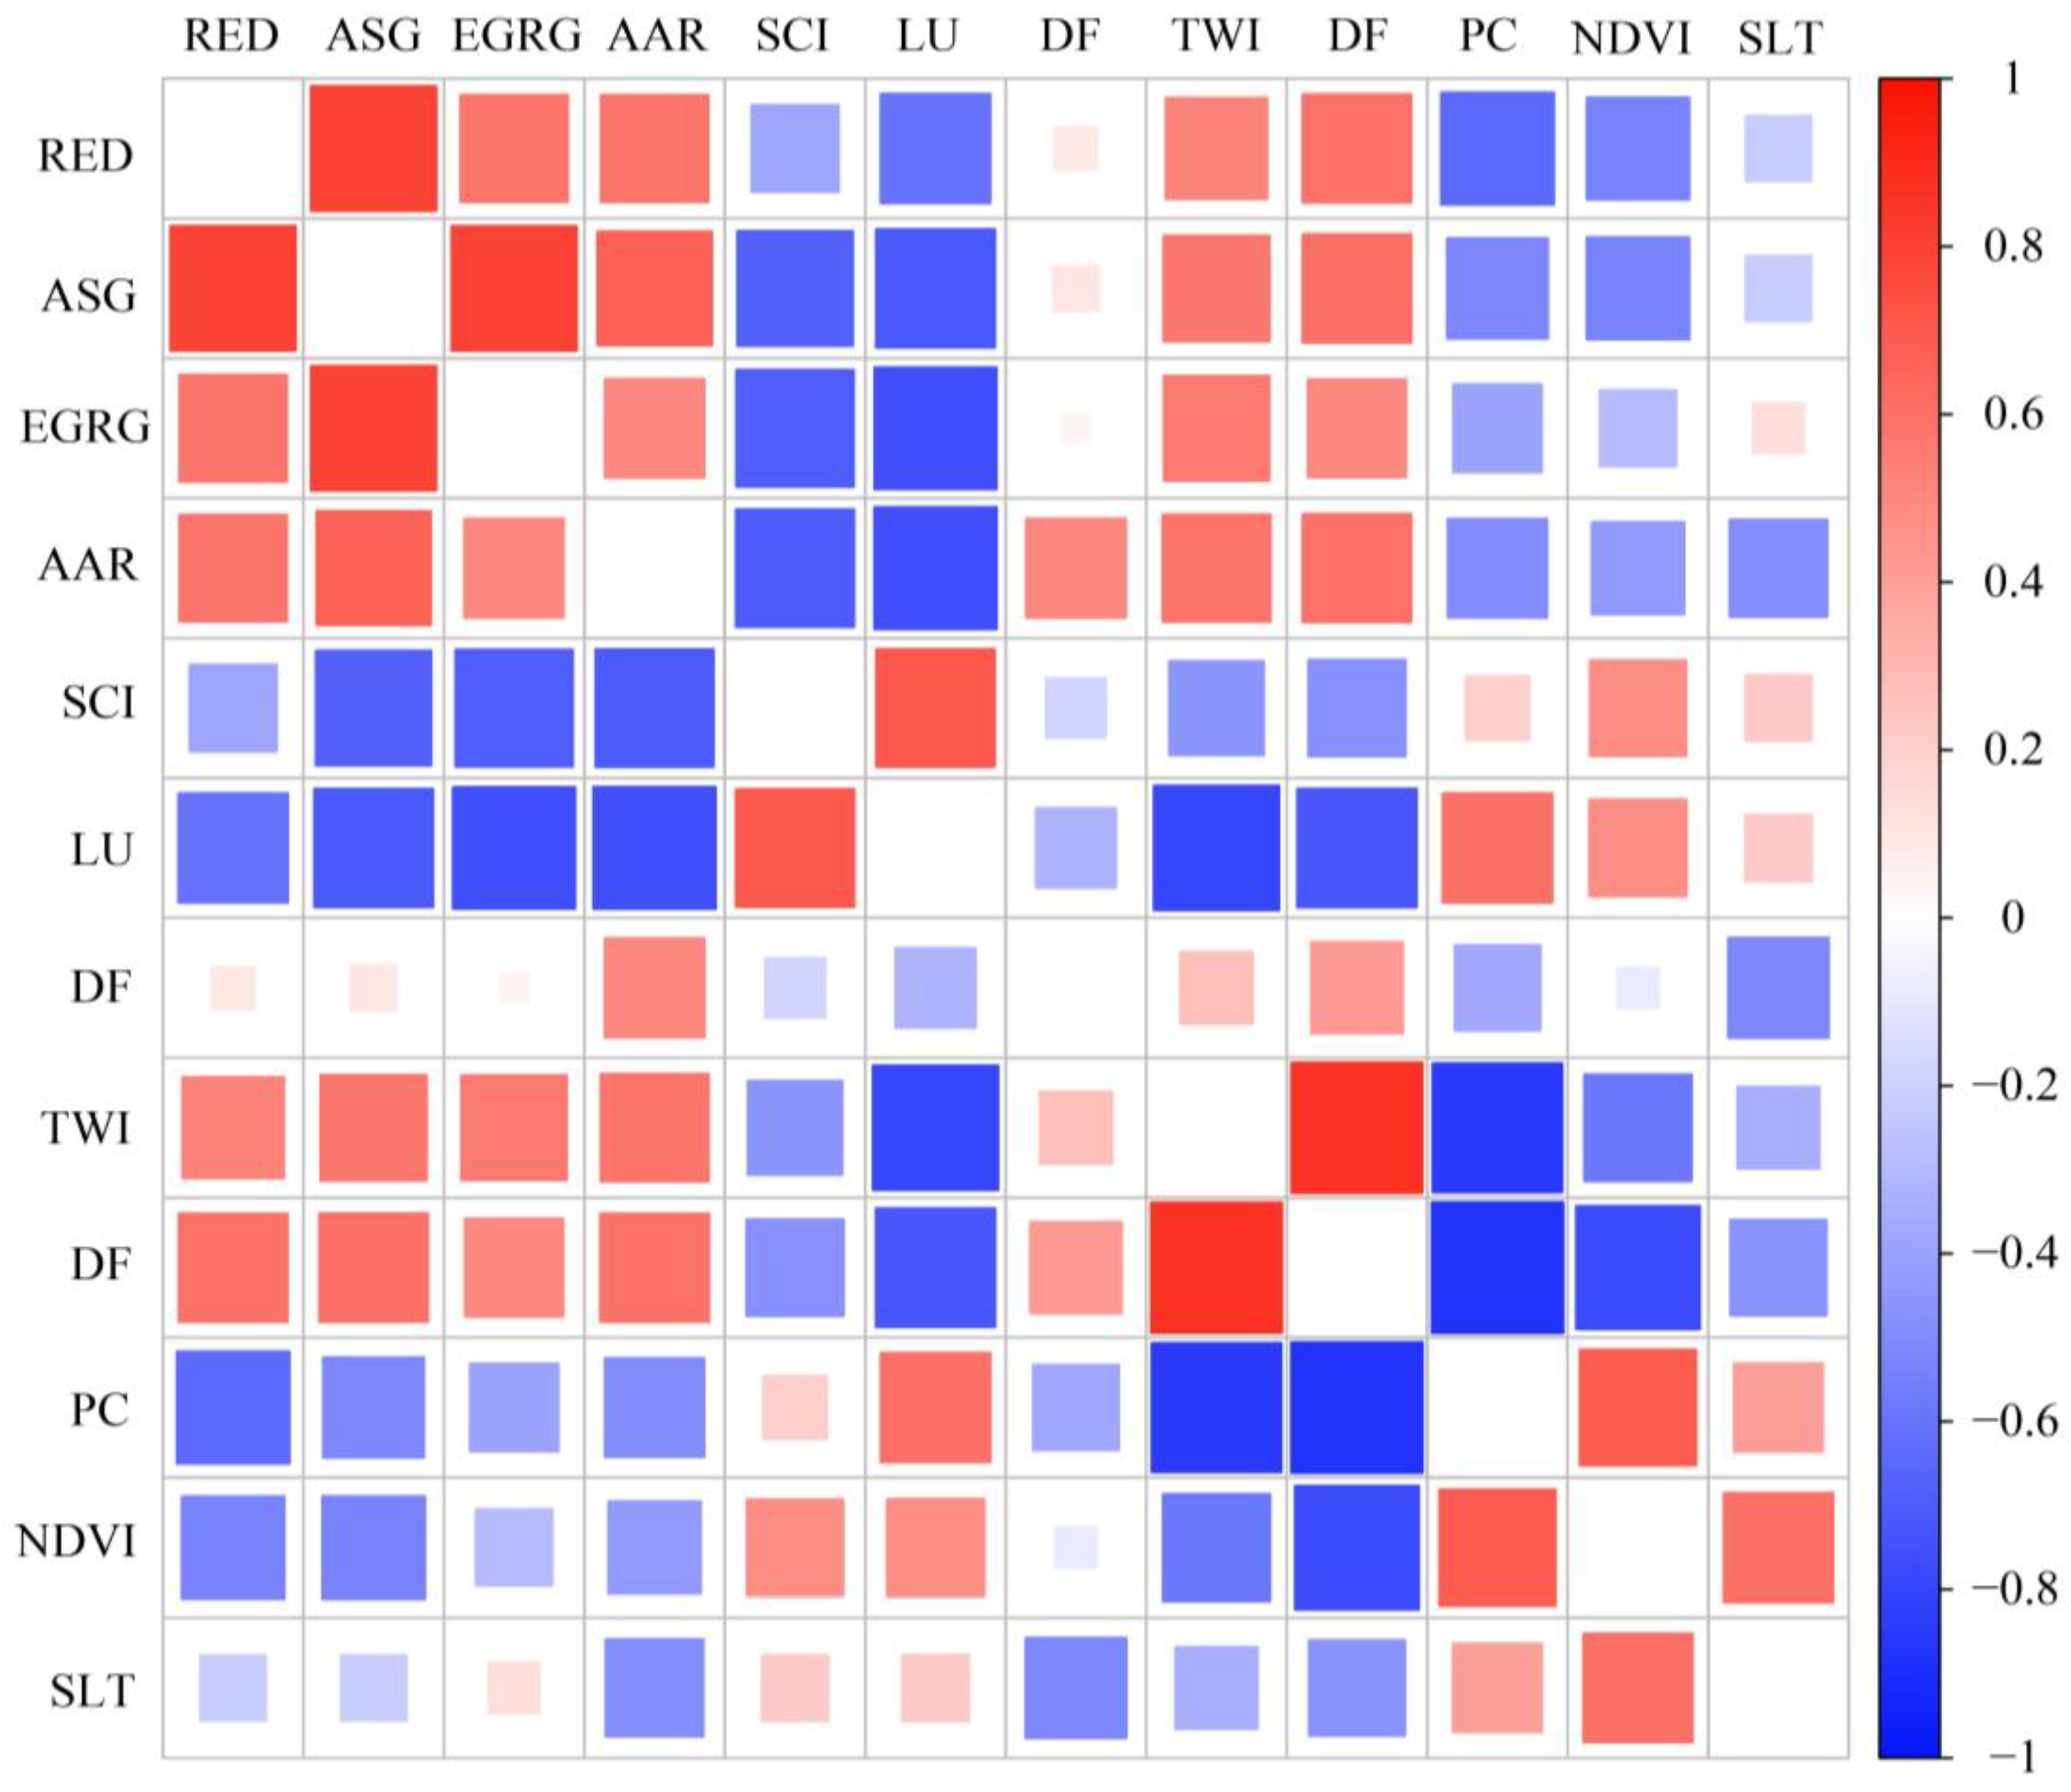
The Pearson correlation coefficient is a statistical index used to measure the correlation (linear correlation) between two variables X and Y, and its value ranges from −1 to 1 [
29]. This statistical analysis method was adopted to conduct a correlation analysis on the dataset of the study area, and the analysis results are presented in
Table 3 and
Figure 4. When the correlation coefficient between two variables is greater than 0.5, it can be considered that there is a strong correlation between them, and the redundant variables should be eliminated by considering the importance degree of the evaluation factors. The results indicate that the correlation coefficients of all evaluation factors are at low or relatively low levels, which satisfies the modeling requirements for susceptibility evaluation.
Multicollinearity refers to the existence of a linear correlation among independent variables, meaning that one independent variable can be expressed as a linear combination of one or more other independent variables. The presence of exact or high correlations among some evaluation factors will lead to distorted estimations of the trained models. The Variance Inflation Factor (VIF) is a statistical index used to characterize the degree of multicollinearity among factors [
30]. The lower the VIF value is, the lower the multicollinearity among factors will be. Under normal circumstances, when the VIF value is less than 5, the multicollinearity among factors is considered to have little impact on the model. The
VIF can be calculated using the following formula:
where
R2 is the multiple correlation coefficient of the factor. The
VIF values are shown in the
Table 4. It can be seen that the
VIF values of all 12 evaluation factors are less than 5; therefore, it can be determined that there is no multi-collinearity among these 12 evaluation factors.
4.2. Machine Learning Model
(1) Back Propagation Neural Network (BP) Model
General BP theoretical frameworks have been widely used in geohazard modeling [
31]; in this study, we customized the network structure according to the number of lithology, topographic and hydrological conditioning factors of the study area. The input layer contained 12 conditioning factor variables, a single hidden layer with 18 neurons was set after trial training, and the output layer included only one node representing the landslide occurrence probability. Considering the limited landslide sample size in mountainous terrain, we adopted the early stopping strategy to avoid overfitting during model training. The BP neural network model structure tailored for landslide susceptibility assessment is shown in
Figure 5.
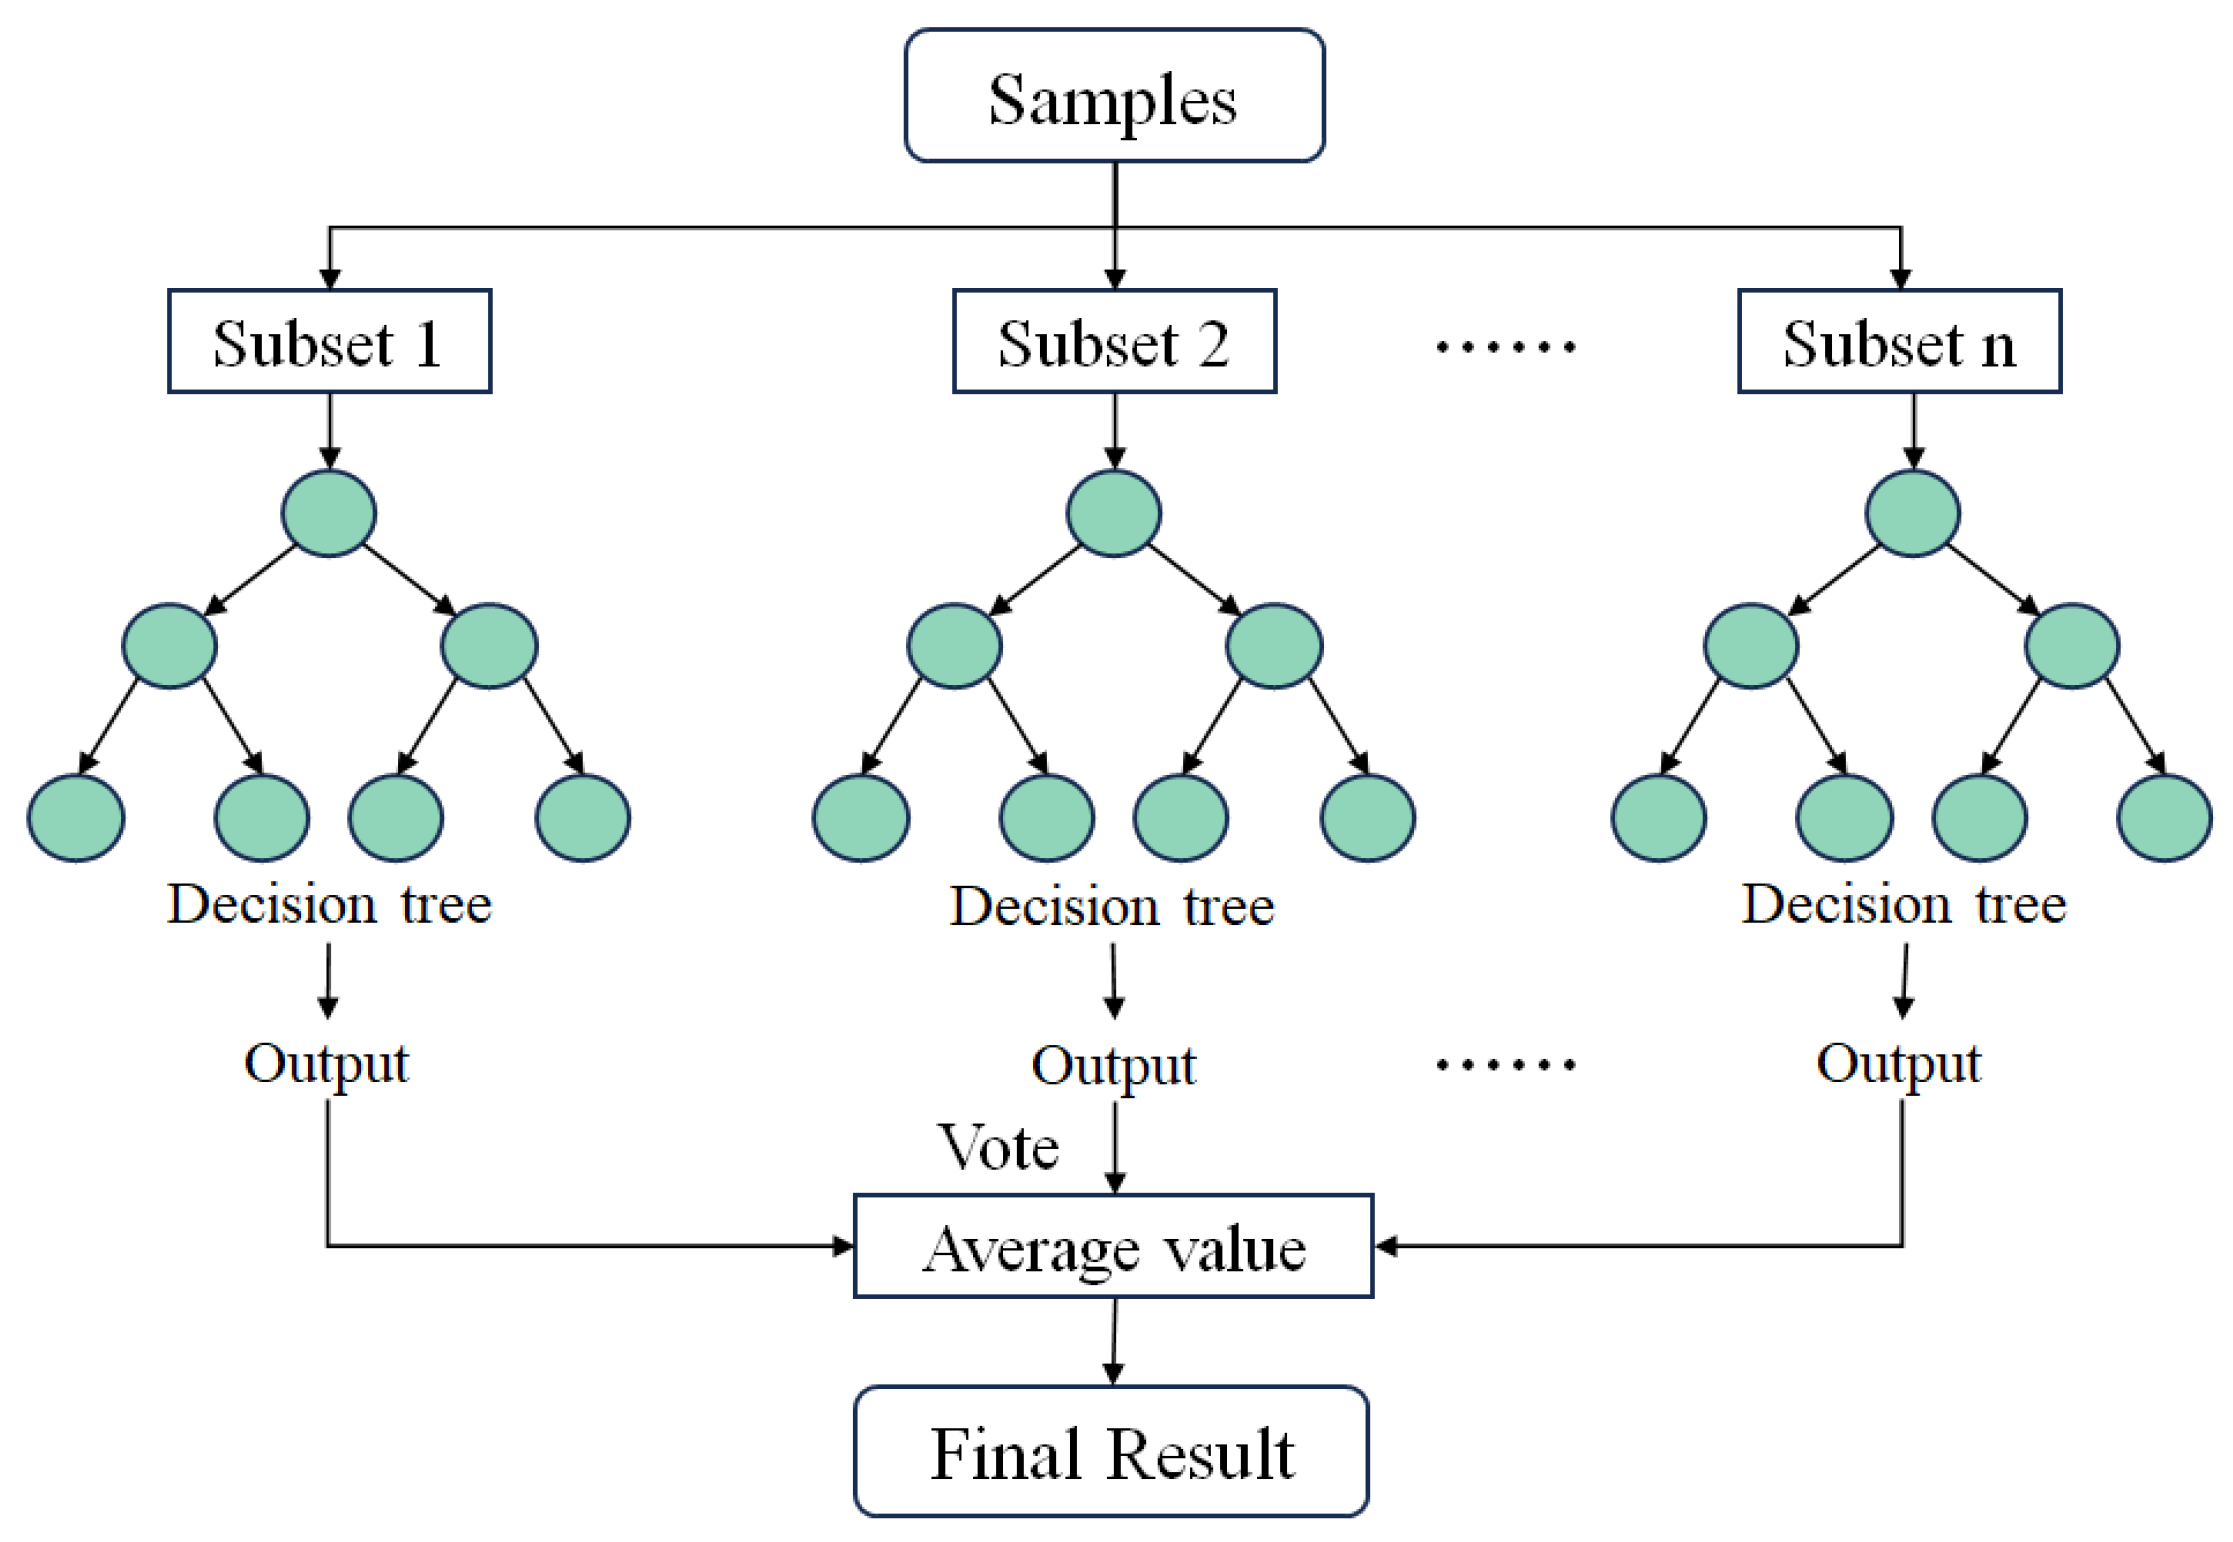
(2) Random Forest (RF) Model
A binary classification Random Forest (RF) model was adopted specifically for landslide/non-landslide discrimination in this paper [
32] (see
Figure 6). To match the local geological feature distribution, we set the number of decision trees to 150 and used 70% of the total samples for model training and the remaining 30% for verification. For classification tasks, the Random Forest determines the final classification result through the majority voting method, which effectively reduces prediction bias caused by unbalanced geohazard samples in mountainous watersheds.
(3) Support Vector Machine (SVM) Model
As a discriminative classifier, the Support Vector Machine (SVM) is theoretically based on the principle of structural risk minimization [
33]. To address the nonlinear relationship between complex terrain-geological factors and landslide distribution in the study area, the radial basis function (RBF) was selected as the kernel function after comparative trials [
34]. c and g are two important hyperparameters optimized in this study: c is the penalty factor (regularization parameter), and g is the radial basis function width parameter.
The main formulas applied in the landslide binary classification task are as follows:
The objective function is expressed as:
where
c is the penalty factor (also referred to as the regularization parameter), and
g is the radial basis function parameter.
Constraint conditions are as follows:
where ω is the normal vector of the hyperplane,
is the number of sample points,
is the feature vector of the i-th sample point,
is the bias term of the model,
is the label of the i-th sample point,
is the slack variable (adopted to handle non-linearly separable data), and
is the regularization parameter.
(4) Particle Swarm Optimization (PSO) Algorithm
This algorithm is a meta-heuristic algorithm based on swarm intelligence theory, and its bionic principle is derived from the dynamic modeling of the flocking and foraging behaviors of birds [
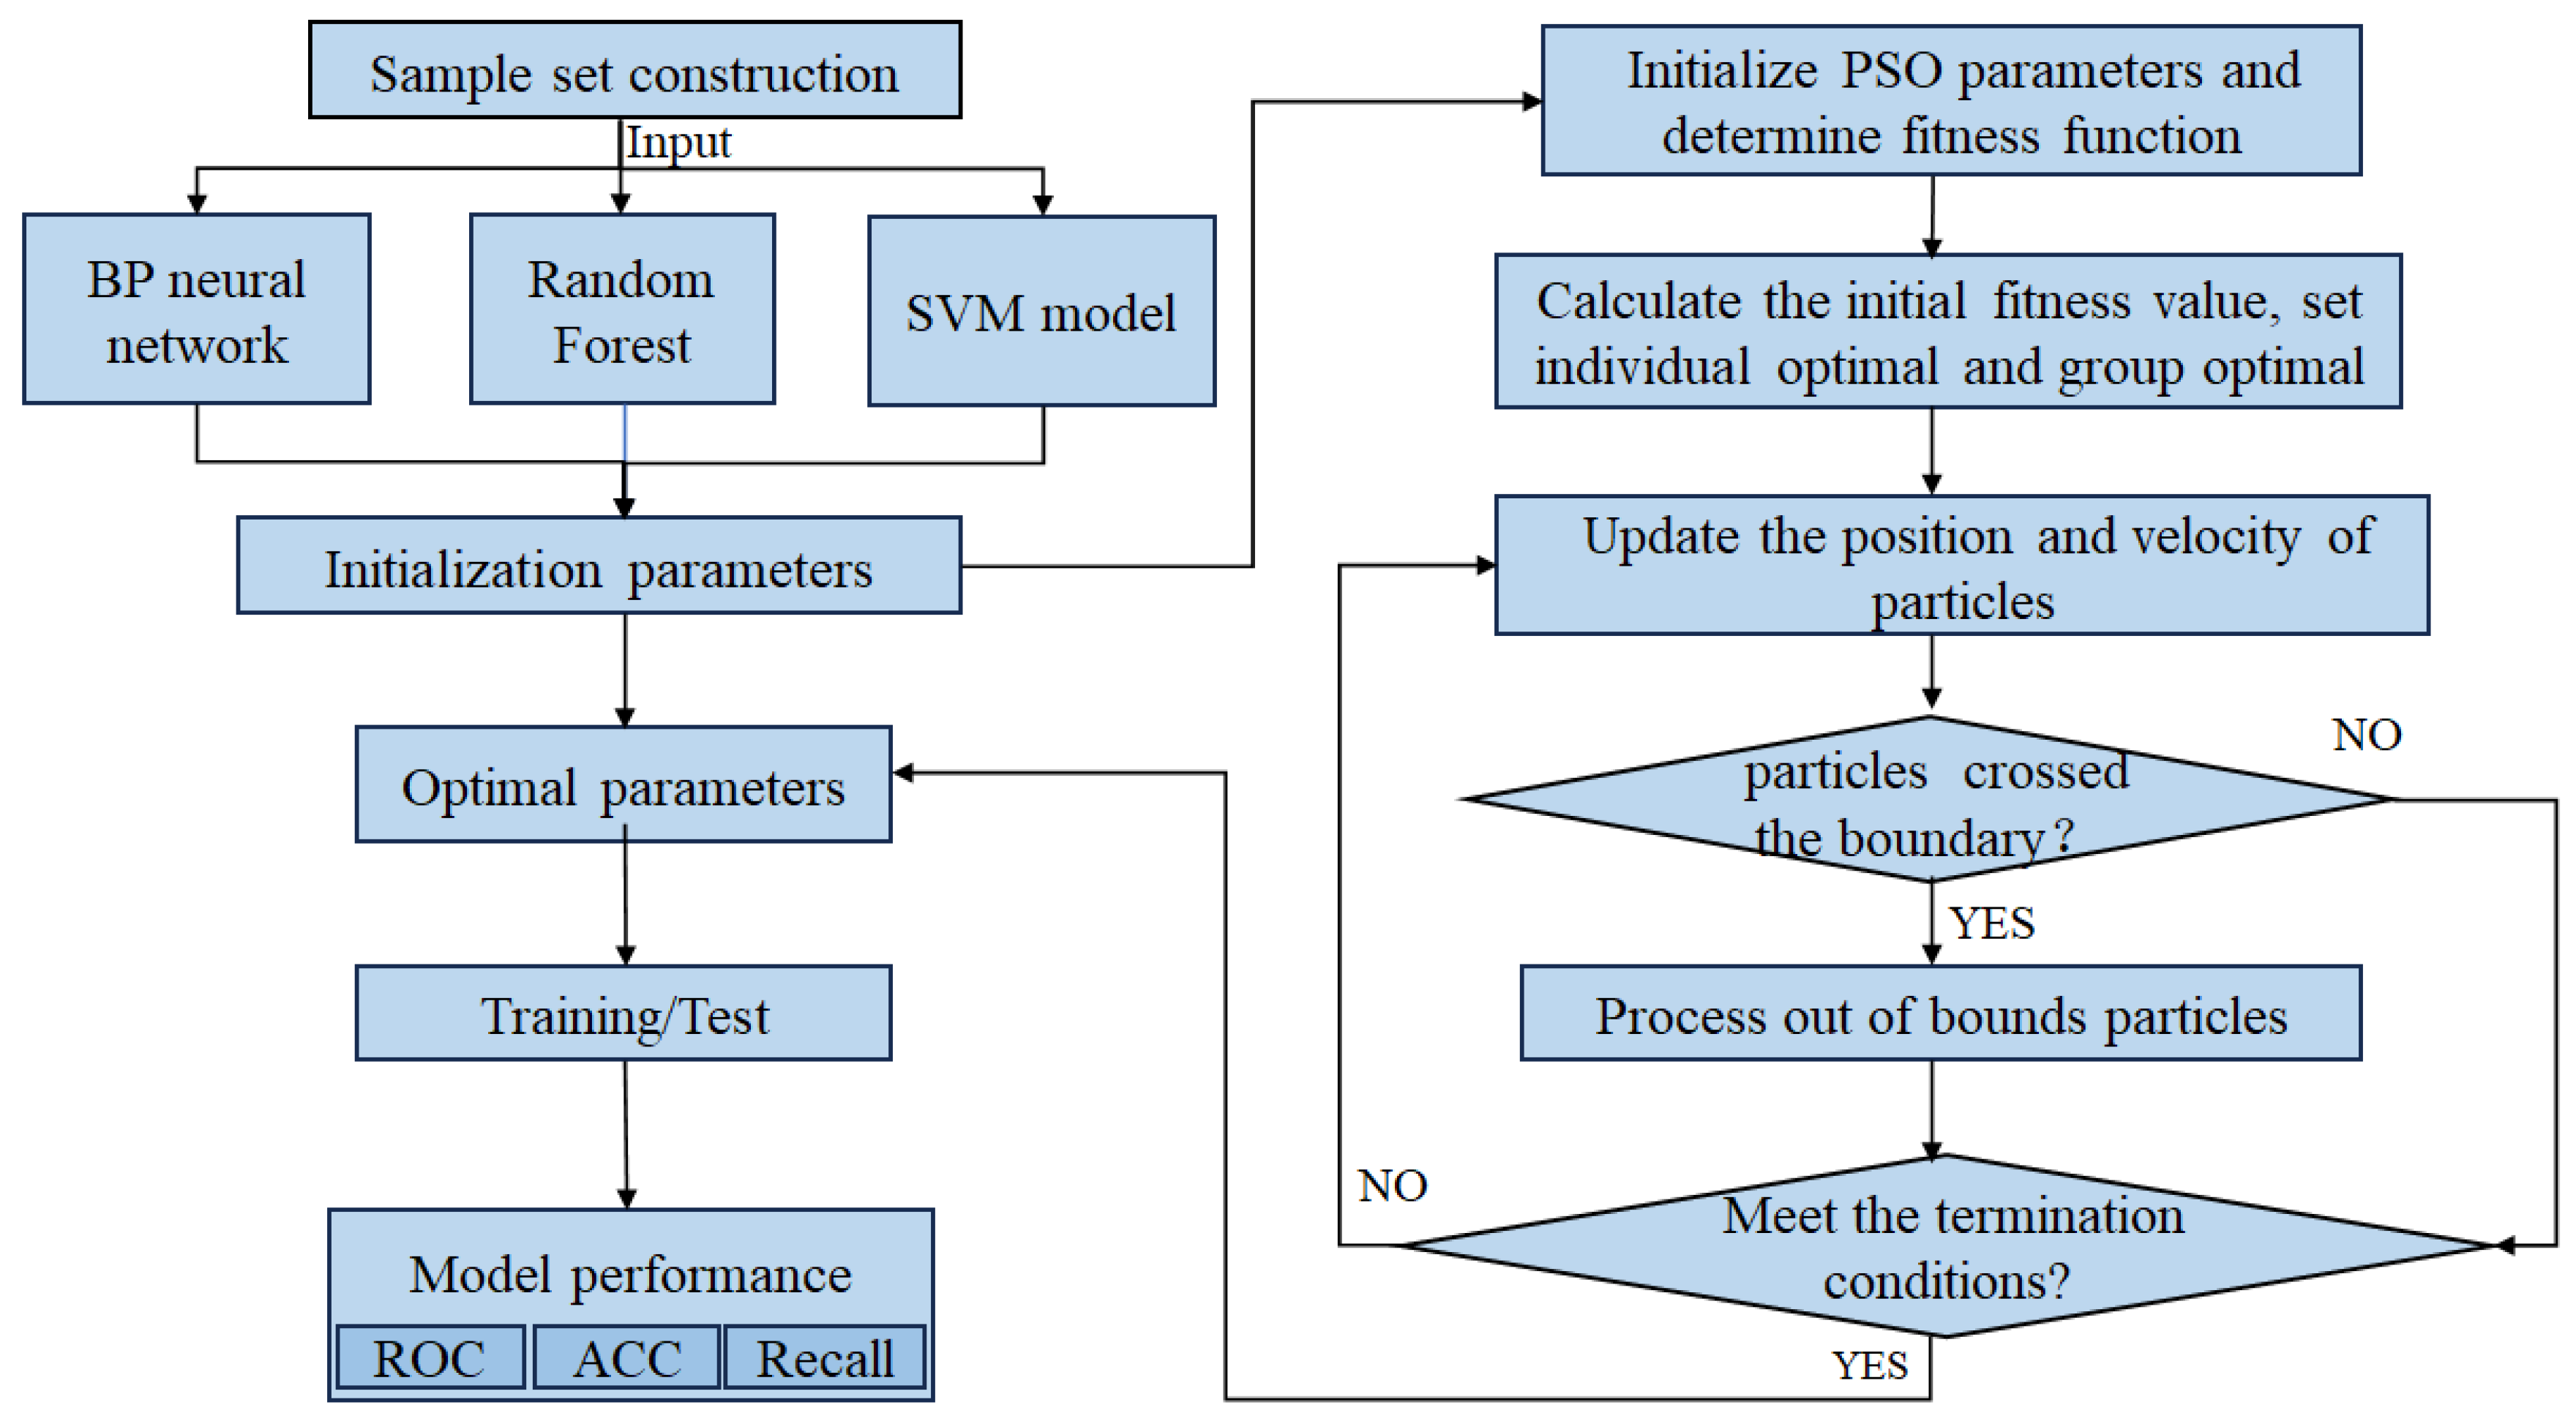
35]. The algorithm constructs a particle swarm motion model in the multi-dimensional solution space, where each particle dynamically adjusts its flight velocity and direction according to its individual historical optimal position and the global optimal position of the swarm. This dual-memory mechanism integrates the processes of cognitive learning and social learning. This algorithm is simple and easy to implement, does not require gradient information, and has the advantage of excellent global convergence performance. In this paper, PSO was introduced to optimize the hyperparameters of BP, RF and SVM simultaneously, so as to improve the prediction performance of landslide susceptibility models. The Particle Swarm Optimization (PSO) model was configured with 200 iterations (max-gen) and a population size of 50 (population-size) as its core parameters after repeated debugging for the local dataset. The optimization process for geohazard model parameter tuning is illustrated in
Figure 7.
The PSO hyperparameters (population size of 50 and maximum iterations of 200) were determined through multiple groups of pre-comparative trials with different parameter combinations and random seed repetitions. This set of parameters guarantees a stable convergence of the optimization process and minor fluctuations in model performance across different random seeds while avoiding excessive computational overhead. Detailed sensitivity test records are omitted to maintain concise manuscript length, as the core of this study is the comparison of the landslide prediction capabilities among the PSO-BP, PSO-RF and PSO-SVM models.
4.3. Model Validation
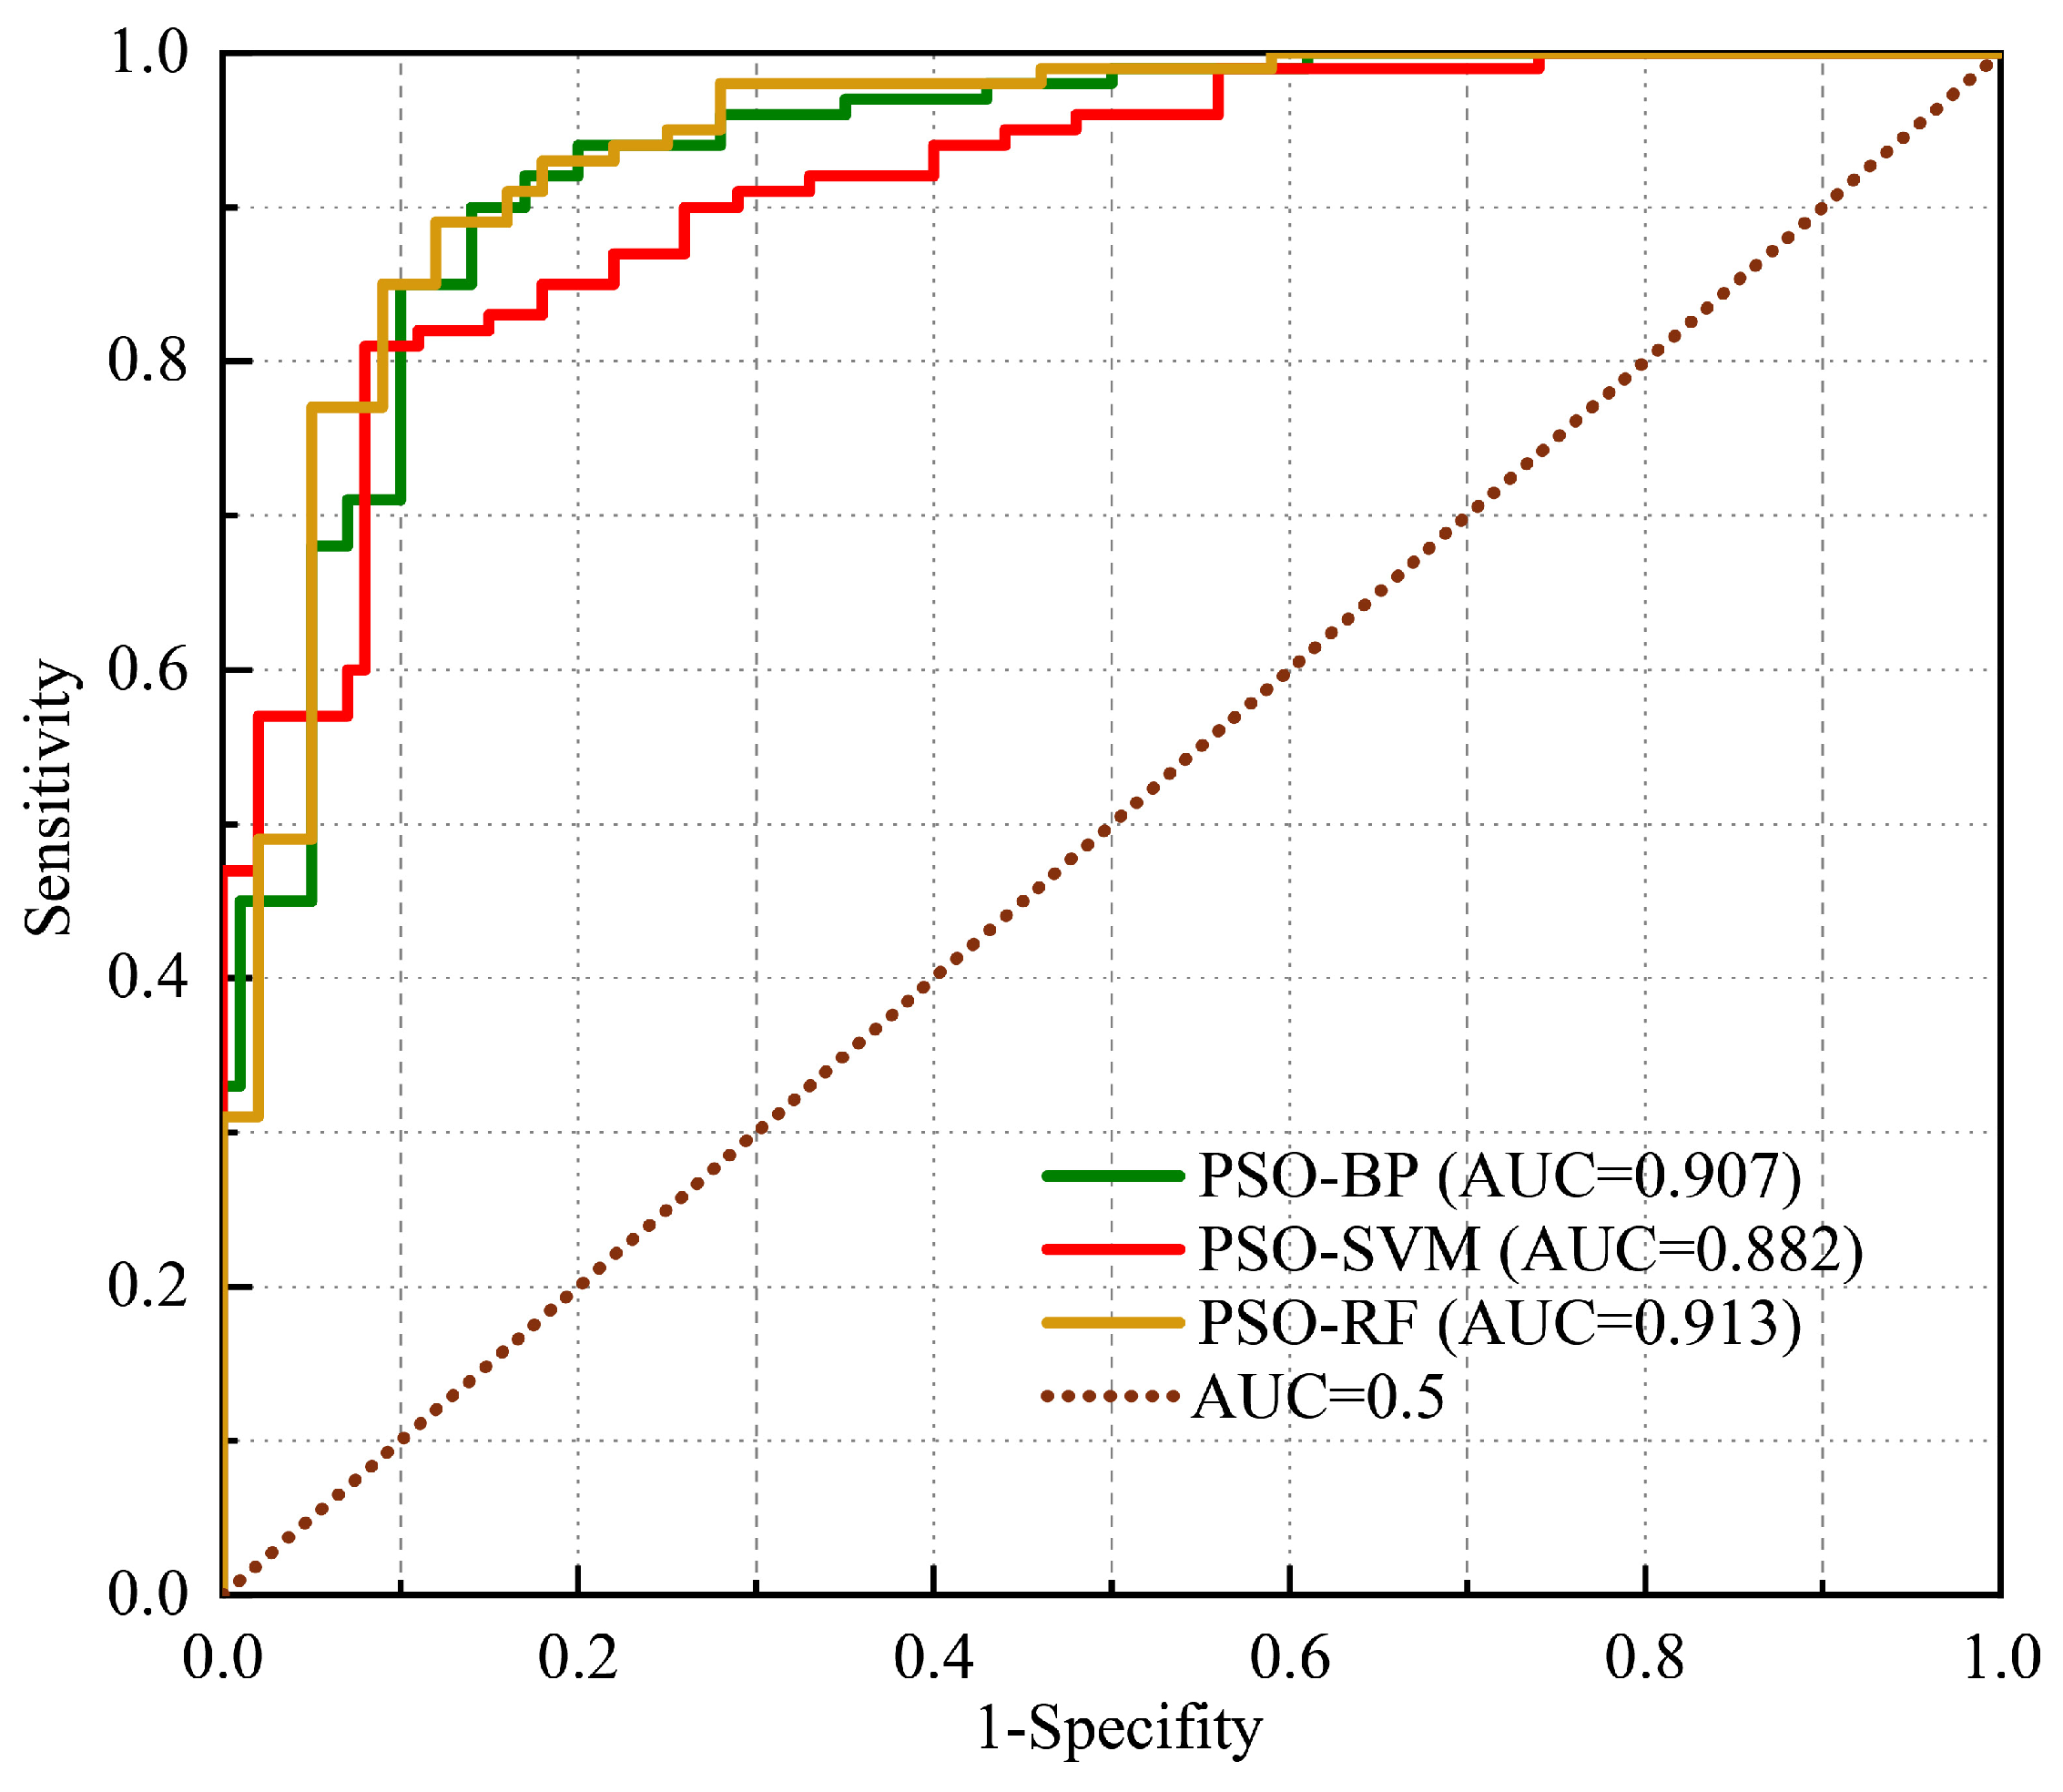
Based on the preliminary susceptibility survey results of Xiangtan County, a sample set was constructed by randomly selecting 200 residential slope units with geological disasters or moderate-to-high susceptibility as positive samples and 200 residential slope units with low susceptibility as negative samples at a positive-to-negative sample ratio of 1:1. This sample set was then used for the training and testing of the evaluation models. Accuracy, recall, precision, and F1-score were selected as the metrics to evaluate model performance. The results show that the three selected geological hazard evaluation models yield relatively accurate predictions in the geological hazard susceptibility assessment for the study area, meeting the basic requirements of geological hazard susceptibility assessment. Among these models, the PSO-RF model exhibits the best comprehensive performance with an accuracy of 0.94, recall of 0.80, precision of 0.79, and F1-score of 0.79, as detailed in
Table 5. Meanwhile, the area under the ROC curve (AUC) reaches 0.913 (see
Figure 8), indicating that this model has high prediction accuracy and good generalization ability, allowing it to be adapted to a variety of geological environments.
5. Results
5.1. Evaluation Results
To quantitatively divide continuous prediction probabilities into three susceptibility grades, the Jenks natural breakpoint algorithm was first adopted to calculate statistically optimal initial segmentation thresholds of 0.32 and 0.68. These breakpoints were further fine-tuned to finalized values of 0.30 and 0.70 by cross-referencing field survey landslide inventory data, which records the spatial distribution of actual sliding scars, sporadic unstable slopes and stable intact terrain. The unified classification criteria are defined as follows: residential slope units with a predicted probability of <0.30 belong to the low-susceptibility class; units with probabilities between 0.30 and 0.70 are classified as moderate susceptibility; and units with probabilities >0.70 are classified as high susceptibility.
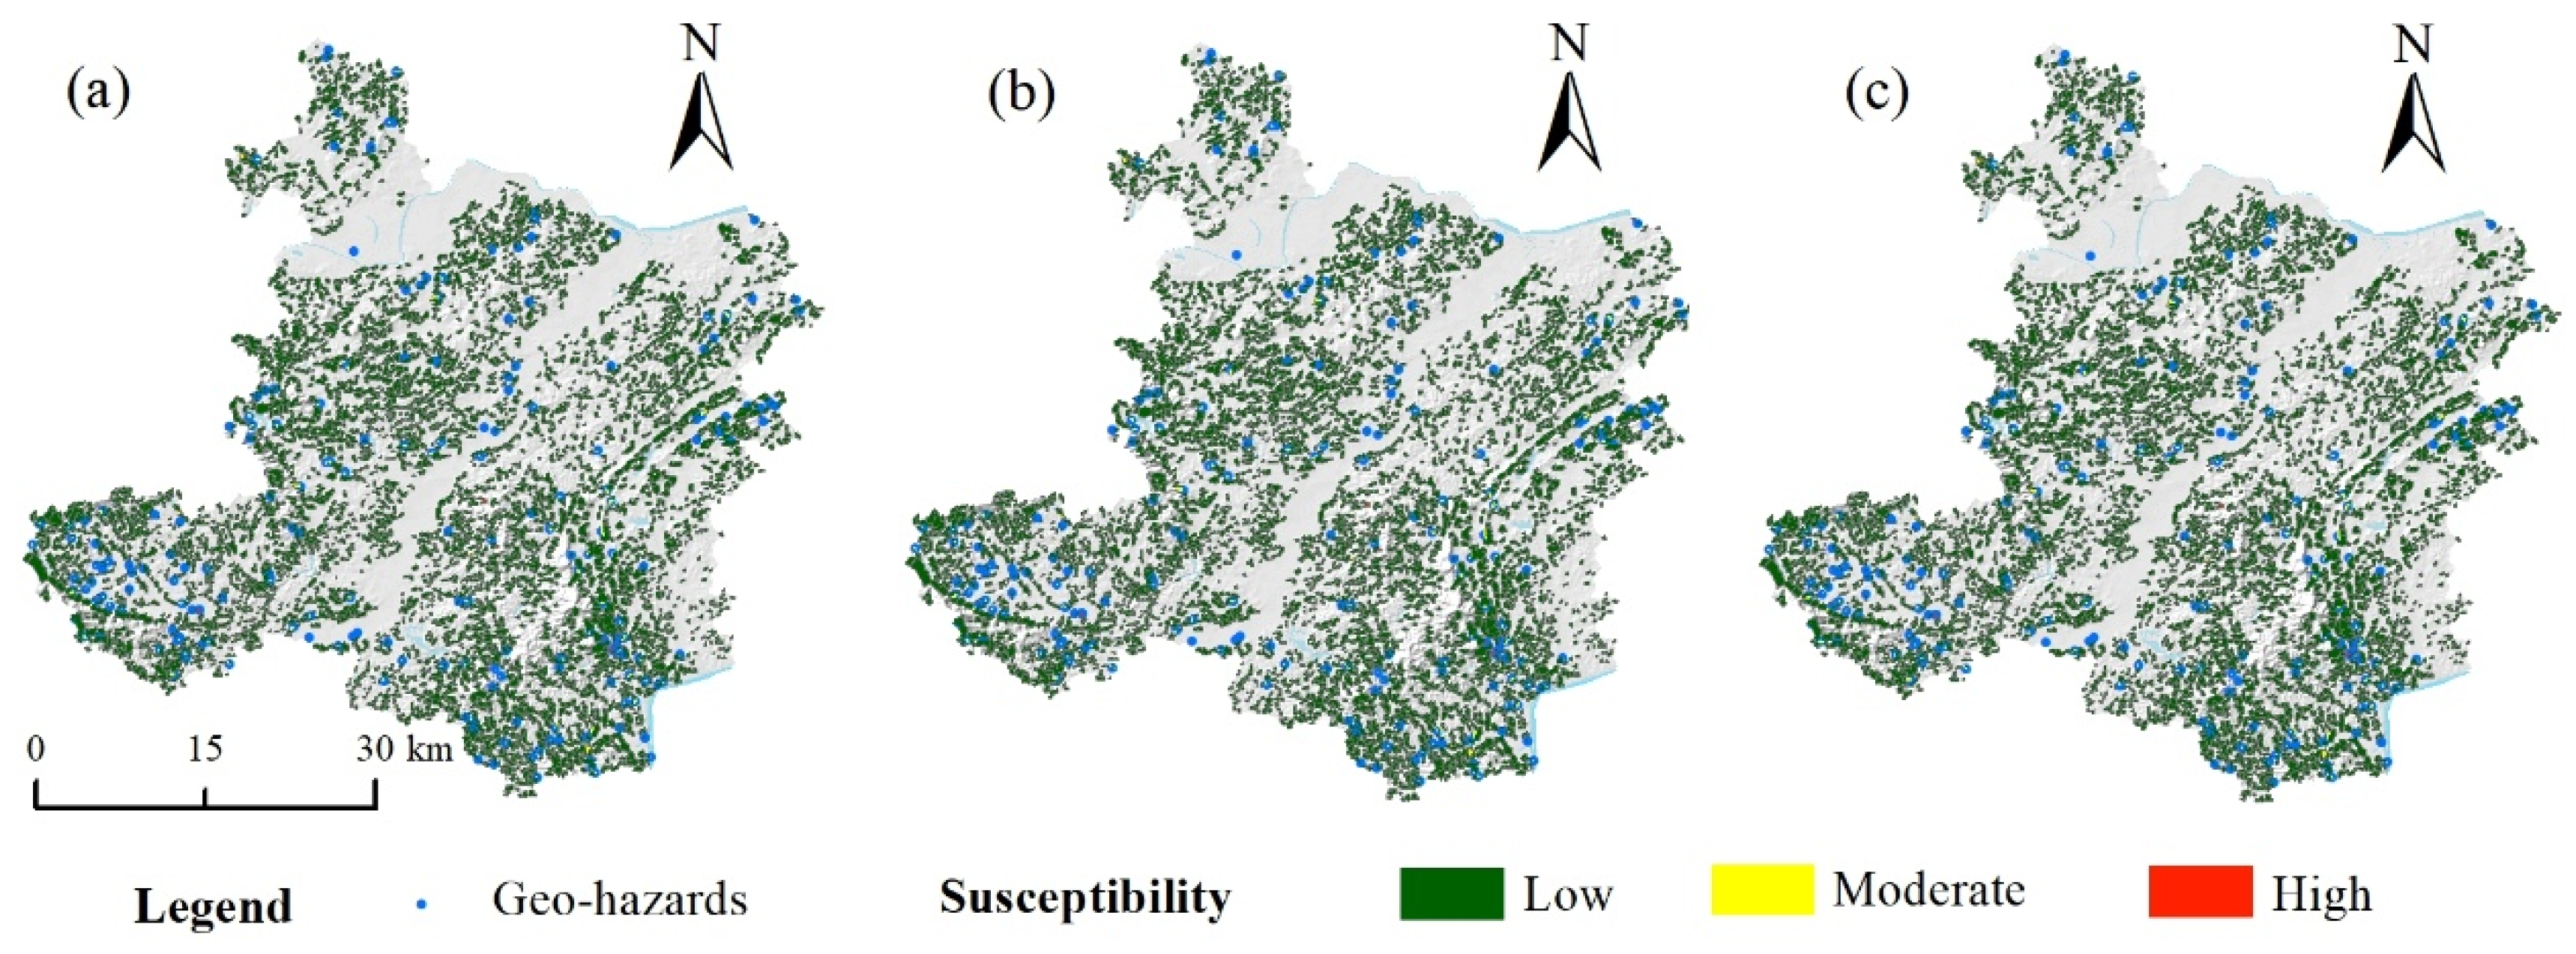
Combined with the field survey results of the study area, the prediction results were classified into three categories: high-susceptibility, medium-susceptibility, and low-susceptibility residential slope units in accordance with the above threshold rules. Correspondingly, the geological hazard susceptibility zoning map was generated using ArcGIS software, as shown in
Figure 9. The results indicate that for the PSO-BP model, the numbers of moderate- and high-susceptibility residential slope units are 1254 and 26, accounting for 17.28% and 0.36% of the total, respectively; for the PSO-RF model, the numbers of moderate- and high-susceptibility residential slope units are 939 and 50, with respective proportions of 12.94% and 0.69%; and for the PSO-SVM model, the numbers of moderate- and high-susceptibility residential slope units are 923 and 32, making up 12.72% and 0.44% of the total respectively. Details are shown in
Table 6. The medium- and high-susceptibility residential slope units are mainly distributed in the southwestern, southeastern, and partially northern regions of the study area. These regions are characterized by large slope height differences, steep terrain, advanced economic development, and intense human engineering activities. They are particularly heavily affected by slope cutting conducted by local residents, which forms high and steep slopes and thus leads to frequent occurrences of geological disasters such as landslides. Therefore, it is necessary to implement corresponding supporting measures based on the probability of geological hazard occurrences. Overall, the three selected susceptibility evaluation models can accurately identify the high-, moderate-, and low-susceptibility residential slope units, meeting the requirements of geological hazard susceptibility investigation and assessment.
5.2. Kappa Coefficient Test
The Kappa coefficient is a statistical metric used to measure the level of agreement between model classifiers or among different evaluators. Generally speaking, a Kappa value greater than 0.6 indicates that the classification results have a high degree of consistency. As can be seen from
Table 5, the Kappa coefficients of the three evaluation models (PSO-BP, PSO-RF, and PSO-SVM) are 0.49, 0.64, and 0.58, respectively. This indicates that the PSO-BP and PSO-SVM models exhibit good performance, and their evaluation and classification results achieve a relatively consistent level. However, the PSO-RF model demonstrates higher accuracy in identifying the susceptibility of residential slope units, with its Kappa coefficient reaching as high as 0.64, which reflects a high degree of agreement between the model classification results and the actual conditions. This indicates that the susceptibility zoning of the study area based on this evaluation method has higher credibility. The calculation formula is as follows:
where
Po is the observed agreement proportion, referring to the accuracy of actual classification, i.e., the ratio of the sum of correctly classified samples across all categories to the total number of samples, and
Pe is the expected agreement proportion, also known as the accuracy of expected classification, i.e., the expected correct rate of random classification based on sample distribution.
5.3. Rationality Test of Geological Hazard Point Distribution
Since the ground subsidence geological disasters in the study area are mainly induced by mining activities, only landslides and collapses were considered in the rationality test of geological hazard point distribution. In addition, slope units with fewer than three households were not included in the delineation of residential slope units in this study. Consequently, 18 geological hazard points are located outside the scope of residential slope units. Therefore, the total number of landslide and collapse hazard points within the residential slope units amounts to 148.
The number of geological hazard points within residential slope units of each susceptibility grade evaluated by each model was extracted based on the Extract Multi Values to Points tool in ArcGIS software. The percentage relative to the total number of hazard points and the number of residential slope units in each susceptibility grade were calculated, as shown in
Table 7. All three evaluation models exhibited good performance in the rationality test of geological hazard point distribution. Among them, 60.81% of the geological hazard points predicted by the PSO-BP model fell within the moderate- and high-susceptibility residential slope units, which showed the highest degree of agreement with the results of field surveys. An analysis of the landslide and collapse points falling within the low-susceptibility residential slope units reveals that these geological hazard points are mainly induced by irregular slope cutting during house construction (the cut slopes are nearly vertical with no effective supporting measures), manifesting as small-scale local collapse and slide deformation. Furthermore, the residential slope units where these hazards are located are inherently characterized by low-gradient, gentle slopes with thick soil layers (soil thickness of approximately 3 m, slope height less than 5 m, and natural slope gradient less than 15°). Collapse and slide deformation, as well as the occurrence of such disasters, could be completely avoided if slope cutting during house construction were standardized or supporting measures were implemented after slope cutting. Therefore, such residential slope units are mostly classified as low-susceptibility areas in both field survey evaluations and machine learning model evaluations, and the model-based evaluations demonstrate higher effectiveness in assessing these types of residential slope units.
5.4. Validation of the Importance of Geological Hazard Impact Factors
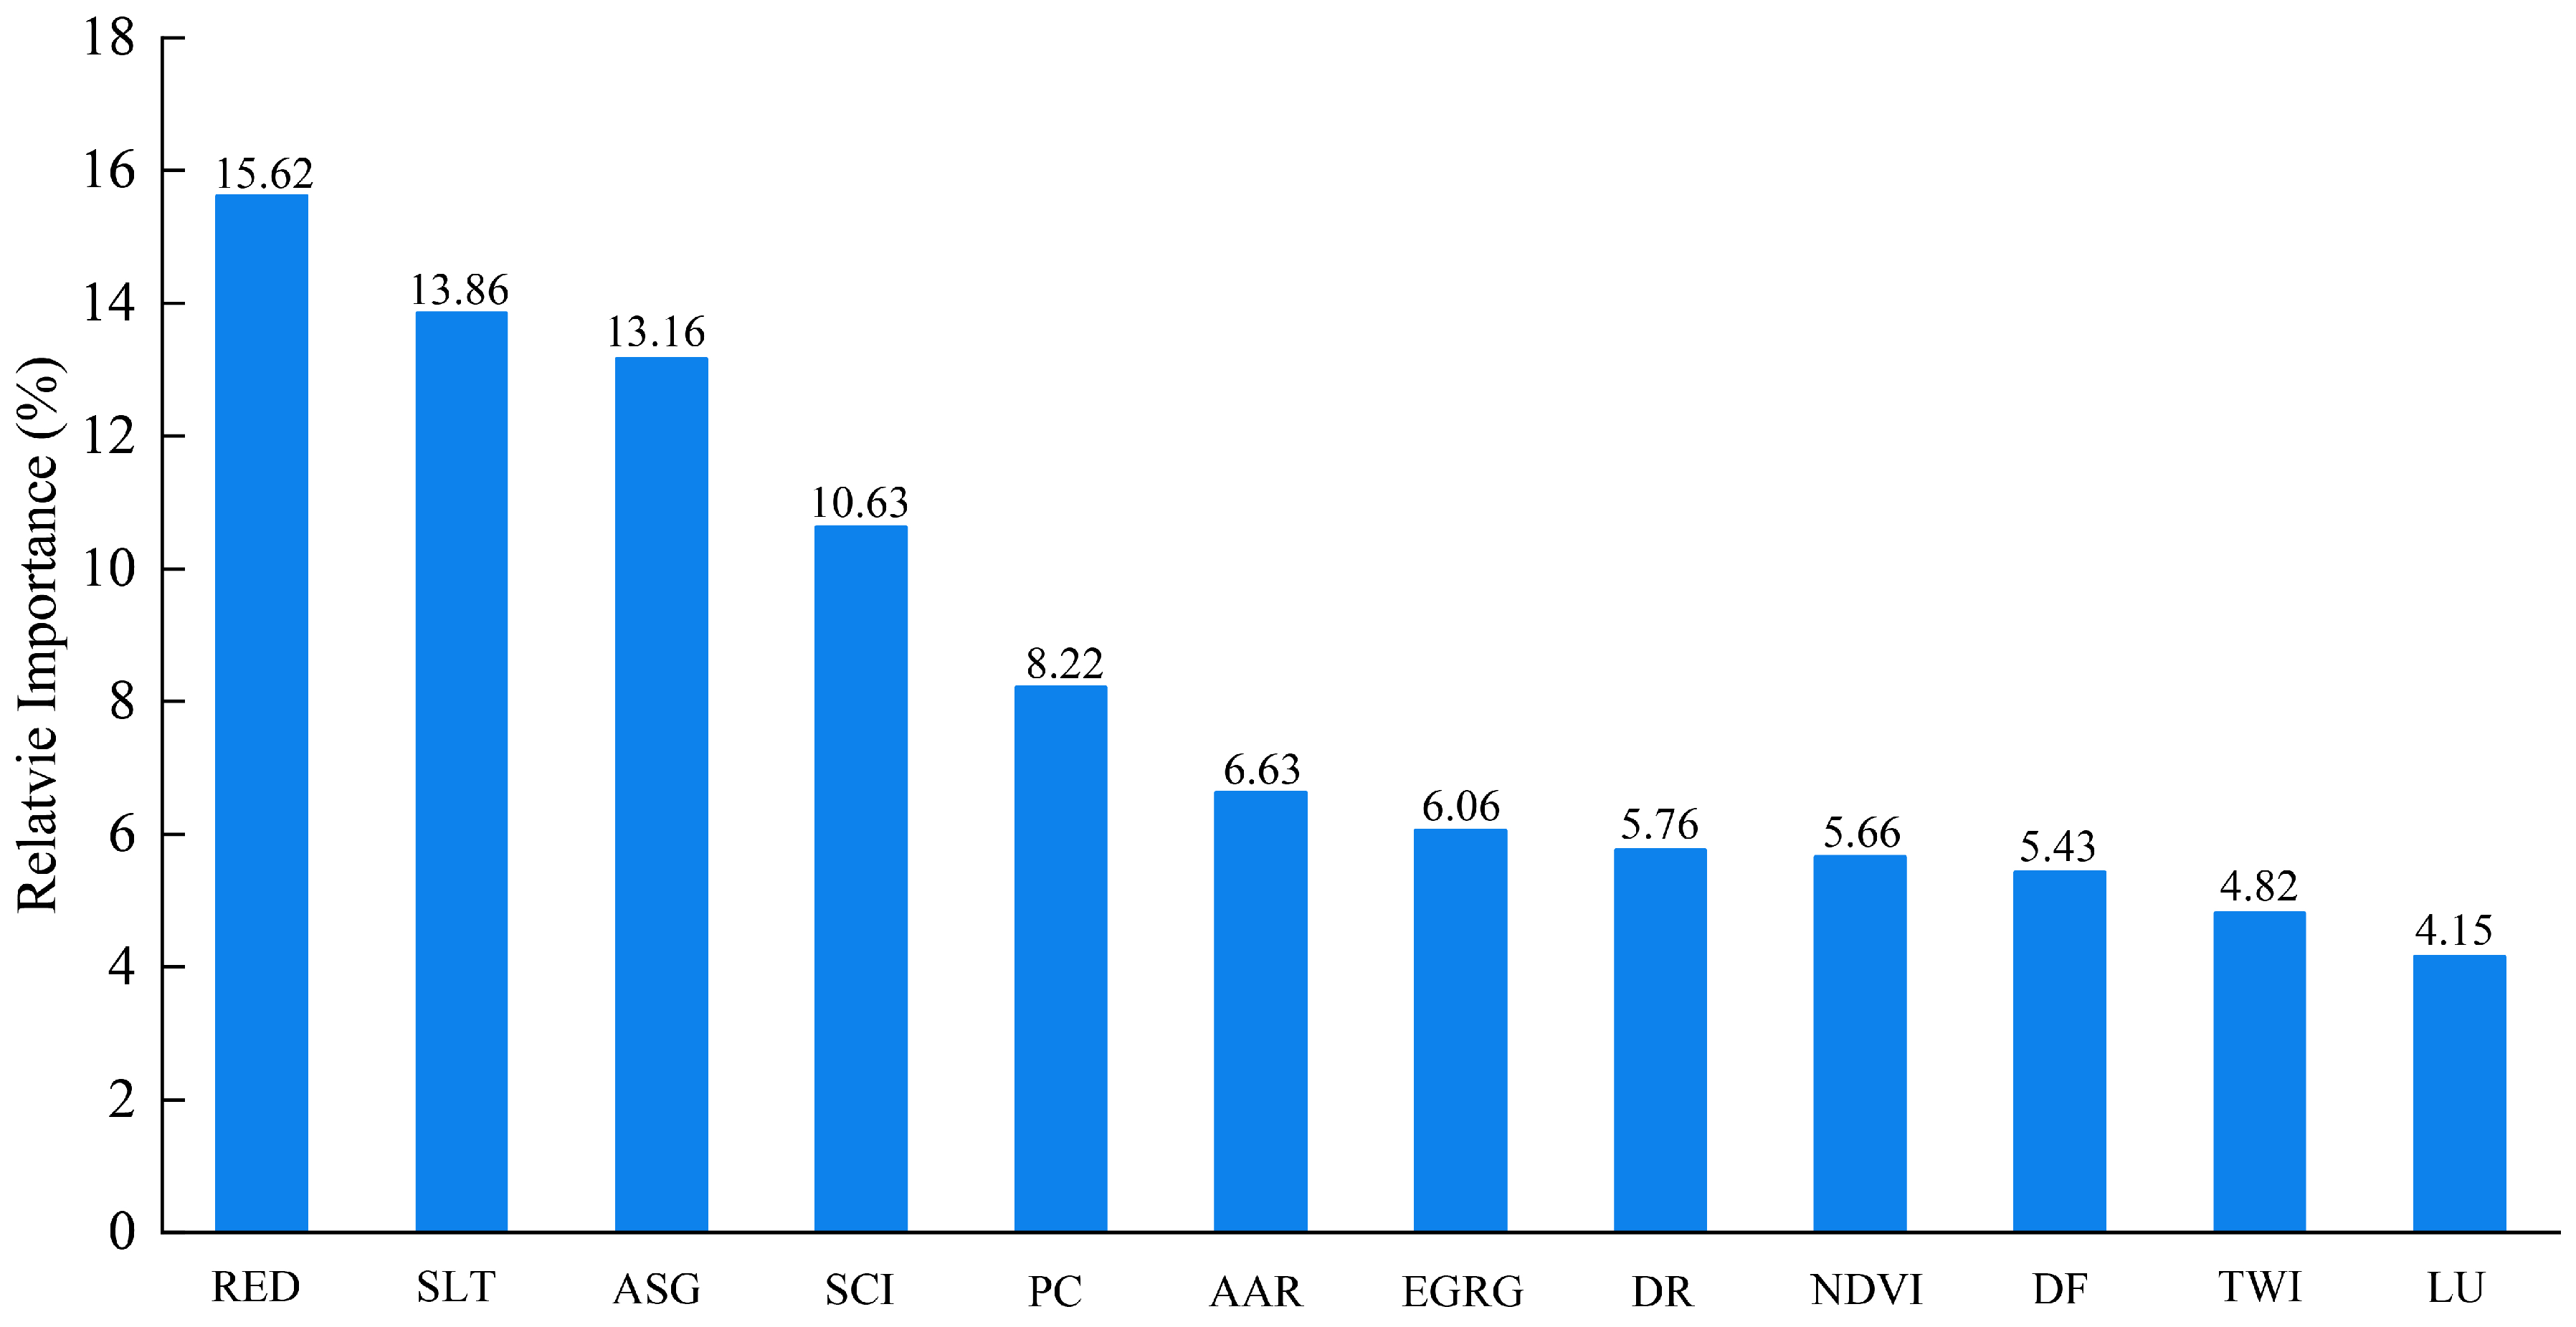
Based on the well-performing PSO-RF model, the importance levels of the geological hazard susceptibility factors were extracted from evaluation results for validation (see
Figure 10). The results indicate that the factor with the greatest impact on geological hazard susceptibility classification is the relative elevation difference (15.62%), followed by soil thickness (13.86%), average slope gradient (13.16%), slope cutting intensity (10.63%), and profile curvature (8.22%). The cumulative importance of these five evaluation factors accounts for 61.49% of the total importance of all evaluation factors, reflecting that these features exert a relatively high degree of influence on the development of geological hazards and are basically consistent with the results of preliminary field surveys and the characteristics of geological hazard development in the study area.
6. Discussions
It is necessary to distinguish two independent datasets derived from the preliminary field survey to exclude circular dependency risks. The manually delineated moderate-to-high susceptibility zoning only functions as a spatial constraint for sampling. This qualitative zoning result is not adopted to judge whether a slope unit is a positive landslide sample, nor does it participate in model training and subsequent performance verification. All positive samples are labeled based on objectively verified landslide scars and sliding traces recorded during field surveys, which act as the ground truth dataset. In addition, the benchmark for evaluating model performance, including AUC, accuracy and F1-score is the real landslide inventory, rather than the preliminary susceptibility zoning grades. Sampling is limited to moderate-to-high preliminary zones simply to avoid collecting a large number of stable low-risk slope units without landslide records and to reduce redundant calculations. The labeling of positive samples and model verification are both based on independent field landslide records, so the independence of the landslide susceptibility evaluation is not compromised.
Furthermore, spatial cross-validation was not performed in this study, and model performance was assessed based on a single stratified train–test split. Considering the limited number of landslide positive samples in the study area, dividing samples into multiple spatial folds would result in too few training units per subset and unstable model fitting. To mitigate the bias brought by the spatial autocorrelation of adjacent slope units, stratified random sampling covering all geomorphic and lithologic zones was adopted to ensure the spatial dispersion of samples. The training and test datasets were randomly partitioned at a ratio of 7:3 with no geographically adjacent slope units shared between the two subsets, which reduces information leakage caused by spatial correlation. Multiple quantitative indicators, including accuracy, precision, recall, F1 score and AUC were integrated to comprehensively evaluate model predictive ability, avoiding one-sided judgment from a single metric. We recognize that spatial cross-validation can further improve the reliability of evaluation results, which will be prioritized in future research with expanded landslide inventory data.
It is also necessary to recognize the limitations of Kappa coefficient evaluation in this study. The benchmark for calculating Kappa is the preliminary susceptibility zoning derived from field surveys, which is subject to inconsistent survey standards and the subjective empirical judgment of investigators. This introduces inherent uncertainty, so the obtained Kappa values cannot be regarded as fully reliable quantitative evidence of model performance. Due to data constraints, there is no other independent full-coverage objective geohazard dataset available to replace the preliminary zoning map as the Kappa benchmark. Therefore, we only take Kappa as an auxiliary reference index to reflect the consistency between model zoning and field qualitative judgment. The comprehensive evaluation of model predictive capacity is mainly based on objective landslide inventory data, including AUC, accuracy, precision, recall and F1-score, which are free from artificial subjective bias. Subsequent research can adopt standardized unified field survey data or high-precision remote sensing interpretation landslide datasets to obtain more stable and credible Kappa results. It can be observed that the PSO-SVM model has a recall of only 0.60 and a precision of 0.78, showing an obvious systematic underprediction of hazard-prone slope units and a large number of false negative samples. In actual geological hazard risk prevention, false negatives mean that real unstable slopes are misclassified as low-susceptibility areas, which creates serious safety hazards for local residents.
There is an inevitable trade-off between recall and precision in classification models. The PSO-RF model achieves a balanced state, with recall reaching 0.80 and precision reaching 0.79, which can simultaneously control the risk of missing hidden danger points and excessive false alarms. In contrast, PSO-SVM pursues a relatively high precision at the cost of recall, resulting in a widespread omission of dangerous zones, which cannot satisfy the practical needs of regional geological hazard investigation. For disaster prevention work, guaranteeing a high recall rate to avoid missing unstable slopes is a vital evaluation criterion, which further verifies the comprehensive superiority of the PSO-RF model.
7. Conclusions
(1) Taking geological disasters in Xiangtan County as the research subject, 7257 residential slope units were delineated as the basic evaluation units for this study. A total of 12 susceptibility evaluation factors were selected, including relative elevation difference, average slope gradient, NDVI, topographic relief, soil thickness, engineering geological rock group of rock and soil mass, distance to faults, intensity of human engineering activities, land use type, distance to roads, annual average rainfall, and TWI, to construct a geological hazard susceptibility evaluation factor system for the study area.
(2) The three models were subjected to training and testing, and their performance was comparatively analyzed using accuracy, recall, precision, F1 score, and ROC curve accuracy as evaluation metrics. The results show that the selected evaluation models exhibit high levels of performance and stability, among which the PSO-RF model demonstrates the most outstanding comprehensive performance (accuracy = 0.94, F1 = 0.79, AUC = 0.913).
(3) The three trained models were applied to conduct geological hazard susceptibility evaluation for the study area. Among them, the Random Forest model optimized by the Particle Swarm Optimization (PSO) algorithm achieved a relatively high level of consistency in the consistency test (Kappa = 0.64). According to the susceptibility evaluation results of this model, the numbers of moderate- and high-susceptibility residential slope units are 939 and 50, accounting for 12.94% and 0.69%, respectively, and they are mainly distributed in the southwestern, southeastern, and partially northern parts of the study area.
(4) The integration of PSO hyperparameter optimization with three classic machine learning models (BP, RF, SVM), proposed in this work for regional geohazard susceptibility evaluation, provides an effective reference for small-sample landslide susceptibility assessment in mountainous areas with complex lithology and under the influence of human activities.
Author Contributions
Conceptualization, T.Q., L.L. and Y.L. (Yulong Lu); methodology, T.Q., L.L., Y.L. (Yulong Lu), Y.Z., Y.L. (Yang Liu) and D.W.; software, L.L., Y.Z. and D.W.; investigation, T.Q., Y.L. (Yulong Lu), Y.L. (Yang Liu) and D.W.; data curation, T.Q., L.L. and Y.Z.; writing—original draft preparation, T.Q., L.L., Y.Z., Y.L. (Yulong Lu) and D.W.; writing—review and editing, Y.L. (Yulong Lu), Y.Z., Y.L. (Yang Liu) and D.W.; visualization, L.L., Y.L. (Yulong Lu) and D.W.; supervision, L.L., Y.L. (Yulong Lu) and Y.L. (Yang Liu); project administration, L.L., Y.L. (Yulong Lu) and Y.L. (Yang Liu). All authors have read and agreed to the published version of the manuscript.
Funding
This research was funded by the Key Program of the National Natural Science Foundation of China (Grant No. 42530710) and project Xiangdiao [2022] 62 from the Department of Natural Resources of Hunan Province.
Institutional Review Board Statement
Not applicable.
Informed Consent Statement
Not applicable.
Data Availability Statement
The original contributions presented in this study are included in the article. Further inquiries can be directed to the corresponding author.
Conflicts of Interest
The authors declare no conflict of interest.
References
- Fidan, S.; Tanyaş, H.; Akbaş, A.; Lombardo, L.; Petley, D.N.; Görüm, T. Understanding fatal landslides at global scales: A summary of topographic, climatic, and anthropogenic perspectives. Nat. Hazards 2024, 122, 1123–1150. [Google Scholar]
- Lima, P.; Steger, S.; Glade, T.; Murillo-García, F.G. Literature Review and Bibliometric Analysis on Data-Driven Assessment of Landslide Susceptibility. J. Mt. Sci. 2022, 19, 1670–1698. [Google Scholar] [CrossRef]
- Luo, L.; Pei, X.; Cui, S.; Huang, R.; Zhu, L.; He, Z. Combined Selection of Susceptibility Assessment Factors for Jiuzhaigou Earthquake-Induced Landslides. Chin. J. Rock Mech. Eng. 2021, 40, 2306–2319. Available online: https://rockmech.whrsm.ac.cn/EN/10.13722/j.cnki.jrme.2021.0198 (accessed on 15 March 2026).
- Wang, S.H.; Wang, R.S.; Sun, X.Y.; Liu, X.M.; Lu, W.P.; Lin, Z.A. Landslide Susceptibility Evaluation Based on CF-CNN-LSTM Model. J. Nat. Disasters 2024, 33, 84–95. [Google Scholar]
- Reichenbach, P.; Rossi, M.; Malamud, B.D.; Mihir, M.; Guzzetti, F. A Review of Statistically-Based Landslide Susceptibility Models. Earth Sci. Rev. 2018, 180, 60–91. [Google Scholar] [CrossRef]
- Chen, Z.; Li, D.; Chen, C.; Huang, W.; Tang, X. Dynamic Evaluation of Landslide Susceptibility Based on Machine Learning and InSAR Technology. J. Nat. Disasters 2025, 34, 56–65. [Google Scholar] [CrossRef]
- Sun, F.; Zhu, H.; Wu, X.; Han, D.; Cui, C.; Yang, M. Landslide Susceptibility Assessment in Hanyuan County Under Different Future Climate Scenarios. J. Nat. Disasters 2025, 34, 66–78. [Google Scholar] [CrossRef]
- Chang, Z.; Huang, F.; Jiang, S.; Zhang, Y.; Zhou, C.; Huang, J. Slope Unit Extraction and Landslide Susceptibility Prediction Using Multi-scale Segmentation Method. Adv. Eng. Sci. 2023, 55, 184–195. [Google Scholar] [CrossRef]
- Zhao, P.; Zhao, S.; Sun, Y.; Nguyen, X.; Wang, N.; Zhang, S. Landslide Susceptibility Assessment in Southern Anhui Province Based on Slope Units and Semantic Segmentation. Chin. J. Geol. 2024, 59, 562–574. [Google Scholar] [CrossRef]
- Li, Y.; Xu, L.; Shang, Y.; Chen, S. Debris Flow Susceptibility Evaluation in Meizoseismal Region: A Case Study in Jiuzhaigou, China. J. Earth Sci. 2024, 35, 263–279. [Google Scholar] [CrossRef]
- Dhakate, R. Distribution of Aquifer Characteristics in Different Geomorphologic Units in a Granitic Terrain. Appl. Water Sci. 2020, 10, 231. [Google Scholar] [CrossRef]
- Seybold, L.; Trepmann, C.A.; Janots, E. A Ductile Extensional Shear Zone at the Contact Area Between HP-LT Metamorphic Units in the Talea Ori, Central Crete, Greece: Deformation During Early Stages of Exhumation from Peak Metamorphic Conditions. Int. J. Earth Sci. 2019, 108, 213–227. [Google Scholar] [CrossRef]
- Jiang, W.; Li, Y.; Yang, X.; Wang, X.; Zhang, Y.; Liu, H. Study on Landslide Susceptibility in Nujiang Prefecture Based on Slope Unit. J. Soil Water Conserv. 2023, 37, 160–167. [Google Scholar] [CrossRef] [PubMed]
- Li, H.; Jiang, S. Geological Hazard Susceptibility Evaluation Based on Slope Unit: Take the Key Investigation Area of Fuchuan Yao Autonomous County, Hezhou City as an Example. Resour. Inf. Eng. 2023, 38, 56–59. [Google Scholar] [CrossRef]
- Zhang, Z.; Qian, Z.; Wei, Y.; Li, J.; Wang, H.; Chen, X. Landslide Susceptibility Evaluation Considering Optimal Combination of Influencing Factors: A Case Study of Shuicheng District. Sci. Technol. Eng. 2023, 23, 4091–4099. [Google Scholar] [CrossRef]
- Chang, L.; Jiao, D.; Si, D. Evaluation Model Construction of Geological Hazard Susceptibility in Island Areas: Taking Qushan Town, Daishan County as the Example. J. Inst. Disaster Prev. 2021, 23, 59–67. [Google Scholar]
- Wu, J.; Chen, H.; Xiang, Z. Optimization of the Method of Dividing Slope Units and Evaluation Index of Suitability. J. Nat. Disasters 2025, 34, 127–136. [Google Scholar] [CrossRef]
- Shrestha, A.; Aryal, K. A comprehensive review on landslide susceptibility zonation techniques. Quaest. Geogr. 2024, 43, 5–32. [Google Scholar] [CrossRef]
- Qiu, Y.; Chen, J.; Fang, Q.; Li, S.; Chen, J.; Wang, D.; Xu, Z. Geological Hazard Risk Assessment of Different Rainfall Recurrence Periods in Mountainous Counties of Southern Hunan. Saf. Environ. Eng. 2025, 32, 243–254. [Google Scholar] [CrossRef]
- Merghadi, A.; Yunus, A.P.; Dou, J.; Whiteley, J.; Pham, B.T.; Bui, D.T.; Avtar, R.; Abderrahmane, B. Machine Learning Methods for Landslide Susceptibility Studies: A Comparative Overview of Algorithm Performance. Earth Sci. Rev. 2020, 207, 103225. [Google Scholar] [CrossRef]
- Liu, S.; He, B.; Wang, T.; Liu, J.; Cao, J.; Wang, H.; Zhang, S.; Li, K.; Li, R.; Zhang, Y.; et al. Development Characteristics and Susceptibility Assessment of Coseismic Geological Hazards of Jishishan MS 6.2 Earthquake, Gansu Province, China. J. Geomech. 2024, 30, 314–331. [Google Scholar] [CrossRef]
- Peng, S.; Liu, P.; Chen, G.; Wang, L.; Zhang, W.; Luo, W.; Jing, X. Regional Landslide Hazard Assessment Using the IV-RF Coupling Model and Critical Monthly Average Rainfall Threshold: A Case Study from Fuling District, Chongqing. Chin. J. Geol. Hazard Control 2025, 36, 131–145. [Google Scholar] [CrossRef]
- Wang, Z.; Zhao, L. Prediction of Loess Landslides Deformation Using Elman Neural Network Model Based on Genetic Algorithm and Particle Swarm Optimization. J. Geod. Geodyn. 2023, 43, 679–684. [Google Scholar] [CrossRef]
- Duan, Z.; Zhang, L.; Chen, J. Characteristics and Influencing Factors of Geological Disasters Caused by Building Houses on Slopes in Rural Hilly Areas of Hunan Province. Heilongjiang Sci. 2024, 15, 152–154. [Google Scholar]
- Qu, T.; Zhang, L.; Pan, Z. Analysis of Genetic Mechanisms and Stability Evaluation of Typical Red Clay Landslides in Xiangtan Area. Eng. Technol. Res. 2020, 5, 251–252. [Google Scholar] [CrossRef]
- Lin, P.; He, S.; Abudikeyimu, X. Landslide Susceptibility Assessment Along Highways Based on LR-FAHP Model. J. Nat. Disasters 2024, 33, 27–36. [Google Scholar]
- Zhang, Y.; Zi, F.; Cao, Y.; Cheng, X.; Han, Y.; Tang, L. Evaluation of Landslide Susceptibility in Yuanling County Based on MaxEnt, Model. J. Nat. Disasters 2025, 34, 105–116. [Google Scholar] [CrossRef]
- Pearson, K. Mathematical contributions to the theory of evolution. III. Regression, heredity, and panmixia. Philos. Trans. R. Soc. Lond. A 1896, 187, 253–318. [Google Scholar] [CrossRef]
- Du, P.; Chen, N.; Wu, K.; Li, Z.; Zhang, Y. Evaluation of Landslide Susceptibility in Southeast Tibet Based on a Random Forest Model. J. Chengdu Univ. Technol. Sci. Technol. Ed. 2024, 51, 328–344. [Google Scholar] [CrossRef]
- Zheng, D.; Gao, M.; Yan, C.; Li, Y.; Nian, T. Susceptibility Assessment of Landslides Based on Convolutional Neural Network Model: A Case Study from Xianrendong National Nature Reserve in Southern Liaoning Province. Earth Sci. 2024, 49, 1654–1664. [Google Scholar] [CrossRef]
- Pradhan, B.; Kim, H. Evaluation of landslide susceptibility models using different multicollinearity treatments. Nat. Hazards 2020, 103, 3201–3228. [Google Scholar] [CrossRef]
- Li, C.; Liu, Y.; Lai, S.; Wang, D.; He, X.; LIU, Q.; He, B. Landslide Susceptibility Evaluation Methods Based on BP Neural Network Model. Sci. Technol. Eng. 2023, 23, 5481–5492. [Google Scholar] [CrossRef]
- Zhai, W.; Wang, X.; Wu, M.; Wu, X.; Li, Q. Geological Disaster Susceptibility Evaluation Based on Coupling of Frequency Ratio Model and Random Forest Model. J. Nat. Disasters 2023, 32, 74–82. [Google Scholar] [CrossRef]
- Chen, X.; Shi, Y.; Wen, Y.; Suriya; Xiaomei, M. Landslide Susceptibility Evaluation Based on Certainty Factor and Support Vector Machines. Sci. Technol. Eng. 2023, 23, 518–527. [Google Scholar] [CrossRef]
- Wang, Z.; Sun, Z.; Sun, L. Optimised BP Neural Network-Based Gravity Data Inversion of Crustal Thickness in the Huatung Basin and Manila Subduction Zone Region. Acta Geol. Sin. 2024, 98, 3316–3331. [Google Scholar] [CrossRef]
| Disclaimer/Publisher’s Note: The statements, opinions and data contained in all publications are solely those of the individual author(s) and contributor(s) and not of MDPI and/or the editor(s). MDPI and/or the editor(s) disclaim responsibility for any injury to people or property resulting from any ideas, methods, instructions or products referred to in the content. |