Article

Spatiotemporal Responses of Terrestrial Ecosystems to Climate Forcing and Mitigation Strategies for Cold Regions Engineering


1
School of Hydraulic and Electric Power, Heilongjiang University, Harbin 150080, China
2
Heilongjiang Province Cold Region Hydrology and Water Conservancy Engineering Joint Laboratory (International Cooperation), Harbin 150080, China
3
Institute of Groundwater Cold Region, Heilongjiang University, Harbin 150080, China
*
Author to whom correspondence should be addressed.
Appl. Sci. 2026, 16(15), 7387; https://doi.org/10.3390/app16157387
Submission received: 24 June 2026 / Revised: 19 July 2026 / Accepted: 21 July 2026 / Published: 23 July 2026

Abstract

Vegetation dynamics are key indicators of climate change and ecological risk in cold regions. This study investigated vegetation–climate interactions in Heilongjiang Province, China, using an integrated analytical framework that combined the Mann–Kendall test, Pettitt test, Hurst exponent, Continuous Wavelet Transform, and Wavelet Transform Coherence with the Normalized Difference Vegetation Index and meteorological data from 1990 to 2024. The dominant vegetation comprises cold–temperate coniferous forests, mixed broadleaf–conifer forests, meadow steppes, and croplands. Results showed that (1) the climate system experienced asynchronous abrupt changes, with potential evapotranspiration, precipitation, and temperature changing in 2008, 2011, and 2013, respectively. Accordingly, the Normalized Difference Vegetation Index reversed in 2011, with greening rates in the range of 0.009–0.022 yr−1 in the northwestern and central regions and browning rates in the range of −0.010 to −0.025 yr−1 in the southwestern and eastern regions. (2) The Hurst exponent ranged from 0.23 to 0.48 for temperature and potential evapotranspiration, indicating strong anti-persistence and high future ecological vulnerability. (3) Wavelet coherence analysis identified precipitation as the dominant climatic driver at 6–9-year scales, whereas temperature shifted from a short-term positive driver to a long-term stressor, and potential evapotranspiration mainly regulated vegetation at 5–8-year scales. These findings provide scientific support for ecological risk assessment and climate-resilient cold regions engineering.

1. Introduction

As a vital component of terrestrial ecosystems, vegetation acts as a critical “ecological safeguard” for cold regions engineering, protecting underlying permafrost and major infrastructure from thermal erosion [1,2]. Previous studies have demonstrated that hydrothermal factors, including precipitation (PCP), temperature (TMP), and potential evapotranspiration (PET), serve as critical climatic drivers affecting vegetation growth and ecosystem functioning. For instance, amplified warming in cold regions actively stimulates shrub encroachment and alters the active layer thickness, which fundamentally reshapes the thermal stability of the underlying permafrost [3,4]. Concurrently, shifts in the regional water balance—driven by asymmetrical variations in PCP and PET—directly dictate soil moisture availability, profoundly determining the resilience of plant communities against eco-hydrological stress [5,6]. With the intensification of global climate change, the response of vegetation to climatic factors exhibits pronounced regional heterogeneity, nonlinear characteristics, and time-lag effects [5,7,8]. Vegetation also regulates carbon and water cycles, providing essential feedback on global climate change [9]. However, climate change has profoundly altered these ecosystems, exacerbating engineering and environmental risks. Elucidating vegetation response mechanisms to climate forcing is thus essential for environmental impact assessments and mitigation strategies [10,11,12].
While the Normalized Difference Vegetation Index (NDVI) is widely used to monitor vegetation dynamics [13], previous studies have primarily examined its relationships with hydrothermal factors through conventional trend analysis or correlation methods [14,15]. Recent studies from Arctic Alaska, Siberia, the Canadian boreal forest, and northern Europe have demonstrated that vegetation responses to climate change differ substantially among cold regions because of variations in permafrost conditions, vegetation composition, and hydrothermal regimes [16,17,18]. However, most existing studies focus on linear relationships and rarely consider abrupt changes, future persistence, and multi-scale nonlinear coupling simultaneously. Consequently, the mechanisms underlying vegetation responses to climate forcing remain insufficiently understood, limiting ecological risk assessment and climate adaptation in cold regions.
Methodologically, integrated frameworks supersede singular time-domain analyses for characterizing complex climate–ecological processes. The Mann–Kendall and Pettitt tests effectively identify trends and abrupt change points, so they have been widely adopted across various Earth science disciplines. Specifically, they are extensively utilized in hydrology to detect structural shifts in river runoff and basin-scale water balances, in climatology to trace monotonic variations in extreme PCP and TMP anomalies, and in eco-hydrology to pinpoint abrupt transition nodes in long-term vegetation dynamics (e.g., NDVI degradation or greening phases) [19,20,21,22], while the Hurst exponent evaluates future persistence and degradation risks [23]. Furthermore, Continuous Wavelet Transform and wavelet coherence quantify multi-scale periodicities, transient variations, and lead-lag mechanisms in both time and frequency domains [15,24,25,26].
Situated in a high-latitude cold-temperate zone, Heilongjiang Province represents one of the most sensitive regions to global climate change [27,28,29] and a concentrated hub for cold regions engineering [29,30,31]. The overall purpose of this study is to clarify the multi-scale response mechanisms of vegetation to hydrothermal variability. Specifically, this study aims to: (1) identify the spatiotemporal trends, abrupt changes, and future persistence of NDVI and hydrothermal factors in 1990–2024; and (2) quantify the nonlinear coupling, periodic resonance, and phase-lag relationships between vegetation dynamics and climatic factors. The findings provide scientific support for ecological risk assessment and climate-resilient cold regions engineering.

2. Materials and Methods

2.1. Overview of the Study Area

Situated in northeastern China (121°11′ E–135°05′ E, 43°25′ N–53°33′ N), Heilongjiang Province (~473,000 km2) is a vital grain base and ecological barrier for Northeast China (Figure 1). Topographically, it features elevated mountainous perimeters—including the Greater Khingan, Lesser Khingan, and Wanda Mountains—surrounding the low-lying central Songnen and Sanjiang Plains.
Climatically, it falls within the temperate continental monsoon zone, transitioning from a humid continental climate (Dwa/Dwb) in the south-central plains to a subarctic climate (Dwc) in the northern mountains [32]. Meteorologically, PCP increases from northwest to southeast, while both TMP and potential evapotranspiration decrease from south to north. This creates a distinct east-to-west moisture gradient based on the aridity index (AI): the eastern regions are semi-humid to humid (AI > 0.5) with summer water surpluses, whereas the western Songnen Plain is semi-arid (0.2 < AI < 0.5) and susceptible to spring/summer moisture deficits.
Vegetation spatial patterns are strongly coupled with regional hydrothermal conditions. The northern and eastern mountains are dominated by cold–temperate coniferous forests and mixed broadleaved–coniferous forests, whereas the western plains are characterized by meadow steppes and croplands. Correspondingly, the dominant soils comprise dark-brown forest soils in the mountainous areas, fertile black soils (Mollisols) in the central plains, meadow soils in lowland wetlands, and chernozem soils in the western Songnen Plain. Consequently, the NDVI is notably higher in the eastern and southeastern sectors. Highly sensitive to global warming, Heilongjiang serves as a crucial representative area for investigating high-latitude vegetation dynamics and climate responses [29,33].

2.2. Data Sources and Preprocessing

To ensure the statistical robustness and physical reliability of this research, a unified temporal span of 35 years (1990–2024) was selected for all meteorological and vegetation datasets (Table 1). This specific range was deliberately established because it exceeds the World Meteorological Organization (WMO) 30-year standard for defining a stable climatological baseline. Furthermore, a continuous 35-year record provides a sufficient sample size crucial for identifying significant abrupt change nodes and capturing low-frequency decadal periodicities in subsequent time–frequency analyses without severe edge effects. Detailed specifications for each dataset are outlined below.

2.2.1. Meteorological Data

The meteorological variables employed in this study—namely, PCP, mean surface TMP, and PET—were derived from the high-resolution gridded meteorological dataset of China (ChinaMet). This dataset was developed by Ling Zhang and Yingyi Hu et al., and is distributed by the National Cryosphere Desert Data Center. This dataset is distinguished by its significant advantages of a prolonged time series and high spatial resolution. Methodologically, it overcomes the limitations inherent in single data sources through a deep integration of ground-based observational records from over 2000 meteorological stations of the China Meteorological Administration. Furthermore, it systematically fuses multi-source remote-sensing PCP products (e.g., IMERG, SM2RAIN-ASCAT, and CMORPH), the latest ERA5-Land reanalysis data from the European Centre for Medium-Range Weather Forecasts, alongside diverse auxiliary datasets including MODIS land surface TMP and AVHRR. At the core algorithmic level, the dataset was developed using knowledge-guided machine learning methods combined with climate-field-assisted spatial downscaling techniques. Consequently, its spatiotemporal resolution and accuracy are significantly superior to those of comparable products. Furthermore, the PET within the dataset scientifically integrates both the Hargreaves and Penman–Monteith estimation methods, providing exceptionally high-precision baseline data for this study to quantify regional evaporative demand and dry–wet variations [34,35].

2.2.2. Vegetation Index Data

This study employs the annual Landsat NDVI_mean dataset for China as the core indicator to characterize regional vegetation growth conditions. Seamlessly integrating over three decades of Earth observation imagery, this dataset establishes a long-term, high-resolution, and highly verifiable basemap of vegetation dynamics. In terms of raw data and algorithmic processing, the dataset was derived from rigorously orthorectified Landsat Collection 2 Tier 1 Level 2 scene imagery. The Normalized Difference Vegetation Index was subsequently computed utilizing the surface reflectance from the near-infrared and red bands. To mitigate noise interference induced by cloud obscuration and data gaps, this product adopts a rigorously designed annual compositing strategy. Specifically, it initially generates 8-day time-series composites (utilizing the most recently acquired valid pixel values within each cycle) and subsequently performs a deep integration of the year-round data via mean-value computation to yield the final spatial distribution map of the mean annual NDVI. This annual greenness metric can precisely quantify the comprehensive impacts of water and energy stresses on terrestrial ecosystems, thereby providing an unparalleled, high-resolution benchmark for scientifically diagnosing cropland growth, evaluating the efficacy of the Grain for Green Project, and elucidating the evolutionary dynamics of high-latitude vegetation within the study area.

2.3. Methods

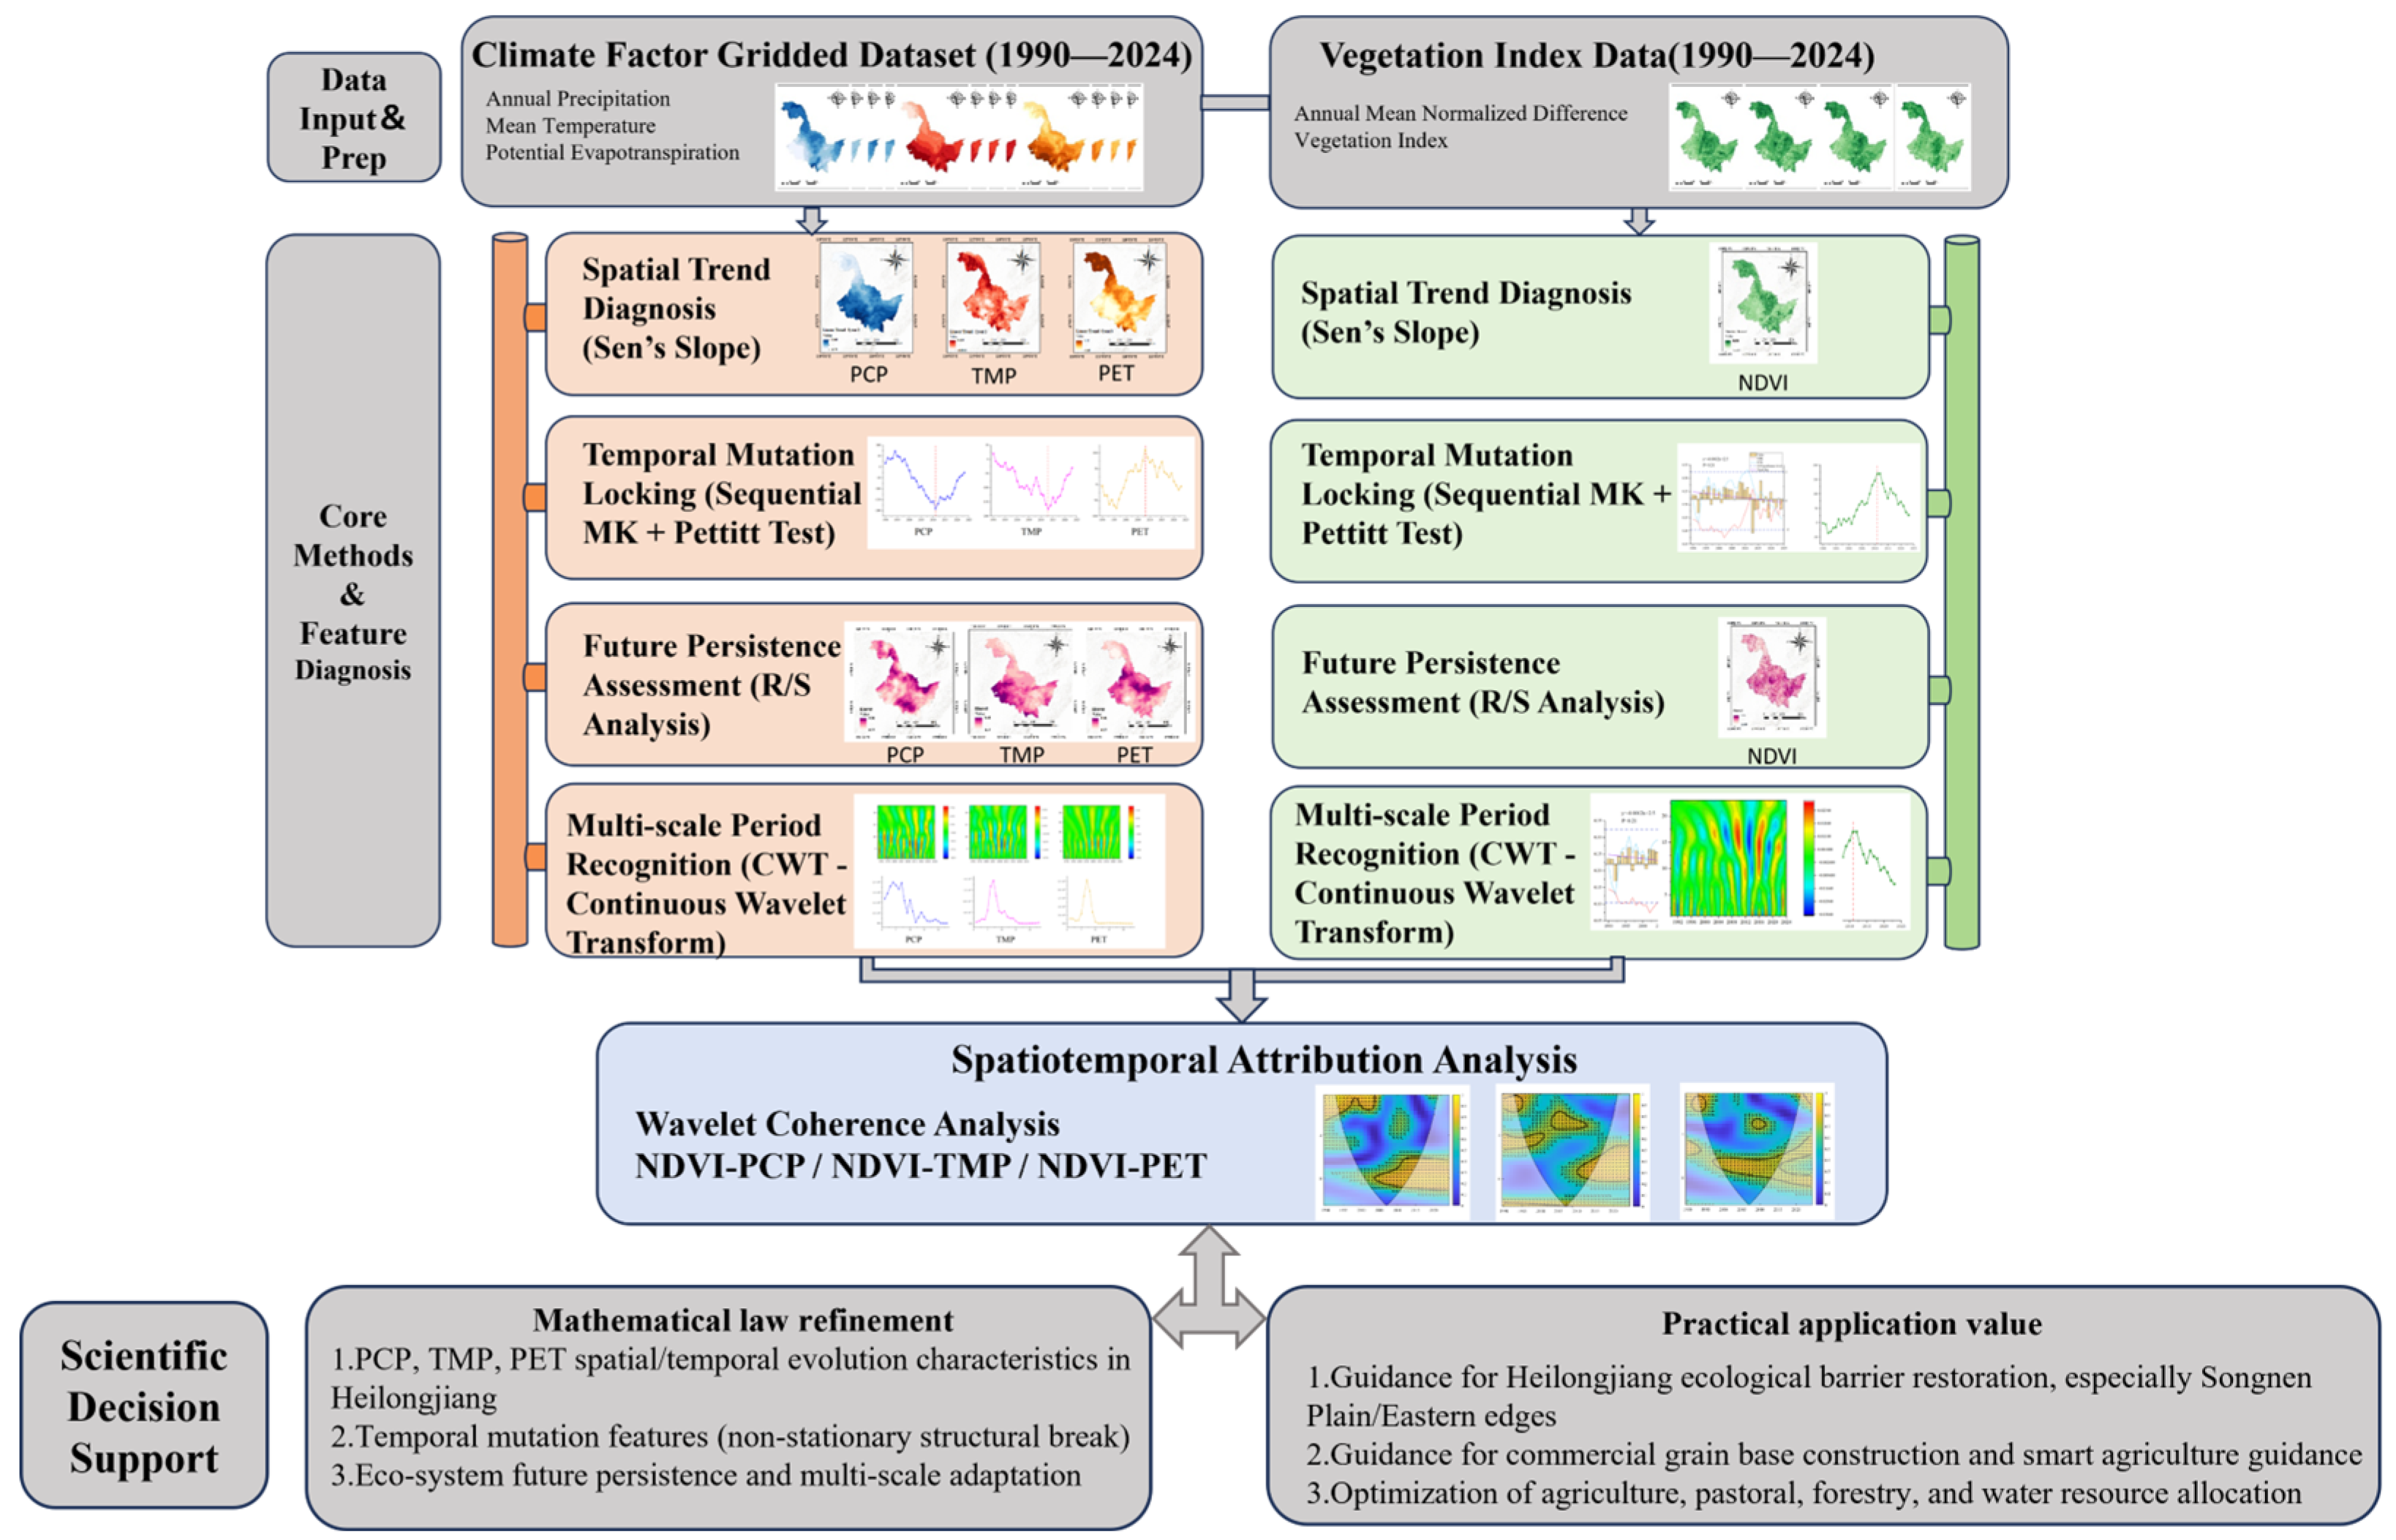
Focusing on the study area, this research establishes an integrated multi-method framework. Using long-term NDVI and high-resolution meteorological data, the Mann–Kendall test, Pettitt’s test, and Hurst exponent were coupled to evaluate the spatiotemporal trends, structural breakpoints, and future persistence of vegetation and hydrothermal factors. Additionally, Continuous Wavelet Transform (CWT) and Wavelet Transform Coherence (WTC) were employed to quantify the frequency-domain resonance and lead-lag driving mechanisms of climate factors on vegetation. Ultimately, this study systematically reveals the multi-scale coupling patterns and adaptation mechanisms of coupled climate–ecosystem dynamics in high-latitude cold regions.

2.3.1. Sen’s Slope Trend Estimation

The Theil–Sen Median trend estimation, proposed by Sen [36], is a robust non-parametric statistical method for trend calculation [37,38]. Compared to conventional linear regression models based on the ordinary least squares method, the Sen’s slope estimator is distribution-free, meaning it does not assume that time-series data follow a specific probability distribution. Furthermore, it exhibits superior immunity to data gaps and robustness against extreme climatic outliers [39]. Due to the inherent stochastic errors and non-stationary fluctuations in Earth observation data under the context of global climate change, the Theil–Sen approach has been widely adopted by the international scientific community for the quantitative assessment of spatiotemporal trends in long-term satellite-derived vegetation indices (e.g., NDVI, LAI) and hydro-meteorological variables [21,39,40,41] due to its exceptional statistical robustness. In this study, the rate of change for NDVI and key meteorological factors (PCP, TMP, and PET) from 1990 to 2024 was calculated. The calculation formula is as follows:
β = Median ( x j x i j i ) , 1 i < j n
where x i and x j represent the values of the variable in the i -th and j -th years of the time series, respectively, and n denotes the length of the study period used for the calculation. A positive value of β > 0 indicates an increasing trend in the time series, whereas a negative value of β < 0 indicates a decreasing trend.

2.3.2. Mann–Kendall Abrupt Change Detection

The Mann–Kendall test is a rank-based non-parametric statistical method originally proposed by Mann [42] and subsequently developed by Kendall [43]. In global change ecology and hydro-meteorological studies, long-term Earth observation datasets often deviate from normal distributions and are highly susceptible to the influence of extreme climatic events [44]. Due to its independence from distributional assumptions and robustness against outliers, the MK test has been widely used for trend detection in environmental and ecological time series. Compared with traditional parametric approaches, the MK test exhibits strong robustness to noisy observations and minimizes the statistical bias associated with artificially imposed distributional assumptions. Therefore, it has been extensively applied to quantify monotonic trends and evaluate their statistical significance in long-term eco-climatic time series [39,40]. For a time series of length n , the rank sequence s k is defined as follows:
s k = i = 1 k r i       ,   k = 2 , 3 , , n
where r i is assigned a value of 1 when x i > x j ,   j < i ; otherwise, it is assigned a value of 0. Subsequently, the standardized statistic U F k is calculated as follows:
U F k = s k E s k Var s k ,   k = 1,2 , , n
The expected value, E ( s K ) , and variance, V a r ( s k ) , of the statistic s k are computed as follows:
E s K = K K 1 4
V a r s K = K K 1 2 k + 5 72
The U F k sequence forms the forward sequential statistic curve. A significance level of α = 0.05 was employed, with critical thresholds of ± 1.96 . Values exceeding these thresholds indicate statistically significant increasing or decreasing trends during the corresponding period. The final forward statistic, U F n , represents the overall trend of the entire time series and is denoted as the Z -value. Subsequently, the statistical significance of the trend was evaluated by calculating the corresponding P -value based on the standard normal cumulative distribution function, i.e., P = 2 × 1 ϕ Z .

2.3.3. Pettitt Abrupt Change Detection

The Pettitt test is a rank-based non-parametric statistical method proposed by Pettitt [45] for detecting abrupt structural changes in time series. Specifically, it identifies non-stationary change points associated with shifts in the mean of a time series at an unknown time.
In long-term climatic and vegetation dynamics datasets, the sequential Mann–Kendall test provides valuable information on stage-specific variations through the forward and backward statistic curves. However, climate series in high-latitude cold regions are typically characterized by high-frequency noise and multi-scale oscillatory behavior. Under such conditions, frequent intersections between the forward statistic curve UF and backward statistic curve UB may occur within non-stationary intervals, thereby increasing the likelihood of false change-point identification [46].
In contrast, the Pettitt test is based on a Mann–Whitney-type rank statistic and identifies the most probable structural break point by maximizing the cumulative rank differences between two sub-series. Consequently, this method is less sensitive to endpoint effects and local high-frequency fluctuations, making it particularly suitable for complex long-term environmental datasets with multiple trend transitions. Previous studies have demonstrated that the Pettitt test generally exhibits higher statistical power and greater accuracy than the conventional MK test for identifying a single dominant structural change point [47,48].
Considering the complementary mathematical characteristics of the two non-parametric approaches, this study combined the Pettitt test with the MK mutation test to establish a cross-validation framework for abrupt change detection. This integrated methodological framework effectively reduces the uncertainty associated with a single statistical model and improves the reliability and robustness of identifying key turning points in the spatiotemporal evolution of PCP, air TMP, PET, and NDVI in Heilongjiang Province in 1990–2024.
For a given time series, x t , the Pettitt test statistic U t , T is defined as follows:
U t , T = U t 1 , T + k = 1 T s g n ( x t x k ) , ( t = 1,2 , , n )
s g n x t x k = 1 , x t > x k 0 , x t = x k 1 , x t < x k
Subsequently, the statistic K t is calculated for each time point t as.
K t = m a x U t , T
The time corresponding to the maximum value of K t is identified as the most probable change point. The significance of the detected change point is then evaluated using the following probability function:
p = 2 e x p 6 K t 2 / n 3 + n 2
If p < 0.05 , the null hypothesis is rejected, indicating that the detected change point is statistically significant.

2.3.4. Hurst Exponent Analysis Based on R/S Analysis

The Hurst exponent is a fundamental statistical indicator used to quantify long-range dependence and long-term memory effects in non-stationary time series. It was originally proposed by the British hydrologist Hurst [23] during investigations of the long-term storage regulation capacity of the Nile River. In this study, the classical rescaled range (R/S) analysis was employed to estimate the Hurst exponent. This method effectively suppresses nonlinear high-frequency noise and enables the identification of the persistence and anti-persistence characteristics of historical variations in vegetation and hydroclimatic variables [23].
In recent decades, the R/S framework has become one of the most widely adopted approaches for assessing the long-term stability and potential trend reversal risks of climate–ecosystem systems under global change [49,50]. The procedure first divides the original time series into several equal-length sub-series. Subsequently, the mean value of each sub-series is calculated, followed by the cumulative deviation from the mean at each time step. The range of cumulative deviations and the corresponding standard deviation are then used to derive the rescaled range. By repeating this procedure for different sub-series lengths, a linear relationship between log(R/S) and log(n) is established under a double-logarithmic coordinate system, and the slope of the fitted regression line is taken as the Hurst exponent. The theoretical basis of R/S analysis and its applications in hydrological studies have been extensively documented in previous studies [50,51].

2.3.5. Continuous Wavelet Transform

Hydroclimatic variables and vegetation dynamics in high-latitude regions are typically characterized by pronounced non-stationarity and multi-scale variability [15,52]. Conventional Fourier analysis cannot simultaneously preserve temporal localization and frequency information, whereas the Continuous Wavelet Transform provides superior time–frequency localization capabilities for identifying transient features and periodic structures in non-stationary signals [15].
In practical applications, discrete wavelet transform is primarily used for data compression and noise reduction, whereas CWT is more suitable for periodicity analysis and feature extraction [24]. In this study, the complex Morlet wavelet was selected as the mother wavelet owing to its excellent time–frequency localization properties and ability to generate smooth continuous wavelet spectra. Moreover, its complex formulation allows the simultaneous separation of amplitude and phase information, thereby facilitating the identification of energy distributions and phase transition characteristics across multiple temporal scales. This approach provides a robust framework for investigating the multi-scale periodic behavior of regional climate–ecosystem interactions [53].

2.3.6. Wavelet Coherence Analysis

Wavelet coherence analysis further extends the capability of CWT by providing a robust framework for investigating the co-variability between two non-stationary time series in the time–frequency domain [24,51]. In addition to identifying regions of significant coherence, WTC can quantify lead-lag relationships through the phase angle of the cross-wavelet spectrum, thereby revealing the temporal synchronization and delayed responses between paired variables [24,52].
In this study, the complex Morlet wavelet was also adopted as the mother wavelet to calculate the cross-wavelet power spectrum and relative phase information. WTC was subsequently applied to examine the relationships between NDVI and PCP, air TMP, and PET. This analysis aimed to quantitatively characterize the nonlinear climatic forcing mechanisms and time–frequency lag effects governing vegetation dynamics in the high-latitude cold region of Heilongjiang Province across multiple temporal scales [24,52].
The overall workflow of this study is illustrated in Figure 2.

3. Results

3.1. Trends and Abrupt Changes in Hydroclimatic Factors

3.1.1. Temporal and Spatial Trends of Hydroclimatic Factors

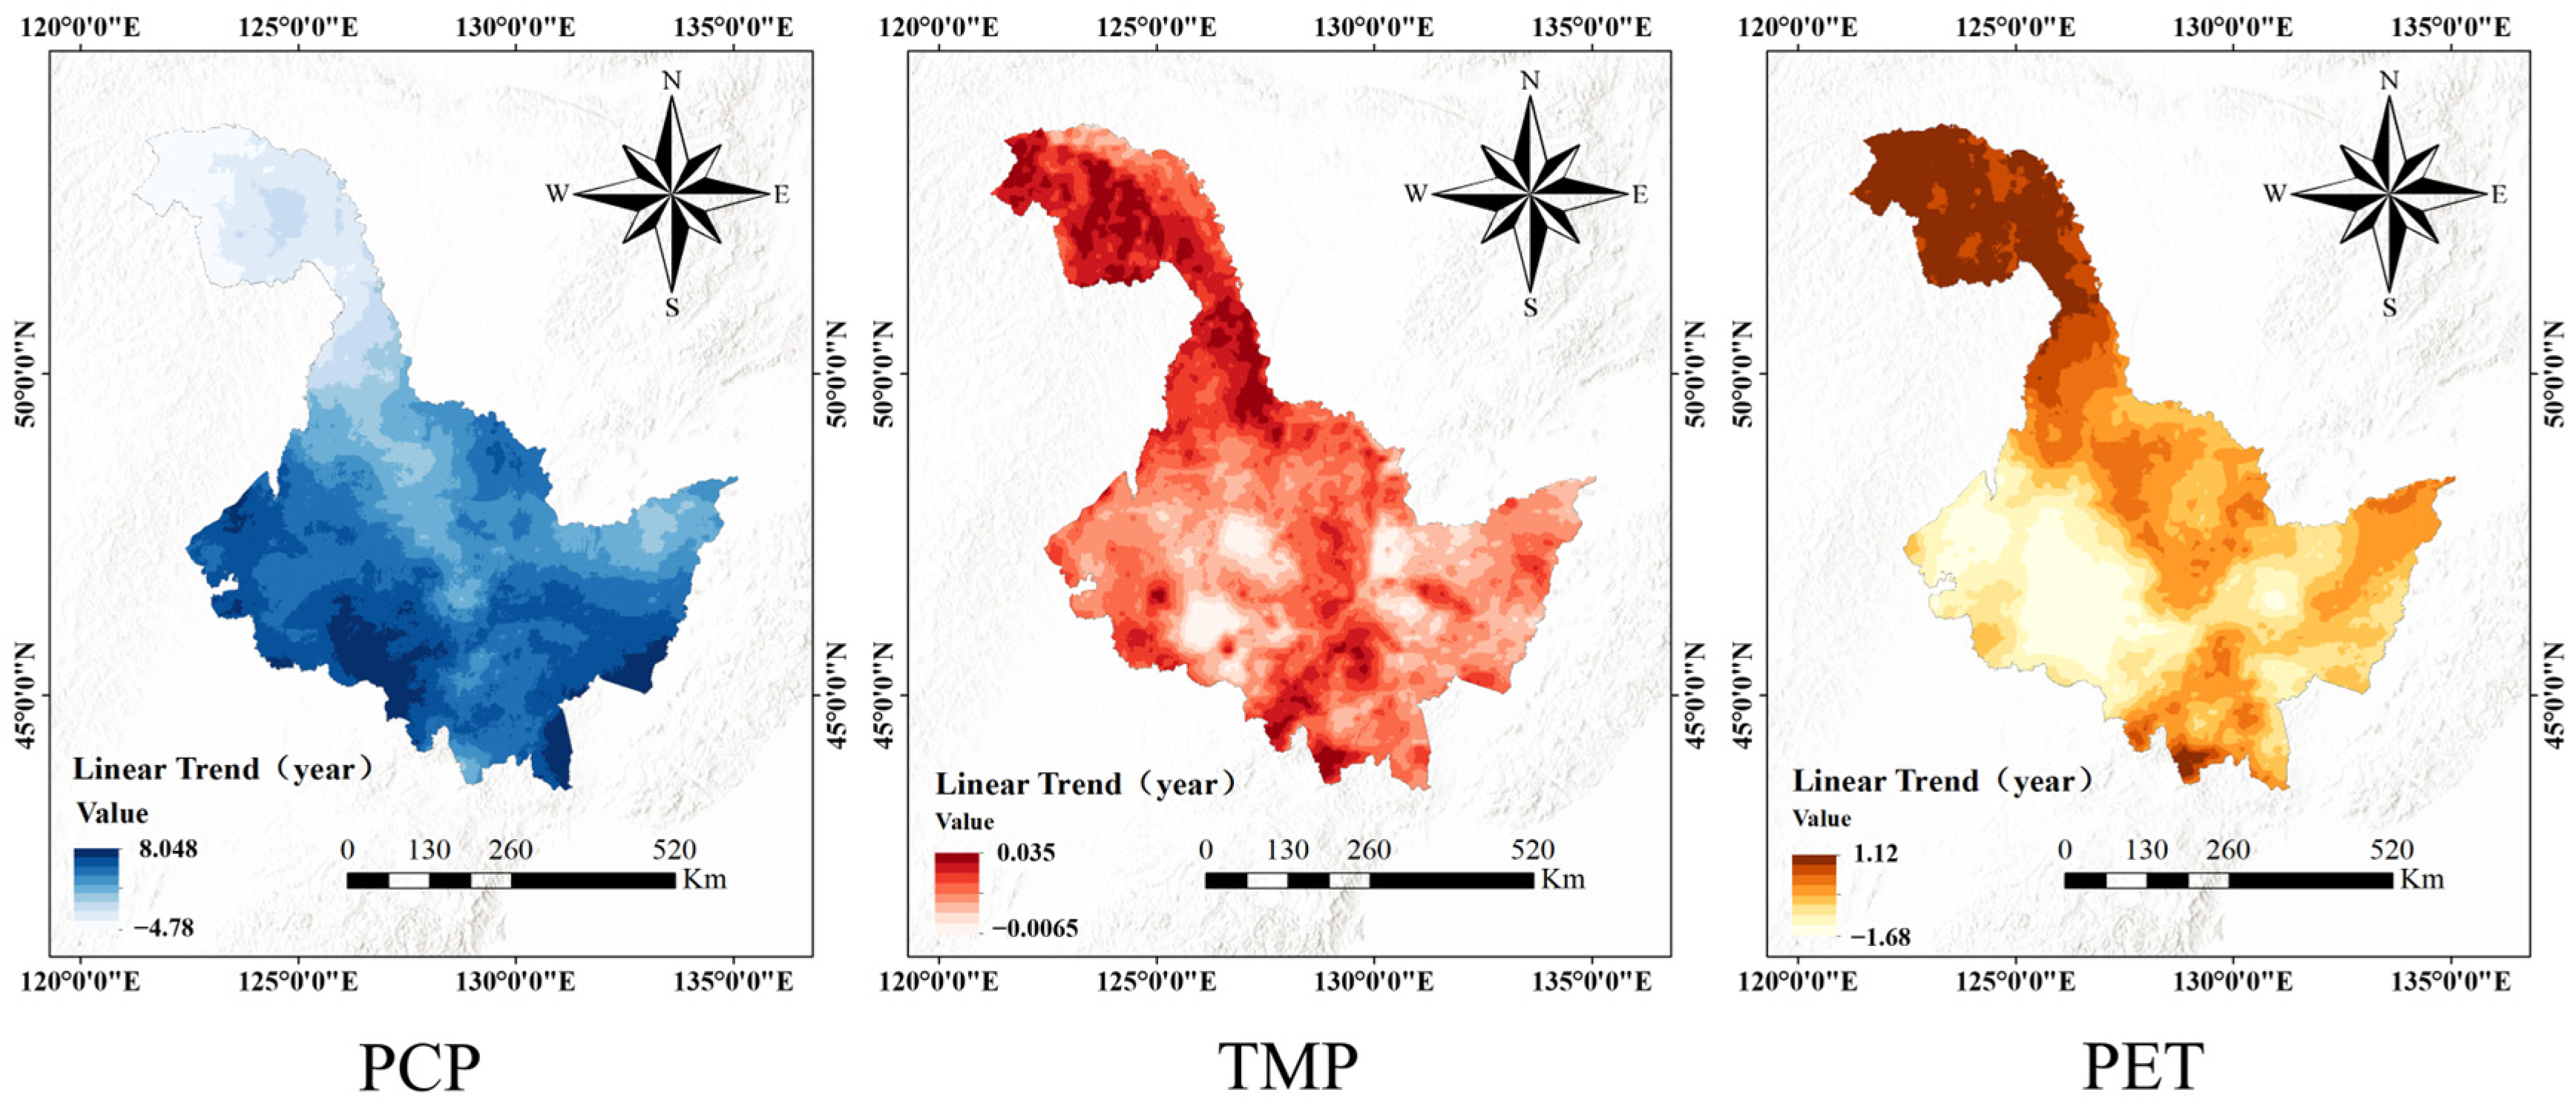
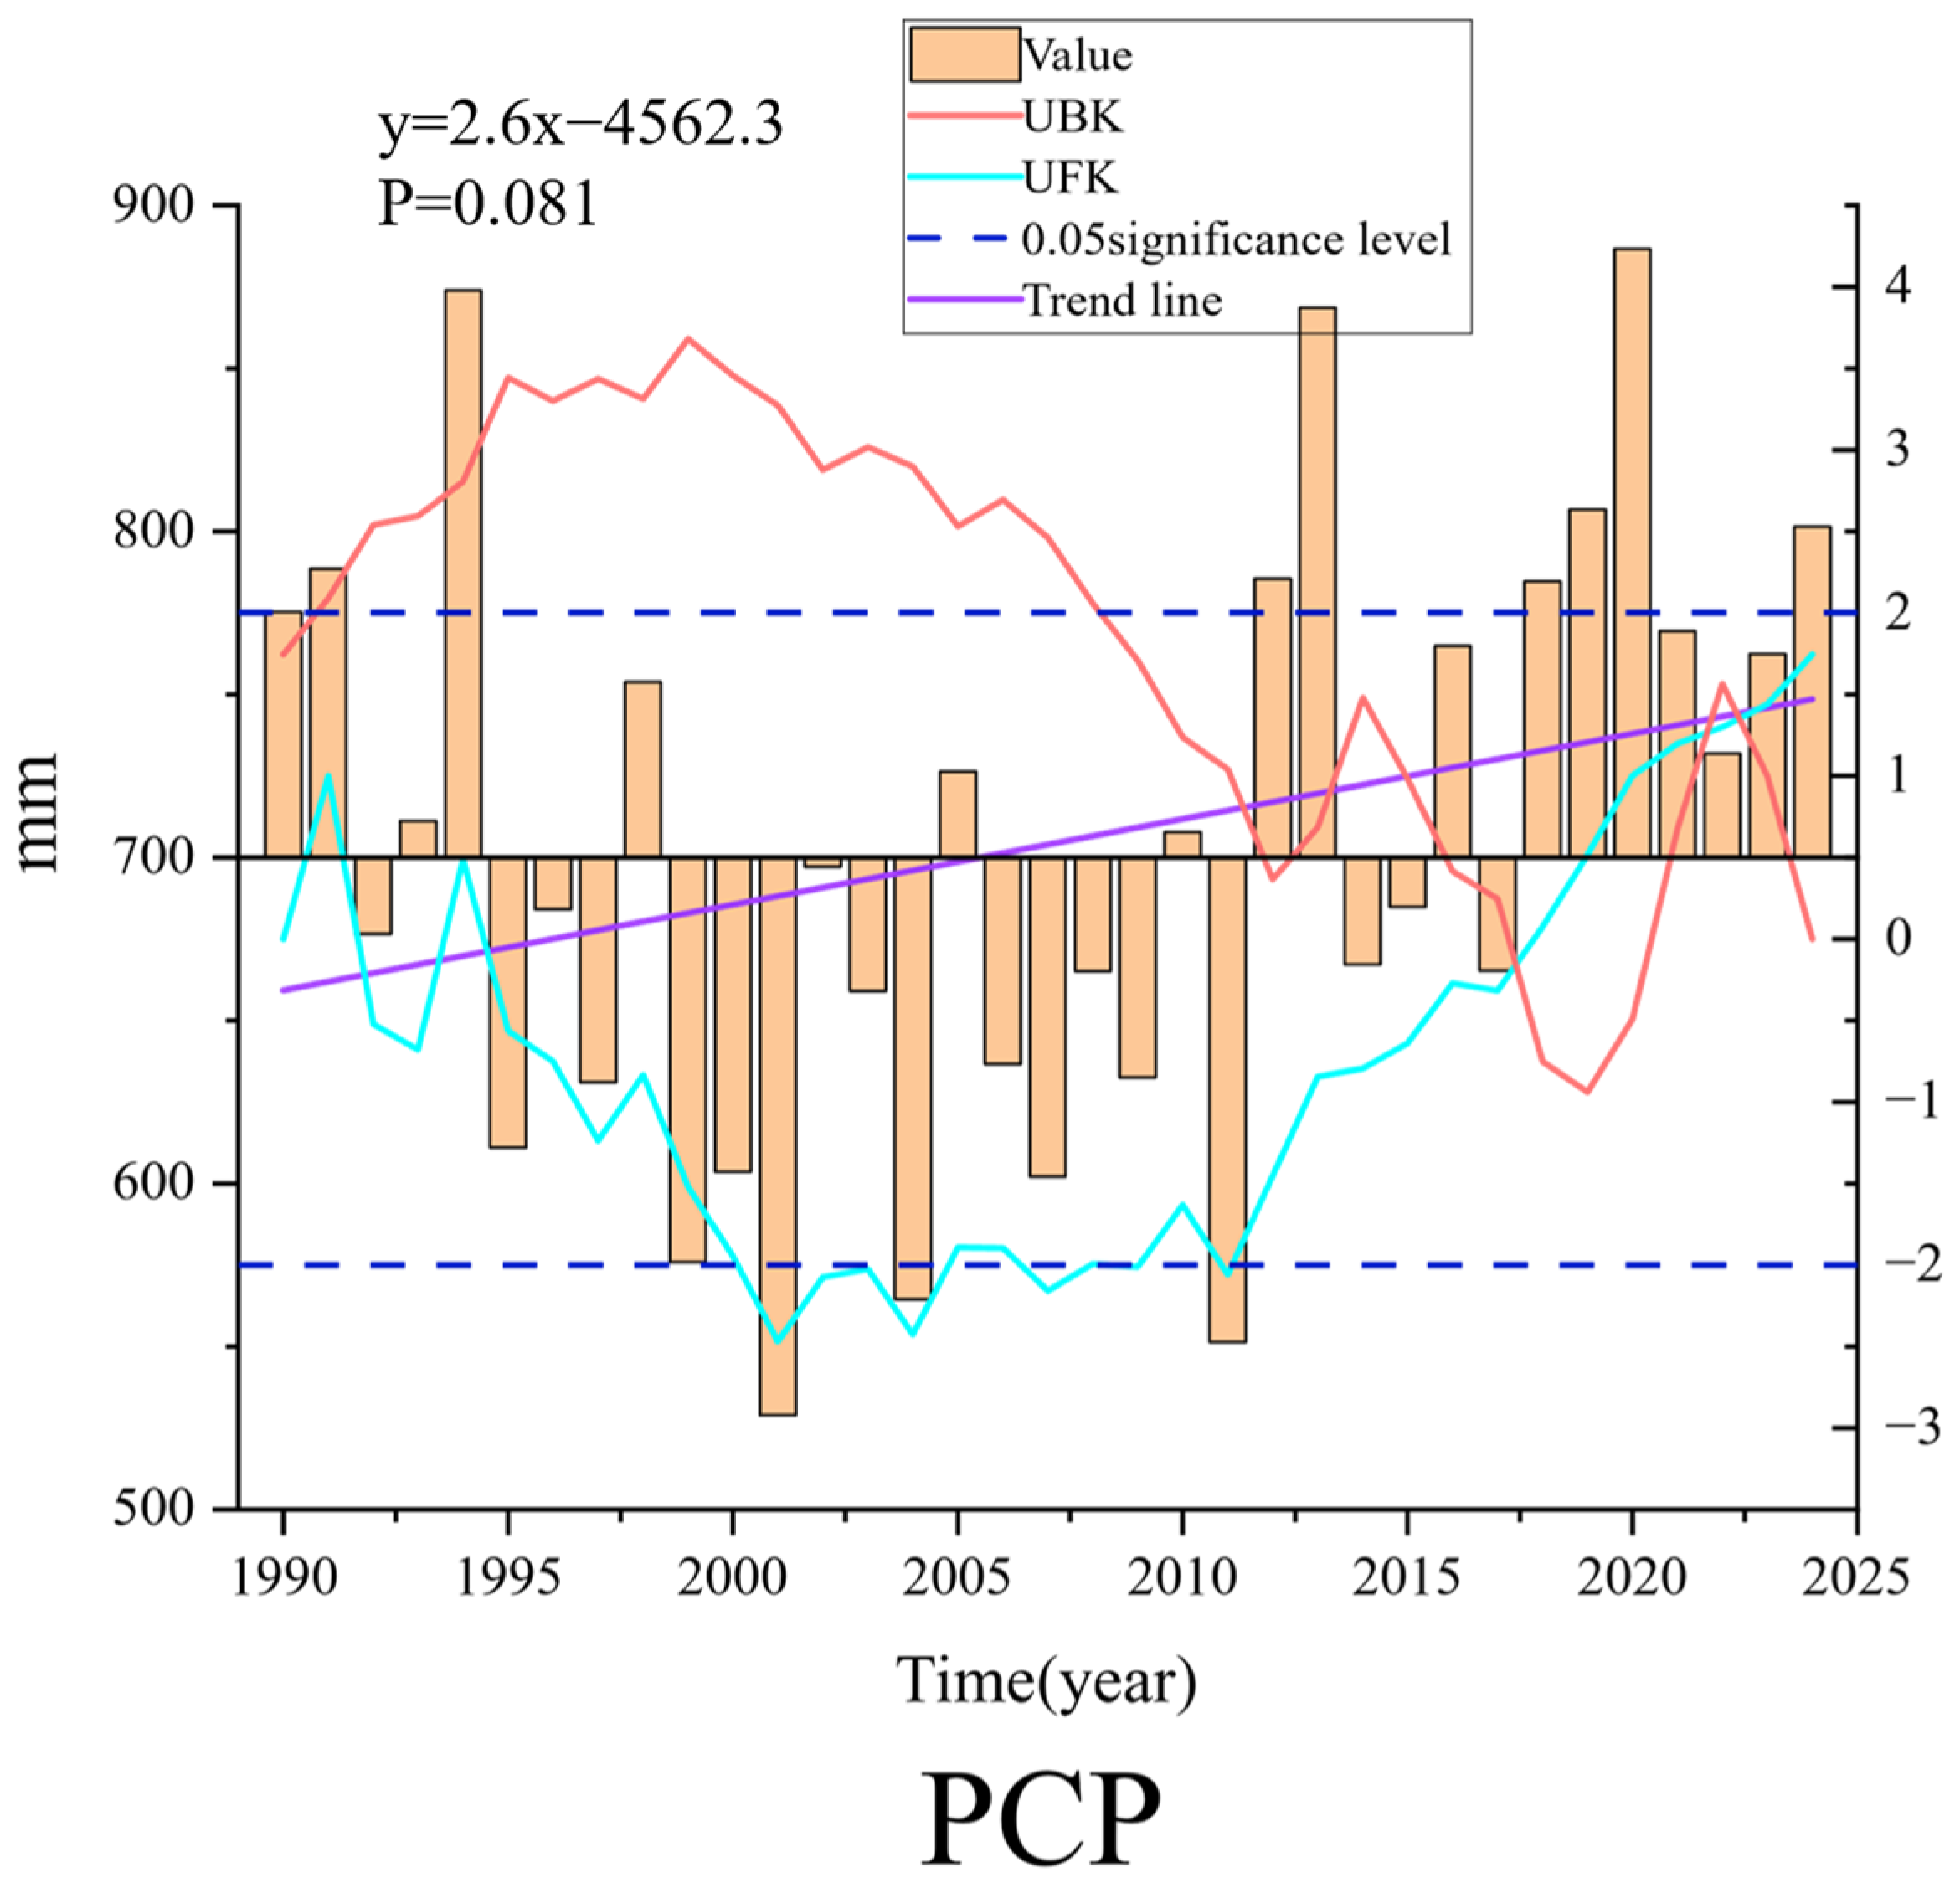
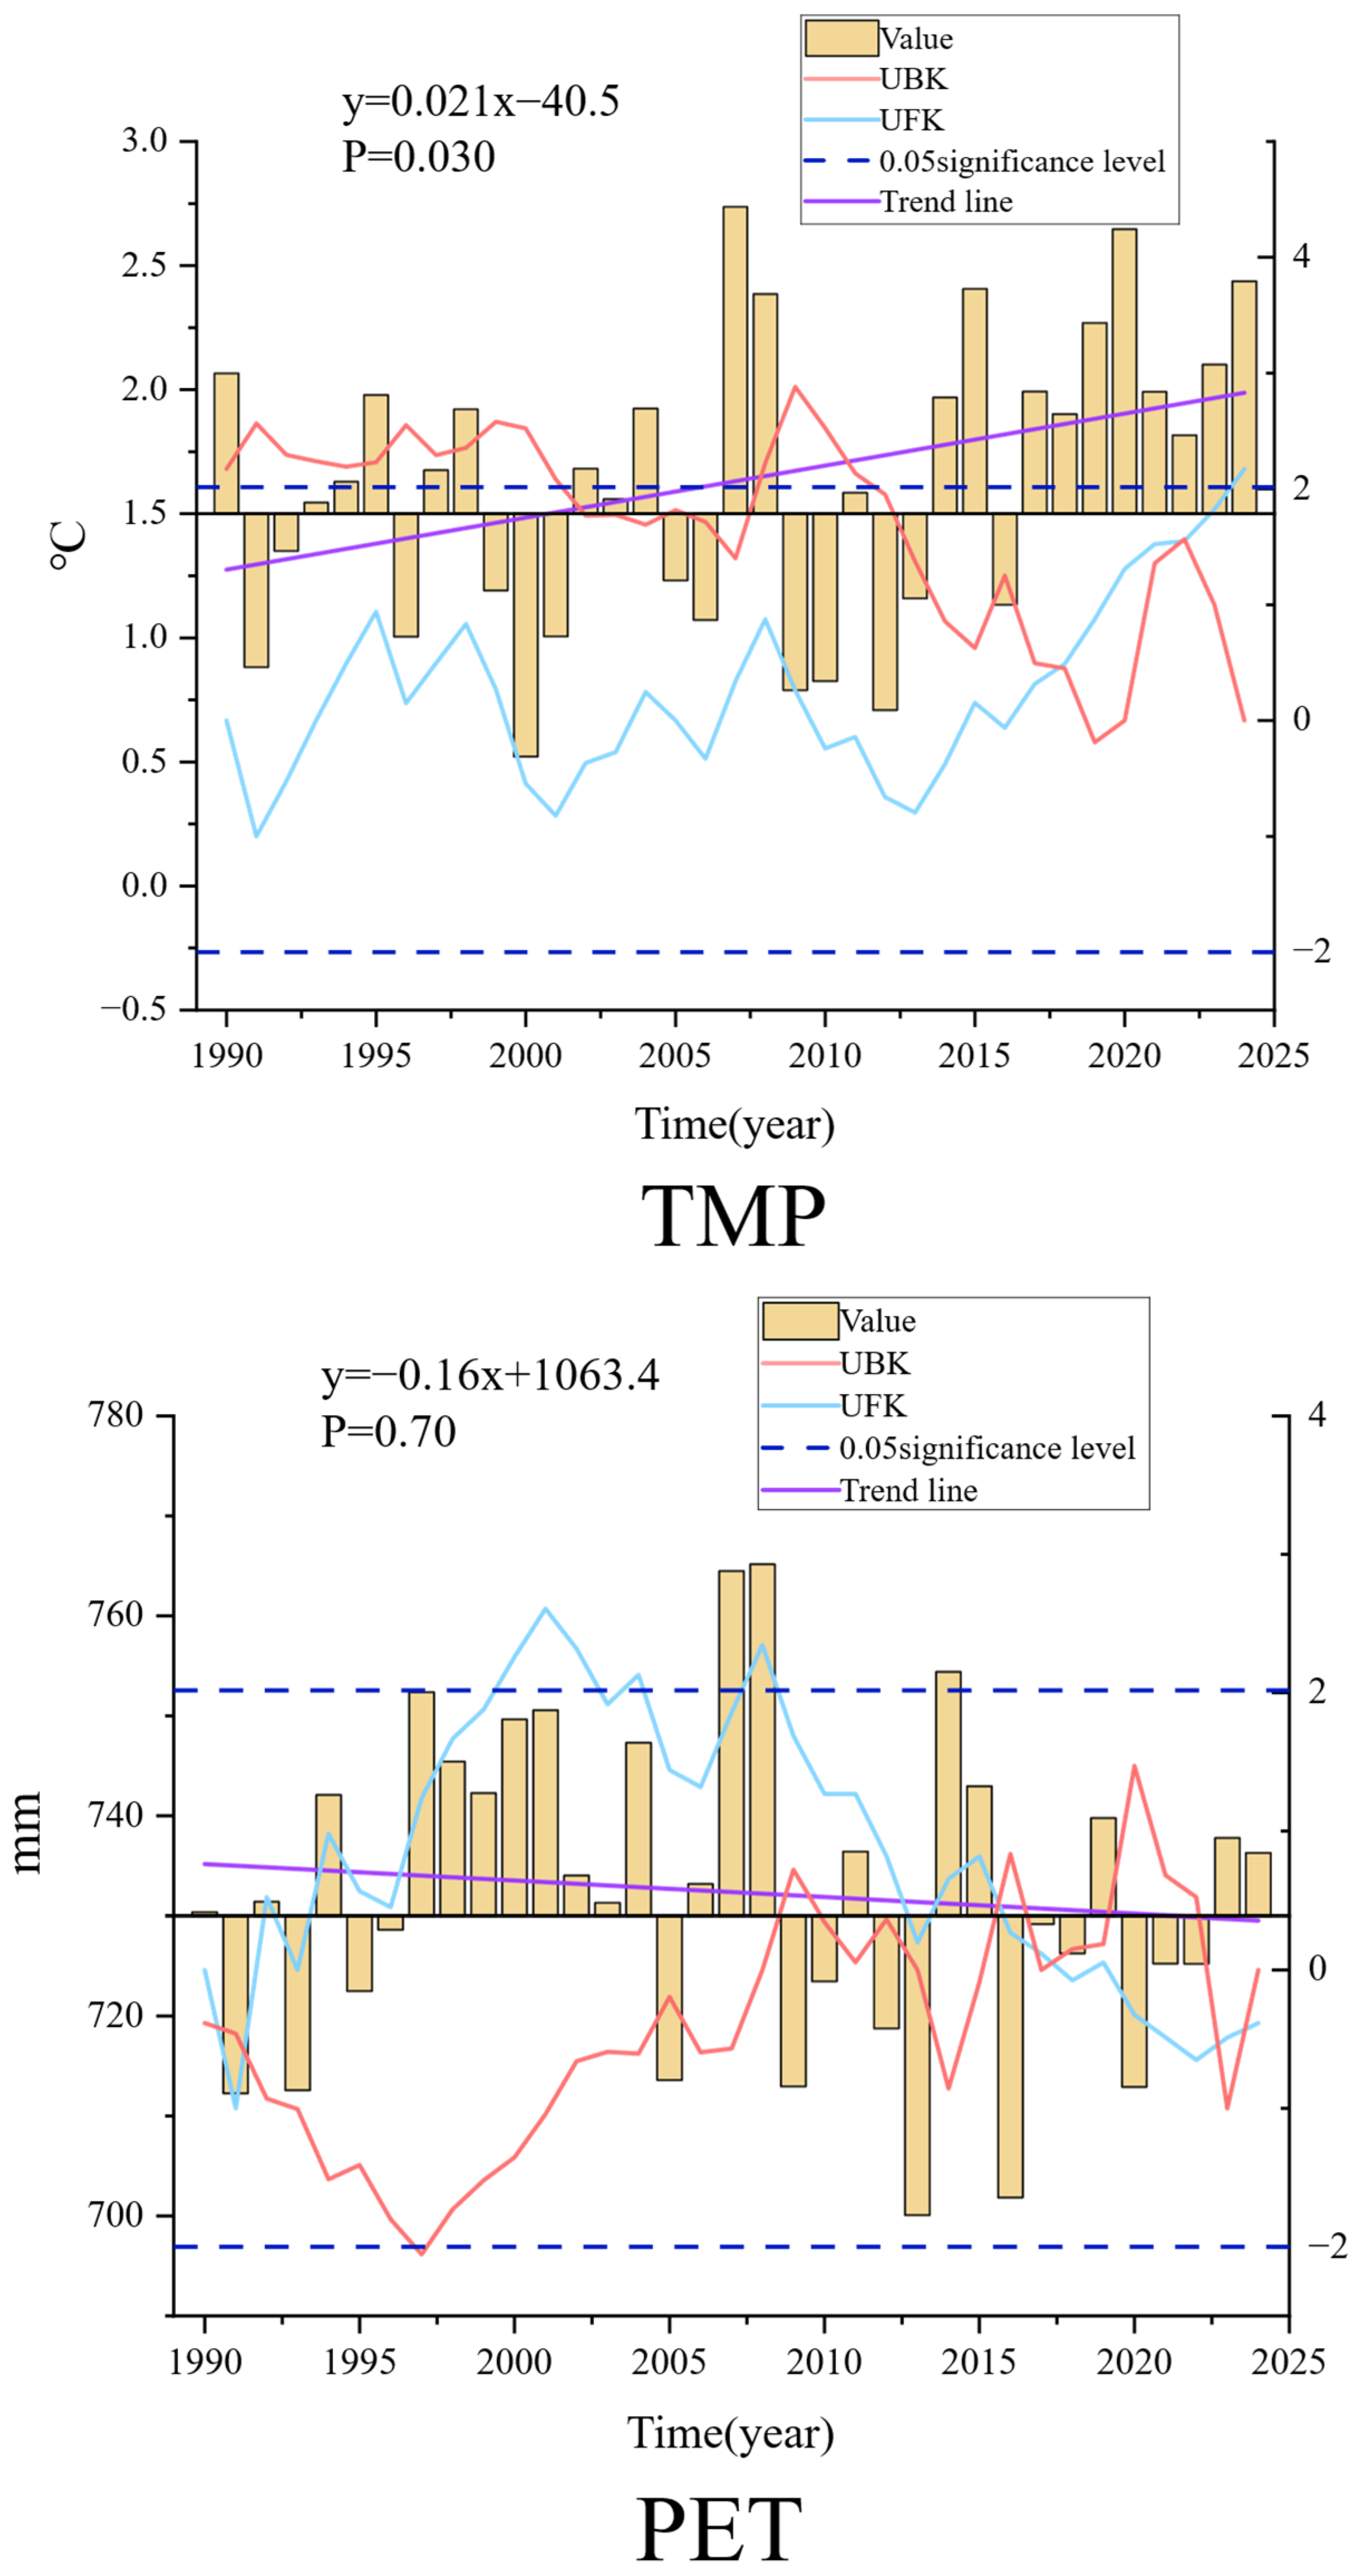
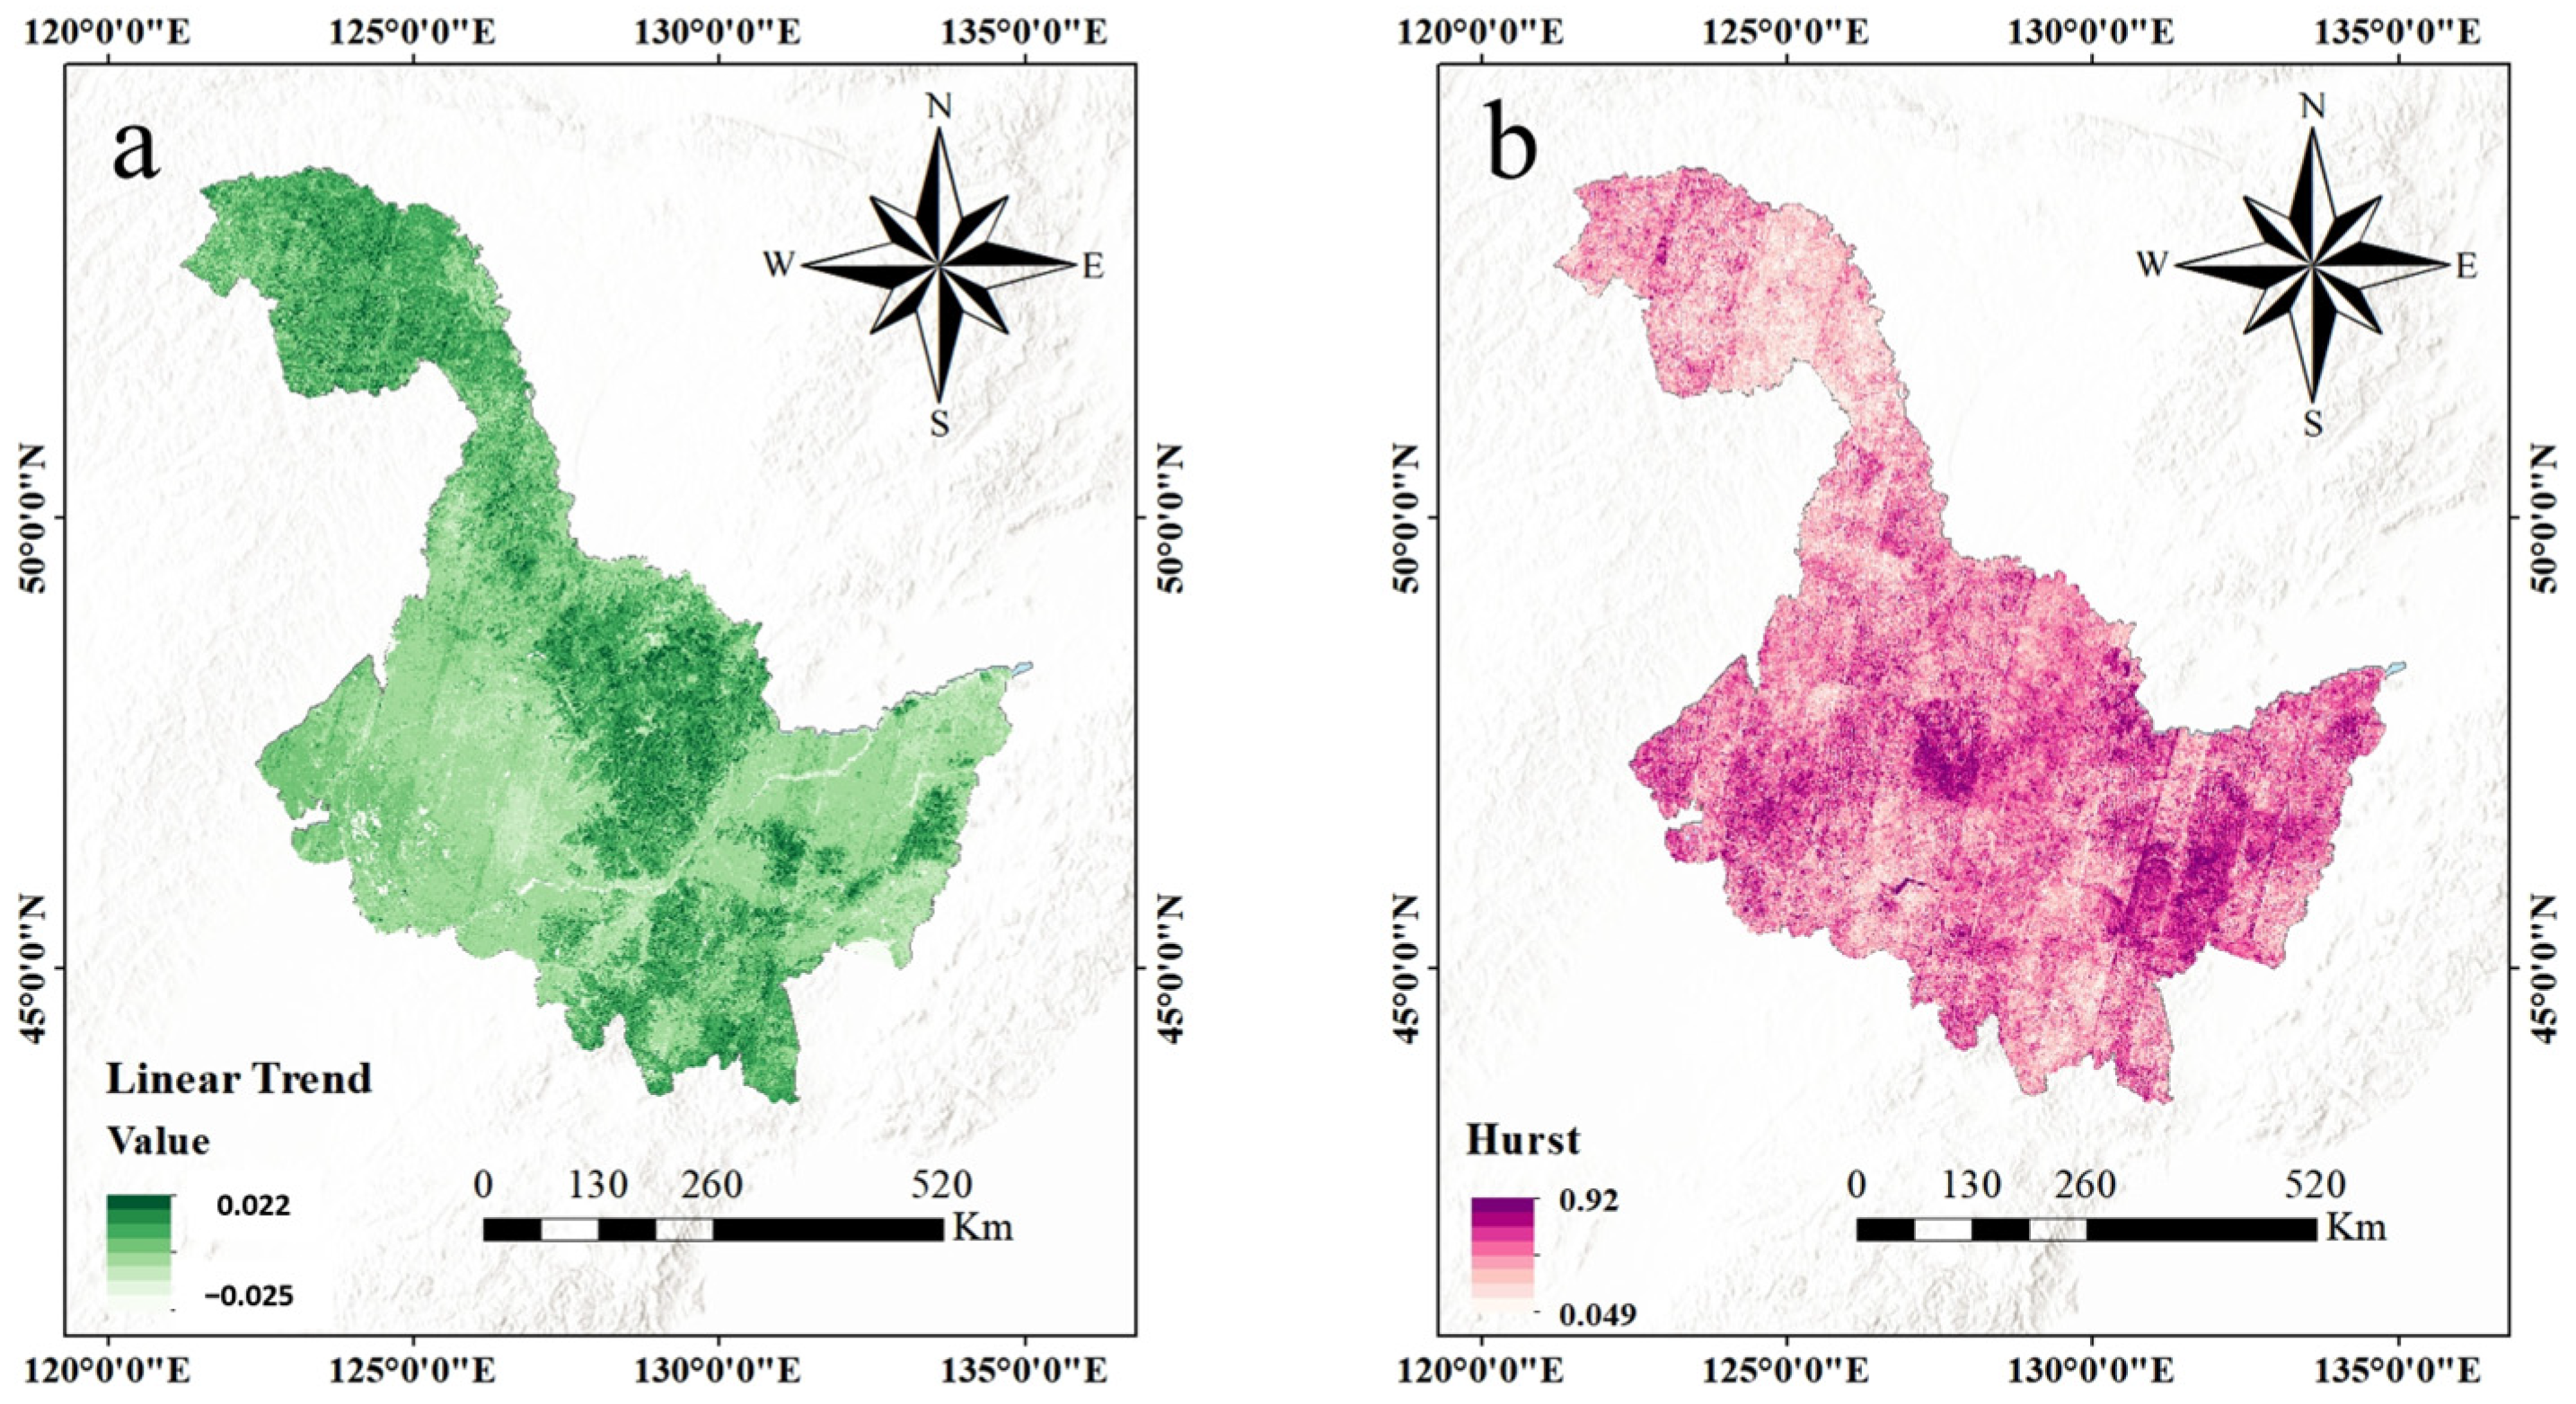
Figure 3 and Figure 4 illustrate the spatiotemporal variations in PCP, air TMP, and PET in Heilongjiang Province from 1990 to 2024.
During the study period, annual PCP exhibited a non-significant increasing trend (Sen’s slope = 2.6 mm yr−1, p = 0.081 > 0.05 ). Temporal MK statistics revealed a pronounced dry phase (2000–2005) followed by a gradual moisture recovery after 2013. Spatially (ranging from 4.78 to 8.05 mm yr−1), PCP increased in the central and south-central regions but decreased in the northwestern Greater Khingan Mountains and western margins.
Conversely, air TMP showed a statistically significant warming trend of 0.021 °C yr−1 ( p = 0.030 < 0.05 ), with warming accelerating after 2020. This province-wide warming ( 0.0065 to 0.035 °C yr−1) was most intense in the northwestern Greater Khingan Mountains and south-central regions, with only isolated pixels showing slight cooling.
PET exhibited a non-significant decrease (slope = −0.16 mm yr−1 ( p = 0.70 > 0.05 )). A period of enhanced evaporative demand (2000–2005) was followed by a sustained decline after 2010. Spatially ( 1.68 to 1.12 mm yr−1), PET displayed a distinct north–south polarization: increasing in the northern Greater Khingan Mountains while decreasing across extensive western and southern regions, indicating a profound reorganization of regional hydrothermal allocation.

3.1.2. Abrupt Changes in Hydroclimatic Factors

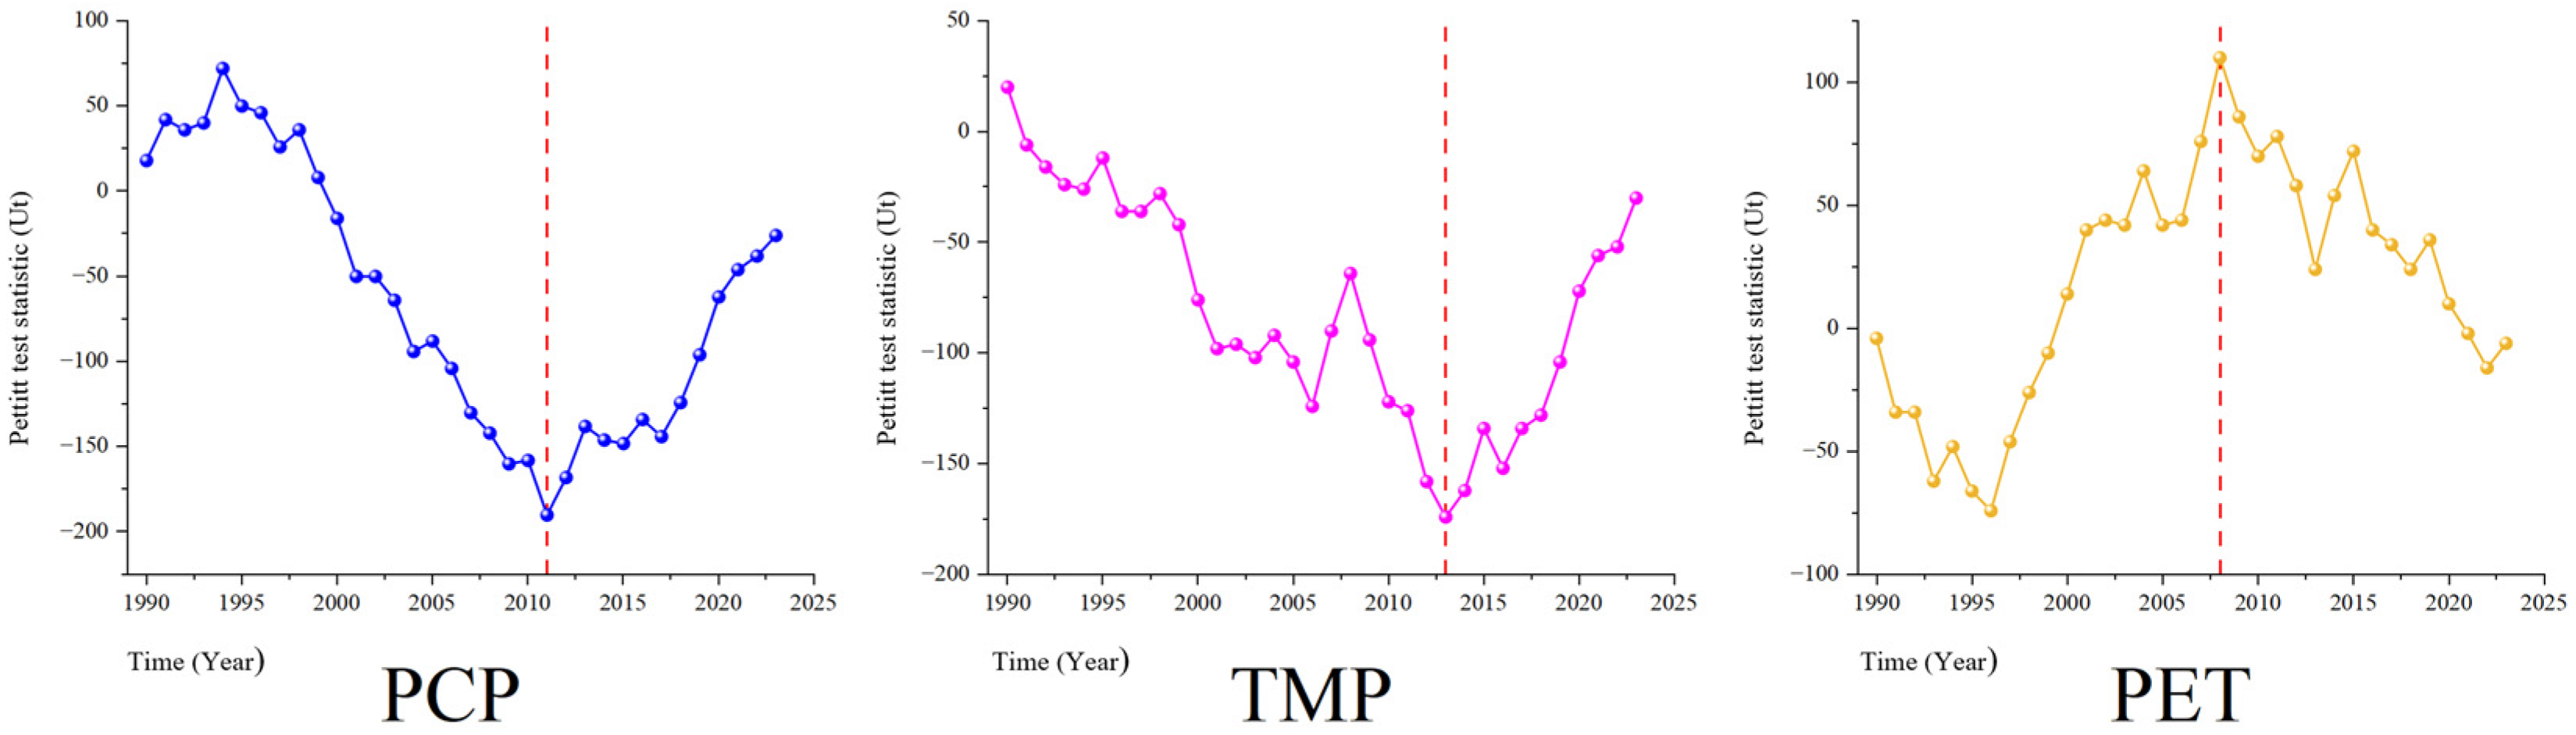
To reliably identify structural breakpoints in hydroclimatic variables, the SQ-MK and Pettitt tests were jointly applied (Figure 4 and Figure 5). For PCP, following a pronounced dry phase from 2000 to 2005, both tests identified 2011 as the dominant change point, marking a transition toward a gradually increasing moisture pattern. Meanwhile, air TMP, characterized by persistent overall warming, underwent a critical structural shift in 2013, entering an accelerated warming regime. PET experienced a surge between 2000 and 2005 before sharply declining, with 2008 identified as the primary turning point that transitioned into a weakened water consumption phase. Overall, the asynchronous abrupt changes in these variables—PET in 2008, PCP in 2011, and TMP in 2013—highlight the nonlinear responses of high-latitude hydroclimatic components. This complex hydroclimatic reorganization significantly alters the regional water–energy balance and subsequent ecosystem stability.

3.1.3. Hurst Exponent

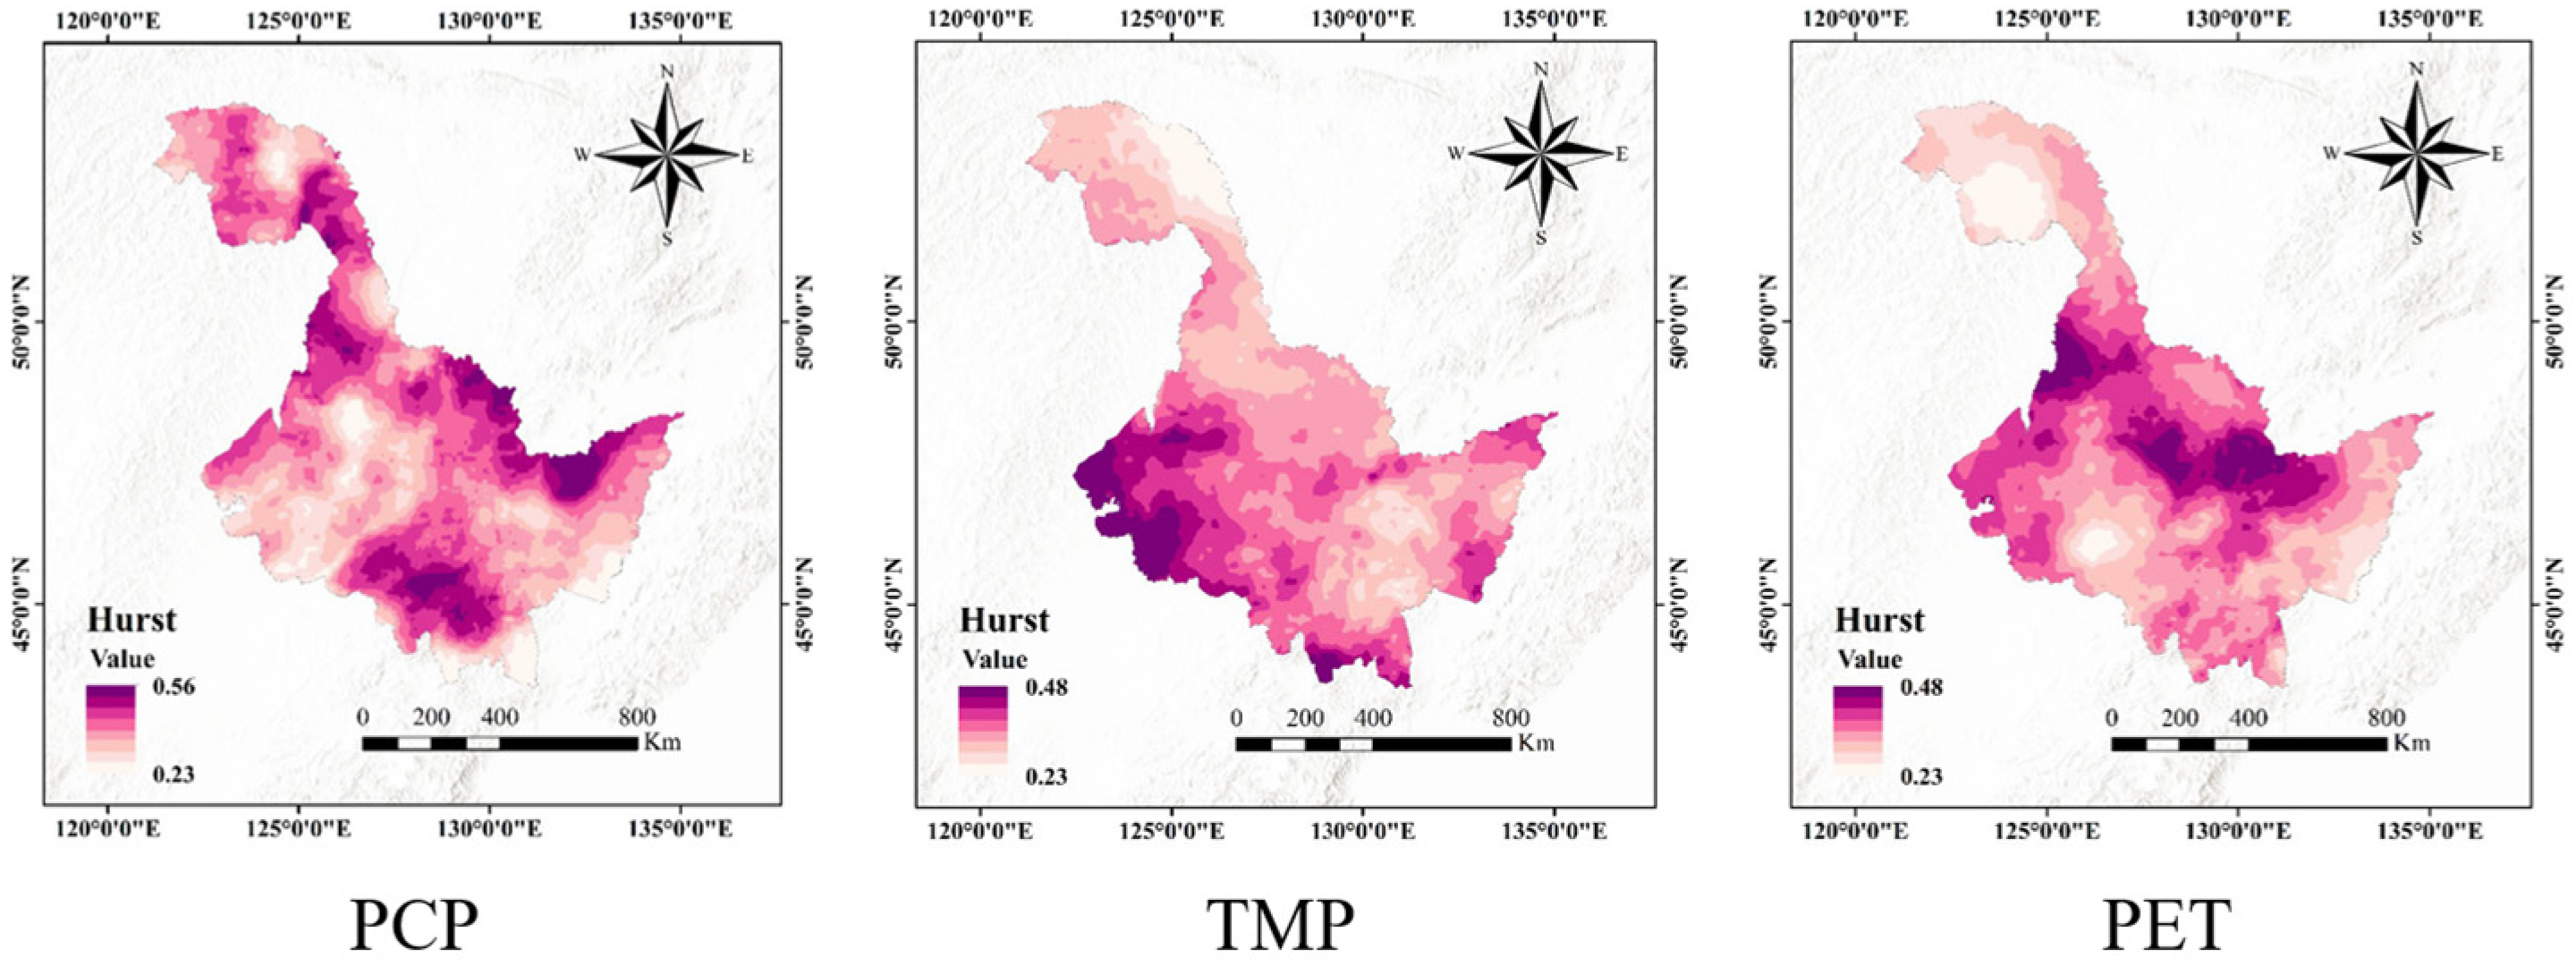
The rescaled range (R/S) analysis was employed to estimate the Hurst exponent (H) for characterizing time-series persistence (Figure 6). PCP (H ranging from 0.23 to 0.56 ) uniquely exhibited localized persistence (H > 0.5) in the south-central and eastern regions, whereas the northern, northwestern (Greater Khingan Mountains), and western margins displayed anti-persistence or stochastic fluctuations. Conversely, TMP (H: 0.23 to 0.48 ) demonstrated pervasive anti-persistent characteristics across the entire study area (with the regional maximum remaining below 0.5), indicating that historical warming trends risk fluctuating reversals, particularly in the highly unpredictable northern and northwestern high-latitude regions. Similarly, PET (H: 0.23 to 0.48 , all below 0.5) also entered a robust anti-persistent trajectory province-wide, with relatively higher values clustered in the central and mid-western portions. Overall, while PCP maintains trend continuation capacity in the central and eastern sectors, both regional thermal conditions and evaporative demand face profound anti-persistent evolutionary risks.

3.1.4. Periodicity

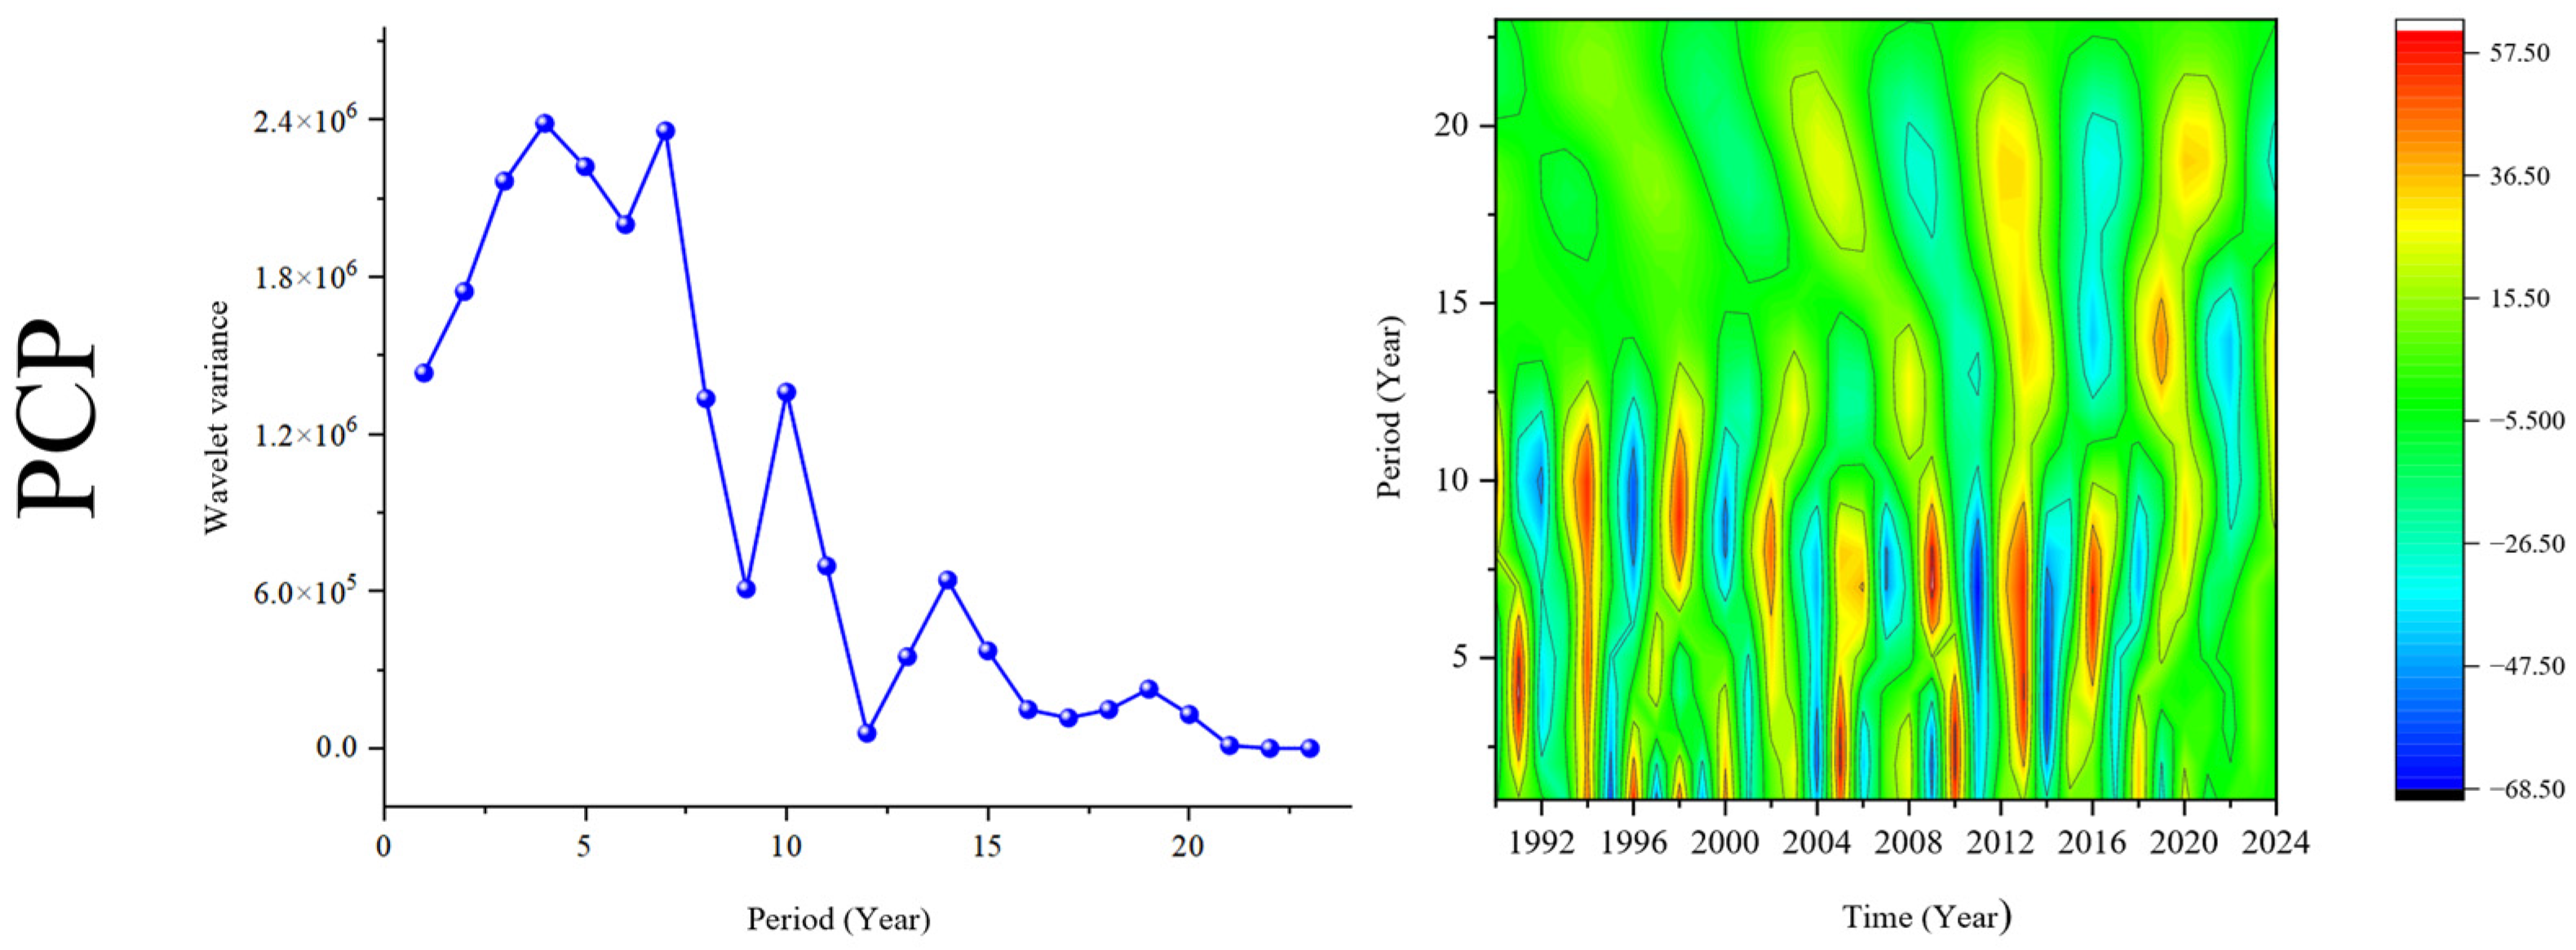
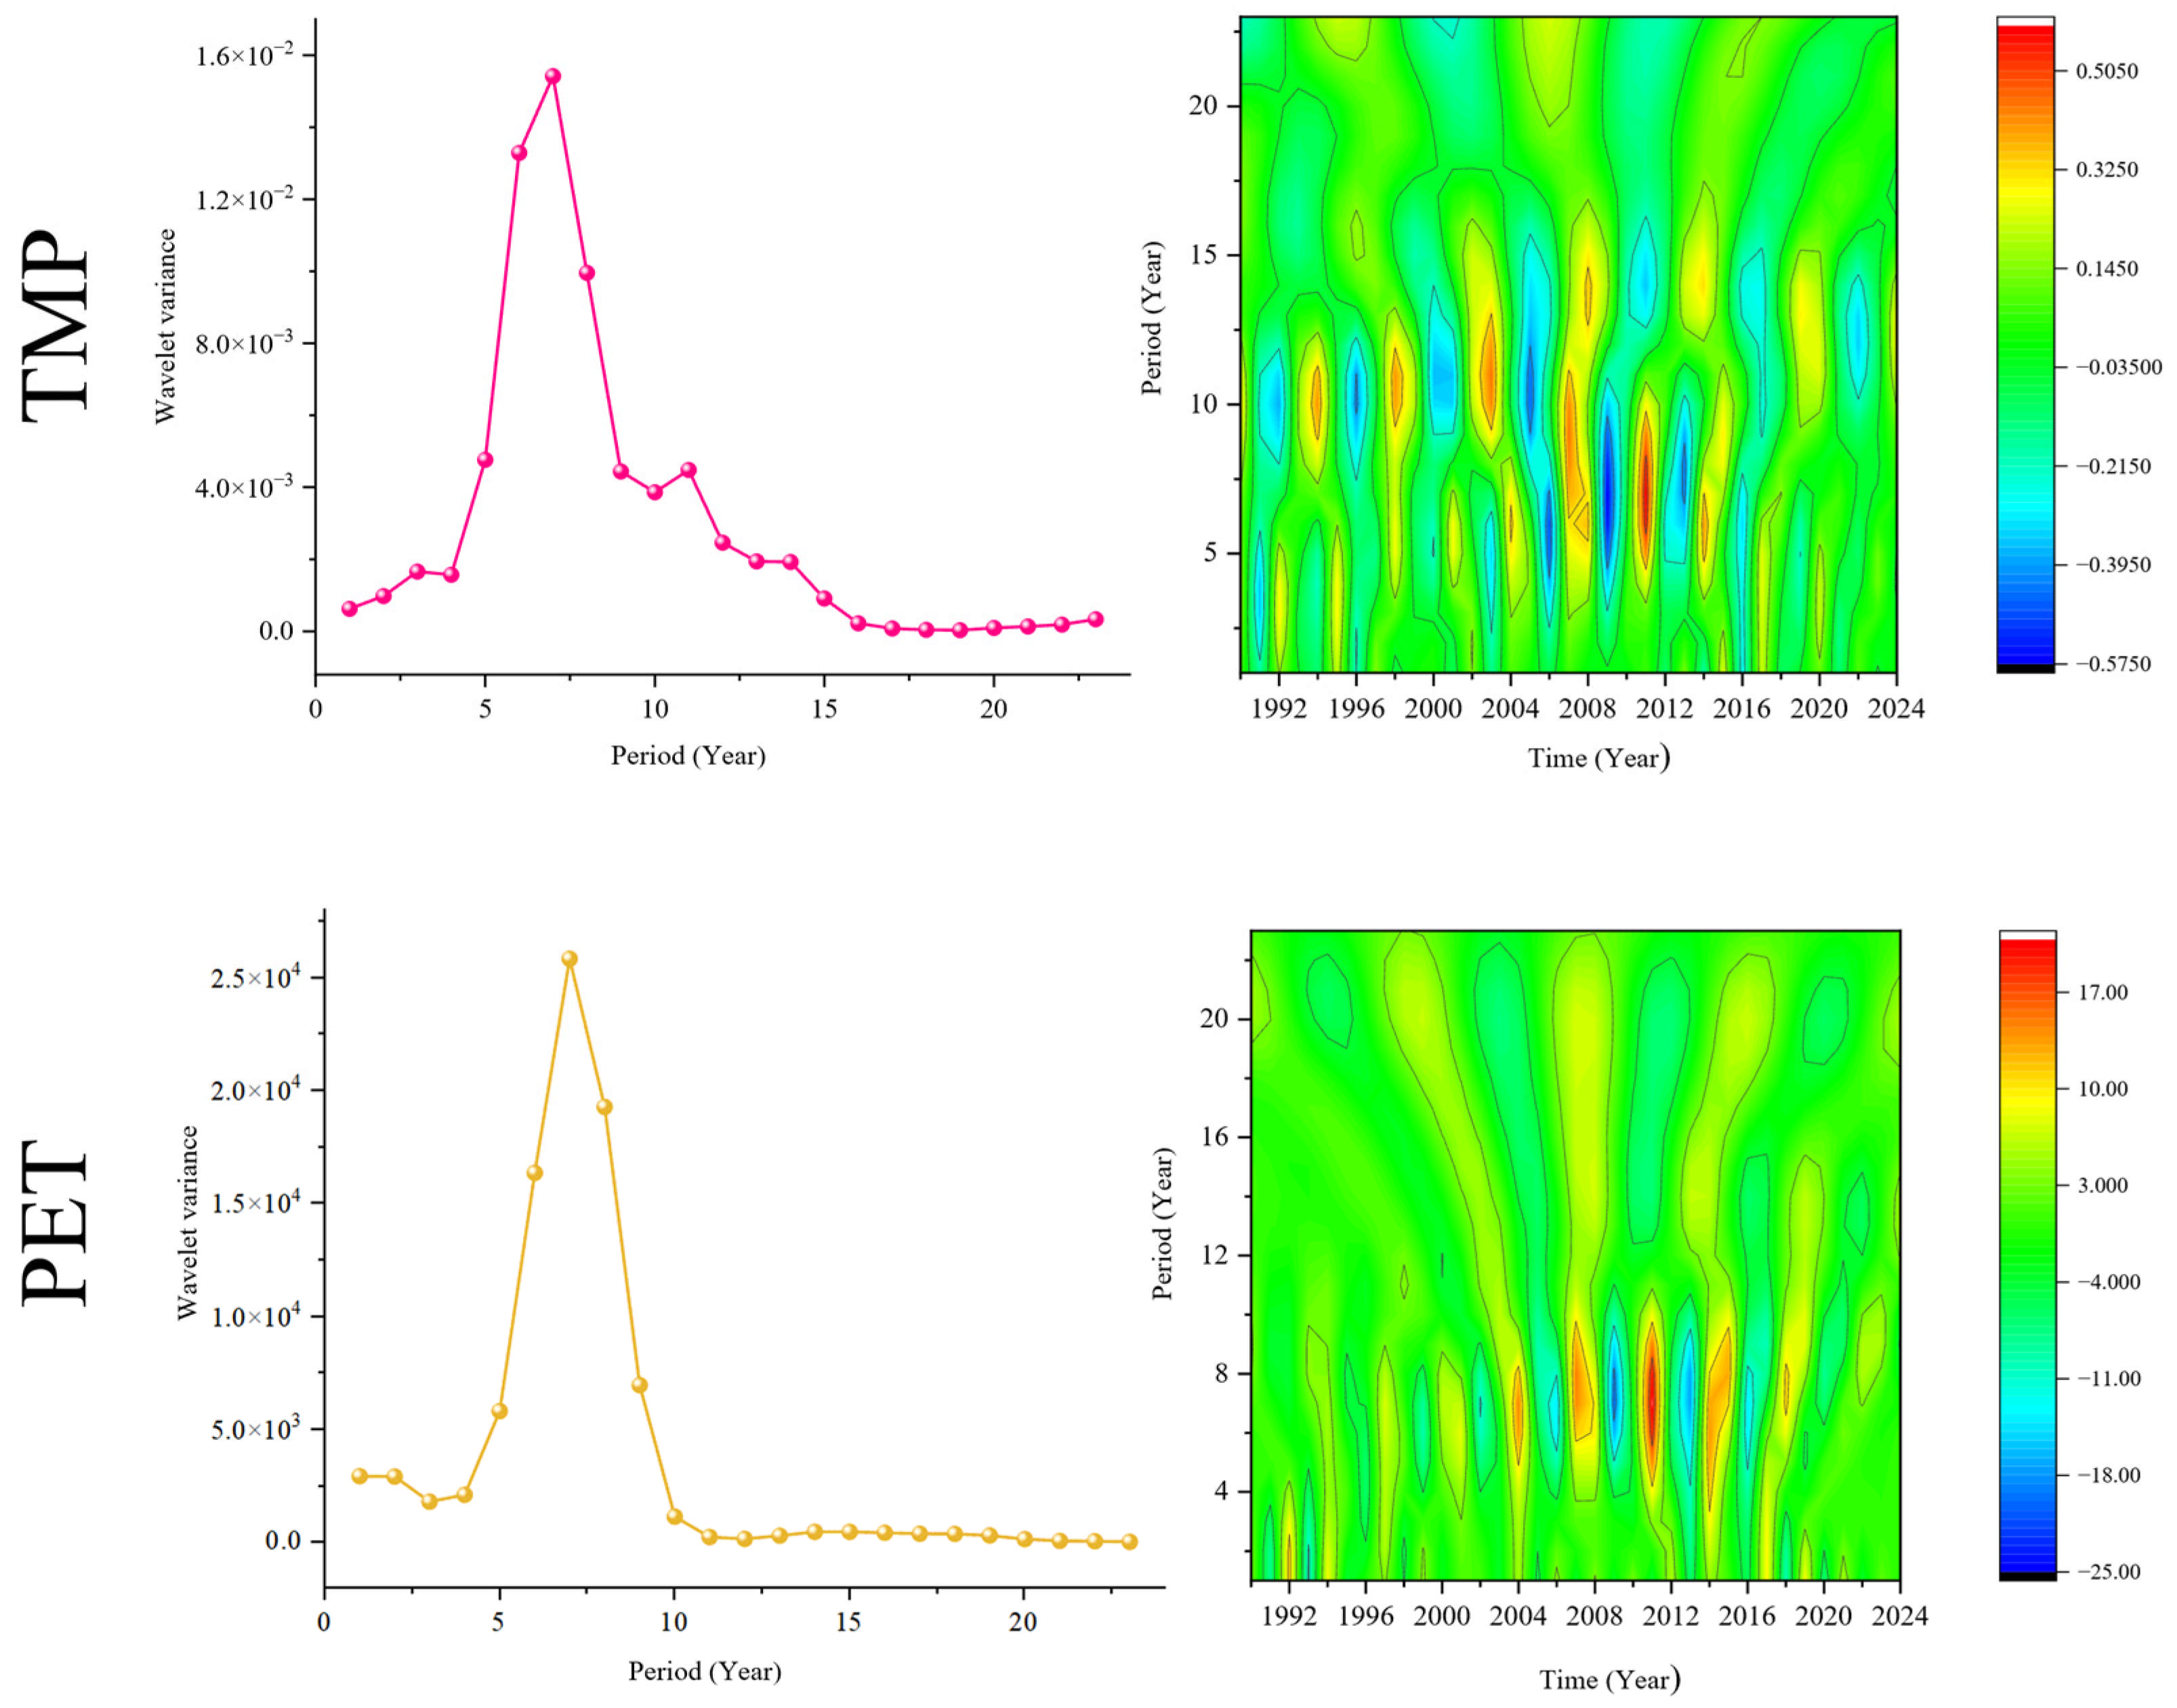
The real-part contour maps of wavelet coefficients and the corresponding wavelet variance plots, derived from the Continuous Wavelet Transform of meteorological factors in the study area (Figure 7), clearly elucidate the multi-scale periodic oscillation characteristics and energy distribution patterns within the time series.
Overall, PCP, TMP, and PET all exhibit pronounced interannual-scale fluctuations; however, substantial inter-variable differences exist regarding their energy distribution structures and temporally active intervals. Specifically, PCP, acting as the proxy for moisture supply, presents complex multi-scale nested features. Its time–frequency domain is characterized by frequent alternating positive and negative phase oscillations throughout the entire study period (1992–2024). These oscillations are primarily concentrated within two frequency bands: a short-term period range of 3–8 years and a medium- to long-term period range of 10–14 years (with the latter being particularly pronounced between 2004 and 2016). The corresponding wavelet variance curve displays a distinct “bimodal” morphology. The primary dominant period is distributed across a broad frequency band range of 4–7 years, while a significant secondary dominant period emerges at a range of 10–12 years, indicating a relatively dispersed energy distribution.
In stark contrast, TMP and PET—representing thermal conditions and atmospheric evaporative demand, respectively—exhibit exceptionally strong periodic singularity and evolutionary continuity. The robust oscillation signals of TMP are highly localized within the 5–9-year temporal scale, with this regular and intense oscillatory behavior being particularly concentrated in the 1996–2016 interval. Meanwhile, the strong oscillations of PET remain stable within the 4–8-year frequency band, and its high-contrast alternating positive and negative phases propagate continuously throughout the entire study period (1992–2024). Furthermore, the wavelet variance curves for both variables present an extremely sharp “unimodal” structure, with the maximum energy peaks precisely and consistently aligned at approximately 7 years.
This implies that during the long-term evolution of the regional climate system, TMP and PET are dominantly controlled by a short-to-medium period of approximately 7 years, demonstrating robust periodic stability. Conversely, PCP is synergistically modulated by multiple overlapping periodicities, resulting in a markedly more complex interannual fluctuation rhythm.

3.2. Characteristics of NDVI Variations

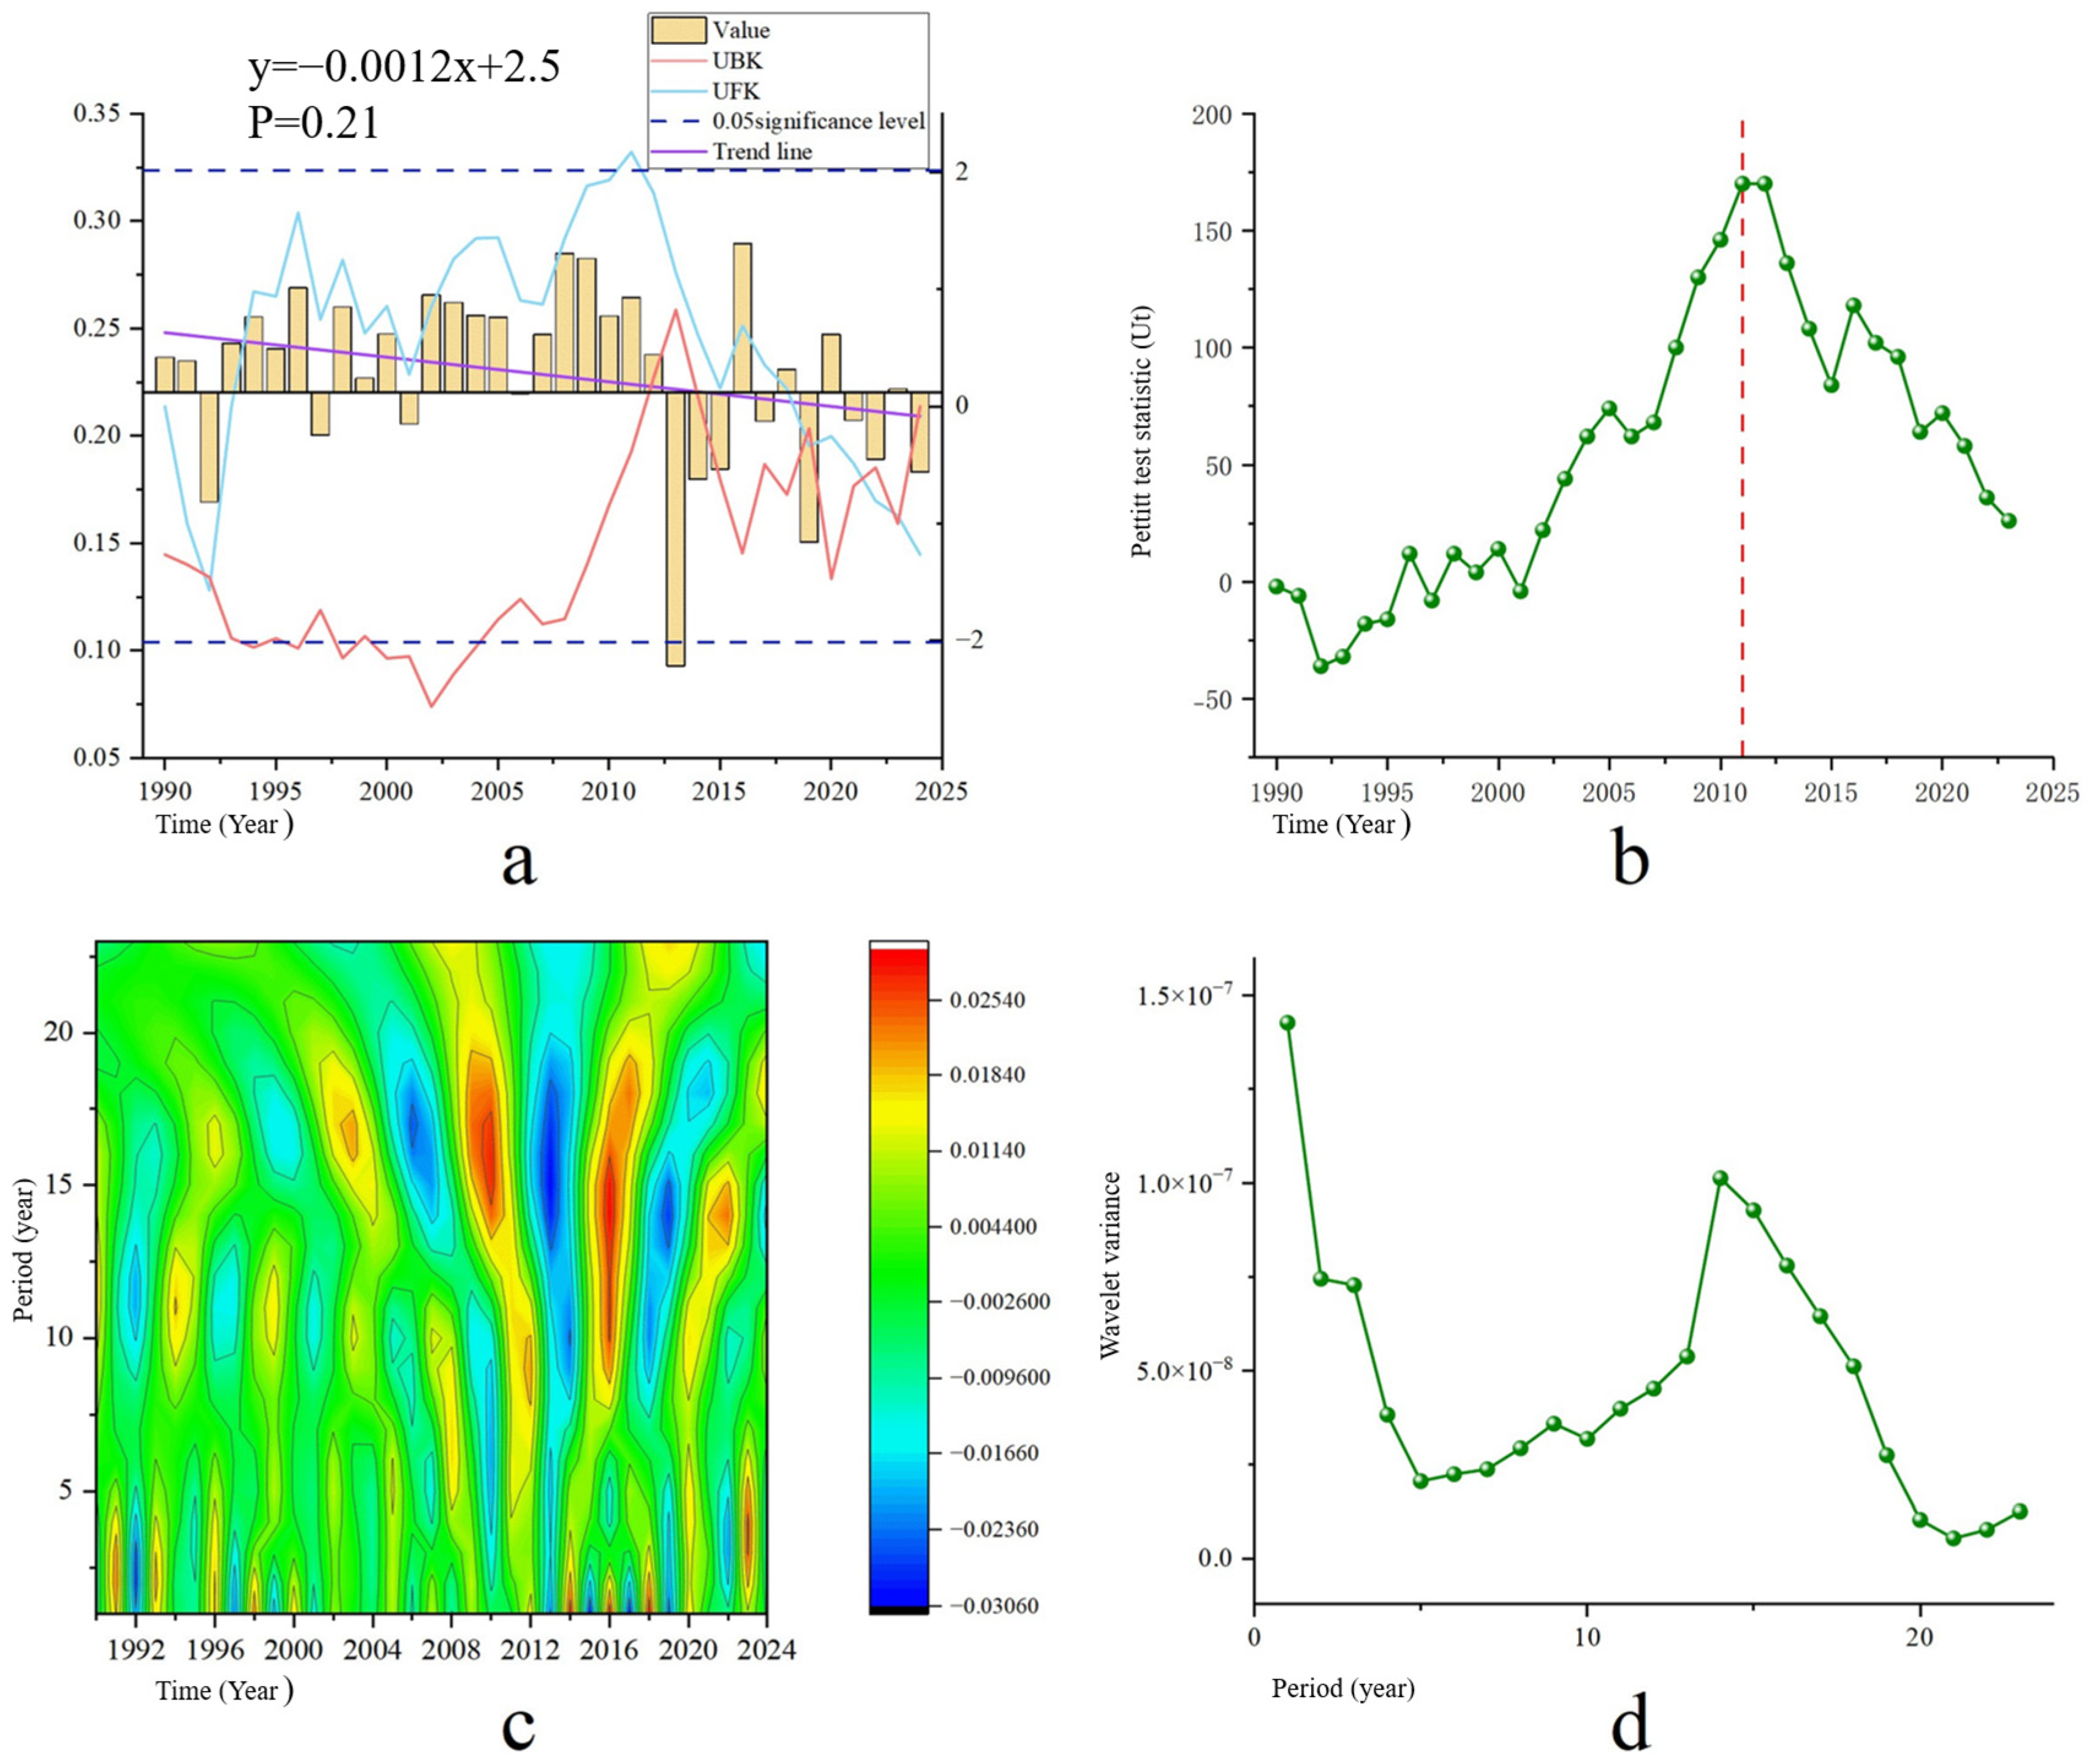
(1) Based on the Theil–Sen Median trend (Figure 8a) and the Mann–Kendall test results (Figure 9a), the overall trend slope of the NDVI in the study area from 1990 to 2024 was −0.0012 yr−1, with a p -value of 0.21 (exceeding the 0.05 significance threshold). This indicates that over the 35-year study period, the regional NDVI exhibited an overall non-significant, slight declining trend. However, intense phased fluctuations were embedded within the time series. An observation of the U F curve from the MK test (Figure 8a) reveals that during the 1990s, the U F values were predominantly above the zero line, displaying a slight oscillatory upward trend. Around the year 2000, the curve retreated to near the zero line, followed by a rapid ascent, forcefully breaking through the upper 0.05 significance limit (the + 1.96 critical threshold) between 2011 and 2013. Subsequently, the U F curve experienced a precipitous drop, falling below the zero line. To precisely capture the turning point of this phased reversal, the Pettitt abrupt change test (Figure 9b) provides a definitive answer: the statistic curve reached its maximum peak in 2011. This highly significant breakpoint constitutes the core watershed of the temporal NDVI evolution, precisely dividing the entire study period into an “oscillatory climbing phase prior to 2011” and a “rapid declining phase post-2011.”
(2) Regarding the spatial distribution pattern, the Theil–Sen Median trend map (Figure 8a, with variations ranging from 0.025 to 0.022 ) reveals pronounced spatial heterogeneity in NDVI dynamics. The majority of the study area is covered in dark green, representing a positive trend. This greenness is particularly dense in the northwestern and central core regions, indicating that vegetation coverage in these areas has achieved the most significant improvement and restoration over the past 35 years. In contrast, the light-colored or white regions, which represent negative growth or no obvious change, are primarily scattered sporadically across the southwestern plains and eastern marginal zones. The overall spatial evolution manifests a non-equilibrium state characterized by “widespread improvement alongside localized degradation.”
(3) The Hurst exponent, calculated based on the rescaled range (R/S) analysis (Figure 8b, with values ranging from 0.049 to 0.92 ), provides a panoramic view of the future continuation capacity of the NDVI evolutionary trends. The regional color scheme is dominated by medium-to-high purplish-red hues, signifying that vegetation dynamics in most areas possess positive persistence ( H > 0.5 ); namely, the favorable vegetation growth conditions are highly likely to persist. Examining the spatial details, the south-central and southeastern regions are colored deep purple with high Hurst exponents, demonstrating exceptionally strong ecological evolutionary stability and inertia. Conversely, localized areas in the northern and western margins exhibit lighter colors (pink or near-white, with H values approaching or below 0.5 ). This indicates that the persistence of vegetation evolution in these regions is relatively weak, characterized by strong stochasticity and the potential risk of trend reversals or unpredictable fluctuations. Comprehensively, the spatial stability of vegetation evolution in the study area presents a pattern of being robust in the south-central regions and fragile in the northern regions.
(4) Furthermore, combining the Continuous Wavelet Transform (Figure 9c) and wavelet variance (Figure 9d) successfully reveals the frequency-domain patterns of the NDVI time-series evolution. The wavelet variance plot in Figure 9d illustrates that the energy distribution features an extremely prominent primary peak precisely localized within the 14–15-year frequency band, thereby establishing the 14–15-year period as the first dominant periodicity of NDVI evolution in the study area. In the real-part contour map of wavelet coefficients (Figure 9c), the time–frequency energy centers (warm-colored high-value regions) corresponding to this dominant periodicity are densely concentrated in the 2008–2016 interval. This temporal span perfectly coincides with the “severe abrupt change period in 2011” identified by the aforementioned MK and Pettitt tests, profoundly demonstrating that the vegetation system underwent its most intense non-stationary oscillation during this specific phase.

3.3. Wavelet Coherence Analysis Between Meteorological Factors and NDVI

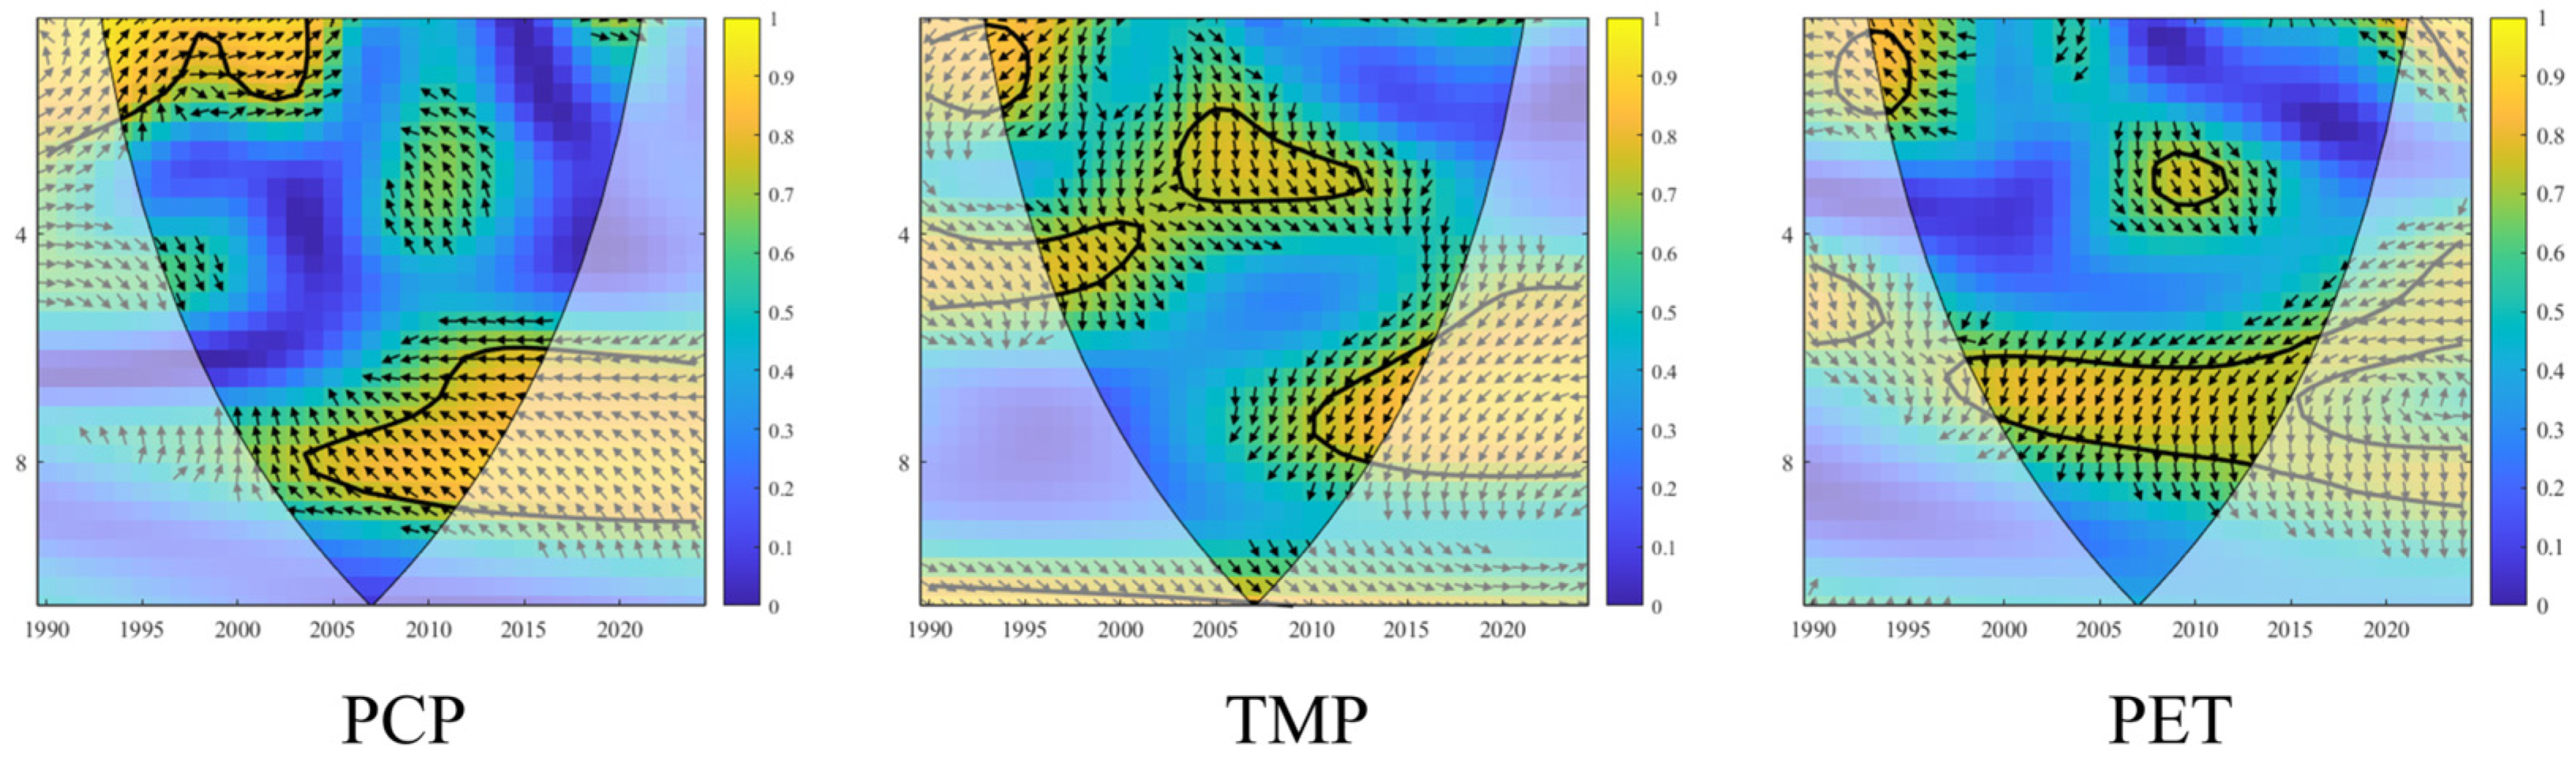
To investigate the periodic regulatory mechanisms of meteorological factors on vegetation dynamics within the study area, this research employed Wavelet Transform Coherence to analyze the relationships between NDVI and PCP, TMP, and PET (Figure 10). Overall, the NDVI and the respective meteorological factors exhibited significant coherence across various temporal and periodic scales, accompanied by distinct inter-variable differences.
The results indicate that the coherence between PCP and NDVI was primarily concentrated within short-term and medium-to-long-term periodic scales. In the medium-to-long-term periodic band (6–9 years, 2003–2013), a substantially large area of extremely high coherence existed between PCP and NDVI, exhibiting a pronounced leading characteristic (with arrows predominantly pointing down and right). This demonstrates that PCP variations temporally preceded the vegetation response, reflecting the direct driving effect of moisture supply on terrestrial vegetation growth. Simultaneously, within the short-term periodic band (1–3 years, 1995–2010), PCP also demonstrated a certain in-phase synchronous or leading positive correlation with the NDVI.
Conversely, TMP exhibited a distinctly different, patch-like dispersed pattern compared to the other meteorological factors. In the short-to-medium-term periodic band (3–5 years, 2005–2015), TMP maintained a relatively stable in-phase positive correlation with the NDVI (arrows pointing horizontally to the right). However, in the medium-to-long-term periodic band, the coherence relationship manifested significant anti-phase characteristics: during the 4–6-year period from 1990 to 1998, and the 6–9-year period from 2008 to 2016, significant negative correlations or anti-phase leading signals emerged (arrows pointing up and left or down and left). This indicates that the multi-scale characteristics of TMP fluctuations exerted complex, phased impacts on vegetation dynamics. Additionally, sporadic positive coherence was observed in the 1–3-year short-term period (1990–1996).
Meanwhile, PET displayed the most concentrated and continuous high-coherence band over the long time series. In the medium-term periodic band (5–8 years, 1998–2013), an extremely significant, large-scale closed area of high coherence existed between PET and NDVI, exhibiting clear anti-phase leading or anti-phase synchronous relationships (arrows predominantly pointing horizontally left or down and left). This implies that mid-term evapotranspirative water and heat consumption exerted a strong inverse regulatory effect on vegetation evolution. Furthermore, within localized short-term periodic ranges (e.g., the 1–3-year period from 1992 to 1996, and the 3–5-year period from 2008 to 2014), PET and NDVI also exhibited certain in-phase leading signals.
In summary, a distinct time–frequency regulatory relationship exists between NDVI and meteorological factors in the study area: PCP acts as a significant in-phase leading driving factor across various scales; PET possesses a robust anti-phase concentrated regulatory characteristic within the medium-term period; while the impact scales of TMP on the NDVI are the most dispersed, characterized by an alternation between short-to-medium-term in-phase synchronization and medium-to-long-term anti-phase fluctuations.

4. Discussion

Distinct from traditional time-series paradigms, this study integrates spatiotemporal and multi-scale analyses to elucidate the complex driving mechanisms of meteorological factors (PCP, TMP, and PET) on high-latitude vegetation dynamics (NDVI). Specifically, TMP predominantly regulates vegetation phenological rhythms under global warming, while PCP distribution directly dictates the intensity and spatial pattern of vegetation improvement.
Accordingly, this discussion first examines the spatiotemporal evolution, periodicities, and abrupt changes in key meteorological factors and the NDVI. Subsequently, Wavelet Transform Coherence (WTC) and partial correlation are employed to precisely identify the multi-scale climatic drivers governing vegetation evolution. These findings significantly deepen the understanding of coupled climate–ecosystem dynamics in high latitudes, providing crucial theoretical support for regional ecological barrier construction, smart agriculture, and sustainable resource management [54,55,56].

4.1. Analysis of the Variation Characteristics of Meteorological Factors in Heilongjiang Province

Situated in the high-latitude monsoon region on the eastern margin of the Eurasian continent, the study area represents a typical ecologically sensitive zone in China. As emphasized in the IPCC AR6 Synthesis Report [57], such high-latitude ecosystems face unprecedented and potentially irreversible changes under anthropogenic climate forcing [58,59]. Driven by this macro-background, regional hydrothermal patterns have undergone pronounced reorganization, with TMP, PCP, and PET exhibiting highly asynchronous variations in their spatiotemporal and periodic structures.
Specifically, from 1990 to 2024, regional TMP exhibited a significant upward trend with a warming rate of 0.021 ° C/a, substantially exceeding the global average. This amplified warming aligns with the IPCC consensus on high-latitude climate hazards [60], and is largely driven by the ice–albedo positive feedback mechanism, where the melting of snow and permafrost accelerates regional warming, particularly in the Greater Khingan Mountains [60,61].
From a frequency-domain perspective, TMP evolution demonstrated a stable dominant periodicity of approximately 7 years and experienced a pronounced abrupt change around 2013. This periodic structure is highly consistent with the decadal fluctuations in the East Asian Winter Monsoon and the anomalies of the Pacific Decadal Oscillation (PDO), which significantly regulate heat transport processes and trigger phased regional TMP anomalies in Northeast China [62,63].
Notably, the Hurst exponent results for TMP revealed pervasive “anti-persistent” characteristics across the region (maximum H = 0.48 ). This implies that the historical warming trend is highly susceptible to stochastic reversals or slowed growth, signaling a decline in the internal stability of the high-latitude climate system and an amplified risk of extreme fluctuations [64]. Such thermal uncertainty not only poses severe threats to agricultural security but also exacerbates ecological risks, including permafrost degradation and disrupted vegetation rhythms [61,65]. Ultimately, the regional climate system is transitioning from “continuous warming” to “enhanced volatility,” presenting novel challenges for sustainable ecological and agricultural management.
In contrast, regional PCP exhibits a nonlinear recovery and pronounced spatial heterogeneity. Although overall annual PCP increased slowly (approximately 2.6 mm/a), this non-significant trend underscores strong uncertainty in moisture supply [66,67]. Following a markedly dry phase (2000–2005) and a structural abrupt change in the 2011 PCP trough, the region transitioned into a gradual wetting trend. This nonlinear evolution, modulated by nested 4–7- and 10–12-year periodicities, reflects the complex superimposed influences of the East Asian Summer Monsoon, ENSO, PDO, and Northeast Cold Vortex activities [15,64,68,69].
Spatially, the central and south-central regions exhibit an increasing PCP trend with strong continuation capacity ( H > 0.5 ) [23], fostering NDVI increases and ecosystem restoration. Conversely, the northwestern Greater Khingan Mountains face a negative, anti-persistent growth trend, implying sustained drought stress and heightened ecological vulnerability [14,65]. Therefore, this spatial disequilibrium in water resource allocation constitutes the core physical background driving the heterogeneous evolution of regional vegetation.
PET serves as a crucial nexus linking the water cycle and energy balance. From 1990 to 2024, regional PET exhibited a weak declining trend, peaking around 2008 before fluctuating downward. This aligns with the global “Evaporation Paradox,” where PET decreases despite continuous warming, likely driven by weakened wind speeds, reduced solar radiation, and increased humidity [70,71].
Temporally, PET and TMP share a stable 7-year periodicity, indicating that regional thermal conditions—modulated by decadal atmospheric circulation anomalies and the East Asian monsoon—remain the core drivers of PET variations [72,73].
Spatially, however, PET exhibits a pronounced “north-south polarization”. In the north (e.g., Greater Khingan Mountains), intense warming, permafrost degradation, and extended growing seasons have significantly enhanced evaporative demand [14,61]. Conversely, the south-central region shows a significant PET decline, which synergizes with increased PCP to create a “moistening” environment conducive to vegetation restoration and agricultural production [66]. Ultimately, this spatial disparity reflects a transition in the regional climate system from a singular warming-driven mechanism to an “asynchronous hydrothermal restructuring”. The resulting dichotomy—characterized by heat-driven drying in the north and moisture-driven greening in the south-central region—exacerbates spatial ecological heterogeneity and will persistently dictate future regional vegetation dynamics and ecosystem stability [9,65].
In summary, the climate system in the study area is undergoing a drastic restructuring with asynchronous elements: the abrupt change nodes for TMP, PCP, and evapotranspiration are distributed across distinctly different years (2013, 2011, and 2008, respectively). The asynchrony and spatial differentiation of these hydrothermal factors in responding to climate change dictate that vegetation dynamics in this region are by no means a simple linear response to a single climatic factor. Instead, they represent a comprehensive ecological adaptation to this intricate, north-south polarized regional hydrothermal configuration. Aligning with the urgent warnings of the IPCC AR6 Synthesis Report, this intricate climate–ecology restructuring underscores the necessity for integrated, climate-resilient adaptation strategies to safeguard both fragile ecosystems and cold regions engineering infrastructure against compounding future risks.

4.2. Analysis of the Variation Characteristics of NDVI

Vegetation serves as a highly sensitive indicator of eco-climatic responses in high-latitude regions [74,75]. From 1990 to 2024, the regional NDVI exhibited a slight, non-significant declining trend (slope = −0.0012 yr−1), which masked intense, non-stationary ecological fluctuations. Both the Mann–Kendall and Pettitt tests identified 2011 as a critical structural breakpoint: vegetation experienced an oscillatory upward trend that peaked between 2011 and 2013, followed by a rapid, phased recession [58].
Notably, this ecological turning point in 2011 perfectly synchronized with the regional PCP trough. This demonstrates that extreme shifts in moisture supply—rather than thermal conditions—act as the primary trigger for ecosystem abrupt changes in the Northeast region [14,67]. In these semi-humid to semi-arid transitional zones, abrupt PCP drops rapidly deplete soil moisture and inhibit photosynthetic capacity, severely weakening overall ecosystem stability [66]. Consequently, the 2011 NDVI reversal essentially reflects a profound restructuring of the regional hydrothermal balance.
Furthermore, high-latitude ecosystems exhibit distinct “threshold effects,” rapidly undergoing structural changes when climatic variations exceed their adaptive capacity [64]. In this cold–temperate monsoon zone, vegetation is dually constrained by TMP and moisture [60]. Under global warming, although rising temperatures prolong the growing season, a lack of synchronous PCP exacerbates evapotranspirative water stress, driving the ecosystem from restoration into degradation [61].
Consequently, the non-stationary NDVI evolution over the past 35 years—epitomized by the 2011 ecological transition—proves that vegetation dynamics are not simple linear responses to single climatic factors. Rather, they are the comprehensive outcome of complex synergistic interactions between regional hydrothermal restructuring and inherent ecological vulnerability.
Frequency-domain analysis reveals a prominent 14–15-year dominant periodicity for the NDVI. This creates a pronounced scale mismatch with the shorter periodicities of PCP (4–7 and 10–12 years) and TMP/PET (~7 years), indicating that vegetation dynamics do not linearly track single meteorological factors [15,29]. Instead, this low-frequency NDVI signal reflects the ecosystem’s inherent lag effect and internal buffering mechanisms in response to decadal climatic oscillations (e.g., ENSO, PDO) [62,64,68].
Furthermore, NDVI time–frequency energy was highly concentrated between 2008 and 2016, coinciding perfectly with the structural abrupt changes in regional hydrothermal factors (particularly the 2011 ecological transition). This temporal overlap signifies an intense “resonance effect”: synchronous peak climatic forcings—simultaneously altering the growing season, soil moisture, and evapotranspiration—triggered an ecosystem response far exceeding the linear superposition of individual factors [59,65].
The multi-scale periodicities, lagged responses, and energy resonance of the NDVI highlight the complex low-frequency modulatory behaviors of high-latitude ecosystems under long-term climatic forcing, providing a theoretical basis for frequency-domain-based ecological predictions.
Spatially, vegetation dynamics (1990–2024) exhibited a non-equilibrium pattern of “widespread improvement alongside localized degradation,” reflecting the synergistic impacts of varying hydrothermal conditions and human activities [59]. The most significant vegetation improvements occurred in two distinct zones driven by entirely different mechanisms: In the northwestern Greater Khingan Mountains, ecological restoration was strongly warming-driven. Rising temperatures prolonged the growing season and improved soil thermal conditions via permafrost degradation and earlier snowmelt, manifesting a typical high-latitude “greening” trend [14,60,61]. Conversely, improvement in the central core region was moisture-driven. This area benefited from a favorable configuration of increased PCP and weakened PET, which effectively alleviated water constraints and promoted continuous vegetation growth [72].
Existing studies suggest that in the semi-humid regions of Northeast China, vegetation changes exhibit high sensitivity to moisture conditions; when PCP increases and evapotranspiration decreases, the restorative capacity of the ecosystem will be significantly enhanced [29]. However, localized degradation occurred in the southwestern Songnen Plain and eastern margins. This spatial disparity is primarily driven by the coupling of high-intensity agricultural disturbances (e.g., land reclamation, irrigation consumption) [66] and localized water stress exacerbated by rising TMP [58,67]. Ultimately, this spatial evolution pattern reflects a complex synergy of climate and human activities: “warming-driven” restoration in the north, “moisture-driven” improvement in the center, and agriculture/water-stress-induced degradation in specific locales.
The spatial evolution pattern of vegetation in the study area profoundly reflects the comprehensive impacts of regional hydrothermal differences and human activity disturbances. Specifically, the high-latitude northern regions primarily exhibit “warming-driven” vegetation restoration, while the central regions demonstrate “moisture-improved” ecological restoration characteristics; conversely, areas with intense agricultural activities and fragile moisture conditions are more prone to vegetation degradation. This illustrates that vegetation changes in high-latitude regions are essentially a complex ecological response process under the synergistic interactions of the climate system and human activities.
Furthermore, although the Hurst exponent indicates an overall positive persistence for the regional NDVI ( H > 0.5 ) [23], its spatial stability is distinctly dichotomous: “stable in the south-central and fragile in the north.” This highlights that, despite the overarching greening trend, substantial spatial disparities in future ecological risks still persist within the high-latitude vegetation system.
From the perspective of spatial patterns, the south-central and southeastern regions not only currently maintain favorable vegetation coverage conditions, but their Hurst exponents are also significantly higher, indicating that vegetation evolution in these areas possesses strong inertia and long-term stability. This is primarily and closely related to the relatively sufficient PCP conditions, lower evapotranspirative consumption, and higher ecological restorative capacity in the region [72]. Previous studies have pointed out that in regions with synergistically improved hydrothermal conditions, vegetation systems can generally maintain relatively stable ecological feedback mechanisms, thereby exhibiting a strong and continuous “Greening” trend [14]. However, compared to the south-central regions, the extreme northern parts of the study area, particularly the northern Greater Khingan Mountains and the western marginal areas, have Hurst exponents approaching or even falling below 0.5, despite exhibiting a clear vegetation improvement trend over the past 35 years. This indicates strong stochasticity and uncertainty in their future evolution. This implies that the ecological foundation of the current vegetation “Greening” phenomenon in these northern high-latitude regions is unstable; its improvement trend may rely more on short-term climate warming drivers, lacking long-term stable ecological support [29]. Existing studies suggest that high-latitude ecosystems are extremely sensitive to climate change; when warming exceeds the ecological adaptation threshold, vegetation may rapidly transition from a restoration phase to a degradation phase [60].
Notably, as previously discovered in this study, the overall TMP variations in the study area exhibit pronounced “anti-persistent” characteristics ( H < 0.5 ), which means there is a substantial risk of fluctuating reversals in future regional thermal conditions. In this context, once the future climate system experiences phased cooling, an increase in extreme low-TMP events, or a deterioration in regional moisture supply, the vegetation in the sensitive northern high-latitude zones may face significant degradation risks [67]. Especially under the background of permafrost degradation, the inherent stability of high-latitude ecosystems has already been weakened, and localized areas may even experience enhanced ecological vulnerability due to soil moisture imbalances and the destruction of surface ecological structures [61]. Furthermore, recent studies concerning Arctic Amplification point out that changes in high-latitude climate systems often possess stronger uncertainty and nonlinear characteristics [76]. Although short-term warming may promote vegetation growth, in the long run, if the frequency of extreme climate events continues to increase, it may further undermine vegetation stability by exacerbating droughts, abnormal freeze–thaw cycles, and ecological disturbances [64]. Therefore, the high-latitude marginal regions, such as the northern Greater Khingan Mountains, are highly likely to become one of the most sensitive areas to future ecological risks within the study area.
Overall, although the vegetation dynamics in the study area exhibit an overall improving trend, the ecosystems in the northern high-latitude cold regions still demonstrate pronounced vulnerability to continuous climate change. Particularly in the context of “anti-persistent” risks within the regional climate system, the current vegetation greening trend does not signify a stable restoration of ecological resilience. Under the non-stationary evolution of the future climate, long-term monitoring of vegetation dynamics, permafrost changes, and extreme climate events in the northern marginal regions should be critically strengthened. This is imperative to improve regional ecological security early-warning systems and adaptive management capabilities against unforeseen climatic shocks.

4.3. The Impact of Meteorological Factors on NDVI

High-latitude ecosystems are extremely sensitive to climate change, among which meteorological factors act as the most direct and core natural driving sources governing vegetation dynamic evolution. While TMP and PET strongly influence vegetation dynamics, PCP remains the paramount driver governing regional ecological stability [60].
The research results reveal a significant positive coherence between PCP and NDVI. Their frequency-domain coherence spans short-term (1–3 years) and medium-to-long-term (6–9 years) scales. Particularly at the medium-to-long-term scale, the two formed an extensive and stable high-coherence zone, exhibiting a pronounced in-phase leading characteristic of PCP. This indicates that regional PCP variations not only directly affect the vegetation moisture supply but also exert a continuous, lagged regulatory effect on vegetation dynamics [15]. Previous studies have pointed out that in semi-humid and cold–temperate regions, vegetation growth exhibits a significant response lag to PCP changes. Especially at medium-to-long-term scales, PCP further regulates the vegetation growth state by influencing soil moisture storage, freeze–thaw processes, and surface eco-hydrological cycles [29]. From the perspective of ecological dynamics, PCP essentially determines whether the vegetation ecosystem can maintain its fundamental moisture threshold. When PCP increases, the effective soil water content rises, plant photosynthesis is enhanced, and both the Leaf Area Index and Net Primary Productivity increase synchronously, thereby driving the increase in the NDVI [14]. Conversely, insufficient or persistently low regional PCP easily exacerbates soil droughts and vegetation water stress, further inhibiting vegetation growth [67]. This mechanism is particularly pronounced in high-latitude cold regions, as the relatively short growing season makes vegetation highly dependent on effective moisture supply [61].
Regarding the spatial pattern, this study found that PCP in the central and south-central regions exhibited a significant increasing trend, which is highly consistent with the widespread improvement of the NDVI in these areas. Previous studies suggest that the recent “warming and moistening” trend in Northeast China has effectively improved regional eco-hydrothermal conditions and significantly promoted vegetation restoration [66]. Particularly in the south-central regions, the increase in PCP and the decrease in PET have formed a synergistic effect of “enhanced moisture recharge and weakened moisture consumption,” which effectively alleviates moisture constraints during the vigorous vegetation growth period, providing a critical ecological foundation for sustained regional vegetation restoration [72].
Furthermore, the WTC analysis reveals that the relationship between PCP and NDVI is not a simple linear synchronization but instead exhibits distinct characteristics of multi-scale resonance and phased enhancement. Notably, between 2008 and 2016, the high-coherence energy of both variables intensified significantly. This highly coincides with the previously identified regional ecological abrupt change phase, indicating that the driving effect of climatic forcing on vegetation dynamics reached its peak during this period [64]. This phenomenon demonstrates that vegetation systems in high-latitude regions not only possess high sensitivity to PCP changes but also feature a distinct systematic amplified response mechanism. This study further confirms that PCP is one of the most critical natural driving factors for NDVI variations in the study area. By regulating soil moisture supply, eco-hydrological cycles, and vegetation physiological processes, regional PCP changes exert profound impacts on the stability of high-latitude ecosystems. Therefore, under the context of global climate change, the future evolution of regional PCP patterns and changes in extreme hydrological events will become pivotal factors affecting the ecological security and vegetation restoration capacity of the region.
In contrast to the singular positive driving effect of PCP on vegetation dynamics, the impact of TMP on the NDVI in the study area exhibits strong scale-dependent differentiation and nonlinear response characteristics. Based on the Wavelet Transform Coherence analysis results, in the short-to-medium-term periodic band (approximately 3–5 years), TMP and NDVI demonstrate a stable positive correlation. This is primarily because the study area, as a typical high-latitude cold region, has its growing season significantly constrained by low temperatures. Warming can advance snowmelt, elevate surface soil temperatures, and prolong the progression of the vegetation-growing season, thereby effectively promoting the onset of vegetation phenology and enhancing photosynthetic activity [74]. Previous studies have pointed out that the “Greening” trend of high-latitude vegetation largely benefits from the TMP rise in spring and the early growing season; its positive response to warmer conditions is particularly pronounced at short-term scales [59]. However, at longer medium-to-long-term periodic scales (approximately 4–6 years and 6–9 years), TMP and NDVI exhibit significant negative correlations or anti-phase leading characteristics. This frequency-domain scale differentiation reflects the complex mechanisms of TMP on vegetation dynamics: while a prolonged and significant TMP rise enhances the evapotranspirative water consumption process, it may also lead to the rapid depletion of surface soil moisture, thereby triggering localized water stress and subsequently exerting a phased inhibitory effect on vegetation growth [67]. This “heat–moisture” interactive effect is particularly prominent in high-latitude regions, as rising temperatures are accompanied by increased evapotranspiration; if PCP fails to replenish synchronously, it will exacerbate soil moisture deficits, thereby dampening the positive response of vegetation to higher temperatures [71].
This dual response mechanism of the ecosystem to TMP essentially embodies the vulnerability of high-latitude vegetation to climate change. At short-term scales, moderate warming is conducive to vegetation growth, especially during the early spring snowmelt and early growing season phases. Conversely, at long-term time scales, when temperatures remain persistently high accompanied by an insufficient moisture supply, high temperatures become the primary limiting factor for growth. They may even induce vegetation stress responses (such as chlorophyll loss and reduced vegetation coverage) through pathways like increasing evapotranspirative water consumption and altering soil moisture dynamics [64]. For instance, under the background of global warming, studies in multiple regions have recorded vegetation degradation events caused by the combined effects of high temperatures and droughts, the mechanism of which is precisely the water stress induced by TMP [77]. Furthermore, the co-evolution between TMP and PET provides the physical basis for this “double-edged sword” effect. PET is a crucial indicator measuring the potential for atmospheric evaporative consumption, providing a direct feedback to vegetation water demand [78]. In a long-term high-TMP context, the rise in PET will further intensify surface evaporation and vegetation evapotranspirative water consumption, making the moisture limitation effect more pronounced.
In summary, the impact of TMP on the NDVI in the study area is not a simple positive linear relationship, but rather possesses distinct scale dependence and complex ecological feedback mechanisms. At short-to-medium-term scales, moderate warming can promote vegetation growth; however, at longer periodic scales, continuous high temperatures may become the key trigger for water stress, thereby hindering the positive response of vegetation dynamics. This “double-edged sword” effect must be given critical consideration in regional vegetation dynamic predictions and future ecological risk assessments.
As a key indicator characterizing regional atmospheric evaporative demand and the hydrothermal coupling state, PET plays a crucial role in regulating vegetation growth and carbon cycling processes [1,79]. Existing studies have shown that changes in evaporative demand under the background of climate change can significantly affect ecosystem productivity and variations in vegetation greenness [14,41]. The Wavelet Transform Coherence results of this study indicate that PET and NDVI exhibited sustained and concentrated high-coherence characteristics at the medium-term periodic scale range of 5–8 years, presenting a significant anti-phase relationship or anti-phase synchronous relationship. This phenomenon suggests that the periodic fluctuations in regional hydrothermal consumption intensity exert a significant “inverse regulatory effect” on vegetation dynamics; namely, an enhancement in PET generally corresponds to a decline in the vegetation index, whereas a weakening of PET is conducive to vegetation growth. Mechanistically, an increase in PET implies higher atmospheric evaporative demand and a stronger risk of moisture deficits, thereby restricting vegetation photosynthesis and biomass accumulation [66]. Conversely, lower PET usually corresponds to weaker water stress, which is favorable for vegetation growth and coverage improvement. This mechanism is consistent with global-scale research conclusions, affirming that climatic hydrothermal conditions are among the dominant factors controlling vegetation changes.
From the perspective of synergistic spatial patterns, PET in the central and south-central regions of the study area has significantly decreased, while PCP has continuously increased. This collectively forms a favorable hydrothermal combinatorial pattern characterized by “enhanced moisture recharge and weakened evaporative demand,” thereby promoting the overall improvement of the NDVI [67]. This result aligns with the vegetation “Greening” phenomenon observed in some mid-to-high latitude regions under global warming. In contrast, PET in the northern regions and the Greater Khingan Mountains in the northwest exhibits an upward trend, indicating enhanced atmospheric evaporative demand and intensified hydrothermal deficits in this region, which to some extent inhibits the vegetation improvement process [66]. Comprehensively, by regulating the regional hydrothermal balance, PET exhibits a pronounced and concentrated inverse regulatory effect on NDVI variations at the medium-term periodic scale. Furthermore, differing hydrothermal backgrounds across various spatial regions further shape the spatial heterogeneity of vegetation responses.
In summary, the response of regional NDVI to climate change is by no means a passive, linear reaction to isolated meteorological factors. Rather, it represents a comprehensive ecological adaptation to a highly complex climate system, characterized by PCP-driven moisture availability, TMP-regulated phenological rhythms, and evapotranspiration-mediated hydrothermal balances. As global climate forcing intensifies, the profound asynchrony, nonlinearity, and temporal dependencies of these hydrothermal drivers must be thoroughly integrated into future regional ecological management. Recognizing these multi-scale coupled mechanisms is imperative for developing climate-resilient adaptation strategies and ensuring the long-term stability of cold regions engineering in high-latitude environments.

4.4. Limitations and Future Perspectives

Although this study systematically revealed the spatiotemporal evolution and multi-scale coupled mechanisms between NDVI and meteorological factors in the study area from 1990 to 2024, certain limitations remain due to data resolution constraints and the inherent boundaries of pure statistical methods. Future research should address the following directions.
(1) Limitations of temporal resolution in capturing phenological dynamics and extreme events. This study utilized annual time-series data, which robustly reflect long-term trends and decadal periodicities but inevitably smooth out high-frequency ecological fluctuations. Vegetation is extremely sensitive to climate variations during key phenological stages (e.g., green-up and senescence) [80]. Furthermore, the transient and destructive impacts of frequent extreme climate events—such as flash droughts and summer heatwaves—are often masked by annual averages [56]. Future studies urgently require higher-temporal-resolution datasets (e.g., daily or 8-day) to accurately capture the transient responses of high-latitude vegetation.
(2) Insufficient quantitative decoupling of natural climate and human activities. This study primarily focused on the regulatory effects of natural hydrothermal drivers on the NDVI. However, human interventions (e.g., agricultural management and ecological restoration projects) are core engines driving vegetation “Greening” in specific areas like the Songnen Plain [81]. Because non-meteorological parameters were not explicitly incorporated, this study could not precisely isolate the absolute contribution of human activities using methods such as residual analysis. Quantifying the decoupling of these dual drivers will be crucial for enhancing model interpretability in the future.
(3) The necessary transition from statistical correlations to physical ecological causality. The methods employed in this study (e.g., WTC, MK test, and Hurst exponent) are fundamentally data-driven signal mining tools, which cannot directly dissect physiological and micro-ecological dynamics. In high-latitude regions, complex physical mechanisms—such as vegetation–climate feedback [82] and permafrost degradation altering soil moisture distribution [83]—are difficult to encompass within purely statistical models. Future research should integrate process-based eco-hydrological models with advanced data-driven approaches (e.g., deep learning or machine learning) to break the “black box” of statistical inference and ultimately achieve a theoretical leap from statistical correlations to physical ecological causality [84].

5. Conclusions

By comprehensively employing multi-scale spatiotemporal and frequency-domain analysis methods, this study systematically elucidated the evolutionary characteristics and coupling mechanisms between NDVI and meteorological factors in Heilongjiang Province from 1990 to 2024. The findings provide a quantitative basis for the environmental impact assessment and ecological risk prevention of cold regions engineering. The main conclusions are as follows.
(1) Asynchronous climate restructuring and spatial vegetation differentiation. TMP, PCP, and PET underwent abrupt changes in 2013, 2011, and 2008, respectively. Driven by extreme moisture fluctuations, regional NDVI experienced a structural mutation and reversed from an initial rise to a subsequent decline in 2011. Spatially, vegetation improved in the northwest and central regions (rates ranging from 0.009 to 0.022 yr−1) but degraded in the southwest and east (rates ranging from −0.010 to −0.025 yr−1), which increases the risks of soil erosion and surface denudation for engineering projects in degraded zones.
(2) Multi-scale climatic drivers. PCP acts as the core, in-phase driver maintaining vegetation growth, primarily across 6–9-year scales. TMP acts as a “double-edged sword,” transitioning from a short-term (3–5 years) positive driver to a long-term (>6 years) negative stressor due to water stress. Meanwhile, PET exerts a strong inverse regulatory effect in the medium term (5–8 years). Consequently, cold regions engineering must guard against long-term “water stress” to ensure foundation and ecological stability.
(3) Ecological uncertainty and permafrost risks. Hurst exponent predictions indicate strong “anti-persistent” risks for TMP and PET (H values ranging from 0.23 to 0.48), meaning historical warming trends are highly susceptible to fluctuating reversals. Vegetation is extremely fragile in the extreme northern and western margins, where degradation can accelerate permafrost thawing and severely threaten the safe operation of high-cold infrastructure.
(4) Ecological mitigation strategies. Major engineering projects must avoid highly vulnerable extreme northern and western areas and minimize surface disturbances to protect the natural vegetation thermal insulation layer. In the degraded southwestern and eastern regions (where NDVI declines at rates up to −0.025 yr−1), artificial ecological restoration technologies (e.g., drought-resistant slope protection) should be mandatorily integrated into engineering mitigation measures to compensate for moisture deficits.
Ultimately, this study deepens the understanding of eco-climatic interactions in high-latitude cold regions, providing vital theoretical and practical support for cold regions engineering site selection, climate mitigation strategies, and sustainable management.

Author Contributions

Conceptualization, W.X.; Methodology, W.X.; Software, W.X.; Validation, W.X., R.Z. and Y.Z.; Formal analysis, W.X.; Investigation, W.X. and X.W.; Data curation, W.X. and X.W.; Writing—original draft, W.X.; Writing—review & editing, W.X., C.D., X.W. and X.Y.; Supervision, C.D.; Project administration, C.D.; Funding acquisition, C.D. All authors have read and agreed to the published version of the manuscript.

Funding

This research received no external funding.

Institutional Review Board Statement

Not applicable.

Informed Consent Statement

Not applicable.

Data Availability Statement

The data presented in this study are available from publicly accessible repositories. These data were derived from the following public resources: National Cryosphere Desert Data Center (ChinaMet): https://www.ncdc.ac.cn/portal/metadata/21691d03-bef2-4800-924e-5614e7268b87 (accessed on 5 February 2026); and NASA EarthData: https://www.earthdata.nasa.gov/data (accessed on 6 February 2026).

Conflicts of Interest

The authors declare no conflict of interest.

References

  1. Beer, C.; Reichstein, M.; Tomelleri, E.; Ciais, P.; Jung, M.; Carvalhais, N.; Rödenbeck, C.; Arain, M.A.; Baldocchi, D.; Bonan, G.B.; et al. Terrestrial Gross Carbon Dioxide Uptake: Global Distribution and Covariation with Climate. Science 2010, 329, 834–838. [Google Scholar] [CrossRef] [Scilit] [PubMed]
  2. Pan, Y.; Birdsey, R.A.; Fang, J.; Houghton, R.; Kauppi, P.E.; Kurz, W.A.; Phillips, O.L.; Shvidenko, A.; Lewis, S.L.; Canadell, J.G.; et al. A Large and Persistent Carbon Sink in the World’s Forests. Science 2011, 333, 988–993. [Google Scholar] [CrossRef] [Scilit] [PubMed]
  3. Myers-Smith, I.H.; Forbes, B.C.; Wilmking, M.; Hallinger, M.; Lantz, T.; Blok, D.; Tape, K.D.; Macias-Fauria, M.; Sass-Klaassen, U.; Lévesque, E.; et al. Shrub Expansion in Tundra Ecosystems: Dynamics, Impacts and Research Priorities. Environ. Res. Lett. 2011, 6, 045509. [Google Scholar] [CrossRef] [Scilit]
  4. Jorgenson, M.T.; Romanovsky, V.; Harden, J.; Shur, Y.; O’Donnell, J.; Schuur, E.A.G.; Kanevskiy, M.; Marchenko, S. Resilience and Vulnerability of Permafrost to Climate changeThis Article Is One of a Selection of Papers from The Dynamics of Change in Alaska’s Boreal Forests: Resilience and Vulnerability in Response to Climate Warming. Can. J. For. Res. 2010, 40, 1219–1236. [Google Scholar] [CrossRef] [Scilit]
  5. Seddon, A.W.R.; Macias-Fauria, M.; Long, P.R.; Benz, D.; Willis, K.J. Sensitivity of Global Terrestrial Ecosystems to Climate Variability. Nature 2016, 531, 229–232. [Google Scholar] [CrossRef] [Scilit] [PubMed]
  6. Gauthier, S.; Bernier, P.; Kuuluvainen, T.; Shvidenko, A.Z.; Schepaschenko, D.G. Boreal Forest Health and Global Change. Science 2015, 349, 819–822. [Google Scholar] [CrossRef] [Scilit] [PubMed]
  7. Wu, D.; Zhao, X.; Liang, S.; Zhou, T.; Huang, K.; Tang, B.; Zhao, W. Time-Lag Effects of Global Vegetation Responses to Climate Change. Glob. Change Biol. 2015, 21, 3520–3531. [Google Scholar] [CrossRef] [Scilit] [PubMed]
  8. Piao, S.; Nan, H.; Huntingford, C.; Ciais, P.; Friedlingstein, P.; Sitch, S.; Peng, S.; Ahlström, A.; Canadell, J.G.; Cong, N.; et al. Evidence for a Weakening Relationship between Interannual Temperature Variability and Northern Vegetation Activity. Nat. Commun. 2014, 5, 5018. [Google Scholar] [CrossRef] [Scilit] [PubMed]
  9. Piao, S.; Friedlingstein, P.; Ciais, P.; de Noblet-Ducoudré, N.; Labat, D.; Zaehle, S. Changes in Climate and Land Use Have a Larger Direct Impact than Rising CO2 on Global River Runoff Trends. Proc. Natl. Acad. Sci. USA 2007, 104, 15242–15247. [Google Scholar] [CrossRef] [Scilit] [PubMed]
  10. Peñuelas, J.; Filella, I. Responses to a Warming World. Science 2001, 294, 793–795. [Google Scholar] [CrossRef] [Scilit] [PubMed]
  11. Ali, A.; Sanaei, A.; Li, M.; Nalivan, O.A.; Ahmadaali, K.; Pour, M.J.; Valipour, A.; Karami, J.; Aminpour, M.; Kaboli, H.; et al. Impacts of Climatic and Edaphic Factors on the Diversity, Structure and Biomass of Species-poor and Structurally-complex Forests. Sci. Total Environ. 2020, 706, 135719. [Google Scholar] [CrossRef] [Scilit] [PubMed]
  12. Han, J.; Han, F.; He, B.; Ma, X.; Wang, T. Spatiotemporal Changes and Driving Factors of Alpine Land Cover in Tianshan World Natural Heritage Sites. Sci. Rep. 2024, 14, 20895. [Google Scholar] [CrossRef] [Scilit] [PubMed]
  13. Tucker, C.J. Red and Photographic Infrared Linear Combinations for Monitoring Vegetation. Remote Sens. Environ. 1979, 8, 127–150. [Google Scholar] [CrossRef] [Scilit]
  14. Nemani, R.R.; Keeling, C.D.; Hashimoto, H.; Jolly, W.M.; Piper, S.C.; Tucker, C.J.; Myneni, R.B.; Running, S.W. Climate-Driven Increases in Global Terrestrial Net Primary Production from 1982 to 1999. Science 2003, 300, 1560–1563. [Google Scholar] [CrossRef] [Scilit] [PubMed]
  15. Torrence, C.; Compo, G.P. A Practical Guide to Wavelet Analysis. Bull. Am. Meteorol. Soc. 1998, 79, 61–78. [Google Scholar] [CrossRef] [Scilit]
  16. Beck, P.S.A.; Juday, G.P.; Alix, C.; Barber, V.A.; Winslow, S.E.; Sousa, E.E.; Heiser, P.; Herriges, J.D.; Goetz, S.J. Changes in Forest Productivity across Alaska Consistent with Biome Shift. Ecol. Lett. 2011, 14, 373–379. [Google Scholar] [CrossRef] [Scilit] [PubMed]
  17. Miles, V.V.; Esau, I. Spatial Heterogeneity of Greening and Browning between and within Bioclimatic Zones in Northern West Siberia. Environ. Res. Lett. 2016, 11, 115002. [Google Scholar] [CrossRef] [Scilit]
  18. Myers-Smith, I.H.; Elmendorf, S.C.; Beck, P.S.A.; Wilmking, M.; Hallinger, M.; Blok, D.; Tape, K.D.; Rayback, S.A.; Macias-Fauria, M.; Forbes, B.C.; et al. Climate Sensitivity of Shrub Growth across the Tundra Biome. Nat. Clim. Change 2015, 5, 887–891. [Google Scholar] [CrossRef] [Scilit]
  19. Helsel, D.R.; Hirsch, R. Statistical Methods in Water Resources; Version 1.1; Techniques of Water-Resources Investigations; Elsevier: Amsterdam, The Netherlands, 1992. [Google Scholar]
  20. Burn, D.H.; Hag Elnur, M.A. Detection of Hydrologic Trends and Variability. J. Hydrol. 2002, 255, 107–122. [Google Scholar] [CrossRef] [Scilit]
  21. Jong, R.; de Bruin, S.; Wit, A.; Schaepman, M.; Dent, D. Analysis of Monotonic Greening and Browning Trends from Global NDVI Time-Series. Remote Sens. Environ. 2011, 115, 692–702. [Google Scholar] [CrossRef] [Scilit]
  22. Partal, T.; Kahya, E. Trend Analysis in Turkish Precipitation Data. Hydrol. Processes 2006, 20, 2011–2026. [Google Scholar] [CrossRef] [Scilit]
  23. Hurst, H.E. Long-Term Storage Capacity of Reservoirs. Trans. Am. Soc. Civ. Eng. 1951, 116, 770–799. [Google Scholar] [CrossRef] [Scilit]
  24. Grinsted, A.; Moore, J.C.; Jevrejeva, S. Application of the Cross Wavelet Transform and Wavelet Coherence to Geophysical Time Series. Nonlinear Processes Geophys. 2004, 11, 561–566. [Google Scholar] [CrossRef] [Scilit]
  25. Maraun, D.; Kurths, J. Cross Wavelet Analysis: Significance Testing and Pitfalls. Nonlinear Processes Geophys. 2004, 11, 505–514. [Google Scholar] [CrossRef] [Scilit]
  26. Labat, D. Wavelet Analysis of the Annual Discharge Records of the World’s Largest Rivers. Adv. Water Resour. 2008, 31, 109–117. [Google Scholar] [CrossRef] [Scilit]
  27. Mao, D.; Wang, Z.; Luo, L.; Ren, C. Integrating AVHRR and MODIS Data to Monitor NDVI Changes and Their Relationships with Climatic Parameters in Northeast China. Int. J. Appl. Earth Obs. Geoinf. 2012, 18, 528–536. [Google Scholar] [CrossRef] [Scilit]
  28. Jin, H.; Yu, Q.; Lü, L.; Guo, D.; He, R.; Yu, S.; Sun, G.; Li, Y. Degradation of Permafrost in the Xing’anling Mountains, Northeastern China. Permafr. Periglac. Processes 2007, 18, 245–258. [Google Scholar] [CrossRef] [Scilit]
  29. Chu, H.; Venevsky, S.; Wu, C.; Wang, M. NDVI-Based Vegetation Dynamics and Its Response to Climate Changes at Amur-Heilongjiang River Basin from 1982 to 2015. Sci. Total Environ. 2019, 650, 2051–2062. [Google Scholar] [CrossRef] [Scilit] [PubMed]
  30. Mao, J.; Ribes, A.; Yan, B.; Shi, X.; Thornton, P.E.; Séférian, R.; Ciais, P.; Myneni, R.B.; Douville, H.; Piao, S.; et al. Human-Induced Greening of the Northern Extratropical Land Surface. Nat. Clim. Change 2016, 6, 959–963. [Google Scholar] [CrossRef] [Scilit]
  31. Xing, Z.; Li, X.; Mao, D.; Luo, L.; Wang, Z. Heterogeneous Responses of Wetland Vegetation to Climate Change in the Amur River Basin Characterized by Normalized Difference Vegetation Index from 1982 to 2020. Front. Plant Sci. 2023, 14, 1290843. [Google Scholar] [CrossRef] [Scilit] [PubMed]
  32. Beck, H.E.; Zimmermann, N.E.; McVicar, T.R.; Vergopolan, N.; Berg, A.; Wood, E.F. Present and Future Köppen-Geiger Climate Classification Maps at 1-Km Resolution. Sci. Data 2018, 5, 180214. [Google Scholar] [CrossRef] [Scilit] [PubMed]
  33. Piao, S.; Fang, J.; Zhou, L.; Ciais, P.; Zhu, B. Variations in Satellite-Derived Phenology in China’s Temperate Vegetation. Glob. Change Biol. 2006, 12, 672–685. [Google Scholar] [CrossRef] [Scilit]
  34. Zhang, L.; Li, X.; Zheng, D.; Zhang, K.; Ma, Q.; Zhao, Y.; Ge, Y. Merging Multiple Satellite-Based Precipitation Products and Gauge Observations Using a Novel Double Machine Learning Approach. J. Hydrol. 2021, 594, 125969. [Google Scholar] [CrossRef] [Scilit]
  35. Hu, Y.; Zhang, L. Added Value of Merging Techniques in Precipitation Estimates Relative to Gauge-Interpolation Algorithms of Varying Complexity. J. Hydrol. 2024, 645, 132214. [Google Scholar] [CrossRef] [Scilit]
  36. Sen, P.K. Estimates of the Regression Coefficient Based on Kendall’s Tau. J. Am. Stat. Assoc. 1968, 63, 1379–1389. [Google Scholar] [CrossRef]
  37. Fernandes, R.; Leblanc, S.G. Parametric (Modified Least Squares) and Non-Parametric (Theil–Sen) Linear Regressions for Predicting Biophysical Parameters in the Presence of Measurement Errors. Remote Sens. Environ. 2005, 95, 303–316. [Google Scholar] [CrossRef] [Scilit]
  38. Hirsch, R.M.; Slack, J.R.; Smith, R.A. Techniques of Trend Analysis for Monthly Water Quality Data. Water Resour. Res. 1982, 18, 107–121. [Google Scholar] [CrossRef] [Scilit]
  39. Gocic, M.; Trajkovic, S. Analysis of Changes in Meteorological Variables Using Mann-Kendall and Sen’s Slope Estimator Statistical Tests in Serbia. Glob. Planet. Change 2013, 100, 172–182. [Google Scholar] [CrossRef] [Scilit]
  40. Fensholt, R.; Langanke, T.; Rasmussen, K.; Reenberg, A.; Prince, S.D.; Tucker, C.; Scholes, R.J.; Le, Q.B.; Bondeau, A.; Eastman, R.; et al. Greenness in Semi-Arid Areas across the Globe 1981–2007—An Earth Observing Satellite Based Analysis of Trends and Drivers. Remote Sens. Environ. 2012, 121, 144–158. [Google Scholar] [CrossRef] [Scilit]
  41. Zhu, Z.; Piao, S.; Myneni, R.B.; Huang, M.; Zeng, Z.; Canadell, J.G.; Ciais, P.; Sitch, S.; Friedlingstein, P.; Arneth, A.; et al. Greening of the Earth and Its Drivers. Nat. Clim. Change 2016, 6, 791–795. [Google Scholar] [CrossRef] [Scilit]
  42. Mann, H.B. Nonparametric Tests Against Trend. Econometrica 1945, 13, 245–259. [Google Scholar] [CrossRef] [Scilit]
  43. Kendall, M.G. Rank Correlation Methods, 4th ed.; Charles Griffin: London, UK, 1975. [Google Scholar]
  44. Hamed, K.H.; Ramachandra Rao, A. A Modified Mann-Kendall Trend Test for Autocorrelated Data. J. Hydrol. 1998, 204, 182–196. [Google Scholar] [CrossRef] [Scilit]
  45. Pettitt, A.N. A Non-Parametric Approach to the Change-Point Problem. J. R. Stat. Soc. Ser. C Appl. Stat. 1979, 28, 126–135. [Google Scholar] [CrossRef] [Scilit] [PubMed]
  46. Kundzewicz, Z.W.; Robson, A.J. Change Detection in Hydrological Records—A Review of the Methodology/Revue Méthodologique de La Détection de Changements Dans Les Chroniques Hydrologiques. Hydrol. Sci. J. 2004, 49, 7–19. [Google Scholar] [CrossRef] [Scilit]
  47. Rougé, C.; Ge, Y.; Cai, X. Detecting Gradual and Abrupt Changes in Hydrological Records. Adv. Water Resour. 2013, 53, 33–44. [Google Scholar] [CrossRef] [Scilit]
  48. Mallakpour, I.; Villarini, G. The Changing Nature of Flooding across the Central United States. Nat. Clim. Change 2015, 5, 250–254. [Google Scholar] [CrossRef] [Scilit]
  49. Peng, J.; Liu, Z.; Liu, Y.; Wu, J.; Han, Y. Trend Analysis of Vegetation Dynamics in Qinghai–Tibet Plateau Using Hurst Exponent. Ecol. Indic. 2012, 14, 28–39. [Google Scholar] [CrossRef] [Scilit]
  50. Koutsoyiannis, D. Climate Change, the Hurst Phenomenon, and Hydrological Statistics. Hydrol. Sci. J. 2003, 48, 3–24. [Google Scholar] [CrossRef] [Scilit]
  51. Torrence, C.; Webster, P.J. Interdecadal Changes in the ENSO–Monsoon System. J. Clim. 1999, 12, 2679–2690. [Google Scholar] [CrossRef] [Scilit]
  52. Cazelles, B.; Chavez, M.; Berteaux, D.; Ménard, F.; Vik, J.O.; Jenouvrier, S.; Stenseth, N.C. Wavelet Analysis of Ecological Time Series. Oecologia 2008, 156, 287–304. [Google Scholar] [CrossRef] [Scilit] [PubMed]
  53. Labat, D. Recent Advances in Wavelet Analyses: Part 1. A Review of Concepts. J. Hydrol. 2005, 314, 275–288. [Google Scholar] [CrossRef] [Scilit]
  54. Chapin, F.S.; Sturm, M.; Serreze, M.C.; McFadden, J.P.; Key, J.R.; Lloyd, A.H.; McGuire, A.D.; Rupp, T.S.; Lynch, A.H.; Schimel, J.P.; et al. Role of Land-Surface Changes in Arctic Summer Warming. Science 2005, 310, 657–660. [Google Scholar] [CrossRef] [Scilit] [PubMed]
  55. Basso, B.; Antle, J. Digital Agriculture to Design Sustainable Agricultural Systems. Nat. Sustain. 2020, 3, 254–256. [Google Scholar] [CrossRef] [Scilit]
  56. Vicente-Serrano, S.M.; Gouveia, C.; Camarero, J.J.; Beguería, S.; Trigo, R.; López-Moreno, J.I.; Azorín-Molina, C.; Pasho, E.; Lorenzo-Lacruz, J.; Revuelto, J.; et al. Response of Vegetation to Drought Time-Scales across Global Land Biomes. Proc. Natl. Acad. Sci. USA 2013, 110, 52–57. [Google Scholar] [CrossRef] [Scilit] [PubMed]
  57. IPCC. Climate Change 2023: Synthesis Report. Contribution of Working Groups I, II and III to the Sixth Assessment Report of the Intergovernmental Panel on Climate Change; Lee, H., Romero, J., Eds.; IPCC: Geneva, Switzerland, 2023. [Google Scholar]
  58. Chen, W.; Shi, L. Study on the Driving Mechanisms of Spatiotemporal Nonstationarity of Vegetation Dynamics in Heilongjiang Province. Sci. Rep. 2025, 15, 28844. [Google Scholar] [CrossRef] [Scilit] [PubMed]
  59. Piao, S.; Fang, J.; Ciais, P.; Peylin, P.; Huang, Y.; Sitch, S.; Wang, T. The Carbon Balance of Terrestrial Ecosystems in China. Nature 2009, 458, 1009–1013. [Google Scholar] [CrossRef] [Scilit] [PubMed]
  60. Serreze, M.C.; Barry, R.G. Processes and Impacts of Arctic Amplification: A Research Synthesis. Glob. Planet. Change 2011, 77, 85–96. [Google Scholar] [CrossRef] [Scilit]
  61. Romanovsky, V.E.; Drozdov, D.S.; Oberman, N.G.; Malkova, G.V.; Kholodov, A.L.; Marchenko, S.S.; Moskalenko, N.G.; Sergeev, D.O.; Ukraintseva, N.G.; Abramov, A.A.; et al. Thermal State of Permafrost in Russia. Permafr. Periglac. Processes 2010, 21, 136–155. [Google Scholar] [CrossRef] [Scilit]
  62. Mantua, N.J.; Hare, S.R.; Zhang, Y.; Wallace, J.M.; Francis, R.C. A Pacific Interdecadal Climate Oscillation with Impacts on Salmon Production*. Bull. Am. Meteorol. Soc. 1997, 78, 1069–1080. [Google Scholar] [CrossRef] [Scilit]
  63. Wang, H.; He, S. Weakening Relationship between East Asian Winter Monsoon and ENSO after Mid-1970s. Chin. Sci. Bull. 2012, 57, 3535–3540. [Google Scholar] [CrossRef] [Scilit]
  64. Easterling, D.R.; Meehl, G.A.; Parmesan, C.; Changnon, S.A.; Karl, T.R.; Mearns, L.O. Climate Extremes: Observations, Modeling, and Impacts. Science 2000, 289, 2068–2074. [Google Scholar] [CrossRef] [Scilit] [PubMed]
  65. Bonan, G.B. Forests and Climate Change: Forcings, Feedbacks, and the Climate Benefits of Forests. Science 2008, 320, 1444–1449. [Google Scholar] [CrossRef] [Scilit] [PubMed]
  66. Piao, S.; Ciais, P.; Huang, Y.; Shen, Z.; Peng, S.; Li, J.; Zhou, L.; Liu, H.; Ma, Y.; Ding, Y.; et al. The Impacts of Climate Change on Water Resources and Agriculture in China. Nature 2010, 467, 43–51. [Google Scholar] [CrossRef] [Scilit] [PubMed]
  67. Dai, A. Increasing Drought under Global Warming in Observations and Models. Nat. Clim. Change 2013, 3, 52–58. [Google Scholar] [CrossRef] [Scilit]
  68. Han, T.; Wang, H.; Sun, J. Strengthened Relationship between Eastern ENSO and Summer Precipitation over Northeastern China. J. Clim. 2017, 30, 4497–4512. [Google Scholar] [CrossRef] [Scilit]
  69. Flannigan, M.D.; Krawchuk, M.A.; de Groot, W.J.; Wotton, B.M.; Gowman, L.M. Implications of Changing Climate for Global Wildland Fire. Int. J. Wildland Fire 2009, 18, 483–507. [Google Scholar] [CrossRef] [Scilit]
  70. Brutsaert, W.; Parlange, M.B. Hydrologic Cycle Explains the Evaporation Paradox. Nature 1998, 396, 30. [Google Scholar] [CrossRef] [Scilit]
  71. Roderick, M.L.; Farquhar, G.D. Changes in Australian Pan Evaporation from 1970 to 2002. Int. J. Climatol. 2004, 24, 1077–1090. [Google Scholar] [CrossRef] [Scilit]
  72. Jung, M.; Reichstein, M.; Ciais, P.; Seneviratne, S.I.; Sheffield, J.; Goulden, M.L.; Bonan, G.; Cescatti, A.; Chen, J.; de Jeu, R.; et al. Recent Decline in the Global Land Evapotranspiration Trend Due to Limited Moisture Supply. Nature 2010, 467, 951–954. [Google Scholar] [CrossRef] [Scilit] [PubMed]
  73. Ding, Y.; Chan, J.C.L. The East Asian Summer Monsoon: An Overview. Meteorol. Atmos. Phys. 2005, 89, 117–142. [Google Scholar] [CrossRef] [Scilit]
  74. Myneni, R.B.; Keeling, C.D.; Tucker, C.J.; Asrar, G.; Nemani, R.R. Increased Plant Growth in the Northern High Latitudes from 1981 to 1991. Nature 1997, 386, 698–702. [Google Scholar] [CrossRef] [Scilit]
  75. Xu, L.; Myneni, R.B.; Chapin, F.S., III; Callaghan, T.V.; Pinzon, J.E.; Tucker, C.J.; Zhu, Z.; Bi, J.; Ciais, P.; Tømmervik, H.; et al. Temperature and Vegetation Seasonality Diminishment over Northern Lands. Nat. Clim. Change 2013, 3, 581–586. [Google Scholar] [CrossRef] [Scilit]
  76. Overland, J.E.; Francis, J.A.; Hanna, E.; Wang, M. The Recent Shift in Early Summer Arctic Atmospheric Circulation. Geophys. Res. Lett. 2012, 39, L19804. [Google Scholar] [CrossRef] [Scilit]
  77. Bastos, A.; Ciais, P.; Friedlingstein, P.; Sitch, S.; Pongratz, J.; Fan, L.; Wigneron, J.P.; Weber, U.; Reichstein, M.; Fu, Z.; et al. Direct and Seasonal Legacy Effects of the 2018 Heat Wave and Drought on European Ecosystem Productivity. Sci. Adv. 2026, 6, eaba2724. [Google Scholar] [CrossRef] [Scilit] [PubMed]
  78. Dannenberg, M.P.; Yan, D.; Barnes, M.L.; Smith, W.K.; Johnston, M.R.; Scott, R.L.; Biederman, J.A.; Knowles, J.F.; Wang, X.; Duman, T.; et al. Exceptional Heat and Atmospheric Dryness Amplified Losses of Primary Production during the 2020 U.S. Southwest Hot Drought. Glob. Change Biol. 2022, 28, 4794–4806. [Google Scholar] [CrossRef] [Scilit] [PubMed]
  79. Mu, Q.; Zhao, M.; Running, S.W. Improvements to a MODIS Global Terrestrial Evapotranspiration Algorithm. Remote Sens. Environ. 2011, 115, 1781–1800. [Google Scholar] [CrossRef] [Scilit]
  80. Piao, S.; Wang, X.; Park, T.; Chen, C.; Lian, X.; He, Y.; Bjerke, J.W.; Chen, A.; Ciais, P.; Tømmervik, H.; et al. Characteristics, Drivers and Feedbacks of Global Greening. Nat. Rev. Earth Environ. 2020, 1, 14–27. [Google Scholar] [CrossRef] [Scilit]
  81. Chen, C.; Park, T.; Wang, X.; Piao, S.; Xu, B.; Chaturvedi, R.K.; Fuchs, R.; Brovkin, V.; Ciais, P.; Fensholt, R.; et al. China and India Lead in Greening of the World through Land-Use Management. Nat. Sustain. 2019, 2, 122–129. [Google Scholar] [CrossRef] [Scilit] [PubMed]
  82. Forzieri, G.; Alkama, R.; Miralles, D.G.; Cescatti, A. Satellites Reveal Contrasting Responses of Regional Climate to the Widespread Greening of Earth. Science 2017, 356, 1180–1184. [Google Scholar] [CrossRef] [Scilit] [PubMed]
  83. Biskaborn, B.K.; Smith, S.L.; Noetzli, J.; Matthes, H.; Vieira, G.; Streletskiy, D.A.; Schoeneich, P.; Romanovsky, V.E.; Lewkowicz, A.G.; Abramov, A.; et al. Permafrost Is Warming at a Global Scale. Nat. Commun. 2019, 10, 264. [Google Scholar] [CrossRef] [Scilit] [PubMed]
  84. Reichstein, M.; Camps-Valls, G.; Stevens, B.; Jung, M.; Denzler, J.; Carvalhais, N. Prabhat Deep Learning and Process Understanding for Data-Driven Earth System Science. Nature 2019, 566, 195–204. [Google Scholar] [CrossRef] [Scilit] [PubMed]
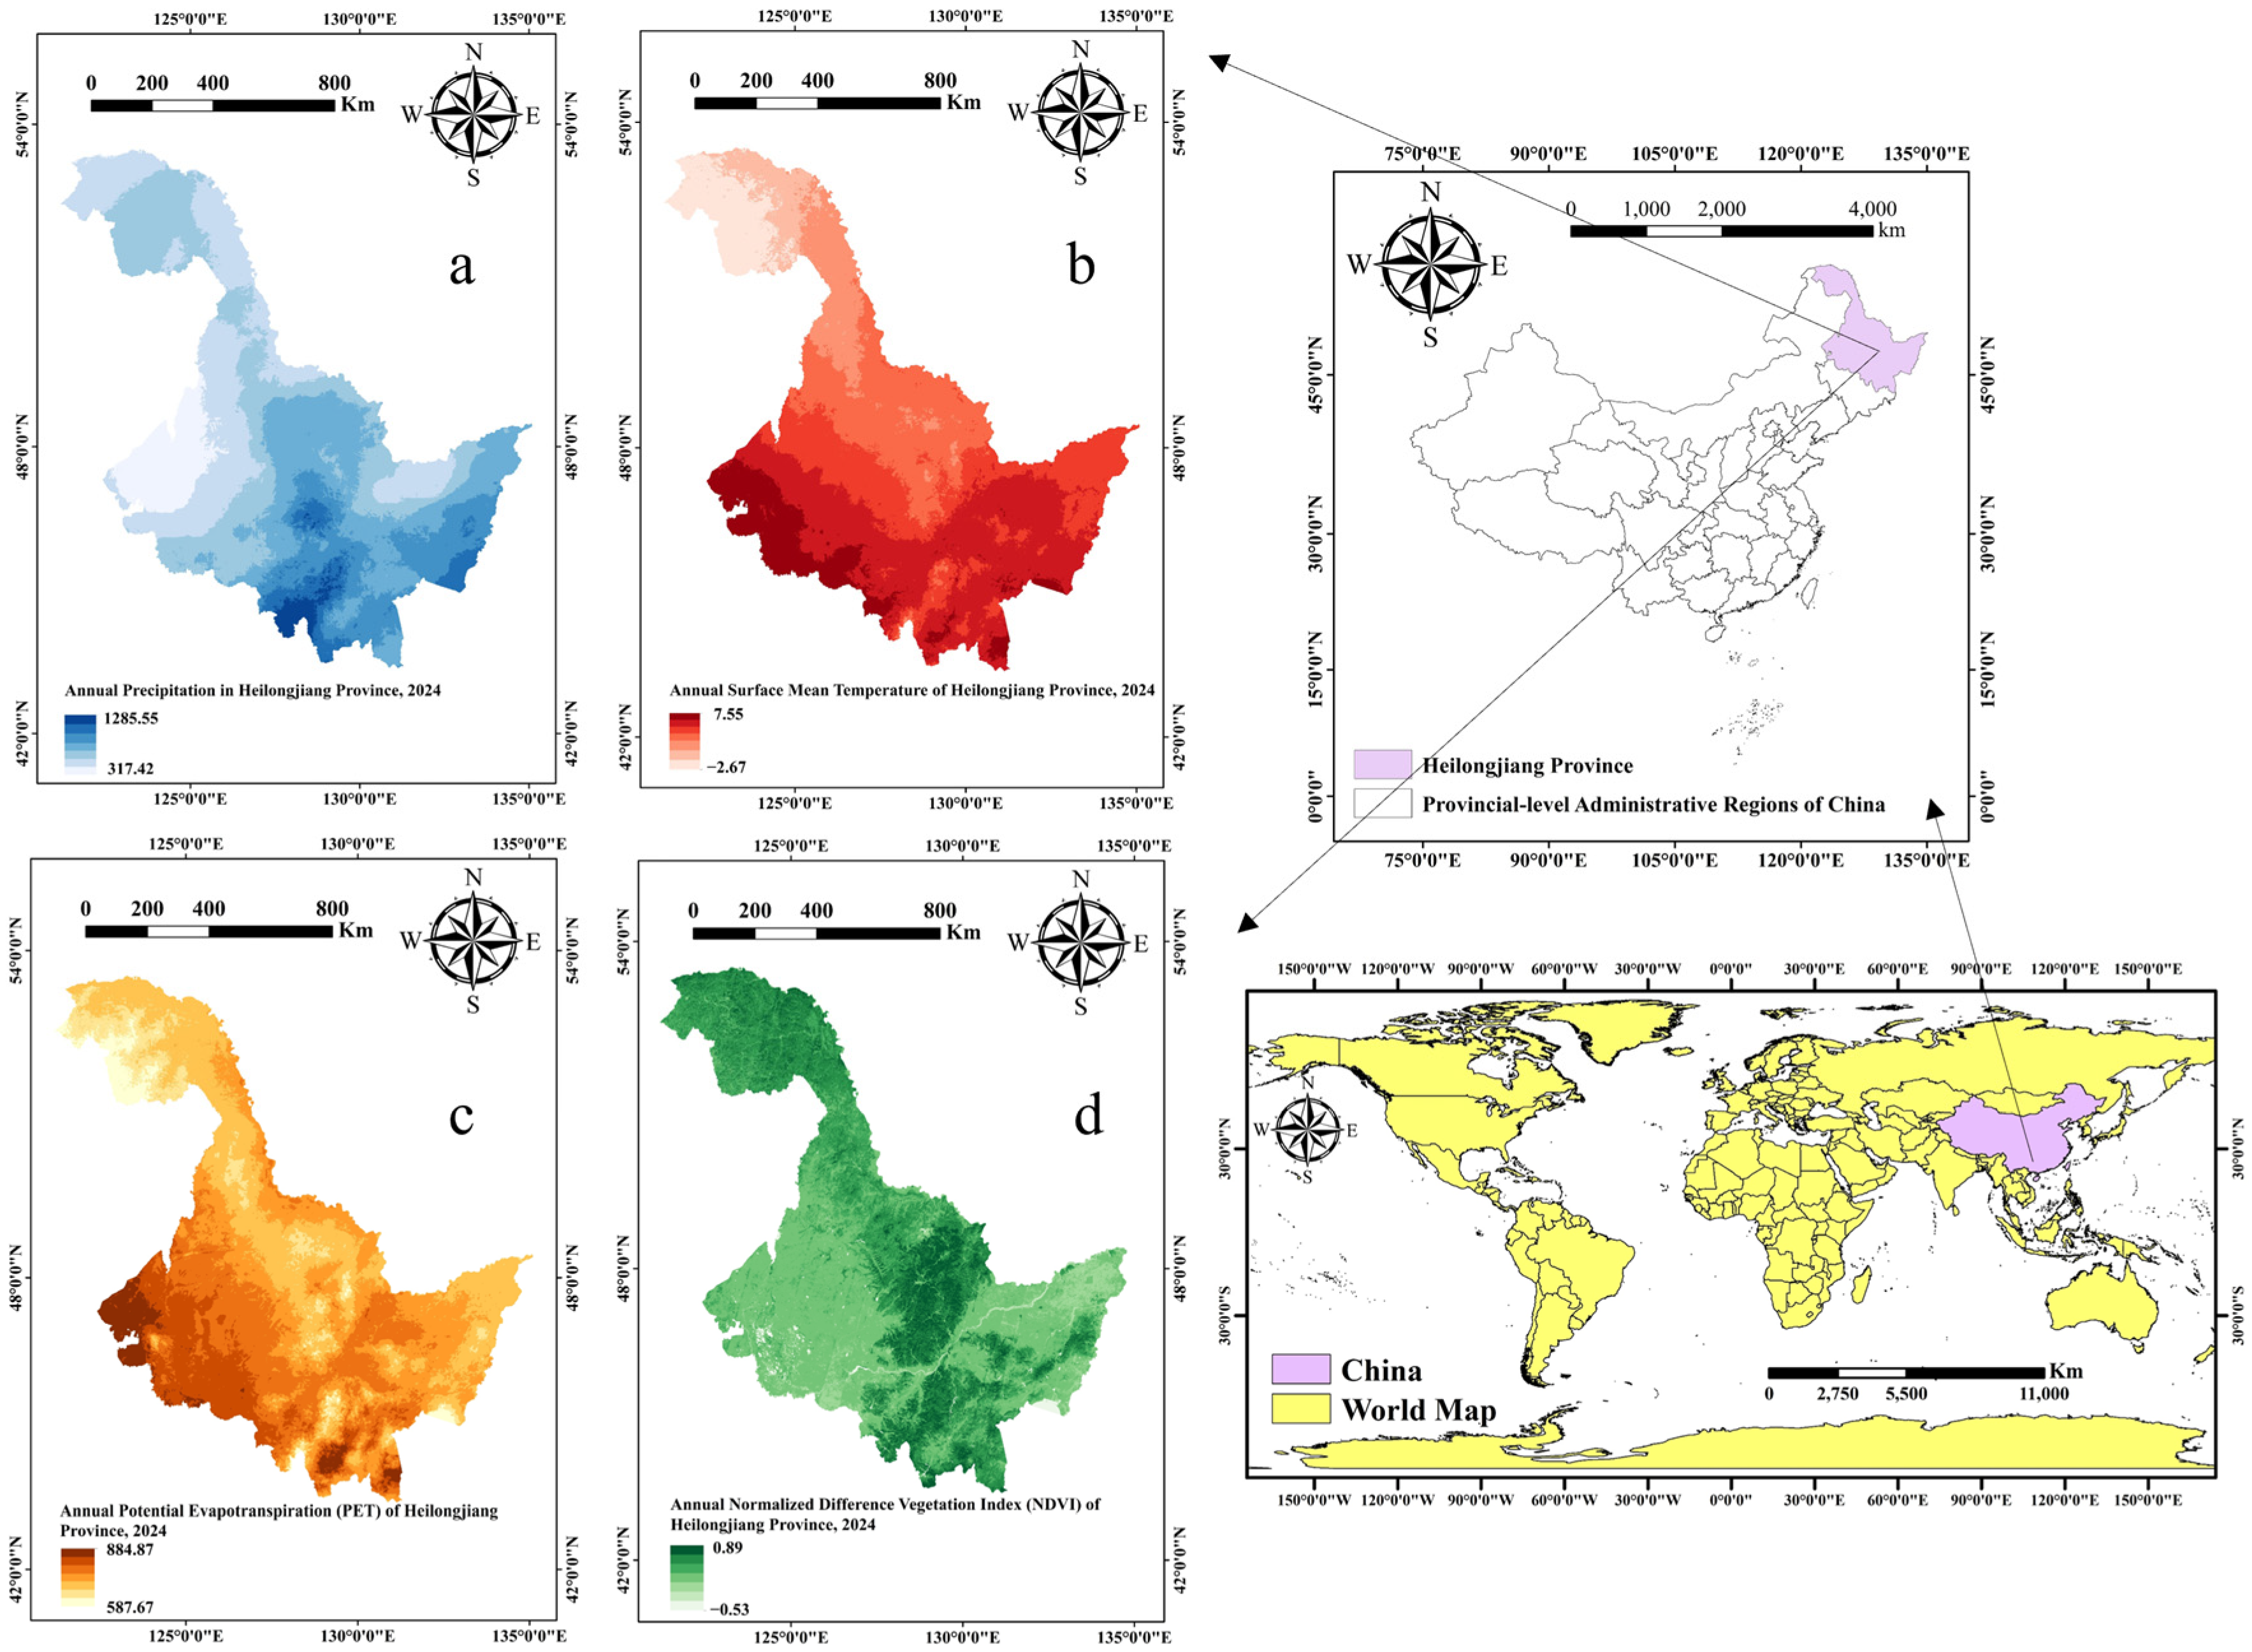
Figure 1. Location of the study area and spatial distribution of environmental variables in Heilongjiang Province. (a) Annual PCP in 2024; (b) annual TMP in 2024; (c) annual PET in 2024; (d) annual NDVI in 2024. Insets show the location of Heilongjiang Province within China and its geographical position in the world.
Applsci 16 07387 g001
Figure 2. Overall methodological framework of this study.
Applsci 16 07387 g002
Figure 3. Spatial distribution of linear trends in hydroclimatic factors in Heilongjiang Province in 1990–2024.
Applsci 16 07387 g003
Figure 4. Temporal variations in hydroclimatic factors in Heilongjiang Province in 1990–2024, including the forward ( U F K ) and backward ( U B K ) Mann–Kendall statistics at the 0.05 significance level, together with their corresponding linear trend analyses.
Applsci 16 07387 g004aApplsci 16 07387 g004b
Figure 5. Pettitt change-point detection results for hydroclimatic factors in Heilongjiang Province in 1990–2024. The red dashed line indicates the detected change point.
Applsci 16 07387 g005
Figure 6. Spatial distribution of the Hurst exponent for hydroclimatic factors in Heilongjiang Province in 1990–2024.
Applsci 16 07387 g006
Figure 7. Real-part contour maps of wavelet coefficients and corresponding wavelet variance plots for meteorological factors in Heilongjiang Province in 1990–2024.
Applsci 16 07387 g007aApplsci 16 07387 g007b
Figure 8. Spatial distribution of NDVI trend characteristics in Heilongjiang Province in 1990–2024. (a) Spatial distribution of the linear trend (Sen’s slope) of the NDVI; (b) spatial distribution of the Hurst exponent of the NDVI.
Applsci 16 07387 g008
Figure 9. Temporal variation characteristics of the NDVI in Heilongjiang Province in 1990–2024. (a) Mann–Kendall (MK) trend and mutation test; (b) Pettitt mutation test; the red dashed vertical line denotes the detected abrupt change point. (c) real-part contour map of the Continuous Wavelet Transform (CWT) coefficients; and (d) wavelet variance spectrum of the NDVI.
Applsci 16 07387 g009
Figure 10. Wavelet coherence plots between meteorological factors and NDVI in Heilongjiang Province in 1990–2024. Colors represent coherence strength, black contours indicate the 95% confidence level, the shaded region indicates the cone of influence, and arrows indicate the phase relationship.
Applsci 16 07387 g010
Table 1. Temporal scales, spatial scales, and data sources provided by various research institutions.
Data TypeData NameTime ScaleTime SpanSource
Meteorological dataPrecipitationAnnual1990–2024https://www.ncdc.ac.cn/portal/metadata/21691d03-bef2-4800-924e-5614e7268b87 (accessed on 5 February 2026)
Average temperatureAnnual1990–2024
Potential evapotranspirationAnnual1990–2024
Vegetation dataAverage NDVIAnnual1990–2024https://www.earthdata.nasa.gov/data (accessed on 6 February 2026)
Disclaimer/Publisher’s Note: The statements, opinions and data contained in all publications are solely those of the individual author(s) and contributor(s) and not of MDPI and/or the editor(s). MDPI and/or the editor(s) disclaim responsibility for any injury to people or property resulting from any ideas, methods, instructions or products referred to in the content.