1. Introduction
With the aim of optimizing and sustaining the management of soils, crops, and the environment, the understanding of soil and its traceability has become an increasingly important concern for farmers, livestock breeders, foresters, climatologists, and their partners [
1]. A wide range of soil analyses are offered by laboratories to contribute to this approach as well as to address the growing need to monitor quality and promote respect for the environment and consumer health [
2]. Soil samples are often taken to provide an estimate of nutrient availability for crop growth [
3]. Soil is analyzed for its pH level and N, P, K, Ca, and Mg contents, as fertilizers are dependent on the availability of these elements in the soil [
4]. Soil structure, granulometry, water retention capacity, and trace metal elements are other recommended analytical properties of agricultural soils [
5,
6]. Most methods of soil analysis are standardized so that results are comparable among laboratories applying the same standard.
Facing increasingly stringent requirements regarding the reliability and traceability of analytical results, laboratories have adopted recognized quality systems, such as accreditation or approval by Ministries of Agriculture. Another essential tool enabling laboratories to demonstrate and maintain control over their analytical quality is participation in proficiency tests (PTs) where reference materials are used. Participation in PTs is also a mandatory requirement for obtaining accreditation under the ISO/IEC 17025 standard [
7].
Proficiency tests are based on interlaboratory comparisons to evaluate the analytical performance of laboratories by comparing their measurement results with the true value of the analyte [
8]. The true value can only be determined at a high confidence level if a certified reference material is used for the PTs, but certified reference materials are not always available for the specific purposes of PTs, or they are too costly for regular use [
9]. An assigned value as a consensus statistical estimation from the participants’ results, particularly those of accredited laboratories, on a reference material can be an alternative to the true value [
10].
Laboratories’ performance is often expressed in the form of a score which allows for measurement results to be comparable for different measurands and over multiple PT rounds. The comparison of performance scores of different laboratories on the same measurand over multiple PT rounds can provide information on whether their performance is held to the standard over a long period of time, or if there are any systematic or random biases in one or many PT rounds. A standardized
z-score, calculated from the robust mean of the participants’ results and its associated standard deviation, is frequently used in proficiency assessment [
10,
11].
A laboratory that implements a good internal quality control system can have low measurement variability under repeatability conditions where independent results are obtained with the same analytical procedure, in the same laboratory, on identical test items, by the same operator, using the same equipment. However, the laboratory’s performance can be influenced when these repeatability factors are not constant over a long period of time.
While PTs focus on evaluating the accuracy and reliability of test results during a single test round, they provide limited insight into the consistency of the laboratory performance when measurements are repeated on identical test material months or years later under intermediate-precision conditions involving different analysts, instruments, or operating circumstances [
12]. An interlaboratory PT design that enables the evaluation of the performance achieved under intermediate-precision conditions is of great importance for laboratories pursuing international standards or aiming to validate an analytical method when they are concerned with reproducibility on a wide range of test materials or over a long period of time.
This study presents the results of four interlaboratory proficiency tests conducted on two different types of soil. To evaluate the long-term laboratory performance, a second blind test was organized 28 and 17 months after the initial test for each soil, respectively. The same laboratories participated in both rounds and applied the same analytical methods. These tests enabled participating laboratories to compare their results not only with those of other laboratories within each individual proficiency testing round, but also with their own performance across the two preceding testing rounds on the same matrix.
2. Materials and Methods
2.1. Experimental Design
Two different batches of agricultural sandy soil (Sample A and Sample B) were sent to 27 laboratories in Belgium, France, Germany, and Morocco for analysis under time-different intermediate-precision conditions. Each sample was analyzed in two PT rounds separated by 28 months (in January 2020 and May 2022 for Sample A) and 17 months (in December 2020 and April 2022 for Sample B). Laboratories were asked to analyze the contents of moisture, P2O5, pH, exchangeable cations K+, Ca2+, Mg2+, organic carbon, and nitrate, ammoniacal, and total nitrogen following the same standardized methods. All tests were organized in the form of a blind test where the laboratories did not have prior information about the types of soil to avoid interference with the assessment of laboratory performance.
2.2. Sample Production
A batch of sandy soil from Haut-Rhin, France (sample A), and another sandy-silty soil batch from Normandy, France (sample B), were chosen for this study. The procedure for preparing the samples sent to the laboratories was the same for both batches: first, soil was air-dried and sieved at 2 mm in accordance with the ISO 11464 standard [
13]. Then, each batch was homogenized and divided into 128 samples of 750 g using a specific rotary machine—a carousel—that guarantees progressive filling to obtain the homogeneous distribution of the raw material across all test items.
The homogeneity of the soil samples prepared using this procedure was assessed through experimental studies conducted on 10 samples randomly selected from the same batch, each analyzed in duplicate, in accordance with the requirements of Annex B of the ISO 13528 standard [
10].
A set of the produced samples was sent to the laboratories participating in the first two regular proficiency tests just after production (January 2020 and December 2020, respectively). Surplus samples were stored at ambient temperature (20 °C ± 5 °C) in thermally sealed packaging to limit water and gas exchanges and out of direct light and sent to the same laboratories at time intervals of 28 and 17 months.
2.3. Sample Analysis
For each test, participating laboratories were asked to analyze the samples within a period of one month from the date of shipping. The methods required to determine the content of the 12 analytes for this study are summarized in
Table 1.
2.4. Statistical Analysis
2.4.1. Determination of Assigned Values and Standard Deviations
The results of the four proficiency tests were evaluated in accordance with the ISO 13528 standard [
10]. For each analyte, Algorithm A described in Annex C3 of ISO 13528 was applied to derive the consensus assigned value,
, and the standard deviation for proficiency assessment,
. Algorithm A transformed the original results reported by the participating laboratories through winsorization and provided robust estimates of the mean and standard deviation. Algorithm A began by setting an initial value for the robust mean, defined as the median of the results, and an initial value for the robust standard deviation, fixed at 1.483 median of the deviations from the initial robust mean. To limit the influence of outlying results, large deviations were down-weighted instead of being excluded from the calculation of the new values for the robust mean and the robust standard deviation, and then they were iteratively updated until no further change occurred between iterative calculations. The method is useful for approximately normal data where outliers constitute less than 20%. Coefficients of variation (CVs) expressed as relative standard deviations,
/
%, were also calculated as they provided a measure of the dispersion of the results around the assigned value.
In order to evaluate the intermediate precision of an analytical method performed on the identical samples by the same laboratory in two different PT rounds, a standard deviation was estimated from all observed differences between two measurements, using the Equation (1), as described in the ISO 5725-3 standard [
12] below:
where
i = laboratory
i participating in the proficiency test,
= the number of laboratories participating in the estimation of the assigned value,
= the measurement of the laboratory
i in the first PT round,
= the measurement performed on the same batch of test soil by the laboratory
i in the second PT round, and
= the intermediate precision standard deviation of measurements performed on the same batch of soil by the same laboratories participating in two different PT rounds. The subscript (T) denoted time as an intermediate factor influencing the precision of an analytical method. It could reflect variability of test results arising from uncontrollable environmental conditions (e.g., humidity and temperature) as well as changes in analysts or equipment when they were determined at different times.
2.4.2. Criteria for Assessing Individual Laboratory Proficiency
Laboratory performance was evaluated using the standardized
z-score, as recommended by ISO 13528. The
z-score for a result
was calculated as:
where
i = laboratory
i participating in the proficiency test,
= test result of the laboratory
i,
= assigned value,
= standard deviation for proficiency assessment, and
=
z-score calculated for the test result
.
The performance of a laboratory based on a z-score was interpreted as follows:
if || ≤ 2.0, the result of the laboratory i was considered to be acceptable;
if 2.0 < || ˂ 3.0, the result of the laboratory i was considered to give a warning signal;
if || ≥ 3.0, the result of the laboratory i was considered to be unacceptable.
Given the z-score associated with each result and the number of results submitted for a proficiency test, the number of acceptable results, the number of warning results, and the number of unacceptable results, were calculated for each analyte. In general, a high number of acceptable results is an indicator of good performance of participating laboratories. However, an internal investigation of the sources of large measurement deviations is necessary for the warning and unacceptable results. Based on the conclusion of the investigation, the laboratories decide if the implementation of corrective and/or preventive actions should be taken.
3. Results
3.1. General Results
The statistical parameters for the four proficiency tests are summarized in
Table 2 and
Table 3 for Sample A and
Table 4 and
Table 5 for Sample B. Participation by analyte varied from 12 to 27 laboratories. All participants applied the same analytical method for each analyte, and the same laboratories participated in both rounds for each type of soil.
Because the assigned values were robust estimates, outlying results were excluded solely when they could be attributed to analytical errors. Only one incoherent result was detected for the analysis of exchangeable acidity (pH using a KCl extraction solution) on Sample B, as the laboratory indicated a higher value than the result reported for active acidity (pH using a water extraction solution). This value was not considered in the calculation of the assigned value.
Preliminary examination of statistical parameters demonstrated the overall low dispersion of the results for all analytes of both samples (
Table 2 and
Table 4). The CVs were in the range of 1–9%, except for 14% of ammoniacal nitrogen in the January 2020 test, indicating the low variability of the results within each round. In addition, the small intermediate precision standard deviations implied the analytical quality of the laboratories when two measurements were performed with high reliability even though they were taken at long intervals of 17 and 28 months.
The high proportion of acceptable results demonstrated the overall good performance of the participating laboratories (
Table 3 and
Table 5). More than 88% of the results were acceptable, except for 4 (3 with warning signals and 1 unacceptable) results for moisture content in the April 2022 test and 5 (3 with warning signals and 2 unacceptable) results for ammoniacal nitrogen content in the December 2020 test, accounting for 15% and 19% of the results, respectively.
A slight decrease was observed for nitrate nitrogen content, with a corresponding increase in ammoniacal nitrogen content, particularly on Sample A, showing the evolution of ammoniacal nitrogen over time. This higher variability compared to the other analyses might be due to analytical factors related to the extraction and determination procedure, such as the soil-to-extractant ratio, extraction time, and sampling techniques (sample homogenization before sampling). The extractions used for inorganic nitrogen were in fact more sensitive to laboratory errors than the other analyses. However, considering the low coefficients of variation (under 15%), the within-round measurement variability was small for these analytes.
In addition, the small differences in the assigned values between the two blind rounds and the low variability of the results for all analytes provided evidence of the homogeneity and stability of the matrices used for these PTs (
Table 2 and
Table 4).
3.2. Individual Laboratory Performance
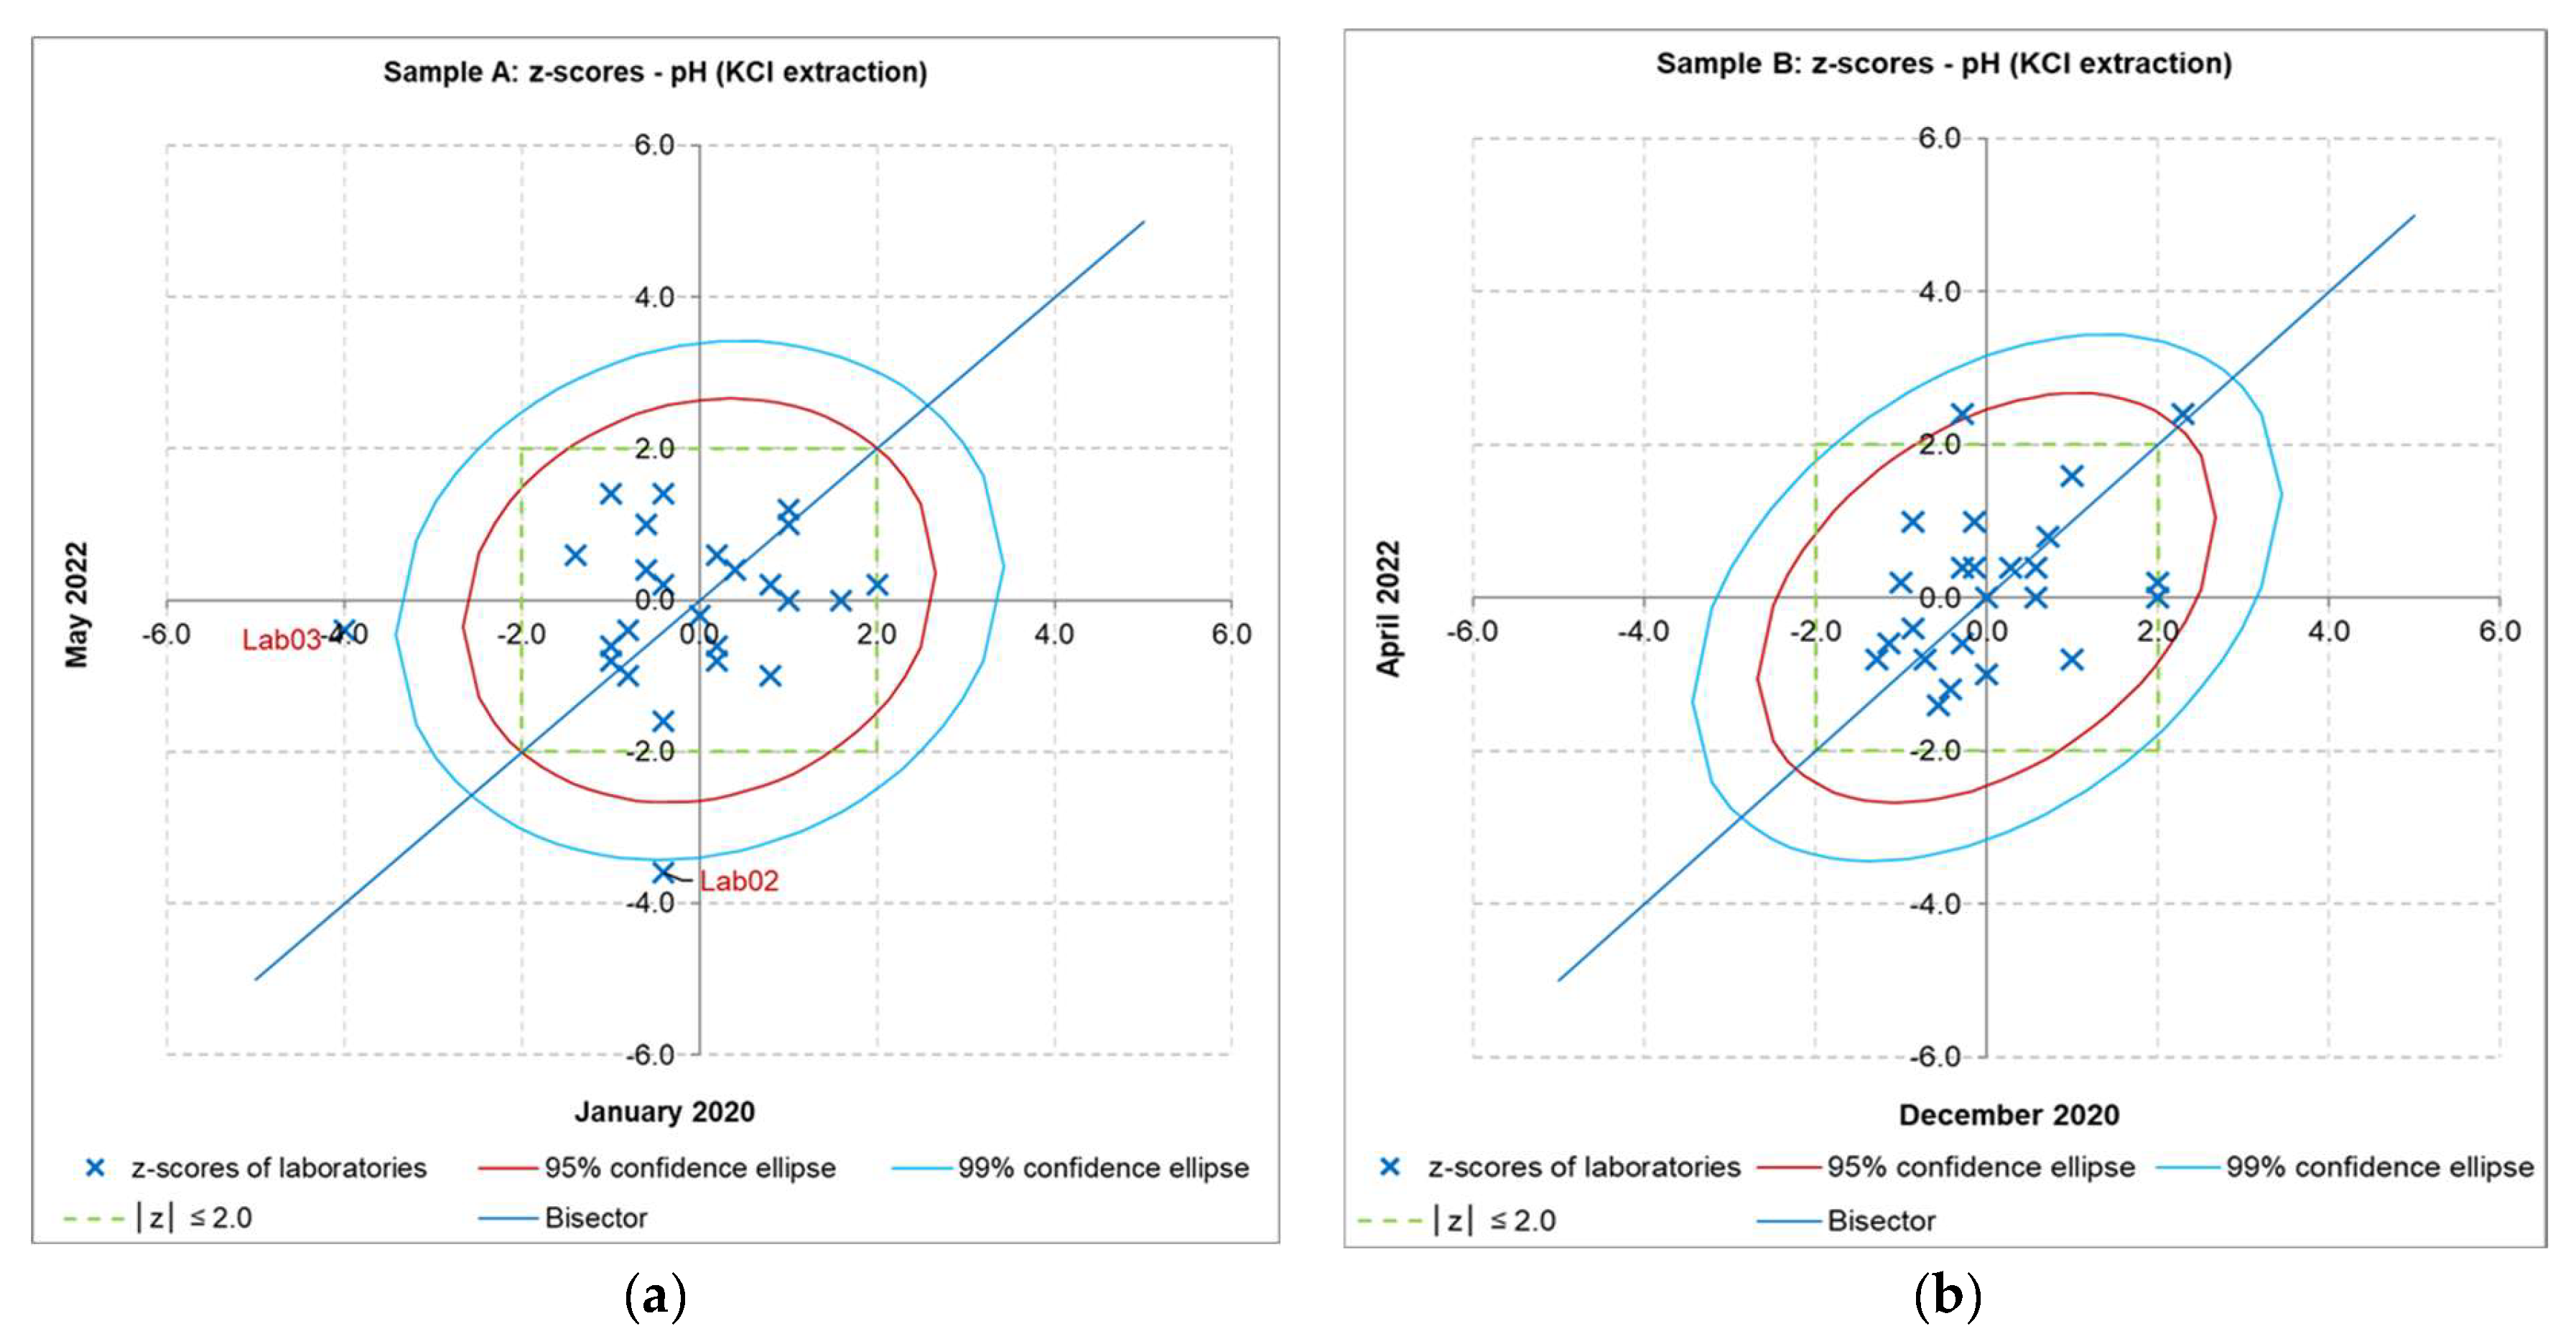
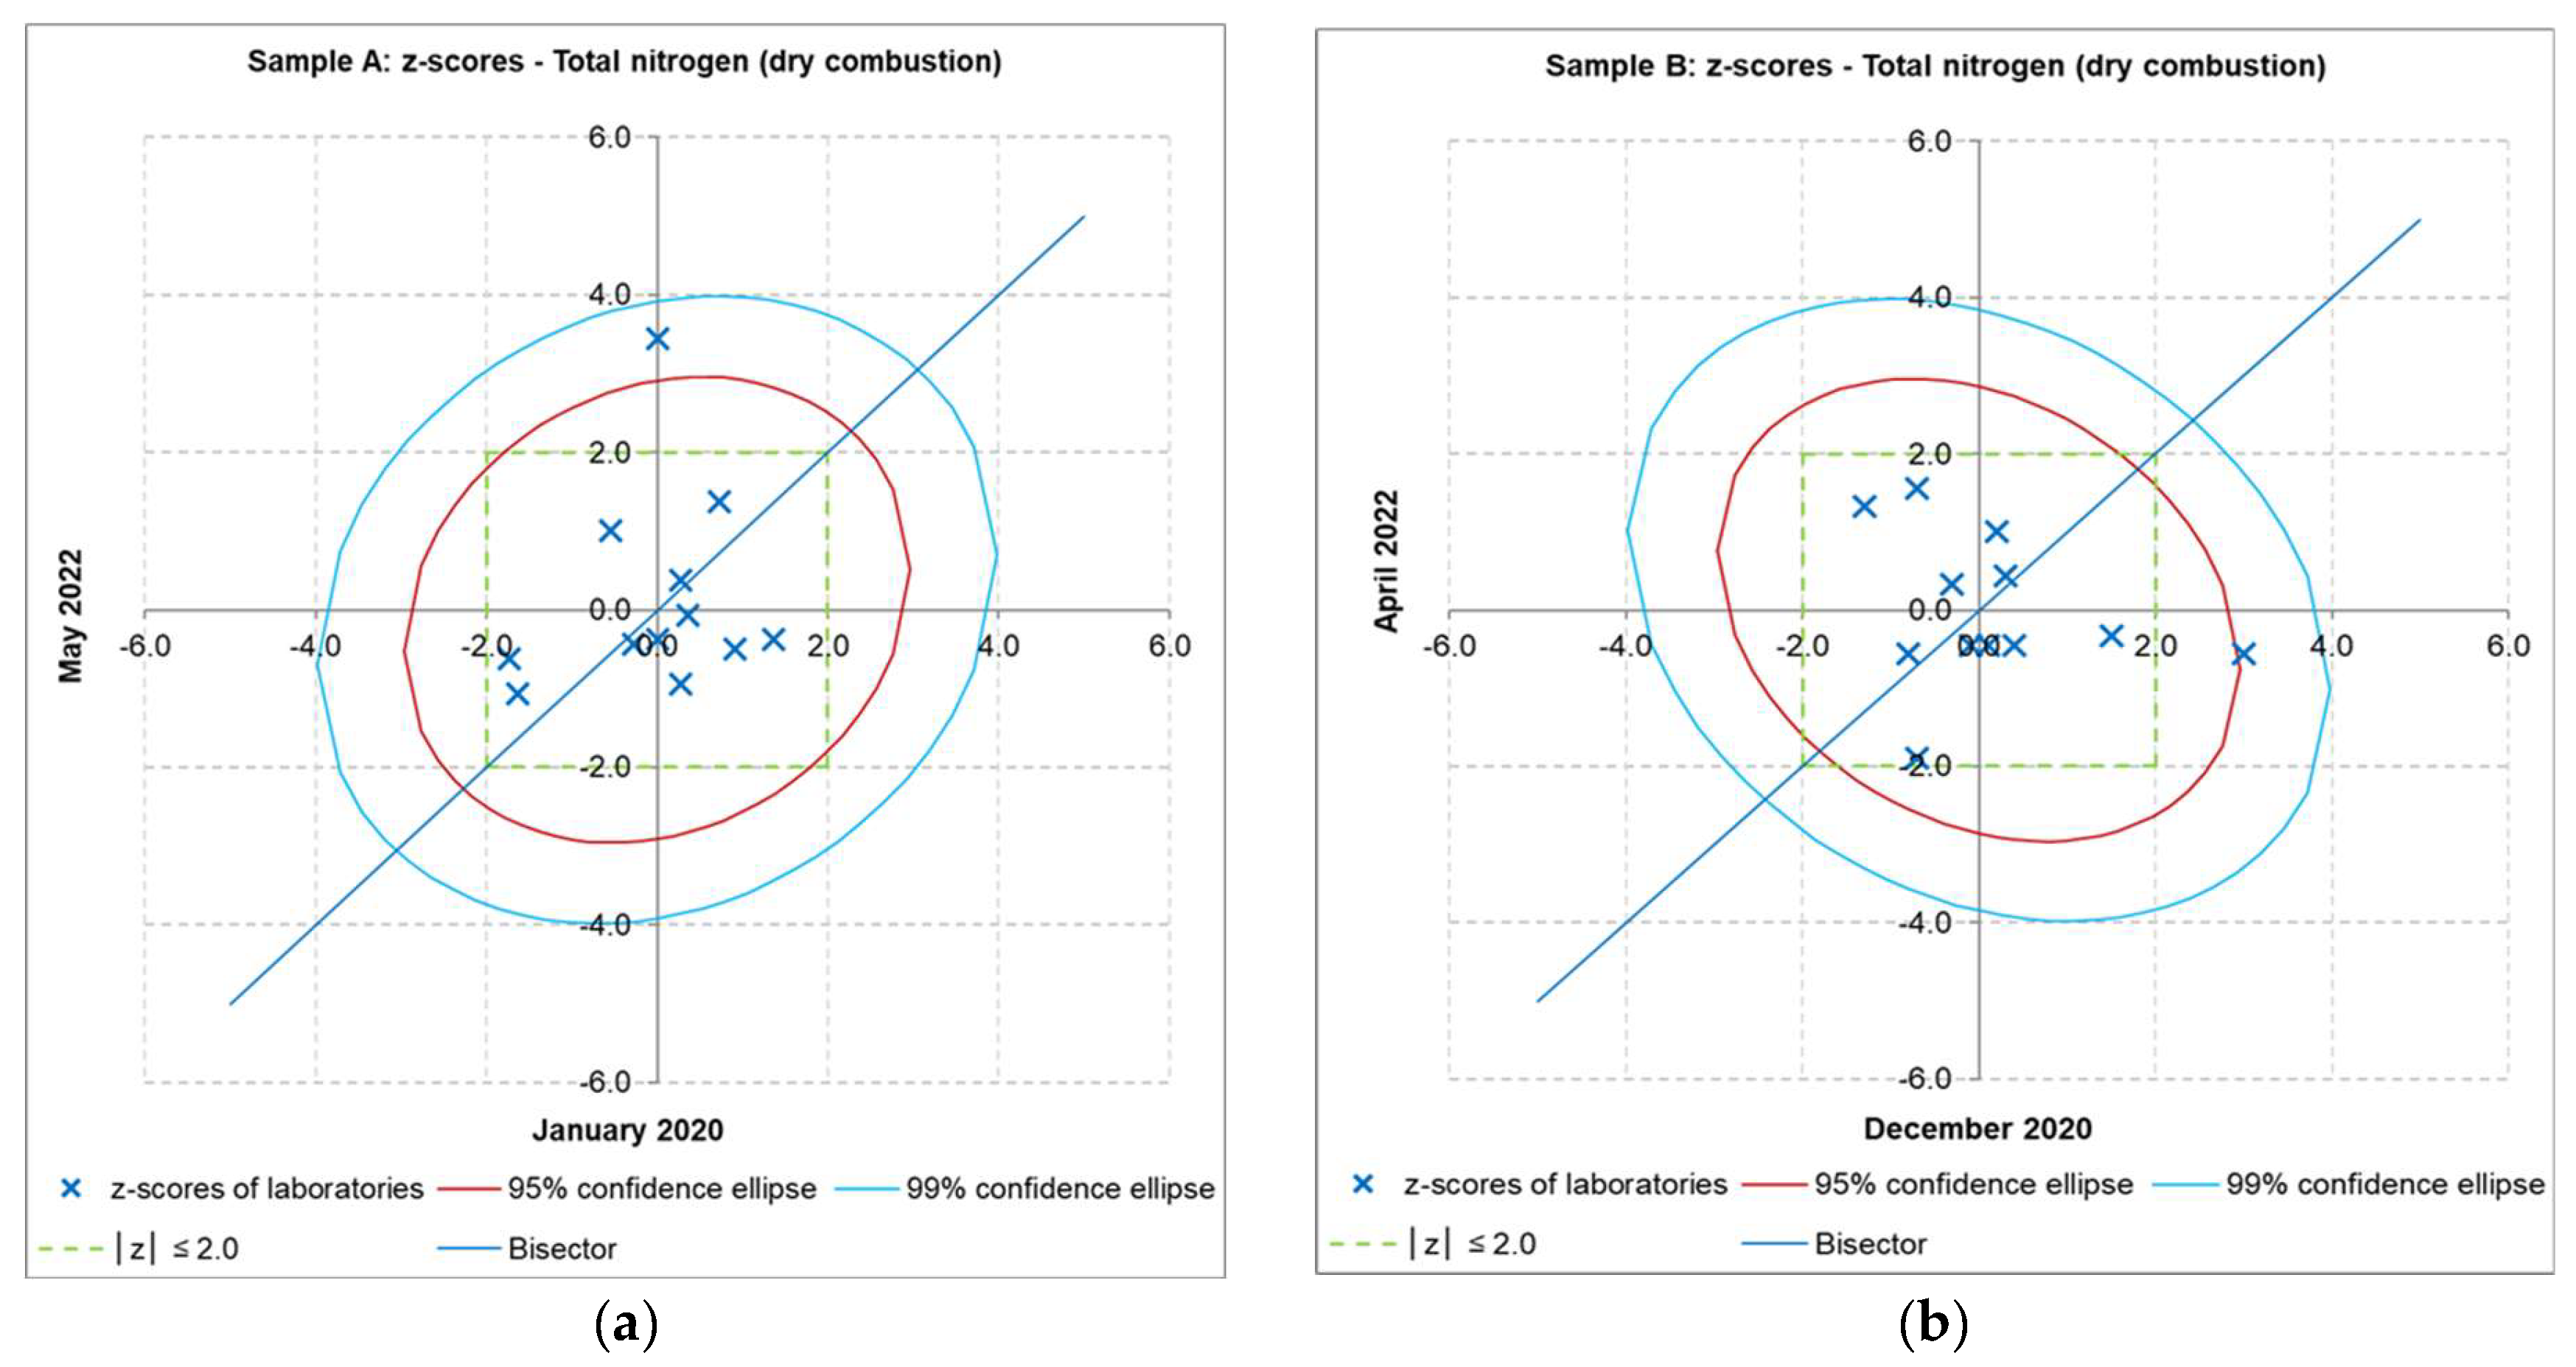
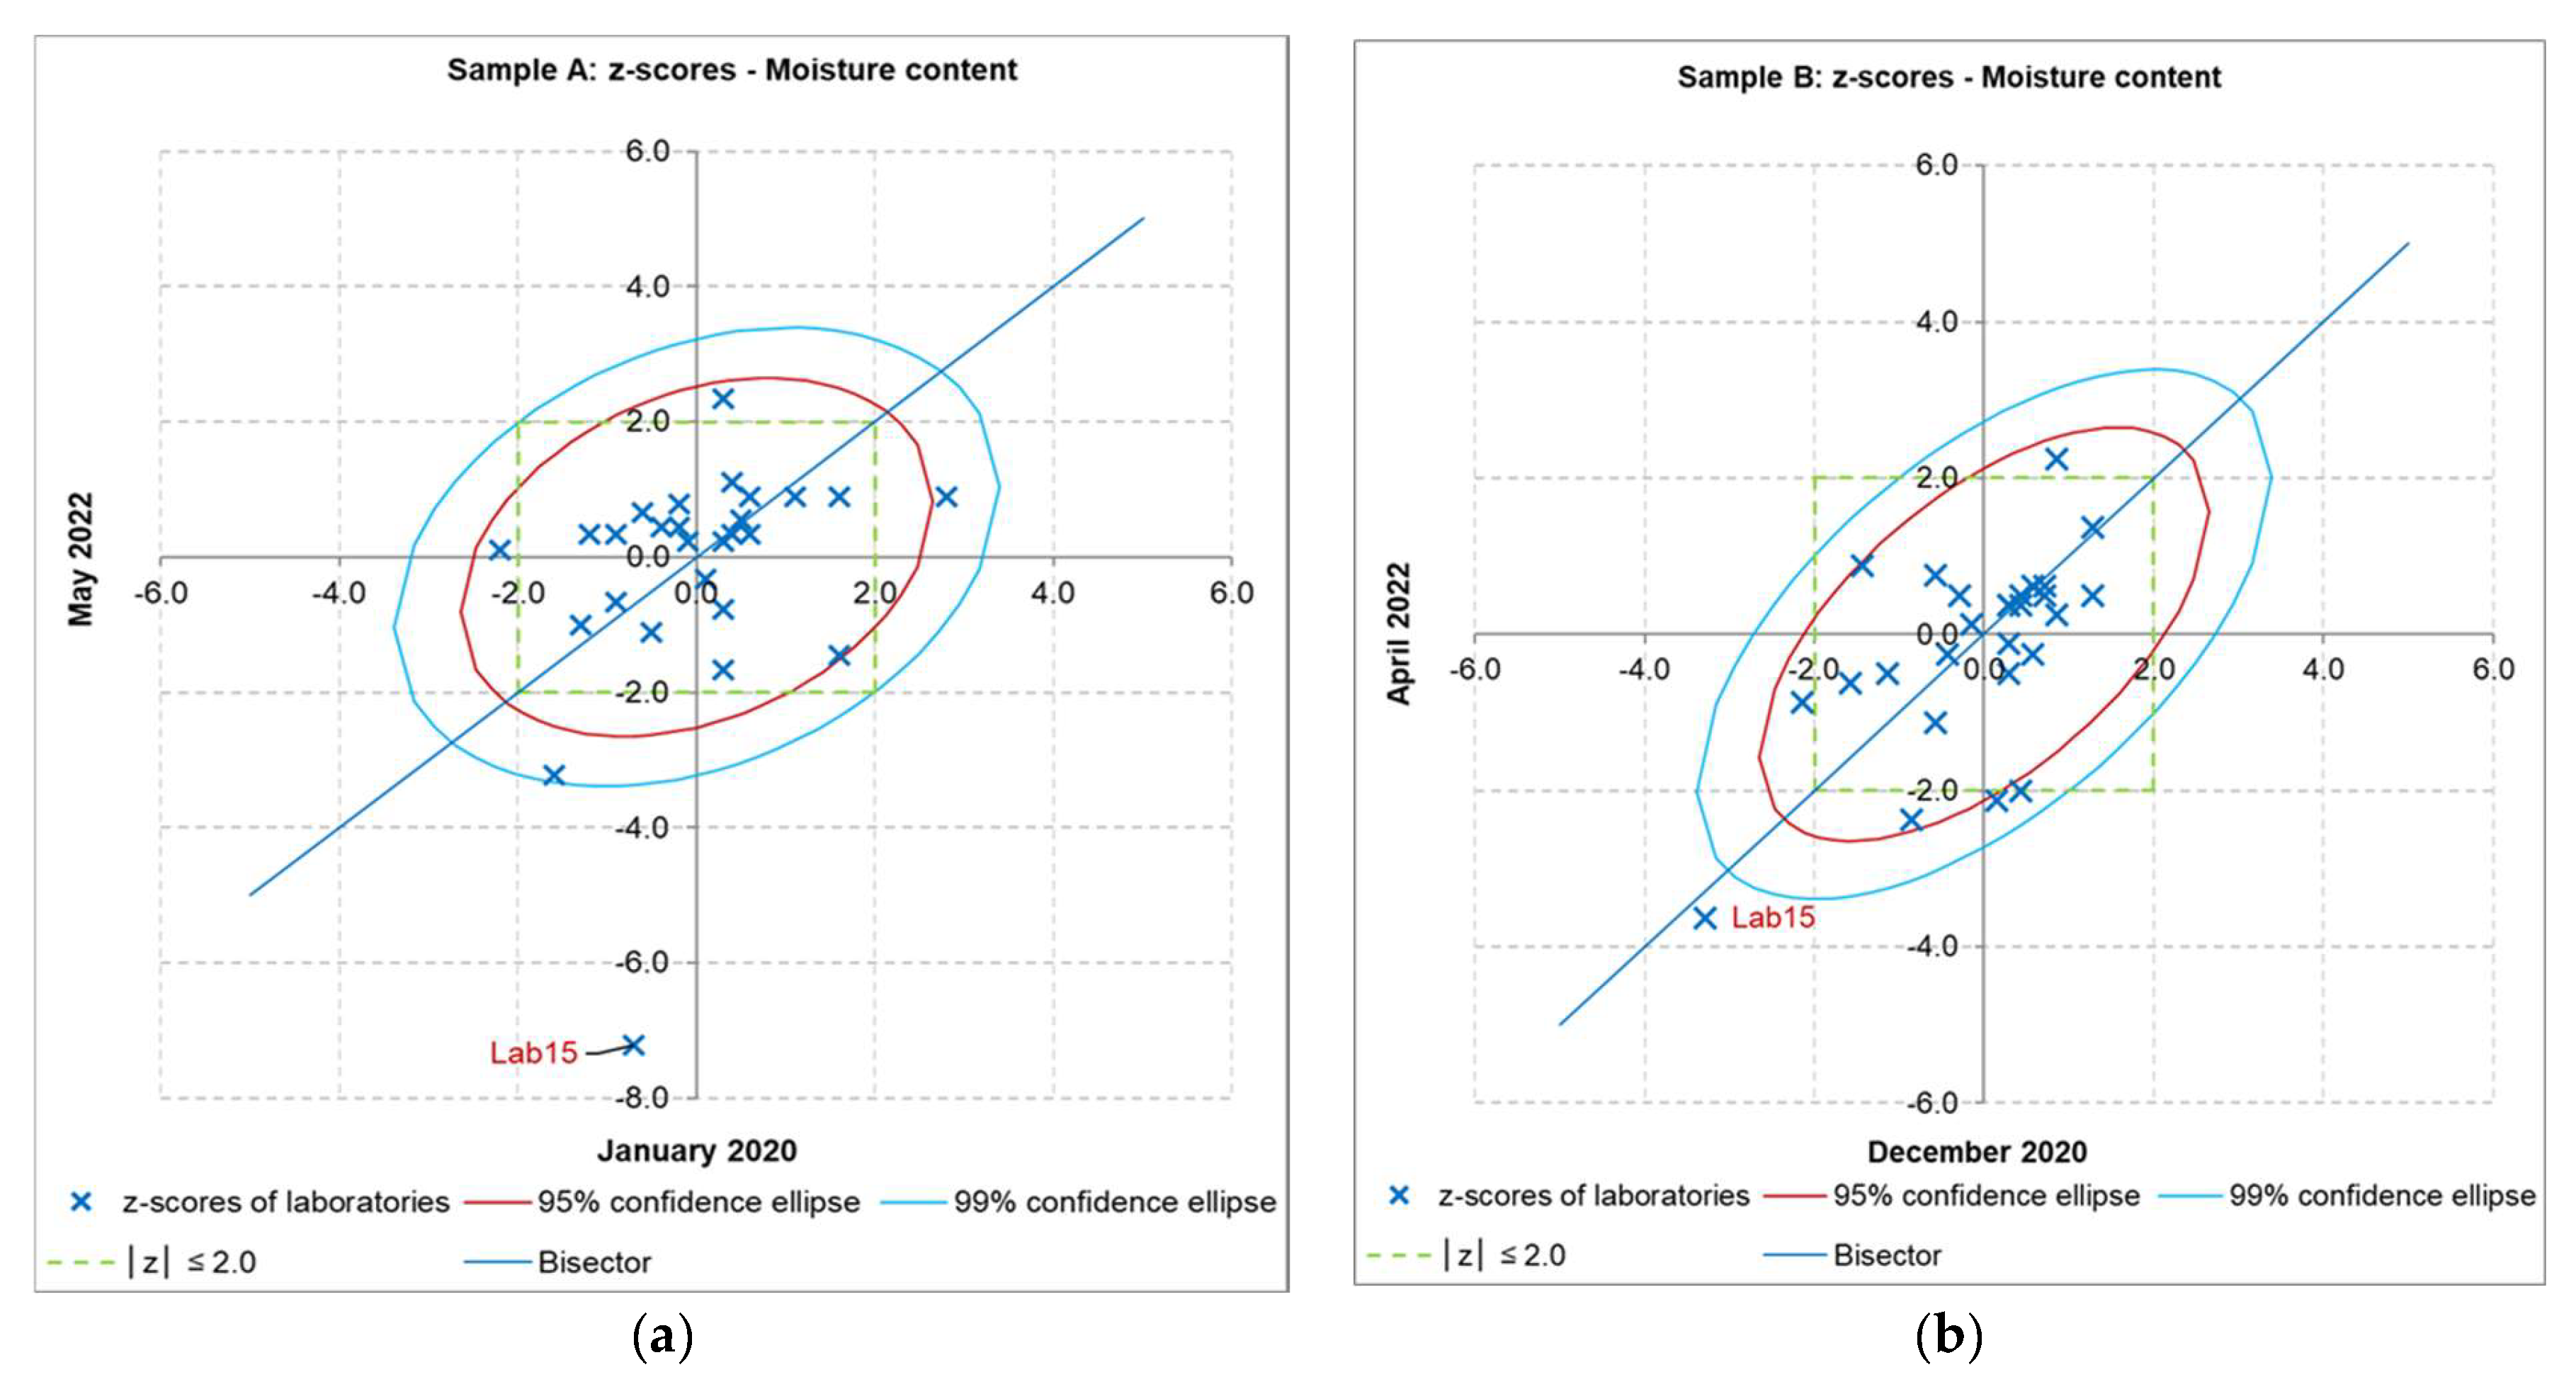
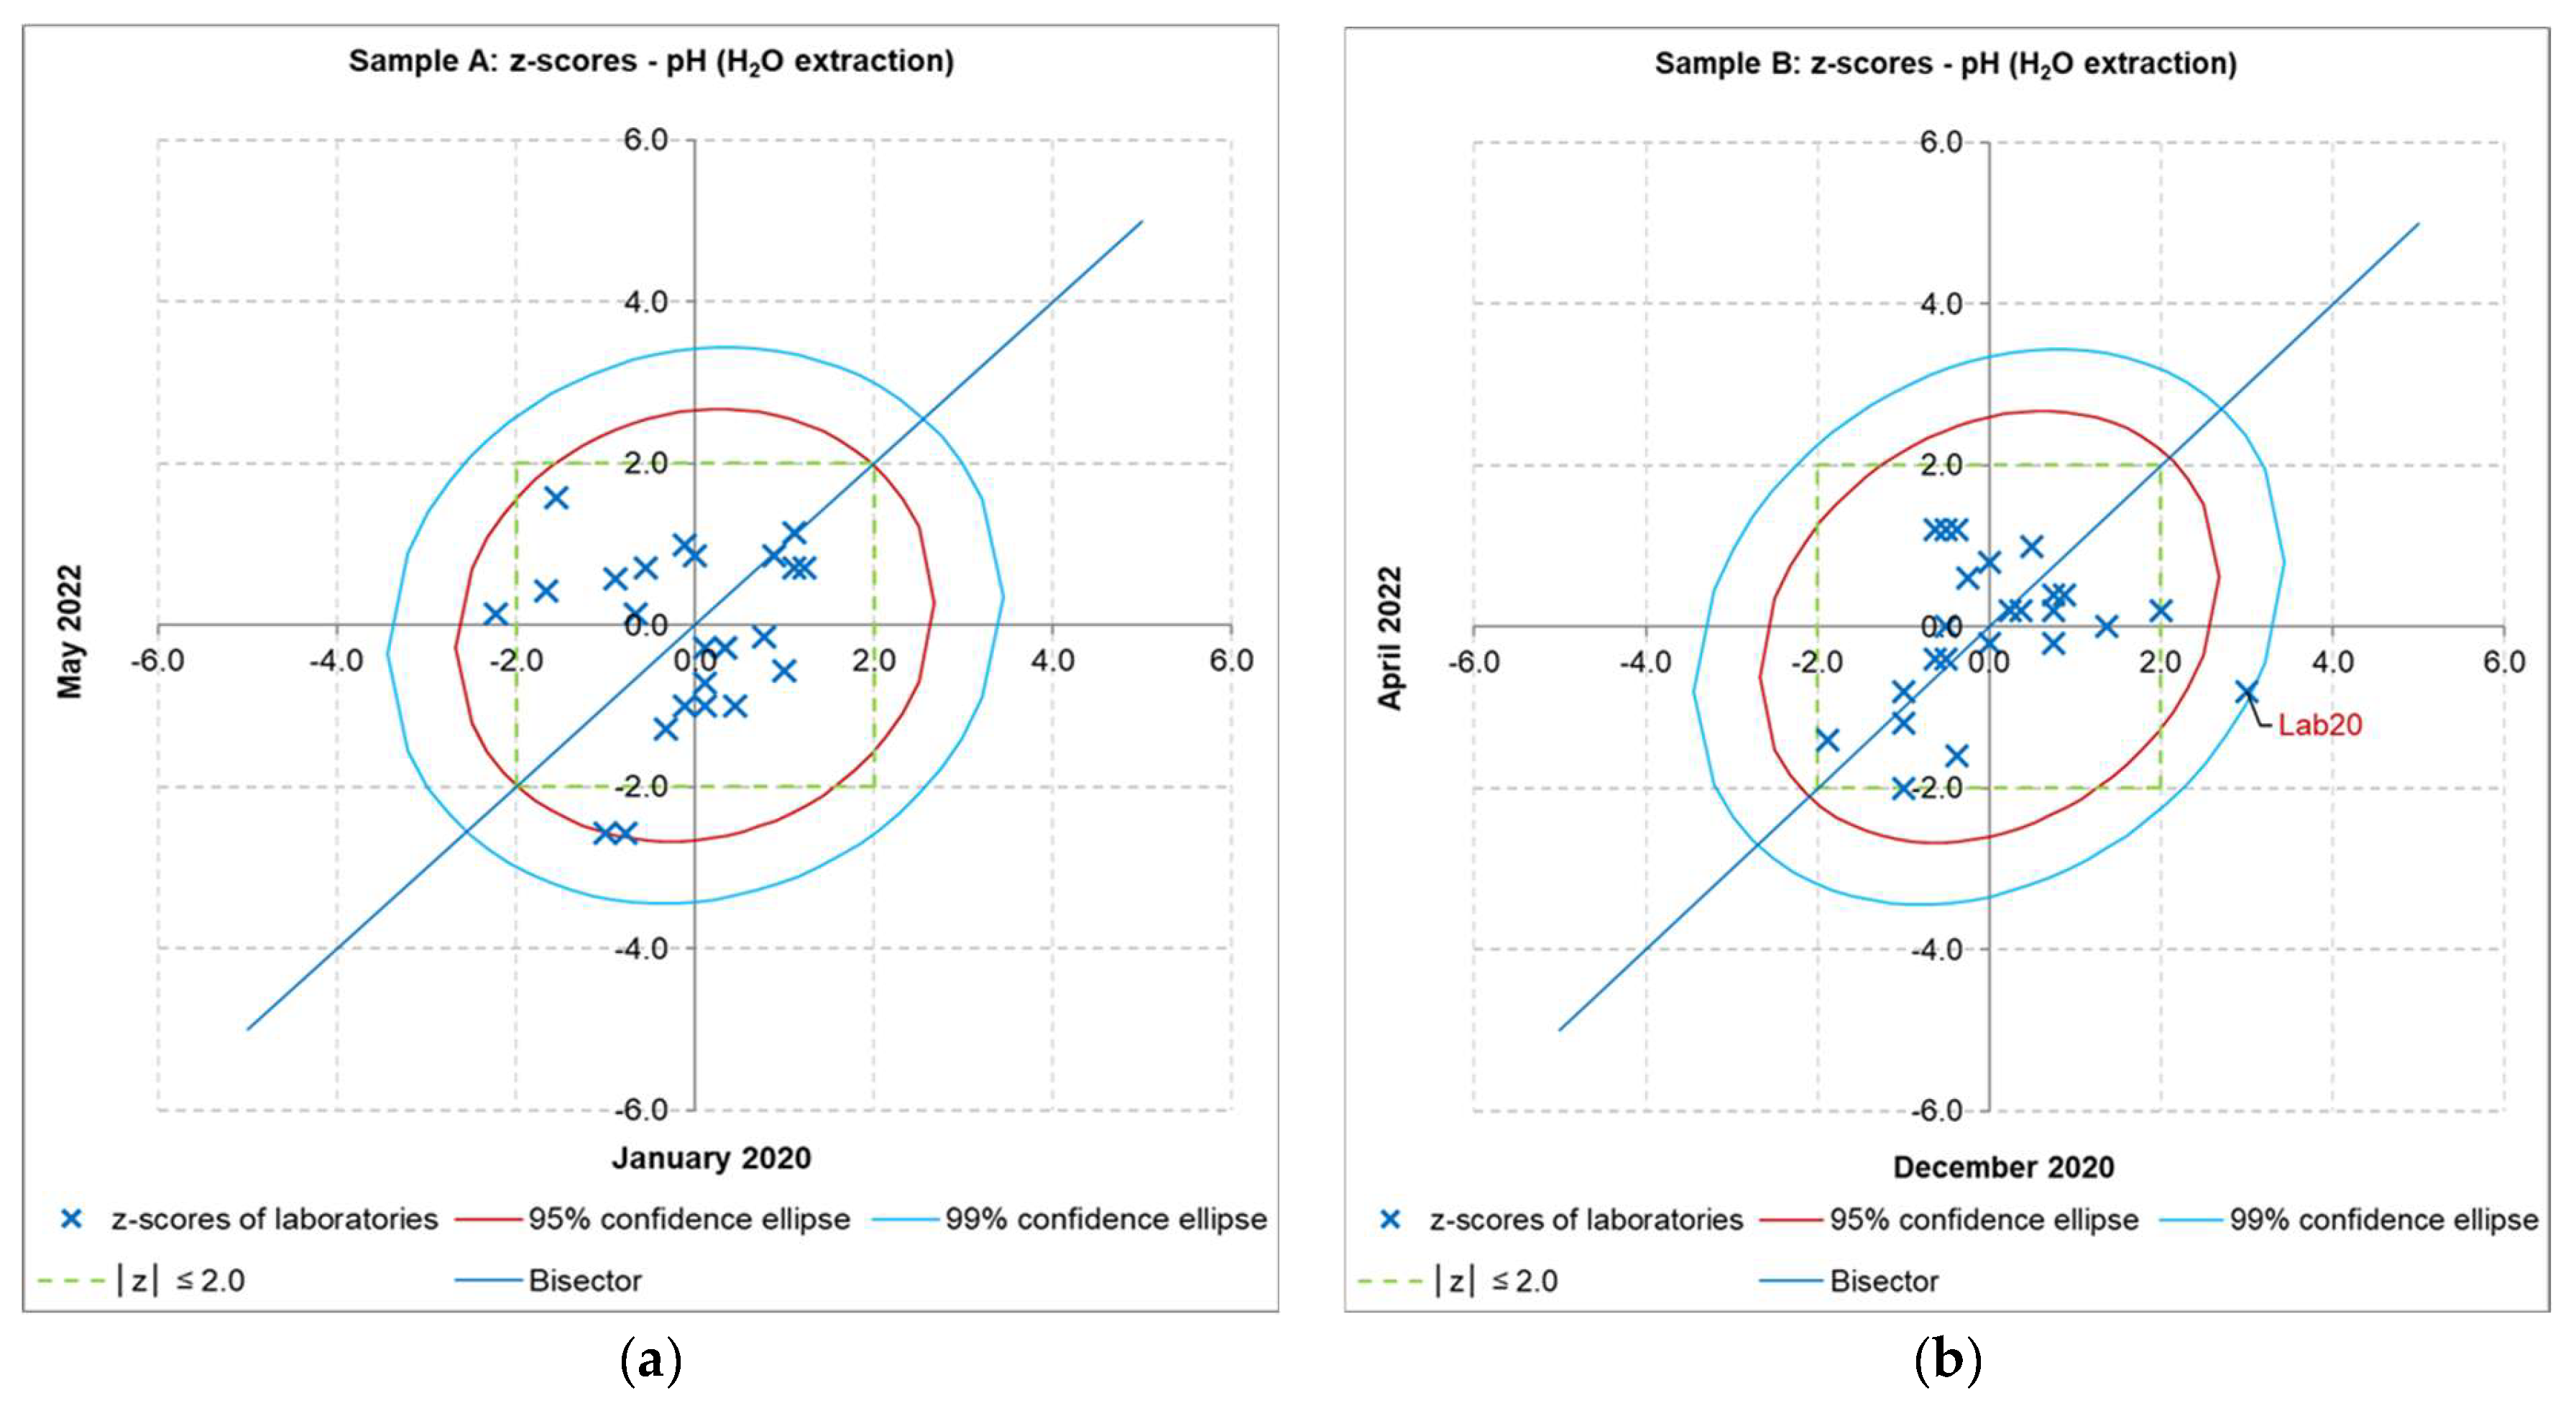
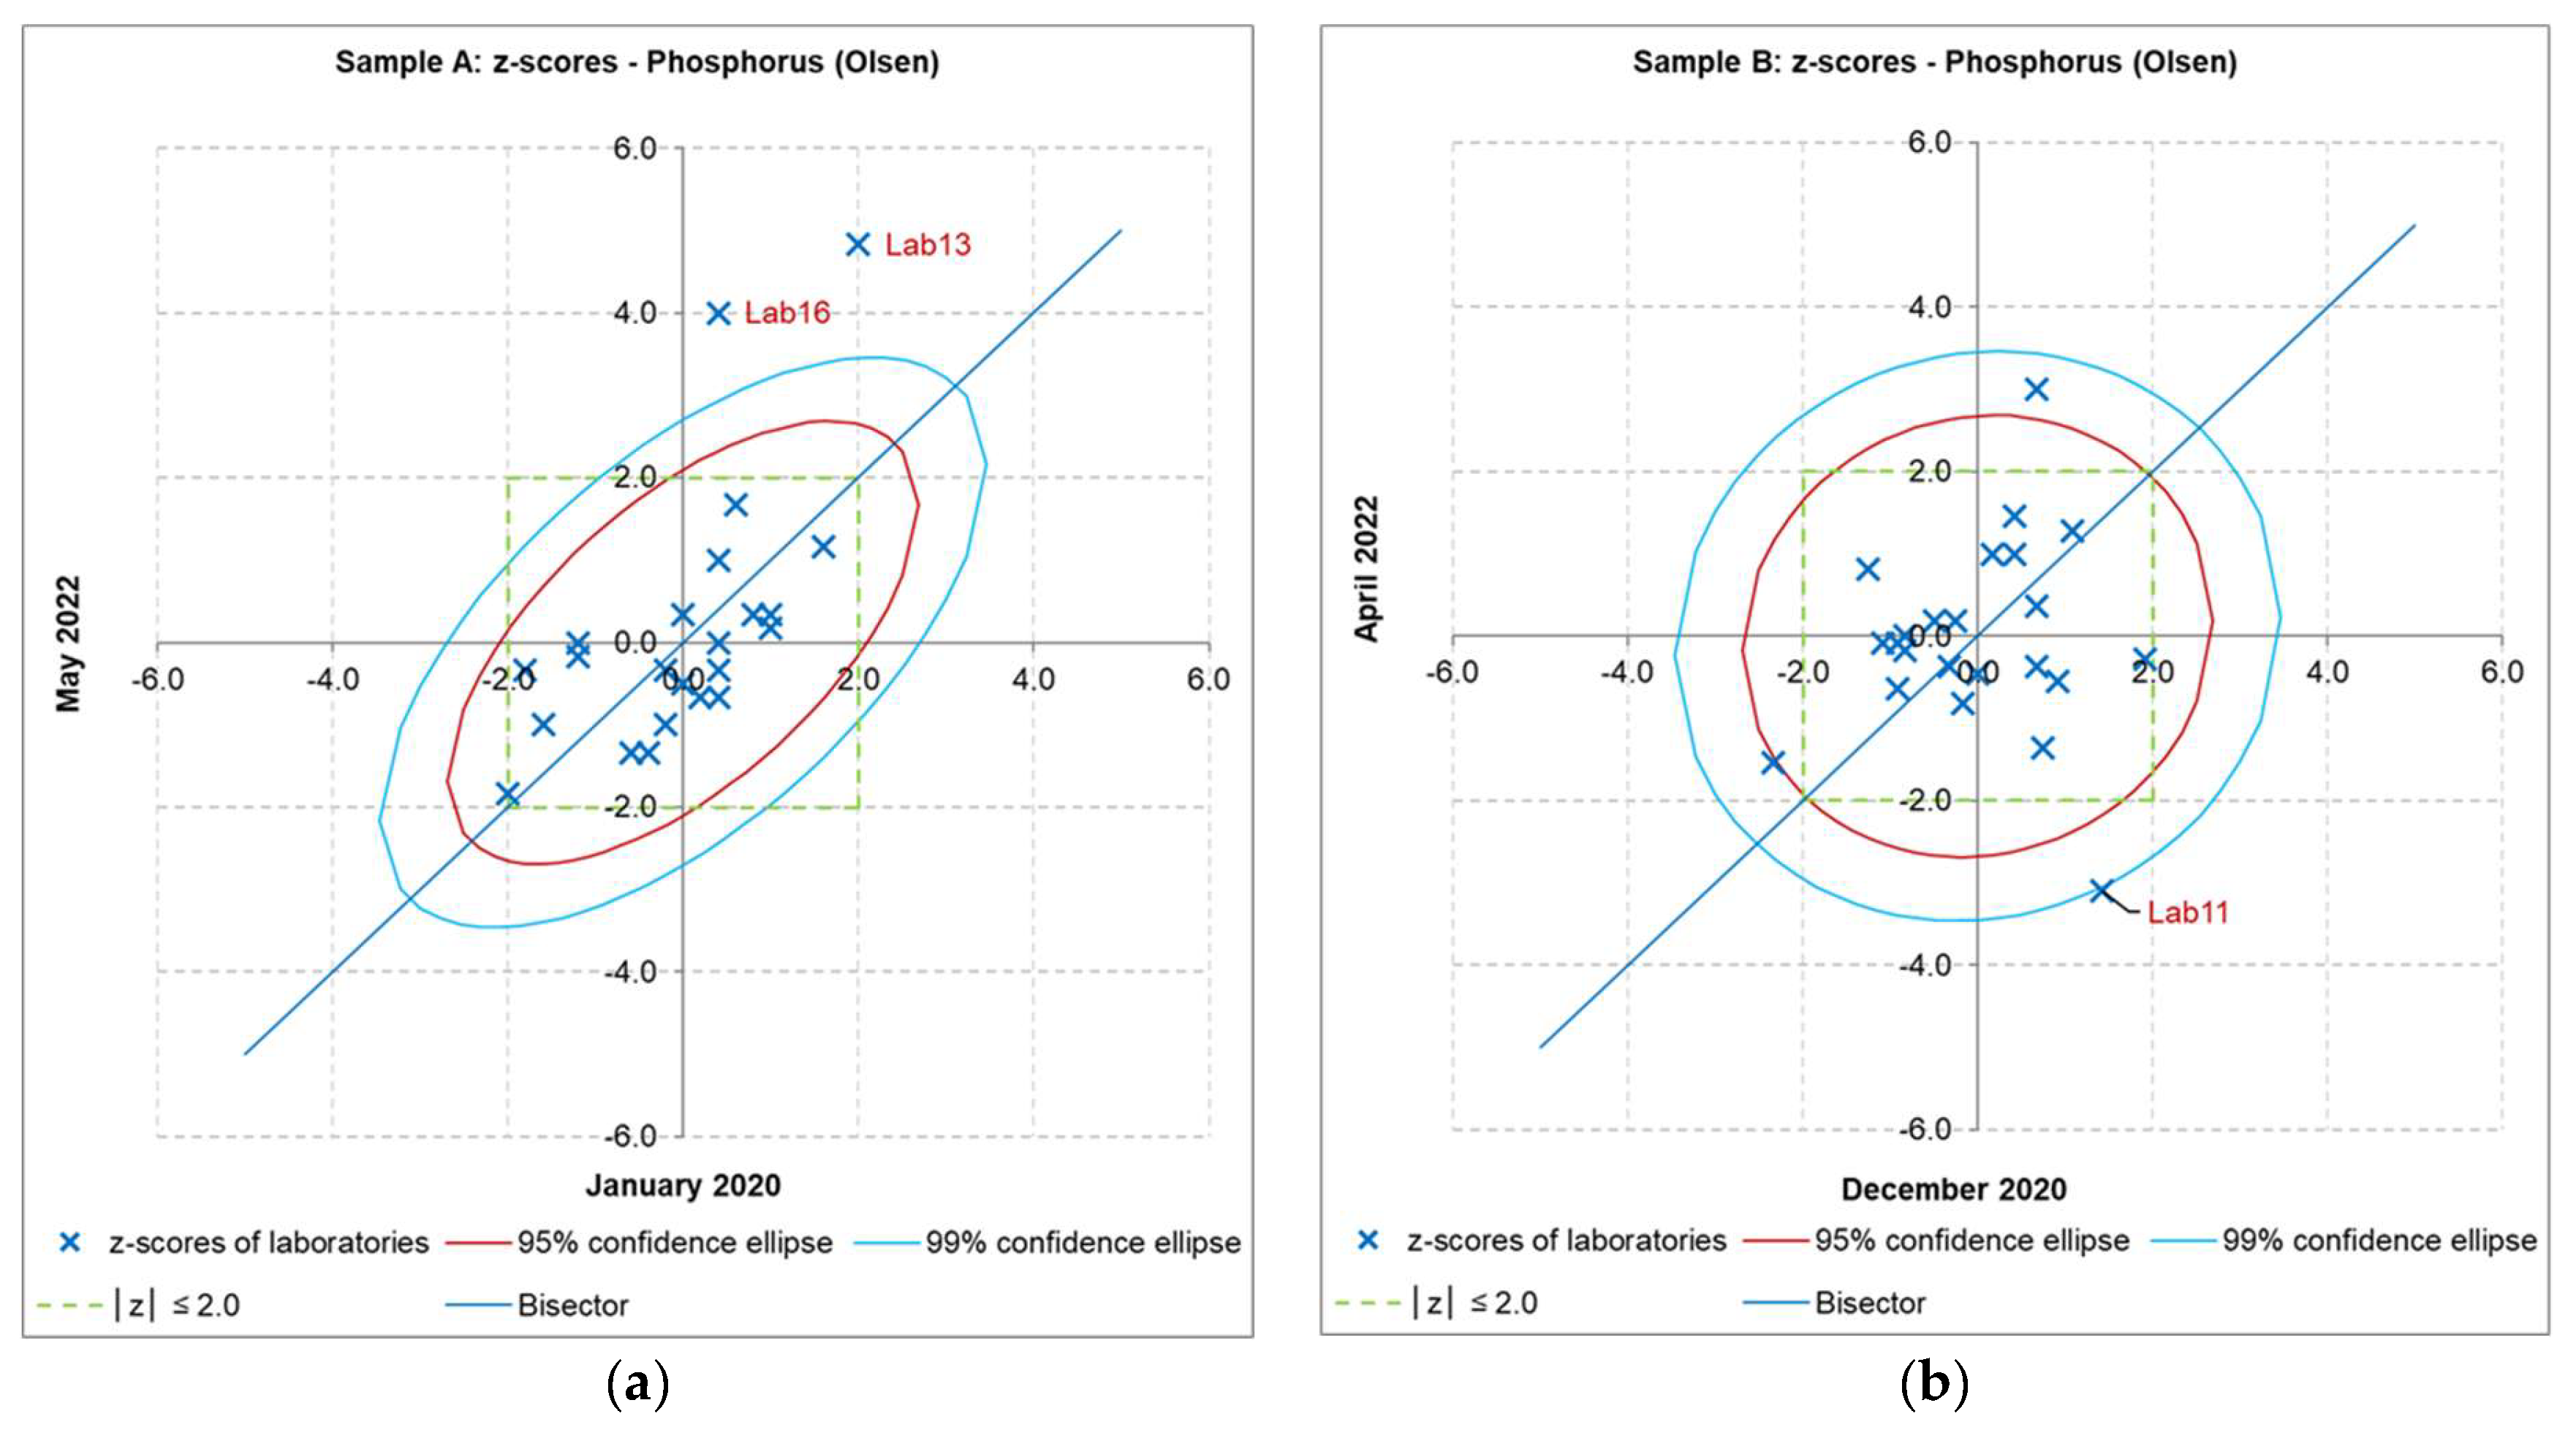
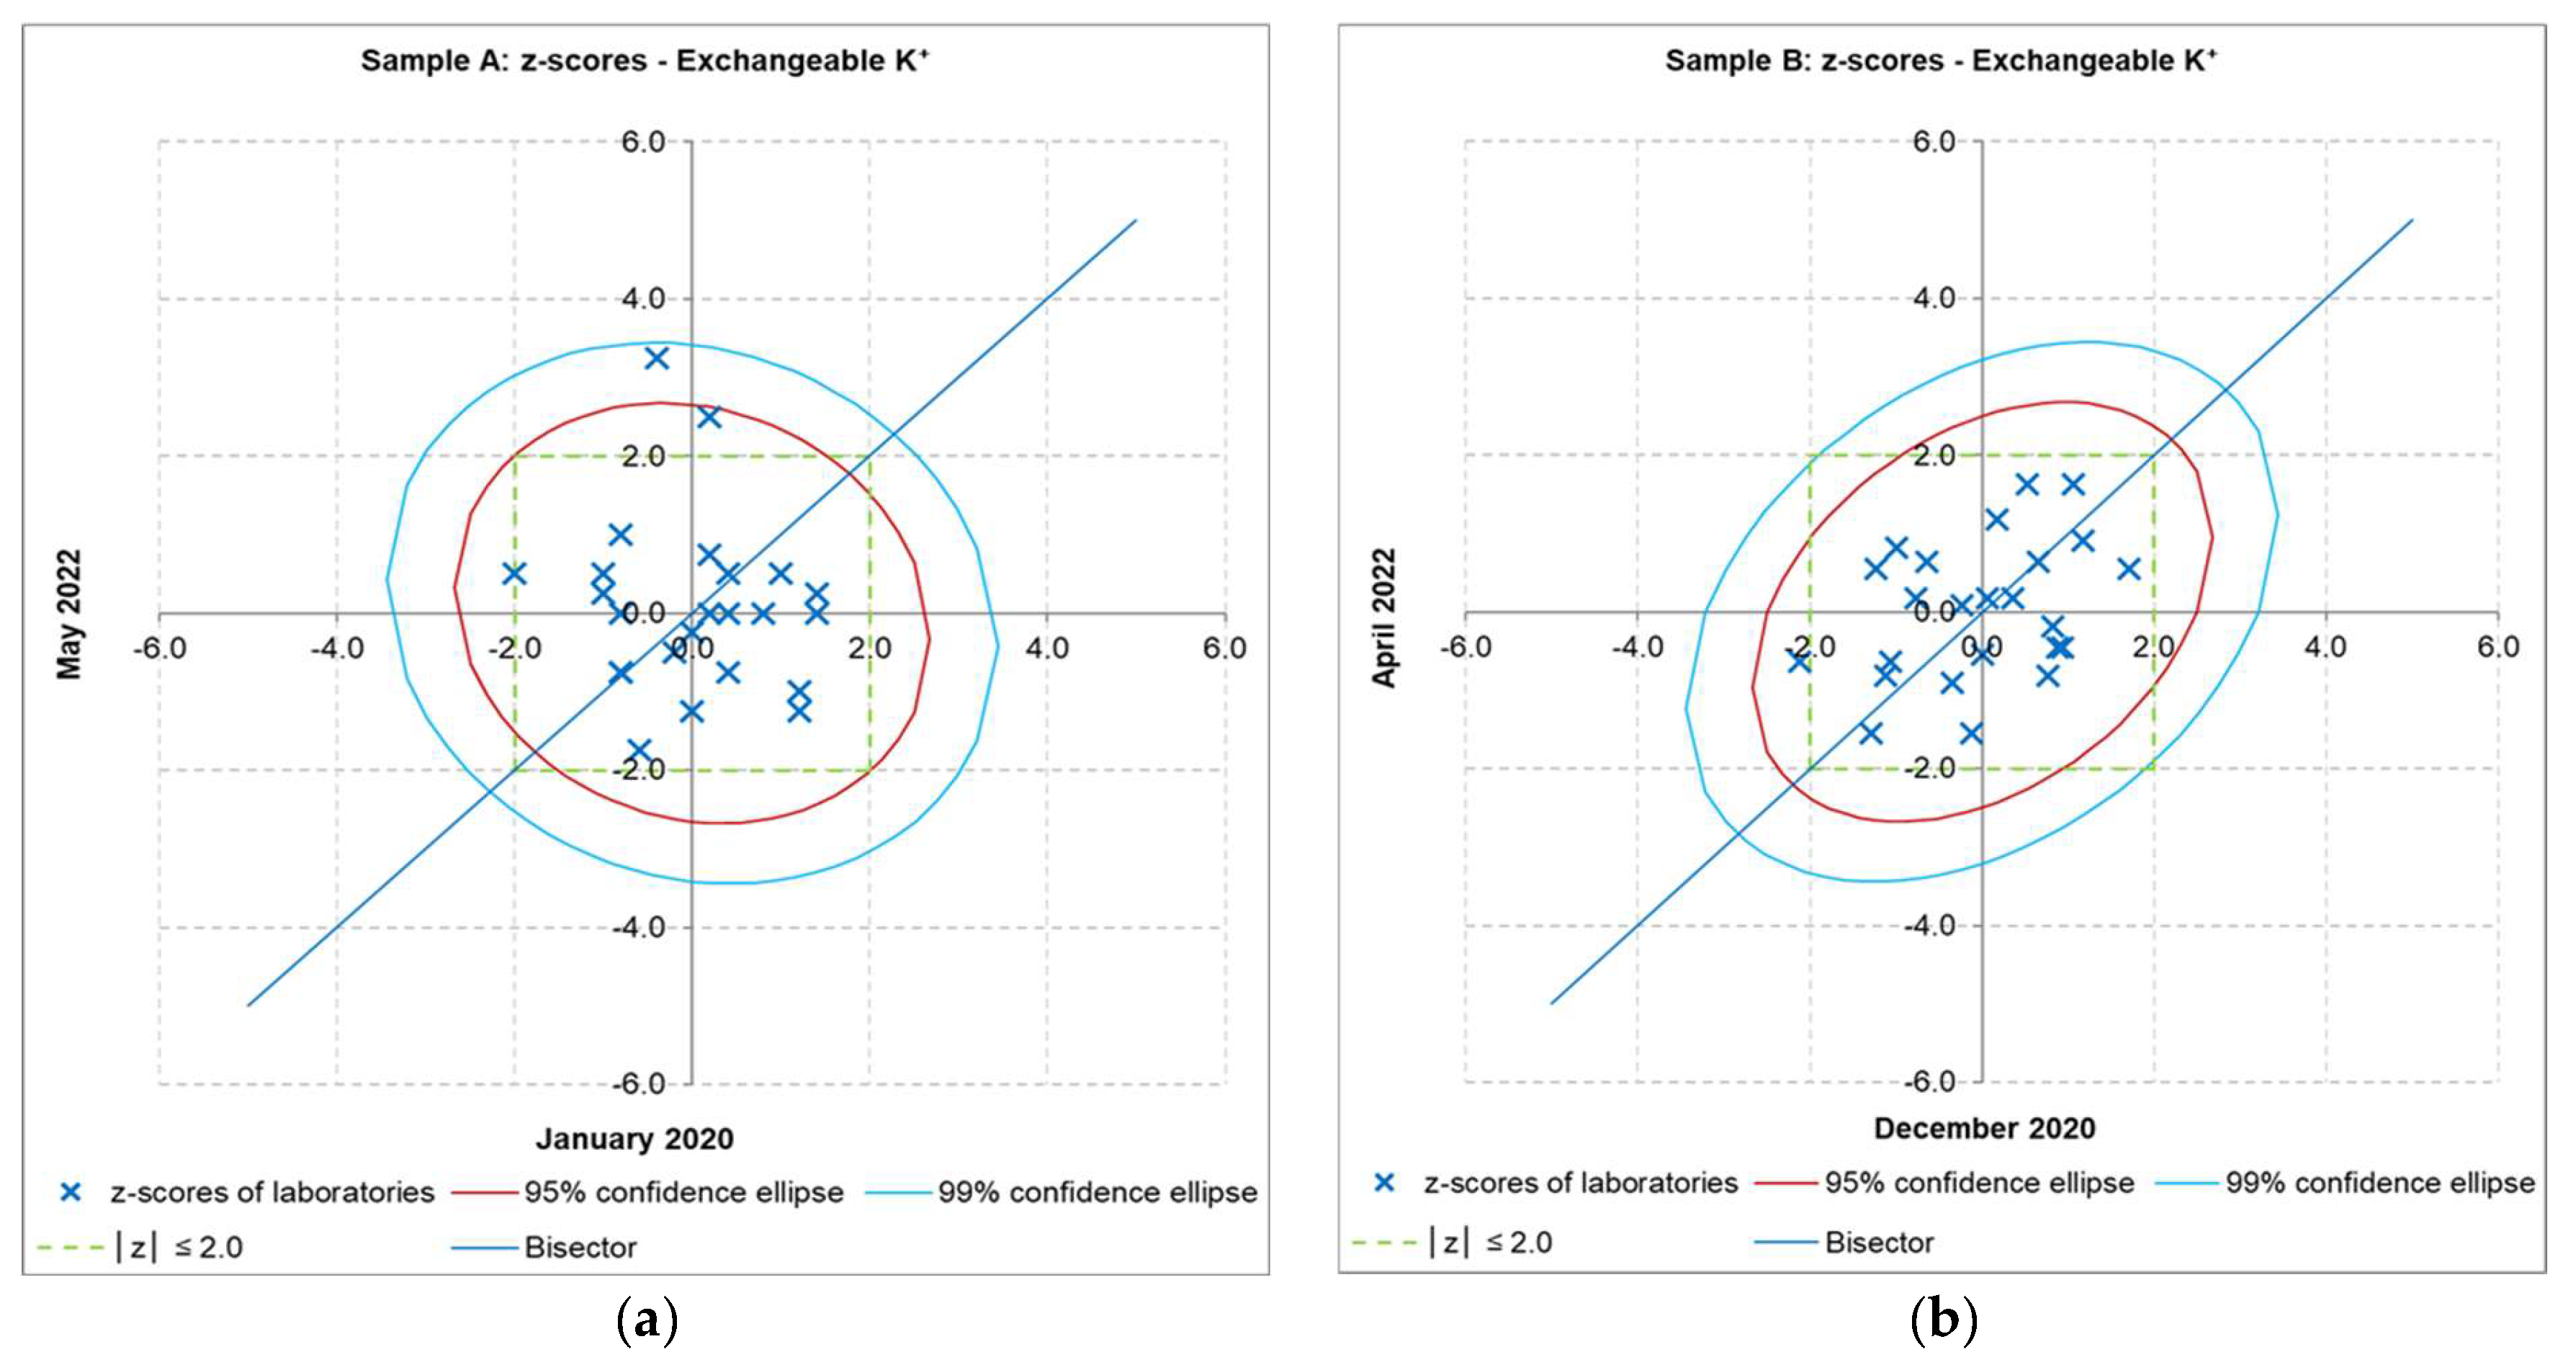
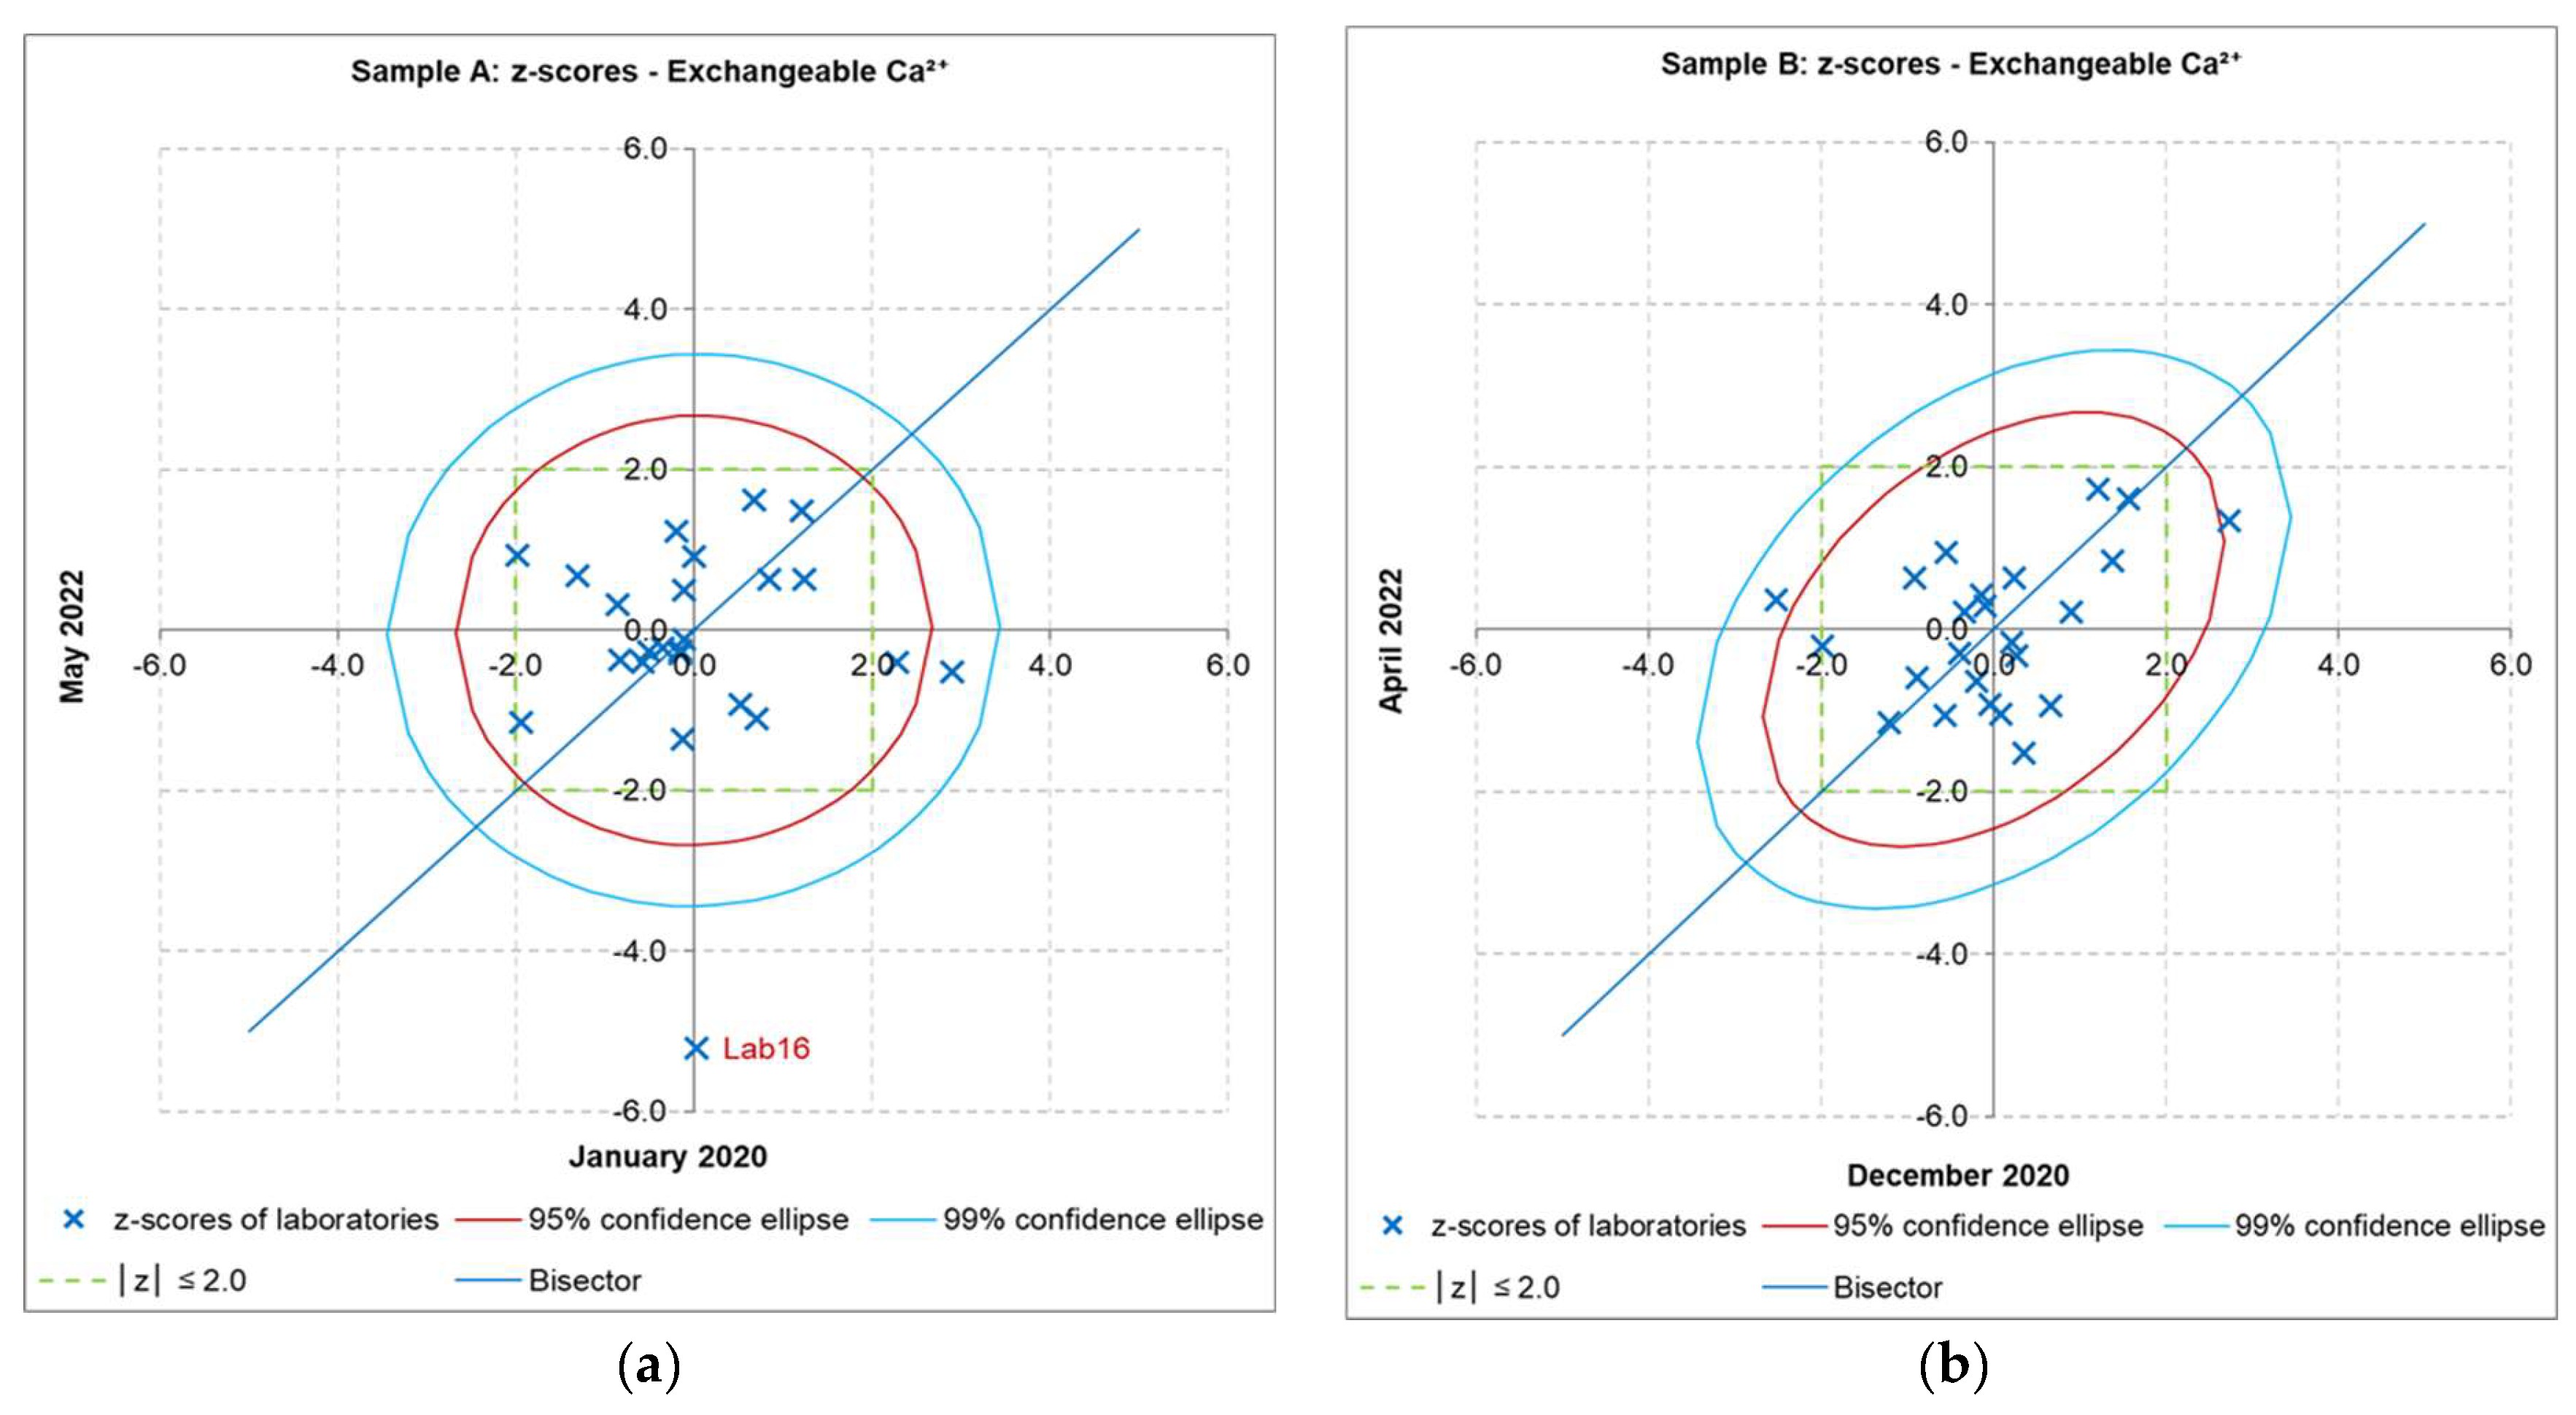
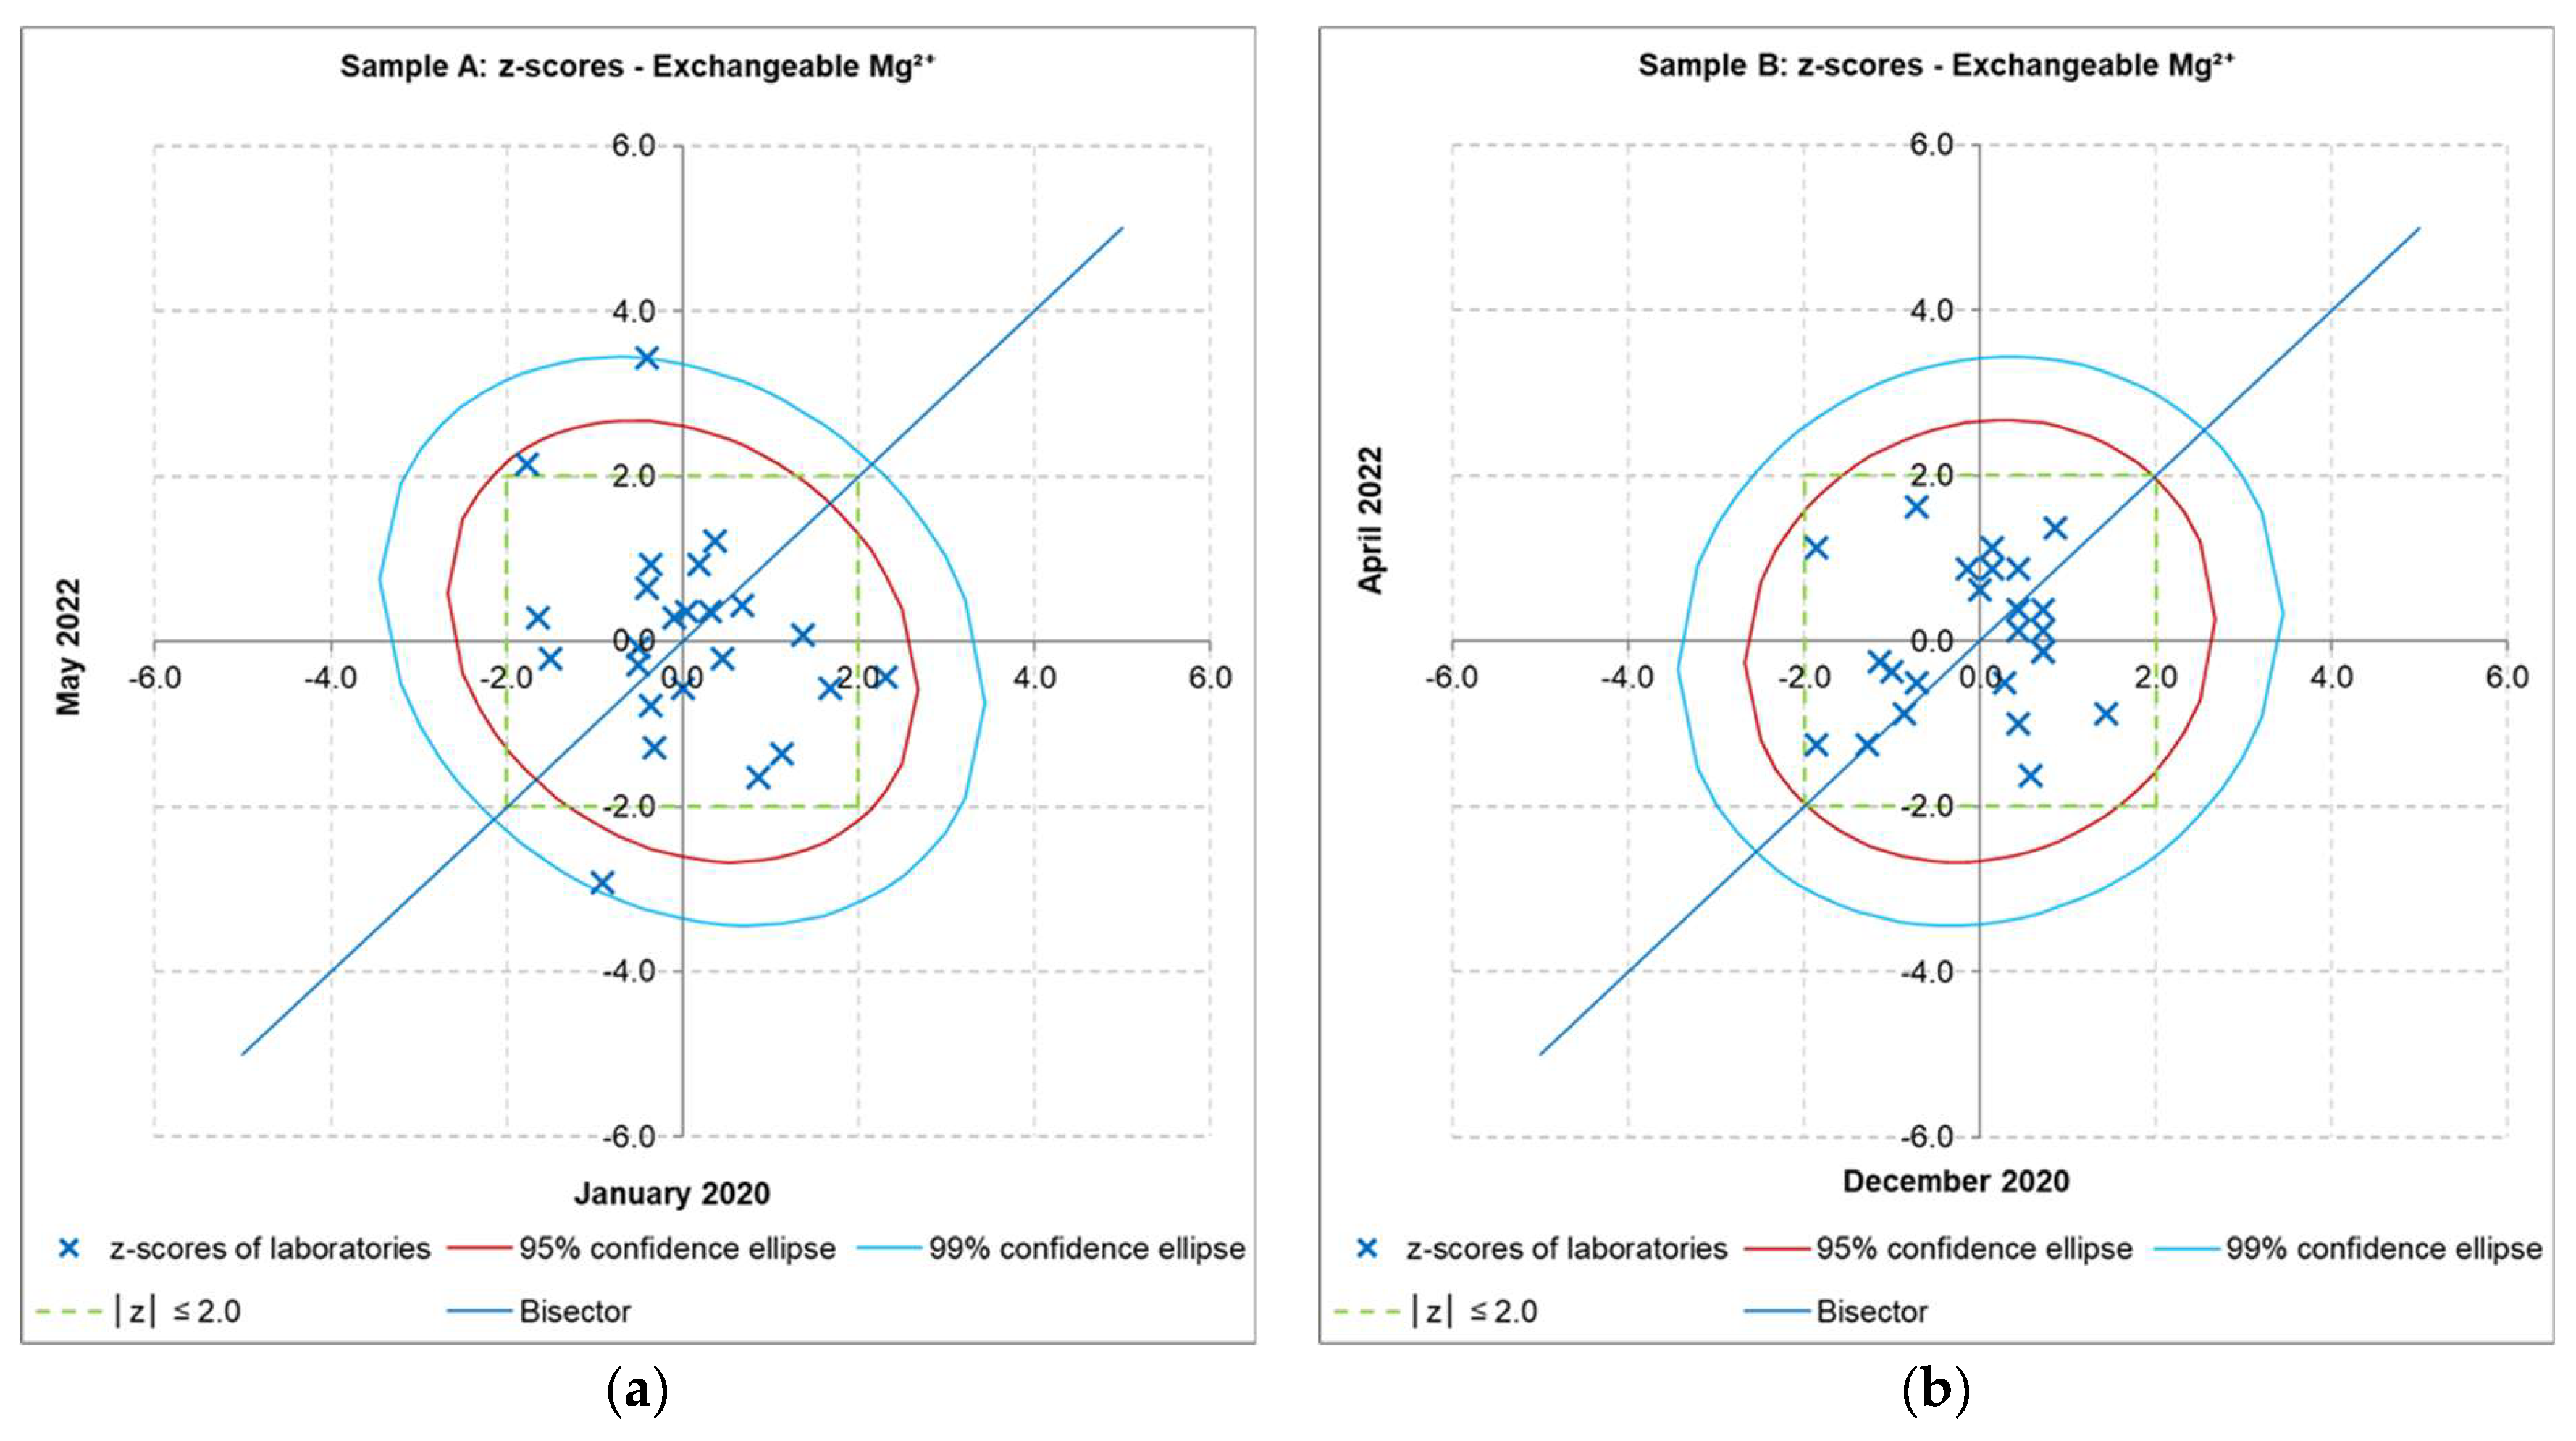
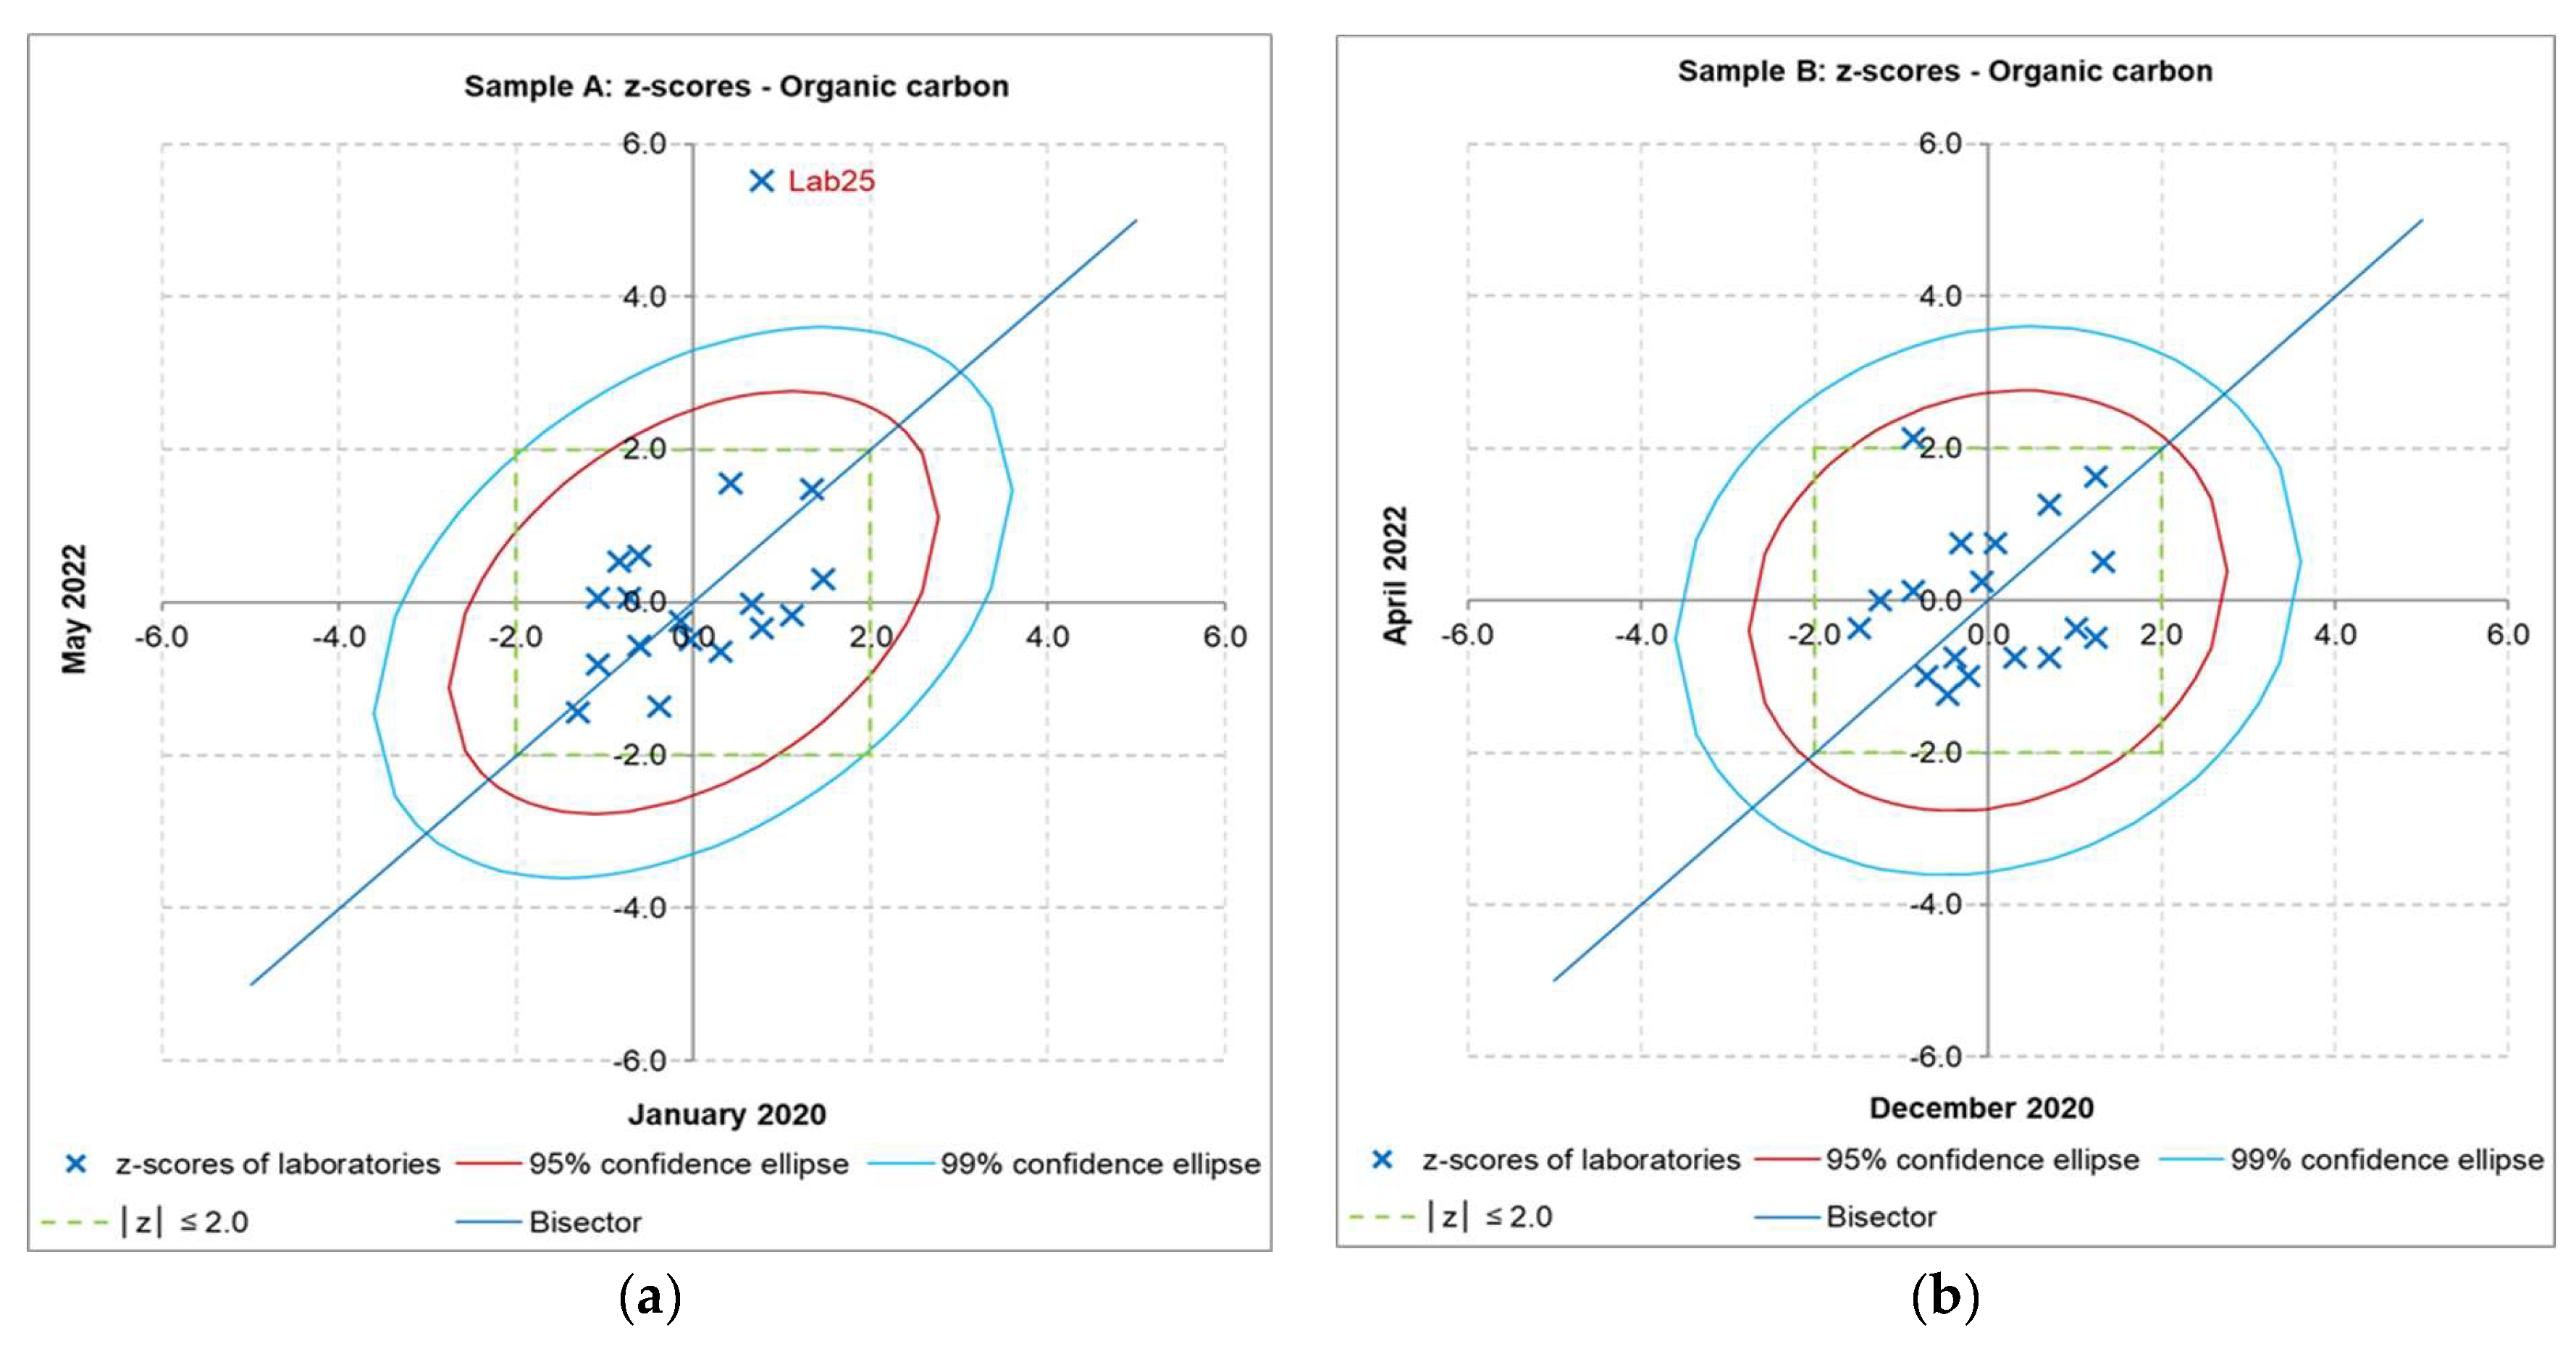
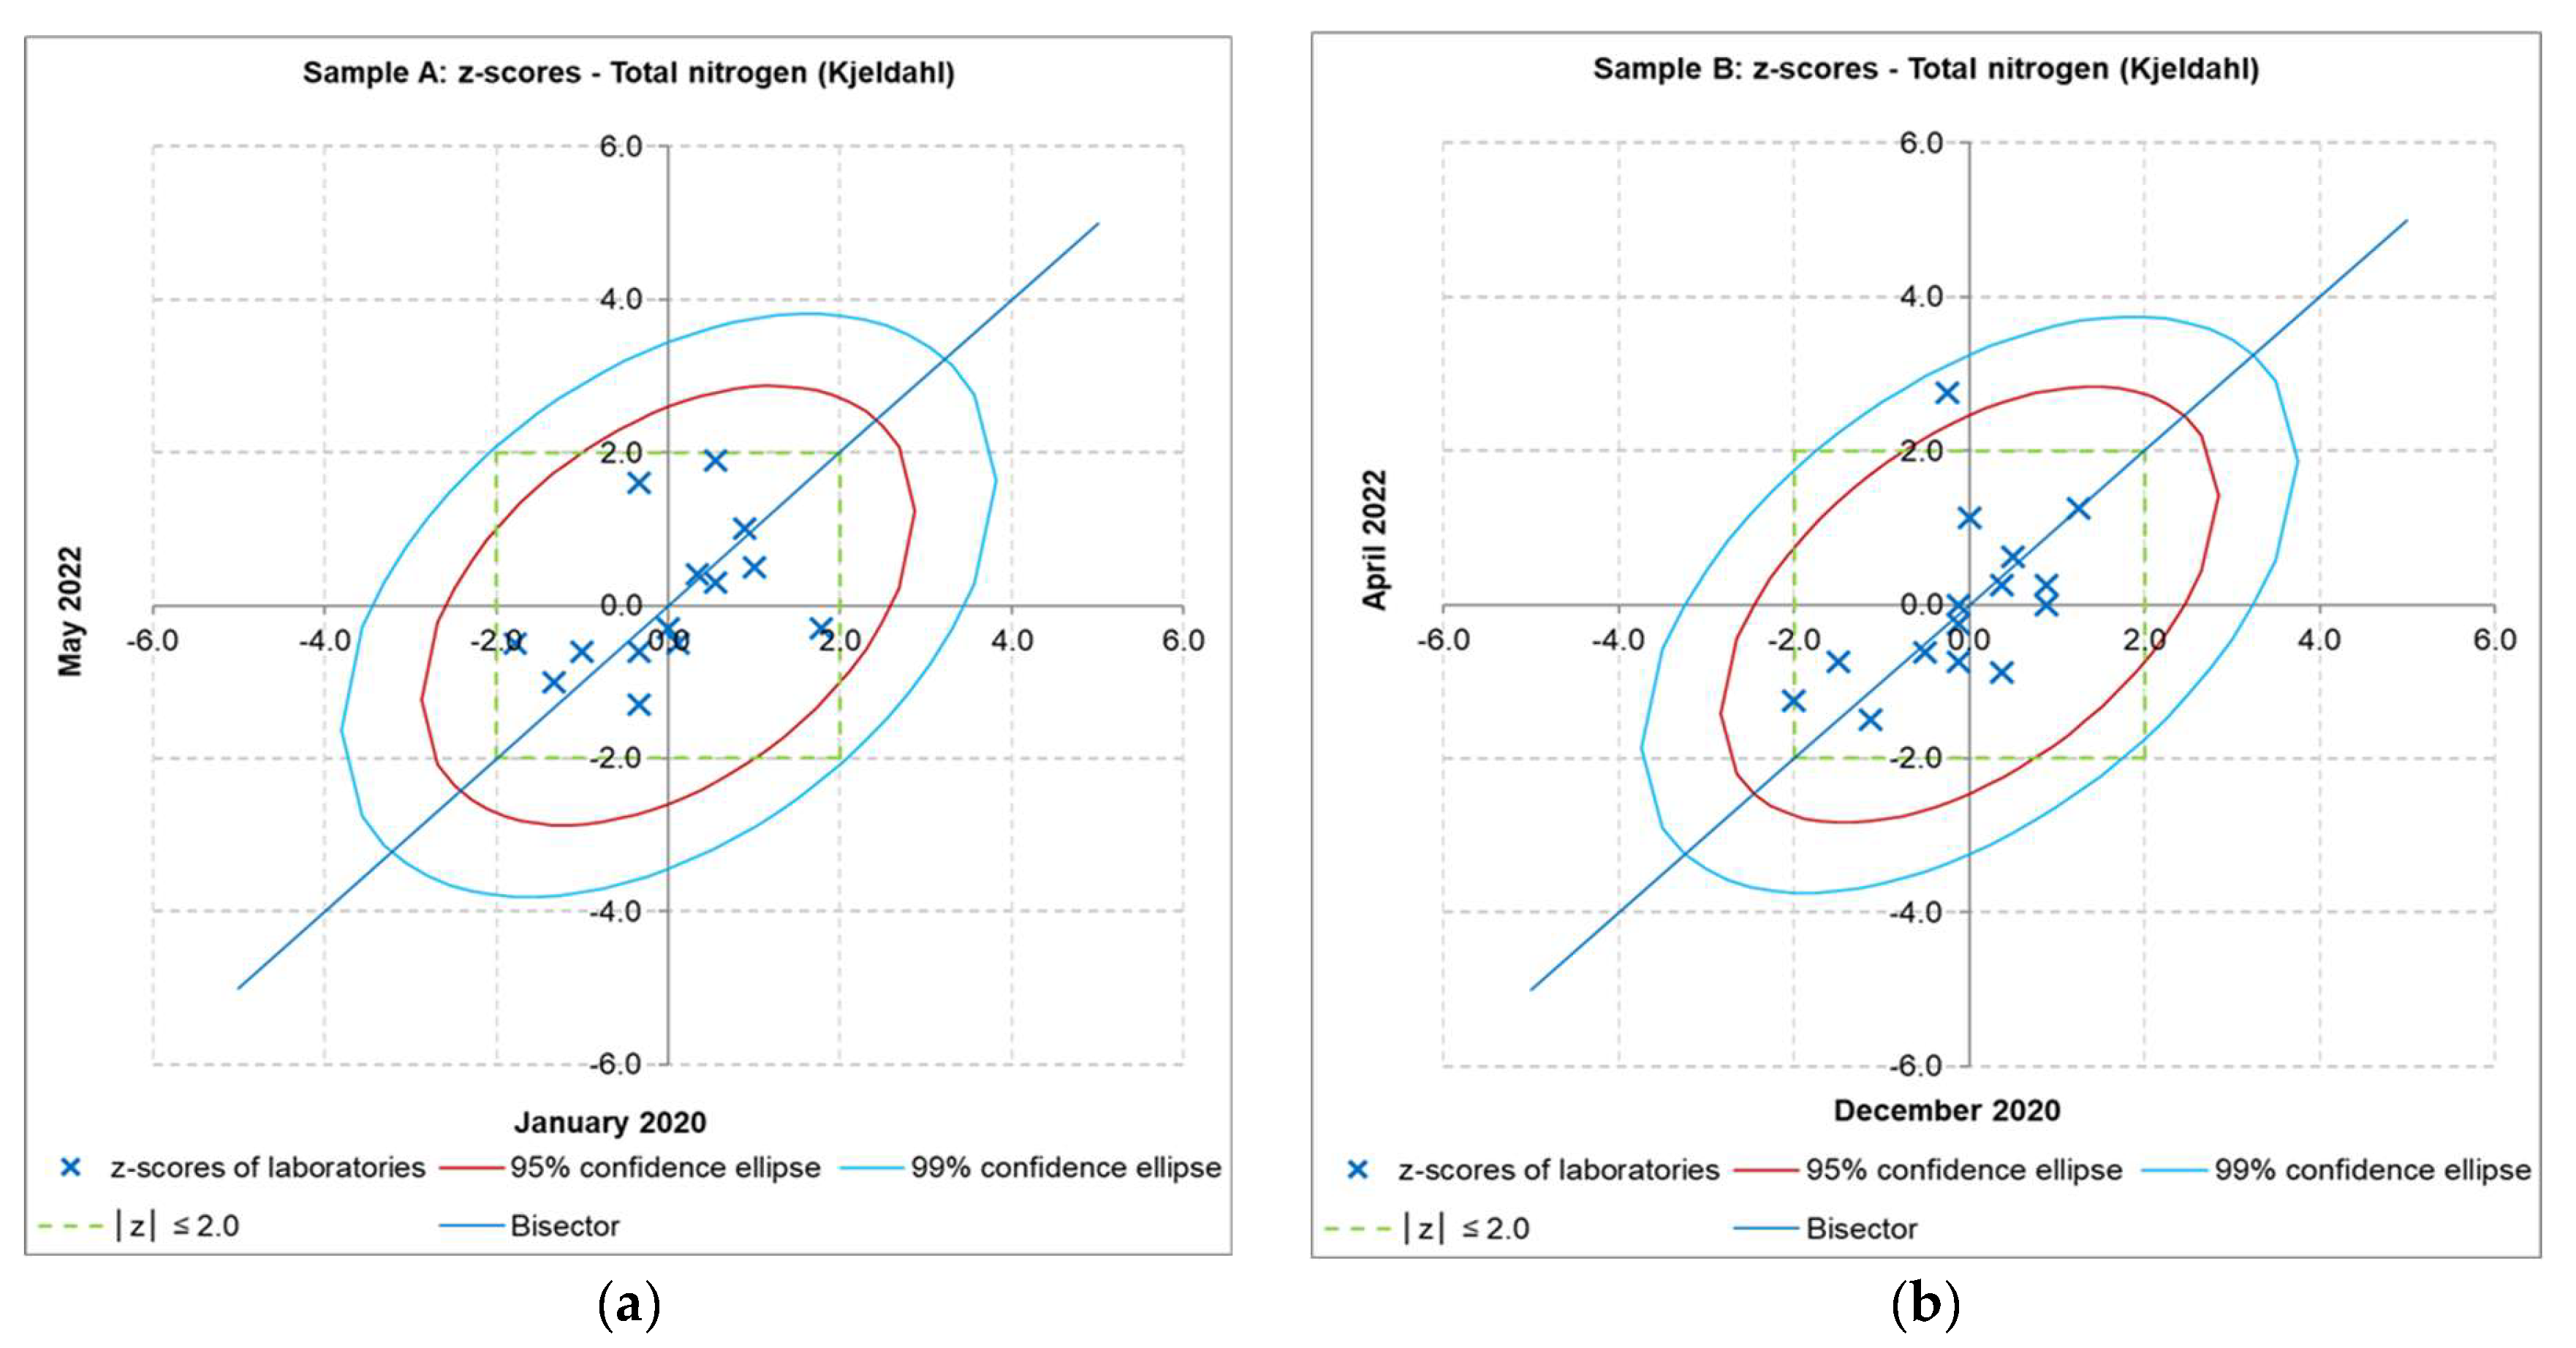
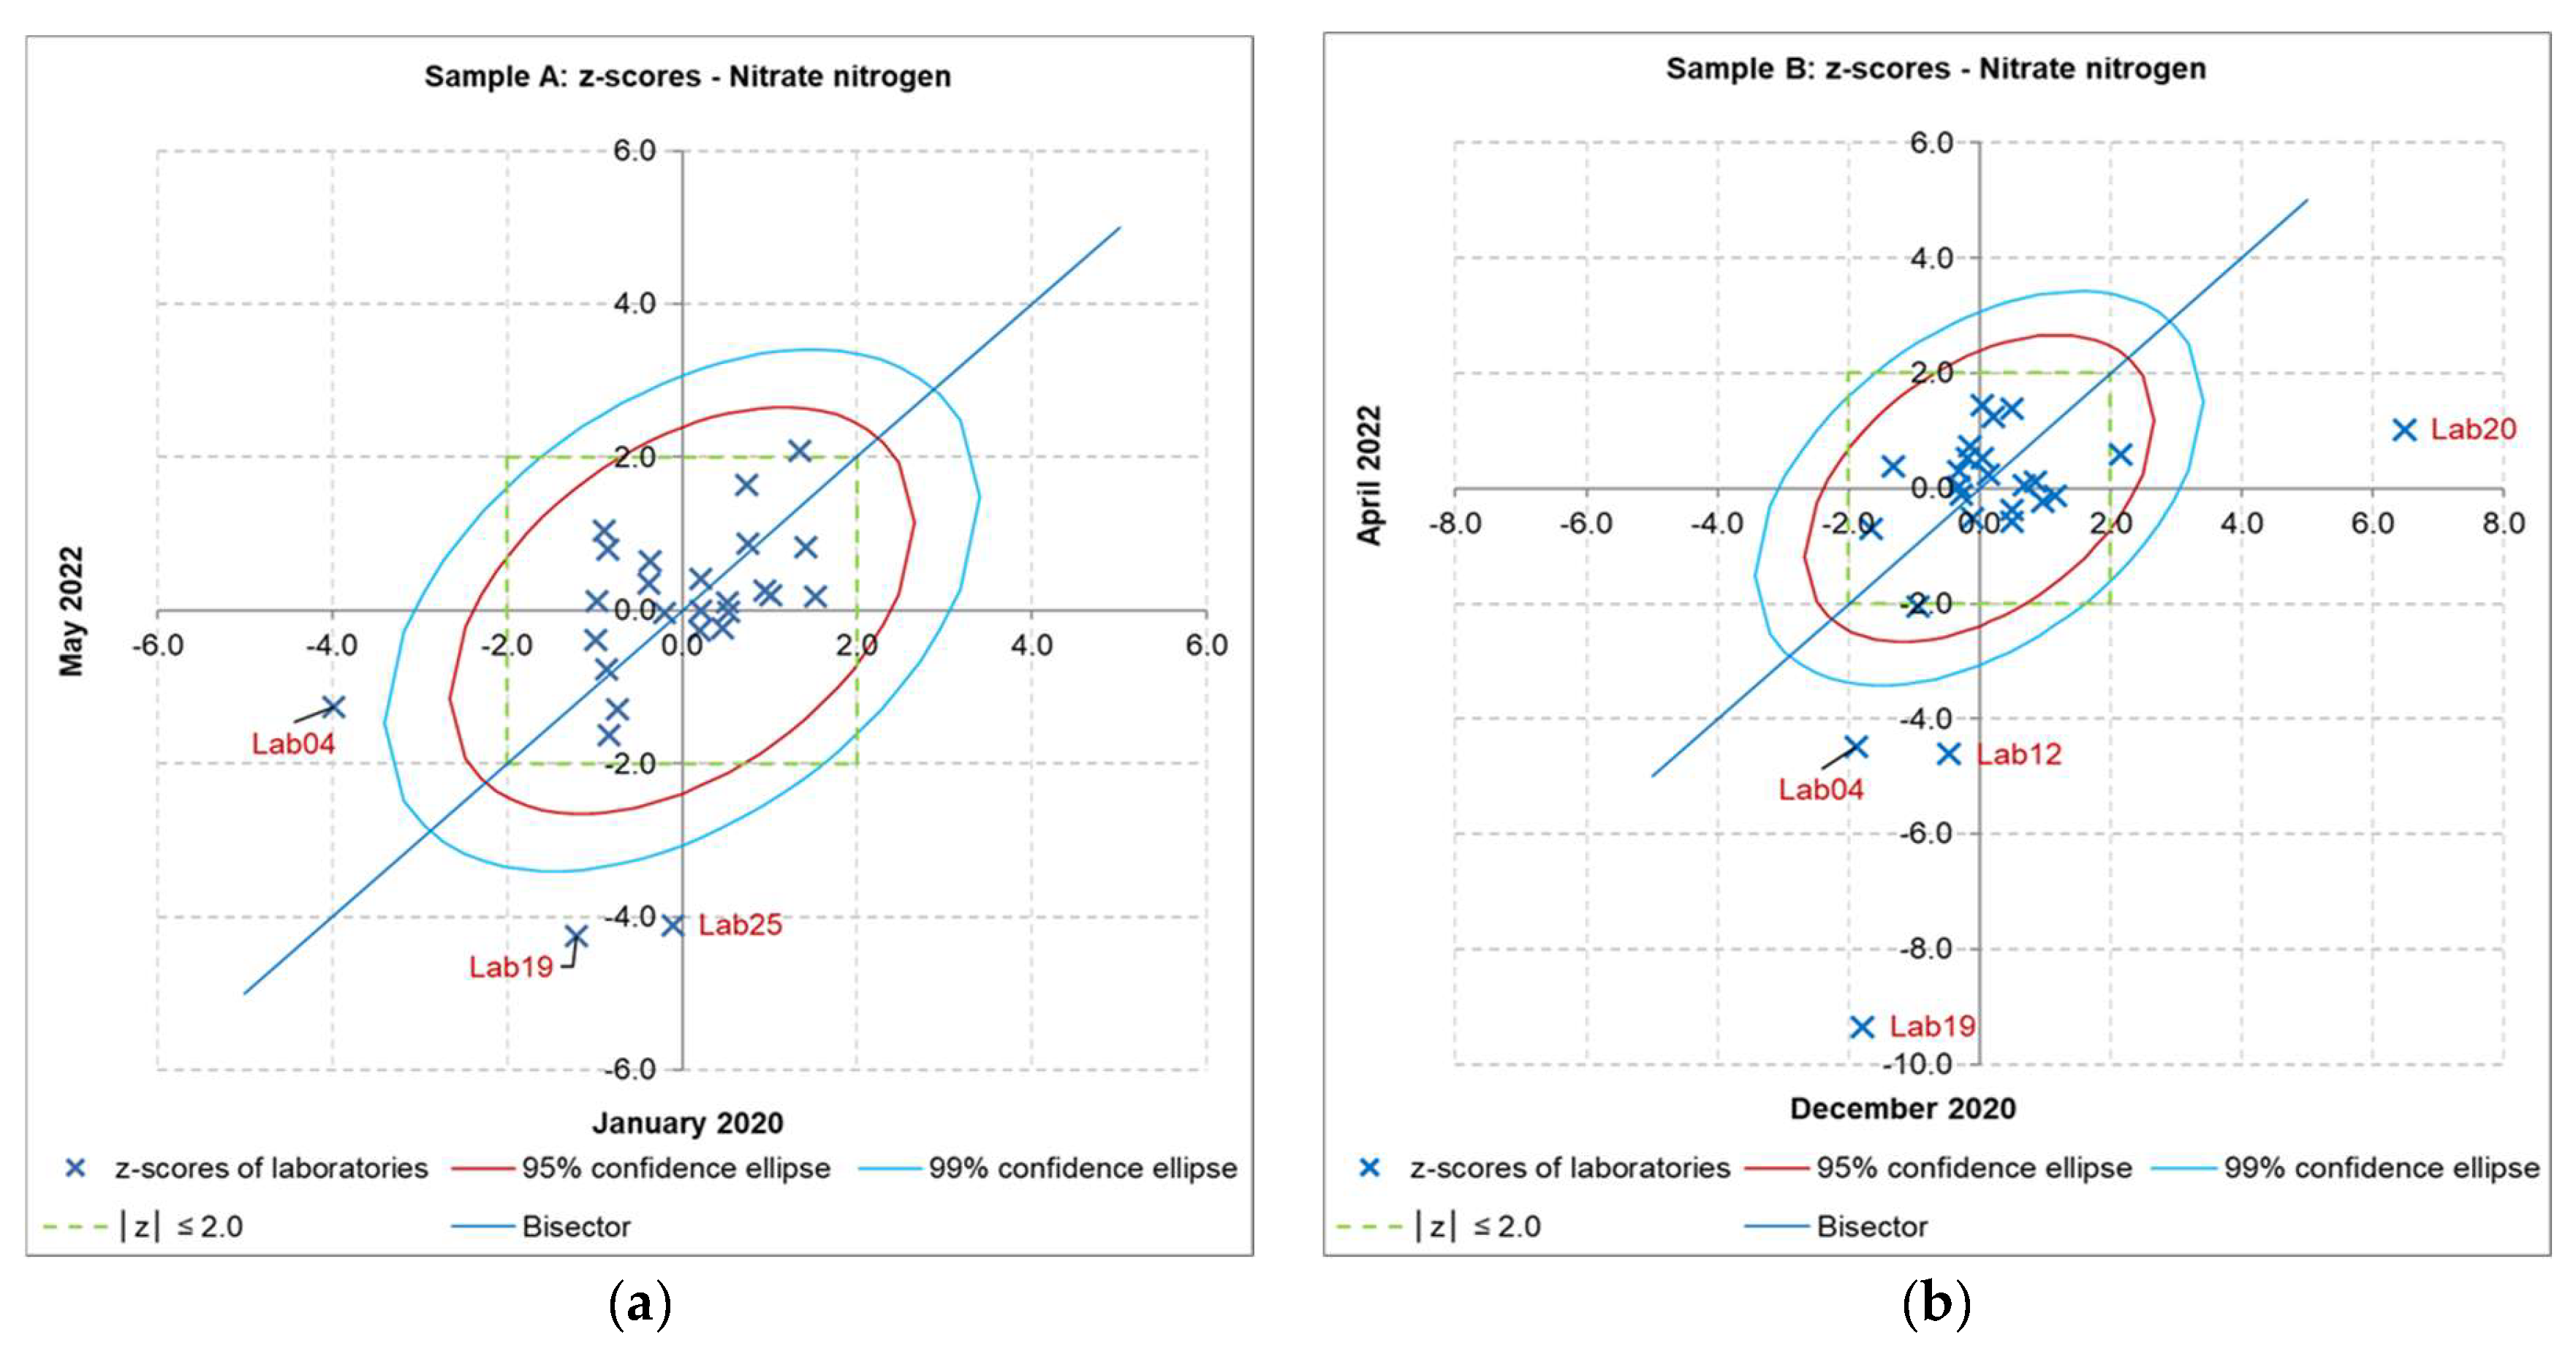
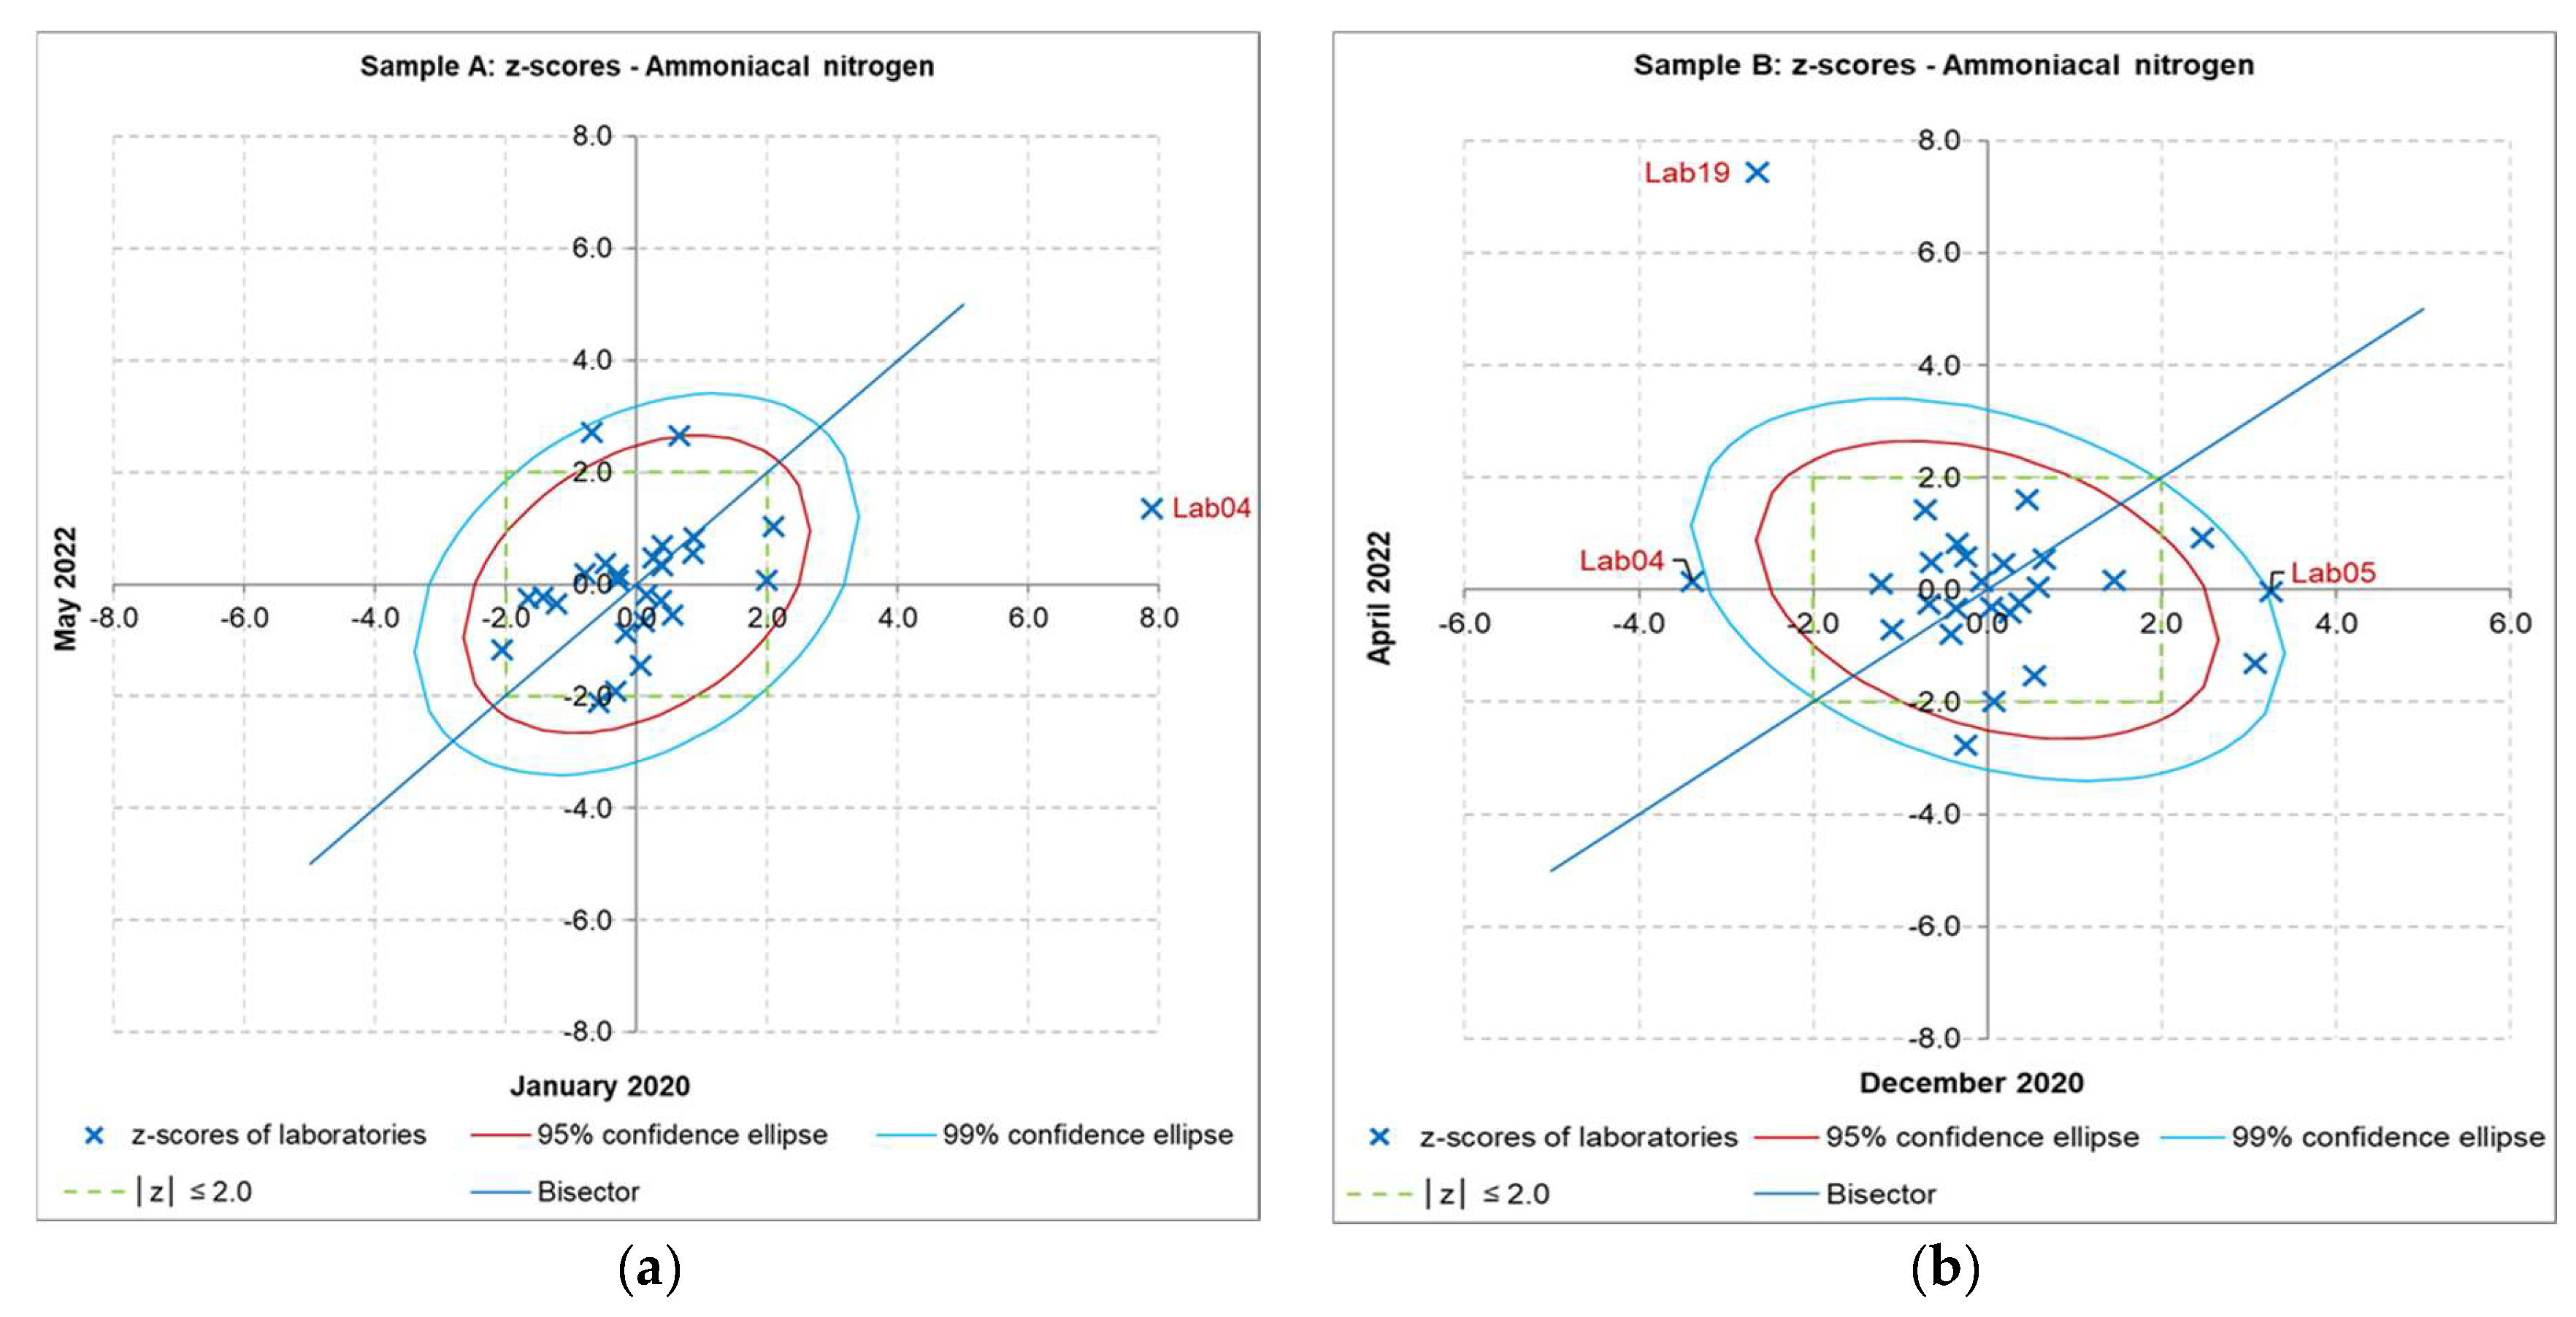
The comparison of two measurements obtained in blind tests on identical samples provides an effective tool for laboratories to control the reliability of their test results over time. Youden plots were constructed to compare the z-scores associated with the results of laboratories for 12 analytes of this study (
Figure 1,
Figure 2,
Figure 3,
Figure 4,
Figure 5,
Figure 6,
Figure 7,
Figure 8,
Figure 9,
Figure 10,
Figure 11 and
Figure 12). The abscissa of a point was the
z-score obtained by a laboratory in the first round, and the ordinate was the
z-score of the same laboratory derived in the second round. The intersection of the coordinate axes corresponded to the point (0.0, 0.0). A square region bounded by the
z-scores of −2.0 and 2.0 on the two axes, a bisector line, and 95% and 99% confidence ellipses were plotted on a Youden graph to assist the interpretation of measurement acceptability [
22,
23,
24].
Figure 1,
Figure 2,
Figure 3,
Figure 4,
Figure 5,
Figure 6,
Figure 7,
Figure 8,
Figure 9,
Figure 10,
Figure 11 and
Figure 12 showed that most of the points scattered closely around the intersection point and inside the |
z| ≤ 2.0 region for all analytes, exhibiting the overall satisfactory laboratory performance in all PT rounds. Some large deviations were detected. For example, on the moisture content plot of Sample A (
Figure 1a), one outlying laboratory (indicated as Lab15 on the graph) lay outside the 95% and 99% confidence ellipses in the lower left quadrant, far away from the intersection of the two coordinate axes, but remained close to the vertical axis. This laboratory reported an acceptable result for the test round in January 2020, but a very low result with an unacceptable
z-score of −7.2 for the second measurement in May 2022. It should be noted that this same laboratory exhibited large deviations from the assigned values on the Sample B plot (
Figure 1b), obtaining lower results than all other participants in both December 2020 and April 2022 rounds of the tests. Laboratory Lab15 was subject to an internal investigation of the causes and considered taking corrective actions if necessary.
Nitrate nitrogen and ammoniacal nitrogen seemed to pose difficulties for some laboratories. However, they were only distant from one of the coordinate axes. For example, the laboratory Lab19 obtained acceptable z-scores in the first rounds, but unacceptable z-scores of −4.2 and −9.3 in the second rounds for nitrate nitrogen in both Samples A and B, respectively. The difference in the z-scores of the laboratory Lab19 demonstrated that large measurement deviations were only observed in the second test rounds and did not imply systematic analytical biases.
The shapes of the ellipses indicated a positive correlation between the two datasets for moisture content, Kjeldahl total nitrogen, and nitrate nitrogen in both Samples A and B. This relationship was observed for Olsen phosphorus, organic carbon, and ammoniacal nitrogen in Sample A, and pH (KCl extraction), exchangeable K+, and exchangeable Ca2+ in Sample B. The other analytes showed weak or negative correlations between the measurements of two blind testing rounds. However, this observation did not affect the laboratory proficiency assessment, which was based on the z-scores.
3.3. z*-Scores
Another approach to assessing the consistency of laboratory performance is to compare the difference between two measurements performed on the same batch of soil in two different PT rounds with the intermediate precision standard deviation. A standardized difference score, z*, was calculated for each pair of measurements as follows: , or , where = the z*-score of the laboratory i, = the measurement of the laboratory i in the first round, = the measurement of the laboratory i in the second round, = the number of participating laboratories, and = the intermediate precision standard deviation of measurements performed on the same batch of soil by the same laboratories participating in two different PT rounds.
This
z*-score should not be confused with the standard
z-scores for proficiency assessment in
Figure 1,
Figure 2,
Figure 3,
Figure 4,
Figure 5,
Figure 6,
Figure 7,
Figure 8,
Figure 9,
Figure 10,
Figure 11 and
Figure 12. A
z*-score is simply a measure of the magnitude of an individual laboratory’s measurement difference relative to the standard deviation of the measurement differences observed among all participating laboratories. A value of
z* greater than 2–3 suggests that the laboratory’s measurement difference is larger than can be reasonably attributed to intermediate precision. The
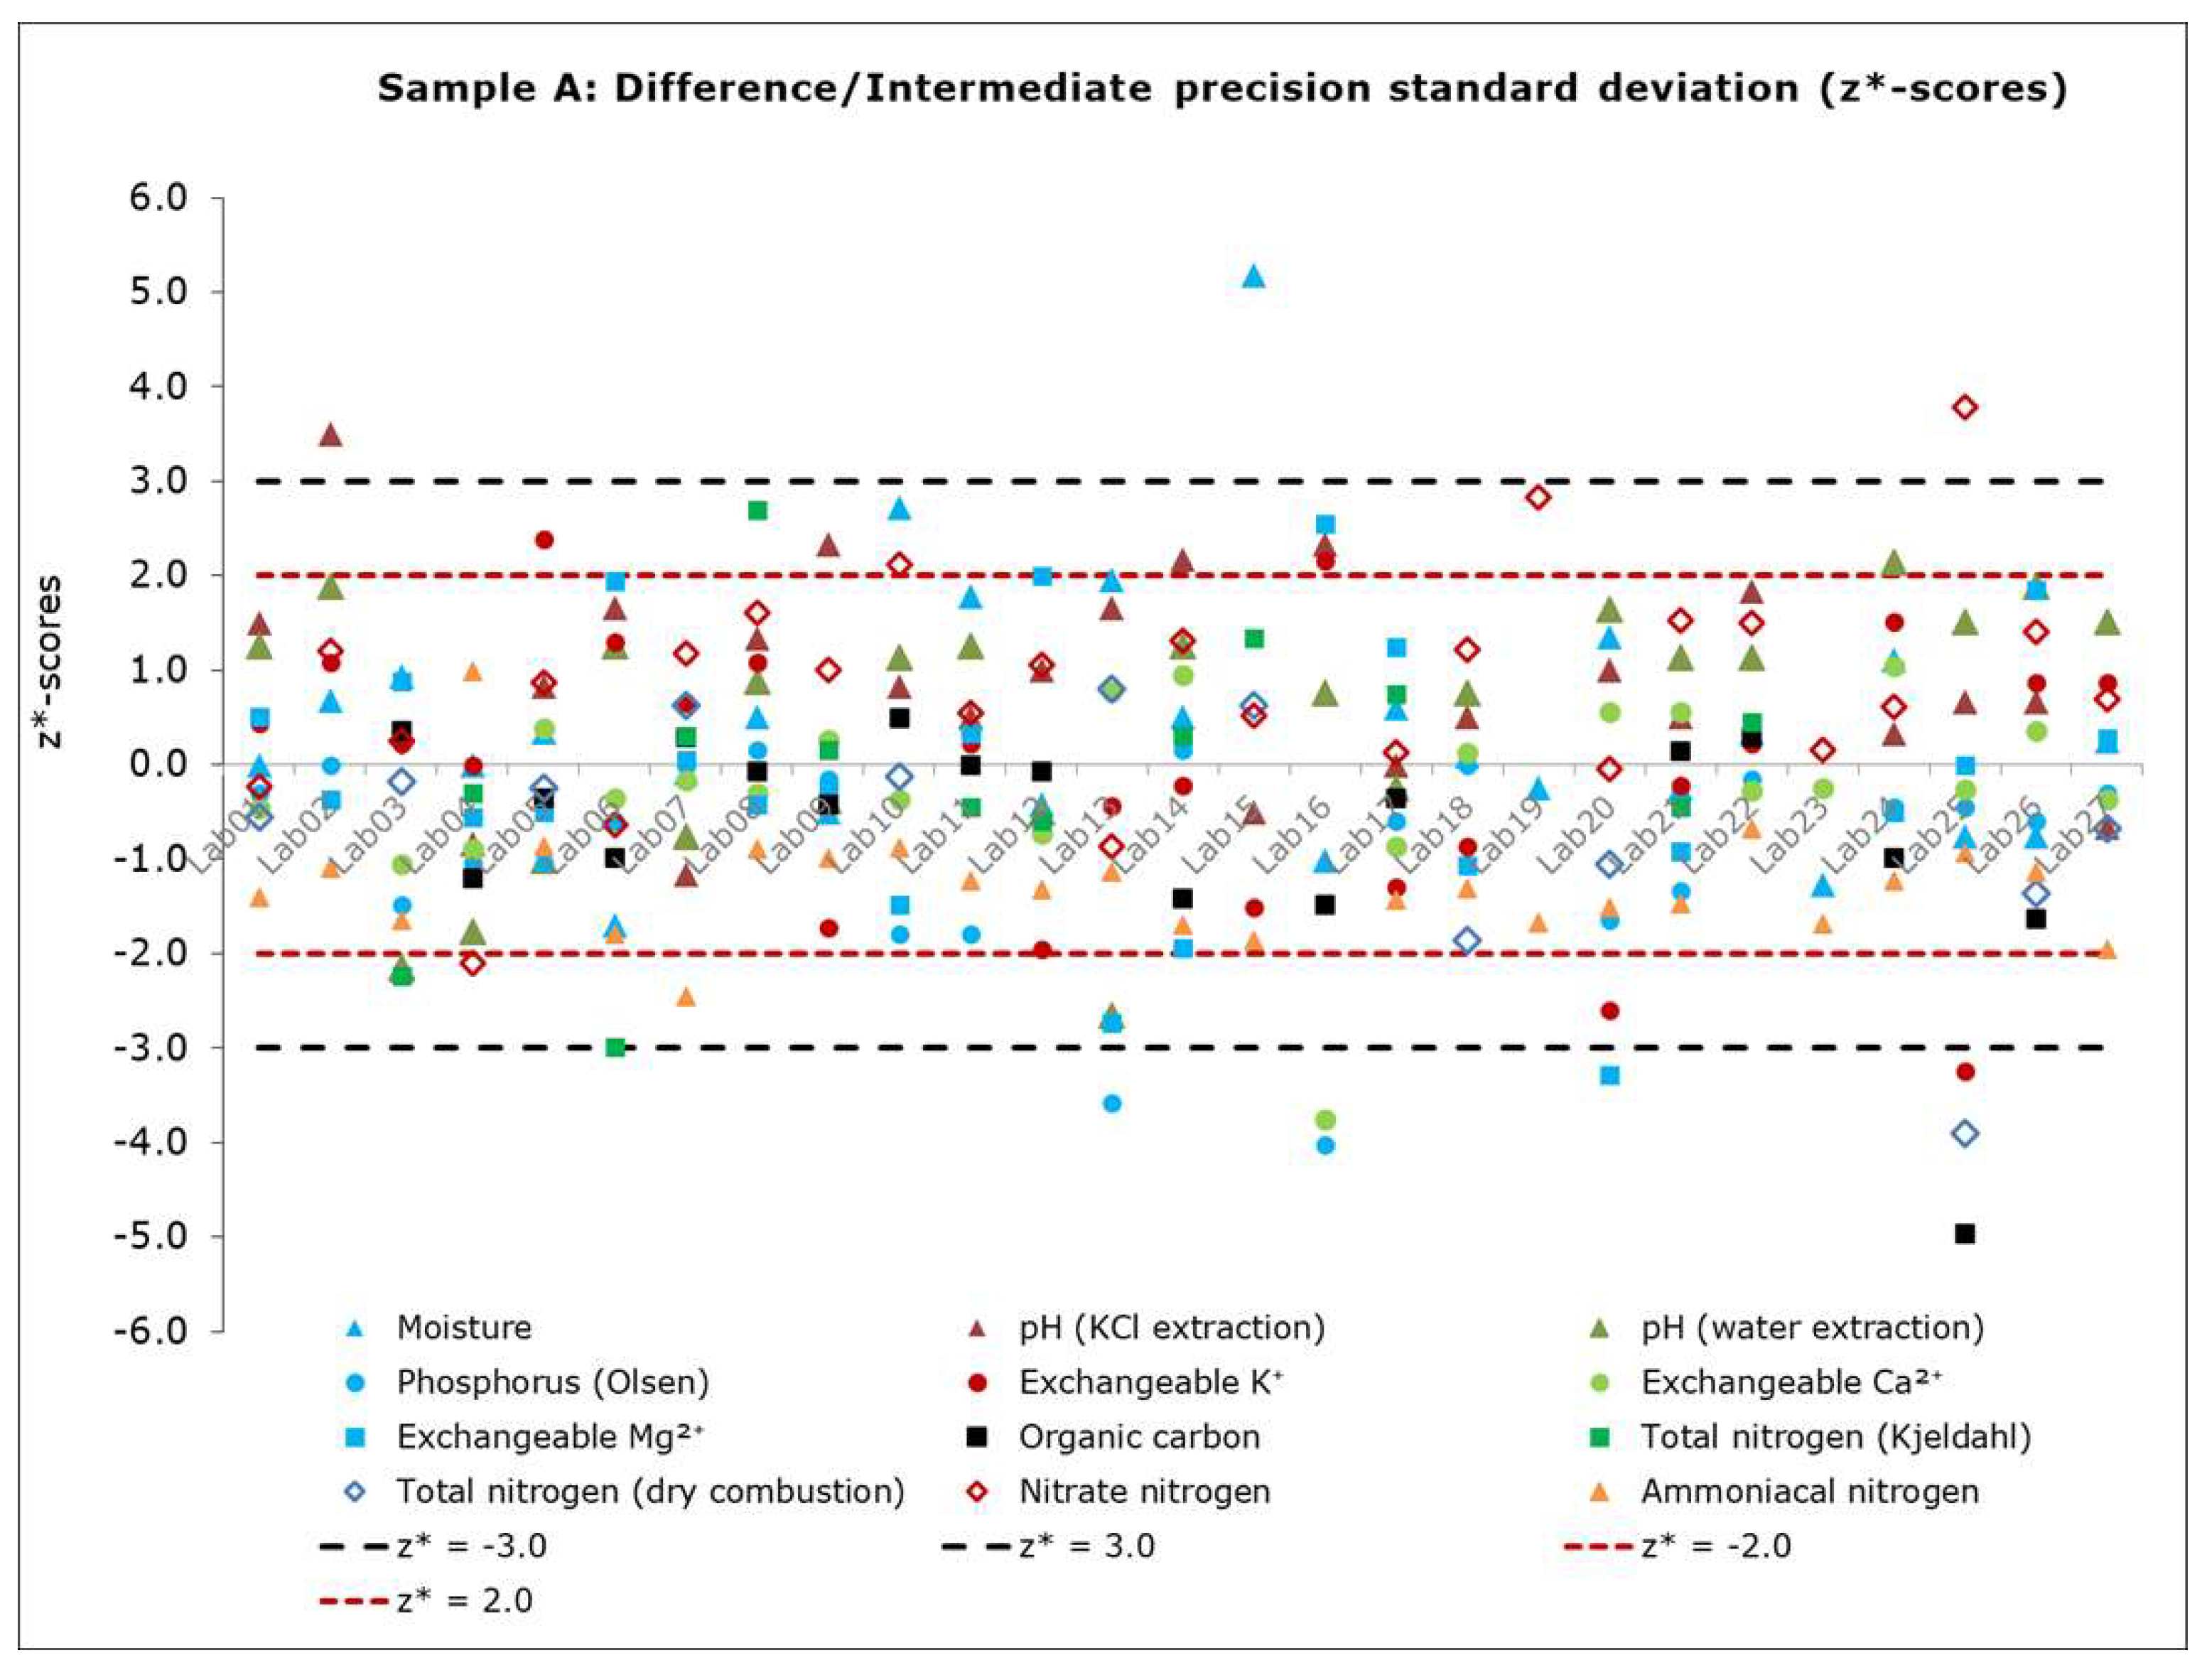
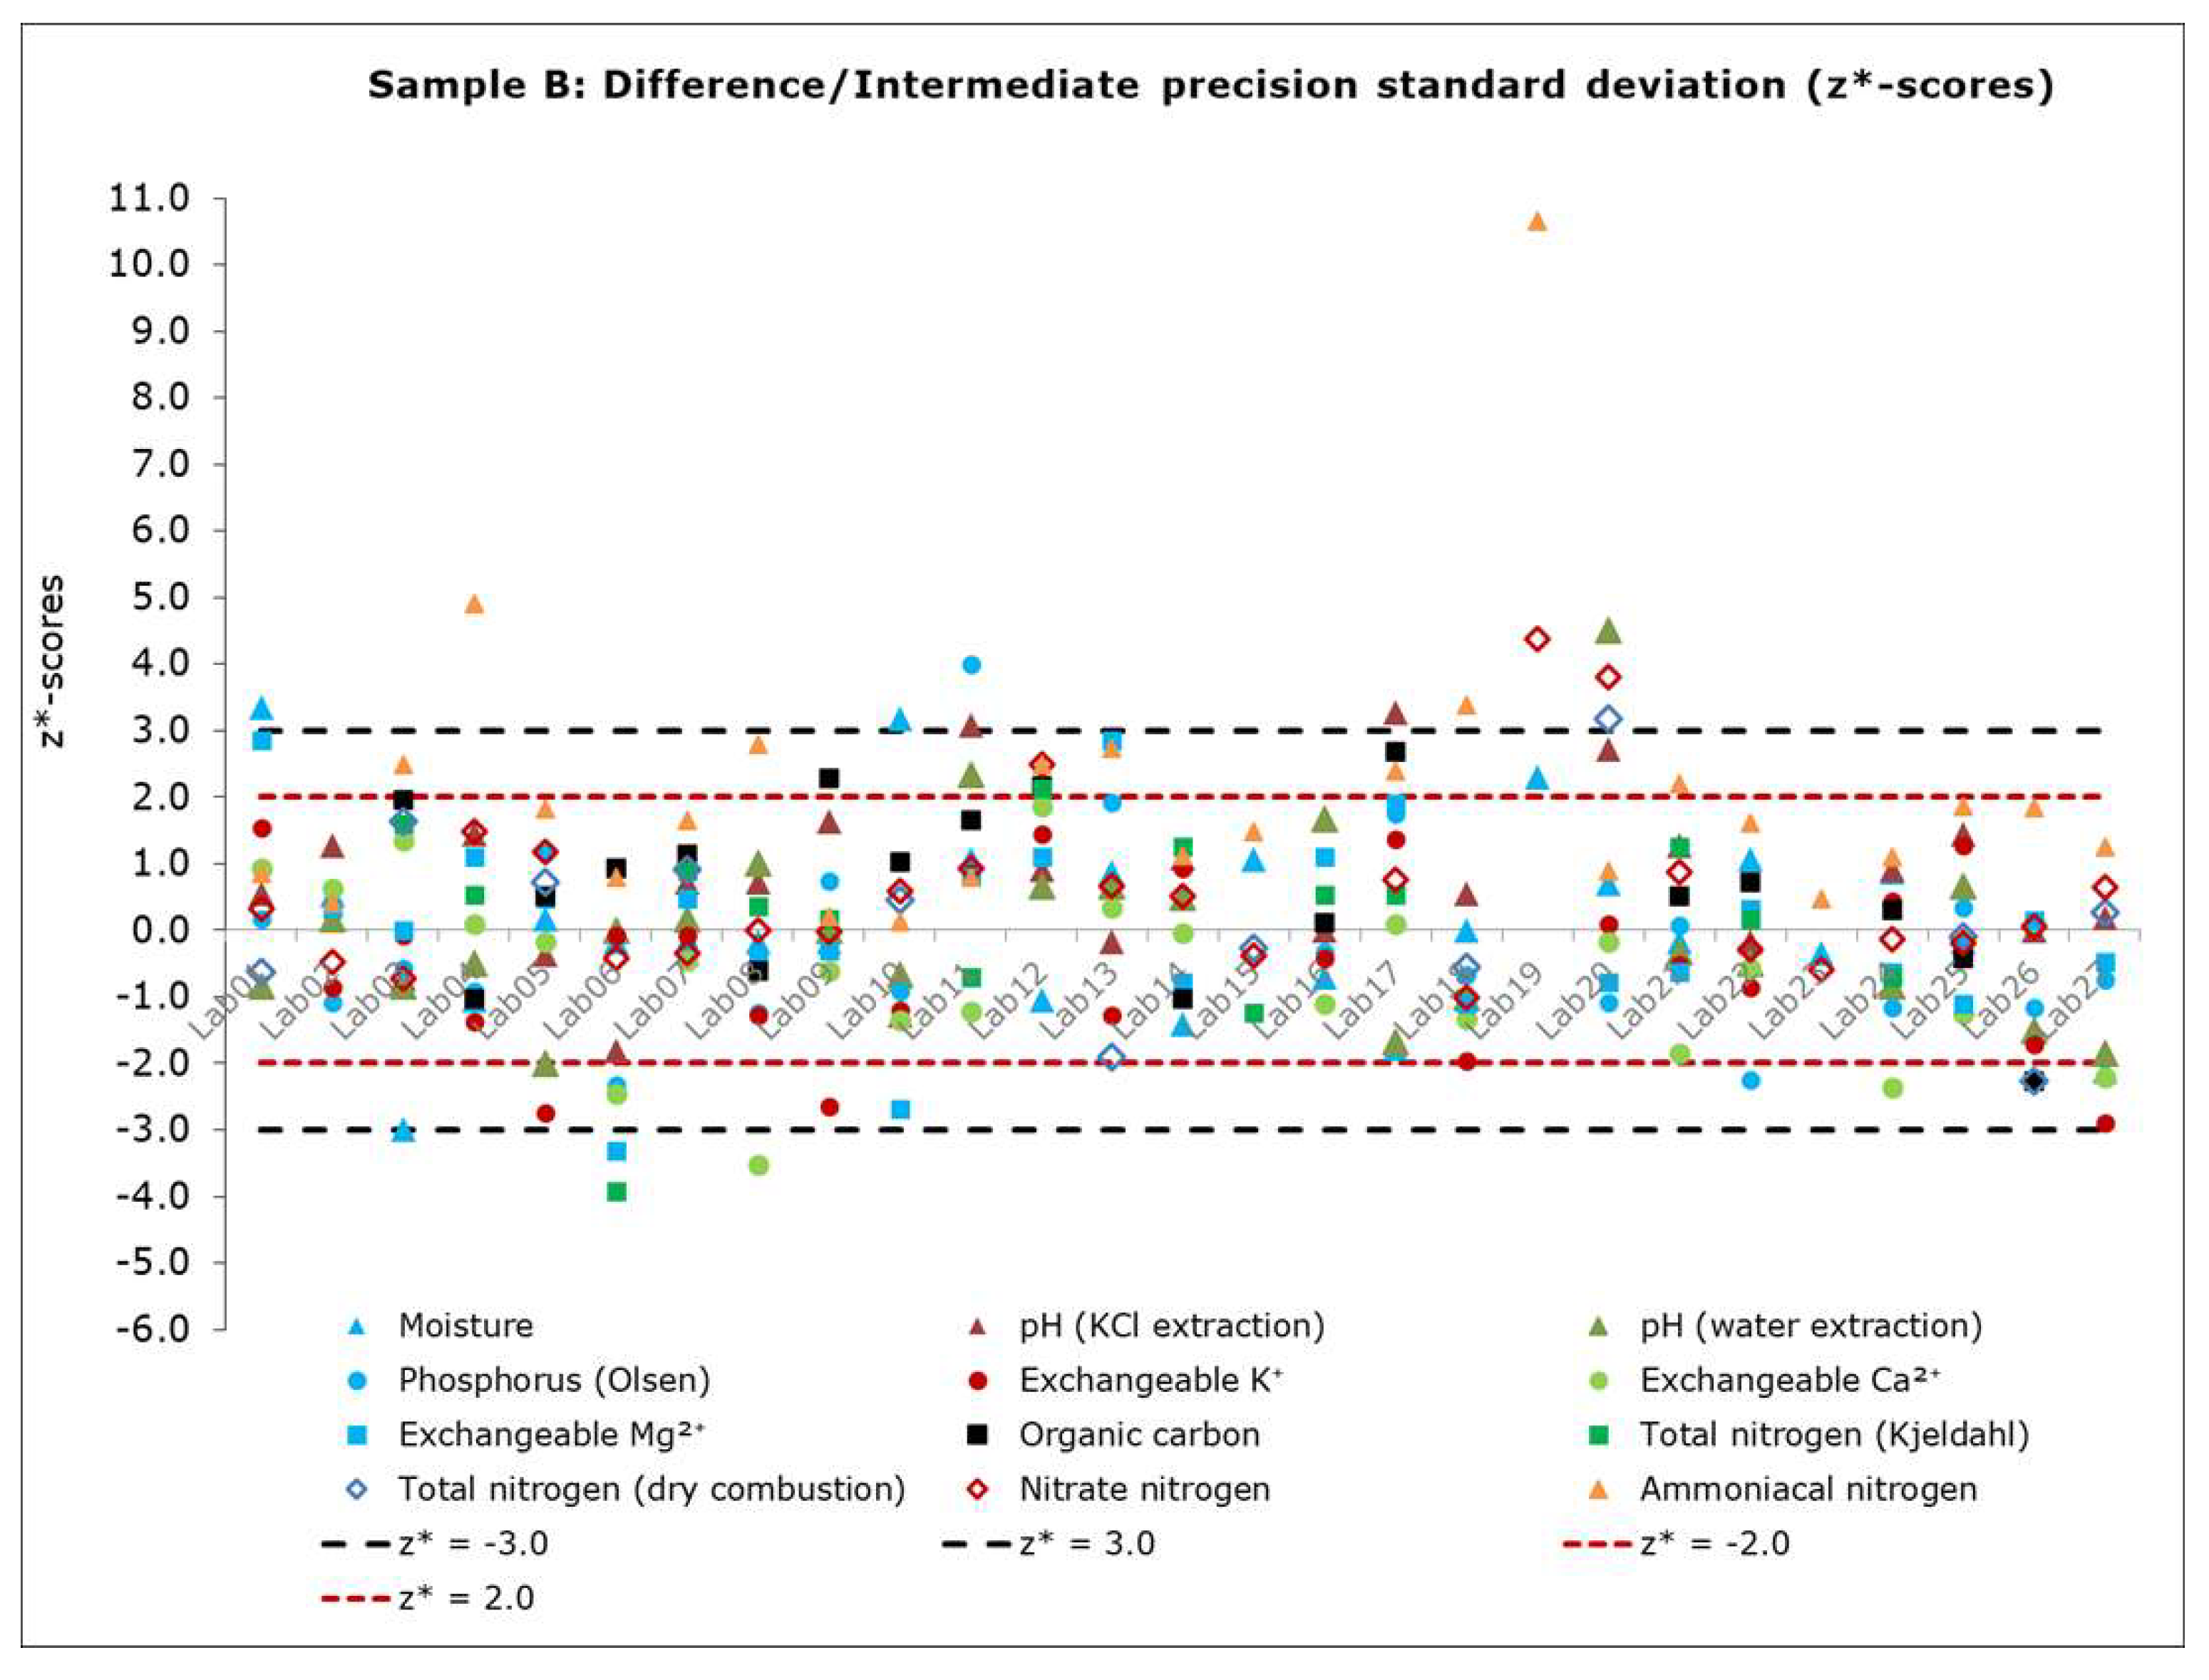
z*-scores of 27 laboratories for 12 analytes are presented in
Figure 13 for Sample A and in
Figure 14 for Sample B.
Figure 13 and
Figure 14 show that measurement differences were generally within acceptable limits for most participating laboratories. However, |
| ≥ 3.0 was observed for 4% of laboratories analyzing Sample A, and 6% of laboratories analyzing Sample B.
4. Discussion
Both statistical and graphical analyses of this study demonstrated the consistency of test results for more than 80% of laboratories participating in four blind tests on two different batches of soil. Although the main objective of proficiency testing is to assess test results submitted to a trial, specific designs also allow laboratories to address biases. Blind testing on the same type of soil provides an effective tool for laboratories to demonstrate the reliability of their test results and detect anomalies in their routine analytical procedures. Youden plots and z*-score difference graphs are useful tools for laboratory self-assessment and performance monitoring, particularly because they allow individual laboratory results to be evaluated in comparison with those of other participating laboratories.
The assigned values and their associated statistics of dispersion estimated from participating laboratories applying the same standard methods, particularly from accredited laboratories or those approved by Ministries of Agriculture, contribute to the characterization of soils.
However, several considerations should be taken into account when interpreting the results of this study. Firstly, the findings were specific to the two types of soil used for these tests. Future studies should therefore incorporate a wider range of soil types to evaluate the influence of matrix effects on laboratory performance. Secondly, conducting such a study requires the sustained participation, over time, of a group of laboratories that are strongly committed to the continuous improvement of their quality management systems. The graphical methods used in this study are useful for blind testing with replicate measurements; however, they are not applicable in a routine single proficiency test program. Finally, although the intermediate precision standard deviation provides an indication of the magnitude of differences that may be expected between measurements performed over long time intervals, the deviations observed for some laboratories—such as the laboratory Lab15 for moisture content in Sample A and the laboratory Lab19 for nitrate nitrogen and ammoniacal nitrogen in Sample B—reflect laboratory-specific sources of variability. These may arise from differences in the implementation of analytical methods, sampling procedures, or other internal practices and are therefore likely to be heterogeneous in nature. In interpreting these results, it is important to highlight that the primary objective of proficiency tests is not only to assess analytical performance but also to support the continuous improvement of laboratory quality control.
5. Conclusions
This study demonstrates the overall low within- and between-laboratory measurement biases for the 12 tested methods on two batches of agricultural soil over a long interval of analysis and highlights the reliability of the results of the laboratories participating regularly in interlaboratory proficiency tests. As shown from the statistical and graphical analysis, frequent participation in interlaboratory proficiency tests is an effective external quality control tool for laboratories to validate their routine analytical methods, detect anomalies in their analytical procedures, and earn the confidence of customers and public institutions.
Youden plots and z*—standardized difference scores introduced in this study are useful for the blind duplicate testing design. For routine proficiency testing schemes, control charts based on individual z-scores—stratified by round, matrix, concentration level, analytical method, and date of analysis—would be more effective for long-term performance monitoring.
A more comprehensive interlaboratory study on a wider range of soils will be required to evaluate the reproducibility of analytical methods and procedures, considering other sources of random effects. The quantification of different intermediate precision factors contributing to the global variance of the measurand allows for identification of the elements in routine analytical procedures that are a cause of concern for a laboratory’s performance.
Compared with conventional proficiency testing schemes, the present study provides a valuable framework for evaluating laboratories’ capacity to maintain a high level of analytical performance under intermediate-precision conditions over time, thereby supporting long-term quality assurance and continuous performance improvement.
Author Contributions
Conceptualization and methodology, C.M. and A.T.; writing, C.M. and T.T.N.; review and editing, A.T., A.B. and N.P.; supervision, A.B. All authors have read and agreed to the published version of the manuscript.
Funding
This research received no external funding.
Institutional Review Board Statement
Not applicable.
Informed Consent Statement
Not applicable.
Data Availability Statement
The raw data supporting the conclusions of this article will be made available by the authors on request.
Acknowledgments
Bipea acknowledges all the laboratories participating in this study.
Conflicts of Interest
The authors declare no conflicts of interest.
References
- Srivastava, R.K.; Purohit, S.; Alam, E.; Islam, M.K. Advancements in soil management: Optimizing crop production through interdisciplinary approaches. J. Agric. Food Res. 2024, 18, 101528. [Google Scholar] [CrossRef]
- Rakshit, A.; Ghosh, S.; Chakraborty, S.; Philip, V.; Datta, A. Soil Analysis: Recent Trends and Applications; Springer: Singapore, 2020. [Google Scholar]
- Havlin, J.L.; Tisdale, S.L.; Nelson, W.L.; Beaton, J.D. Soil Fertility and Fertilizers: An Introduction to Nutrient Management, 8th ed.; Pearson: Chennai, India, 2014. [Google Scholar]
- Weil, R.R.; Brady, N.C. The Nature and Properties of Soils, 15th ed.; Pearson Education: Upper Saddle River, NJ, USA, 2017. [Google Scholar]
- Kabata-Pendias, A. Soil–plant transfer of trace elements—An environmental issue. Geoderma 2004, 122, 143–149. [Google Scholar] [CrossRef]
- Rabot, E.; Wiesmeier, M.; Schlüter, S.; Vogel, H.J. Soil structure as an indicator of soil functions: A review. Geoderma 2018, 314, 122–137. [Google Scholar] [CrossRef]
- ISO/IEC 17025; General Requirements for the Competence of Testing and Calibration Laboratories. International Standardization Organization: Geneva, Switzerland, 2017.
- ISO/IEC 17043; Conformity Assessment—General Requirements for the Competence of Proficiency Testing Providers. International Standardization Organization: Geneva, Switzerland, 2023.
- Thompson, M.; Ellison, S.L.R.; Wood, R. The international harmonized protocol for the proficiency testing of analytical chemistry laboratories (IUPAC Technical Report). Pure Appl. Chem. 2006, 78, 145–196. [Google Scholar] [CrossRef]
- ISO 13528; Statistical Methods for Use in Proficiency Testing by Interlaboratory Comparison. International Standardization Organization: Geneva, Switzerland, 2022.
- Hund, E.; Massart, D.L.; Smeyers-Verbeke, J. Inter-laboratory studies in analytical chemistry. Anal. Chim. Acta 2000, 423, 145–165. [Google Scholar] [CrossRef]
- ISO 5725-3; Accuracy (Trueness and Precision) of Measurement Methods and Results—Part 3: Intermediate Precision and Alternative Designs for Collaborative Studies. International Standardization Organization: Geneva, Switzerland, 2023.
- 13. ISO 11464; Soil quality–Pretreatment of Samples for Physico-Chemical Analysis. International Standardization Organization: Geneva, Switzerland, 2006.
- ISO 11465; Soil Quality—Determination of Dry Matter and Water Content on a Mass Basis—Gravimetric Method. International Standardization Organization: Geneva, Switzerland, 1993.
- ISO 10390; Soil, Treated Biowaste and Sludge–Determination of pH. International Standardization Organization: Geneva, Switzerland, 2021.
- ISO 11263; Soil Quality—Determination of Phosphorus—Spectrometric Determination of Phosphorus soluble in Sodium Hydrogen Carbonate Solution. International Standardization Organization: Geneva, Switzerland, 1994.
- NF X31-108; Soil Quality—Determination of Ammonium Acetate Extractable Ca++, Mg++, K+ and Na+ cations—Agitation Method. Association Française de Normalisation (AFNOR): La Plaine Saint-Denis, France, 2024.
- ISO 14235; Soil Quality. Determination of Organic Carbon by Sulfochromic Oxidation. International Standardization Organization: Geneva, Switzerland, 1998.
- ISO 11261; Soil Quality—Determination of Total Nitrogen—Modified Kjeldahl Method. International Standardization Organization: Geneva, Switzerland, 1995.
- ISO 13878; Soil Quality—Determination of Total Nitrogen Content by Dry Combustion (“Elemental Analysis”). International Standardization Organization: Geneva, Switzerland, 1998.
- ISO 14256-2; Soil Quality—Determination of Nitrate, Nitrite and Ammonium in Field-Moist Soils by Extraction with Potassium Chloride Solution; Part 2: Automated Method with Segmented Flow Analysis. International Standardization Organization: Geneva, Switzerland, 2005.
- Youden, W.J. Graphical diagnosis of interlaboratory test results. J. Qual. Technol. 1972, 4, 29–33. [Google Scholar] [CrossRef]
- Mandel, J.; Lashof, T.W. Interpretation and generalization of Youden’s two-sample diagram. J. Qual. Technol. 1974, 6, 22–36. [Google Scholar] [CrossRef]
- Van Nuland, Y. ISO 9002 and the circle technique. Qual. Eng. 1992, 5, 269–291. [Google Scholar] [CrossRef]
Figure 1.
Youden plots of the z-scores associated with the moisture content results analyzed on (a) Sample A (January 2020 and May 2022 proficiency tests) and (b) Sample B (December 2020 and April 2022 proficiency tests).
Figure 1.
Youden plots of the z-scores associated with the moisture content results analyzed on (a) Sample A (January 2020 and May 2022 proficiency tests) and (b) Sample B (December 2020 and April 2022 proficiency tests).
Figure 2.
Youden plots of the z-scores associated with the pH results (KCl extraction solution) analyzed on (a) Sample A (January 2020 and May 2022 proficiency tests) and (b) Sample B (December 2020 and April 2022 proficiency tests).
Figure 2.
Youden plots of the z-scores associated with the pH results (KCl extraction solution) analyzed on (a) Sample A (January 2020 and May 2022 proficiency tests) and (b) Sample B (December 2020 and April 2022 proficiency tests).
Figure 3.
Youden plots of the z-scores associated with the pH results (water extraction solution) analyzed on (a) Sample A (January 2020 and May 2022 proficiency tests) and (b) Sample B (December 2020 and April 2022 proficiency tests).
Figure 3.
Youden plots of the z-scores associated with the pH results (water extraction solution) analyzed on (a) Sample A (January 2020 and May 2022 proficiency tests) and (b) Sample B (December 2020 and April 2022 proficiency tests).
Figure 4.
Youden plots of the z-scores associated with the Olsen phosphorus results analyzed on (a) Sample A (January 2020 and May 2022 proficiency tests) and (b) Sample B (December 2020 and April 2022 proficiency tests).
Figure 4.
Youden plots of the z-scores associated with the Olsen phosphorus results analyzed on (a) Sample A (January 2020 and May 2022 proficiency tests) and (b) Sample B (December 2020 and April 2022 proficiency tests).
Figure 5.
Youden plots of the z-scores associated with the exchangeable (extractable) K+ results analyzed on (a) Sample A (January 2020 and May 2022 proficiency tests) and (b) Sample B (December 2020 and April 2022 proficiency tests).
Figure 5.
Youden plots of the z-scores associated with the exchangeable (extractable) K+ results analyzed on (a) Sample A (January 2020 and May 2022 proficiency tests) and (b) Sample B (December 2020 and April 2022 proficiency tests).
Figure 6.
Youden plots of the z-scores associated with the exchangeable (extractable) Ca2+ results analyzed on (a) Sample A (January 2020 and May 2022 proficiency tests) and (b) Sample B (December 2020 and April 2022 proficiency tests).
Figure 6.
Youden plots of the z-scores associated with the exchangeable (extractable) Ca2+ results analyzed on (a) Sample A (January 2020 and May 2022 proficiency tests) and (b) Sample B (December 2020 and April 2022 proficiency tests).
Figure 7.
Youden plots of the z-scores associated with the exchangeable (extractable) Mg2+ results analyzed on (a) Sample A (January 2020 and May 2022 proficiency tests) and (b) Sample B (December 2020 and April 2022 proficiency tests).
Figure 7.
Youden plots of the z-scores associated with the exchangeable (extractable) Mg2+ results analyzed on (a) Sample A (January 2020 and May 2022 proficiency tests) and (b) Sample B (December 2020 and April 2022 proficiency tests).
Figure 8.
Youden plots of the z-scores associated with the organic carbon results analyzed on (a) Sample A (January 2020 and May 2022 proficiency tests) and (b) Sample B (December 2020 and April 2022 proficiency tests).
Figure 8.
Youden plots of the z-scores associated with the organic carbon results analyzed on (a) Sample A (January 2020 and May 2022 proficiency tests) and (b) Sample B (December 2020 and April 2022 proficiency tests).
Figure 9.
Youden plots of the z-scores associated with the Kjeldahl total nitrogen results analyzed on (a) Sample A (January 2020 and May 2022 proficiency tests) and (b) Sample B (December 2020 and April 2022 proficiency tests).
Figure 9.
Youden plots of the z-scores associated with the Kjeldahl total nitrogen results analyzed on (a) Sample A (January 2020 and May 2022 proficiency tests) and (b) Sample B (December 2020 and April 2022 proficiency tests).
Figure 10.
Youden plots of the z-scores associated with the dry combustion total nitrogen results analyzed on (a) Sample A (January 2020 and May 2022 proficiency tests) and (b) Sample B (December 2020 and April 2022 proficiency tests).
Figure 10.
Youden plots of the z-scores associated with the dry combustion total nitrogen results analyzed on (a) Sample A (January 2020 and May 2022 proficiency tests) and (b) Sample B (December 2020 and April 2022 proficiency tests).
Figure 11.
Youden plots of the z-scores associated with the nitrate nitrogen results analyzed on (a) Sample A (January 2020 and May 2022 proficiency tests) and (b) Sample B (December 2020 and April 2022 proficiency tests).
Figure 11.
Youden plots of the z-scores associated with the nitrate nitrogen results analyzed on (a) Sample A (January 2020 and May 2022 proficiency tests) and (b) Sample B (December 2020 and April 2022 proficiency tests).
Figure 12.
Youden plots of the z-scores associated with ammoniacal nitrogen results analyzed on (a) Sample A (January 2020 and May 2022 proficiency tests) and (b) Sample B (December 2020 and April 2022 proficiency tests).
Figure 12.
Youden plots of the z-scores associated with ammoniacal nitrogen results analyzed on (a) Sample A (January 2020 and May 2022 proficiency tests) and (b) Sample B (December 2020 and April 2022 proficiency tests).
Figure 13.
z* standardized difference scores calculated for each pair of measurements of 12 analytes performed by 27 laboratories on Sample A.
Figure 13.
z* standardized difference scores calculated for each pair of measurements of 12 analytes performed by 27 laboratories on Sample A.
Figure 14.
z* standardized difference scores calculated for each pair of measurements of 12 analytes performed by 27 laboratories on Sample B.
Figure 14.
z* standardized difference scores calculated for each pair of measurements of 12 analytes performed by 27 laboratories on Sample B.
Table 1.
Analytical methods.
Table 1.
Analytical methods.
| Analyte | Method |
|---|
| Moisture content | ISO 11465 [14] |
| pH (extraction solution KCl 1 M) | ISO 10390 [15] |
| pH (extraction solution H2O) | ISO 10390 [15] |
| Plant-available phosphorus—P2O5 (Olsen) | ISO 11263 [16] |
| Exchangeable (extractable) K+ | NF X31-108 [17] |
| Exchangeable (extractable) Ca2+ | NF X31-108 [17] |
| Exchangeable (extractable) Mg2+ | NF X31-108 [17] |
| Organic carbon | ISO 14235 [18] |
| Total nitrogen (Kjeldahl) | ISO 11261 [19] |
| Total nitrogen (dry combustion) | ISO 13878 [20] |
| Nitrate nitrogen | ISO 14256-2 [21] |
| Ammoniacal nitrogen | ISO 14256-2 [21] |
Table 2.
Statistical summary of 12 analytes in Sample A’s proficiency tests.
Table 2.
Statistical summary of 12 analytes in Sample A’s proficiency tests.
| Sample A’s Analytes | Unit | a | b | c | d (%) | e | f | g (%) | h | i |
|---|
| Moisture | % | 27 | 1.52 | 0.10 | 7 | 1.49 | 0.09 | 6 | 0.03 | 0.12 |
| pH (KCl extraction) | - | 25 | 6.79 | 0.05 | 1 | 6.74 | 0.05 | 1 | 0.05 | 0.06 |
| pH (water extraction) | - | 24 | 7.21 | 0.09 | 1 | 7.17 | 0.07 | 1 | 0.04 | 0.08 |
| Phosphorus (Olsen) | g, kg−1 | 23 | 0.062 | 0.005 | 8 | 0.067 | 0.006 | 9 | −0.005 | 0.007 |
| Exchangeable K+ | g, kg−1 | 24 | 0.061 | 0.005 | 8 | 0.061 | 0.004 | 7 | 0.000 | 0.005 |
| Exchangeable Ca2+ | g, kg−1 | 24 | 2.884 | 0.126 | 4 | 2.861 | 0.097 | 3 | 0.023 | 0.138 |
| Exchangeable Mg2+ | g, kg−1 | 24 | 0.505 | 0.022 | 4 | 0.507 | 0.014 | 3 | −0.002 | 0.022 |
| Organic carbon | g, kg−1 | 18 | 21.5 | 0.9 | 4 | 22.2 | 1.3 | 6 | −0.7 | 1.4 |
| Total nitrogen (Kjeldahl) | g, kg−1 | 14 | 2.15 | 0.09 | 4 | 2.14 | 0.10 | 5 | 0.01 | 0.07 |
| Total nitrogen (dry combustion) | g, kg−1 | 12 | 2.20 | 0.11 | 5 | 2.28 | 0.16 | 7 | −0.08 | 0.16 |
| Nitrate nitrogen | mg, kg−1 | 26 | 59.11 | 3.66 | 6 | 56.12 | 2.87 | 5 | 2.99 | 3.8 |
| Ammoniacal nitrogen | mg, kg−1 | 26 | 3.52 | 0.50 | 14 | 5.45 | 0.45 | 8 | −1.93 | 1.43 |
Table 3.
Laboratory performance in Sample A’s proficiency tests.
Table 3.
Laboratory performance in Sample A’s proficiency tests.
| Sample A’s Analytes | a | b | c | d | e | f | g |
|---|
| Moisture | 27 | 25 (93%) | 2 (7%) | 0 (0%) | 24 (89%) | 1 (4%) | 2 (7%) |
| pH (KCl extraction) | 25 | 24 (96%) | 0 (0%) | 1 (4%) | 24 (96%) | 0 (0%) | 1 (4%) |
| pH (water extraction) | 24 | 23 (96%) | 1 (4%) | 0 (0%) | 22 (92%) | 2 (8%) | 0 (0%) |
| Phosphorus (Olsen) | 23 | 23 (100%) | 0 (0%) | 0 (0%) | 21 (91%) | 0 (0%) | 2 (9%) |
| Exchangeable K+ | 24 | 24 (100%) | 0 (0%) | 0 (0%) | 22 (92%) | 1 (4%) | 1 (4%) |
| Exchangeable Ca2+ | 24 | 22 (92%) | 2 (8%) | 0 (0%) | 23 (96%) | 0 (0%) | 1 (4%) |
| Exchangeable Mg2+ | 24 | 23 (96%) | 1 (4%) | 0 (0%) | 21 (88%) | 2 (8%) | 1 (4%) |
| Organic carbon | 18 | 18 (100%) | 0 (0%) | 0 (0%) | 17 (94%) | 0 (0%) | 1 (6%) |
| Total nitrogen (Kjeldahl) | 14 | 14 (100%) | 0 (0%) | 0 (0%) | 14 (100%) | 0 (0%) | 0 (0%) |
| Total nitrogen (dry combustion) | 12 | 12 (100%) | 0 (0%) | 0 (0%) | 11 (92%) | 0 (0%) | 1 (8%) |
| Nitrate nitrogen | 26 | 25 (96%) | 0 (0%) | 1 (4%) | 23 (88%) | 1 (4%) | 2 (8%) |
| Ammoniacal nitrogen | 26 | 23 (88%) | 2 (8%) | 1 (4%) | 23 (88%) | 3 (12%) | 0 (0%) |
Table 4.
Statistical summary of 12 analytes in Sample B’s proficiency tests.
Table 4.
Statistical summary of 12 analytes in Sample B’s proficiency tests.
| Sample B’s Analytes | Unit | a | b | c | d (%) | e | f | g (%) | h | i |
|---|
| Moisture | % | 27 | 1.28 | 0.07 | 5 | 1.28 | 0.08 | 6 | 0.00 | 0.06 |
| pH (KCl extraction) | - | 24 | 5.62 | 0.07 | 1 | 5.58 | 0.05 | 1 | 0.04 | 0.06 |
| pH (water extraction) | - | 24 | 6.18 | 0.08 | 1 | 6.19 | 0.05 | 1 | −0.01 | 0.06 |
| Phosphorus (Olsen) | g, kg−1 | 23 | 0.144 | 0.012 | 8 | 0.147 | 0.011 | 7 | −0.003 | 0.012 |
| Exchangeable K+ | g, kg−1 | 24 | 0.355 | 0.017 | 5 | 0.360 | 0.011 | 3 | −0.005 | 0.012 |
| Exchangeable Ca2+ | g, kg−1 | 24 | 2.075 | 0.062 | 3 | 2.114 | 0.090 | 4 | −0.039 | 0.065 |
| Exchangeable Mg2+ | g, kg−1 | 24 | 0.172 | 0.007 | 4 | 0.171 | 0.008 | 5 | 0.001 | 0.006 |
| Organic carbon | g, kg−1 | 18 | 19.6 | 1.3 | 7 | 19.0 | 0.8 | 4 | 0.6 | 1.0 |
| Total nitrogen (Kjeldahl) | g, kg−1 | 15 | 2.00 | 0.08 | 4 | 1.98 | 0.08 | 4 | 0.02 | 0.06 |
| Total nitrogen (dry combustion) | g, kg−1 | 12 | 2.07 | 0.10 | 5 | 2.07 | 0.09 | 4 | 0.00 | 0.11 |
| Nitrate nitrogen | mg, kg−1 | 25 | 121.34 | 9.44 | 8 | 119.97 | 8.31 | 7 | 1.37 | 14.19 |
| Ammoniacal nitrogen | mg, kg−1 | 26 | 12.05 | 0.99 | 8 | 13.47 | 0.89 | 7 | −1.42 | 2.02 |
Table 5.
Laboratory performance in Sample B’s proficiency tests.
Table 5.
Laboratory performance in Sample B’s proficiency tests.
| Sample B’s Analytes | a | b | c | d | e | f | g |
|---|
| Moisture | 27 | 25 (92%) | 1 (4%) | 1 (4%) | 23 (85%) | 3 (11%) | 1 (4%) |
| pH (KCl extraction) | 24 | 23 (96%) | 1 (4%) | 0 (0%) | 22 (92%) | 2 (8%) | 0 (0%) |
| pH (water extraction) | 24 | 23 (96%) | 0 (0%) | 1 (4%) | 24 (100%) | 0 (0%) | 0 (0%) |
| Phosphorus (Olsen) | 23 | 22 (96%) | 1 (4%) | 0 (0%) | 21 (91%) | 0 (0%) | 2 (9%) |
| Exchangeable K+ | 24 | 23 (96%) | 1 (4%) | 0 (0%) | 24 (100%) | 0 (0%) | 0 (0%) |
| Exchangeable Ca2+ | 24 | 22 (92%) | 2 (8%) | 0 (0%) | 24 (100%) | 0 (0%) | 0 (0%) |
| Exchangeable Mg2+ | 24 | 24 (100%) | 0 (0%) | 0 (0%) | 24 (100%) | 0 (0%) | 0 (0%) |
| Organic carbon | 18 | 18 (100%) | 0 (0%) | 0 (0%) | 17 (94%) | 1 (6%) | 0 (0%) |
| Total nitrogen (Kjeldahl) | 15 | 15 (100%) | 0 (0%) | 0 (0%) | 14 (93%) | 1 (7%) | 0 (0%) |
| Total nitrogen (dry combustion) | 12 | 11 (92%) | 0 (0%) | 1 (8%) | 12 (100%) | 0 (0%) | 0 (0%) |
| Nitrate nitrogen | 25 | 23 (92%) | 1 (4%) | 1 (4%) | 22 (88%) | 0 (0%) | 3 (12%) |
| Ammoniacal nitrogen | 26 | 21 (80%) | 3 (12%) | 2 (8%) | 24 (92%) | 1 (4%) | 1 (4%) |
| Disclaimer/Publisher’s Note: The statements, opinions and data contained in all publications are solely those of the individual author(s) and contributor(s) and not of MDPI and/or the editor(s). MDPI and/or the editor(s) disclaim responsibility for any injury to people or property resulting from any ideas, methods, instructions or products referred to in the content. |



 ,
,