Article

Differences in Multi-Phase Hydrocarbon Accumulation and Controlling Factors Between Eastern and Western Kuqa Depression


1
Institute of Energy, Peking University, Beijing 100871, China
2
SINOPEC Petroleum Exploration and Production Research Institute, Beijing 102206, China
3
State Energy Key Laboratory of Carbonate Oil and Gas, Beijing 102206, China
4
SINOPEC Key Laboratory of Geology and Resources in Deep Stratum, Beijing 102206, China
5
Key Laboratory of Exploration Technologies for Oil and Gas Resources of Ministry of Education, Yangtze University, Wuhan 430100, China
*
Authors to whom correspondence should be addressed.
Appl. Sci. 2026, 16(14), 7305; https://doi.org/10.3390/app16147305
Submission received: 3 June 2026 / Revised: 16 July 2026 / Accepted: 16 July 2026 / Published: 21 July 2026
(This article belongs to the Section Earth Sciences)

Featured Application

The integrated petrographic, fluid inclusion, Raman spectroscopic, and burial–thermal modeling framework developed in this study provides a practical tool for reconstructing multi-phase hydrocarbon charging histories and pressure evolution in structurally complex foreland basins. Beyond identifying accumulation timing and migration pathways, this framework can support exploration target optimization, evaluation of reservoir preservation and overpressure risk, selection of appropriate development strategies for tight-gas and conventional oil reservoirs, and preliminary assessment of hydrocarbon phase and possible product-quality variation when combined with geochemical data.

Abstract

The Kuqa Depression in the Tarim Basin is a structurally complex foreland basin with strong east–west variations in tectonic deformation, pressure regime, and petroleum system evolution, making reconstruction of multiphase hydrocarbon charging essential for deep and tight reservoir exploration. This study aims to compare the timing, phases, and controlling factors of hydrocarbon accumulation in the eastern Dibei area and the western Qiulitage structural belt. Petrography, fluid inclusion petrography, fluorescence spectroscopy, microthermometry, laser Raman spectroscopy, and burial–thermal history modeling were integrated to reconstruct hydrocarbon charging and pressure evolution in two representative structural domains, the eastern Dibei area and the western Qiulitage structural belt. The results show that the Jurassic Ahe Formation in the eastern Dibei area experienced four charging episodes at 22–20 Ma, 12–10 Ma, 9–7 Ma, and 3–2 Ma, including two oil-charging and two gas-charging stages, whereas the western Tuotan-1 area recorded only two main oil-charging events at 23–20 Ma and 5–3 Ma. These contrasting accumulation histories are primarily controlled by differences in the degree of tectonic contraction, pressure evolution, and source rock maturity. In the eastern Kuqa Depression, intense Himalayan compression promoted overpressure development (pressure coefficient 1.5–1.7), facilitating vertical hydrocarbon migration along fault systems and ultimately leading to tight gas accumulation following reservoir densification at ~8 Ma. In contrast, the western region experienced weaker deformation and near-normal pressure conditions, favoring lateral migration along unconformities and the formation of conventional oil reservoirs. These results highlight the role of tectonic–pressure coupling in governing multi-phase hydrocarbon accumulation and provide a geological basis not only for exploration of deep and tight reservoirs in the Kuqa Depression, but also for evaluating reservoir preservation, overpressure-related development risk, and possible hydrocarbon phase and product-quality variation.

1. Introduction

The Kuqa Depression, located at the northern part of the Tarim Basin, is one of the most important oil and gas provinces in China [1,2]. It hosts multiple large gas fields and plays a critical role in the “West–East Gas Pipeline Project” [3]. Extensive exploration has confirmed the presence of complex hydrocarbon accumulation processes in the northern Kuqa Depression, particularly within the eastern Dibei Slope and the Tugerming Uplift, where several gas fields have been discovered [4,5]. However, despite these successes, the northern structural belt remains underexplored due to limited well control and complex structural deformation [6,7].
Previous studies have shown that the Jurassic reservoirs in this region have experienced multiple hydrocarbon charging and adjustment events, resulting in diverse hydrocarbon phase and mixed source contributions [8]. Nevertheless, most existing studies focus on individual structural belts or single accumulation stages, whereas systematic comparisons between different tectonic domains remain limited.
The Kuqa Depression exhibits pronounced east–west variations in tectonic style, burial history, pressure regime, and source–reservoir assemblages [9,10]. These variations provide a natural laboratory for examining how different tectonic and pressure conditions control hydrocarbon accumulation processes [11,12]. Previous petrographic and fluid inclusion studies of the Tuotan-1 well in the western Qiulitage structural belt have documented hydrocarbon charging processes in Cambrian dolomite reservoirs [13]. Therefore, this study conducts a comparative study of hydrocarbon accumulation in the eastern Dibei area and the western Qiulitage structural belt. By integrating petrography, fluid inclusion analysis, Raman spectroscopy, and burial history modeling, we aim to (1) reconstruct the timing and phases of hydrocarbon charging, and (2) clarify the key geological controls on contrasting accumulation styles under different tectonic and pressure regimes. However, reconstruction of multiphase hydrocarbon accumulation in structurally complex piedmont basins remains challenging because most previous studies have relied on a single analytical method or focused on only one structural domain. Such approaches are often insufficient to resolve the timing, phase evolution, and controlling factors of hydrocarbon charging under variable tectonic and pressure conditions. Therefore, the main research question of this study is how different tectonic regimes and pressure evolution histories control the timing, phases, and pathways of hydrocarbon accumulation in the eastern and western Kuqa Depression, and whether an integrated analytical framework can provide a more robust reconstruction than conventional single-method approaches. To address this question, we combine petrography, fluid inclusion petrography, fluorescence spectroscopy, microthermometry, Raman spectroscopy, and burial–thermal history modeling to reconstruct the multiphase charging history and identify the key geological controls on contrasting accumulation styles. Understanding how tectonic processes control multiphase hydrocarbon accumulation is important not only for reconstructing petroleum system evolution in structurally complex foreland basins, but also for predicting favorable migration pathways, pressure compartments, and reservoir preservation conditions in deep and tight plays. Such knowledge can improve target evaluation, reduce drilling risks related to strong heterogeneity and overpressure, and support more efficient and environmentally responsible hydrocarbon exploration and development.

2. Geological Setting

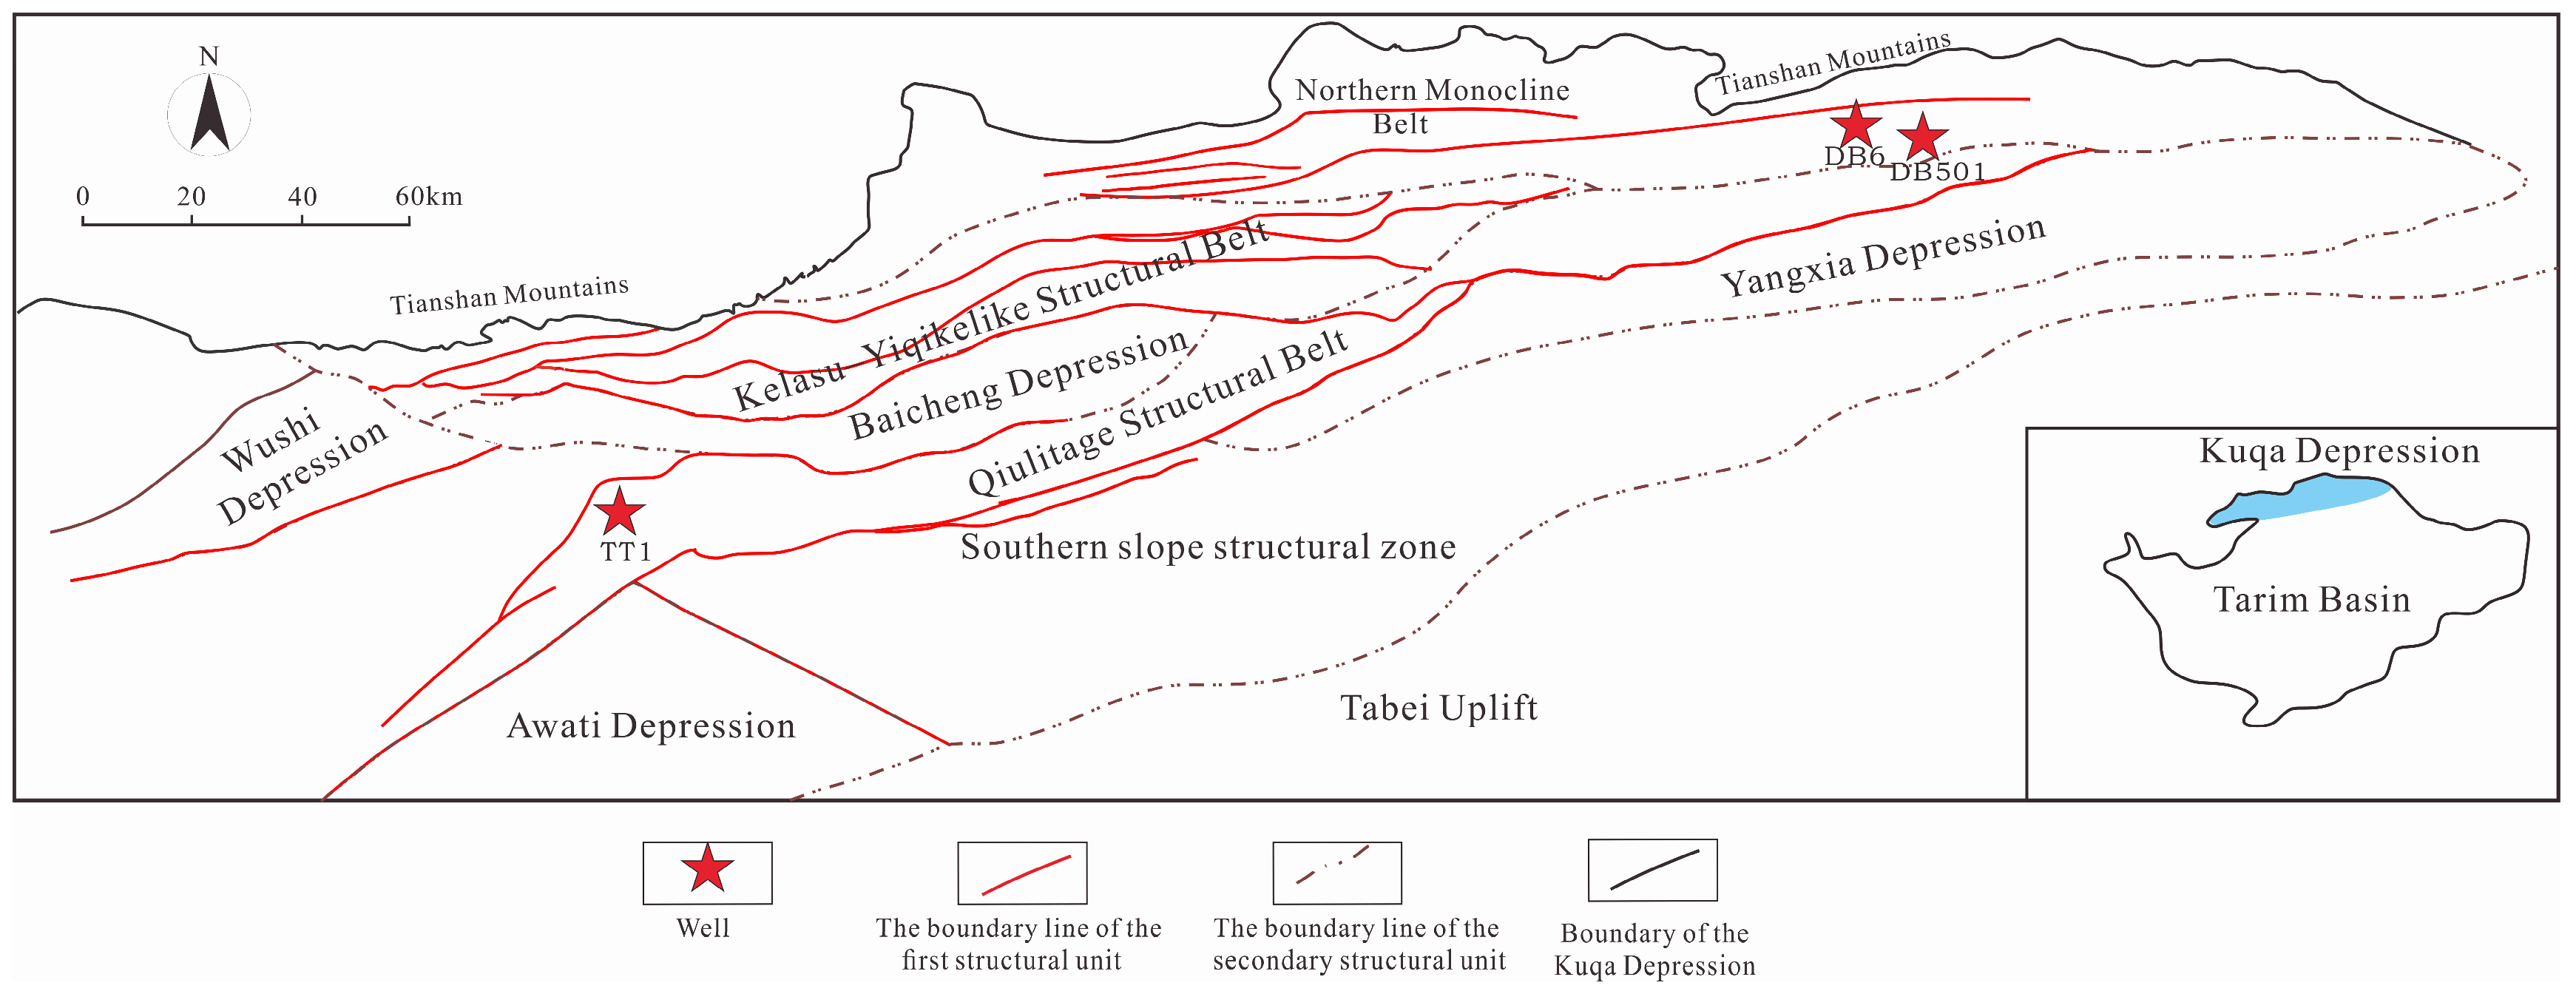
The Kuqa Depression is located along the northern margin of the Tarim Basin, bounded by the Tianshan Mountains to the north and the Tabei Uplift to the south [14,15,16]. It extends approximately 550 km east–west and 30–80 km north–south, covering a total area of about 28,500 km2 [9]. Structurally, the depression is subdivided into several east–west-trending tectonic units, including the Northern Monocline Belt, the Kelasu–Yiqikelike Structural Belt, the Wushi–Baicheng–Yangxia Depression, the Qiulitage Structural Belt, and the Southern Slope [17] (Figure 1).
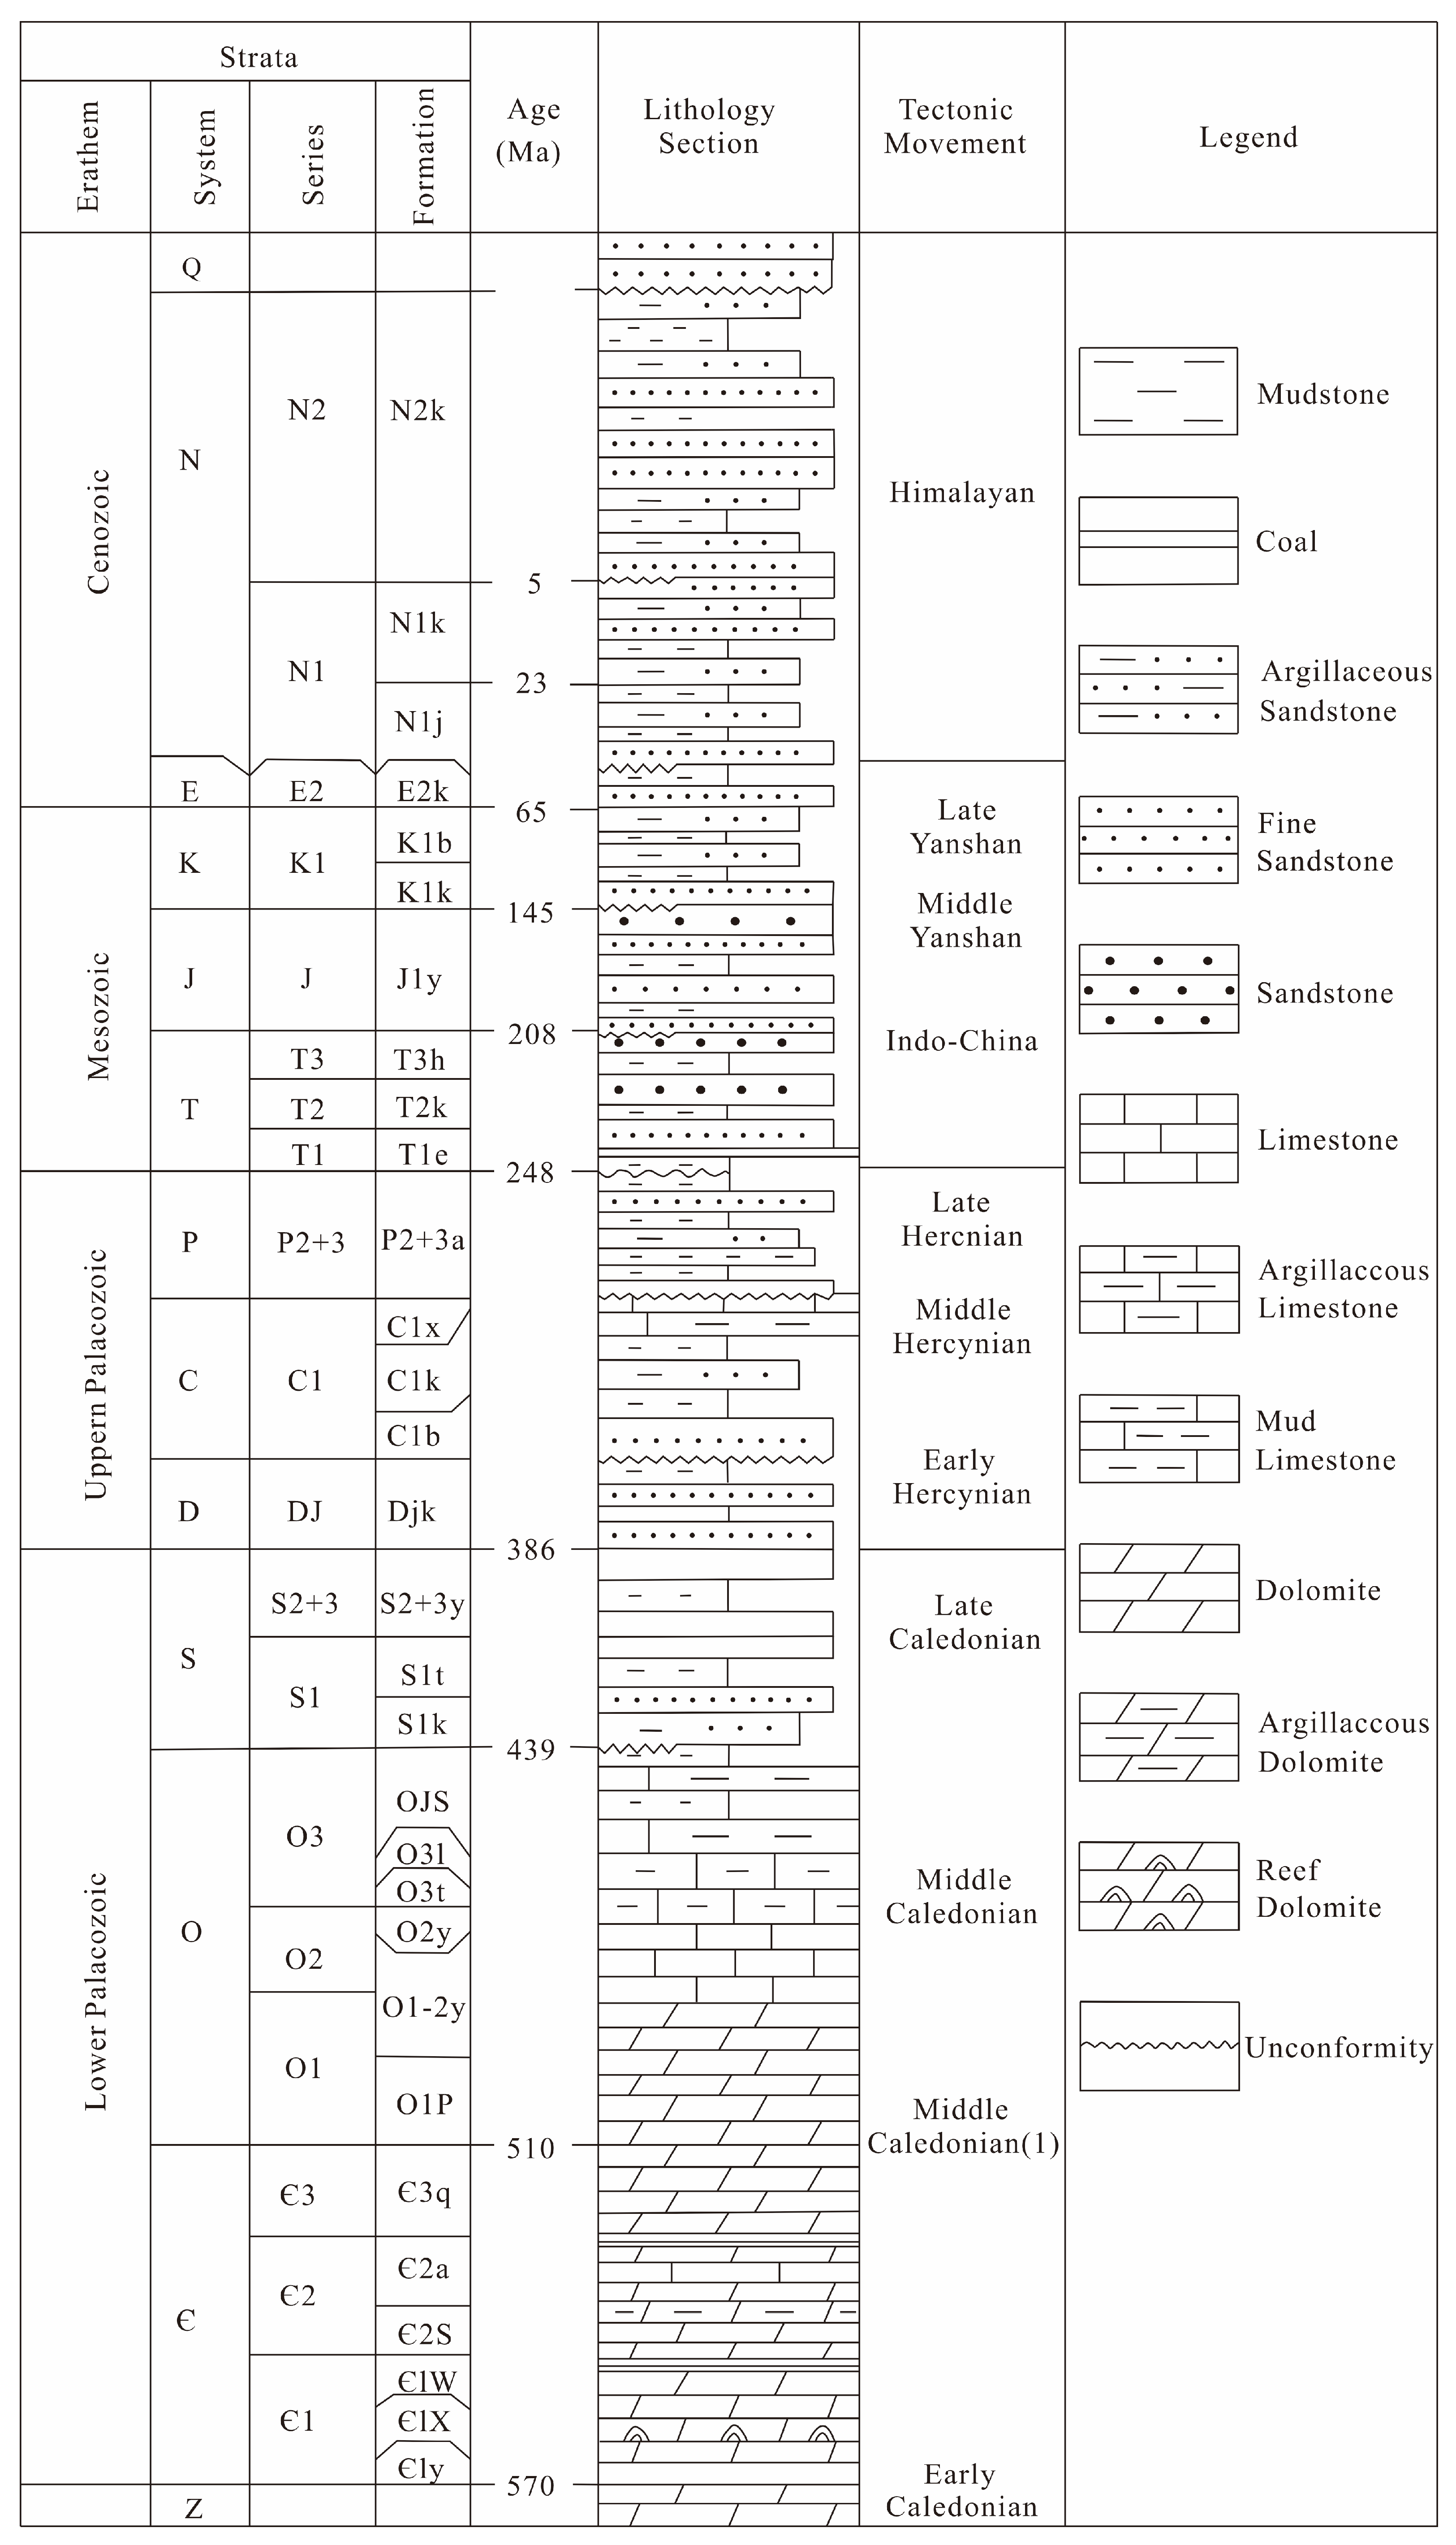
The stratigraphic succession in the northern Kuqa Depression comprises Mesozoic (Triassic–Cretaceous) and Cenozoic strata [18] (Figure 2). Triassic lacustrine mudstones (Huangshanjie Formation) and Jurassic lacustrine mudstones (Yangxia Formation) constitute the primary source rocks, whereas reservoirs are mainly developed in Jurassic sandstones (Ahe Formation) in the east and Upper Cambrian dolomite (Lower Qiulitage Formation) in the west. The Upper Cambrian Lower Qiulitage Formation is widely distributed in the western Kuqa Depression and consists predominantly of fractured dolomite, providing favorable reservoir space for hydrocarbon accumulation. Although the eastern and western reservoirs belong to different stratigraphic units and lithologic systems, they represent the principal hydrocarbon-bearing intervals in two contrasting structural domains of the same basin and therefore provide a suitable basis for examining how basin-scale tectonic and pressure differences influence hydrocarbon accumulation style.
As a representative regenerated foreland basin in China, the Kuqa Depression has undergone a three-stage evolutionary history: 1. Peripheral foreland basin stage during the Late Permian to Early Triassic; 2. Rift/subsidence stage from the Late Triassic through the Paleogene; 3. Regenerated foreland basin stage since the Neogene [19,20].
The present structural framework of the Kuqa Depression is largely controlled by Neogene–Quaternary Himalayan compression [21,22]. Since the middle to late phases of the Himalayan orogeny, tectonic compression from the reactivation of the South Tianshan Mountains has progressively deformed the region from north to south [23]. Deformation intensity increases eastward, resulting in strong faulting and widespread overpressure development in the eastern Kuqa Depression, whereas the western region experienced gentler deformation and remained close to hydrostatic pressure conditions [24,25]. The onset of deformation began in the Early Miocene, forming the Northern Monocline Belt. The Kelasu–Yiqikelike Belt started to develop during the Late Miocene, while the Qiulitage Structural Belt began forming in the Early Pliocene [26]. By the Late Pliocene, uplift of the South Tianshan and crustal shortening intensified deformation across all structural belts [27]. Strong erosion occurred at the structural highs. Since the Quaternary, thick sequences of coarse-grained sediments have accumulated in the structural lows, giving rise to the present-day thick Xiyu Group.

3. Samples and Methods

The objects of this study are reservoir rocks and hydrocarbon-bearing vein samples from two representative hydrocarbon accumulation systems in the Kuqa Depression: the Jurassic Ahe Formation sandstone reservoir in the eastern Dibei area and the Upper Cambrian Lower Qiulitage Formation dolomite reservoir in the western Qiulitage structural belt (Table 1). The analyzed materials include reservoir rock samples, fracture-/vein-filling calcite/dolomite cements, and hydrocarbon-bearing fluid inclusion assemblages. In total, 21 samples were collected and examined, including 19 samples from the eastern area and 2 samples from the western area. These samples were used for petrographic observation, fluid inclusion petrography, fluorescence spectroscopy, microthermometry, Raman spectroscopy, and burial–thermal history interpretation.

3.1. Sample Collection and Preparation

Rock samples used in this study were collected from two representative structural domains of the Kuqa Depression. Western samples were taken from fracture-filling calcite in the Upper Cambrian Lower Qiulitage Formation of the Tuotan-1 well, whereas eastern samples were obtained from calcite- and quartz-filled fractures in the Jurassic Ahe Formation of the Dibei-6 and Dibei-501 wells. All specimens were made into doubly polished wafers with a thickness of approximately 80–100 μm for petrographic observation, fluid inclusion work, and Raman analysis.

3.2. Petrography and Cathodoluminescence

Conventional petrographic observations were first carried out to establish vein relationships, host mineral assemblages, inclusion occurrence, and cross-cutting textures. Cathodoluminescence (CL) imaging was then used to distinguish different generations of calcite cement and to identify growth zonation and cement sequence. CL analyses were performed at the China University of Geosciences (Wuhan) using a CL 8200 MK5 system (Cambridge Image Technology Ltd., Hatfield, UK) operated at an accelerating voltage of 17 kV and a beam current of 500 μA.

3.3. Fluid Inclusion Petrography, Fluorescence, and Microthermometry

Fluid inclusion petrography, ultraviolet fluorescence observation, and fluorescence spectroscopy were carried out at the Key Laboratory of Tectonics and Petroleum Resources, China University of Geosciences (Wuhan). Inclusion types were classified on the basis of host mineral, distribution pattern, shape, phase ratio, fluorescence color, and their relationship to crystal growth zones or healed microfractures. Only inclusions with clear outlines and no obvious evidence of leakage, necking-down, or post-entrapment stretching were selected for further analysis.
Fluorescence observations were made with a Nikon LV100 microscope (Nikon Corporation, Tokyo, Japan) equipped with a UV excitation system operating in the 300–365 nm range. Fluorescence spectra of hydrocarbon-bearing inclusions were measured using a microscope-coupled spectrofluorometric system consisting of a Nikon LV100 fluorescence/transmitted-light microscope linked to a Maya2000 Pro fiber-optic spectrometer (Ocean Optics, Inc., Dunedin, FL, USA). Here, QF535 refers to the quantitative fluorescence intensity at 535 nm derived from the fluorescence emission spectrum of hydrocarbon inclusions, which is used to characterize the composition and maturity of the trapped hydrocarbons. The maximum emission wavelength (λmax) and spectral parameter QF535 were used to distinguish inclusion populations with different hydrocarbon compositions and maturities. These spectral data were interpreted together with petrographic observations and homogenization temperatures to constrain the sequence of oil charging.
Microthermometric measurements were obtained with a Linkam THMS600G heating-freezing stage (Linkam Scientific Instruments Ltd., Redhill, Surrey, UK). The heating/cooling rate was maintained at about °C, and the stage was held isothermally for approximately 2 min near phase transitions to improve reading stability. Analytical uncertainty was within °C. Multiple heating-cooling runs were carried out on representative aqueous inclusions to check repeatability. Homogenization temperatures of coeval aqueous inclusions were taken as minimum trapping temperatures and were subsequently matched with burial–thermal histories to infer the timing of inclusion trapping.

3.4. Raman Spectroscopy

Laser Raman analyses were conducted on gas-rich and methane-dominant inclusions from the eastern Dibei area using a Renishaw inVia Reflex Raman spectrometer (Renishaw plc, Wotton-under-Edge, UK) equipped with a 532 nm excitation laser. To avoid overheating or damaging the inclusions, laser power at the sample surface was kept below 5 mW. Spectra were generally acquired for 10–30 s per measurement and summed over three accumulations.
A two-step acquisition strategy was used. Broad scans were first collected to determine the overall gaseous composition of the inclusion. High-resolution measurements of the methane stretching region were then obtained with an 1800 lines/mm grating in order to determine the exact position of the CH4 symmetric stretching band. Raman shift calibration was performed before each analytical session using a polished silicon wafer with the standard peak at 520.7 cm−1. For the high-resolution methane measurements, wavenumber accuracy was further checked against the instrument lamp line correction procedure, which helped reduce instrumental drift during peak-position determination.
Only optically intact inclusions with a stable focus, minimal host-mineral interference, and no visible post-entrapment modification were analyzed. Methane was identified by its characteristic v1 band near 2908 cm−1. After baseline correction and removal of spurious spikes, the corrected methane peak positions were used to estimate CH4 density through published Raman shift–density relationships. These density data were subsequently used in pressure reconstruction.

3.5. Burial and Thermal History Modeling

Burial and thermal evolution were reconstructed with BasinMod 1D (version [7.06]; Platte River Associates, Inc., Boulder, CO, USA) for the Dibei-6, Dibei-501, and Tuotan-1 wells. The modeling was designed as a one-dimensional burial–thermal reconstruction of the reservoir intervals hosting the analyzed fluid inclusions, rather than as a full petroleum system or migration model. Its purpose was to establish the time–temperature paths of the Jurassic Ahe Formation in the eastern Dibei area and the Lower Qiulitage Formation in the Tuotan-1 well, and then to compare these paths with homogenization temperatures of coeval aqueous inclusions to constrain trapping intervals and hydrocarbon charging timing. The regional source-rock context used in the interpretation is based mainly on the Triassic Huangshanjie Formation and Jurassic Yangxia Formation, which are the principal source rocks in the Kuqa Depression. The model input included stratigraphic age and thickness, lithology, compaction behavior, unconformity-related erosion, and regional tectonic constraints. Lithology-dependent decompaction parameters were applied during backstripping so that changes in burial depth through time could be restored more realistically.
A transient, time-dependent heat-flow model was employed rather than a single constant heat-flow value. In this approach, basal heat flow varies through geological time according to the tectonothermal evolution of the basin, and the thermal structure is solved by conductive heat transfer using the thermal properties and heat capacities of the rock column. Accordingly, changes in heat flow do not produce an instantaneous temperature response; instead, the subsurface temperature profile evolves progressively as controlled by thermal inertia. This framework is more appropriate for the Kuqa Depression, where tectonic loading, uplift, and erosion changed markedly from the Mesozoic to the Cenozoic.
Heat-flow history and erosion magnitude were constrained using available regional geological data, including burial architecture, major tectonic episodes, published maturity information, and present-day temperature constraints from the study area. Model calibration was achieved by comparing simulated thermal maturity and temperature evolution with observed geological and geochemical constraints. Once a satisfactory thermal model was obtained, homogenization temperatures of inclusion assemblages were projected onto the burial–temperature curves to determine likely trapping intervals and thus the timing of hydrocarbon charging. Key model inputs included formation tops and thicknesses from the studied wells, lithology assignments and associated compaction parameters for each stratigraphic unit, estimates of erosion at major unconformities, and a time-dependent basal heat-flow history. Model calibration and validation relied on consistency between simulated thermal evolution and available regional maturity information together with present-day temperature constraints from the study area. In addition, the trapping intervals inferred from the models were checked against independent petrographic relationships and fluid-inclusion assemblage characteristics. Accordingly, the BasinMod results are used here as one-dimensional temporal constraints on inclusion trapping and hydrocarbon charging, rather than as a standalone deterministic simulation of the full accumulation process.
The exact numerical inputs used in the Dibei and TT1 burial–thermal models are summarized in Table 2 and Table 3. In the BasinMod input, F denotes a formation preserved in the present-day stratigraphic succession, whereas E denotes an erosion event, with erosion thickness entered as a negative value. Lithology-dependent compaction parameters were adopted from the BasinMod default database. The heat-flow history and geothermal gradients were constrained by regional thermal data, whereas the fluid-inclusion homogenization temperatures were measured in this study.

4. Results

4.1. Petrography of Calcite and Quartz Veins

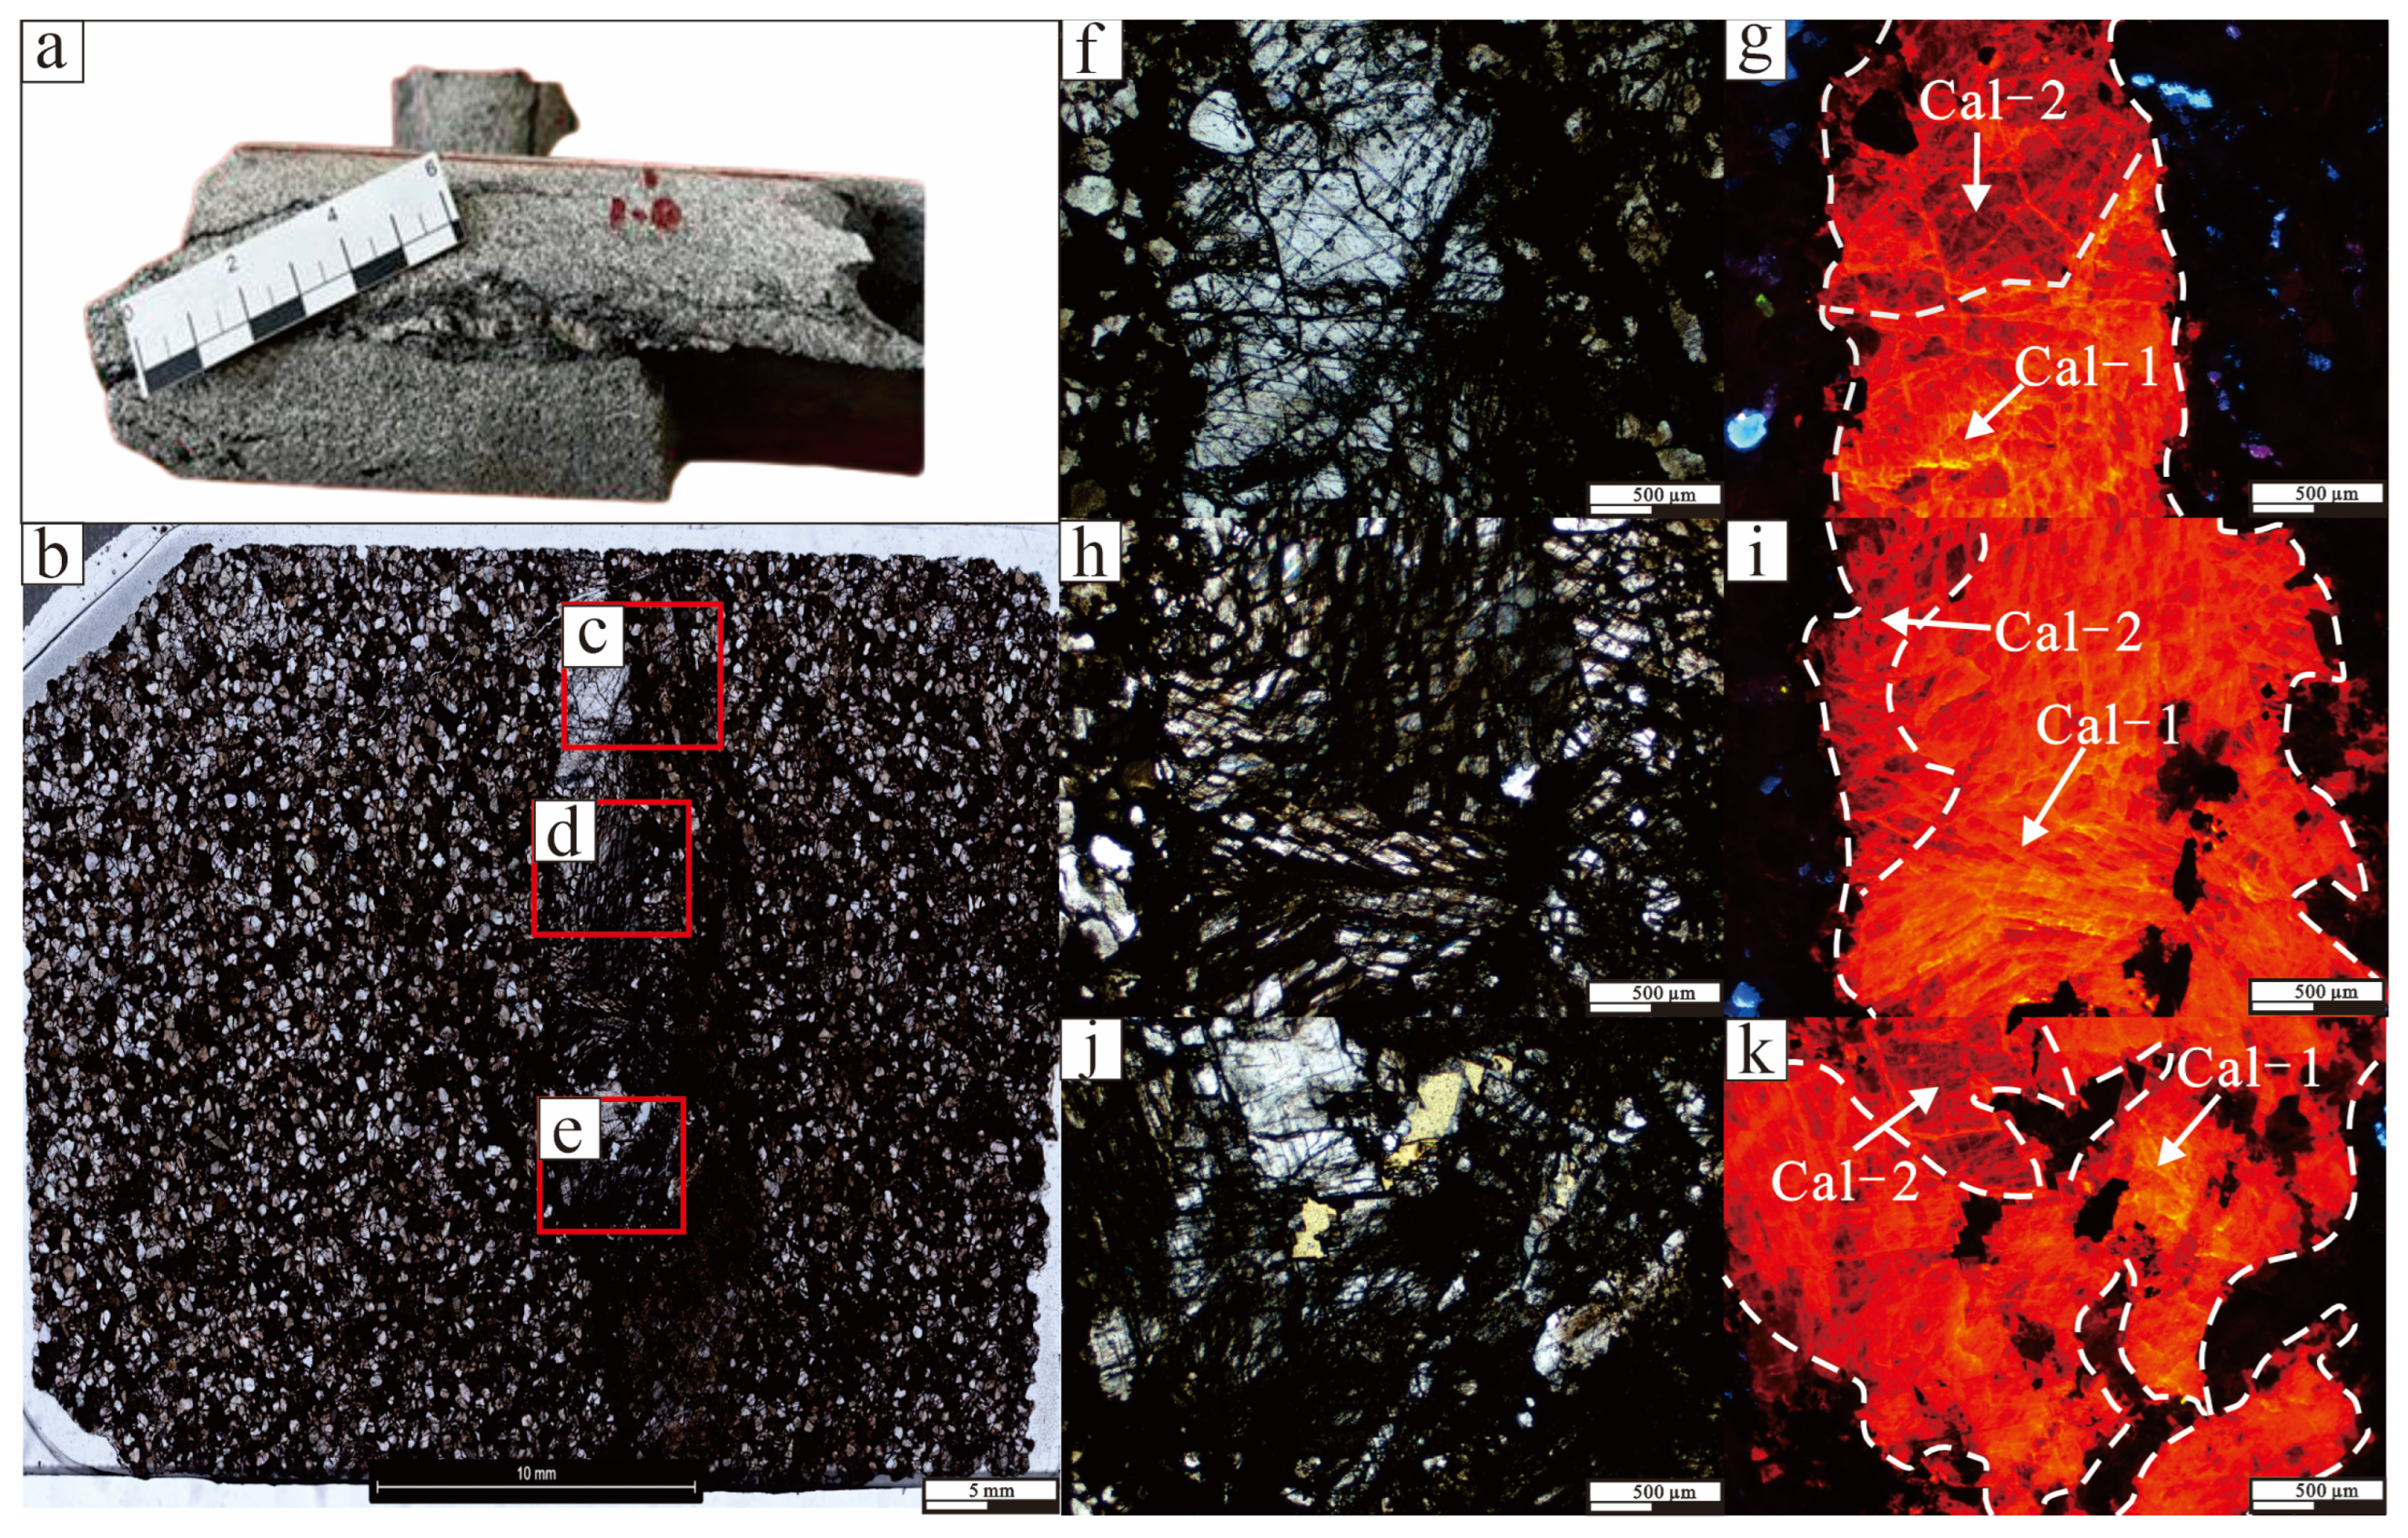
In the western Tuotan-1 Well, located in the Upper Cambrian Lower Qiulitage Formation, two distinct generations of calcite veins were identified based on crosscutting relationships, crystal morphology, and cathodoluminescence (CL) characteristics (Figure 3). The first-generation calcite veins occur within dolomite-hosted fractures and are commonly crosscut by later veins. These veins are typically 1–8 mm wide and are composed of euhedral to subhedral calcite crystals with grain sizes ranging from 10 to 50 μm (Figure 3a–e). Under plane-polarized light, the crystals are colorless and transparent (Figure 3f,h,j). Cathodoluminescence imaging shows a uniformly bright red luminescence, indicating relatively homogeneous growth conditions (Figure 3g,i,k). The second-generation calcite veins preferentially fill vuggy pores and enlarged fractures within the dolomite host (Figure 3a–e). These veins display slightly coarser crystal sizes (20–80 μm) and more irregular crystal boundaries compared to the first generation (Figure 3f,h,j). Under CL, they exhibit darker red to deep red luminescence, locally with weak zoning, suggesting changes in fluid composition or growth conditions during precipitation (Figure 3g,i,k).
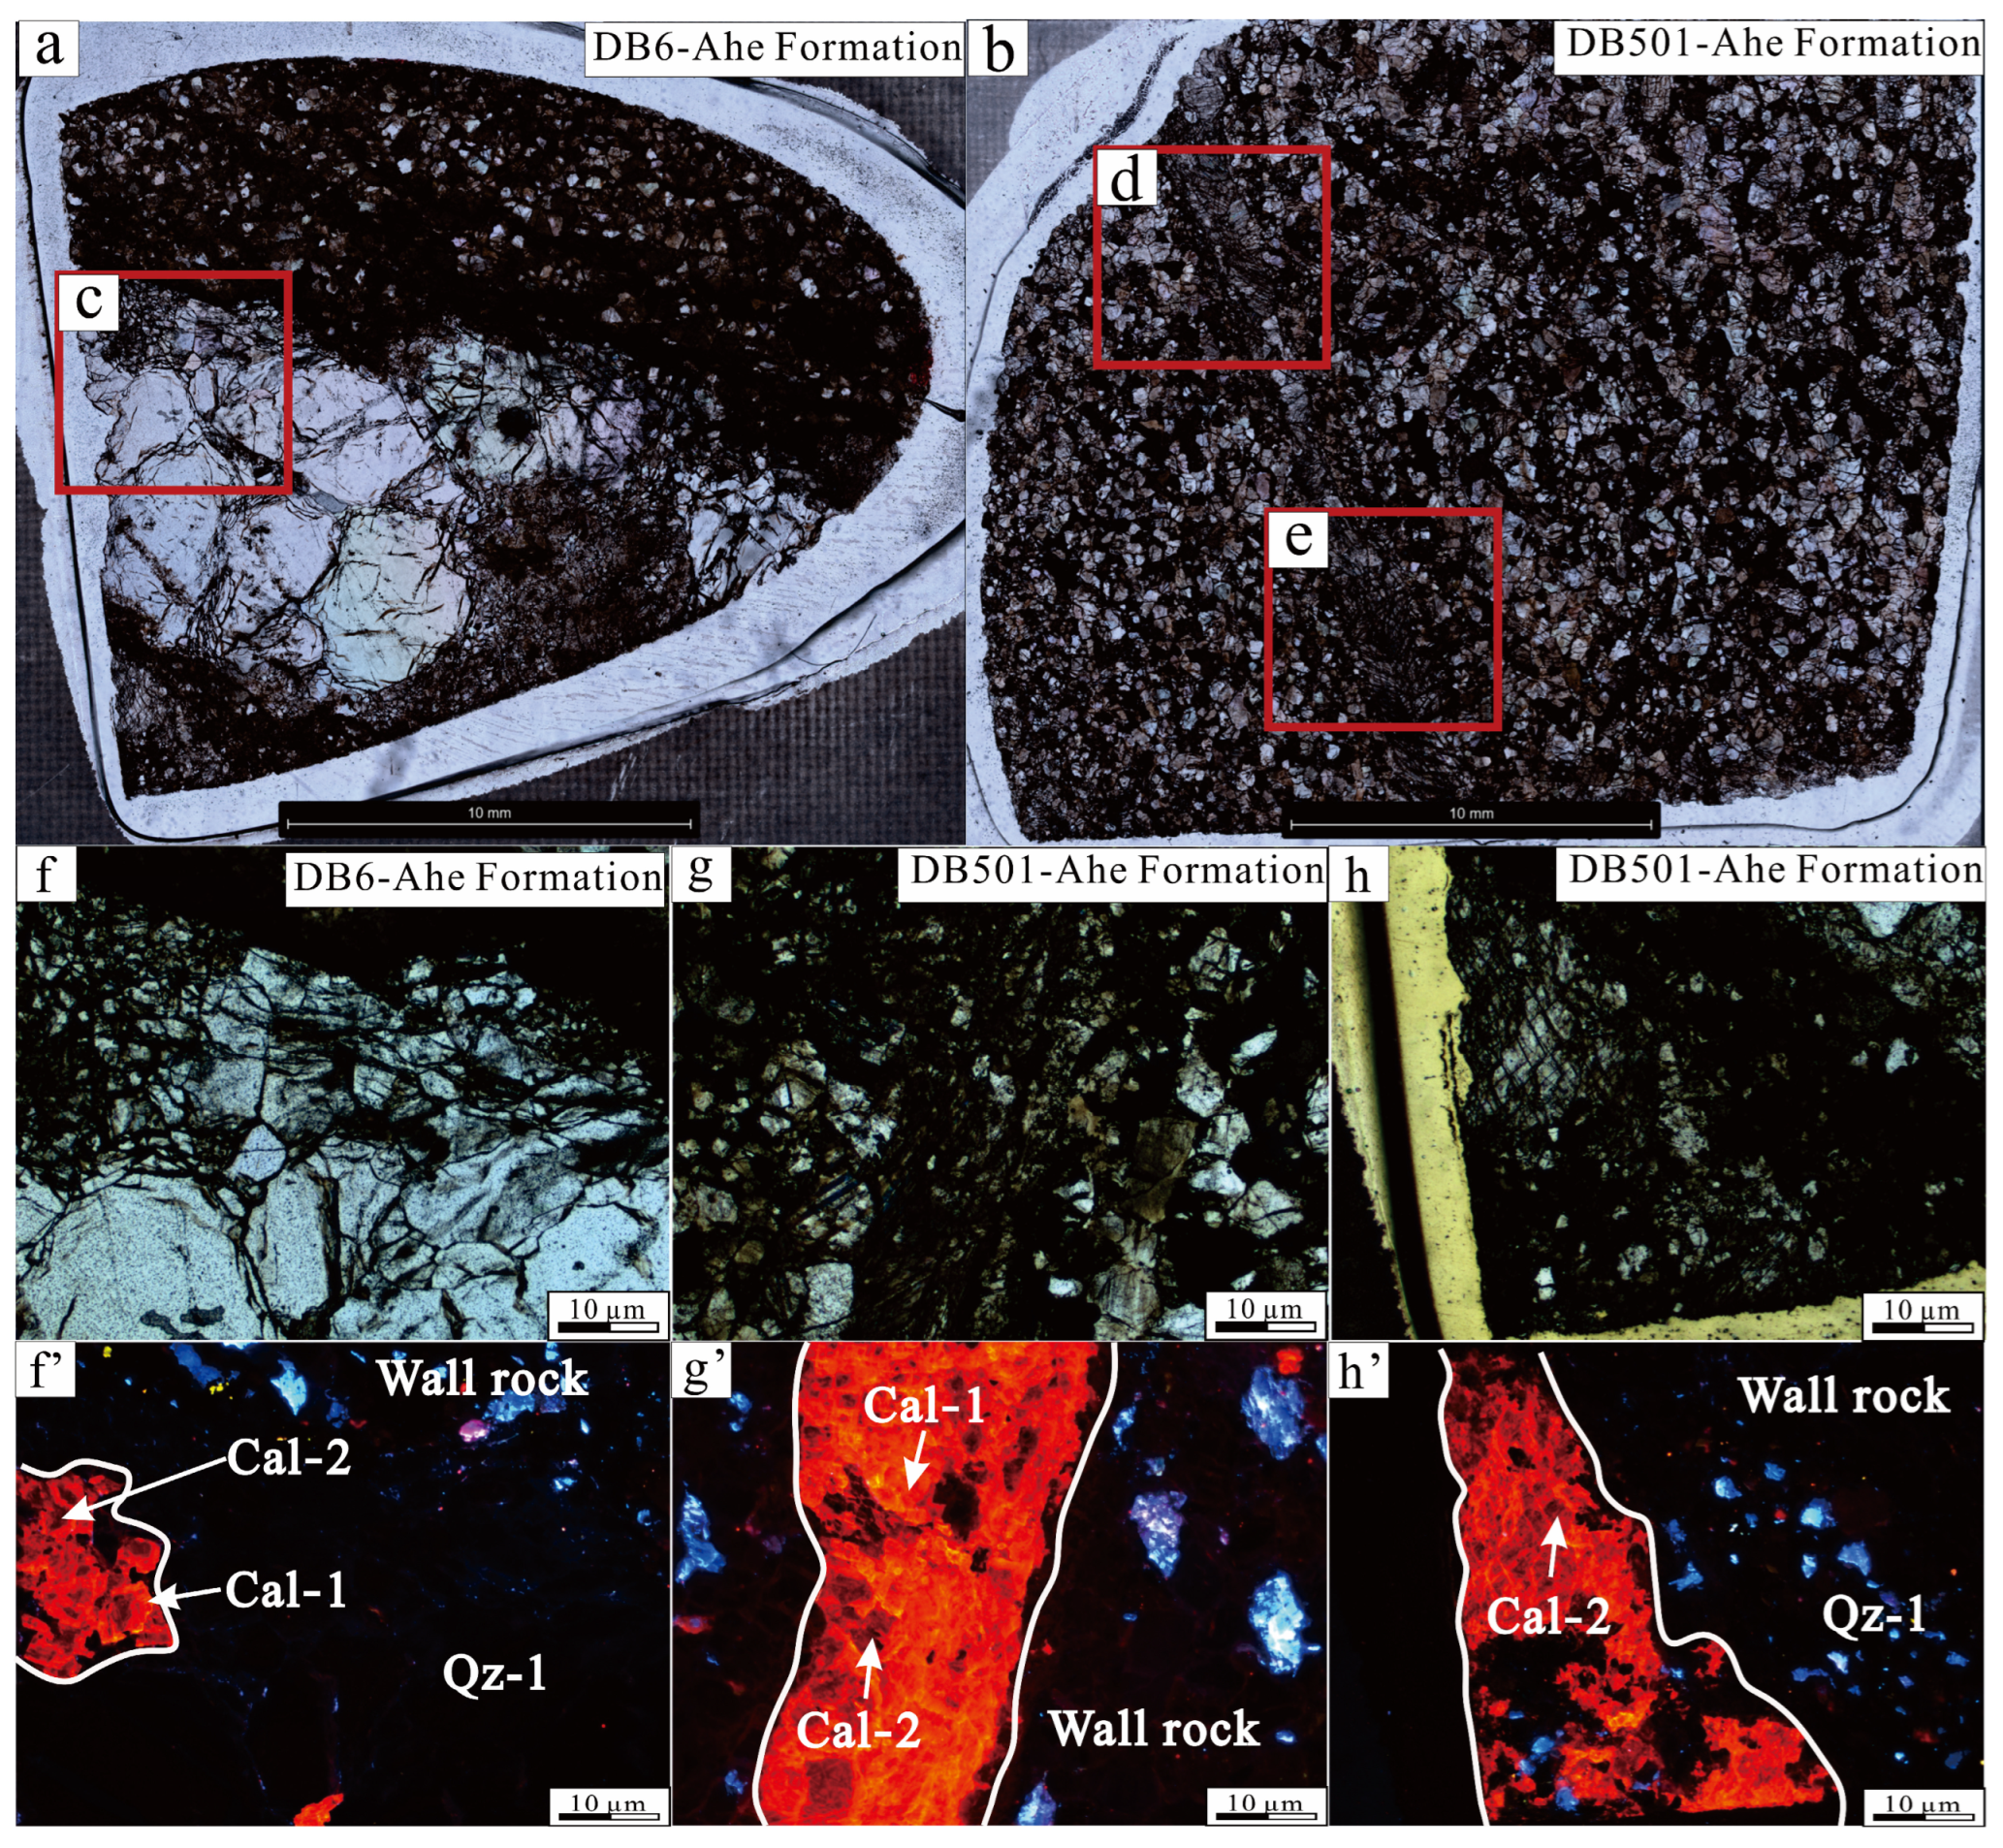
In the eastern Kuqa Depression, petrographic observations were conducted on samples from the Dibei-6 and Dibei-501 wells targeting the Jurassic Ahe Formation. Two generations of calcite veins and one generation of quartz veins were identified within sandstone reservoirs (Figure 4a,b). The first-generation calcite veins occur as high-angle fractures that crosscut sandstone bedding. These veins are 6–10 mm wide and consist of fine-grained calcite crystals with grain sizes of 6–8 μm (Figure 4c,d,f,g). The crystals appear colorless under plane-polarized light (Figure 4c,d,f,g) and exhibit bright red luminescence under CL (Figure 4f’,g’). Quartz veins associated with this fracture system are composed of colorless to transparent quartz crystals with grain sizes ranging from 20 to 80 μm and show no luminescence under CL (Figure 4f’–h’). The second-generation calcite veins are distinguished by cleaner crystal faces and slightly coarser grain sizes (8–12 μm) (Figure 4c–h). Under plane-polarized light, these calcite crystals appear grayish, and CL imaging reveals a dark brown luminescence, clearly contrasting with the first-generation calcite (Figure 4f’–h’).
Based on CL imaging and petrographic relationships, two calcite phases (Cal-1 and Cal-2) were distinguished within the fracture-filling calcite. Cal-1 occurs mainly in the earlier-formed crystal cores and/or along fracture margins, whereas Cal-2 occurs as rims, overgrowths, or fills the remaining fracture space toward the vein center. Therefore, Cal-1 is interpreted as the earlier phase and Cal-2 as the later phase. Although the boundary between Cal-1 and Cal-2 is locally diffuse in CL images, their distinction is supported not only by luminescence differences but also by their textural occurrence and filling position within the same fractures.

4.2. Fluid Inclusion Analysis

4.2.1. Petrography of Fluid Inclusions

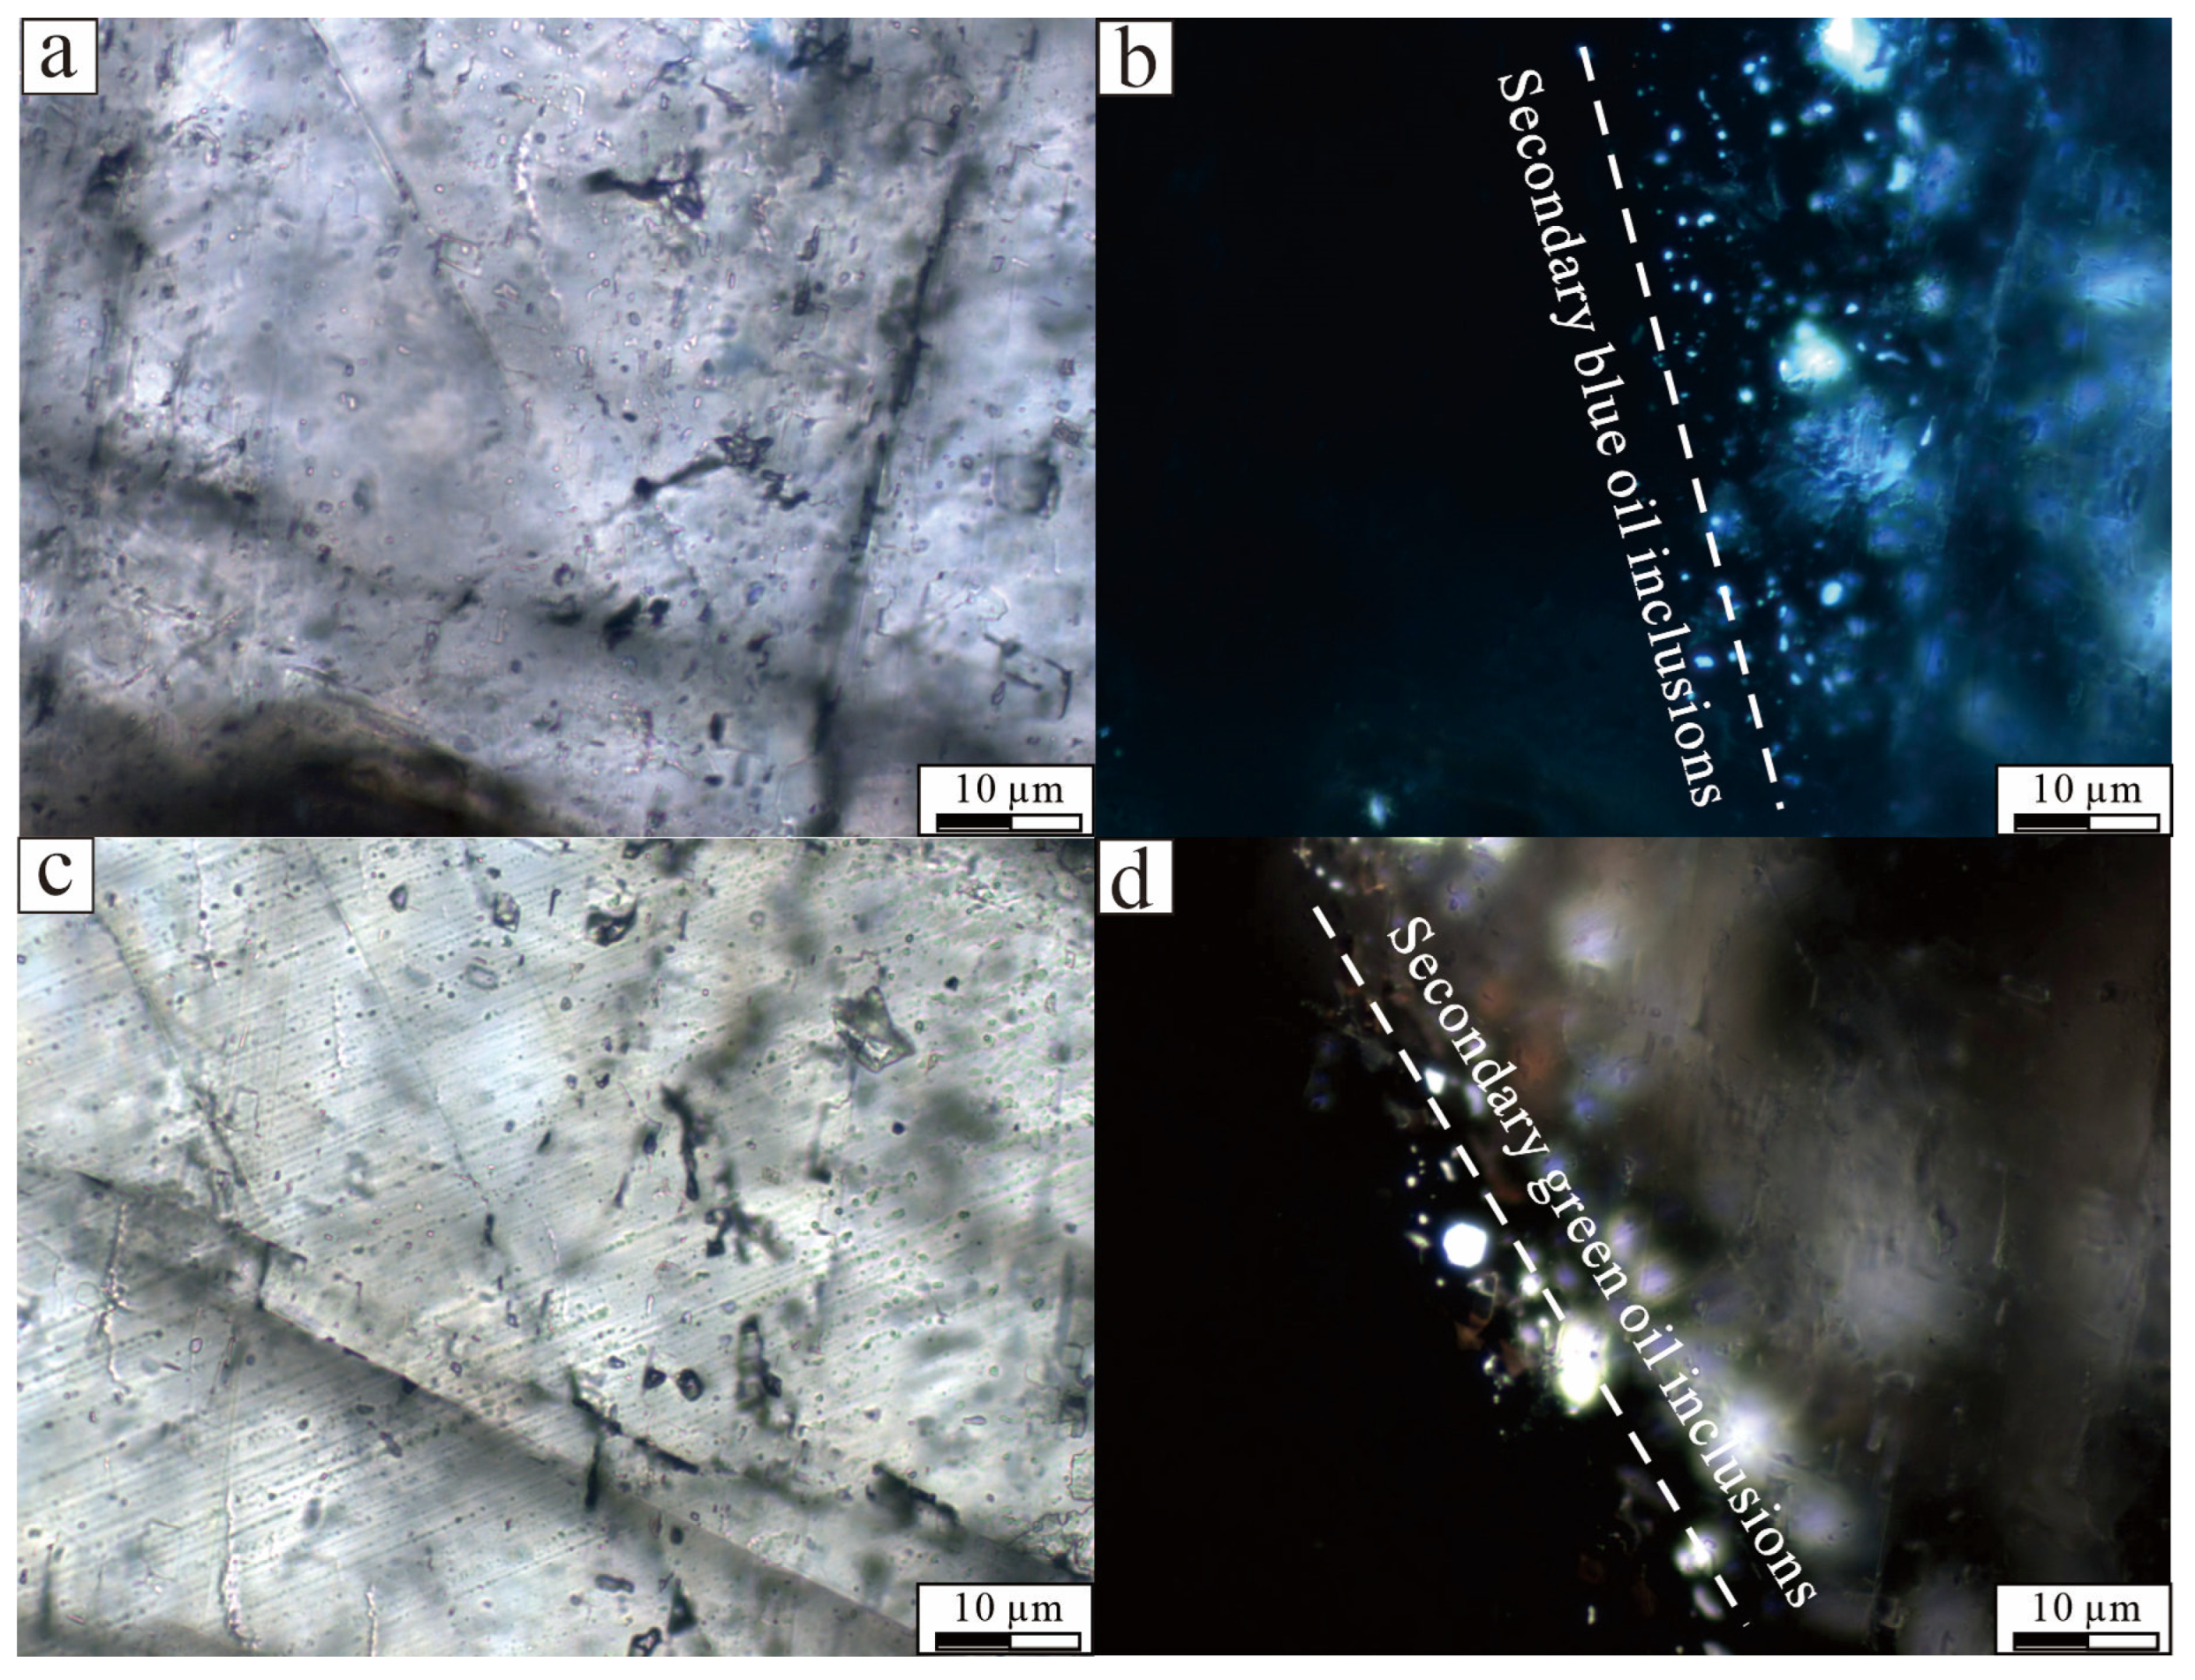
In the western Kuqa Depression, fluid inclusions were investigated in calcite veins from the Tuotan-1 Well within the Qiulitage structural belt. Two principal types of fluid inclusions were identified based on their occurrence, morphology, and fluorescence behavior. The first type consists of secondary oil inclusions distributed along healed microfractures within first-generation calcite veins. These inclusions are relatively large (8–10 μm), elongated to elliptical in shape, and appear colorless and transparent under transmitted light. Under ultraviolet excitation, they display blue fluorescence (Figure 5a,b). The second type comprises secondary oil inclusions hosted by second-generation calcite veins (Figure 5c,d). These inclusions are smaller (2–8 μm) and show irregular morphologies, including elongated and amorphous shapes, exhibiting green fluorescence under ultraviolet light.
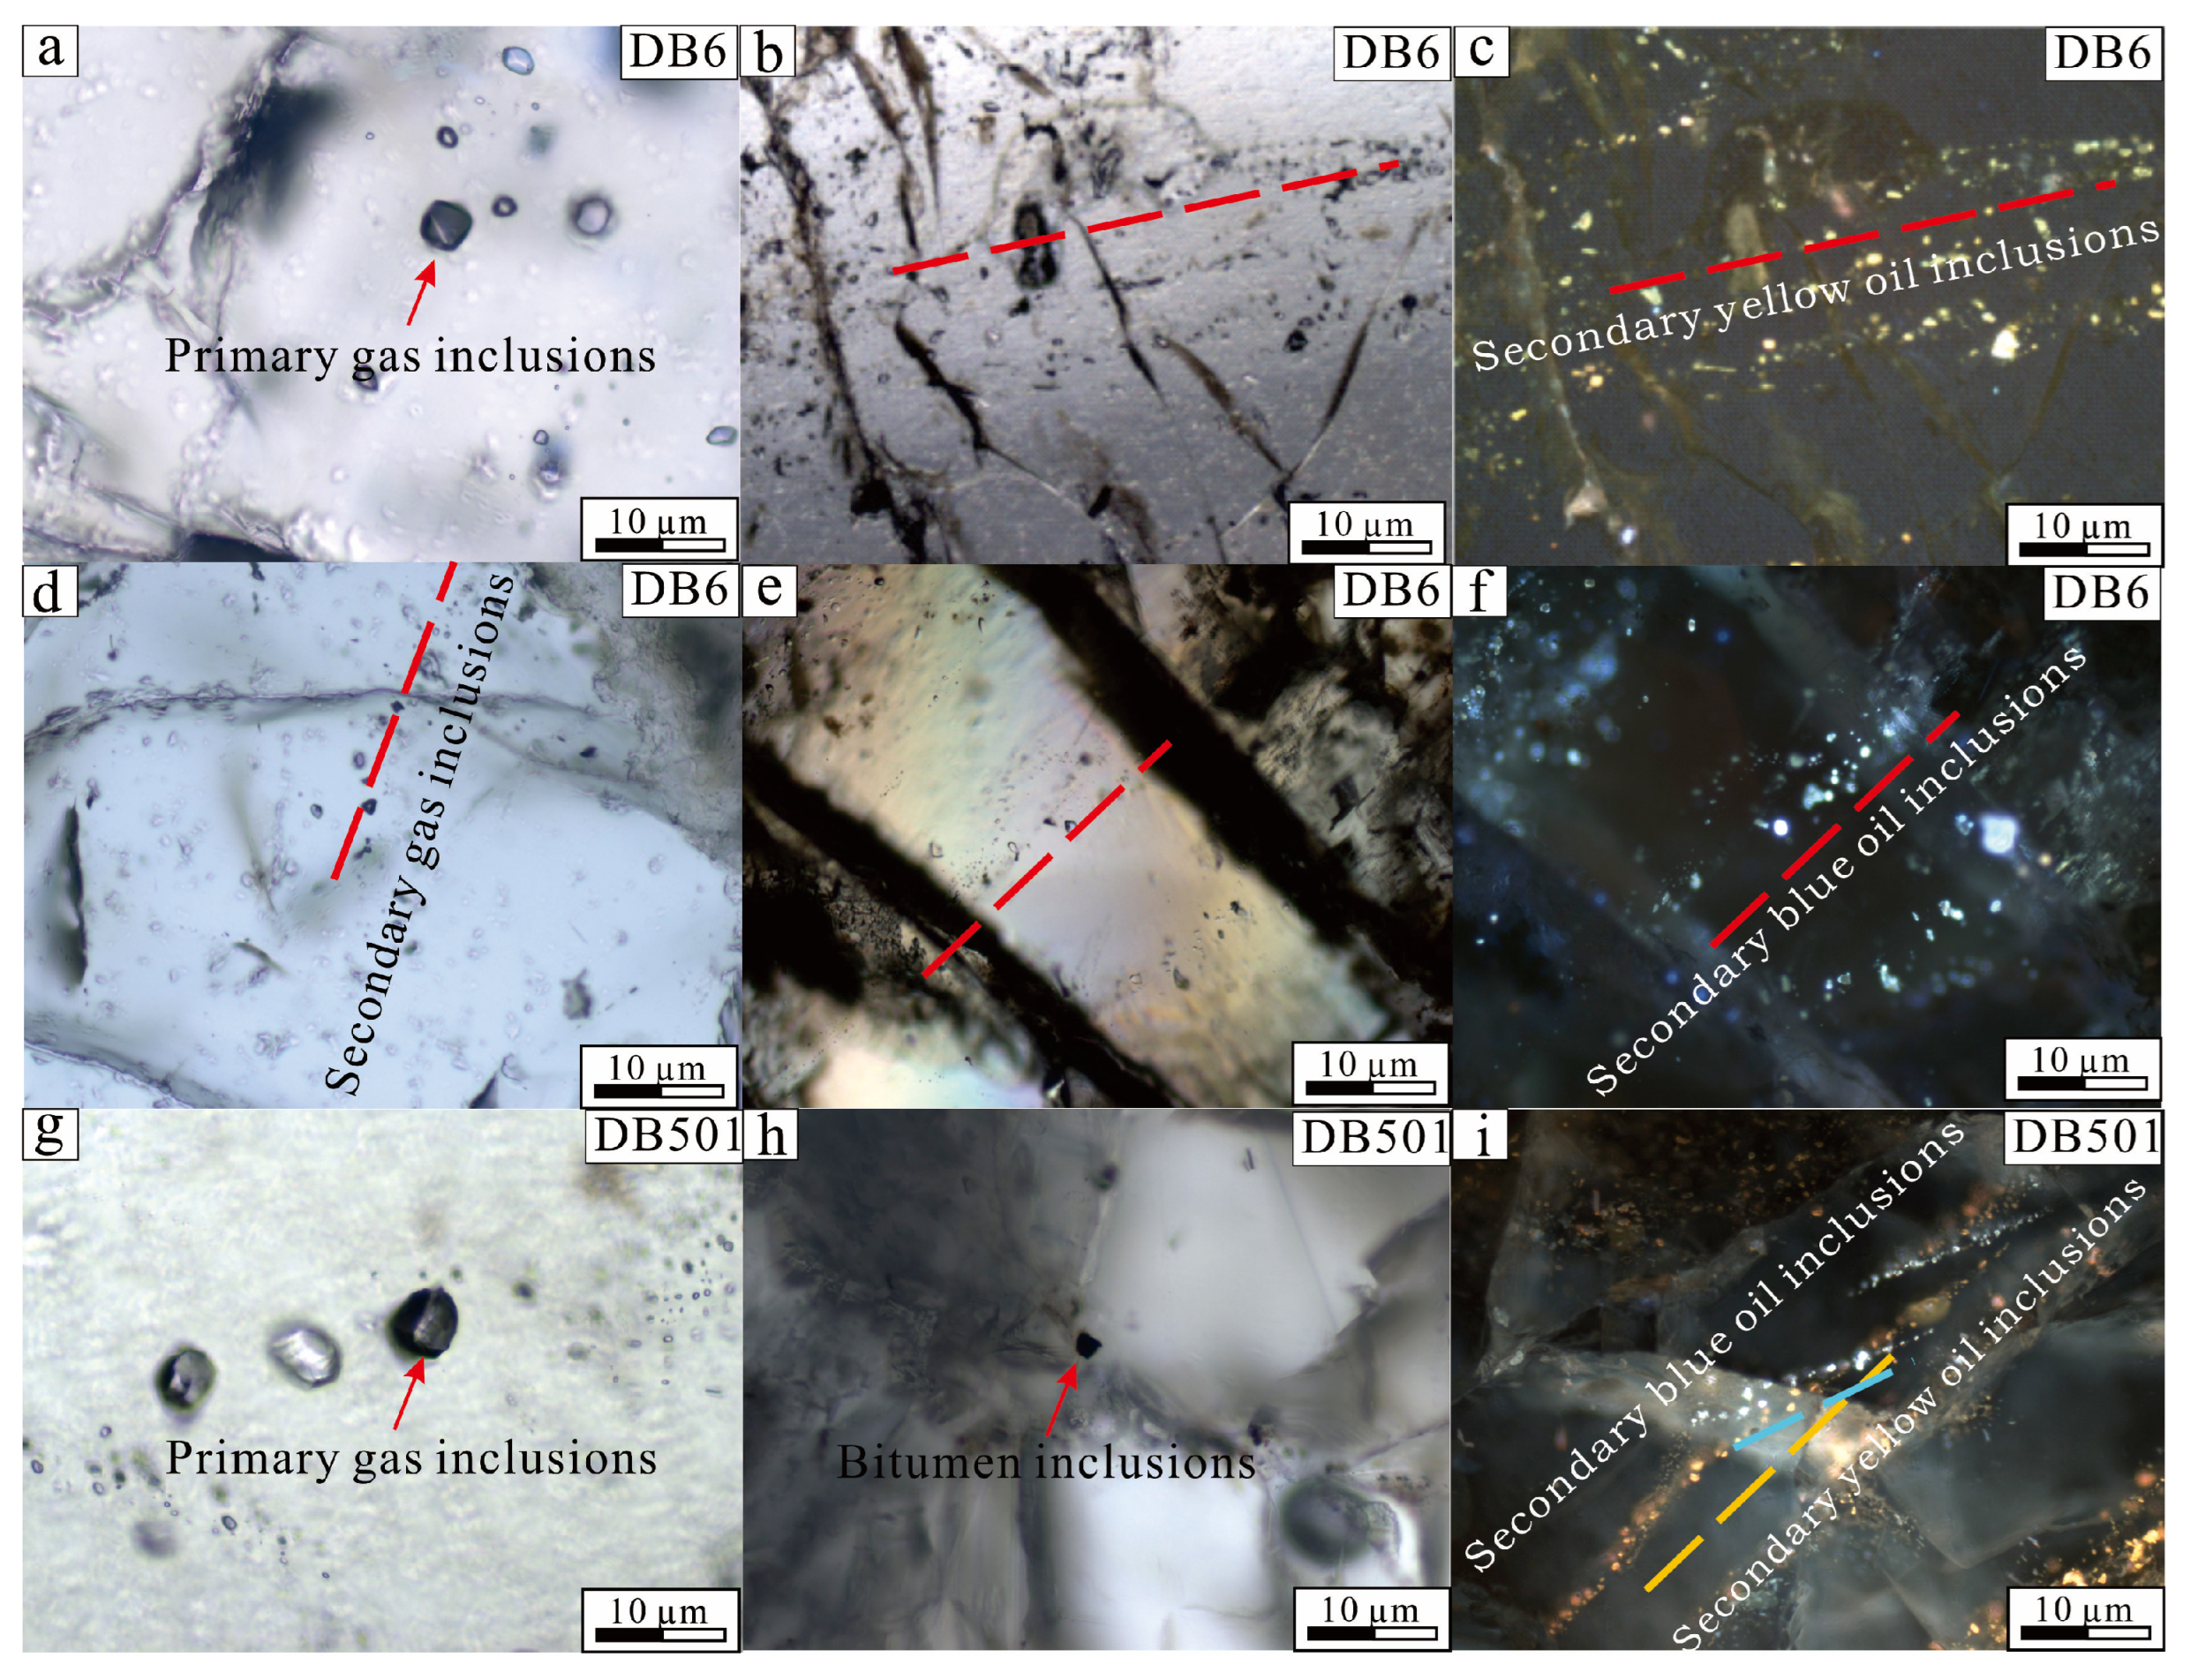
In the eastern Dibei area, a more complex inclusion assemblage was observed across both calcite and quartz veins from the Dibei-6 and Dibei-501 wells. Four main inclusion types were distinguished. Primary gas inclusions were identified within calcite veins, appearing as 10–15 μm elliptical cavities that are black to gray under transmitted light and exhibit regular shapes (Figure 6a,g). Secondary gas inclusions are notably smaller (3–6 μm), typically teardrop-shaped, and appear grayish under transmitted light (Figure 6d). Within these veins, a large number of secondary oil inclusions were also observed. The first generation of oil inclusions, identified by bright yellow fluorescence, occurs along healed microfractures within quartz and appears as well-defined, 8–10 μm inclusions with rounded or elongated morphologies (Figure 6b,c,i). A second generation of oil inclusions was identified by deep blue fluorescence, also measuring 8–10 μm and exhibiting similarly regular morphologies, but distinguished by their stratigraphic context and later formation timing (Figure 6e,f,i). Furthermore, primary bitumen inclusions were observed as isolated, black solid phases within calcite crystals (Figure 6h).

4.2.2. Fluorescence Characteristics

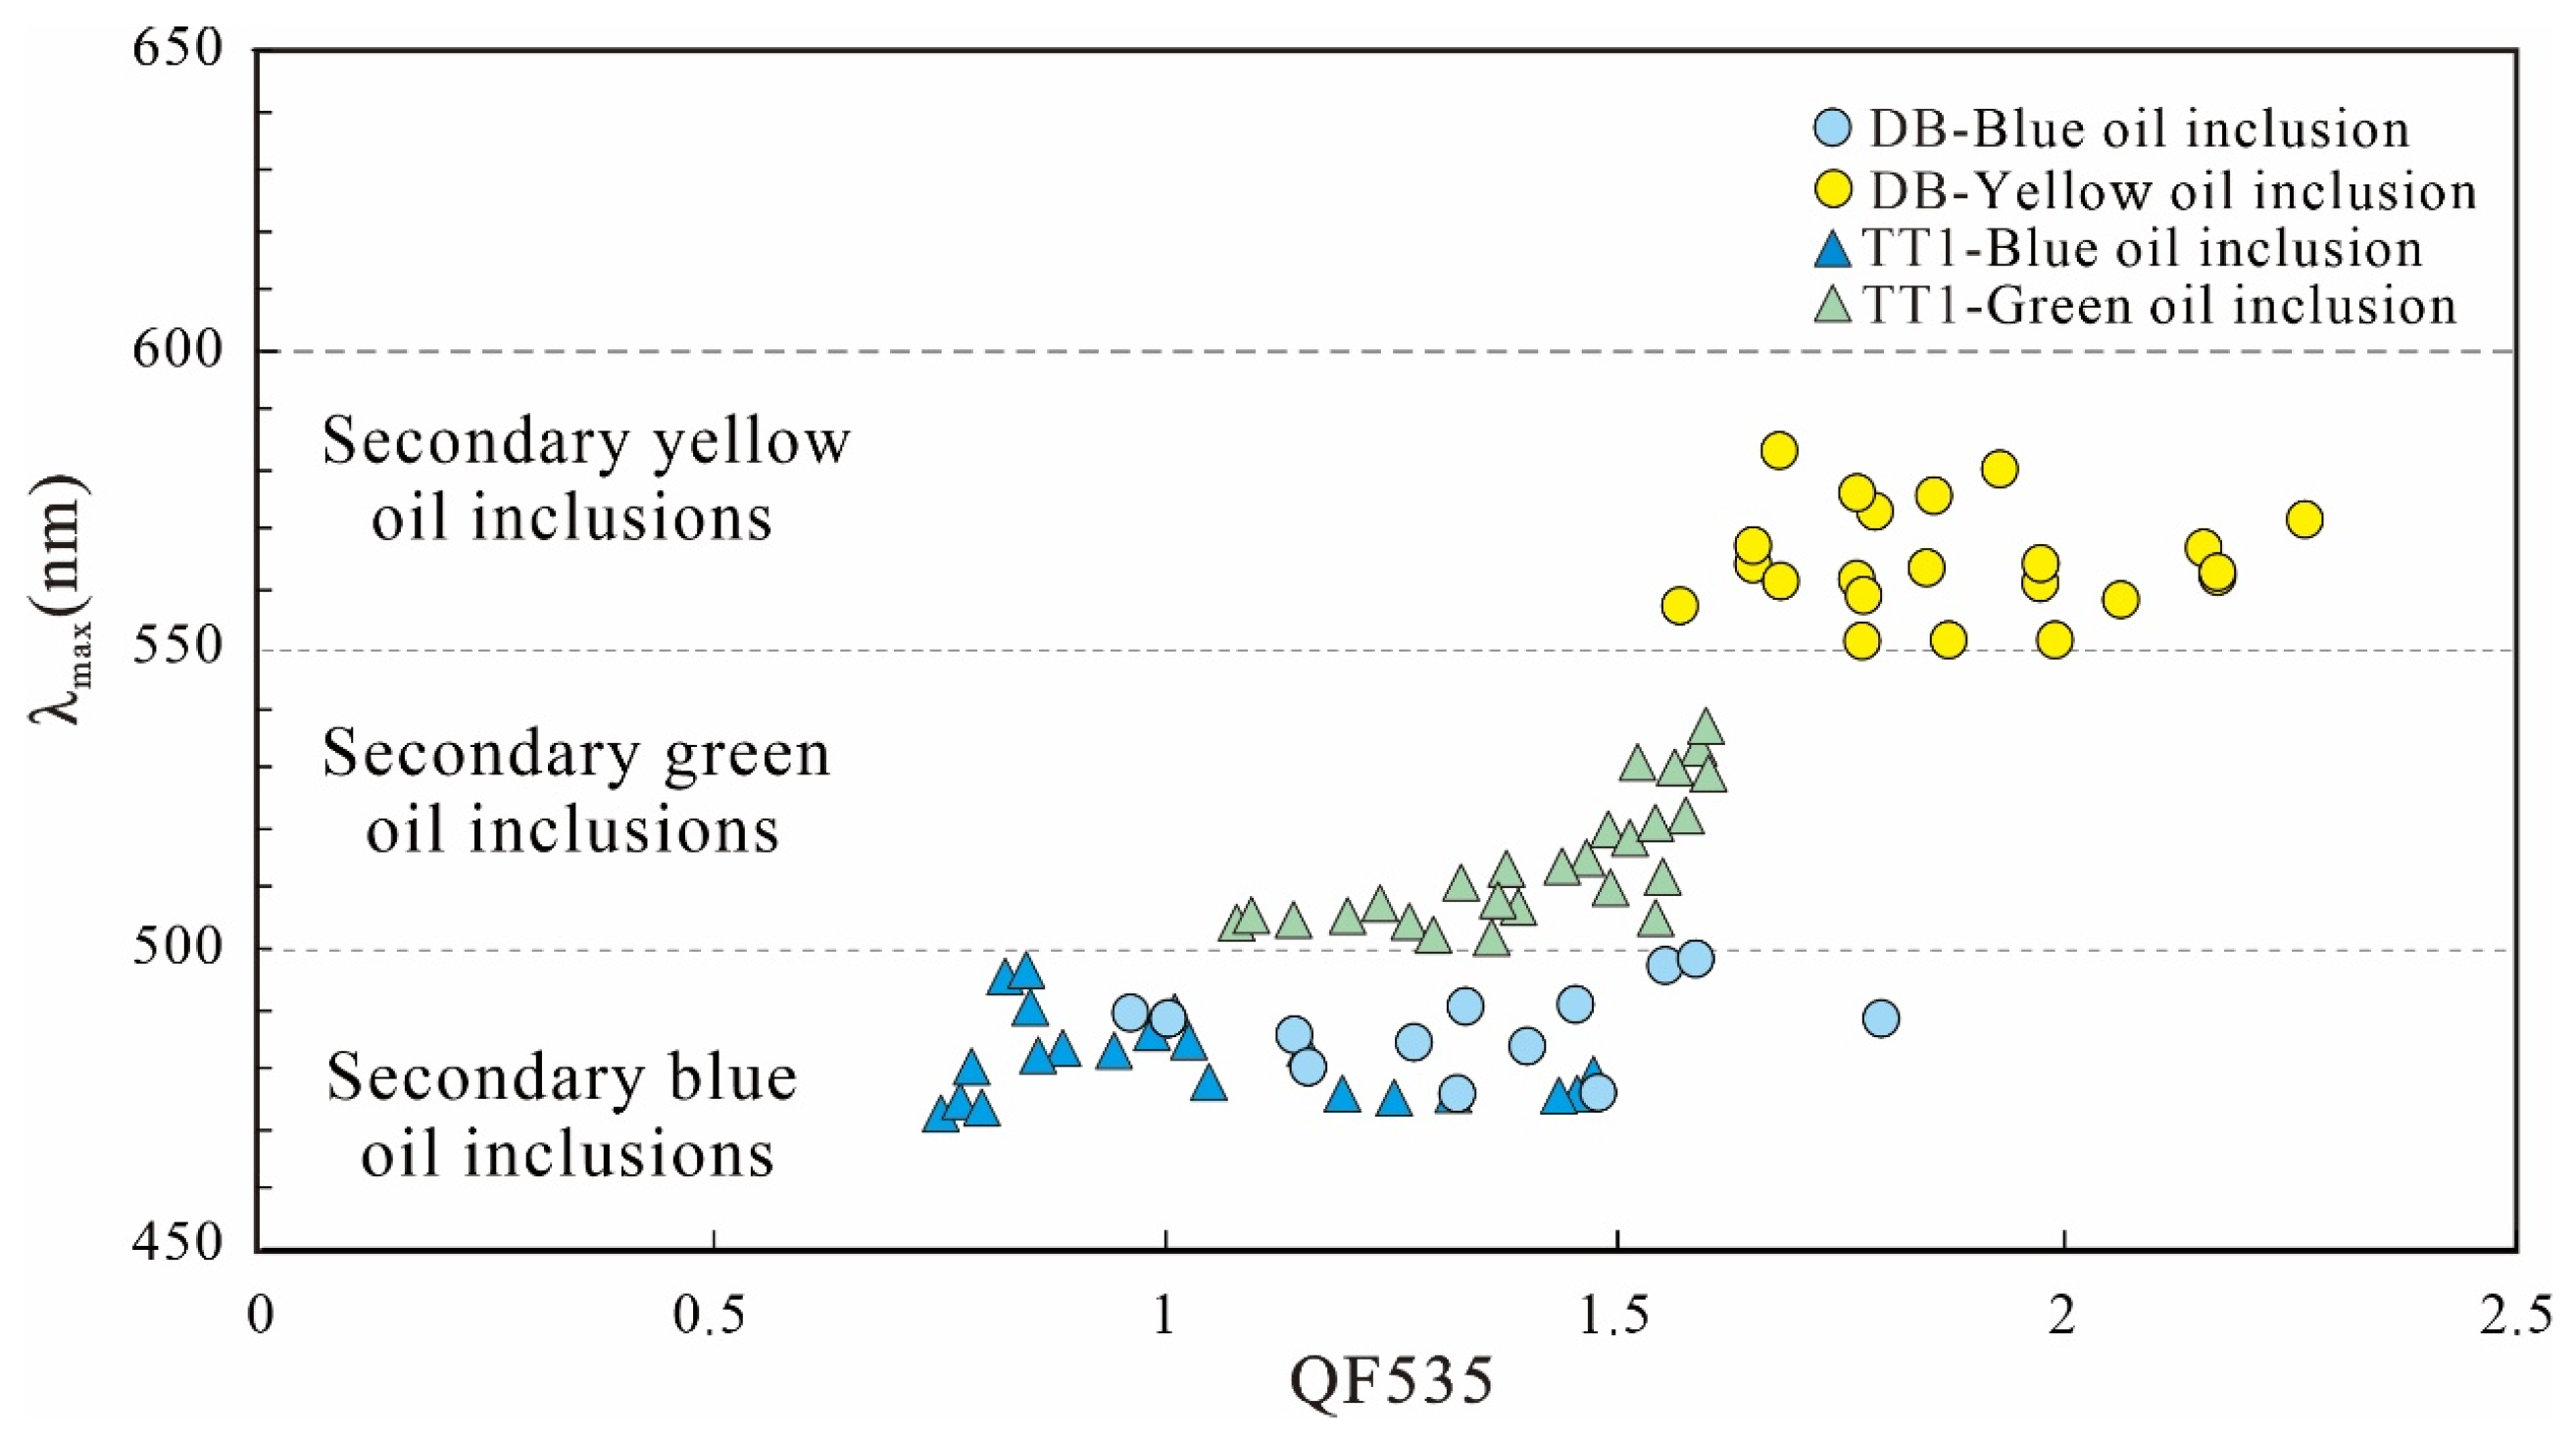
Fluorescence spectroscopy of oil inclusions further supports their classification into distinct generations (Figure 7). In the western region, oil inclusions exhibited either green or blue fluorescence (Figure 7). Green fluorescent oil inclusions showed peak emission wavelengths (λmax) between 500 and 540 nm, with QF535 values ranging from 1.21 to 1.68. Blue fluorescent inclusions had λmax values between 464 and 495 nm and QF535 values between 0.73 and 1.48.
In the eastern region, two types of oil inclusions were also identified based on their fluorescence behavior (Figure 7). Yellow fluorescent inclusions had peak emission wavelengths between 550 and 600 nm and QF535 values ranging from 1.52 to 2.24. Blue fluorescent inclusions in this region had slightly shorter λmax values, ranging from 464 to 490 nm, with corresponding QF535 values between 0.81 and 1.82.

4.2.3. Raman Spectroscopy of Gas Inclusions

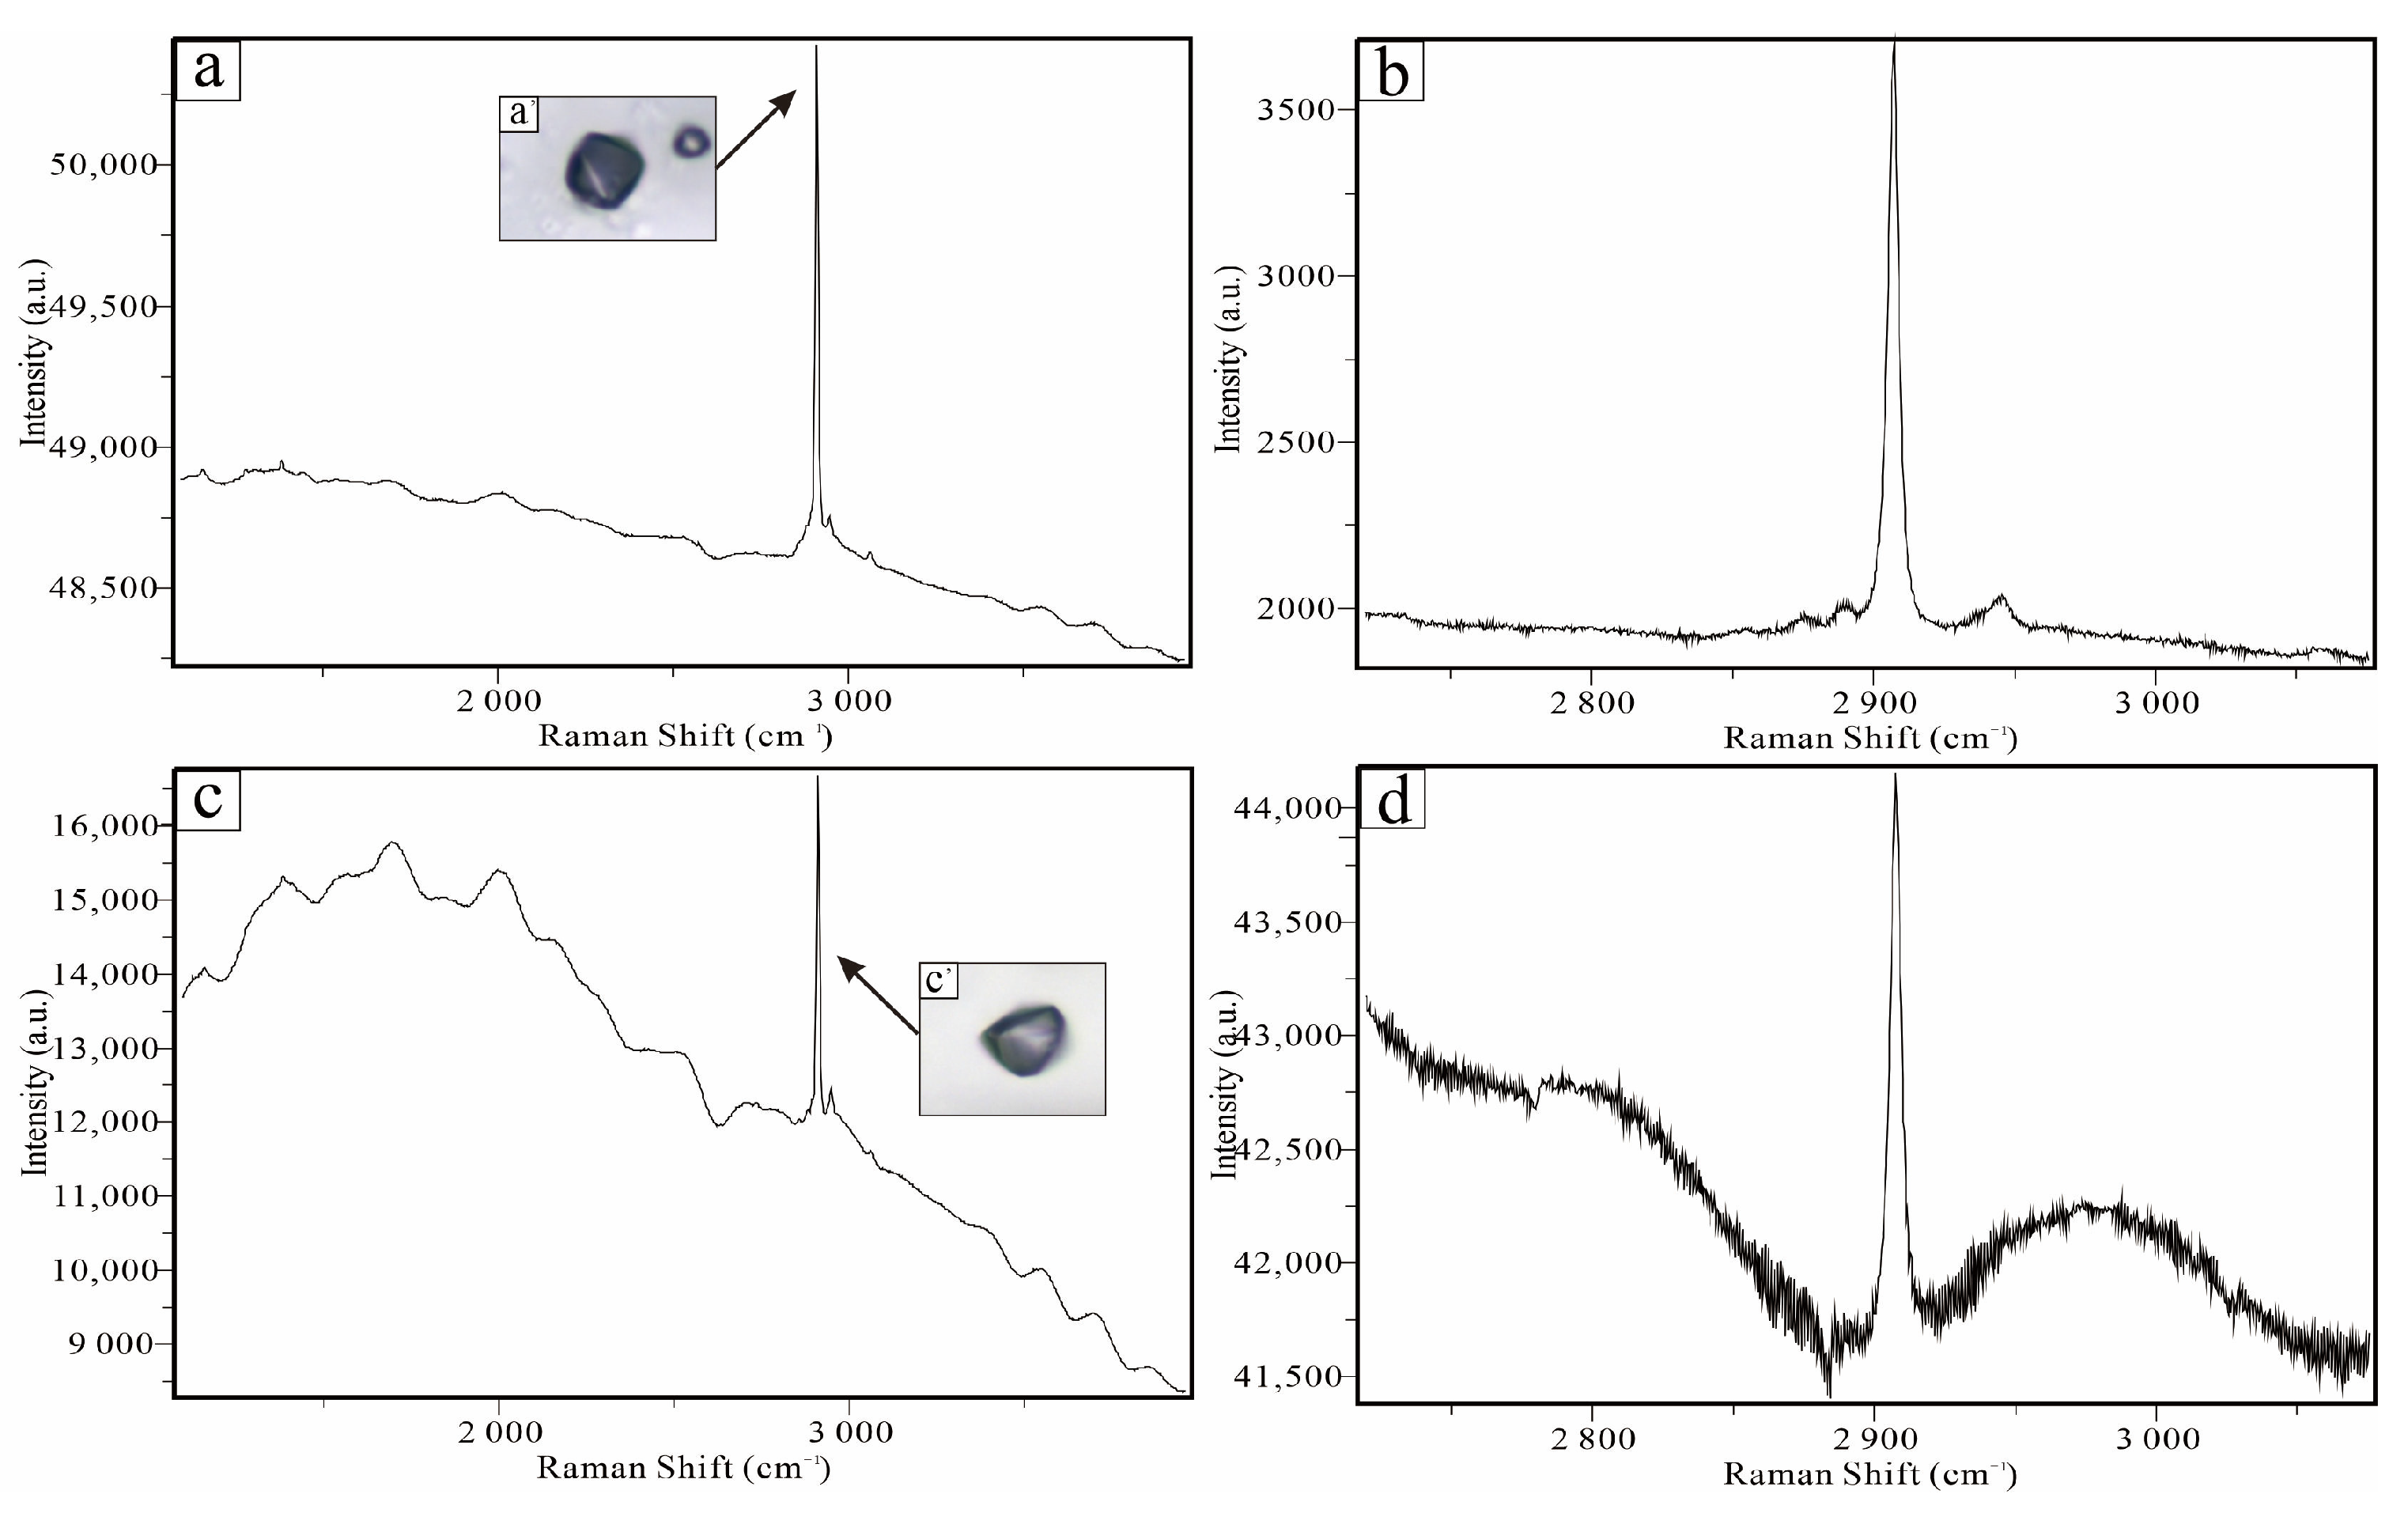
Laser Raman spectroscopy conducted on gas-rich and pure gas inclusions from the eastern Dibei area confirmed that methane is the dominant gaseous component. Spectral analyses of inclusions from the Dibei-501 Well revealed characteristic methane Raman scattering peaks at approximately 2907.52 to 2908.77 cm−1 using an 1800 lines/mm grating (Figure 8a–d), these peaks correspond to the symmetric stretching vibration of methane, indicating that CH4 is the dominant gaseous component within the analyzed inclusions (Figure 8c).

4.2.4. Microthermometry

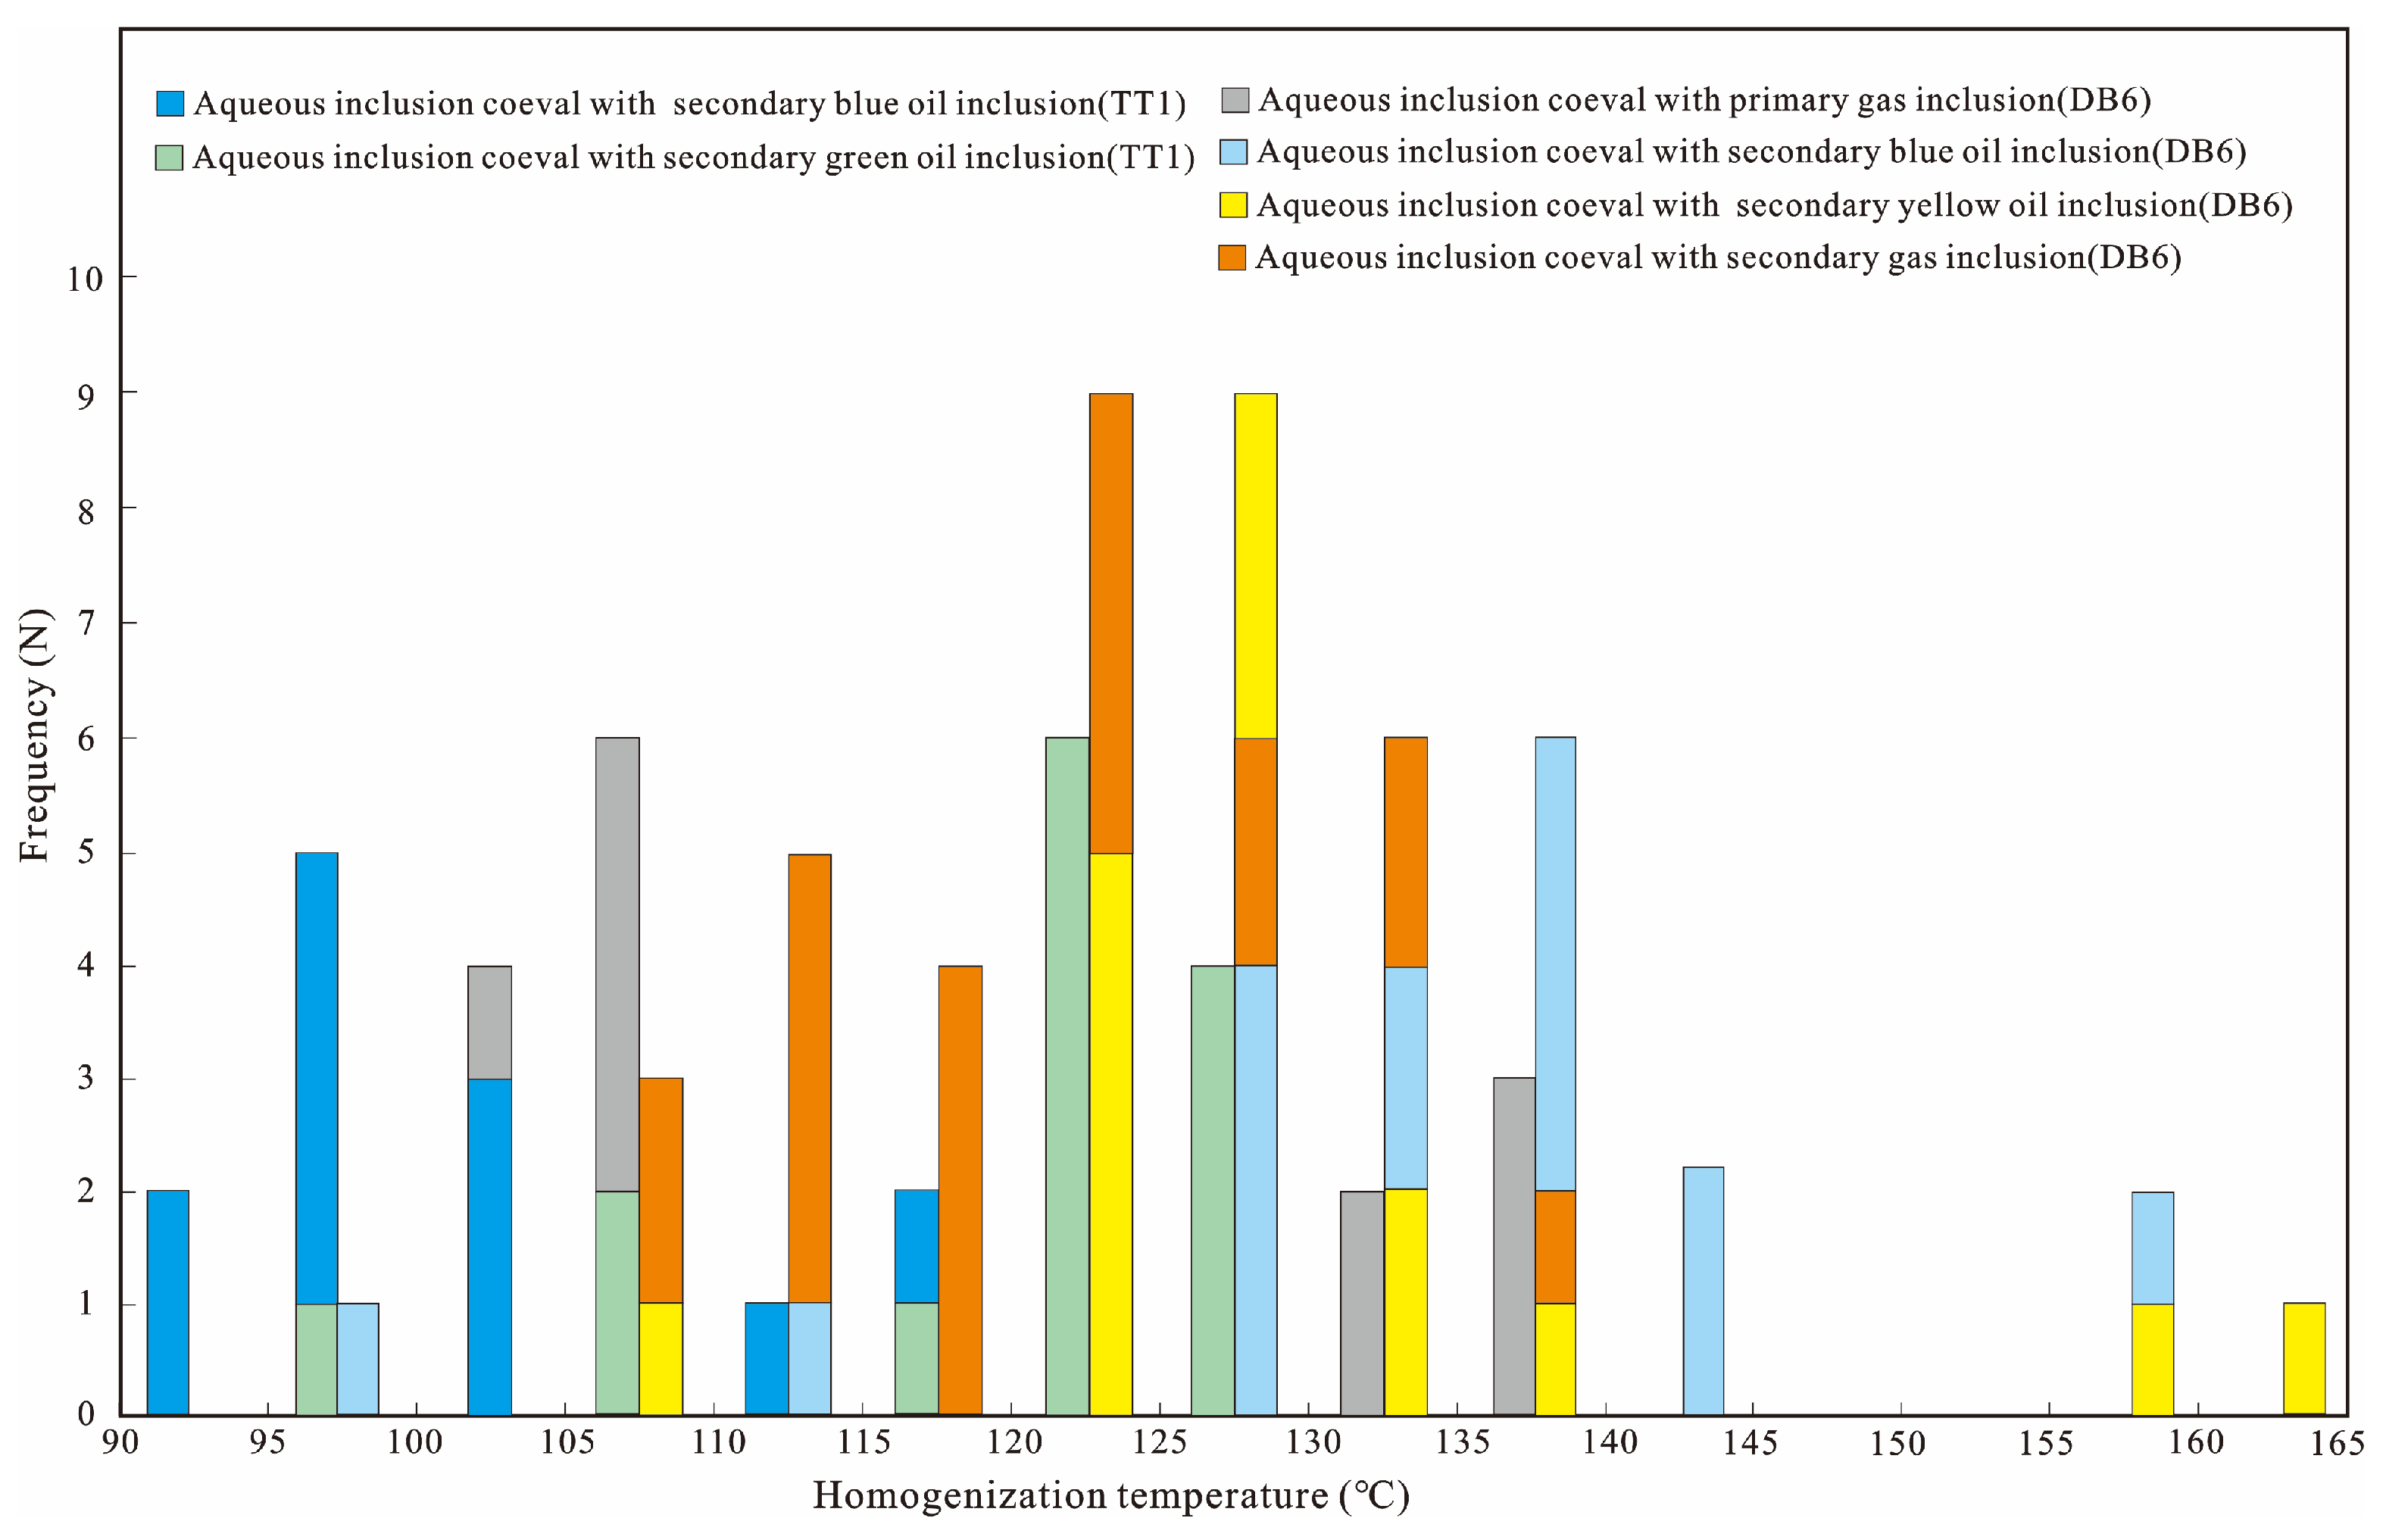
Microthermometric measurements were performed on aqueous inclusions associated with oil and gas inclusions to constrain trapping temperatures (Figure 9). In the Tuotan-1 Well, homogenization temperatures (Th) of aqueous inclusions associated with blue fluorescent oil inclusions in first-generation calcite range from 90 to 120 °C, with a modal value of approximately 98.2 °C. Inclusions associated with green fluorescent oil in second-generation calcite show Th values between 95 and 130 °C, peaking at approximately 122.6 °C.
In the eastern Dibei area, homogenization temperatures are generally higher and more variable (Figure 9). Aqueous inclusions associated with yellow fluorescent oil inclusions exhibited Th values between 105 and 165 °C, with an average value of approximately 128.4 °C. Those associated with blue fluorescent oil inclusions ranged from 95 to 160 °C, with an average value of around 132.5 °C. Aqueous inclusions associated with primary gas inclusions yield Th values between 100 and 140 °C, with an average value of 116.8 °C. Meanwhile, aqueous inclusions associated with secondary gas inclusions exhibit Th values between 105 and 140 °C, with an average value of 122.1 °C.
In summary, the results show clear differences in petrography, cathodoluminescence characteristics, and fluid inclusion features among the analyzed fracture-filling calcites. Based on these observations, the calcites can be grouped into [two phases/types], namely [Cal-1 and Cal-2], although the distinction is locally gradual. The fluid inclusions also show [distinct occurrence/phase/fluorescence/microthermometric] characteristics. Taken together, these data provide the observational basis for the subsequent interpretation.

5. Discussion

5.1. Timing and Phases of Hydrocarbon Charging

Based on the integrated evidence from vein petrography, fluid inclusion petrography, fluorescence spectral parameters, Raman spectroscopy, homogenization temperatures, and calibrated one-dimensional burial–thermal history modeling, multiple episodes of hydrocarbon charging can be distinguished in the Kuqa Depression, with clear spatial differences between the western and eastern regions. The burial–thermal models are used here to constrain the timing of inclusion trapping and charging events, whereas the geological scenario discussed below is based on the combined interpretation of all of these datasets rather than on modeling alone.
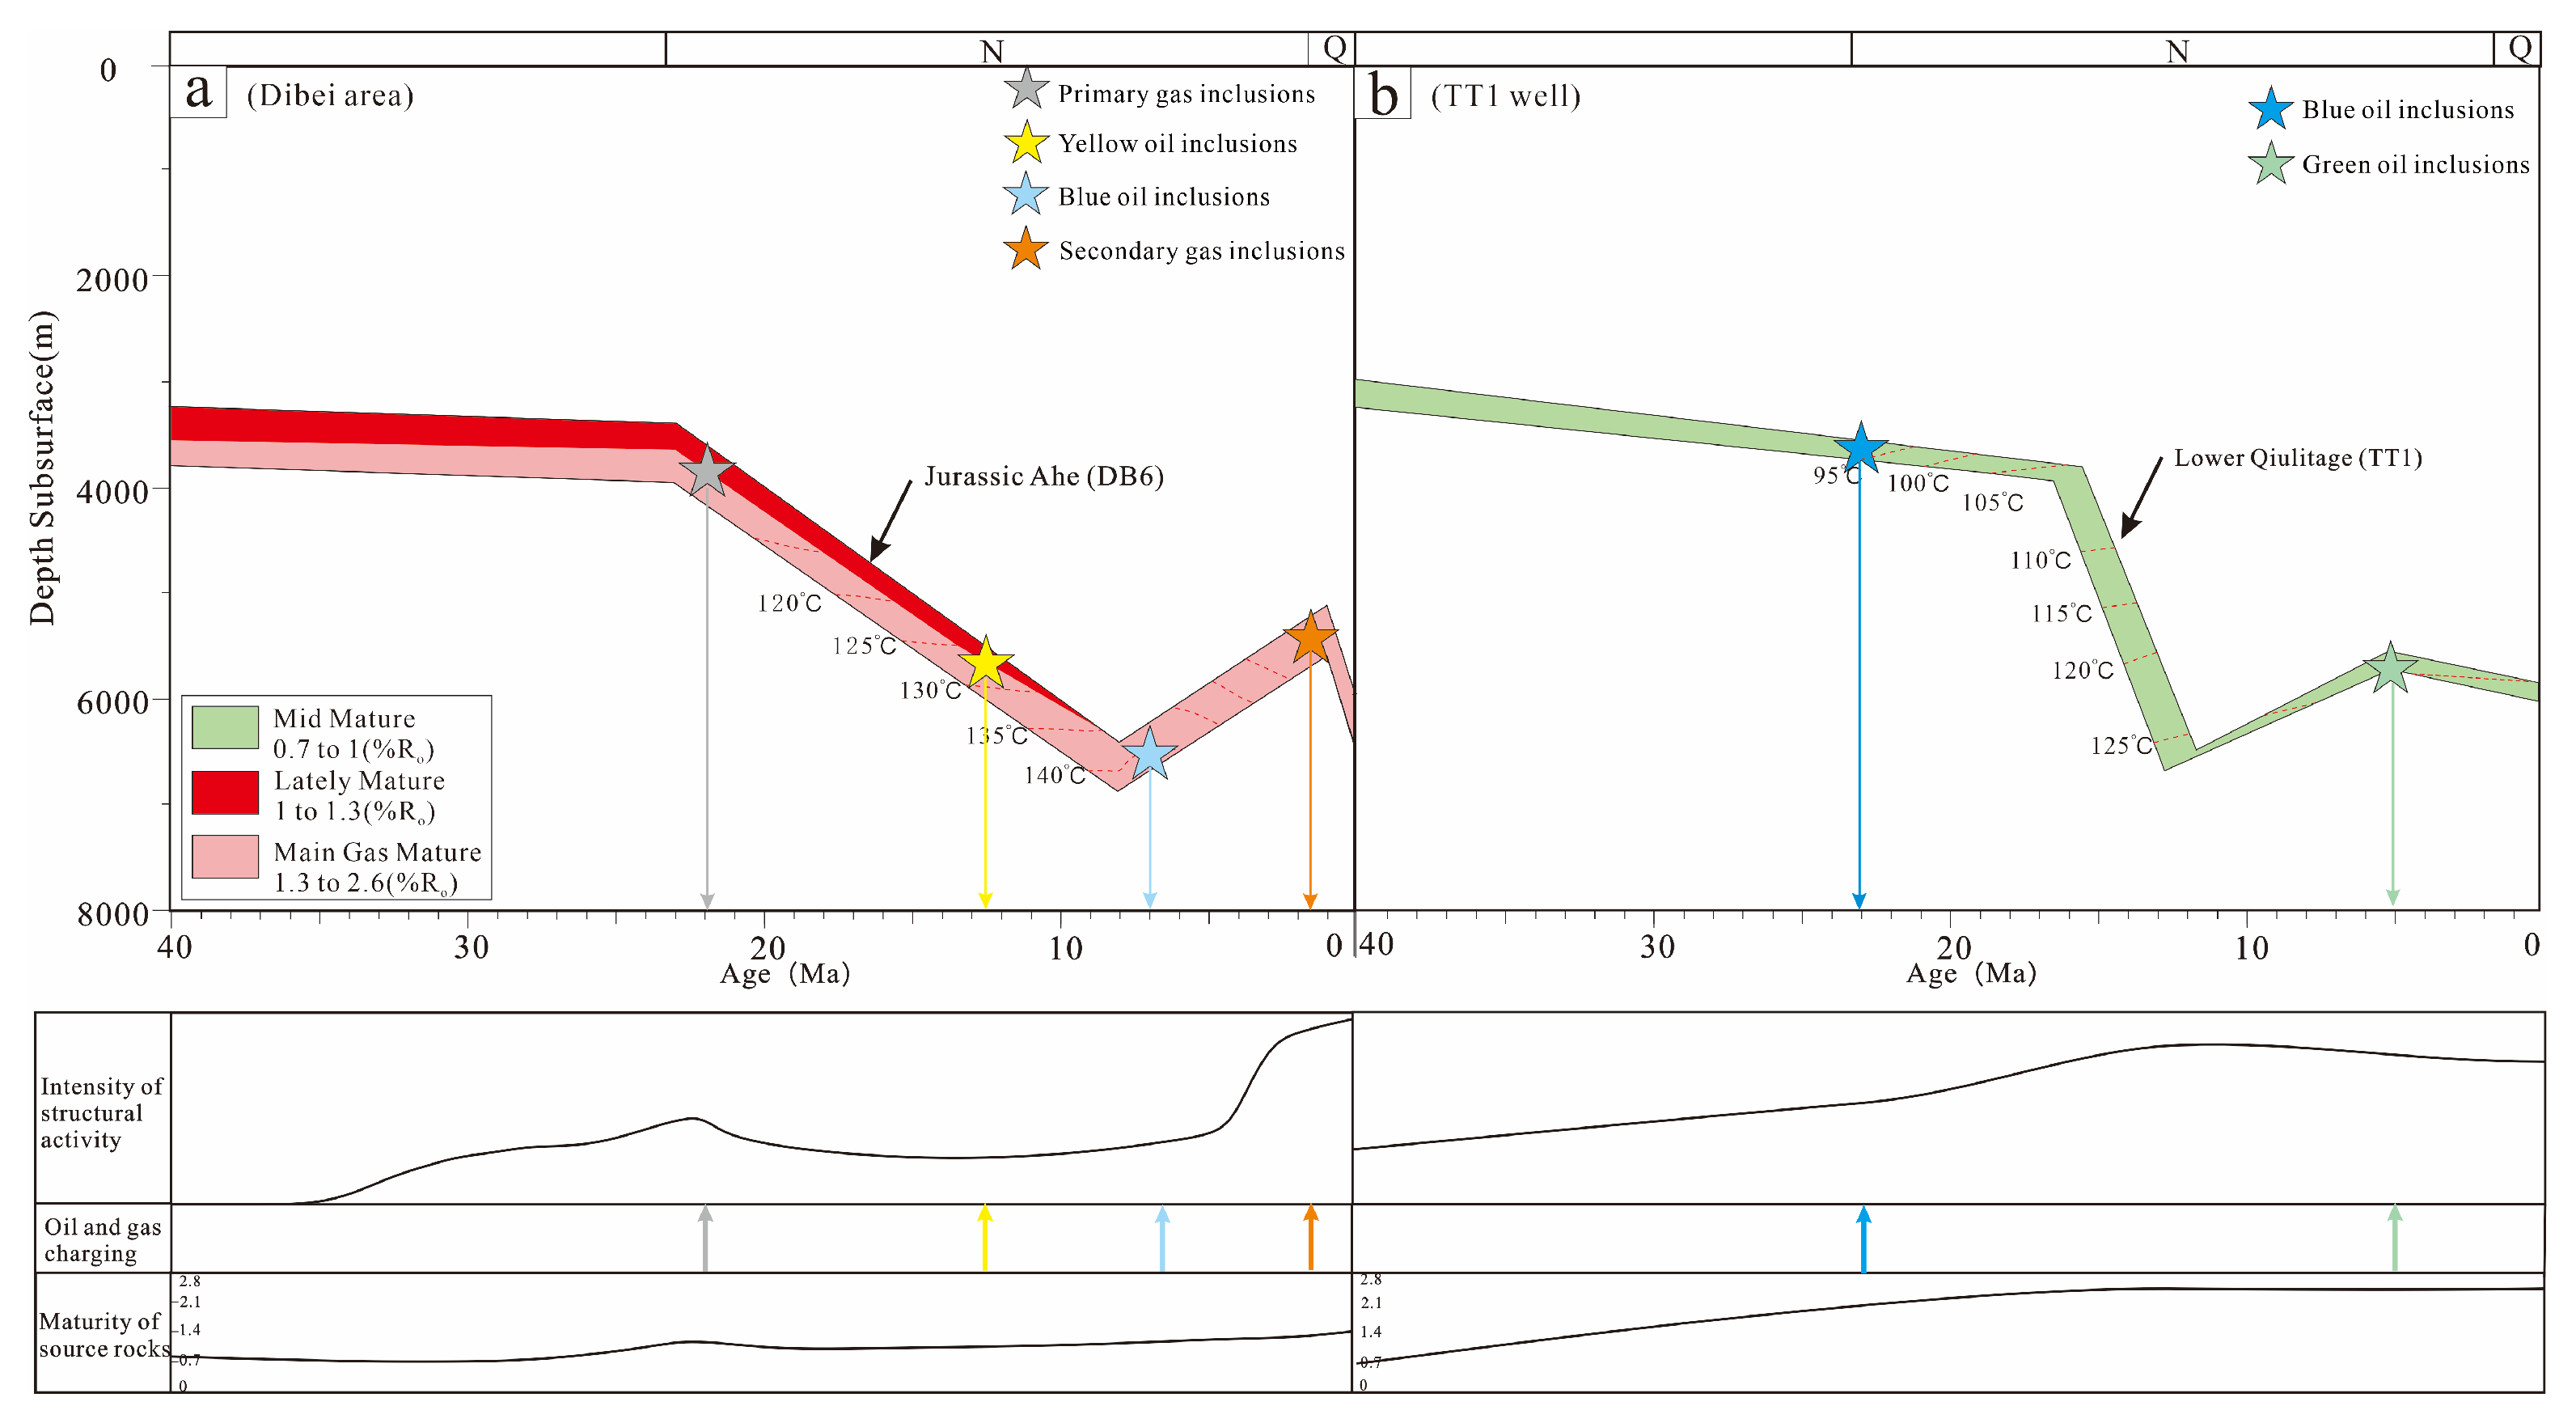
In the eastern Dibei area, four distinct hydrocarbon charging events are recognized. The earliest event is recorded by primary gas inclusions hosted in calcite veins and is constrained to the deposition of the Neogene Jidike Formation (22–20 Ma). This interpretation is supported by the homogenization temperatures of associated aqueous inclusions and their consistency with modeled burial temperatures at that time. Two subsequent oil charging events are indicated by yellow and blue fluorescent oil inclusions, respectively. These two stages occurred during the Kangcun Formation, at approximately 12–10 Ma and 9–7 Ma, reflecting progressive maturation of source rocks. The final charging phase is represented by secondary gas inclusions which are interpreted to record gas migration and accumulation during the Kuqa Formation deposition period (3–2 Ma), coinciding with peak gas generation (Figure 10a).
In contrast, the western Tuotan-1 Well records only two distinct oil charging events. Blue fluorescent oil inclusions indicate an early oil charge during the Jidike Formation sedimentation (23–20 Ma). A later oil charge, represented by green fluorescent inclusions, is constrained to the Kuqa Formation period (5–3 Ma) (Figure 10b). No evidence for multi-stage gas charging comparable to that in the eastern region is observed in the western Kuqa Depression.

5.2. Hydrocarbon Accumulation Processes in the Western Kuqa Depression

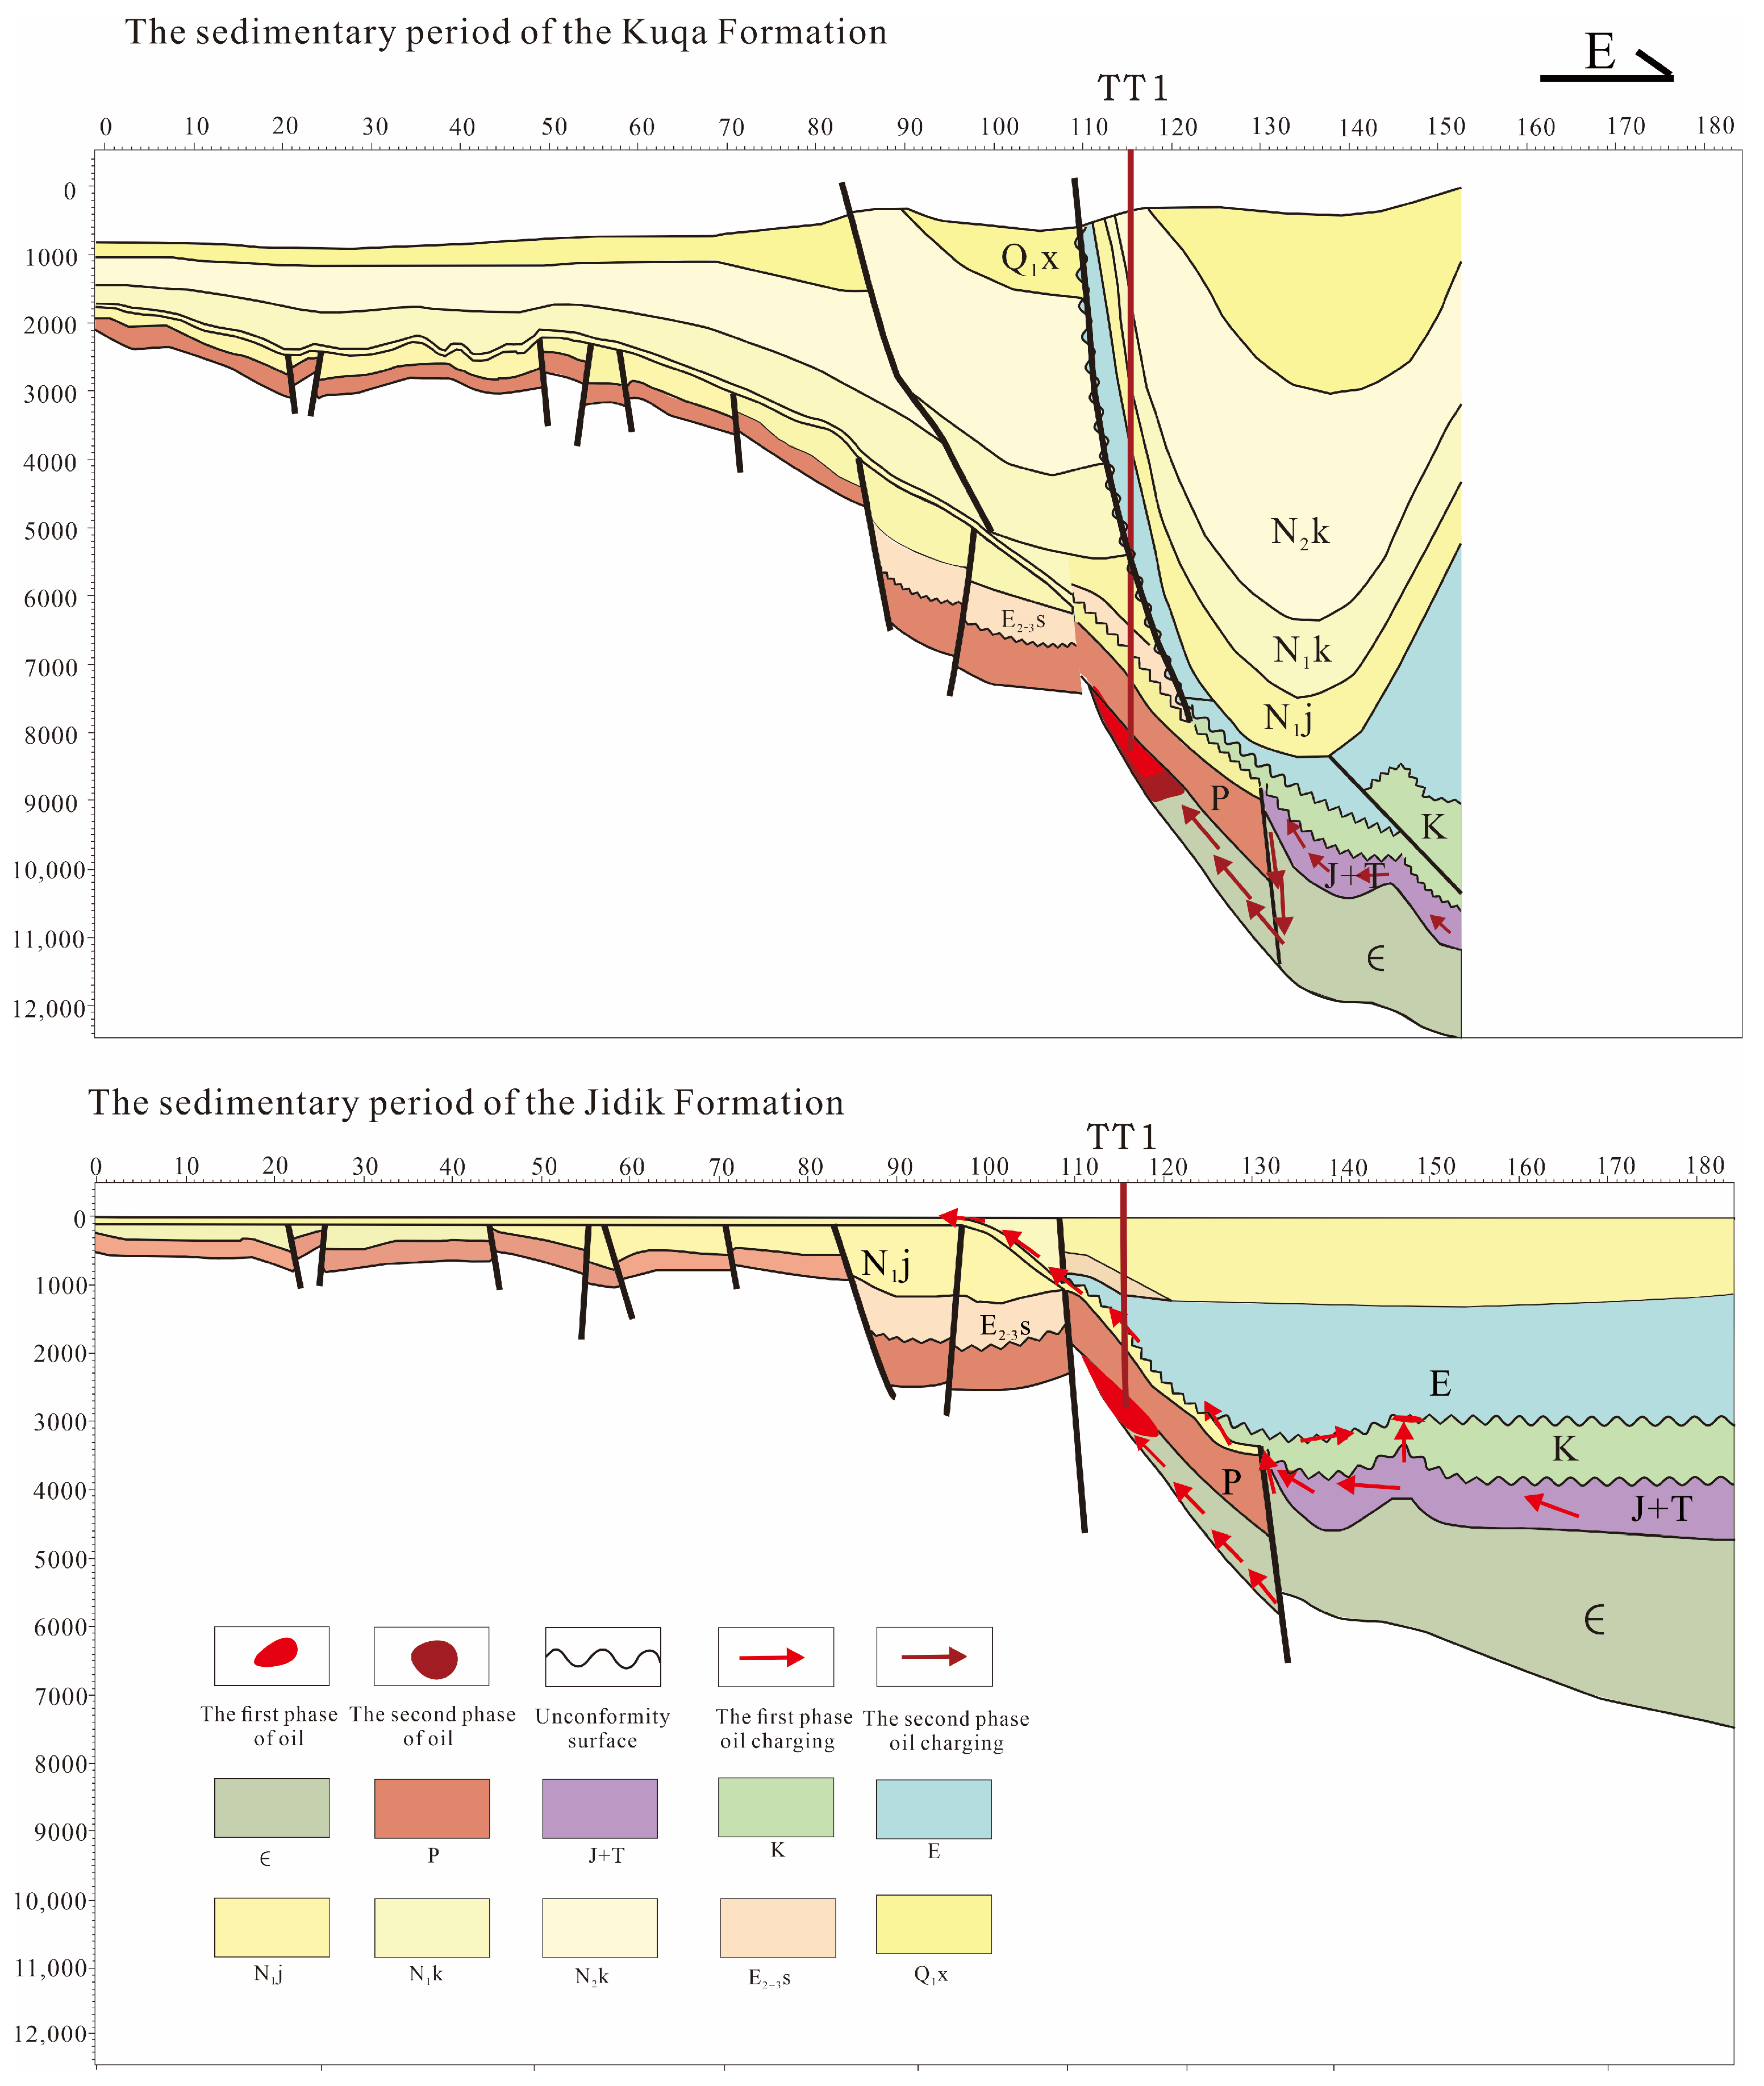
The hydrocarbon accumulation process in the western Kuqa Depression is characterized by relatively simple migration pathways and accumulation mechanisms. This simplicity primarily reflects gentle tectonic deformation, normal pressure conditions, and favorable reservoir properties [11,28]. Hydrocarbon migration pathways were reconstructed based on fault geometry, unconformity surfaces, and fluid inclusion data, and are dominated by lateral flow along unconformities [29]. Hydrocarbons generated from Jurassic and Triassic source rocks migrated predominantly upward along source-connected faults and subsequently moved laterally along regional unconformity surfaces, particularly at the base of the Cretaceous and Paleogene strata. These unconformities acted as effective carrier beds due to enhanced permeability contrasts. Hydrocarbons were then trapped within structural highs and lithological pinch-outs of the Upper Cambrian Lower Qiulitage Formation reservoirs [30]. The accumulation events were closely associated with syn-sedimentary tectonics during the Jidike and Kuqa Formation periods [31] (Figure 11). Hydrocarbon accumulation in the western region was closely associated with syn-tectonic adjustments during the Jidike and Kuqa Formation periods. However, the lack of strong overpressure and limited late-stage fault reactivation restricted large-scale vertical migration and multi-phase recharging.

5.3. Hydrocarbon Accumulation Processes in the Eastern Kuqa Depression

In contrast to the western region, hydrocarbon accumulation in the eastern Kuqa Depression exhibits a complex, multi-stage evolution strongly influenced by intense tectonic deformation and overpressure development [32].
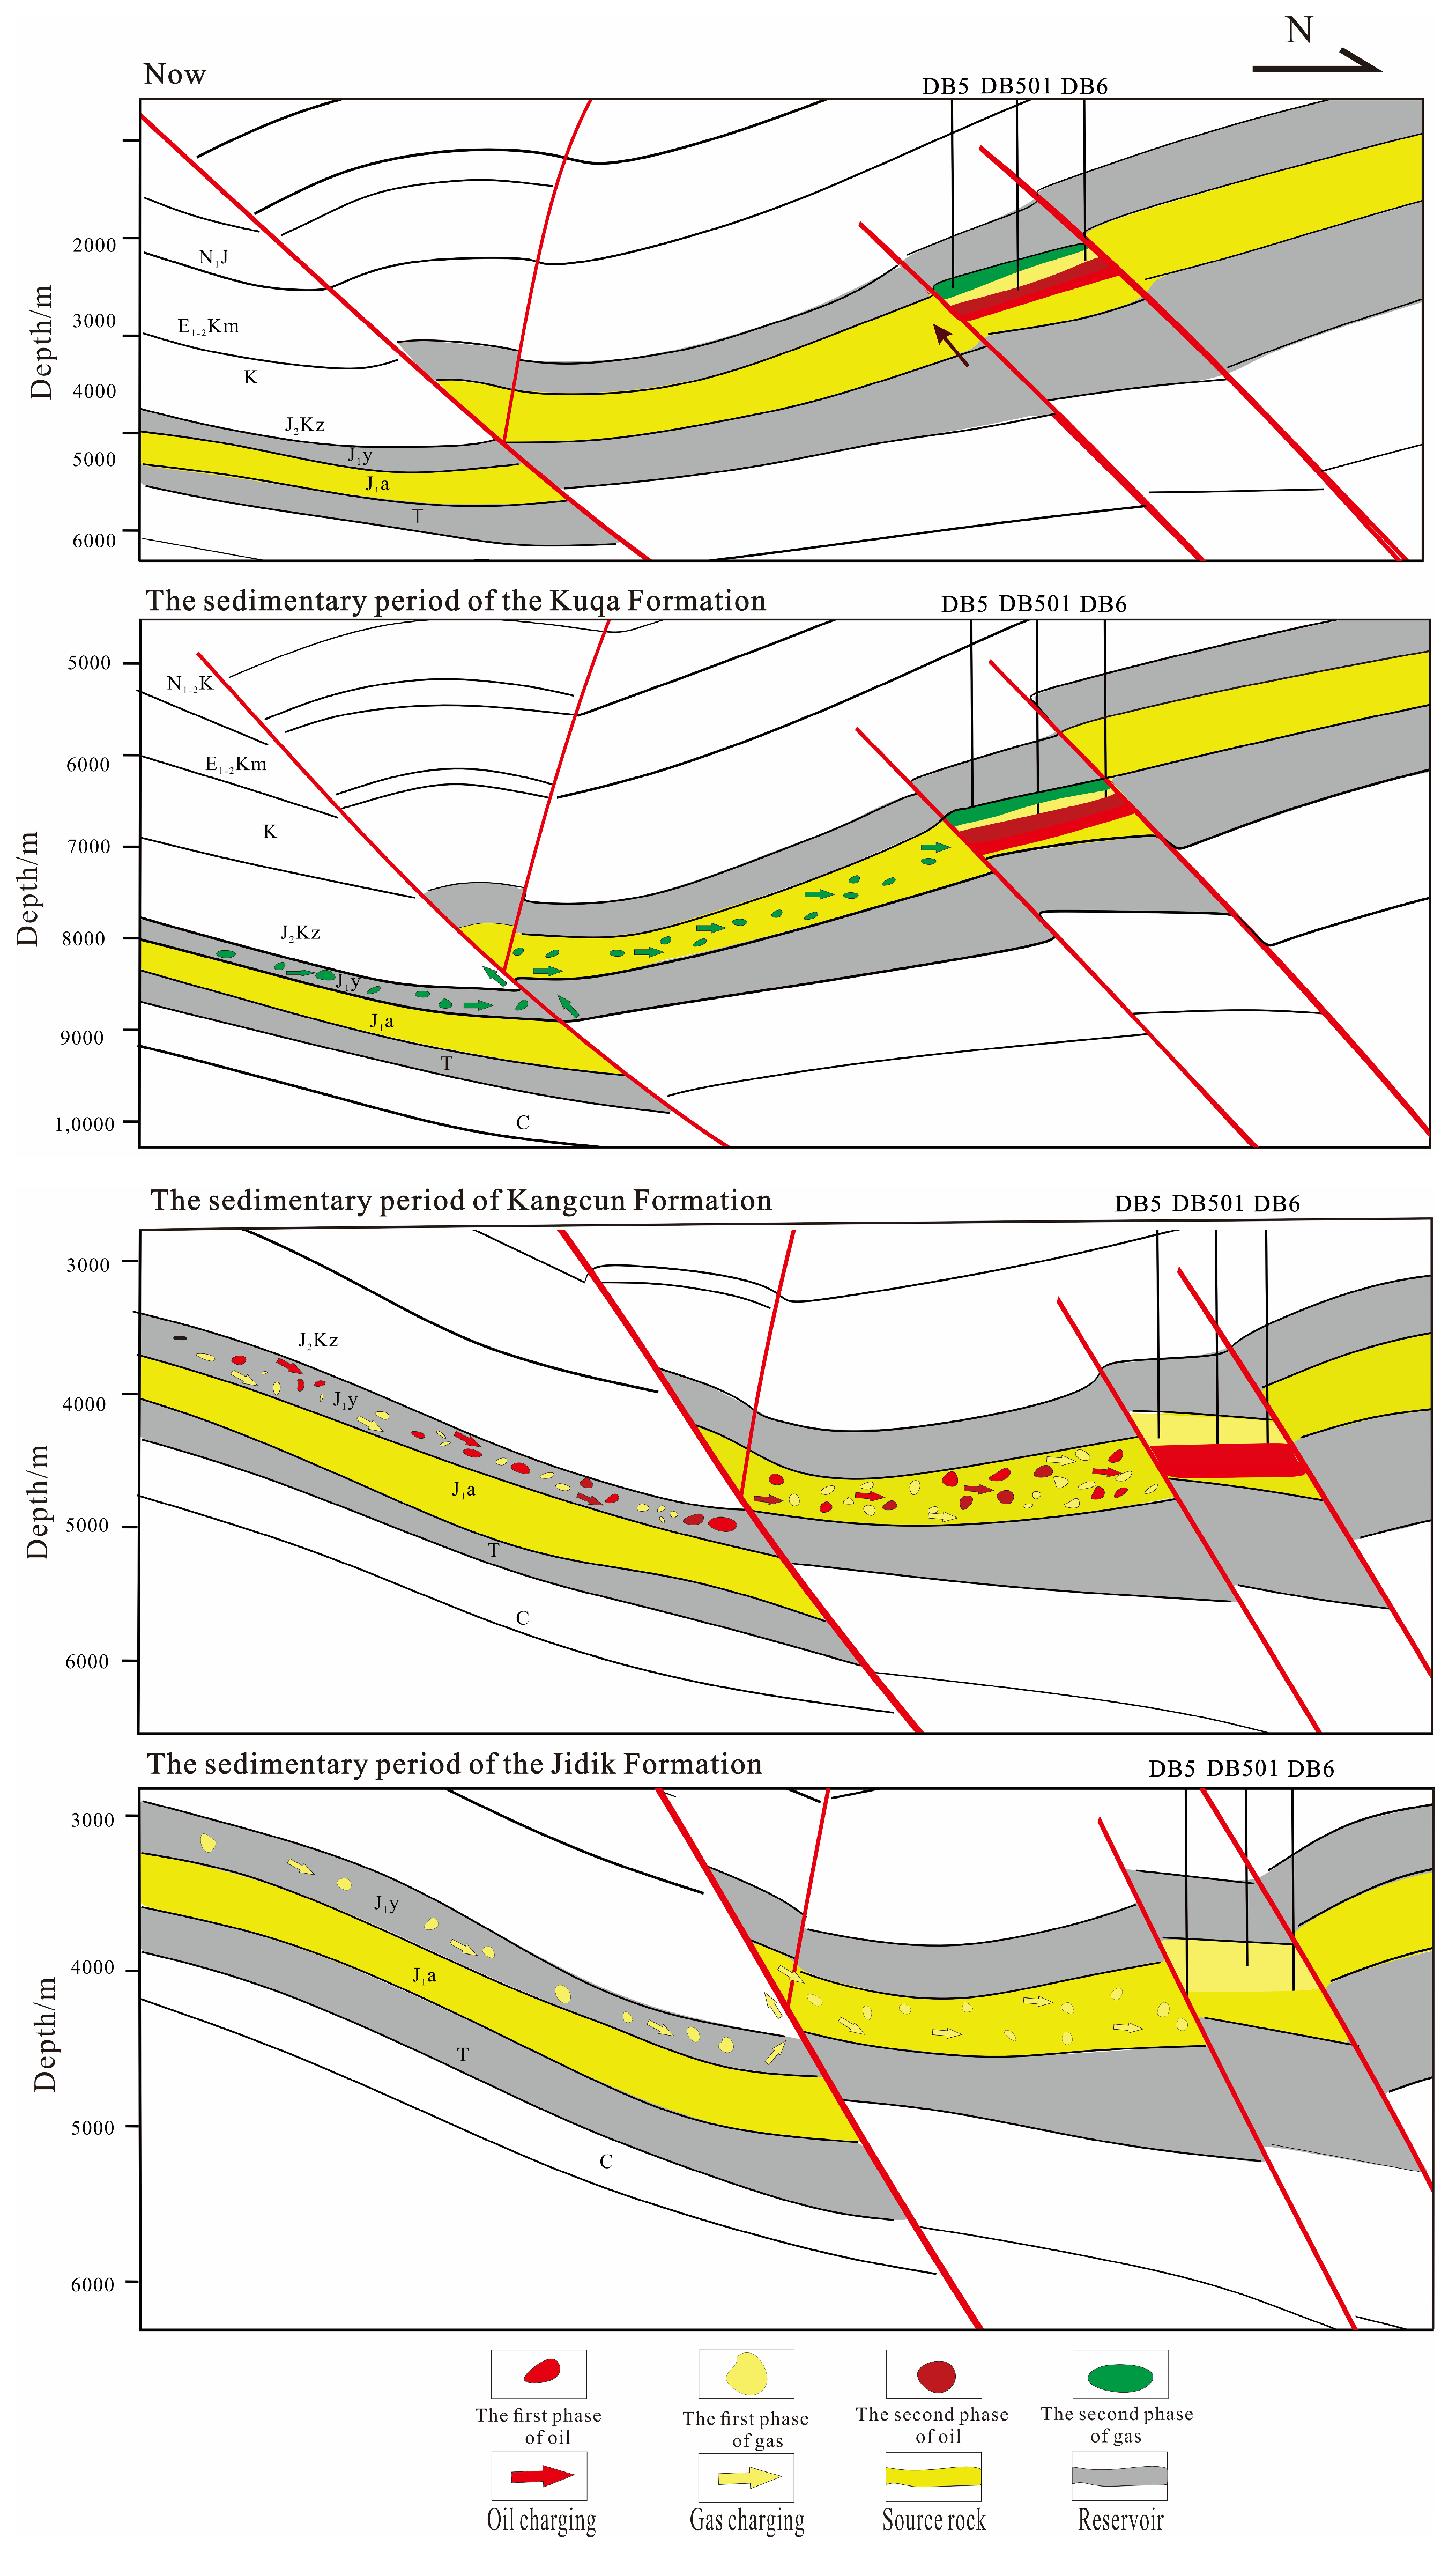
The earliest gas generation event occurred during the Jidike Formation deposition, originating mainly from the Jurassic Yangxia source rocks [33]. Gas migrated laterally along fault zones and then vertically into the Jurassic Ahe Formation reservoirs. Subsequent oil charging during the Kangcun Formation period is recorded by yellow and blue fluorescent oil inclusions, reflecting rapid maturation of both Triassic and Jurassic source rocks [34]. Petrographic observations and burial history modeling indicate that by approximately 8 Ma, the Ahe Formation reservoirs experienced significant mechanical compaction and diagenetic cementation. This process significantly reduced primary porosity and permeability, transforming the reservoirs into tight sandstones. As a result, later-stage hydrocarbons were preferentially preserved as tight gas accumulations.
The final gas accumulation phase occurred during the Kuqa Formation deposition (3–2 Ma), when both the Jurassic and Triassic source rocks reached peak gas generation. Under continued tectonic compression and elevated pore fluid pressures, hydrocarbons migrated upward along pre-existing fault systems and accumulated within the already densified Ahe Formation reservoirs (Figure 12).

5.4. Evolution of Paleopressure in the Eastern Kuqa Depression

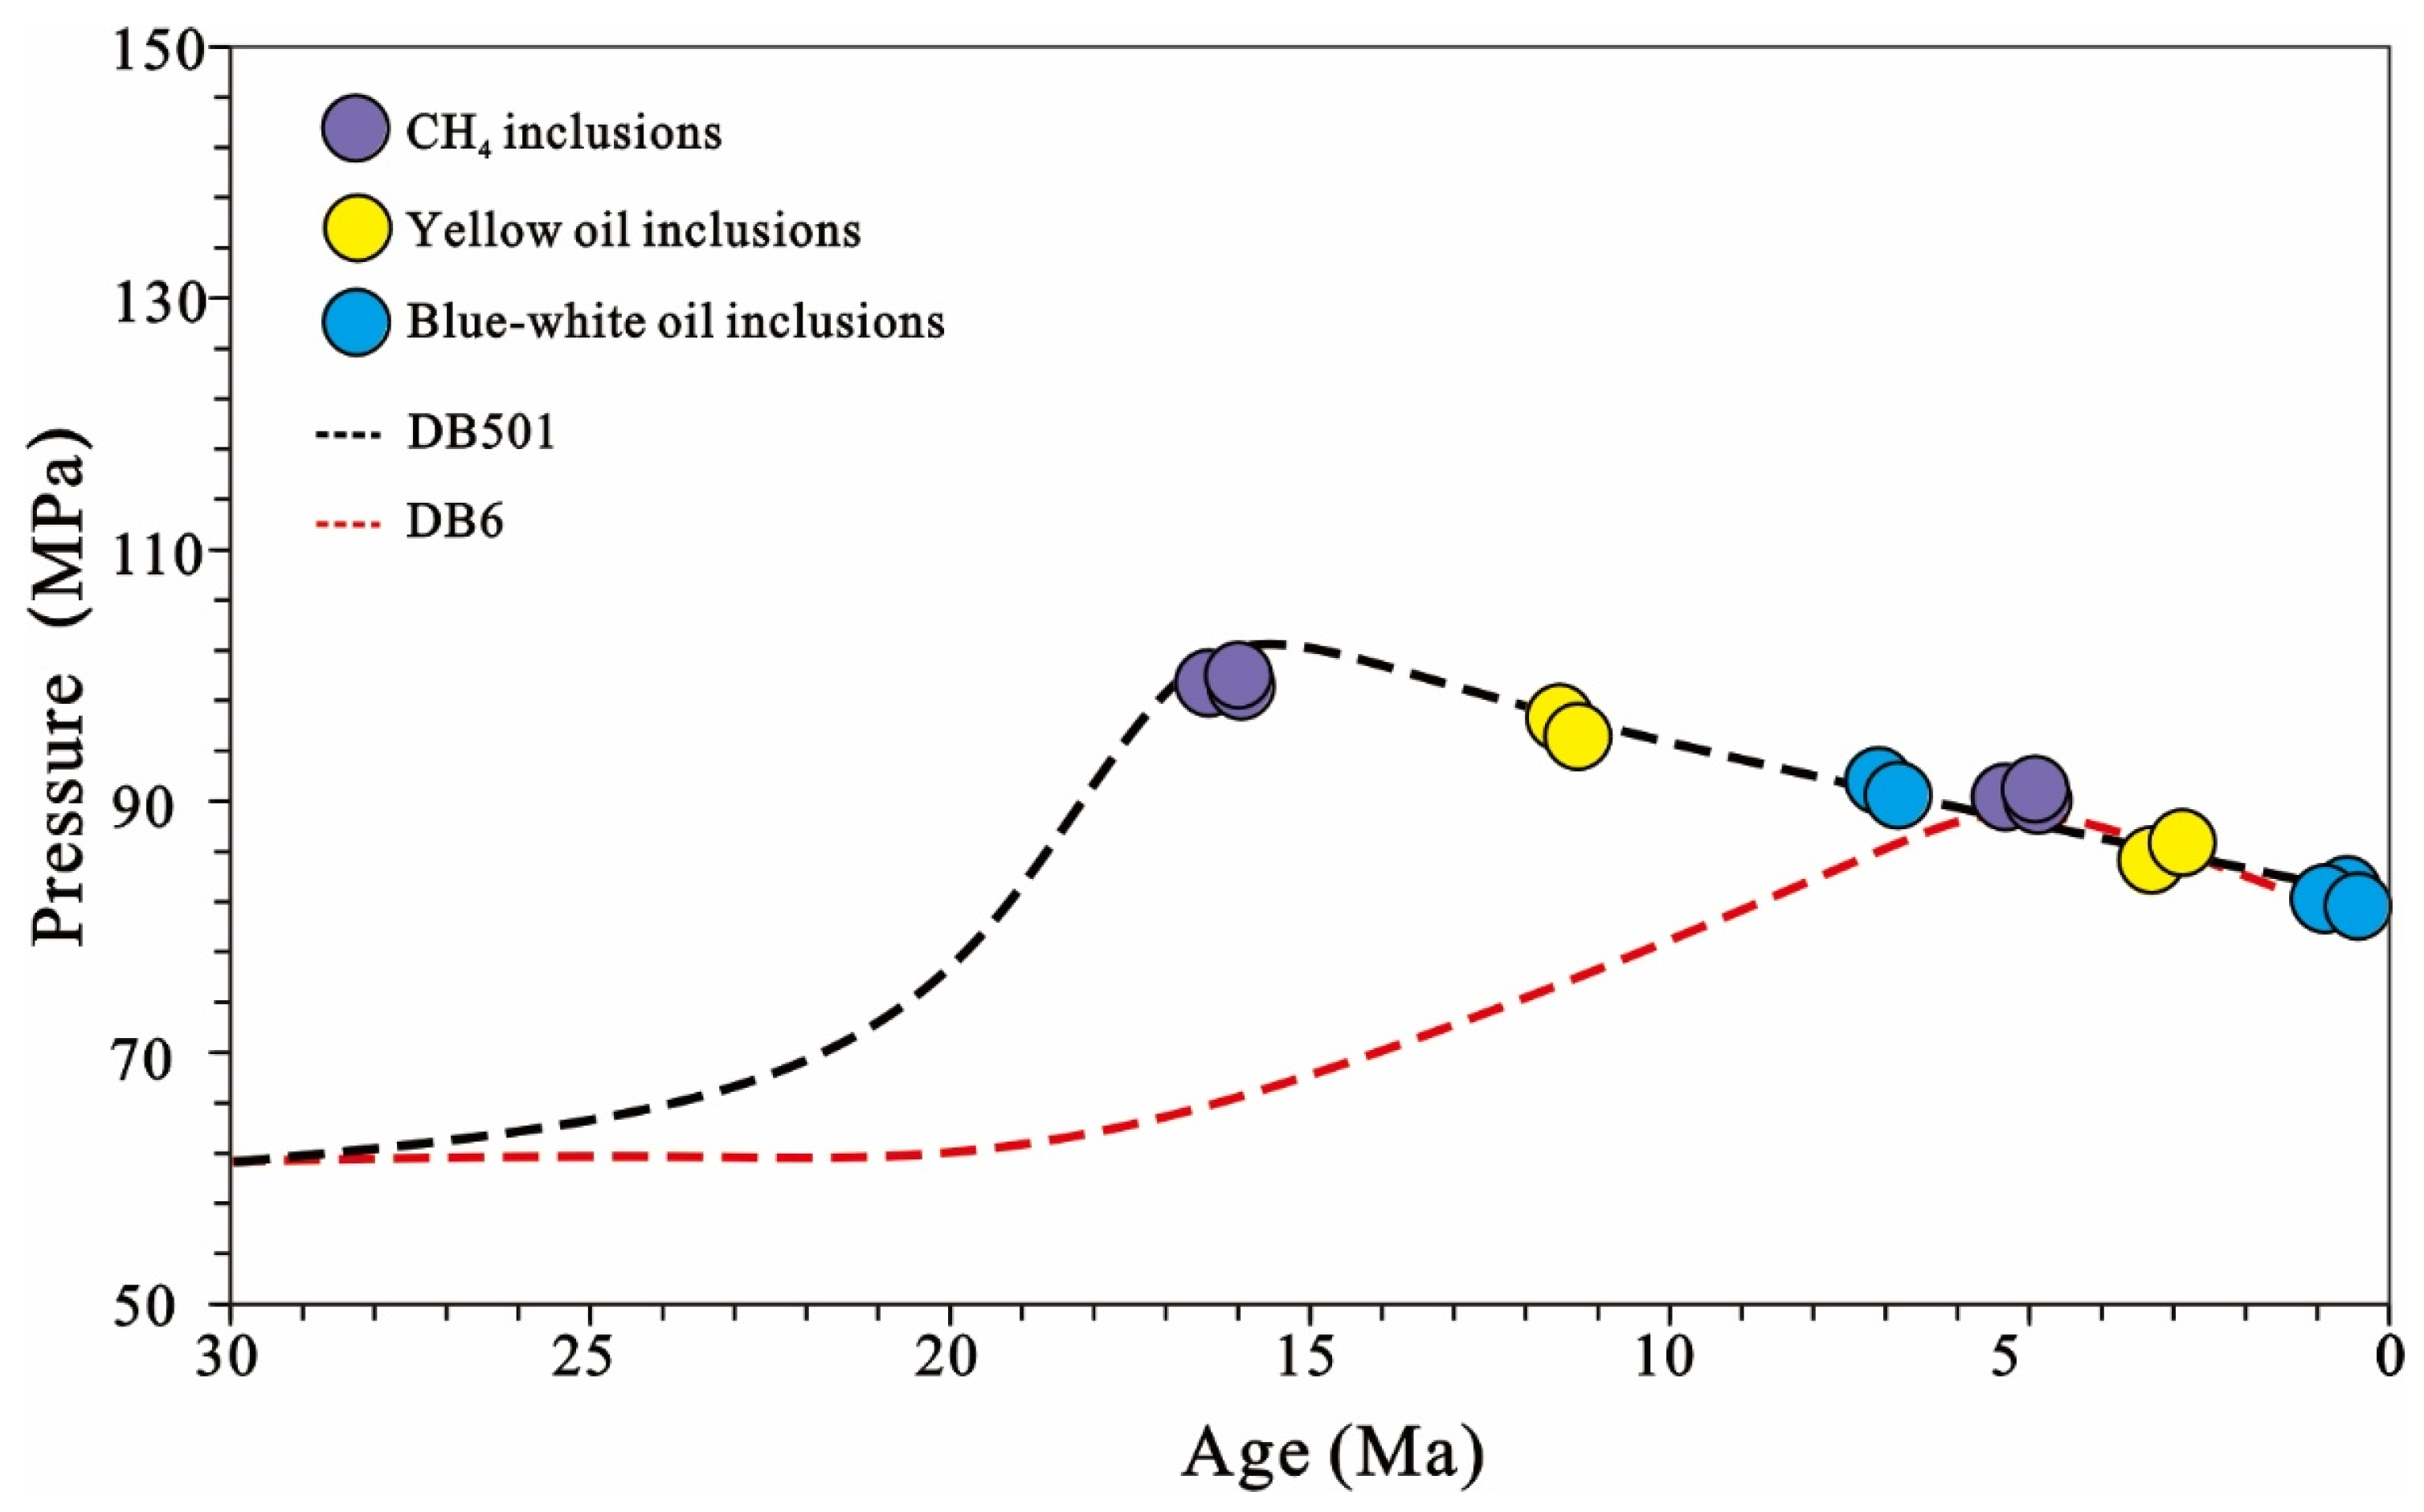
The evolution of paleopressure in the eastern Kuqa Depression can be reconstructed by integrating pressure estimates from fluid inclusions, Raman spectroscopy results, and burial–thermal history modeling. Paleopressures were calculated using isochores derived from microthermometric data of aqueous inclusions, combined with trapping temperatures constrained by burial history models. Pressure coefficients were calculated as the ratio of reconstructed fluid pressure to contemporaneous hydrostatic pressure at the corresponding modeled burial depth (PC = Pf/Ph). Here, Pf is the reconstructed trapping pressure derived from fluid inclusion data, and Ph is the hydrostatic pressure calculated for the same burial depth and time. Therefore, the coefficient values reported below (e.g., 1.43–1.48) were calculated results for each inclusion assemblage and trapping interval, rather than values read directly from Figure 13. The curves shown in Figure 13 are original results generated in this study for the Dibei-6 (DB6) and Dibei-501 (DB501) wells.
The earliest gas inclusions, formed during the Jidike Formation (22–20 Ma) record fluid pressures of 90–92 MPa, corresponding to pressure coefficients of 2.3–2.5. During the Kangcun Formation deposition (12–10 Ma), yellow fluorescent oil inclusions yield slightly lower pressures (79.1–82.5 MPa). Although burial depths at this stage were deeper than during the Kuqa Formation, pressure coefficients remain elevated (1.43–1.48), reflecting sustained overpressure conditions. Blue fluorescent oil inclusions (9–7 Ma) record pressures of 80–86 MPa with coefficients of 1.16–1.21, indicating partial pressure dissipation, corresponding to the basin uplift since ~8 Ma. The final-stage gas inclusions formed during the Kuqa Formation (3–2 Ma) show pressure values from 75 to 86 MPa. Despite similar absolute pressures to earlier stages, the shallower burial depth at this time results in higher pressure coefficients (1.50–1.73), indicating renewed overpressure buildup.
These results indicate a persistently overpressured system in the eastern Kuqa Depression. While early-stage gas generation initially elevated pressure, subsequent tectonic deformation may have induced partial pressure release. However, due to the limited vertical permeability of late-stage fractures, pressure buildup continued in localized compartments, providing the driving force for hydrocarbon migration and entrapment in tight reservoirs. In the western Tuotan area, pressure coefficients remain near normal (1.07–1.15) throughout the hydrocarbon accumulation history, reflecting mild tectonics and open lateral migration pathways along unconformities.

5.5. Contrasting Accumulation Processes Between Eastern and Western Kuqa Depression

The contrasting hydrocarbon accumulation patterns between the eastern and western Kuqa Depression primarily reflect differences in tectonic deformation intensity, source rock maturity, reservoir evolution, and pressure regimes.
In the eastern Dibei area, tectonic activity intensified markedly during the Himalayan orogeny. Prior to the deposition of the Neogene Jidike Formation (~23 Ma), source rocks remained largely immature and no effective hydrocarbon accumulation occurred. During the deposition of the Jidike to Kangcun formations (23–5 Ma), increasing burial depth and geothermal gradients promoted rapid source rock maturation, leading to multi-phase hydrocarbon charging. Subsequent late Himalayan deformation reactivated faults and enhanced overpressure, facilitating vertical migration and gas accumulation in tight reservoirs.
In contrast, the western Kuqa Depression experienced weaker late-stage tectonic deformation. Although hydrocarbon generation initiated earlier, the absence of strong overpressure limited vertical migration. Hydrocarbons migrated primarily along unconformities and accumulated in structurally favorable locations within the Upper Cambrian Lower Qiulitage Formation. The system is characterized by normal to slightly elevated pressure coefficients (~1.07), favoring the preservation of conventional oil reservoirs.
Overall, source rock maturity increases from west to east, with the hydrocarbon generation center located in the eastern Qiulitage structural belt. The coupling of intense tectonic activity, high source rock maturity, overpressure, and fault-controlled migration pathways explains the more complex and gas-dominated accumulations in the eastern Kuqa Depression.

5.6. Limitations and Future Research

Despite the robustness of the integrated analytical framework used in this study, several limitations should be noted. First, the present comparison is based on a limited number of representative wells and samples from the eastern and western Kuqa Depression, namely Dibei-6, Dibei-501, and Tuotan-1. Although these wells capture the main geological characteristics of the studied structural domains, they may not fully represent the spatial heterogeneity of fault architecture, reservoir properties, fluid evolution, and accumulation processes across the entire Kuqa Depression. Second, the reconstruction of hydrocarbon charging timing and paleopressure relies on the interpretation of fluid inclusion assemblages, homogenization temperatures, Raman-derived gas properties, and 1D burial–thermal history modeling. These approaches inevitably involve uncertainties related to inclusion preservation, identification of coeval aqueous inclusions, estimation of trapping temperature, heat-flow history, erosion magnitude, and model parameter selection. Third, the east–west comparison would benefit from more balanced datasets, especially additional direct constraints on gas composition and pressure evolution in the western structural domain. Moreover, the present study mainly focuses on geological reconstruction and does not directly incorporate basin-wide seismic interpretation, detailed geochemical/isotopic tracing, or production dynamic data, which would further strengthen the validation of migration pathways and accumulation models. Future research should therefore expand sampling and well coverage in different structural belts of the Kuqa Depression, integrate fluid inclusion analysis with organic geochemistry and isotopic tracers, and apply 2D/3D basin and petroleum system modeling to better constrain the regional applicability of the proposed hydrocarbon accumulation framework.

6. Conclusions

The timing of hydrocarbon accumulation exhibits significant spatial variation across the Kuqa Depression. In the western region, hydrocarbon charging occurred predominantly in two phases, corresponding to the deposition periods of the Jidike and Kuqa formations. In contrast, the eastern Dibei area experienced four distinct phases of hydrocarbon input—two involving oil and two involving gas—within the same stratigraphic intervals. Source rock maturity also displays a clear east–west gradient: the Jurassic Yangxia Formation in the east has reached a high level of maturity, favoring gas-dominated accumulations, whereas the Triassic Huangshanjie Formation in the west is less mature, predominantly generating oil.
Tectonic activity and overpressure are the principal factors controlling hydrocarbon migration and accumulation in the Kuqa Depression. The Himalayan tectonic compression was a key driver of structural development and fluid dynamics. In the eastern region, proximity to the orogenic belt led to intensive faulting and widespread overpressure (pressure coefficients of 1.5–1.7), enabling efficient vertical migration of hydrocarbons along fault conduits. Moreover, the densification of the Jurassic Ahe Formation around 8 Ma established conditions conducive to tight gas reservoir formation. Conversely, the western region is characterized by milder tectonic deformation, with hydrocarbon migration dominated by lateral flow along unconformities. Lower pressure coefficients (1.1–1.15) and superior reservoir quality in the west favor the preservation of conventional oil accumulations. These findings are significant for both geological interpretation and petroleum exploration. They demonstrate that tectonic–pressure coupling is a key control on the timing, phase, and preservation of hydrocarbons in the Kuqa Depression. From a practical perspective, the results help distinguish exploration targets in overpressured deep gas systems from those in weakly deformed conventional oil systems, thereby improving prospect evaluation, reducing drilling uncertainty, and helping minimize unnecessary exploration disturbance through more targeted resource development.

Author Contributions

Y.Z.: methodology, validation, investigation, data curation, writing—original draft, visualization. J.G.: conceptualization, methodology, writing—review and editing, supervision, project administration, funding acquisition, validation, investigation, writing—original draft. Q.L.: conceptualization, methodology, writing—review and editing, supervision, formal analysis, resources, validation, investigation, writing—original draft. H.L.: methodology, validation, formal analysis, investigation, data curation, software, writing—original draft. Y.H.: methodology, validation, investigation, conceptualization, data curation, software, visualization, writing—review and editing, writing—original draft. All authors have read and agreed to the published version of the manuscript.

Funding

This study is funded by the Integrated Project of the Tethyan Geodynamic System, National Natural Science Foundation of China (Grant Nos. 92255302 and U24B6001).

Institutional Review Board Statement

Not applicable.

Informed Consent Statement

Not applicable.

Data Availability Statement

The original contributions presented in this study are included in the article. Further inquiries can be directed to the corresponding authors.

Acknowledgments

The authors would like to thank the Academic Editors and anonymous reviewers for their constructive comments and suggestions. Technical and analytical support from all involved institutions is also gratefully acknowledged.

Conflicts of Interest

Authors Yang Zhang, Jian Gao, and Huixi Lin were employed by the company SINOPEC Petroleum Exploration and Production Research Institute. The remaining authors declare that the research was conducted in the absence of any commercial or financial relationships that could be construed as a potential conflict of interest.

References

  1. Gao, Z.; Yin, H.; Wu, C.; Chen, W.; Zhao, J.; He, W.; Wang, W. Growth of thrust-faults in fold-and-thrust belts: An example from the Kelasu structural belt of the Kuqa depression, Tarim Basin, NW China. J. Asian Earth Sci. 2026, 295, 106870. [Google Scholar] [CrossRef]
  2. Wang, Q.; Yang, H.; Yang, W. New progress and future exploration targets in petroleum geological research of ultra-deep clastic rocks in Kuqa Depression, Tarim Basin, NW China. Pet. Explor. Dev. 2025, 52, 79–94. [Google Scholar] [CrossRef]
  3. Zhang, C.; Zou, H.; Li, H.; Wang, H. Tectonic framework and evolution of the Tarim Block in NW China. Gondwana Res. 2013, 23, 1306–1315. [Google Scholar] [CrossRef]
  4. Wan, J.; Gong, Y.; Huang, W.; Zhuo, Q.; Lu, X. Characteristics of hydrocarbon migration and accumulation in the Lower Jurassic reservoirs in the Tugerming area of the eastern Kuqa Depression, Tarim Basin. J. Pet. Sci. Eng. 2022, 208, 109748. [Google Scholar] [CrossRef]
  5. Wei, G.; Wang, K.; Zhang, R.; Wang, B.; Yu, C. Structural diagenesis and high-quality reservoir prediction of tight sandstones: A case study of the Jurassic Ahe Formation of the Dibei gas reservoir, Kuqa depression, Tarim basin, NW China. J. Asian Earth Sci. 2022, 239, 105399. [Google Scholar] [CrossRef]
  6. Zhang, C.; Liu, J.; Hu, L.; Huang, W.; Li, S.; Liu, K.; Wang, C.; Pan, Y.; Regenauer-Lieb, K. Characterizing the Present-day Stress Field and Fracture Intensity in the Kuqa Depression, Northwestern China. Pet. Res. 2026; in press. [CrossRef]
  7. Wei, X.; Liu, K.; Yang, X.; Yang, P.; Liu, J.; Ding, X. Evolution of the Dibei condensate gas reservoirs in the northern Kuqa Foreland Basin, western China: Insight for hydrocarbon in-reservoir alteration. Mar. Pet. Geol. 2025, 174, 107306. [Google Scholar] [CrossRef]
  8. Dong, C.; Zhang, L.; Yang, W.; Xu, Z.; Li, J.; Miao, W. Accumulation process and potential of Jurassic tight sandstone oil and gas in Eastern Yangxia sag of Kuqa Depression. China Geol. 2025, 8, 389–407. [Google Scholar] [CrossRef]
  9. Ma, B.; He, Y.; Chen, L.; Wu, G.; Dong, H.; Wang, J.; Yao, J.; Liu, X. Linkage, evolution and formation mechanism of the partially-thoroughgoing intra-cratonic conjugate strike-slip fault system in the northern Tarim Basin, NW China. J. Asian Earth Sci. 2025, 294, 106784. [Google Scholar] [CrossRef]
  10. Zeng, Q.; Zeng, T.; Ouyang, Y.; Dai, C.; Song, Y. Subsalt high steep structure imaging technique: A case study of Keshen area in Kuqa depression, Tarim Basin, NW China. Pet. Explor. Dev. 2017, 44, 923–931. [Google Scholar] [CrossRef]
  11. Zhang, R.; Yang, H.; Wei, H.; Yu, C.; Yang, Z.; Wu, J. Sandstone characteristics and hydrocarbon exploration significance of the Middle-Lower Jurassic of the central-eastern part of the northern tectonic belt of the Kuqa Depression, Tarim Basin, China. J. Nat. Gas Geosci. 2020, 5, 81–90. [Google Scholar] [CrossRef]
  12. Zhao, G.; Li, X.; Liu, M.; Li, J.; Liu, Y.; Zhang, X.; Wei, Q.; Xiao, Z. Accumulation characteristics and controlling factors of the Tugeerming gas reservoir in the eastern Kuqa Depression of the Tarim Basin, northwest China. J. Pet. Sci. Eng. 2022, 217, 110881. [Google Scholar] [CrossRef]
  13. Yang, X.; Huang, Y.; Wang, B.; Wen, Z.; Zhou, L.; Zhang, K.; He, T.; Luo, T.; Chen, X.; Zeng, Q. Oil and gas accumulation and diagenetic fluid evolution in deep Cambrian strata: A case study of well Tuotan 1, Kuqa Depression, Tarim Basin. Pet. Reserv. Eval. Dev. 2025, 15, 382–393. [Google Scholar]
  14. Li, J.; Wang, R.; Qin, S.; Shi, W.; Geng, F.; Luo, F.; Li, G.; Zhang, X. Evolution of Mesozoic paleo-uplifts and differential control on sedimentation on the southern margin of Kuqa Depression, Tarim Basin. Mar. Pet. Geol. 2024, 161, 106707. [Google Scholar] [CrossRef]
  15. Liu, C.; Rong, H.; Chen, S.; Tang, Y.; Deng, Y. Diagenesis and reservoir property variations of tight sandstone with burial depths ranging from shallow to ultra-deep in the Kuqa Depression, Tarim Basin, China. Nat. Gas Ind. B 2024, 11, 121–139. [Google Scholar] [CrossRef]
  16. Xu, K.; Zhang, H.; Ning, W.; Liang, J.; Qiang, J.; Wang, X.; Zheng, P.; Qian, Z.; Zhang, Y.; Yuan, F. Geomechanical parameter-driven evaluation of ultra-deep reservoirs: An integrated methodology and its application to the Kuqa depression, Tarim Basin. Energy Geosci. 2025, 6, 100433. [Google Scholar] [CrossRef]
  17. Huang, J.; Lin, X.; An, K.; Chen, H.; Cheng, X.; Qu, Y.; Li, Y.; Yang, X.; Zhang, L.; Chen, C.; et al. Long-lived Cenozoic positive relief of the south-Eastern Tian Shan: Insights from provenance analyses of the northwestern Kuqa Depression sediments. Palaeogeogr. Palaeoclimatol. Palaeoecol. 2023, 632, 111846. [Google Scholar] [CrossRef]
  18. Meng, Q.; Wu, G.; Fan, L.; Wei, H. Tectonic evolution of early Mesozoic sedimentary basins in the North China block. Earth-Sci. Rev. 2019, 190, 416–438. [Google Scholar] [CrossRef]
  19. Fu, X.; Jia, R.; Wang, H.; Wu, T.; Meng, L.; Sun, Y. Quantitative evaluation of fault-caprock sealing capacity: A case from Dabei-Kelasu structural belt in Kuqa Depression, Tarim Basin, NW China. Pet. Explor. Dev. 2015, 42, 329–338. [Google Scholar] [CrossRef]
  20. Huang, W.; Zeng, L.; Pan, C.; Xiao, Z.; Zhang, H.; Huang, Z.; Zhao, Q.; Yu, S.; Xu, H.; Chen, C.; et al. Petroleum generation potentials and kinetics of coaly source rocks in the Kuqa Depression of Tarim Basin, northwest China. Org. Geochem. 2019, 133, 32–52. [Google Scholar] [CrossRef]
  21. Gao, T.; Ding, X.; Yang, X.; Chen, C.; Xu, Z.; Liu, K.; Zhang, X.; Cao, W. Geochemical Characteristics and Depositional Environment of Coal-Measure Hydrocarbon Source Rocks in the Northern Tectonic Belt, Kuqa Depression. Appl. Sci. 2022, 12, 9464. [Google Scholar] [CrossRef]
  22. Jia, K.; Yuan, W.; Liu, J.; Yang, X.; Zhang, L.; Liu, Y.; Zhou, L.; Liu, K. Hydrocarbon Generation and Accumulation in the Eastern Kuqa Depression, Northwestern China: Insights from Basin and Petroleum System Modeling. Appl. Sci. 2024, 14, 1217. [Google Scholar] [CrossRef]
  23. Qin, X.; Chen, X.; Shao, Z.; Zhang, Y.; Wang, Y.; Li, B. Cenozoic multi-phase intracontinental deformation of the Tianshan Range (NW China): Constraints from detrital zircon provenance and syn-tectonic sedimentation of the Kuqa Depression. J. Asian Earth Sci. 2022, 232, 105183. [Google Scholar] [CrossRef]
  24. Guo, X.; Liu, K.; Jia, C.; Song, Y.; Zhao, M.; Zhuo, Q.; Lu, X. Fluid evolution in the Dabei Gas Field of the Kuqa Depression, Tarim Basin, NW China: Implications for fault-related fluid flow. Mar. Pet. Geol. 2016, 78, 1–16. [Google Scholar] [CrossRef]
  25. Wang, P.W.; Pang, X.Q.; Jiang, Z.X.; Guo, Y.C.; Chen, X.; Wang, Y.W.; Jiao, J. Origin and evolution of overpressure in the Lower Jurassic succession in the Kuqa Depression, western China. J. Nat. Gas Sci. Eng. 2016, 28, 700–710. [Google Scholar] [CrossRef]
  26. Guo, S.; Lyu, X.; Zhang, Y. Relationship between tight sandstone reservoir formation and hydrocarbon charging: A case study of a Jurassic reservoir in the eastern Kuqa Depression, Tarim Basin, NW China. J. Nat. Gas Sci. Eng. 2018, 52, 304–316. [Google Scholar] [CrossRef]
  27. Yang, H.; Hu, S.; Yang, X.; Hu, M.; Xie, H.; Zhang, L.; Li, L.; Zhou, L.; Zhang, G.; Luo, H.; et al. Episodic thrusting and sequence-sedimentary responses and their petroleum geological significance in Kuqa foreland basin, NW China. Pet. Explor. Dev. 2024, 51, 1451–1464. [Google Scholar] [CrossRef]
  28. Liu, X.; Chen, H.; Fan, J.; Kong, L.; Mu, X.; Zhang, H.; Safaei-Farouji, M.; Ostadhassan, M. Relationship between fluorescence and IR parameters of oil inclusions and crude oils in the Dongpu Depression (Bohai Bay Basin, China). J. Asian Earth Sci. 2023, 253, 105705. [Google Scholar] [CrossRef]
  29. Wang, K.; Zhang, R.; Zeng, Q.; Wang, J. Formation mechanism and hydrocarbon exploration significance of the box fold in the Qiulitage structural belt, the Kuqa Depression, Tarim Basin, China. J. Nat. Gas Geosci. 2022, 7, 333–346. [Google Scholar] [CrossRef]
  30. Li, J.; Li, J.; Xie, Z.; Wang, C.; Zhang, H.; Liu, M.; Li, D.; Ma, W.; Mao, D.; Zeng, X. Oil and gas source and accumulation of Zhongqiu 1 trap in Qiulitage structural belt, Tarim Basin, NW China. Pet. Explor. Dev. 2020, 47, 548–559. [Google Scholar] [CrossRef]
  31. Liu, J.; Yang, X.; Liu, K.; Xu, Z.; Jia, K.; Zhou, L.; Wei, H.; Zhang, L.; Wu, S.; Wei, X. Differential hydrocarbon generation and evolution of typical terrestrial gas-prone source rocks: An example from the Kuqa foreland basin, NW China. Mar. Pet. Geol. 2023, 152, 106225. [Google Scholar] [CrossRef]
  32. Ju, W.; Zhong, Y.; Liang, Y.; Gong, L.; Yin, S.; Huang, P. Factors influencing fault-propagation folding in the Kuqa Depression: Insights from geomechanical models. J. Struct. Geol. 2023, 168, 104826. [Google Scholar] [CrossRef]
  33. Tang, X.; Yang, S.; Hu, S. Thermal and maturation history of Jurassic source rocks in the Kuqa foreland depression of Tarim Basin, NW China. J. Asian Earth Sci. 2014, 89, 1–9. [Google Scholar] [CrossRef]
  34. Yang, Z.; Cheng, X.; Ouyang, S.; Liu, Z.; Cheng, Y.; Lan, S.; Xue, L.; Zhang, T.; Qu, Y. Influencing Factors of Hydrocarbon Migration and Adjustment at the Edge of a Stable Cratonic Basin: Implications from Fluid Inclusions, Quantitative Fluorescence Techniques, and Geochemical Tracing. Energies 2026, 19, 638. [Google Scholar] [CrossRef]
Figure 1. Tectonic units and well locations of the Kuqa Depression in the Tarim Basin.
Applsci 16 07305 g001
Figure 2. Generalized stratigraphic column of the Kuqa Depression.
Applsci 16 07305 g002
Figure 3. Petrographic and cathodoluminescence characteristics of calcite veins in dolomite reservoirs from the Lower Qiulitage Formation, T1 Well, western Kuqa Depression. (a) Photograph of core sample from the T1 well. (b) Photograph of thin section, with rectangle areas (ce) selected for optical microscopy. (f) Transmitted light image corresponding to the rectangle area (c) in picture (b). (g) Cathodoluminescence image of the same field of view as (f). (h) Transmitted light image of the rectangle area d in picture (b). (i) Cathodoluminescence image of the same field of view as (h). (j) Transmitted light image of the rectangle area e in picture (b). (k) Cathodoluminescence image of the same field of view as (j).
Applsci 16 07305 g003
Figure 4. Petrographic and cathodoluminescence features of calcite veins in sandstone reservoirs from the Ahe Formation, Dibei-6 and Dibei-501 wells, eastern Kuqa Depression. (a,b) Thin sections showing calcite- and quartz-filling veins in sandstones. (ch) Transmitted light images showing transparent quartz and turbid calcite crystals. (f’h’) Cathodoluminescence images showing non-luminescent quartz, calcite-1 with red luminescence and calcite-2 with dull red luminescence.
Applsci 16 07305 g004
Figure 5. Fluid inclusion petrography of calcite veins in the Lower Qiulitage Formation, Tuotan-1 Well, western Kuqa Depression. (a) Transmitted light image showing secondary oil inclusions with blue fluorescence. (b) The same field of view as a under ultraviolet light. (c) Transmitted light image showing secondary oil inclusions cutting across a calcite crystal. (d) The same field of view as (c), showing secondary green fluorescent oil inclusions in calcite crystal.
Applsci 16 07305 g005
Figure 6. Fluid inclusion petrography of calcite and quartz veins in the Ahe Formation, Dibei-6 and Dibei-501 wells, eastern Kuqa Depression. (a) Primary gas inclusions under transmitted light. (b) Secondary oil inclusions under transmitted light. (c) The same field of view as (b), showing secondary yellow fluorescent oil inclusions. (d) Transmitted light image showing secondary gas inclusions in quartz. (e) Secondary oil inclusions in calcite under transmitted light. (f) The same field of view as (e), showing blue fluorescent secondary oil inclusions. (g) Primary gas inclusions under transmitted light. (h) Primary bitumen inclusions in calcite. (i) Secondary oil inclusions in calcite showing yellow and blue colors under ultraviolet light.
Applsci 16 07305 g006
Figure 7. Fluorescence spectral projections of oil inclusions in calcite veins from the Lower Qiulitage Formation in the Tuotan-1 Well and the Ahe Formation in the Dibei area.
Applsci 16 07305 g007
Figure 8. Laser Raman spectra of gas inclusions in the Dibei area. (a) Laser Raman spectrum of a primary gas inclusion in the Dibei area, with inset (a’) showing the analyzed inclusion. (b) Detailed view of the methane CH4 symmetric stretching vibration peak for the inclusion in (a). (c) Laser Raman spectrum of another representative primary gas inclusion, with inset (c’) showing the analyzed inclusion. (d) Detailed view of the methane CH4 symmetric stretching vibration peak for the inclusion in (c).
Applsci 16 07305 g008
Figure 9. Histogram of homogenization temperatures for fluid inclusions in calcite veins from the Lower Qiulitage Formation in the Tuotan-1 Well and in calcite and quartz veins from the Ahe Formation in the Dibei area.
Applsci 16 07305 g009
Figure 10. One-dimensional burial history and thermal evolution models for the reservoir intervals in the Dibei area and the Lower Qiulitage Formation in the Tuotan-1 well, constructed with BasinMod using stratigraphic age–thickness data, lithology-dependent compaction, unconformity-related erosion, and time-dependent heat-flow histories calibrated to regional maturity and present-day temperature constraints. Colored bars indicate trapping intervals inferred by matching homogenization temperatures of coeval aqueous inclusions to the modeled reservoir temperature histories. The figure is used to constrain the timing of reservoir charging rather than to represent a full source-to-reservoir migration simulation. (a) Dibei area, eastern Kuqa Depression. (b) Tuotan-1 (TT1) well, western Kuqa Depression.
Applsci 16 07305 g010
Figure 11. Schematic model of hydrocarbon accumulation in the Lower Qiulitage Formation, Tuotan area. Є, Cambrian; P, Permian; J+T, Jurassic–Triassic; K, Cretaceous; E, Paleogene; E23s, Suweiyi Formation; N1j, Jidike Formation; N1k, Kangcun Formation; N2k, Kuqa Formation; and Q1x, Xiyu Formation.
Applsci 16 07305 g011
Figure 12. Schematic diagram of dynamic hydrocarbon accumulation in the Dibei area.
Applsci 16 07305 g012
Figure 13. Paleopressure evolution curves for the Dibei area constructed in this study based on fluid inclusion microthermometry, Raman-derived CH4 density, and burial–thermal history modeling. DB6 and DB501 denote the Dibei-6 and Dibei-501 wells, respectively.
Applsci 16 07305 g013
Table 1. Sample information.
WellSample Depth/mFormationTests Conducted
Tuotan-15755.7Upper
Cambrian Lower Qiulitage
Petrographic Analysis
and
Cathodoluminescence
(CL)
Fluid Inclusion Analysis
(Fluorescence Spectroscopy)
Laser
Raman Spectroscopy
Fluid Inclusion
Microthermometry and
Structural Burial History Modeling
Paleopressure Reconstruction
5691.5
Dibei-6 5016.5Jurassic
Ahe
6301.4
5017.7
5013
5011
5016
6302.1
Dibei-5016305.2Jurassic
Ahe
5860.3
5865.8
6204.8
5860.3
5863.2
5861
6208.1
6206.5
5859.5
5860.7
6203.4
Table 2. Main numerical inputs and calibration constraints for the Dibei burial–thermal model.
Input ItemType/AgeNumerical InputSource/Status
Paleogene strataF, 40 Ma180 mDB6 well data
Neogene strataF, 23 Ma2470 mDB6 well data
Himalayan erosionE, 8 Ma−1300 mDB6 model input
Quaternary strataF, 1 Ma1000 mDB6 well data
CompactionSandstoneφ0 = 0.41; c = 0.31 km−1Software default
CompactionMudstoneφ0 = 0.70; c = 0.83 km−1Software default
Heat-flow history210/65/0 Ma55/50/44.6 mW m−2Regional constraint
Thermal calibrationPresent daySurface temperature 12 °C;
geothermal gradient 24 °C km−1
published regional data
Maturity calibrationJ2q/J2kz/J1yRo = 0.91/0.83/0.82%Measured well data
Note: F denotes a formation preserved in the present-day stratigraphic succession; E denotes an erosion event, with erosion thickness entered as a negative value. φ0 is the initial porosity and c is the compaction coefficient, both utilizing BasinMod default database parameters. Geothermal gradient and surface temperature are derived from published regional literature of the Yangxia Sag; well-specific bottom-hole temperature (BHT) logs were unavailable for DB6 and thus regional calibration constraints were applied. Measured Ro calibration data are obtained from core sample analysis of the target wells.
Table 3. Main numerical inputs and calibration constraints for the TT1 burial–thermal model.
Input ItemType/AgeNumerical InputSource/Status
Early Cenozoic depositional unitF, 40 Ma500 mTT1 model input
Neogene depositional unitF, 23 Ma2800 mTT1 model input
Himalayan erosionE, 10 Ma−800 mTT1 model input
Late Neogene–Quaternary unitF, 5 Ma300 mTT1 model input
CompactionCarbonateφ0 = 0.45; c = 0.15 km−1Software default
CompactionMudstoneφ0 = 0.70; c = 0.83 km−1Software default
Heat-flow history210/65/0 Ma55/50/44.6 mW m−2Regional constraint
Thermal calibrationPresent daySurface temperature 12 °C;
geothermal gradient 23 °C km−1
published regional data
Maturity calibrationPresent dayRo = 0.70–1.00%Regional constraint
Note: F denotes a formation preserved in the present-day stratigraphic succession; E denotes an erosion event, with erosion thickness entered as a negative value. φ0 is the initial porosity and c is the compaction coefficient, utilizing BasinMod default carbonate and mudstone compaction parameters. Thermal history is constrained using regional lithospheric thermal evolution and published geothermal data of the Qiulitage structural belt. Present-day geothermal gradient (23 °C/km) and surface temperature (12 °C) are based on regional literature; maturity calibration bounds Ro = 0.70–1.00%) represent regional source rock maturity constraints.
Disclaimer/Publisher’s Note: The statements, opinions and data contained in all publications are solely those of the individual author(s) and contributor(s) and not of MDPI and/or the editor(s). MDPI and/or the editor(s) disclaim responsibility for any injury to people or property resulting from any ideas, methods, instructions or products referred to in the content.