Article

Fabrication and Performance Assessment of an Epoxy-Based Composite Coating for Carbon Capture on Asphalt Pavement

1
School of Materials Science and Engineering, Chang’an University, Xi’an 710064, China
2
Saudi Arabian Oil Company, Dhahran 31311, Saudi Arabia
*
Author to whom correspondence should be addressed.
Appl. Sci. 2026, 16(14), 7264; https://doi.org/10.3390/app16147264
Submission received: 9 June 2026 / Revised: 15 July 2026 / Accepted: 17 July 2026 / Published: 20 July 2026

Abstract

Against the backdrop of China’s dual-carbon strategy and the development of green transportation, systematic research on direct pavement carbon absorption and sequestration remains limited. Traditional epoxy resin coatings, owing to their dense structure, poor air permeability, and single functionality, fail to meet the requirements for pavement carbon absorption. To address this issue, an ordered, honeycomb-like, porous epoxy carbon-absorbing coating was prepared using bisphenol A epoxy resin as the matrix and diethylenetriamine as the curing agent through the breath-figure method. The pore-formation mechanism and the process regulation principles of the coating were systematically elucidated. Key preparation parameters (ambient humidity, dispersion concentration, and spray dosage) were regulated, and multiple microscopic characterization methods, including SEM, FTIR, and TG, were adopted to comprehensively explore the influences of preparation parameters on the coating’s microstructure, chemical composition, and thermal stability. Experimental results indicate that under optimized process conditions, a honeycomb-like porous coating with uniform pore size and regular arrangement can be fabricated. The fabrication procedure features simple operation, favorable controllability, and low cost. The breath-figure method was successfully applied to the preparation of a porous epoxy carbon-absorbing coating, achieving controllable regulation of the porous structure and thereby effectively overcoming the limitations imposed by the dense nature of traditional epoxy coatings. Consequently, this work provides new technical concepts and data support for the development and application of low-carbon functional coatings for pavements.

1. Introduction

China’s transportation sector contributes approximately 11–15% of national end-use carbon emissions, with road transport accounting for more than 90%. Passenger and freight transport are, therefore, key mitigation targets. In response to the national goal of reducing transport carbon-emission intensity by 5% from 2020 levels by 2025, low-carbon infrastructure, green materials, and energy-efficient processes have become increasingly important [1].
Current global low-carbon pavement technologies focus on recycled materials, warm/cold mixes, energy-efficient equipment, and low-carbon asphalt modifiers [2,3,4]. In contrast, systematic research on in situ active carbon absorption and long-term carbon sequestration in pavements is scarce. Dedicated carbon-absorbing coatings for asphalt pavements are particularly lacking. Vehicle exhaust analysis shows that CO2 accounts for 14% by volume of gasoline combustion products. Hazardous substances like NOx, SO2, and particulate matter constitute only about 1% [5]. However, existing studies have focused on degrading these toxic components. Insufficient attention has been given to the in situ capture and stable sequestration of high-concentration CO2. This represents a significant research gap. Asphalt pavements have wide distribution, large surface area, direct contact with exhaust gases, and long service life. The total area of asphalt pavements in China exceeds hundreds of billions of square meters. If equipped with efficient CO2 adsorption and sequestration, these pavements could form a distributed, high-capacity, passive carbon sink system. This would provide a novel pathway for carbon neutrality in the transportation sector.
In the field of solid adsorbents and carbon capture materials, domestic research has several main focuses. These include mesoporous silica-based materials, metal–organic frameworks (MOFs), carbon-based materials, and solid amine adsorbents [6,7,8]. Multiple universities and research institutes have achieved significant breakthroughs. These breakthroughs are in amine functionalization of mesoporous SiO2, water-stable MOF coatings, and graphene aerogel porous materials [9]. Researchers use post-grafting, in situ synthesis, freeze-drying, and other techniques [10,11]. With these techniques, high specific surface areas and high loadings of active sites have been realized. The resulting materials show high CO2 adsorption capacity and good cyclic stability.
Solid amine adsorbents have high adsorption capacity, good selectivity, and mild regeneration conditions. Therefore, they have become a research hotspot in direct air capture [12]. Polymeric amines are widely used for modifying silica- and carbon-based supports. Examples include polyethyleneimine (PEI) and tetraethylenepentamine (TEPA). However, few studies have addressed the stability, water resistance, and aging resistance of these adsorbents under pavement conditions. Their road-specific adaptation remains insufficient. Internationally, several countries lead in key areas. The United States, Germany, the United Kingdom, and South Korea lead in amine loading processes, pore structure regulation, support design, and low-temperature regeneration. South Korea and the United Kingdom have developed porous carbon coatings and composite porous coatings [13,14]. These coatings have high specific surface area, fast adsorption rates, and excellent cyclic stability. Europe and the United States widely adopt high-precision deposition processes. These processes achieve uniform loading of porous materials [15,16]. However, these methods require expensive equipment and complex procedures. This limits their low-cost application in road engineering [17].
This study aims to develop an epoxy-based carbon-absorbing coating that integrates both CO2 adsorption functionality and pavement performance. Initially, nano-silica carriers were prepared, and a high-performance solid amine adsorbent was fabricated through carrier modification and optimized amine loading. Subsequently, a high specific surface area porous epoxy resin-based coating was constructed using the breath-figure method. The adsorbent was formulated into a spraying solution, and a high-performance carbon-absorbing coating was produced by regulating relevant spraying parameters. Finally, the coating’s skid resistance, adhesion, and durability in asphalt pavement applications were confirmed. Furthermore, its structural stability and functional retention were verified under simulated service conditions, providing a feasible solution for the engineered application of functional pavement materials.

2. Materials and Methods

2.1. Materials

2.1.1. Raw Materials

Two raw materials were used for coating preparation. These were epoxy resin and diethylenetriamine (curing agent). They were mixed at a mass ratio of 10:1. Table 1 summarizes the technical specifications of each raw material.

2.1.2. Functional Material

Nano-silica was prepared using the Stöber method. Tetraethyl orthosilicate (TEOS), ammonia, deionized water, and anhydrous ethanol were mixed at a ratio of 2:0.5:1:34 [18]. TEOS was stirred with anhydrous ethanol to form solution A, while ammonia and anhydrous ethanol were stirred to form solution B. Solution B was then added dropwise at a constant rate into solution A and stirred at 60 °C for 1.5 h. Subsequently, the mixture was vacuum-dried at 180 °C for 12 h to obtain the nano-silica carrier. The surface of nano-silica is rich in hydrophilic silanol groups. This causes easy agglomeration and poor compatibility with organic polymer materials. Therefore, the nano-silica was modified. Silane coupling agent modification significantly reduced the surface energy of nano-SiO2. It also improved the dispersion stability in the organic phase. The silane coupling agent and deionized water were stirred and mixed at room temperature, followed by the addition of anhydrous ethanol and the nano-silica carrier. The mixture was then subjected to condensation reflux at 60 °C for 3 h. Finally, the solution was filtered, washed, and dried to obtain the modified nano-silica [19]. Polyethyleneimine (PEI) was loaded onto the modified nano-silica using a physical impregnation method [20,21]. Polyethyleneimine was uniformly stirred with anhydrous ethanol, followed by the addition of modified nano-silica for impregnation over 10 h. The mixture was then dried at 60 °C for 24 h to obtain the amine-loaded adsorbent. This adsorbent served as the functional material in the coating formulation.

2.1.3. Coating Preparation

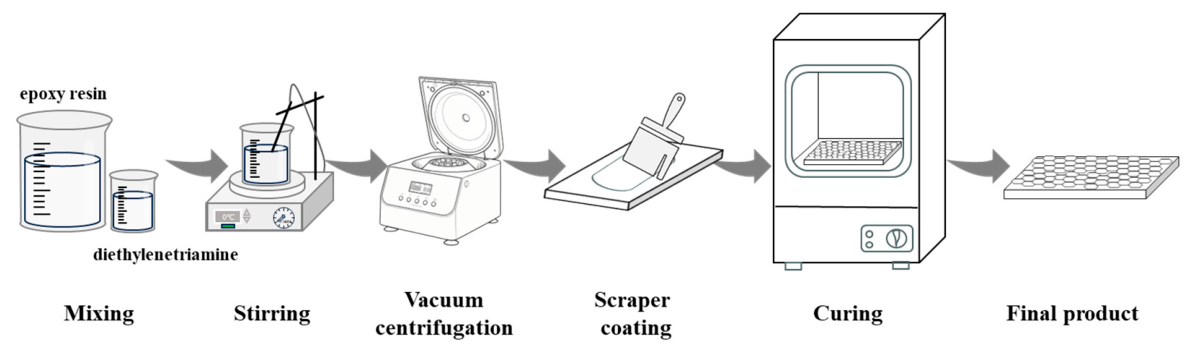
A porous coating was prepared using the breath-figure method [22,23]. The coating raw materials included epoxy resin and diethylenetriamine. The detailed preparation process is shown in Figure 1.
First, epoxy resin and diethylenetriamine were mixed at a mass ratio of 10:1. The mixture was stirred quickly to ensure uniformity. The mixed solution was promptly transferred to a centrifuge tube and centrifuged at 4000 rpm for 60 s to remove bubbles, thereby preventing pinhole defects in the coating [24]. After centrifugal deaeration, the resin was immediately poured onto a clean 100 mm × 100 mm glass slide and coated using a wire rod coater to control the film thickness at 10 μm. Subsequently, the slides were rapidly moved into a constant temperature and humidity chamber. Four humidity gradients (60%, 70%, 80%, and 90%) were set for 2 h curing to screen the optimal humidity condition. The humidity range was maintained at the optimal humidity ±5%, thereby completing the curing and pore formation. The slide was then taken out and allowed to stand still. Surface morphology was observed using an optical microscope.
After standing for 24 h, the coating was fully cured. The amine-loaded adsorbent was then dispersed in anhydrous ethanol. The dispersion was sprayed evenly onto the surface of the epoxy resin-based porous coating. A pneumatic spray gun was used for this step.

2.2. Methods

2.2.1. CO2 Absorption Capacity Test of the Coating

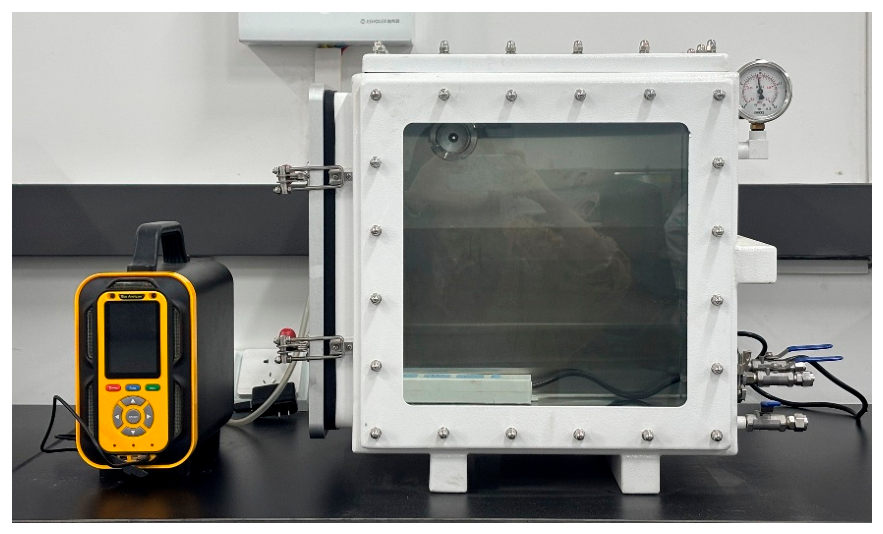
The CO2 adsorption efficiency of the coating was quantitatively evaluated using a self-built apparatus. A schematic diagram of the CO2 absorption device is shown in Figure 2. This test characterized the coating’s ability to capture and adsorb CO2 gas. The test system mainly consisted of two parts: a closed reaction chamber (42 L) and a CO2 gas analyzer. The test was conducted at ambient temperature and pressure. First, the sample to be tested was placed into the closed reaction chamber. The inlet and outlet valves were then opened. The gas analyzer was turned on to record the CO2 concentration inside the reaction chamber. Data were recorded every 5 min by the gas analyzer. The test lasted for 3 h. After the test, all valves were closed. The gas analyzer was connected to a data acquisition system. The test results were exported. Based on the test results, the carbon adsorption efficiency and adsorption capacity of the sample were calculated using Formulas (1) and (2), as follows:
Figure 2. Schematic diagram of the CO2 absorption device.
Applsci 16 07264 g002
η = C 0 C 1 C 0 × 100 %
q = C 0 C 1 × V m
where in η represents the carbon adsorption efficiency, q denotes the adsorption capacity, C0 is the molar concentration of carbon dioxide before the test, C1 is the molar concentration of carbon dioxide after the test, m is the mass of the carbon adsorption/sequestration adsorbent, and V is the volume of the vacuum-sealed chamber.

2.2.2. Water Resistance Test of the Coating

An epoxy resin-based porous coating was prepared following the procedure. The coating was allowed to stand for 24 h to fully cure. The adsorbent dispersion was then sprayed evenly onto the porous coating. To simulate wet pavement conditions, an immersion test was conducted. The Marshall specimen with the sprayed adsorbent was placed in a constant-temperature water tank at room temperature. The immersion lasted for 24 h or more [25]. After immersion, the specimen was taken out. The coating surface was examined for peeling, blistering, or bubbles. The adhesion condition of the adsorbent was also observed.

2.2.3. Skid Resistance Test of the Coating

A pendulum friction tester was used for the skid resistance test. Before the test, the tester was leveled. The bubble in the level gauge was centered. After leveling, zero adjustment was performed. The pendulum arm and the pointer were turned to the same side. The pendulum arm was then released. When the arm swung back, it was caught. The pointer position was checked to see if it was at zero. If not, the upper knob was adjusted. This operation was repeated twice until the pointer read zero both times. Next, the pendulum arm was kept in a vertical position. The height was adjusted so that the rubber slider was flush with the test surface. The two ends of the rubber slider were also aligned with the two ends of the specimen. To start the test, the pendulum arm and the pointer were turned to the same side. An appropriate amount of water was sprayed onto the test surface. The pendulum arm was released. The data were recorded. The first reading was discarded. The subsequent five readings were retained. Before each test, an appropriate amount of water was sprayed onto the test surface [26].

2.2.4. Adhesion Test of the Coating

The adhesion test was designed in accordance with the standard ASTM D4541-22, Standard Test Method for Pull-Off Strength of Coatings Using Portable Adhesion Testers [27]. First, a test dolly was attached to the coating surface using AB adhesive. The assembly was fixed for 24 h or more to reach maximum strength. After that, the test was performed. Before the test, a special cutting tool was used to score around the dolly. This defined the test area and prevented the surrounding coating from being pulled off, which could affect accuracy. The adhesion tester was then manually zeroed. The loading cylinder was assembled with the dolly. Manual pressure was applied until the coating detached from the specimen surface. Conduct the test four times and record the data.

3. Results and Discussion

3.1. Microscopic Characterization Results

3.1.1. Particle Size Analysis of Nano-Silica Before and After Modification

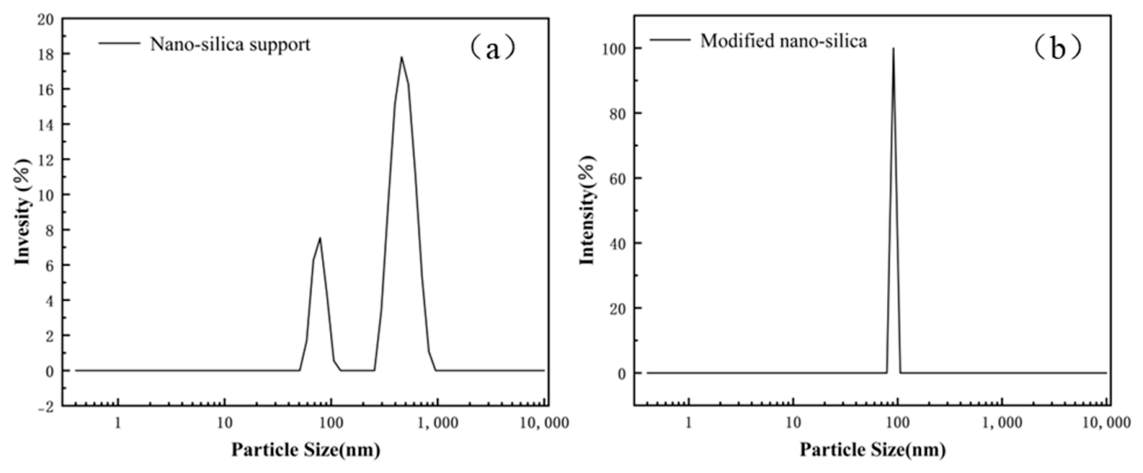
Figure 3 shows the particle size distribution of the nano-silica before and after modification. As shown in Figure 3a, the DLS image of the nano-silica support before modification exhibited two peaks, with the intensity of the large particle peak exceeding that of the small particle peak. The average particle size was 315 nm, indicating an uneven particle size distribution and severe agglomeration. In contrast, Figure 3b shows that the DLS image of the modified nano-silica displayed a single peak with a near-100% intensity, and the average particle size was 92 nm. This indicates that the particles were in a highly dispersed state in the solution, demonstrating the successful modification by the silane coupling agent.

3.1.2. SEM Analysis of the Amine-Loaded Adsorbent

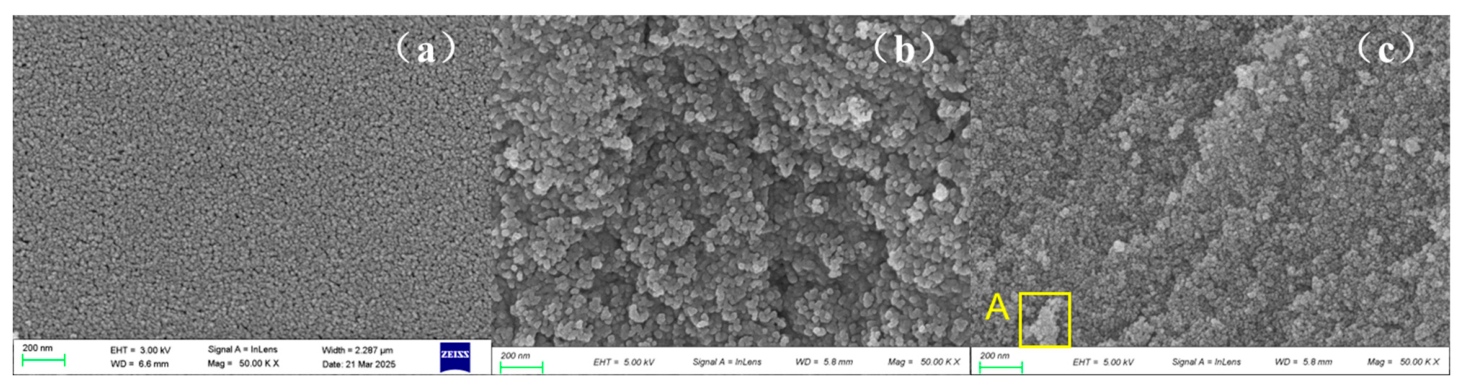
Figure 4 shows the microscopic images of the nano-silica support, the modified nano-silica, and the amine-loaded adsorbent. Figure 4a shows the nano-silica support. The particles are spherical or nearly spherical. The particle surfaces are relatively smooth. Some agglomeration can be seen in the image. This agglomeration occurs for two reasons. First, nano-silica has a very high specific surface area and high surface energy. To lower the surface energy, the particles spontaneously attract and aggregate with each other [28]. Second, the silica surface contains many silanol groups. These groups easily form hydrogen bonds. This leads to strong adhesion between particles. The introduction of the silane coupling agent KH-550 forms an organosilane layer on the silica surface. Figure 4b shows that no obvious coating layer or surface smoothing is observed. This indicates that the modification occurs mainly through chemical bonding, not physical wrapping. After modification, the particles remain in a nano-sized dispersed state. No serious sintering or melting is observed. Figure 4c shows the amine-loaded nano-silica. The morphology does not change significantly after amine loading. The surface roughness increases. The pores of the silica are filled. As shown in Figure (c), the flocculent agglomeration at position A is entirely attributed to the accumulation of amine molecules, thereby demonstrating the successful introduction of amine.

3.1.3. TG Analysis of the Amine-Loaded Adsorbent

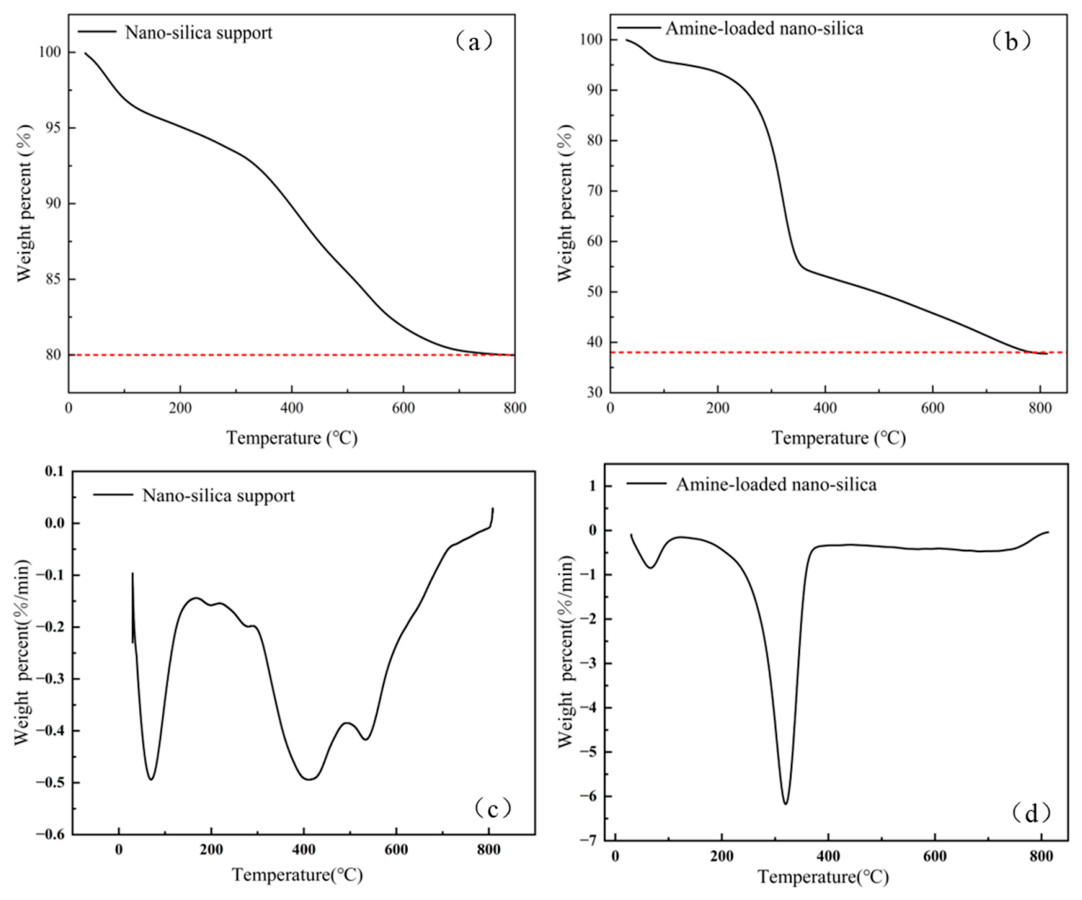
Figure 5 shows the thermogravimetric analysis curves of the nano-silica support and the amine-loaded nano-silica. In the temperature range from room temperature to 150 °C, both curves show a slight decrease. This decrease is caused by the desorption of physically adsorbed water. The silica surface contains many silanol groups. These groups make the surface highly hydrophilic. Therefore, the material easily absorbs moisture from the air [29]. From Figure 5a, the curve decreases slowly between 150 °C and 600 °C. In this range, the hydroxyl groups on the silica surface undergo condensation reactions. These reactions release water molecules. Between 600 °C and 800 °C, the curve becomes stable. This indicates that most volatile components have been removed. What remains is the highly stable silica framework. From Figure 5b, the curve shows a very steep decrease between 150 °C and 400 °C. This steep decrease is caused by the decomposition and volatilization of the loaded amine species. It also confirms that the amine has been successfully loaded onto the nano-silica support. Between 400 °C and 800 °C, the decreasing trend slows down, which may be due to further decomposition or carbonization of the residual amine or its decomposition products. It may also be due to the removal of hydroxyl groups from the support surface. The amine loading content was calculated from the mass difference between the two plateaus. The result is approximately 50%. As shown in Figure 5c, the nano-silica exhibits a peak corresponding to the removal of adsorbed water in the low-temperature region and presents a broad weight loss rate peak within the range of approximately 280–600 °C. This process is primarily attributed to the condensation–dehydration process of surface silanol groups and the decomposition of residual organic components. Figure 5d demonstrates that after amine loading, the sample exhibits a significantly enhanced DTG peak in the range of approximately 310–330 °C, with a maximum weight loss rate of approximately −6.2%/min, which is markedly higher than that of the silica support. This peak is mainly assigned to the thermal decomposition of the loaded amine components. The significant difference in thermal decomposition before and after loading indicates that the amine component has been successfully introduced onto the surface of the nano-silica.

3.1.4. FTIR Analysis of the Amine-Loaded Adsorbent

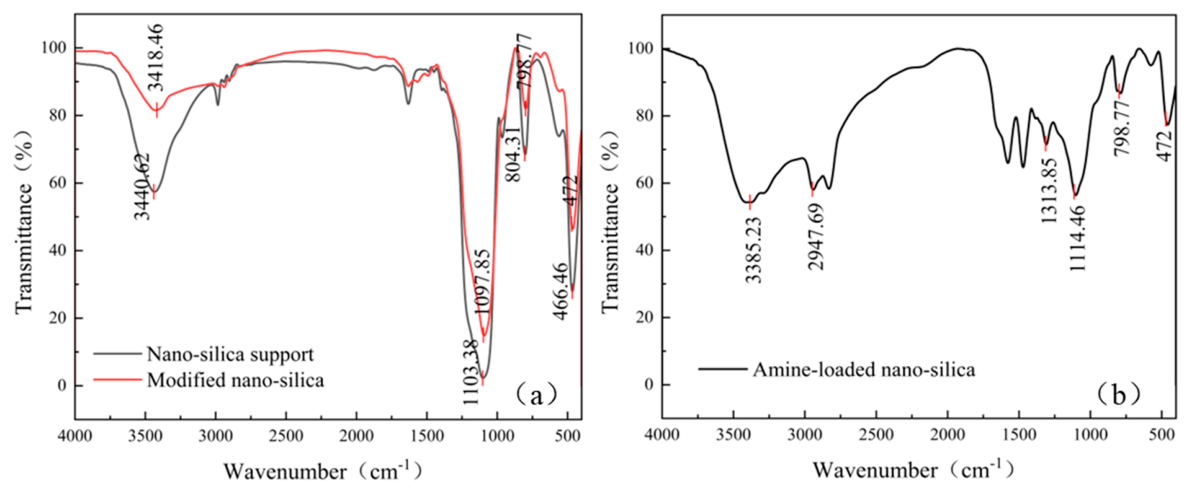
Figure 6 shows the infrared spectra of the nano-silica support, the modified nano-silica, and the amine-loaded nano-silica. In Figure 6a, the characteristic peak at 1103 cm−1 is caused by the asymmetric stretching vibration of Si–O–Si. This peak is the core feature of the three-dimensional silica network framework. The peaks at 804 cm−1 and 466 cm−1 are caused by the symmetric stretching vibration of Si–O–Si and the bending vibration of O–Si–O. These peaks are characteristic vibrations of the silica lattice and the tetrahedral structure of silica. The peak at 3440 cm−1 is the characteristic peak of silanol groups on the silica surface. Comparing the spectra before and after modification, the transmittance increases after modification. This increase occurs because the silanol groups on the silica surface are connected to the inorganic-affinity end groups of the silane coupling agent molecules. The original hydrogen-bonding connections between particles are blocked. As a result, the particles remain dispersed. This leads to higher transmittance [19]. In Figure 6b, the peaks at 1114 cm−1, 798 cm−1, and 472 cm−1 correspond to the characteristic peaks of the silica framework. The peak at 2947 cm−1 is a C–H absorption peak. This indicates that the nano-silica surface has been covered with the organic long chains of the silane coupling agent. The peak at 1313 cm−1 is caused by C–N stretching vibration or CH2 rocking vibration. This is a common feature in amine molecules. The peak at 3385 cm−1 is the N–H stretching vibration peak. This confirms that active amino groups have been successfully introduced [30].

3.1.5. XRD Analysis of the Amine-Loaded Adsorbent

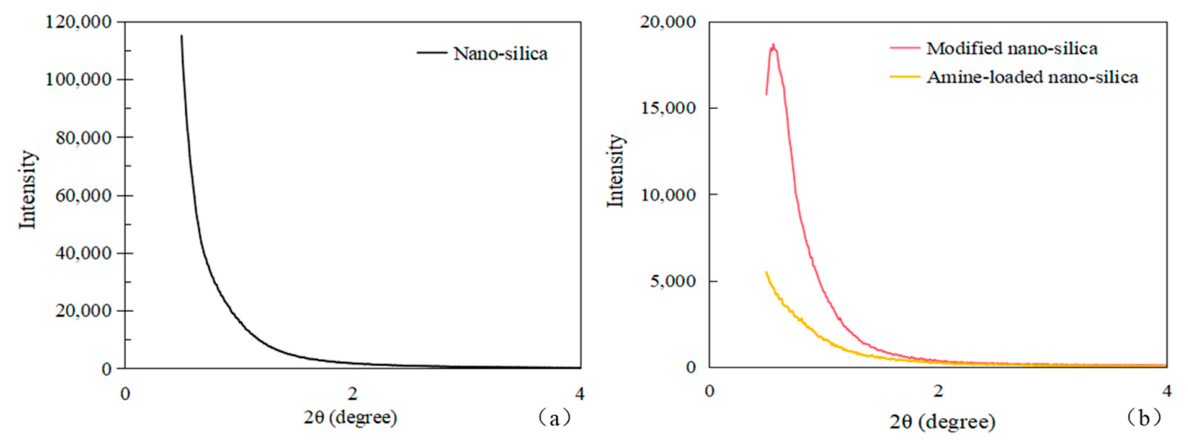
Figure 7 shows the X-ray diffraction patterns of the nano-silica support, the modified nano-silica, and the amine-loaded nano-silica. In Figure 7a, the XRD curve of the nano-silica support shows a very strong and sharp diffraction peak at a very small angle. As the angle increases, the intensity gradually decreases and then becomes flat. This pattern is a typical feature of mesoporous materials. The peak is sharp and high in intensity. This indicates that the pore channels of the support are highly ordered and well-arranged. In Figure 7b, the intensity of modified nano-silica is lower than that before modification, and the peak becomes slightly broader. The presence of the peak indicates that the modification process does not destroy the silica framework or the mesoporous ordering; the ordered structure is thus preserved. The significant decrease in intensity is caused by the grafting of organic functional groups inside the pore channels, which reduces the electron density contrast between the pore interior and the pore walls. For amine-loaded nano-silica, the characteristic low-angle peak has completely disappeared, and the curve is relatively smooth. This disappearance means that the long-range ordering of the nano-silica support is lost, and the electron density contrast becomes very weak. This is attributed to the high amine loading, which blocks the pores, disrupts the original mesoporous arrangement, breaks the ordered structure, and, in some cases, leads to pore blockage or collapse [31].

3.1.6. BET Analysis of the Amine-Loaded Adsorbent

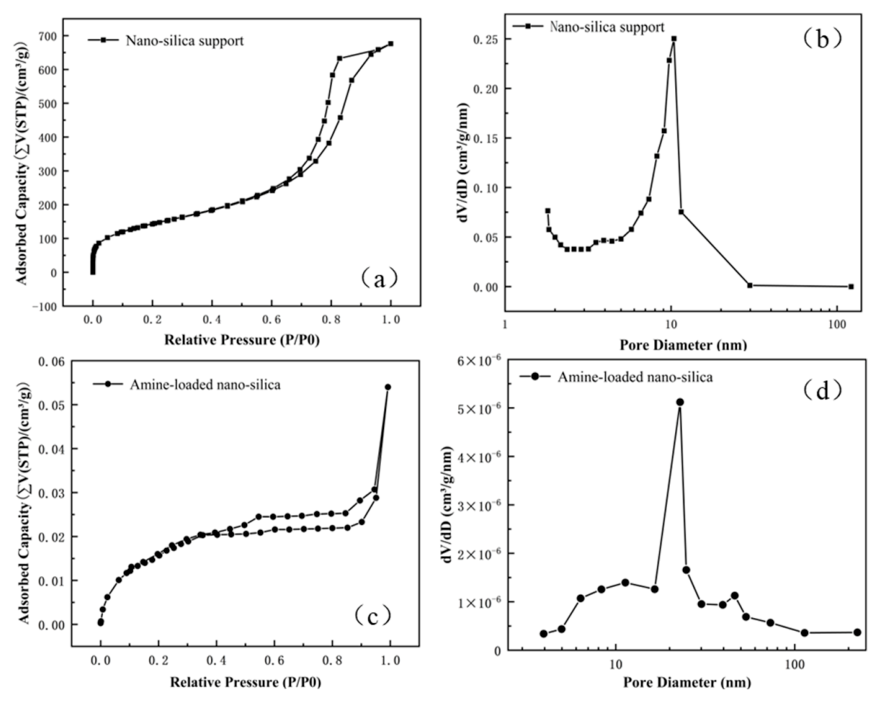
Figure 8 presents the BET isotherms and pore size distributions of the nano-silica carrier and the amine-loaded nano-silica. As shown in Figure 8a, the nitrogen adsorption–desorption isotherm of the nano-silica carrier overall exhibits typical type IV characteristics. With the increase in relative pressure, the adsorption capacity gradually rises, and a distinct adsorption–desorption hysteresis loop appears within the range of approximately P/P0 = 0.75–0.95, indicating the presence of well-developed mesoporous structures inside the material. The shape of this hysteresis loop is somewhat asymmetric, predominantly resembling the H2 type. The pore size distribution results in Figure 8b show that the pore size of the nano-silica carrier is mainly concentrated around 10–12 nm, with a small amount of micropores existing in the 2–3 nm range, suggesting that the carrier possesses a certain hierarchical pore structure. Figure 8c,d demonstrate that after amine loading, both the nitrogen adsorption capacity and the hysteresis loop of the material significantly decrease, indicating that the amine components cover the silica surface, enter or occupy part of the pore channels, thereby causing a marked reduction in specific surface area and pore volume. The original main peak at 10–12 nm in the pore size distribution curve is obviously weakened or disappears, retaining only a weak residual pore peak, which indicates that the original mesopores are significantly occupied by the amine components. These results are consistent with the phenomenon of successful amine loading and the resultant blockage of the pore channels.

3.1.7. Microscopic Morphology Analysis of the Epoxy Resin-Based Porous Coating

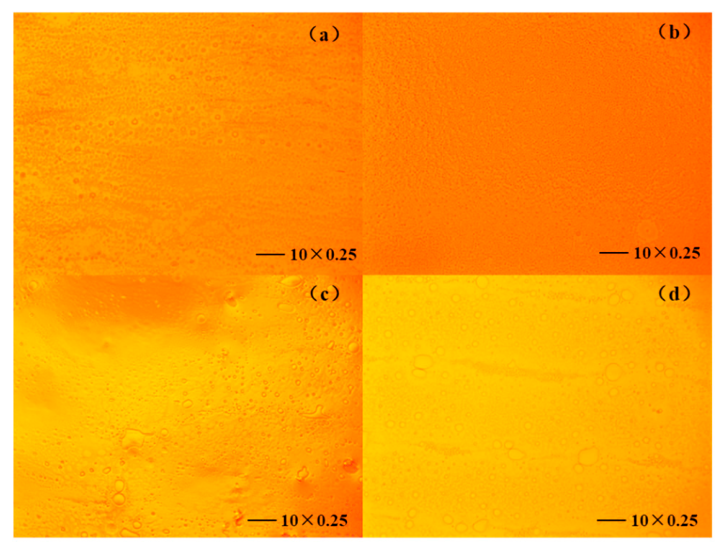
The epoxy resin-based coatings were placed under different humidity conditions. The humidity levels were 60%, 70%, 80%, and 90%. The coatings were cured for 2 h under each condition. After curing, the coatings were taken out. Their surface morphologies were then observed under a microscope.
As shown in Figure 9, panels (a), (b), (c), and (d) show the pore formation under humidity levels of 60%, 70%, 80%, and 90%, respectively. Under 60% and 70% humidity, the pore-formation rate increased with humidity. The pore regularity also improved. However, from 70% to 90% humidity, the pore-formation rate decreased. Regular pore structures were observed only at 70% humidity. A possible explanation is as follows. At 60% humidity, the moisture condensation is insufficient. This leads to a low pore-formation rate and small pore sizes. At 80–90% humidity, the humidity is too high. Droplets coalesce, causing uneven pore sizes and pore structure collapse. As a result, the pore-formation rate declines. Therefore, 70% humidity is identified as the optimal curing humidity for the epoxy resin-based coating.

3.2. CO2 Absorption Capacity of the Coating

3.2.1. Effect of Adsorbent Concentration on the CO2 Absorption Performance of the Coating

The effect of different adsorbent dispersion concentrations on the CO2 absorption performance was investigated. Anhydrous ethanol and the adsorbent were mixed at ratios of 20:1, 30:1, 40:1, and 50:1. PVP K30 was added as a dispersant. These mixtures formed adsorbent dispersions at different concentrations. Each dispersion was sprayed evenly onto the coating using a spray gun. The spraying was performed in small amounts and repeated several times. After spraying, the coated samples were placed in a vacuum chamber. Their CO2 absorption performance was then tested.
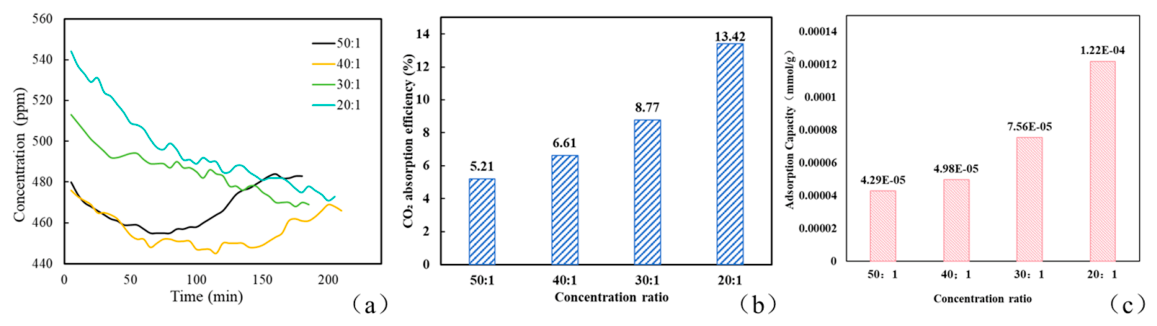
As shown in Figure 10, the adsorbent mass was fixed at 1 g. For ethanol-to-adsorbent ratios of 50:1 and 40:1, the absorption curves first decreased and then increased. For ratios of 30:1 and 20:1, the curves showed a continuous decrease. These results are explained as follows. When too much solvent is used, the coating becomes too thin. This leads to fewer adsorption sites. These sites are fully exposed and become saturated quickly. After surface sites are saturated, CO2 molecules with weak binding forces are easily desorbed under air flow. As the ethanol-to-adsorbent ratio increases, the CO2 absorption efficiency gradually decreases. The highest absorption efficiency is observed at the ratio of 20:1. Figure 10c shows that the CO2 adsorption capacity increased as the ethanol-to-adsorbent ratio decreased, reaching a maximum of 1.22 × 10⁻⁴ mmol/g at 20:1, approximately 2.84 times that at 50:1. This indicates that a lower ethanol content improves the utilization of adsorption sites.

3.2.2. Effect of Adsorbent Spraying Amount on the CO2 Absorption Performance of the Coating

Epoxy resin-based porous coatings were prepared on glass slides of the same size. After the coatings solidified, the adsorbent was mixed with anhydrous ethanol at a ratio of 20:1. Three different amounts of adsorbent (0.5 g, 1 g, and 1.5 g) were used to prepare the dispersions. Each dispersion was sprayed evenly onto the coating. After drying, the CO2 absorption performance was tested.
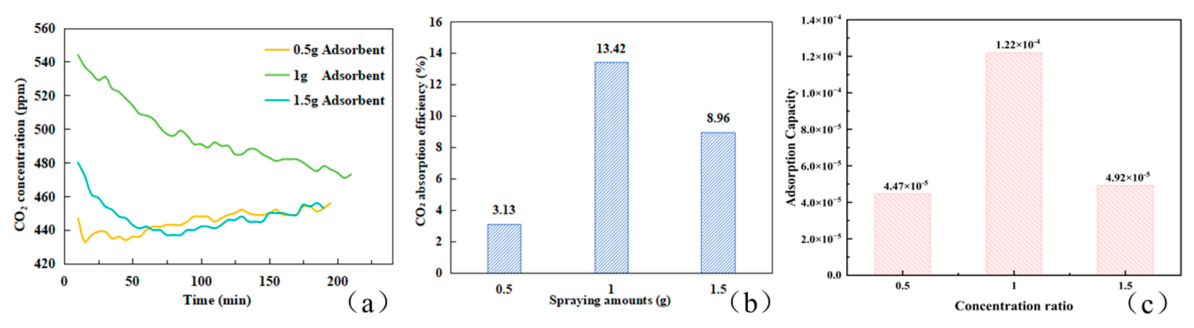
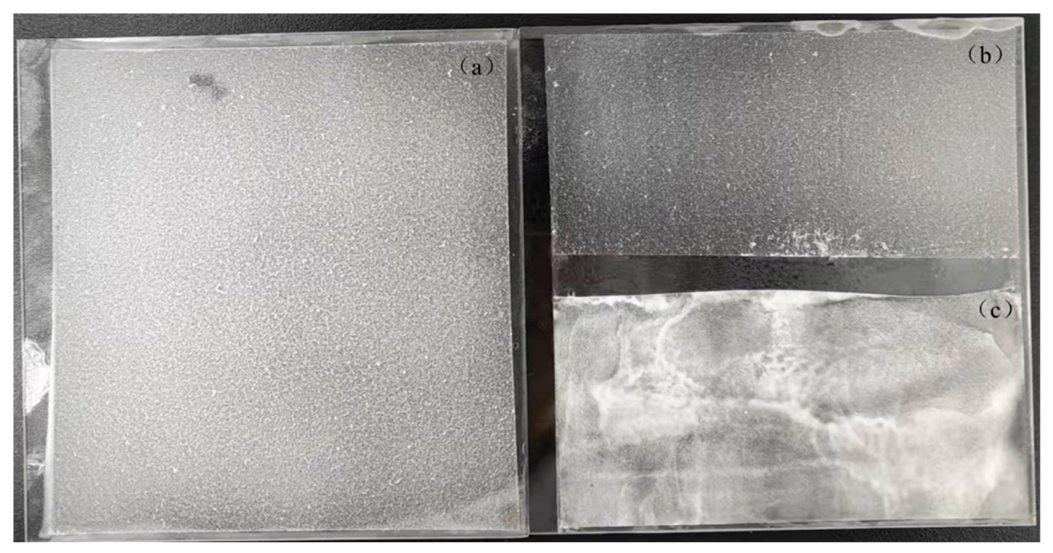
As shown in Figure 11 and Figure 12, when the spraying amount was too high, visible agglomeration of the adsorbent occurred. The agglomeration reduced the CO2 absorption capacity. As a result, the absorption efficiency decreased. When the spraying amount was too low, the adsorbent layer was thin. The number of surface adsorption sites was small. The initial absorption rate was very fast, but the coating became saturated easily. Under air flow disturbance, CO2 molecules with weak binding forces were easily desorbed. This caused the CO2 concentration to rise again. A spraying amount of 1 g was considered moderate. At this amount, the absorption capacity and efficiency were the highest. The adsorbent distribution on the surface was relatively uniform, and no agglomeration was observed. The third panel further shows that the adsorption capacity reached a maximum of 1.22 × 10⁻⁴ mmol/g at a spraying amount of 1 g, which was significantly higher than those at 0.5 and 1.5 g. This confirms that 1 g was the optimal spraying amount.

3.2.3. Effect of Spraying Distance on the Uniformity of the Sprayed Coating

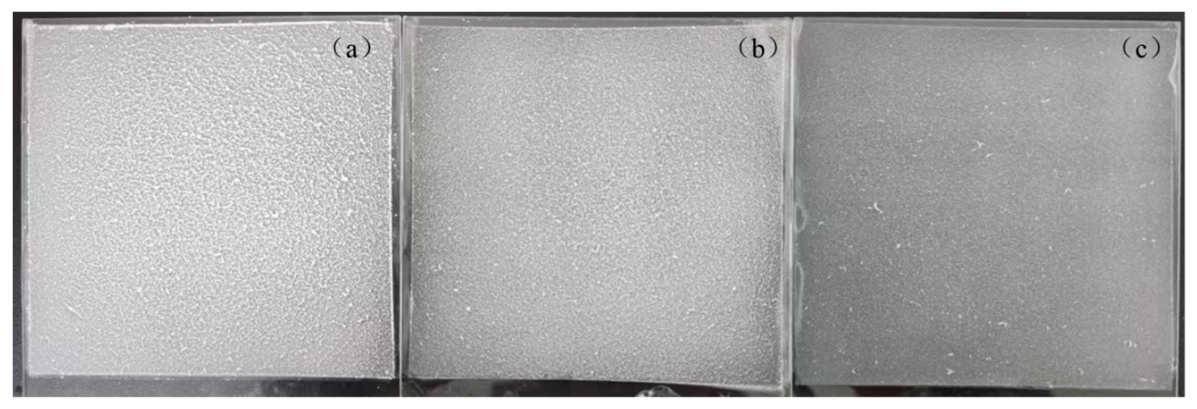
As shown in Figure 13, panel (a) represents a moderate spraying distance, panel (b) represents a distance that is too far, and panel (c) represents a distance that is too close. When the spraying distance is too close, the air flow disrupts the already sprayed adsorbent structure. At the same time, the short distance prevents the sprayed dispersion from drying and solidifying quickly. This leads to large areas of liquefaction. Consequently, the adsorbent is sprayed unevenly. When the spraying distance is too far, the air flow expands like a cone. As a result, a large amount of adsorbent is sprayed outside the target coating area. This causes significant material loss.

3.3. Pavement Performance

3.3.1. Water Resistance

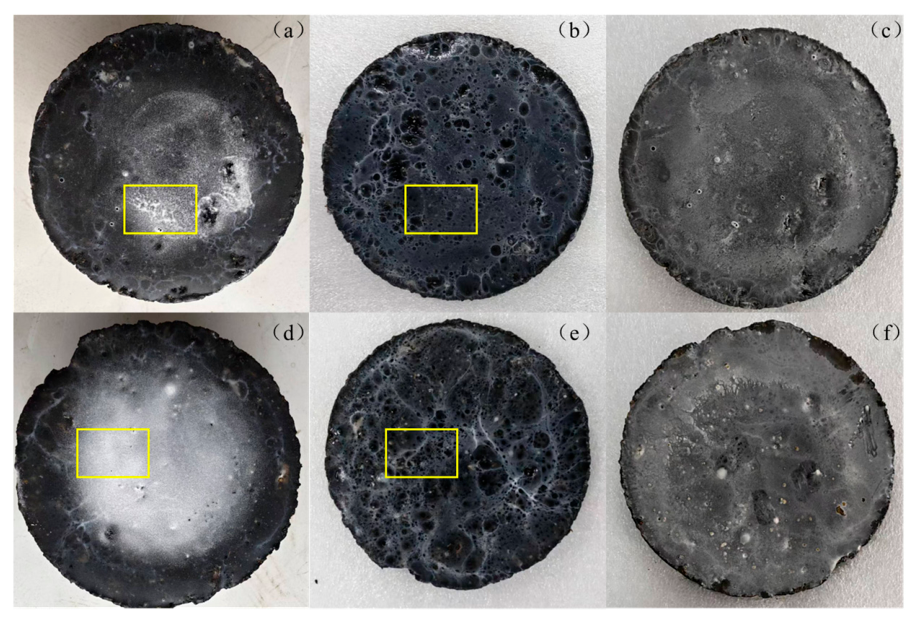
As shown in Figure 14, panels (a) and (d) show the coating before immersion. Panels (b) and (e) show the coating after immersion. Panels (c) and (f) show the coating after drying. As shown in Figures (a) and (d), before water immersion, the adsorbent was primarily dispersed on the coating surface in the form of fine particles. After water immersion, as observed in Figures (b) and (e), adsorbent particles were present within the pores, particle boundaries, and reticular textures highlighted in yellow. No through-cracks, extensive pore connectivity, or obvious interfacial debonding were observed in the coating matrix, indicating that water ingress did not cause significant damage to the coating structure. Furthermore, the loss of adsorbent on the coating surface after immersion was attributed to the detachment of the topmost loose particles. After drying, the adsorbent still appeared as a uniformly distributed powder. No caking or agglomeration occurred. These observations indicate that the coating has good water resistance.

3.3.2. Skid Resistance

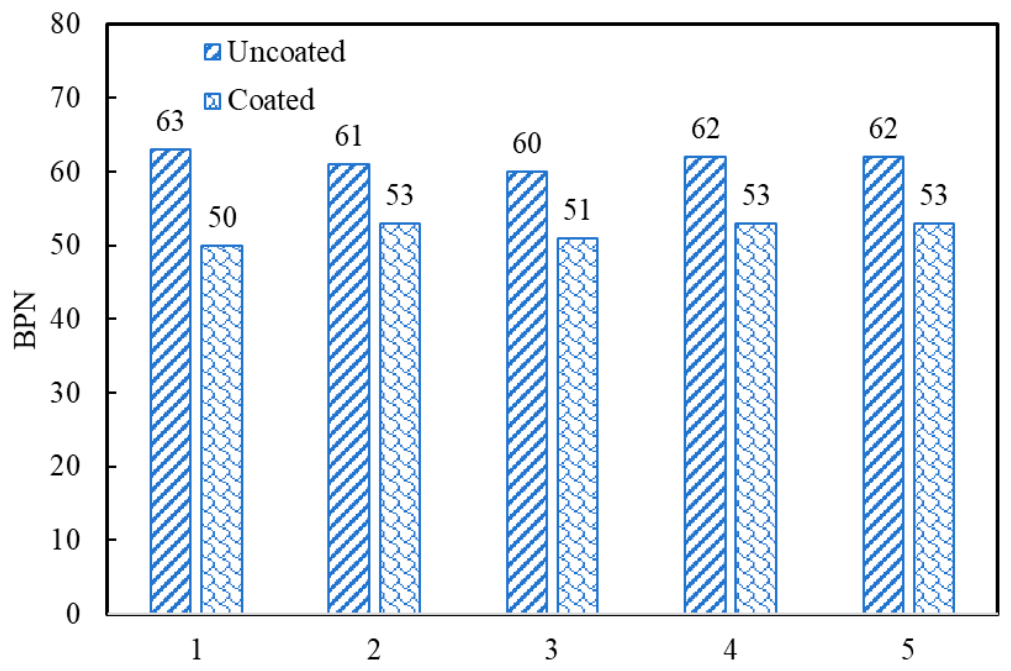
As shown in Figure 15, the average skid resistance value of the Marshall specimen with the coating is 52. The average value of the specimen without the coating is 61.6. The surface friction coefficient of the coated specimen is lower than that of the uncoated specimen. However, the BPN value remains above the minimum requirement specified in the Technical Specification for Maintenance of Highway Asphalt Pavement (JTG5142-2019) [26]. That minimum value is 45. Therefore, the coating has a small effect on the friction coefficient. Its skid resistance is considered good.

3.3.3. Adhesion Performance of the Coating

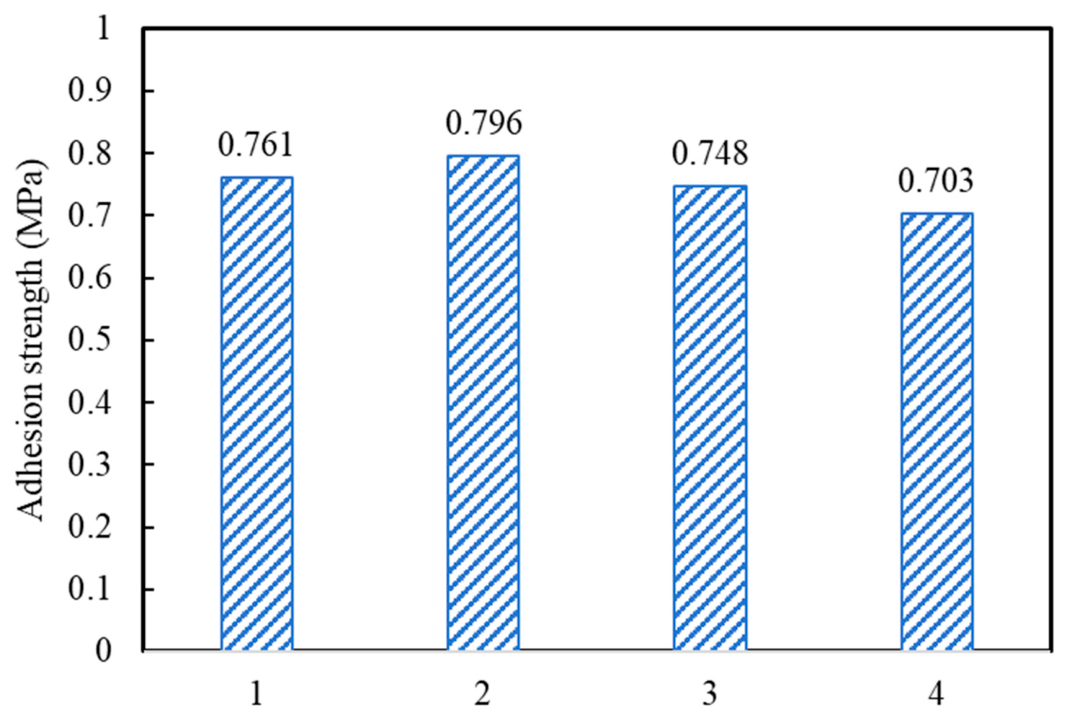
As shown in Figure 16 and Table 2, the adhesion strength of the coating ranges from 0.703 to 0.796 MPa. The average value is 0.752 MPa. The coating in this study is a functional gas adsorption coating. The required adhesion strength for such a coating is 0.3 MPa. All parallel experimental groups in this study meet this requirement. Therefore, the adhesion performance of the coating is considered excellent.

4. Conclusions

This study systematically investigated the preparation, structure, CO2 absorption performance, and pavement performance of an epoxy resin-based porous carbon-absorbing coating. Through material modification and process optimization, the coating achieved a synergistic improvement in both carbon absorption function and pavement performance. The main conclusions are as follows:
(1) The modified nano-silica exhibits well-ordered pore structure, high specific surface area, significantly reduced agglomeration, and improved dispersibility, while maintaining an intact framework. It serves as a high-quality support for subsequent amine functionalization.
(2) The amine loading reaches approximately 50%, successfully introducing amino groups and forming a hierarchical pore structure. This structure provides abundant active sites and diffusion channels, leading to excellent CO2 absorption performance.
(3) An ordered honeycomb-like porous coating is prepared using the breath-figure method under 70% humidity, which is suitable for adsorbent loading. With an optimized spraying process, the adsorbent is uniformly dispersed, resulting in significantly enhanced CO2 absorption capacity and structural stability of the coating.
(4) The porous carbon-absorbing epoxy coating not only endows the pavement with excellent service performance but also has a minimal impact on skid resistance. The coating demonstrates superior interfacial adhesion strength and water resistance stability, capable of maintaining long-term performance in an asphalt pavement environment, thus exhibiting reliable structural durability.

Author Contributions

Conceptualization, S.H. and X.C.; methodology, S.H., L.Z. and H.M.; software, L.Z. and H.M.; validation, Y.X., F.W. and M.H.A.M.; formal analysis, S.H. and F.W.; investigation, S.H., H.M. and Y.X.; resources, X.C. and M.H.A.M.; data curation, L.Z. and F.W.; writing—original draft preparation, S.H.; writing—review and editing, F.W., M.H.A.M., X.C. and Y.X.; visualization, H.M. and F.W.; supervision, X.C.; project administration, F.W.; funding acquisition, Y.X. All authors have read and agreed to the published version of the manuscript.

Funding

This work was supported by the National Natural Science Foundation of China (grant numbers: 52408455 and 52378460), the Fundamental Research Funds for the Central Universities, CHD, the Postdoctoral Fellowship Program of CPSF (grant number: GZC20251134), and the Program Fund of Non-Metallic Excellence and Innovation Center for Building Materials (grant number: 24TDA-3).

Institutional Review Board Statement

Not applicable.

Informed Consent Statement

Not applicable.

Data Availability Statement

The original contributions presented in this study are included in the article. Further inquiries can be directed to the corresponding author.

Conflicts of Interest

Author Mohammed H. Al Mehthel was employed by the company Saudi Arabian Oil Company. The remaining authors declare that the research was conducted in the absence of any commercial or financial relationships that could be construed as a potential conflict of interest.

References

  1. Jia, H.Y.; Ma, T.Y.; Sun, C.Z.; Li, F.H.; Xu, Z.; Zheng, S.X. Application of Green and Low-Carbon Technologies in Bridge Engineering: A Review. J. Southwest Jiaotong Univ. 2026, 61, 931–953. [Google Scholar]
  2. Li, Q.S.; Zhang, H.L.; Chu, F.S.; Li, J.C.; Feng, J.R.; Du, P.F. A polymeric cationic asphalt emulsifier for low-carbon and renewable pavements: Investigating its dual effects of modification and emulsification on asphalt. Constr. Build. Mater. 2025, 487, 142132. [Google Scholar] [CrossRef]
  3. Ahmed, S.; Baig, M.G. Warm mix asphalt for low carbon road construction: A systematic review of technologies, performance and sustainability impacts. Innov. Infrastruct. Solut. 2026, 11, 138. [Google Scholar] [CrossRef]
  4. Liang, X.M.; Wei, Y.C.; Yu, X.; Xiao, J.Z.; Huang, L.J.; Huang, J.H. Low-carbon and environmentally friendly cold mix asphalt and mixtures: Performance and future prospects. Int. J. Pavement Eng. 2025, 26, 2588816. [Google Scholar] [CrossRef]
  5. Editorial Department of China Journal of Highway Transport. Review on China’s Pavement Engineering Research: 2024. China J. Highw. Transp. 2024, 37, 1–81. [Google Scholar]
  6. Yu, W.; Gao, M.; Rim, G.; Rivers, M.L.; Alahmed, A.; Jamal, A.; Park, A.H.A. Novel in-capsule synthesis of metal-organic framework for innovative carbon dioxide capture system. Green Energy Environ. 2023, 8, 767–774. [Google Scholar] [CrossRef]
  7. Gallo, M.; Ronchetti, S.; Onida, B.; Manna, L. The impregnation of mesoporous silica with diaminohexane by means of supercritical CO2: A possible CO2 solid sorbent. J. CO2 Util. 2025, 101, 103207. [Google Scholar] [CrossRef]
  8. Feng, Q.; Wei, F.S.; Chen, Z.L.; Huang, Z.B.; Hu, H.C.; Liang, F.P.; Liu, D.C. Mesoporous silica-based catalysts for photocatalytic CO2 reduction. Microporous Mesoporous Mater. 2024, 366, 112947. [Google Scholar] [CrossRef]
  9. Huang, S.T.; Hu, M.; He, L.H.; Ren, S.J.; Wu, X.D.; Cui, S. Construction of manganese ferrite/zinc ferrite anchored graphene-based hierarchical aerogel photocatalysts following Z-scheme electron transfer for visible-light-driven carbon dioxide reduction. J. Colloid. Interface Sci. 2025, 694, 137678. [Google Scholar] [CrossRef]
  10. Han, L.; Wang, X.; Wu, B.; Zhu, S.; Wang, J.X.; Zhang, Y. In-situ synthesis of zeolite X in foam geopolymer as a CO2 adsorbent. J. Clean. Prod. 2022, 372, 133591. [Google Scholar] [CrossRef]
  11. Jin, H.; Fan, Y.; Ni, S.B.; Zhao, B.Y.; Teng, Q.Q.; Zhou, S.D.; Yang, C.R.; Meng, Q.; Wang, S.Y.; Zhou, A.G. Design and preparation of novel diamine-grafted solid amine adsorbent for efficient carbon dioxide capture from air. Chem. Eng. J. 2025, 516, 164197. [Google Scholar] [CrossRef]
  12. Panda, D.; Kulkarni, V.; Singh, S.K. Evaluation of amine-based solid adsorbents for direct air capture: A critical review. React. Chem. Eng. 2022, 8, 10–40. [Google Scholar] [CrossRef]
  13. Jang, E.; Choi, S.W.; Lee, K.B. Effect of carbonization temperature on the physical properties and CO2 adsorption behavior of petroleum coke-derived porous carbon. Fuel 2019, 248, 85–92. [Google Scholar] [CrossRef]
  14. Vorokhta, M.; Kusdhany, M.I.M.; Švábová, M.; Nishihara, M.; Sasaki, K.; Lyth, S.M. Hierarchically porous carbon foams coated with carbon nitride: Insights into adsorbents for pre-combustion and post-combustion CO2 separation. Sep. Purif. Technol. 2025, 354, 129054. [Google Scholar] [CrossRef]
  15. Piechulla, P.M.; Chen, M.L.; Goulas, A.; Puurunen, R.L.; van Ommen, J.R. Atomic Layer Deposition on Particulate Materials from 1988 through 2023: A Quantitative Review of Technologies, Materials, and Applications. Chem. Mater. 2026, 38, 20–86. [Google Scholar] [PubMed]
  16. Chen, M.; Nijboer, M.P.; Kovalgin, A.Y.; Nijmeijer, A.; Roozeboom, F.; Luiten-Olieman, M.W.J. Atmospheric-pressure atomic layer deposition: Recent applications and new emerging applications in high-porosity/3D materials. Dalton Trans. 2023, 52, 10254–10277. [Google Scholar] [CrossRef] [PubMed]
  17. Jeong, H.; Park, G.; Jeon, J.; Park, S.S. Fabricating Large-Area Thin Films of 2D Conductive Metal-Organic Frameworks. Acc. Chem. Res. 2024, 57, 2336–2346. [Google Scholar] [CrossRef] [PubMed]
  18. Wei, F.; Li, Y.H.; Zhang, Z.Q. Study on Preparation and Properties of Nano Silica by Sol Gel Method. Shandong Chem. Ind. 2024, 53, 13–16. [Google Scholar]
  19. Liu, B.W.; Jiao, L.; Yan, C.H.; Hu, Z.B.; Wang, Q.C.; Wei, Y.; Zhang, Q.; Wang, H. Preparation and evaluation of nano silica modified by silane coupling agent KH-550. Appl. Chem. Ind. 2023, 52, 1367–1370. [Google Scholar]
  20. Srivatsa, S.C.; Bhattacharya, S. Amine-based CO2 capture sorbents: A potential CO2 hydrogenation catalyst. J. CO2 Util. 2018, 26, 397–407. [Google Scholar] [CrossRef]
  21. Lei, T.; Yu, S.N.; Zhou, C.A.; Song, L.; Ma, K.; Li, Z.P.; Yue, H.R. Research progress on the shaping technology of solid amine adsorbents for CO2 capture by adsorption method. Chem. Ind. Eng. Prog. 2022, 41, 6213–6225. [Google Scholar]
  22. Escalé, P.; Rubatat, L.; Billon, L.; Save, M. Recent advances in honeycomb-structured porous polymer films prepared via breath figures. Eur. Polym. J. 2012, 48, 1001–1025. [Google Scholar] [CrossRef]
  23. Soldatov, M.A.; Parshina, M.S.; Makarova, V.V.; Serenko, O.A.; Muzafarov, A.M. Fabrication of thermally stable porous films from a cured epoxy resin via the Breath Figures process. J. Coat. Technol. Res. 2017, 15, 159–164. [Google Scholar] [CrossRef]
  24. Zhao, S.R.; Shen, T.; Li, Y.T.; Deng, R.; Yang, H.C.; Li, W.H. Epoxy-resin-based Slippery Liquid Infused Anti-icing Coating Based on Breath Figure. Acta Polym. Sin. 2021, 52, 1622–1631. [Google Scholar]
  25. GA/T 298-2001; Pavement Marking Paint. Standard Press of China: Beijing, China, 2001.
  26. JTG3450—2019; Field Test Methods of Highway Subgrade and Pavement. People’s Communications Publishing House: Beijing, China, 2019.
  27. D4541-09; Standard Test Method for Pull-Off Strength of Coatings Using Portable Adhesion Testers. ASTM International: West Conshohocken, PA, USA, 2009.
  28. Ghamarpoor, R.; Jamshidi, M. Synthesis of vinyl-based silica nanoparticles by sol-gel method and their influences on network microstructure and dynamic mechanical properties of nitrile rubber nanocomposites. Sci. Rep. 2022, 12, 15286. [Google Scholar] [CrossRef] [PubMed]
  29. Liu, H.R.; Liang, Z.H.; Wang, S.Y.; Ma, N.F.; Chen, S.X. Synthesis and characterization of a thermosensitive solid amine biomass adsorbent for carbon dioxide adsorption. J. Environ. Manag. 2021, 292, 112722. [Google Scholar] [CrossRef]
  30. Liu, L.; Gao, T.; Fu, J.W.; He, G.L.; Gao, Q.J.; Tian, H. Moisture-enhanced carbon dioxide capture on heterocyclic amine-functionalized solid sorbent. Sep. Purif. Technol. 2026, 394, 137420. [Google Scholar] [CrossRef]
  31. Li, X.Y.; Peng, K.; Zhao, X.Q.; Zhao, K.P.; Li, H.R.; Zhao, Y.R.; Zhang, B. Amine-functionalized mesoporous silica derived from natural phyllosilicate for efficient CO2 adsorption. Appl. Clay Sci. 2024, 256, 107433. [Google Scholar] [CrossRef]
Figure 1. Preparation process of the epoxy resin-based porous coating.
Applsci 16 07264 g001
Figure 3. Dynamic light scattering (DLS) images of (a) nano-silica support and (b) modified nano-silica.
Applsci 16 07264 g003
Figure 4. Microscopic images of (a) nano-silica support, (b) modified nano-silica, and (c) amine-loaded nano-silica.
Applsci 16 07264 g004
Figure 5. TG curves (a,b) and DTG curves (c,d) of the nano-silica support and amine-loaded nano-silica.
Applsci 16 07264 g005
Figure 6. Infrared spectra of (a) the nano-silica support, modified nano-silica, and (b) amine-loaded nano-silica.
Applsci 16 07264 g006
Figure 7. X-ray diffraction patterns of (a) nano-silica, (b) the modified nano-silica, and the amine-loaded nano-silica.
Applsci 16 07264 g007
Figure 8. Nano-silica support and amine-loaded nano-silica: (a,c) BET isotherms and (b,d) pore diameter distributions.
Applsci 16 07264 g008
Figure 9. Microscopic images of coatings prepared under different humidity conditions: (a) 60%; (b) 70%; (c) 80%; (d) 90%.
Applsci 16 07264 g009
Figure 10. CO2 absorption curves (a), absorption efficiencies (b), and adsorption capacities (c) of coatings with different adsorbent concentrations.
Applsci 16 07264 g010
Figure 11. Comparison of the effects of different adsorbent dosages: (a) 0.5 g; (b) 1 g; (c) 1.5 g.
Applsci 16 07264 g011
Figure 12. CO2 absorption curves (a), absorption efficiencies (b), and adsorption capacities (c) for different spraying amounts.
Applsci 16 07264 g012
Figure 13. Coating uniformity at different spraying distances: (a) moderate distance; (b) relatively far distance; (c) relatively close distance.
Applsci 16 07264 g013
Figure 14. Morphology of the coating before and after the immersion test: (a,d): Coating before immersion; (b,e): Coating after immersion; (c,f): Coating after drying.
Applsci 16 07264 g014
Figure 15. Comparison of friction coefficients with and without the coating.
Applsci 16 07264 g015
Figure 16. Adhesion Strength of the Coating.
Applsci 16 07264 g016
Table 1. Technical parameters of raw materials.
Raw MaterialDensity
(g/cm3)
Viscosity
(mPa·s, 25 °C)
Epoxy Equivalent (g/mol)Refractive Index
(%, 20 °C)
Softening Point (°C)
Epoxy resin6000–10,000210–23014–23
Diethylenetriamine0.958–0.964141.482–1.486
Table 2. Detachment force and adhesion strength values of the coating.
Group1234
Detachment force (KN)0.2390.2500.2350.221
Adhesion strength (MPa)0.7610.7960.7480.703
Disclaimer/Publisher’s Note: The statements, opinions and data contained in all publications are solely those of the individual author(s) and contributor(s) and not of MDPI and/or the editor(s). MDPI and/or the editor(s) disclaim responsibility for any injury to people or property resulting from any ideas, methods, instructions or products referred to in the content.