1. Introduction
As an important branch of modern engineering technology, micro aeroengines have witnessed an expanding scope of applications and growing market demand. In particular, unmanned aerial vehicles (UAVs) and small aircraft urgently require such efficient and lightweight power sources. In the military field, micro aeroengines have been widely applied in new weapon systems such as unmanned reconnaissance aircraft and unmanned combat aerial vehicles. Their small size, light weight and low noise enable them to adapt to complex and variable battlefield environments and improve operational efficiency. In the civil field, micro aeroengines also show broad application prospects. Most UAVs used in agriculture, logistics, disaster relief and other industries adopt micro aeroengines as their power source, whose performance directly affects the working efficiency and operating radius of UAVs [
1,
2].
In aeroengines, fuel must first undergo atomization and evaporation and then be fully mixed with air before entering the combustion chamber for combustion. In micro aeroengines, evaporation tubes are mostly adopted for fuel supply, and the fuel atomization and evaporation effect of evaporation tubes has a significant influence on the combustion performance of the combustion chamber, such as the combustion efficiency, ignition and flameout. Studies have shown that reducing the diameter of fuel droplets can improve the efficiency of the combustion chamber [
3,
4,
5,
6,
7,
8].
Inside the evaporation tube, fuel atomization is mainly achieved by the breakup of fuel droplets under aerodynamic force caused by the velocity difference between fuel and air. Fuel absorbs heat from the tube wall in the evaporation tube, evaporates into gas after reaching the boiling point, and then enters the combustion chamber for combustion. To improve the atomization and evaporation performance of evaporation tubes, on the one hand, the interaction between air and fuel droplets should be enhanced; on the other hand, the heat transfer between the wall and the fuel–air mixture should be strengthened to raise the fuel temperature and thus improve the evaporation effect [
4,
6].
Since there are many geometric parameters affecting the atomization and evaporation performance of evaporation tubes, and there are coupling relationships among these parameters, the optimization of evaporation tubes is difficult and costly. Therefore, an algorithm that can quickly find a satisfactory design scheme is of great engineering value.
For computationally expensive design problems, surrogate-based optimization has become an effective approach for improving optimization efficiency [
9,
10,
11,
12,
13,
14,
15]. Among various surrogate models, Gaussian-process-based models are widely used because they can accurately approximate highly nonlinear responses while providing predictive uncertainty information for adaptive sampling and Bayesian optimization [
16,
17]. In addition, proper design-of-experiments and sequential infill strategies can further improve the balance between global exploration and local exploitation, thereby reducing the number of expensive simulations required [
18]. Therefore, introducing a few-shot surrogate-based optimization framework is a reasonable choice for the optimal design of evaporation tubes.
In this paper, CFD simulation is carried out on an evaporation tube with a straight tube and spiral wall configuration. Firstly, the influence of each geometric parameter on the atomization and evaporation performance of the evaporation tube is obtained through single-factor analysis. Then, a few-shot optimization method is used to optimize the evaporation tube in a seven-dimensional space. Finally, the effectiveness of the optimization method is verified by CFD validation. With only a small number of samples, multiple optimized design schemes with significantly improved atomization and evaporation performance are selected.
2. Numerical Calculation Method
2.1. CFD Calculation Method
In this paper, numerical calculations are carried out using Fluent in the commercial software Ansys 2022 R1. The realizable k-epsilon two-equation model is adopted for turbulence modeling. As an improved version of the k-epsilon family, it provides more accurate turbulence simulations for flows with strong rotation, adverse pressure gradients and flow separation, making it suitable for capturing the internal flow in spiral-wall evaporation tubes. The fuel is represented by a single-component C12H23, and the Discrete Phase Model (DPM) is employed for fuel simulation. This model is applicable when the particle volume fraction is less than 10%, and inter-particle interactions are negligible. It tracks droplet motion using the Lagrangian method and is widely used for simulating fuel evaporation. The Lagrangian wall film model is used for the droplet–wall interaction. A pressure-based solver and the SIMPLE algorithm are adopted in the computation. The second-order upwind scheme is used for the discretization of momentum, species and energy equations.
In addition, the parameters analyzed for fuel atomization and evaporation in this study are the Sauter Mean Diameter (SMD) and fuel evaporation rate, which characterize the atomization performance and evaporation performance of the evaporation tube, respectively. SMD is a measure of the mean spray droplet diameter and is a built-in property in Fluent that can be used to characterize the size distribution of spray droplets. Since SMD is related to the surface area of particles, it can better reflect the evaporation characteristics of fuel droplets. Therefore, SMD is adopted in this paper to describe the fuel particle size. The formula for calculating SMD is given below:
where
—diameter of each droplet in the actual spray;
—number of droplets with diameter .
The fuel evaporation rate is defined as the ratio of the mass of evaporated fuel at the evaporation tube outlet to the total fuel mass, and its calculation formula is given by
where
—mass of evaporated fuel at the outlet;
m—total mass of fuel.
2.2. Case Validation
2.2.1. Introduction to Geometric Model
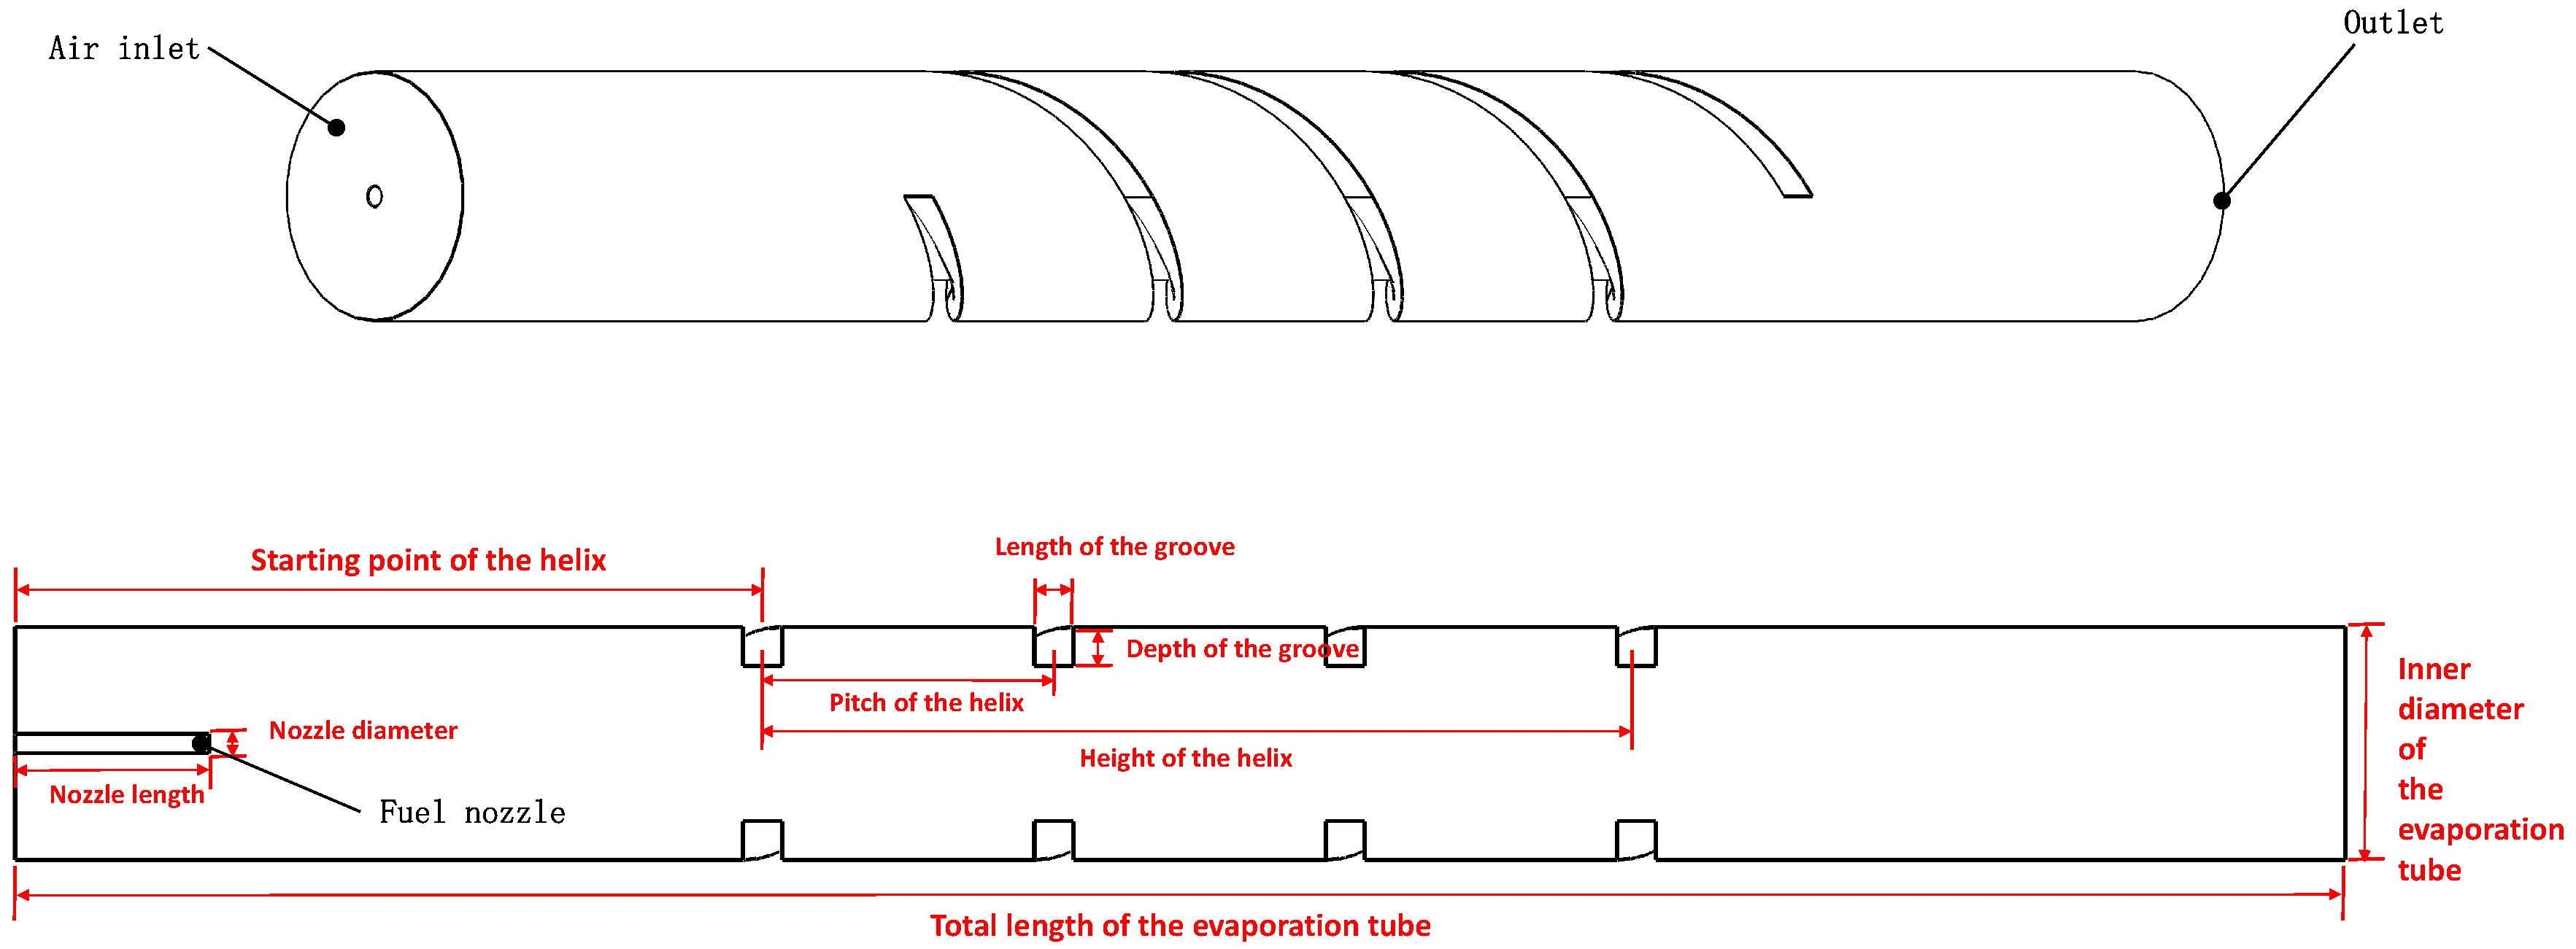
The evaporation tube adopts a straight-tube configuration with a spiral wall, and its geometric model is shown in
Figure 1. This model can effectively enhance the shear effect between air and fuel as well as the heat transfer between air and the wall, thereby improving the atomization and evaporation performance [
4,
5]. There are nine parameters controlling the evaporation tube, and the symbols and variation ranges of these parameters are listed in
Table 1.
2.2.2. Parameter Settings
Pressure boundary conditions are applied at the inlet and outlet. The inlet gauge pressure is 8000 Pa, the outlet gauge pressure is 0 Pa, and the inlet air temperature is 430 K. When the geometric parameters of the evaporation tube are changed, the fuel mass flow rate at the inlet remains constant at 0.333 g/s, and the inlet fuel temperature is 300 K. The wall temperature of the evaporation tube is 800 K, and the operating pressure is 290,000 Pa. A no-slip boundary condition is adopted for the wall, and standard wall functions are used for near-wall treatment.
2.2.3. Grid Independence Verification
In this paper, mesh generation is conducted using ANSYS Fluent Meshing (Version 2021). A hybrid unstructured mesh is adopted, with hexahedral cells in the central region and tetrahedral cells near the wall. Numerical calculations are performed with element sizes of 0.3, 0.2, 0.16, and 0.12 mm, respectively, with the Sauter Mean Diameter (SMD) and fuel evaporation rate as evaluation indicators. The results are listed in
Table 2. It is shown that when the element size is reduced to 0.16 mm, and the cell count reaches 1.31 million, the calculated values of SMD and evaporation rate tend to be stable. Therefore, the subsequent calculations in this paper employ a grid size of 0.16 mm.
3. Few-Shot Optimization Method
3.1. Sampling Method
In multi-objective optimization, a certain number of basic sample points are required. The optimization problem in this paper is a seven-dimensional problem, and 100 basic sample points are used. The sampling method adopted in this study is the Halton sequence sampling method. Halton sequence sampling is a method for generating low-discrepancy sequences (LDS), which is used to generate point sets in multi-dimensional space. Compared with traditional random sampling methods, it can cover the unit interval space more uniformly, thereby improving the prediction accuracy of the model. This idea is consistent with the general principle of design of experiments for computer simulations, where a more space-filling distribution of samples is preferred to improve the surrogate-model accuracy and robustness [
14,
15,
19]. The bases of the sequence are composed of a series of coprime prime numbers, which can be expressed as
where the inverse function of the base is defined as
In the equation, i can be expressed as a number with base b:
3.2. Surrogate Model
To improve the decision-making accuracy of the model, the establishment of a surrogate model is crucial. In this paper, Gaussian Process Regression (GPR) is employed for modeling and analysis [
17]. GPR is a non-parametric Bayesian method that describes the relationship between inputs and outputs by constructing a Gaussian process model. The core of Gaussian Process Regression lies in the covariance function (kernel function), which defines the correlation between input variables. By training on the dataset, GPR can estimate the covariance function between input and output variables, thereby identifying the Gaussian process that best represents the data distribution.
The expression of Gaussian Process Regression (GPR) is given as follows:
where f(x) is the objective function, m(x) is the mean function, k(x,x′) is the kernel function, and GP denotes the Gaussian process.
Given a training dataset
, the posterior distribution of the objective function can be obtained using Bayes’ theorem:
where
and
are the mean and variance of the posterior distribution, respectively, whose expressions are given as follows:
Here, K denotes the covariance matrix of the training set, y is the output vector of the training set, represents the kernel function between the validation set and the training set, and denotes the noise variance of the training set. To ensure the reproducibility of subsequent optimization processes, this paper proposes specific modeling parameters based on the aforementioned GPR theoretical framework.
The optimized surrogate model presented in this paper is a Gaussian process regression model implemented using scikit-learn’s GaussianProcessRegressor, with separate models established for SMD and the evaporation rate. All seven input geometric variables and the output variable are standardized using StandardScaler to achieve zero mean and unit variance; the prior mean of GPR employs a zero mean within the standardized space. The model employs an isotropic kernel function combination, with a scalar feature length scale rather than an anisotropic vector.
The kernel function comprises a combination of White Kernel, RBF, Rational Quadratic, Matérn (
), and a second RBF layer; the initial noise variance is set to
with a range from
to
; the initial length scales for RBF are 10 and
, corresponding to ranges from
to
and
to
, respectively; the initial length scale for Rational Quadratic is
with an alpha parameter of
; the initial length scale for Matérn is
. The hyperparameters were estimated by maximizing the logarithmic marginal likelihood using GaussianProcessRegressor, with the default L-BFGS-B optimizer employed without additional restart settings; numerical noise was handled jointly by the White Kernel and the default alpha parameter.
The training/test split follows a 9:1 ratio. To prevent random partitioning from inadvertently affecting small-sample model evaluations, the script selects partitions with optimal R2 performance on the test set among values ranging from to 99 for modeling; subsequent CFD samples are incorporated into the training dataset, after which the surrogate model is retrained.
The goodness-of-fit test of the regression equation is used to examine the clustering degree of sample points around the regression line, so as to evaluate how well the regression equation represents the sample points. The regression equation reflects the linear influence of independent variables on the dependent variable. Therefore, the larger the proportion of the regression sum of squares (SSA) in the total sum of squares of deviations (SST), the higher the goodness-of-fit. As an indicator of the goodness-of-fit of the sample regression line to the data, the coefficient of determination is given as follows:
where
,
.
4. Results of Single-Factor Analysis
The model has nine geometric parameters. To investigate the effects of these nine parameters on the atomization and evaporation performance of the evaporation tube, five uniformly distributed points within the parameter variation range are selected around the baseline value of each parameter. Numerical simulations are carried out under the same fuel mass flow rate and boundary conditions, and their control laws are summarized separately. The results show that the inner diameter of the evaporation tube, spiral pitch, and groove depth have the largest impact on its performance, whereas the total length of the tube and groove length have the least influence; therefore, these parameters are not optimized as variables.
Since most contour plots exhibit similar characteristics, one parameter with a strong influence on atomization and evaporation performance and two parameters with obvious contour features are selected for detailed single-factor analysis. The effects of the remaining parameters on the atomization and evaporation performance are listed in
Table 3.
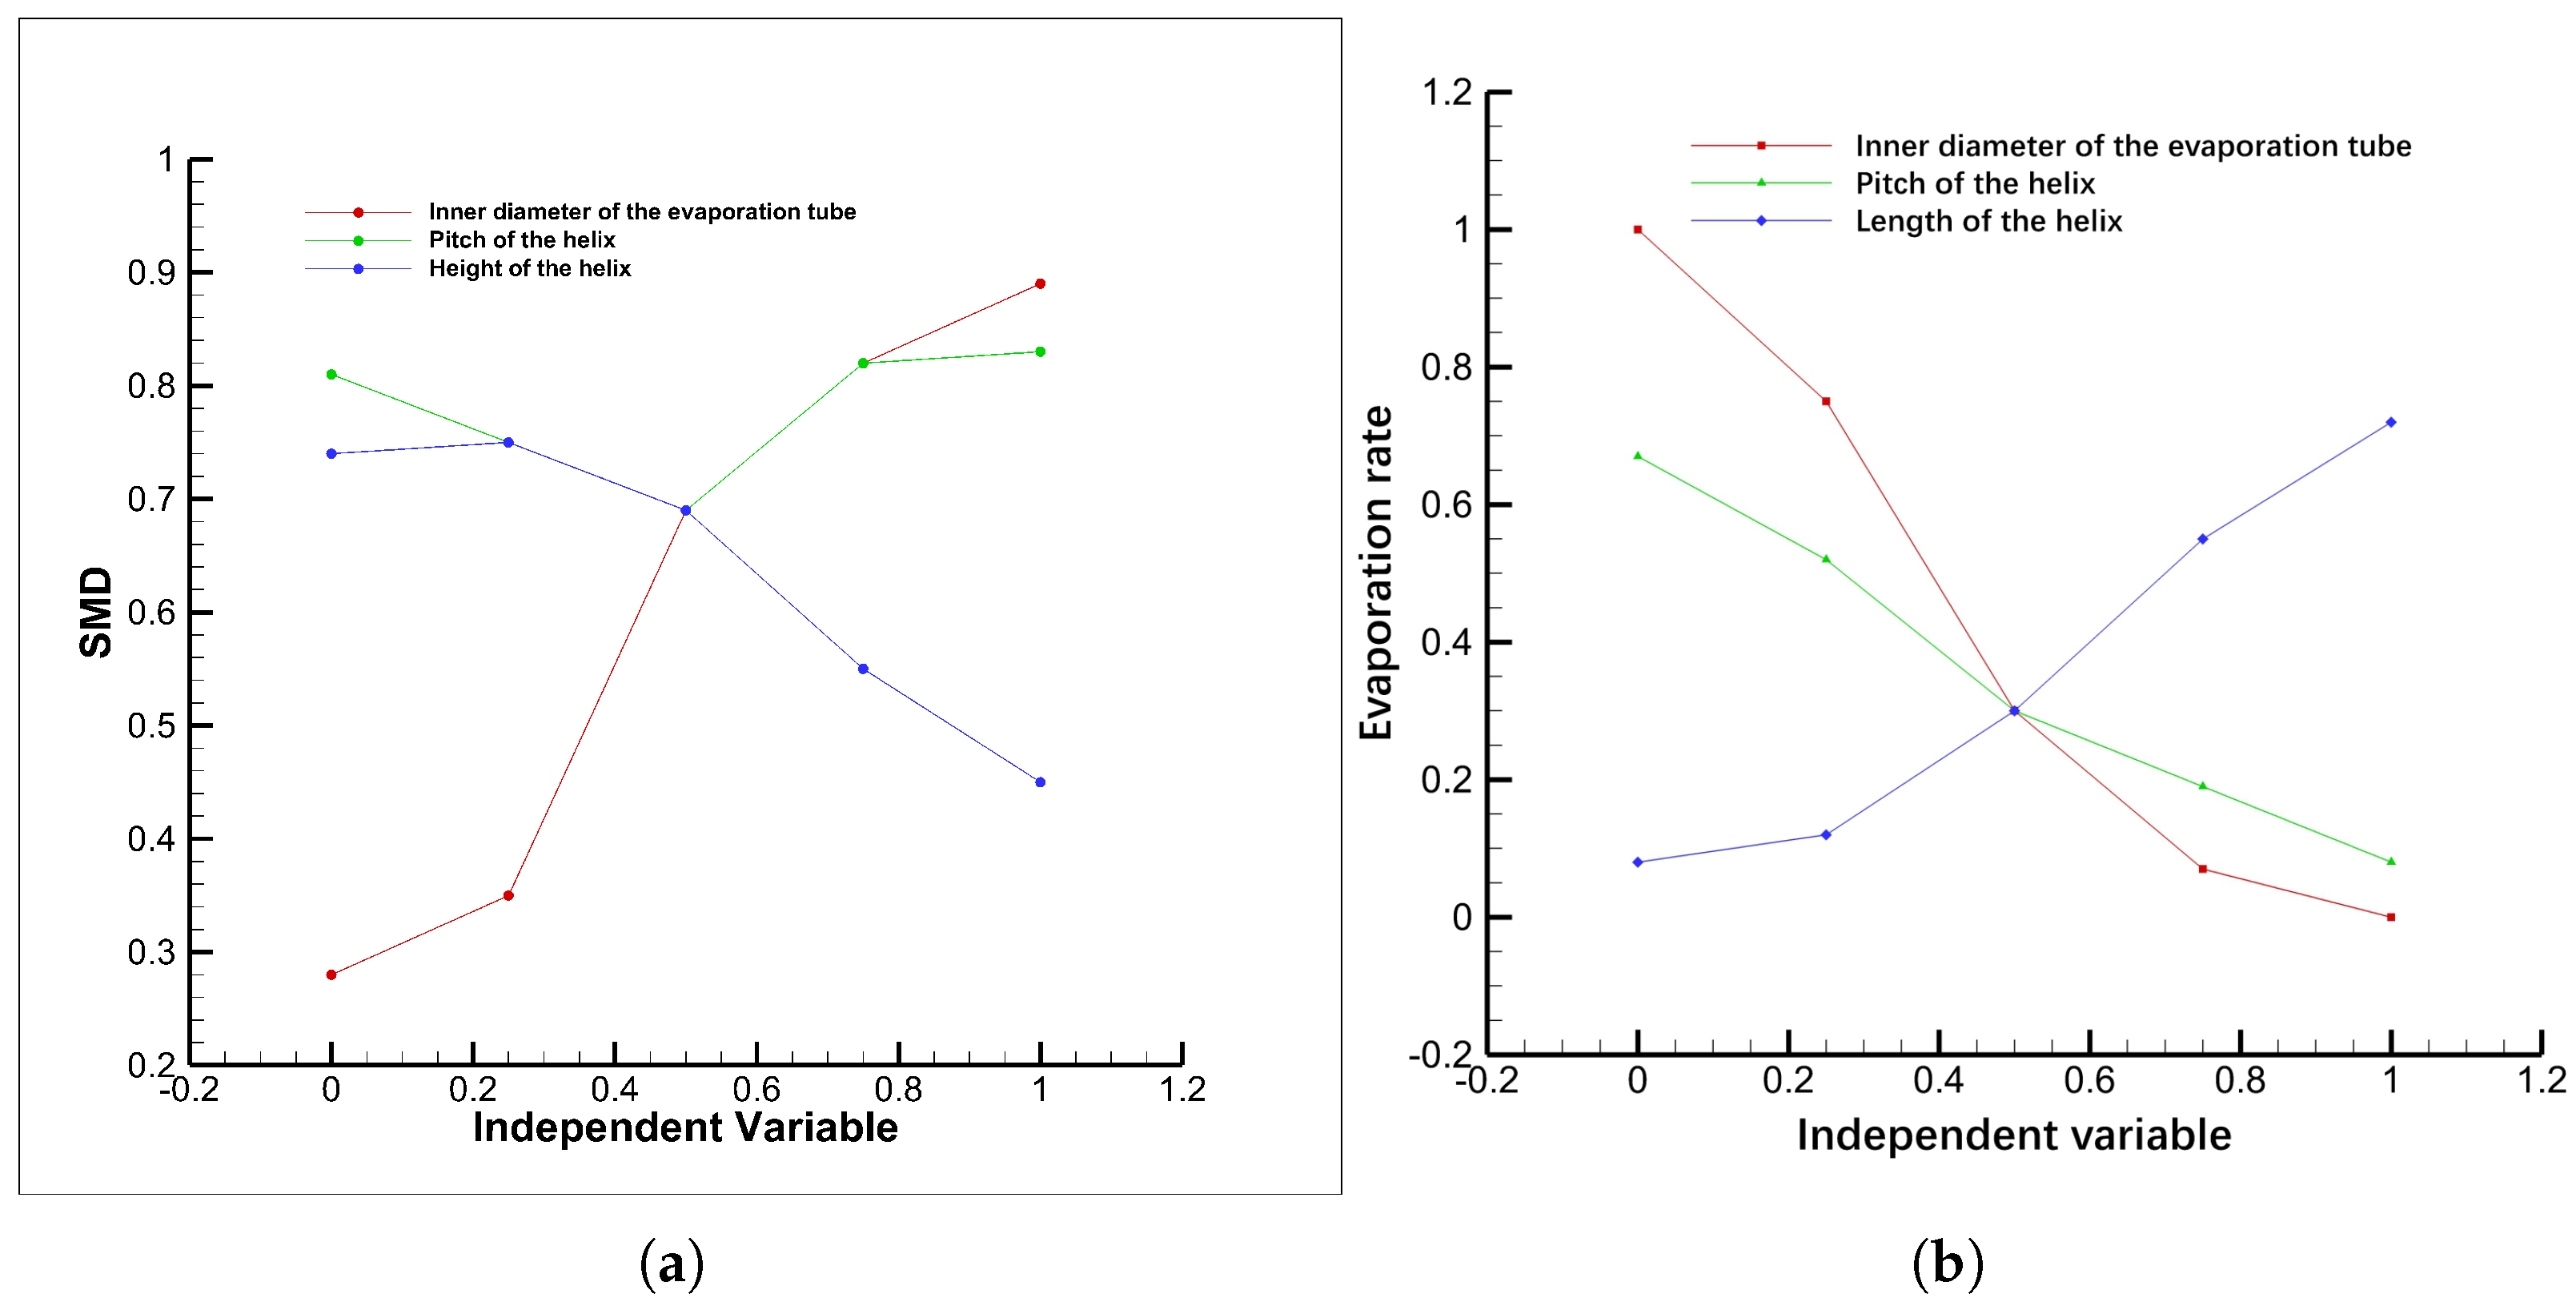
Figure 2 presents the variation laws of the inner diameter, helical pitch, and helical length of the evaporation tube on SMD and evaporation efficiency. It can be observed that, as the inner diameter increases, the normalized SMD rises from 0.28 to 0.89, and the normalized evaporation efficiency decreases from 1.0 to 0.0, indicating a remarkable impact on the atomization and evaporation performance. With the increase in the helical pitch, the SMD first decreases and then increases, while the evaporation efficiency declines gradually, with a smaller influence compared with the inner diameter. As the helical length increases, the SMD decreases gradually, and the evaporation efficiency increases continuously.
4.1. Evaporator Tube Inner Diameter
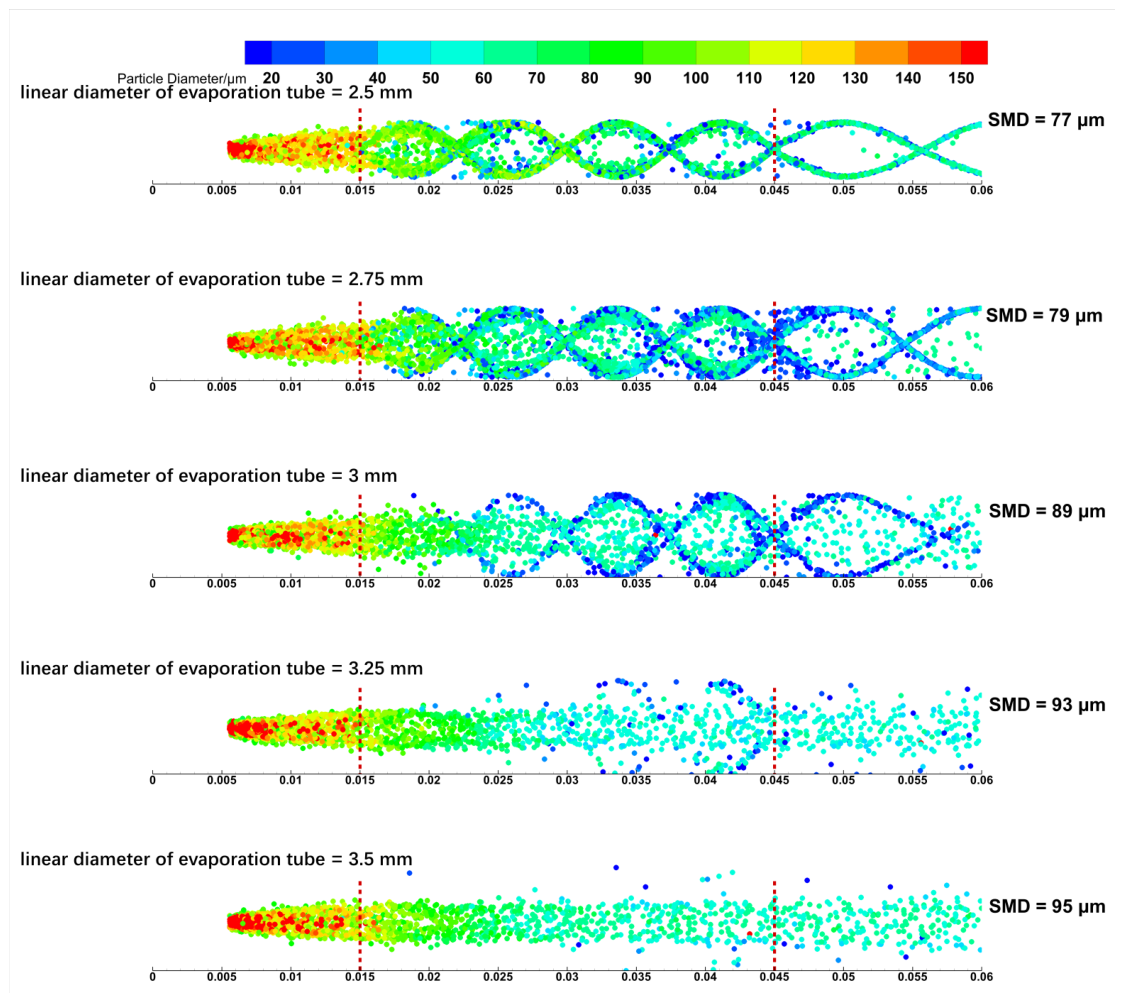
The flow of the air–fuel mixture inside the evaporation tube can be divided into three stages: the inlet section, the spiral section, and the outlet section. The inlet section refers to the flow just after fuel injection, before entering the spiral wall. The spiral section is where the fuel flows along the spiral structure; in this stage, the fuel has extensive contact with the wall, making it the main stage for fuel atomization and evaporation. The outlet section describes the flow after the fuel leaves the inner spiral wall. As can be seen from the particle contours shown in
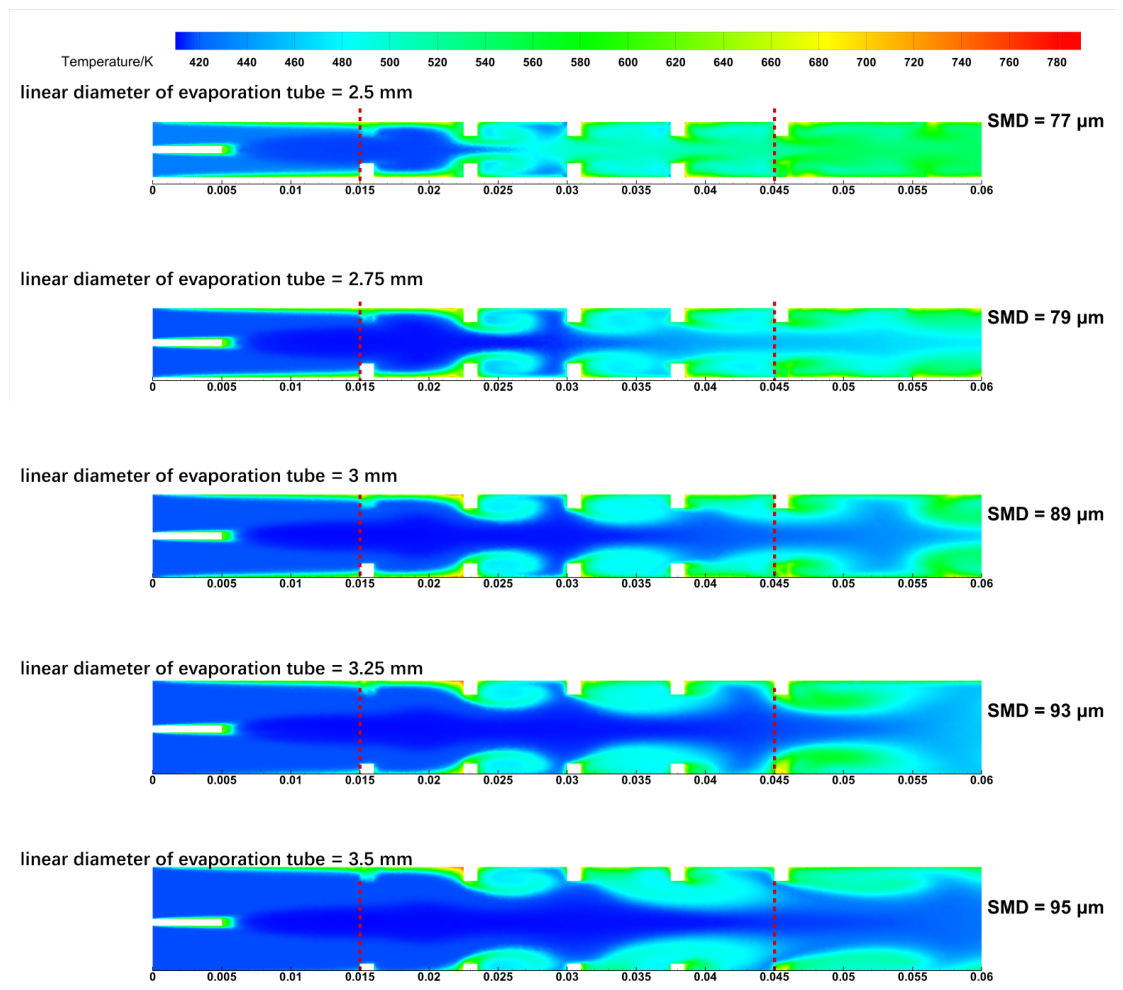
Figure 3, in the spiral section, the smaller the inner diameter of the evaporation tube, the more particles move close to the wall, and the smaller the particle size of those swirling along the wall. This is because the spiral wall induces a swirling effect on the fuel, which enhances the shear interaction between air and fuel and promotes atomization. Moreover, when moving near the wall, the fuel is close to the high-temperature wall, resulting in strong heat transfer and high temperature, which is more favorable for reaching the boiling point and evaporating. This mechanism is further supported by the temperature distribution in
Figure 4. The smaller the inner diameter of the evaporation tube, the more the air–fuel mixture near the center contacts the wall, leading to stronger heat transfer from the wall to the mixture and thus a higher temperature. In the outlet section, the smaller the inner diameter of the evaporation tube, the more fuel particles continue to move along spiral trajectories toward the outlet, due to the strong swirling effect after leaving the spiral wall [
4,
5,
6].
4.2. Helical Pitch
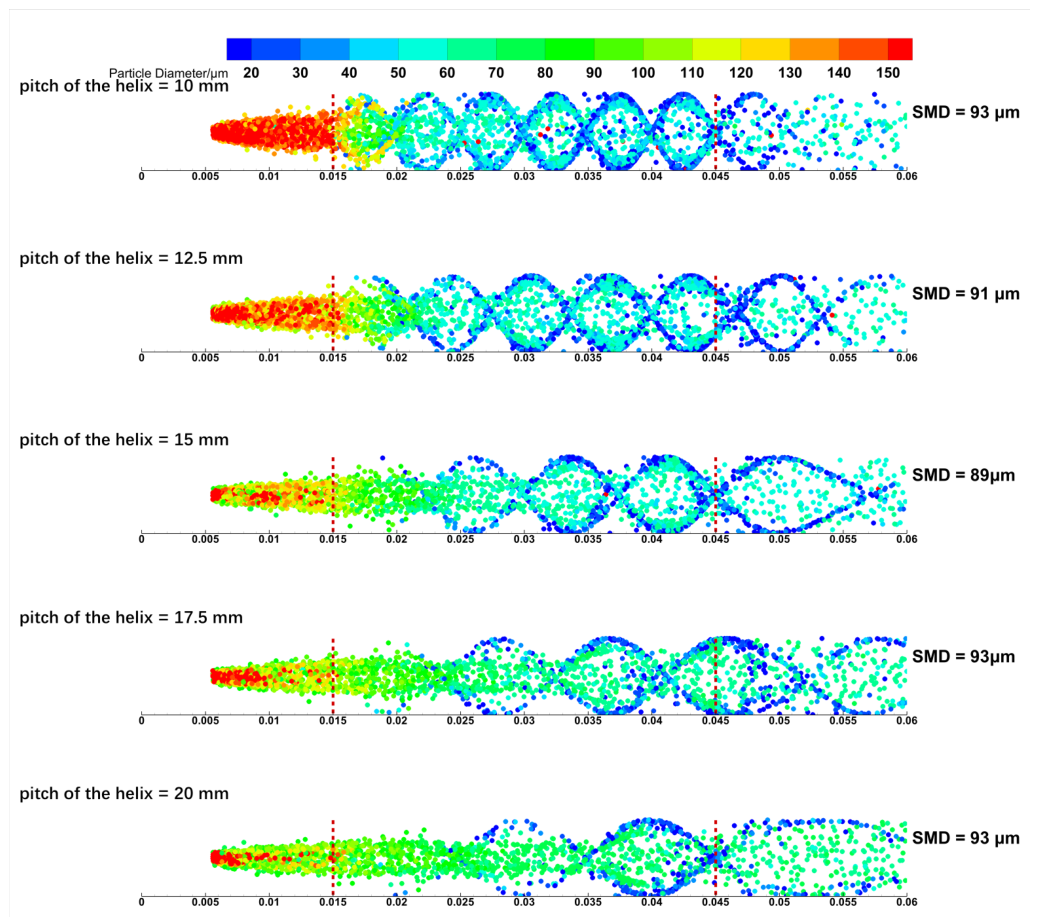
The particle contours in
Figure 5 show that, in the inlet section, an excessively small helical pitch leads to the accumulation of a large amount of large-sized fuel near the front of the spiral wall. This is because the small helical pitch results in high total flow resistance, which slows down the air–fuel mixture and causes fuel accumulation. In the spiral section, when the helical pitch is too small, the fuel in the center of the evaporation tube is poorly broken up due to the low flow velocity, resulting in large fuel droplets in the central region. Conversely, when the helical pitch is too large, the number of spiral cycles is reduced, leading to fewer collisions between fuel droplets and the wall and, thus, relatively larger particle sizes. It can therefore be concluded that a stronger impact of fuel on the spiral wall leads to better atomization and breakup effect. In the third stage (outlet section), when the helical pitch is excessively small, almost no fuel particles continue to move spirally after leaving the spiral wall, and the particle size is larger than that in the second stage. This may be attributed to the mixing between the air–fuel mixture exiting the spiral region and the fuel near the center that is less affected by the swirling flow. Although the strong velocity difference along the tube axis promotes collision and mixing, the low flow velocity leads to an increase in the average particle size. When the helical pitch is excessively large, the swirling effect induced by the spiral wall is weak, resulting in fewer particles moving along the spiral path and larger droplet sizes.
4.3. Helical Length
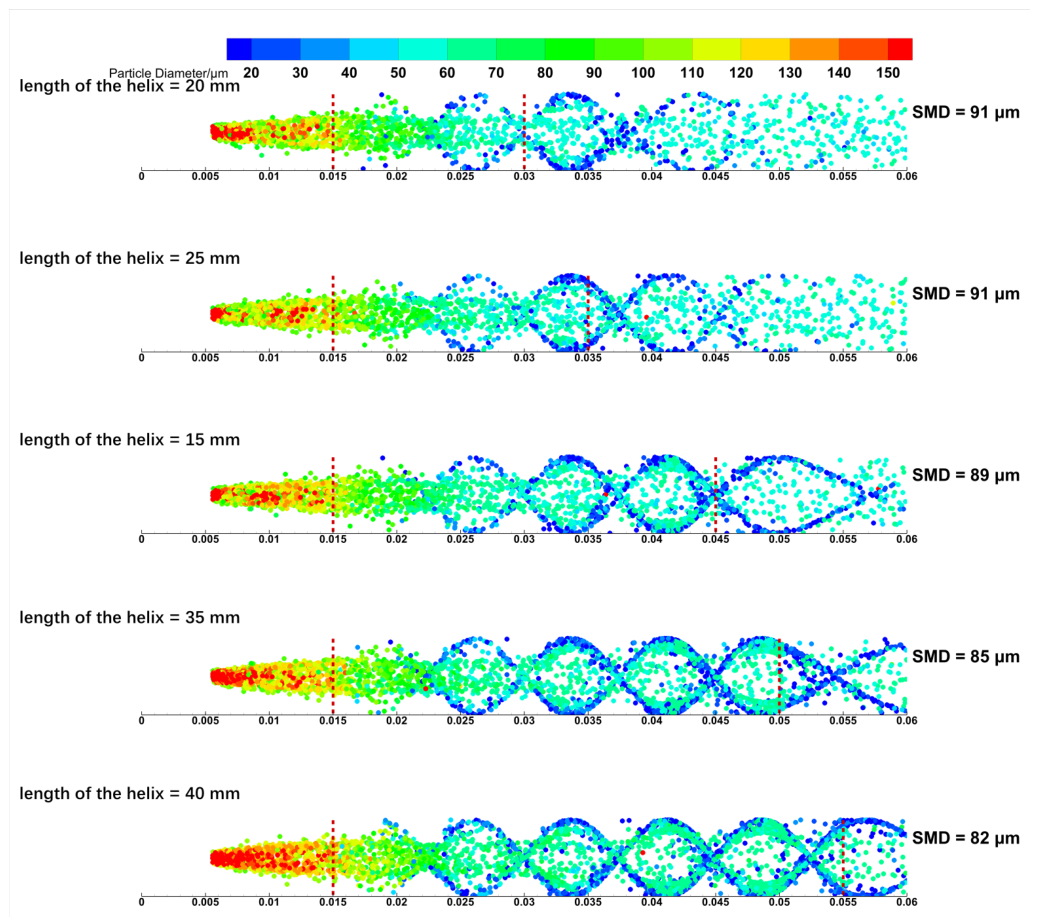
As shown in
Figure 6, in the inlet section, the longer the helical length, the more serious the accumulation at the front part, which can also be attributed to the increased total resistance caused by the helical structure. In the spiral section, a larger helical length corresponds to more spiral cycles. Since the spiral wall provides a longer duration for accelerating fuel breakup, the breakup effect is improved, resulting in smaller fuel particle sizes at the outlet. In the outlet section, when the helical length is short, the swirling effect of the air–fuel mixture decays rapidly after leaving the spiral wall, and the particle size increases instead after mixing with the central airflow. This further confirms the importance of sufficient spiral length in maintaining the atomization and breakup effect.
5. Analysis of Optimization Results
This study conducted a seven-dimensional optimization of the evaporation tube, with seven design variables: inner diameter, nozzle length, nozzle diameter, spiral line starting point, spiral pitch, spiral height, and groove depth. The optimization objective was to reduce the surface moisture content (SMD) and enhance the evaporation efficiency. The optimization dataset comprised three phases: initial design, iterative point addition, and CFD re-computation. The initial CFD sample set consisted of 100 cases, including 90 for training and 10 for preliminary testing; during each of the five filling rounds, an additional six candidate configurations were selected for CFD re-computation and incorporated into the dataset, resulting in a total of 130 CFD evaluations throughout the optimization process. One reference configuration in the dataset was used solely for relative improvement rate calculation and was not included in the optimization sample count; when analyzing geometric parameter uniqueness, since repeated CFD re-computations were performed for two sets of configurations, the 130 CFD evaluations corresponded to 128 unique geometric configurations.
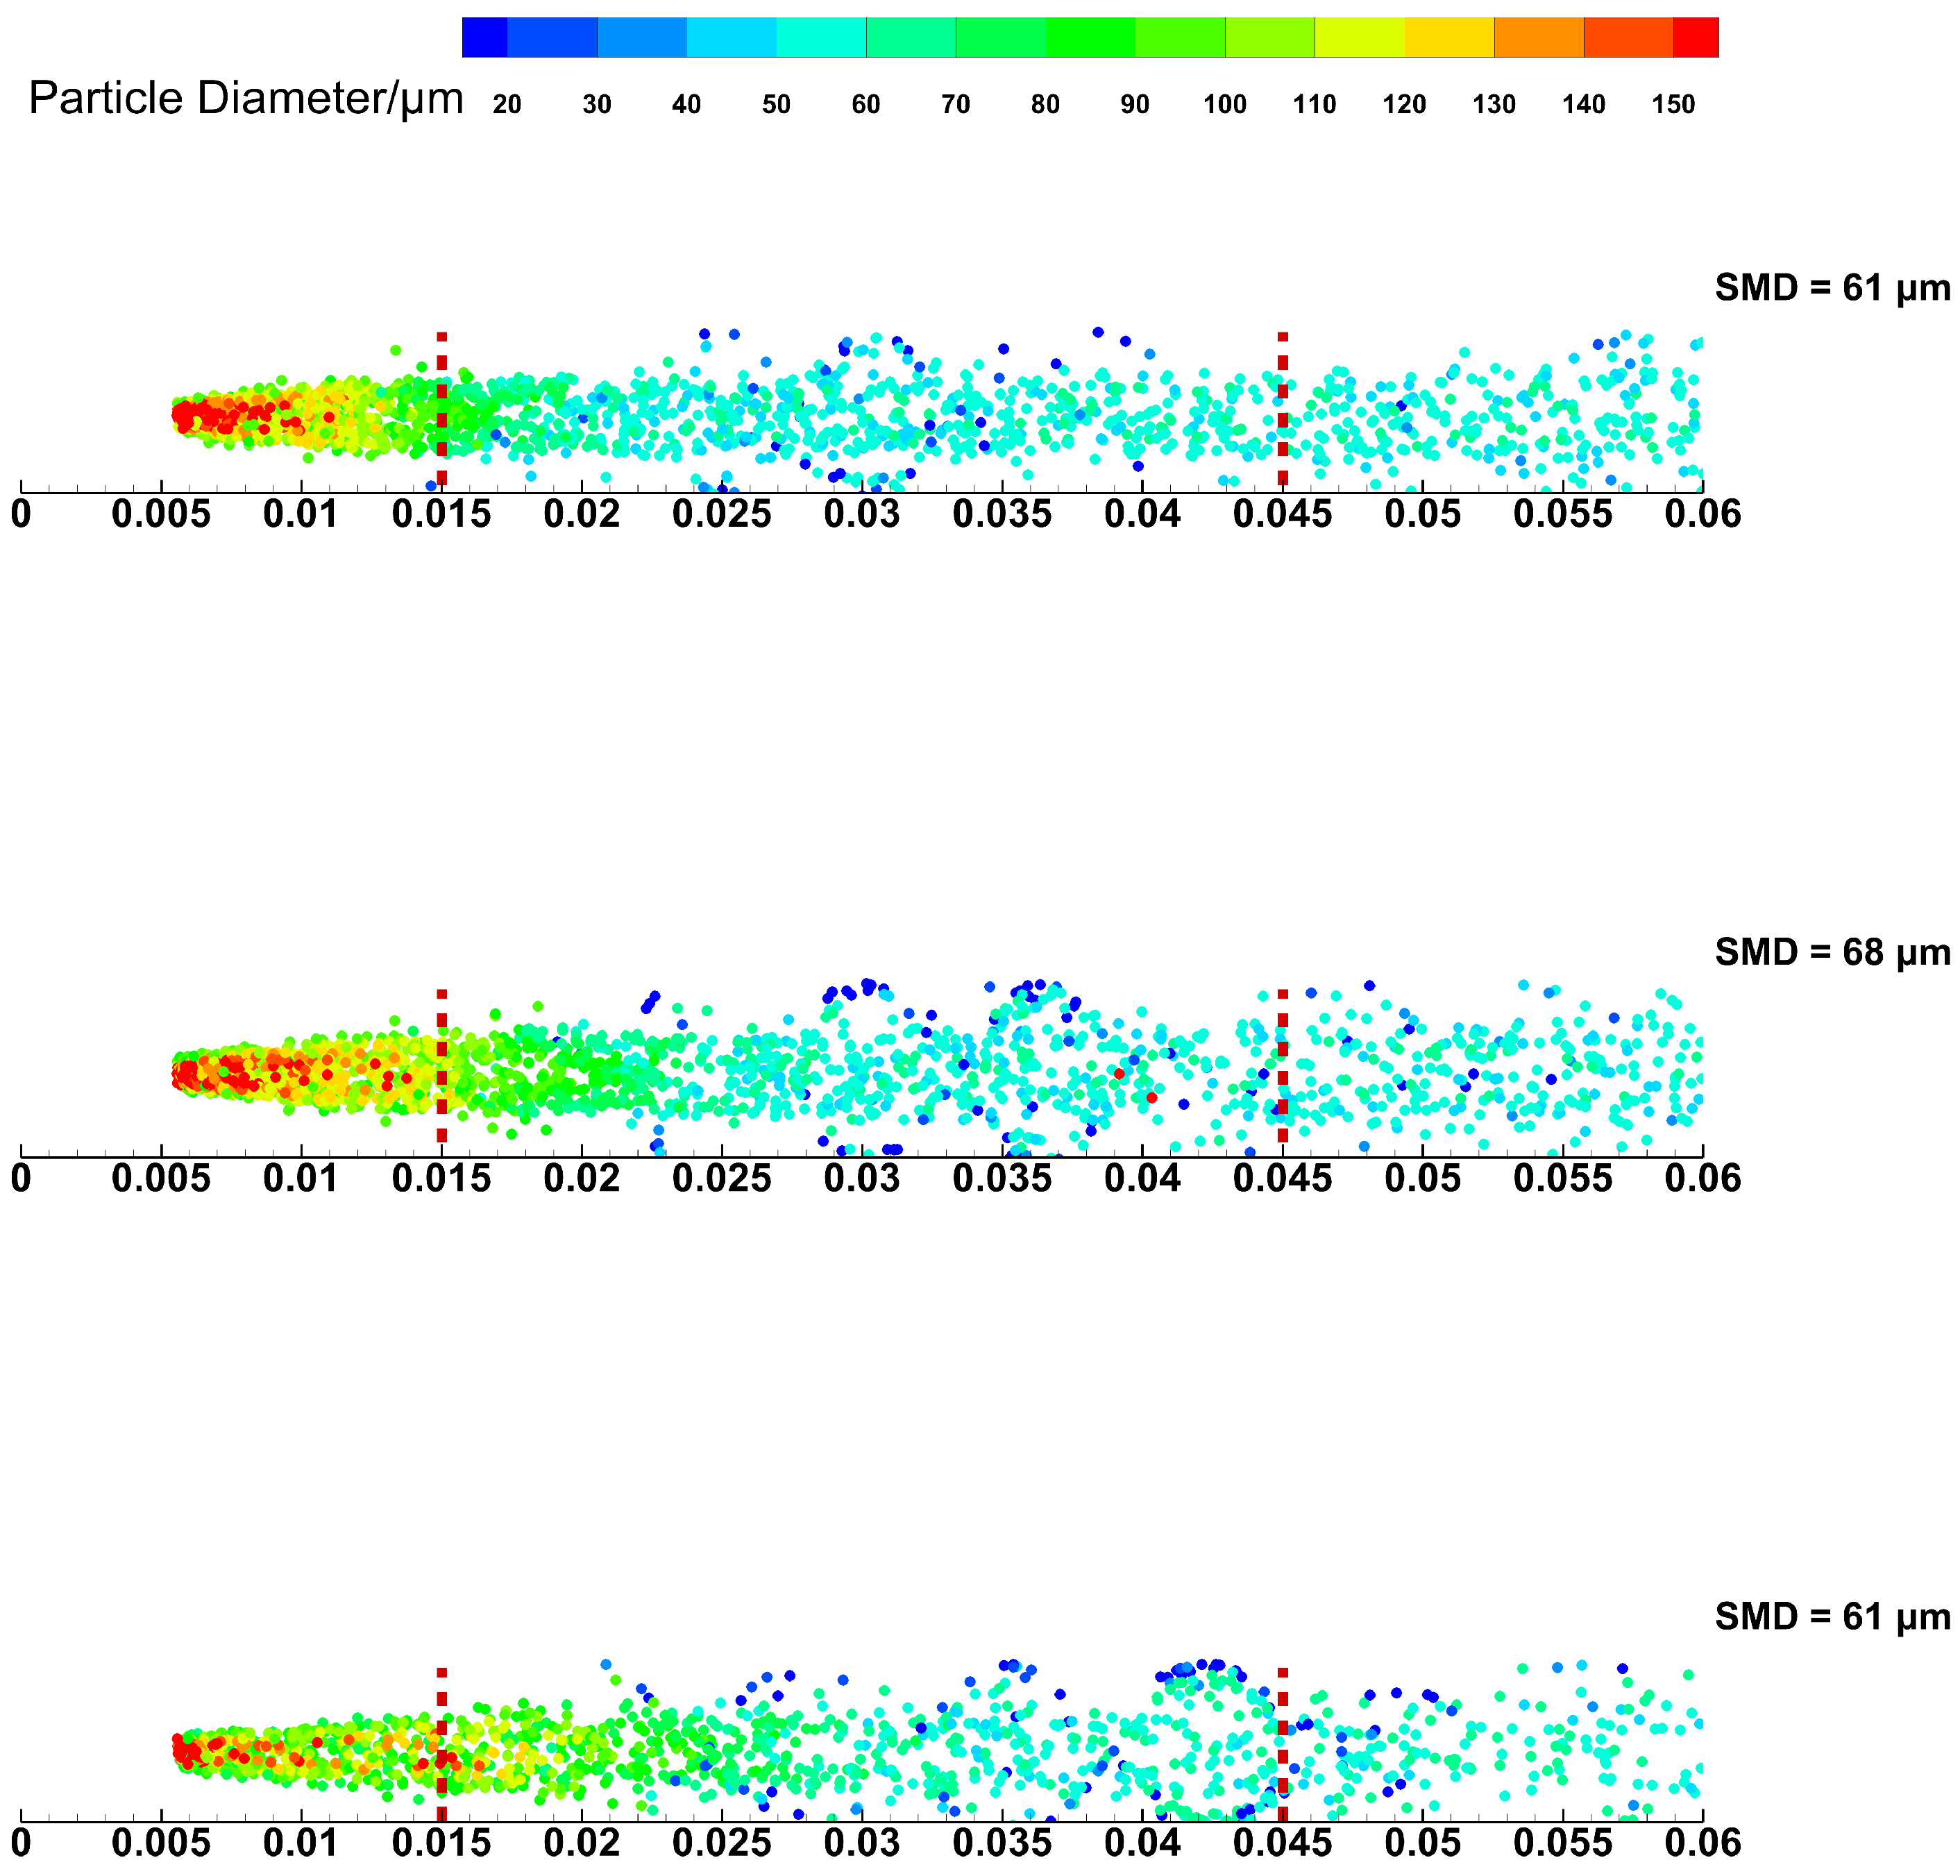
After five iterations, a total of 30 optimized conffgurations validated through CFD were obtained. To visually validate the optimization outcomes, representative optimized configurations were selected from the 30 CFD-verified solutions and compared with the baseline case. As shown in
Figure 7, the optimized designs exhibit significantly smaller droplet sizes and more uniform particle distribution in the spiral section, which is consistent with the improved SMD and evaporation rate predicted by the surrogate model.
The Pareto frontier is searched using the NSGA-II algorithm on the aforementioned agent model [
20]. The implementation employs geatpy’s moea_NSGA2_templet function with real-number encoding, a population size of 500, a maximum generation count of 500, crossover probability of 0.9, and mutation probability of 0.1. Crossover and mutation operators utilize the default real-number encoding parameters provided by the template, while distribution indices and other parameters follow geatpy’s default settings. The initial population is randomly generated within the upper and lower bounds of seven variables; constraints are enforced by maintaining these bounds. The algorithm terminates upon reaching the maximum generation limit. Each optimization iteration runs independently without pre-setting additional random seeds for NSGA-II. To unify the optimization objectives of minimizing the SMD and maximizing the evaporation rate, a benefit-based minimum–maximum normalized metric is defined as follows:
In the formula, the SMD is optimized when its value is smaller; thus, the difference between the maximum value and the current value is used to represent the SMD efficiency. Similarly, the evaporation rate is optimized when its value is larger; therefore, the increase in the current evaporation rate relative to the minimum evaporation rate is employed to measure the evaporation efficiency. Throughout the text, is consistently used to denote the evaporation rate.
After five rounds of multi-objective optimization, the prediction accuracy of the SMD and evaporation rate surrogate models is summarized in
Table 4a,b. The “R
2 modeling score” in
Table 4b represents the coefficient of determination, indicating the model’s consistency in fitting or predicting the corresponding sample points; maximum and average errors are calculated based on six additional CFD re-computation samples per iteration, while the relative prediction error is defined as
As shown in
Table 4b, the error does not decrease monotonically with an increasing number of iteration rounds: the SMD exhibits the lowest maximum and average errors in the fourth round, while its R
2 value drops from 0.972 to 0.962 in the fifth round; the evaporation rate shows the lowest average error in the third round but achieves the highest R
2 value in the fifth round. This phenomenon indicates that adding new samples improves the overall coverage of the response surface, yet local prediction errors may still increase when candidate points are located in regions with high evaporation rates or significant local gradients. The primary objective of the five-round iterative point addition process is to enhance the coverage of candidate regions and obtain optimized configurations verifiable by CFD simulations.
6. Conclusions
Through single-factor analysis and quantitative sensitivity calculations, this study elucidates the influence patterns of key geometric parameters of spiral-walled evaporative tubes on atomization and evaporation performance. The surface mean droplet diameter (SMD) is primarily influenced by the nozzle diameter, inner tube diameter, and groove depth; the evaporation rate depends mainly on the inner tube diameter, groove depth, helix height, and helix pitch; while the combined effects of total tube length and groove length are relatively minor. Based on these findings, this study employed Halton sampling, GPR surrogate models, and NSGA-II for small-sample optimization in a seven-dimensional space, generating 130 CFD simulations. Statistical analysis of 30 five-round incremental CFD runs revealed a baseline evaporation rate of 0.1695, with optimized configurations achieving rates ranging from 0.4693 to 0.6382—a relative improvement of 176.92–276.61% (average improvement: 234.35%)—and an average SMD reduction of 24.26%, corroborating insights with single-factor analysis findings.
The relative improvement rate and average improvement rate of evaporation are calculated using the following formulas:
The physical mechanism behind the significant increase in the evaporation rate lies in the following: A smaller inner diameter of the evaporation tube enhances near-wall vortex formation and the probability of oil droplets contacting the high-temperature wall surface; a smaller nozzle diameter reduces the initial droplet size; an appropriate spiral pitch combined with a longer spiral section extends the duration of droplet shear, breakup, and heat transfer along the wall surface; while secondary flows induced by groove depth and liquid film disturbances further enhance fuel spreading and evaporation. While the baseline configuration exhibited an evaporation rate of only 0.1695, the optimized configuration achieves an absolute evaporation rate improvement of approximately 0.47–0.64, corresponding to a relative increase exceeding 200%. It should be noted that these conclusions are still limited to the current CFD-DPM model and sample dataset; future studies will validate model robustness through experimental verification, residual history analysis, and more comprehensive sensitivity analyses using advanced physical models.
Author Contributions
Conceptualization, B.Z. and L.L.; methodology, B.Z. and L.L.; software, J.Z.; validation, J.Z., J.H. and L.Z.; formal analysis, J.Z.; investigation, J.H. and L.Z.; resources, B.Z. and L.L.; data curation, J.H. and L.Z.; writing—original draft preparation, J.Z.; writing—review and editing, B.Z. and L.L.; visualization, J.Z.; supervision, B.Z. and L.L.; project administration, B.Z. and L.L. All authors have read and agreed to the published version of the manuscript.
Funding
This research received no external funding. The APC was funded by the authors.
Institutional Review Board Statement
Not applicable.
Data Availability Statement
The data supporting the findings of this study are included within the article.
Conflicts of Interest
The authors declare no conflicts of interest.
References
- Ranran, X.; Fengchao, L.; Establishment, C.A. An Overview on Development of Micro Turbojet Engines. Adv. Aeronaut. Sci. Eng. 2016, 7, 387–396. [Google Scholar]
- Dutczak, J. Micro turbine engines for drones propulsion. In Proceedings of the IOP Conference Series: Materials Science and Engineering; IOP Publishing: Bristol, UK, 2016; Volume 148, p. 012063. [Google Scholar]
- Gonzalez, C.; Wong, K.; Armfield, S. A computational study of the influence of the injection characteristics on micro-turbine combustion. In Proceedings of the 16th Australasian Fluid Mechanics Conference, Gold Coast, Australia, 2–7 December 2007. [Google Scholar]
- Tan, W.L.; Fan, W.J.; Zhang, T.; Wang, W.J.; Zhang, R.C. Performance test of micro turbojet engine’s evaporator and numerical simulation of the combustor. J. Aerosp. Power 2012, 27, 861–867. [Google Scholar]
- Zhang, R.C.; Fan, W.J.; Song, S.W. Atomization and evaporation performance experiment of evaporating tube for trapped vortex combustor. Hangkong Dongli Xuebao/J. Aerosp. Power 2011, 26, 2495–2502. [Google Scholar]
- Jeng, S.; Jog, M.; Benjamin, M. Computational and experimental study of liquid sheet emanating from simplex fuel nozzle. AIAA J. 1998, 36, 201–207. [Google Scholar] [CrossRef]
- Rancourt, G.; Gipe, D.; Starkey, R. Biofueled Miniature Turbojet Engine (BIOMITE). In Proceedings of the 50th AIAA Aerospace Sciences Meeting Including the New Horizons Forum and Aerospace Exposition, Nashville, TN, USA, 9–12 January 2012; p. 109. [Google Scholar]
- Chetiyar, R.; Prasath, M.G.; Selva Babu, B. Design and improvement of combustion chamber for small gas turbine power plant. In Proceedings of the International Conference on Recent Advancement in Mechanical Engineering & Technology (ICRAMET’ 15), Paiyanur, India, 23–24 April 2015. [Google Scholar]
- Han, Z. Kriging surrogate model and its application to design optimization: A review of recent progress. Acta Aeronaut. Astronaut. Sin. 2016, 37, 3197–3225. [Google Scholar]
- Lyu, Z.; Zhou, X.; Liu, Z.; Zhang, B. A surrogate-based algorithm with balanced infill sampling for ignition delay time optimization of a global RP-3 kerosene mechanism. AIP Adv. 2025, 15, 095017. [Google Scholar] [CrossRef]
- Kuhnt, S.; Steinberg, D.M. Design and Analysis of Computer Experiments. Asta Adv. Stat. Anal. 1989, 4, 409–423. [Google Scholar] [CrossRef]
- Mckay, M.D.; Conover, R.J.B.J. A Comparison of Three Methods for Selecting Values of Input Variables in the Analysis of Output from a Computer Code. Technometrics 1979, 21, 239–245. [Google Scholar] [CrossRef]
- Queipo, N.V.; Haftka, R.T.; Shyy, W.; Goel, T.; Vaidyanathan, R.; Tucker, P.K. Surrogate-based analysis and optimization. Prog. Aerosp. Sci. 2005, 41, 1–28. [Google Scholar] [CrossRef]
- Forrester, A.I.J.; Sobester, A.; Keane, A.J. Engineering Design via Surrogate Modelling: A Practical Guide; John Wiley & Sons: Hoboken, NJ, USA, 2008. [Google Scholar]
- Jones, D.R.; Schonlau, M.; Welch, W.J. Efficient Global Optimization of Expensive Black-Box Functions. J. Glob. Optim. 1998, 13, 455–492. [Google Scholar] [CrossRef]
- Shahriari, B.; Swersky, K.; Wang, Z.; Adams, R.P.; De Freitas, N. Taking the human out of the loop: A review of Bayesian optimization. Proc. IEEE 2015, 104, 148–175. [Google Scholar] [CrossRef]
- Williams, C.K.; Rasmussen, C.E. Gaussian Processes for Machine Learning; MIT Press: Cambridge, MA, USA, 2006; Volume 2. [Google Scholar]
- Liu, H.; Ong, Y.S.; Cai, J. A survey of adaptive sampling for global metamodeling in support of simulation-based complex engineering design: H. Liu et al. Struct. Multidiscip. Optim. 2018, 57, 393–416. [Google Scholar]
- Lin, Q.; Zheng, J.; Zou, C.; Cheng, J.; Li, J.; Xia, W.; Shi, H. An improved 3-pentanone high temperature kinetic model using Bayesian optimization algorithm based on ignition delay times, flame speeds and species profiles. Fuel 2020, 279, 118540. [Google Scholar] [CrossRef]
- Deb, K.; Pratap, A.; Agarwal, S.; Meyarivan, T. A fast and elitist multiobjective genetic algorithm: NSGA-II. IEEE Trans. Evol. Comput. 2002, 6, 182–197. [Google Scholar] [CrossRef]
| Disclaimer/Publisher’s Note: The statements, opinions and data contained in all publications are solely those of the individual author(s) and contributor(s) and not of MDPI and/or the editor(s). MDPI and/or the editor(s) disclaim responsibility for any injury to people or property resulting from any ideas, methods, instructions or products referred to in the content. |