Article

CoordAtt-PARSeq: A Coordinate-Attention-Stem- and Focal-Loss-Augmented Permuted Autoregressive Transformer for Robust Fiscal Receipt Text Recognition


1
School of Finance and Public Administration, Harbin University of Commerce, Harbin 150028, China
2
School of Light Industry, Harbin University of Commerce, Harbin 150028, China
3
School of Computer and Information Engineering, Harbin University of Commerce, Harbin 150028, China
*
Authors to whom correspondence should be addressed.
Appl. Sci. 2026, 16(14), 7003; https://doi.org/10.3390/app16147003
Submission received: 31 May 2026 / Revised: 29 June 2026 / Accepted: 3 July 2026 / Published: 13 July 2026
(This article belongs to the Section Computing and Artificial Intelligence)

Abstract

Fiscal receipt text recognition is an important but difficult task within scene text recognition (STR). This study focuses on cropped word-level receipt text images whose text regions are already available, rather than on a complete end-to-end receipt OCR pipeline that also includes text detection and key information extraction. In real-world scenarios, receipt images often contain compact layouts, stamps, folds, uneven contrast, small fonts, and highly imbalanced character distributions. Rare symbols, including decimal points, slashes, colons, and currency marks, are especially important because recognition errors may directly affect financial information. Although Transformer-based recognizers such as PARSeq achieve strong performance on general STR tasks, their patch-token representation weakens local spatial priors, while the conventional cross-entropy loss gives insufficient emphasis to rare receipt-specific characters. To address these limitations, this paper presents CoordAtt-PARSeq, a lightweight extension of PARSeq-tiny for cropped fiscal receipt text recognition. The proposed model inserts a Coordinate Attention (CoordAtt) stem before patch embedding to strengthen horizontal and vertical spatial dependencies, and employs Focal Loss to improve learning on hard and under-represented characters. On WildReceipt, CoordAtt-PARSeq improves PARSeq-tiny by 4.19 percentage points in word accuracy (Ignore Case), 4.07 percentage points in strict word accuracy, and 1.11 percentage points in Normalized Edit Distance (NED), while reducing Character Error Rate (CER) by 1.85 absolute points. It also outperforms CRNN, ViTSTR, ABINet, TRBA, and PARSeq-tiny. On SROIE, the proposed method improves PARSeq-tiny by 4.47 percentage points in word accuracy (Ignore Case), 4.39 percentage points in strict word accuracy, and 1.50 percentage points in NED, with a 1.84-point absolute CER reduction. These results indicate that direction-aware spatial enhancement combined with imbalance-aware character learning can effectively adapt Transformer-based STR models to robust cropped fiscal receipt text recognition.

1. Introduction

The digitization of fiscal documents—invoices, tax receipts, and expense slips—underpins a rapidly growing class of enterprise applications that span robotic process automation, audit assistance, expense management, and downstream tax compliance [1,2,3]. The quantity of paper and image-based receipts processed by accounting departments is overwhelming: industry surveys estimate that unstructured documents account for up to 95% of enterprise data and cause losses of the order of hundreds of millions of dollars annually when handled manually [4,5]. As a consequence, the accuracy of the underlying optical character recognition (OCR) layer has become a primary determinant of the end-to-end value of any document-understanding pipeline [6,7,8].
Receipt OCR is, however, qualitatively different from generic scene text recognition (STR). A receipt is at once a structured document and an in-the-wild image. Its content is dominated by digits, currency marks, and rigid tabular layouts, but the acquisition conditions are uncontrolled: photographs taken by mobile devices in non-flat lighting, red official stamps that occlude the printed text, fold-induced shadows, low-contrast thermal-printed lines, and micro-fonts that occupy only a few pixels of vertical resolution [9,10,11]. The WildReceipt benchmark of Sun et al. [10] captures exactly this regime and has become the canonical testbed for receipt recognition under realistic visual interference. The ICDAR 2019 SROIE competition [6] further established that, on real scanned receipts, top-performing generic STR models lose more than twenty absolute points of word accuracy compared with their performance on natural-scene benchmarks. State-of-the-art STR has converged on two architectural families. The first is rooted in the convolutional–recurrent paradigm pioneered by CRNN [12] and codified by the TRBA pipeline of Baek et al. [13]; the second is built around Vision Transformers (ViTs) [14], with representative members including ViTSTR [15], language-driven ABINet [16,17], and the permuted autoregressive PARSeq model [18]. Among these, PARSeq currently offers one of the most attractive accuracy/parameter trade-offs and a unified bidirectional/iterative decoding interface, and is therefore an appealing starting point for receipt recognition.
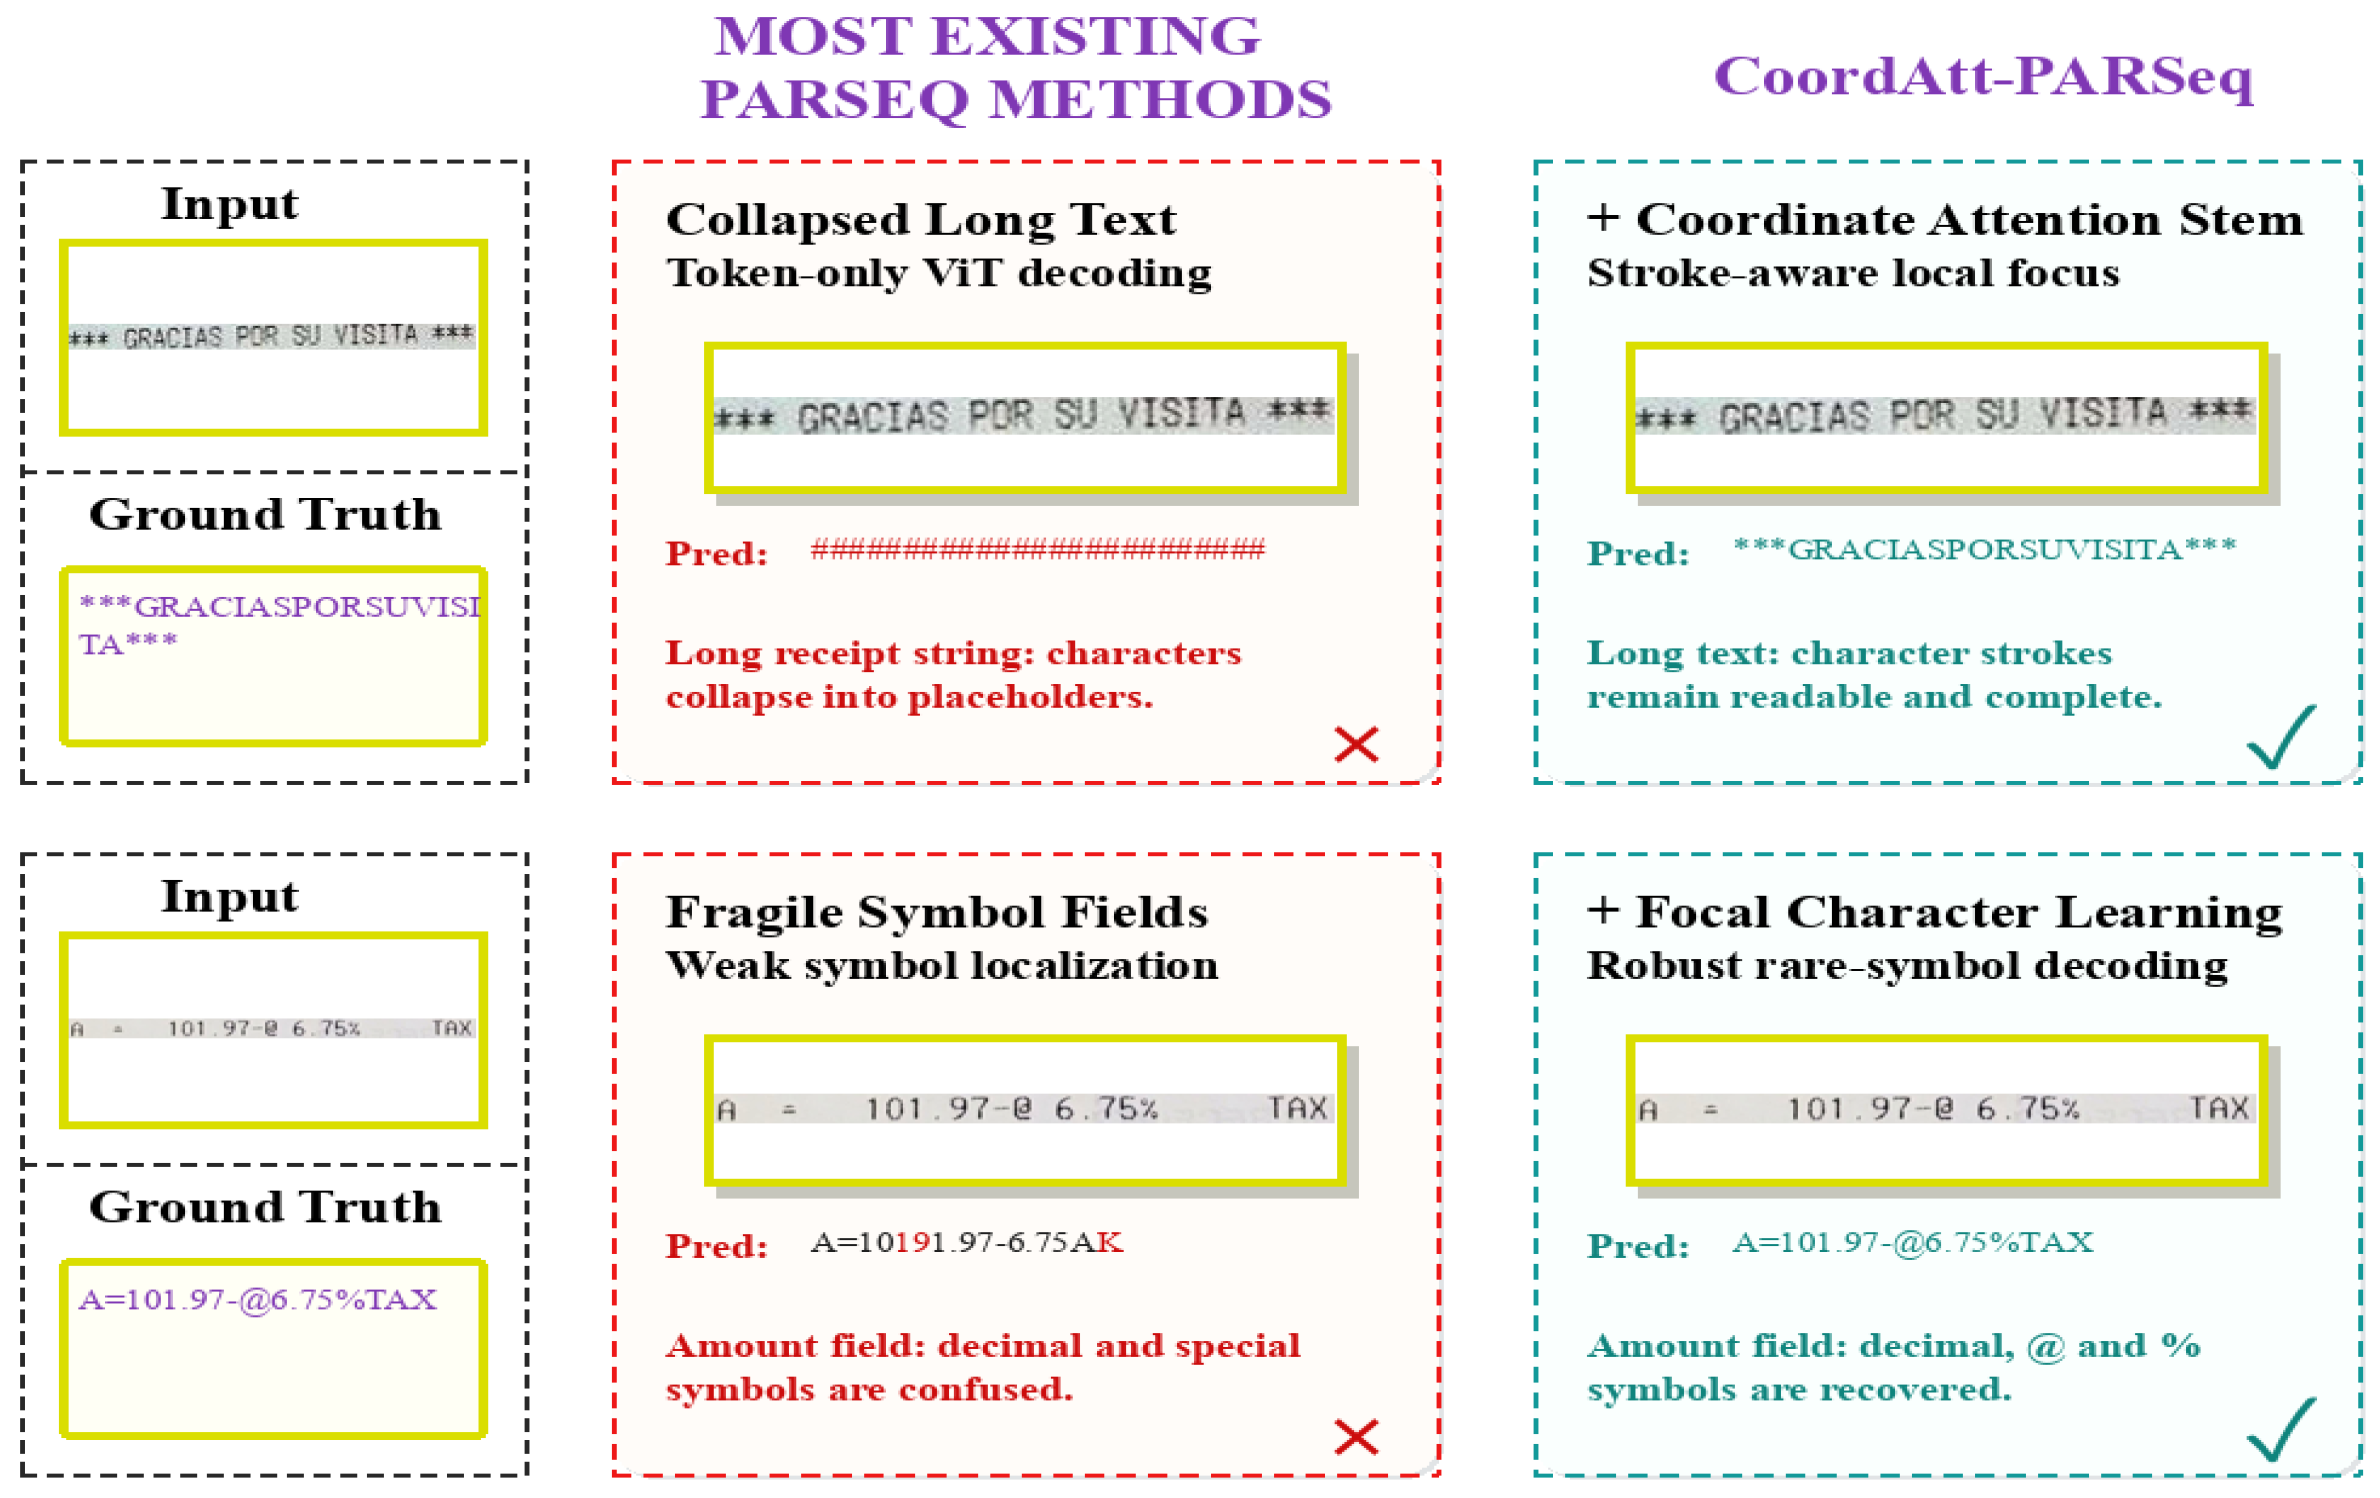
PARSeq nonetheless exhibits two failure modes when transferred to fiscal receipts (Figure 1). First, its tokenizer is a vanilla ViT patch embedding that linearizes the 2-D image into a 1-D token sequence and discards the strict horizontal and vertical alignment that defines a receipt; this loss of spatial inductive bias makes the model unable to separate a red stamp stroke from a thin character stroke, leading to dropped digits and hallucinated currency marks. Second, PARSeq is optimized with token-level cross-entropy that weights every character equally. On WildReceipt, the character histogram is severely long-tailed: decimal points, “$” symbols, and merchant-specific abbreviations are rare, yet each error costs the entire transaction record [19].
We address both issues with two surgical, lightweight modifications. We prepend a Coordinate Attention (CoordAtt) stem [20] (CoordAtt decouples 2-D spatial attention into two complementary 1-D pooling operations along the height and width axes, thereby retaining long-range directional context with negligible parameter cost.) to the ViT encoder so that horizontal and vertical spatial priors are reintroduced before patch flattening. We replace the default cross-entropy loss with a Focal Loss in the spirit of Lin et al. [21] so that the optimizer concentrates on the long-tailed but business-critical characters. The resulting model, CoordAtt-PARSeq, preserves a computational profile close to PARSeq-tiny while yielding consistent improvements on two cropped receipt recognition benchmarks.
We emphasize that this work does not claim CoordAtt or Focal Loss as new algorithms. Its technical contribution is a receipt-specific adaptation of PARSeq-tiny in which direction-aware spatial filtering is placed before ViT patch tokenization and imbalance-aware character learning is applied to finance-critical long-tailed symbols. This placement is important because the receipt-line geometry is weakened once the image has been converted into one-dimensional patch tokens. The experiments are therefore designed to test whether this targeted integration improves cropped receipt text recognition under receipt-specific degradations, not whether CoordAtt or Focal Loss is generally superior in all OCR settings.
The scope of the study is cropped word-level recognition. We use ground-truth text-region annotations from WildReceipt and SROIE to crop text images and then evaluate the recognizer on these crops. A complete receipt OCR system would additionally require text detection, crop rectification, field grouping, and key information extraction; these stages are discussed as deployment considerations but are not evaluated as part of the main benchmark.
The contributions of this paper are threefold:
  • We analyze the limitations of pure Vision-Transformer-based STR models on fiscal receipt images, and attribute the performance gap mainly to the lack of explicit spatial inductive bias and the long-tailed distribution of receipt characters.
  • We develop CoordAtt-PARSeq, a lightweight extension of PARSeq-tiny that integrates a CoordAtt stem and Focal Loss. The CoordAtt stem introduces only 999 extra parameters, less than 0.02% of the model size, while preserving a computational profile close to that of the original PARSeq-tiny recognizer.
  • We conduct controlled experiments on WildReceipt and SROIE with five strong baselines, including CRNN, ViTSTR, ABINet, TRBA, and PARSeq-tiny. The results show that CoordAtt-PARSeq achieves the best performance on all reported main metrics, with absolute gains of 4.19 and 4.47 percentage points in case-insensitive word accuracy on WildReceipt and SROIE, respectively.
The remainder of this paper is organized as follows. Section 2 reviews related studies on scene text recognition, receipt OCR, attention-based feature enhancement, and class-imbalance learning. Section 3 presents the CoordAtt-PARSeq framework, including the overall architecture, CoordAtt stem, Focal Loss objective, and network configuration. Section 4 describes the experimental setup and reports the quantitative results, covering datasets, baselines, evaluation metrics, implementation details, main comparisons, ablation studies, and the sensitivity analysis of the Focal Loss focusing parameter. Section 5 discusses the qualitative results, per-symbol recognition errors, current limitations, and possible future work. Section 6 concludes the paper.

2. Related Work

Fiscal receipt recognition is a specialized branch of scene text recognition (STR), but it differs from generic natural-scene text in both visual form and semantic cost. Receipt images contain dense rows, weak strokes, stamps, folds, low contrast, and business-critical symbols. A missing decimal point, slash, or currency mark may change the meaning of an entire transaction. Following the structure of the original manuscript, this section reviews related work from three perspectives: scene text recognition, receipt/document understanding, and attention-based long-tailed character learning.

2.1. Scene Text Recognition

Scene text recognition has evolved from classical document OCR to modern Transformer-based sequence modeling. Early neural OCR was shaped by document recognition networks [22] and Connectionist Temporal Classification (CTC) [23], which made it possible to train sequence recognizers without explicit character-level alignment. CRNN [12] has become a widely used STR baseline, as it integrates CNN-based visual feature extraction, recurrent sequence representation, and CTC-based transcription within a unified recognition pipeline. Its compactness and stability make it a useful baseline, and related CNN-RNN recognizers remain common in OCR applications [24]. Large-scale synthetic datasets such as MJSynth [25] and SynthText [26], together with benchmarks such as IIIT5K [27] and ICDAR robust-reading tasks [28], further accelerated the development of STR.
Later methods improved STR by introducing rectification, attention, semantic reasoning, and stronger sequence decoders. ASTER [29] and MORAN [30] address irregular text through rectification and attention-based decoding, while a systematic study of Baek et al. [13] decomposes STR into transformation, feature extraction, sequence modeling, and prediction modules, establishing the widely used TRBA baseline. With the success of self-attention [31] and Vision Transformer [14], ViTSTR [15] directly applies ViT-style patch-token modeling to STR, and PARSeq [18] further improves sequence modeling through permuted autoregressive decoding.
Language-aware and vision–language recognizers attempt to resolve ambiguous visual evidence by using contextual reasoning. ABINet [16] introduces autonomous bidirectional language modeling, and ABINet++ [17] extends this idea to scene text spotting. Other approaches use semantic or visual–language interactions, including semantic reasoning networks [32], SEED [33], VisionLAN [34], TextScanner [35], and recent unified vision–language STR models [36,37,38]. These methods are effective when the linguistic context is reliable. However, receipt text often consists of prices, tax identifiers, addresses, item codes, and abbreviations, which are weakly linguistic and highly symbol-sensitive. Therefore, fiscal receipt OCR requires not only stronger sequence modeling, but also more robust visual representation and rare-symbol learning.

2.2. Receipt OCR and Document Understanding

Receipt OCR is closely connected with document understanding, but accurate low-level text recognition is still one of its main bottlenecks. The ICDAR 2019 SROIE benchmark [6] formalized the tasks of scanned receipt OCR and key information extraction, while WildReceipt [10] focuses more on receipt images collected in uncontrolled real-world scenarios, including stamps, folds, perspective distortion, uneven illumination, and dense layouts. These datasets suggest that receipt recognition should not be regarded as a simple document OCR problem. It involves the visual difficulty of in-the-wild STR, and also requires high semantic precision because the recognized content is often used in financial documents.
Document AI models usually combine layout, visual, and textual information to improve full-page understanding. LayoutLMv2 [7], LayoutLMv3 [39], and BROS [8] make use of spatial layout and text relationships for key information extraction (KIE). Donut [40] explores OCR-free document understanding, and TrOCR [41] formulates OCR as a Transformer-based encoder-decoder problem. Recent work has also studied localization-free receipt OCR [11]. These approaches are important for downstream document intelligence, but they do not eliminate the need for accurate text recognition. If a decimal point is missed or a currency symbol is incorrectly recognized, a downstream KIE model may still extract a value that is formally valid but financially wrong.
Recent studies further show that receipt OCR and document understanding are moving toward more specialized and deployment-aware systems. Yu et al. [42] study receipt recognition with multimodal alignment and lightweight sequence modeling, while Abdalla et al. [43] introduce a receipt question-answering benchmark that evaluates document-level reasoning after text has been extracted. For broader document OCR, Li et al. [44] combine layout analysis and optical character recognition for printed documents, Singh and Middleton [45] emphasize tabular context in OCR and reconstruction, and Heakl et al. [46] highlight multilingual and multi-domain document-understanding challenges. These works are complementary to the present study: they motivate full-pipeline document intelligence, whereas our experiments isolate the cropped receipt text recognizer so that the effect of the recognition model can be measured directly.
The practical value of receipt OCR is also reflected in industrial document-processing studies. Automated document processing and robotic process automation have been increasingly adopted in accounting and enterprise workflows [1,4,5]. Invoice and receipt extraction systems generally rely on both text recognition and layout analysis [2,3,9]. Therefore, improving the word-level recognizer remains meaningful even when document-level models are available, since a more reliable OCR layer can directly benefit auditing, reimbursement, and financial document understanding.
The scope of text analysis is broader than OCR. For example, recent domain-specific text-analysis systems use Transformer models [47] and graph neural networks [48] to classify fire-door inspection defects after textual records are available. These studies address downstream text classification rather than visual text recognition, but they illustrate how an OCR module may be combined with task-specific text analytics. In a fiscal receipt pipeline, CoordAtt-PARSeq could serve as the visual recognition layer before layout-aware extraction, question answering, anomaly detection, or compliance analysis.

2.3. Attention Stems and Class-Imbalance Learning

Transformer-based recognizers are effective for global modeling, but their standard patch embedding may weaken the original two-dimensional structure of receipt text. In a ViT-style recognizer, an image is first divided into patches and then represented as a one-dimensional token sequence. This design is powerful for global attention, but it does not explicitly preserve local inductive bias, which is useful for maintaining text-line continuity and separating adjacent rows. Convolutional backbones such as ResNet [49] naturally provide local priors, while lightweight attention modules can further improve feature selectivity. Squeeze-and-Excitation networks [50] recalibrate channel responses, CBAM [51] combines channel and spatial attention, and CoordAtt stem [20] decomposes spatial attention into height-wise and width-wise encodings. This factorization fits the geometry of receipt images well: the horizontal branch helps preserve long text lines, while the vertical branch helps distinguish neighboring rows.
In addition to visual degradation, receipt OCR also faces long-tailed character distributions. Common letters and digits take up most of the corpus, whereas decimal points, slashes, hyphens, colons, and currency symbols appear less frequently but often carry important semantic value. Focal Loss [21] was originally proposed to make dense object detection focus more on hard examples, and this idea is also useful for rare receipt characters. More broadly, class-balanced learning and surveys on imbalanced deep learning show that reweighting can be beneficial when tail classes are rare but important. In this work, the CoordAtt stem and Focal Loss address two complementary bottlenecks: the former restores direction-aware spatial inductive bias before patch embedding, while the latter increases the optimization emphasis on hard and under-represented receipt symbols. This combination adapts PARSeq to the structural and statistical properties of fiscal receipt recognition without replacing it with a larger recognizer.

3. Methodology

3.1. Overall Architecture

For a cropped receipt text image X R H × W × 3 , the proposed model predicts a character sequence Y = ( y 1 , , y T ) from a fixed recognition alphabet. The recognition process follows three main steps. First, the input image is processed by a CoordAtt stem Φ CA , which suppresses spatial interference and produces a refined image-like feature map X R H × W × 3 . Second, the PARSeq encoder [18] divides X into patches, maps them into visual tokens, and models their context through L Transformer blocks. Third, a permuted autoregressive decoder predicts the output sequence Y under multiple decoding orders, with training supervised by the proposed Focal Loss L FCE . The encoder and decoder parts keep the original PARSeq-tiny setting, so that the effect of the CoordAtt stem and the loss function can be compared fairly with the baseline.

3.2. CoordAtt Stem

In a vanilla ViT, the patch-embedding layer converts a two-dimensional image into a one-dimensional sequence of patch tokens. This design is suitable for global self-attention, but it weakens explicit spatial cues along the horizontal and vertical directions. Such cues are important for fiscal receipt recognition, since receipt images usually contain dense text rows, tabular layouts, numerical fields, and short expressions where small symbols matter. The horizontal direction is mainly related to text-line continuity, whereas the vertical direction helps separate neighboring rows and overlapping fields. After patch flattening, these geometric relations are no longer directly represented and must be learned implicitly by the Transformer encoder. This is unfavorable for receipt images affected by stamps, folds, shadows, low contrast, or micro-fonts.
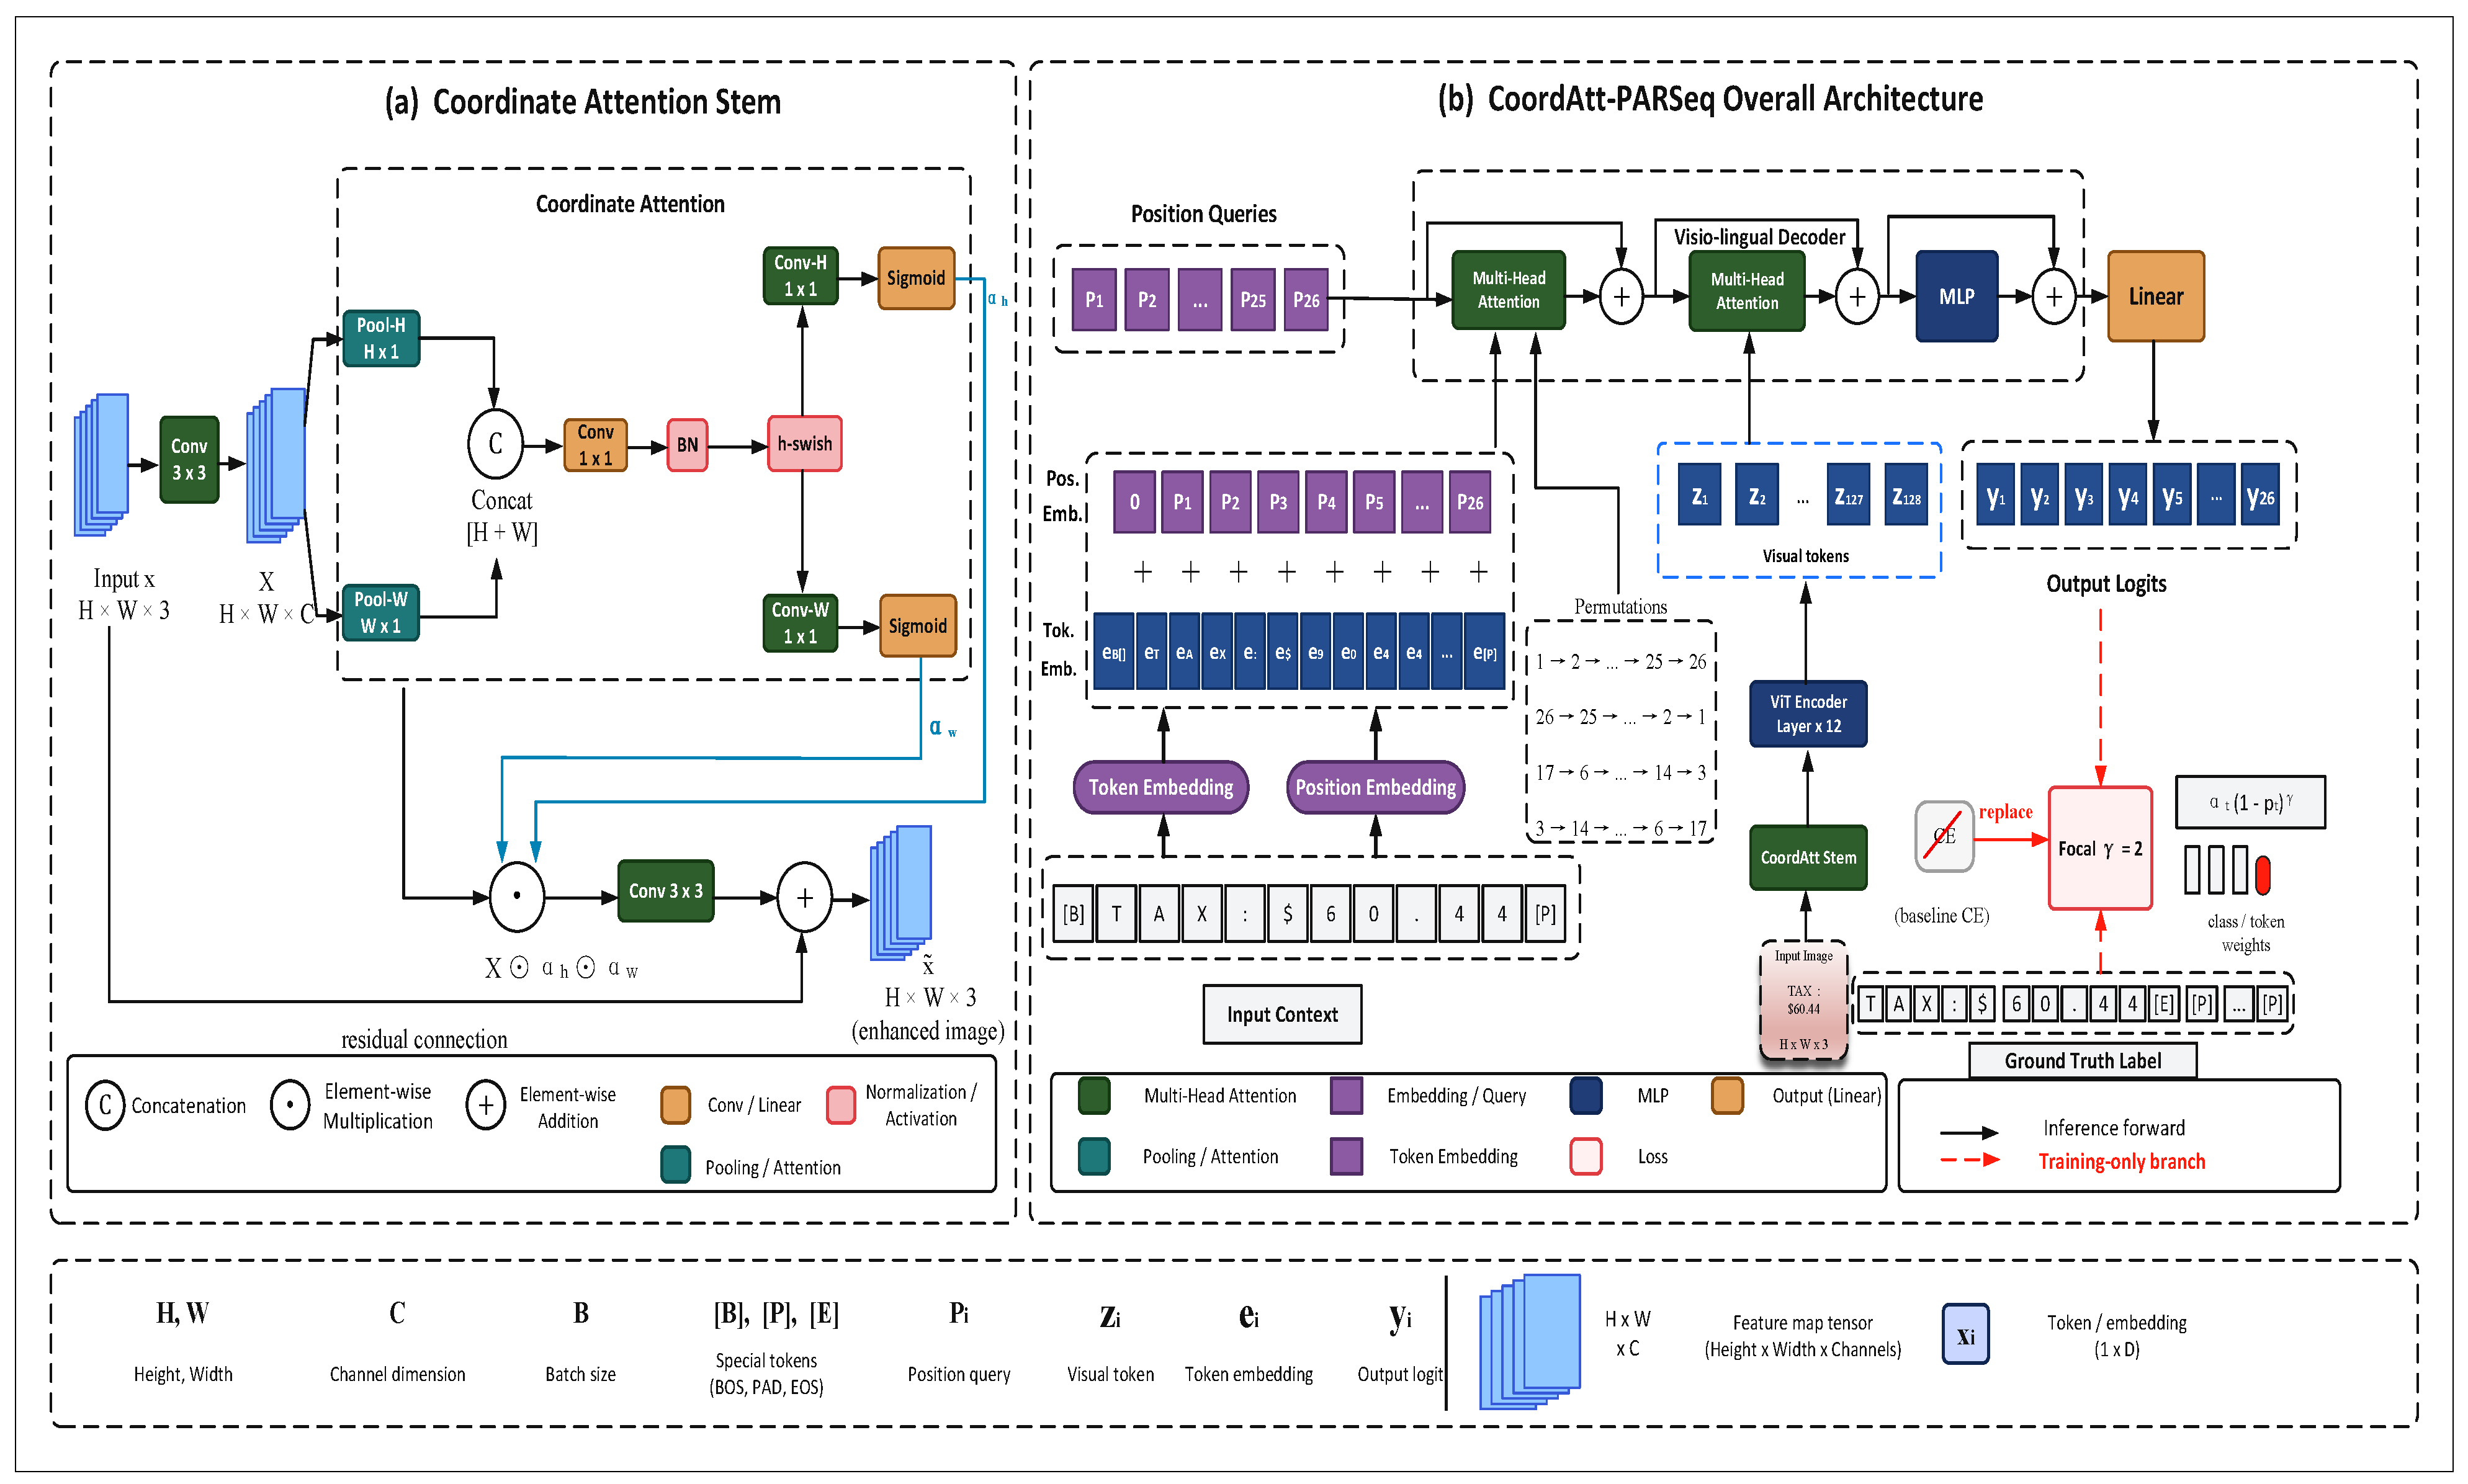
To keep these spatial cues before tokenization, we insert a lightweight CoordAtt stem block [20] before the ViT patch-embedding layer, as illustrated in Figure 2. The stem is not intended to replace the Transformer backbone. Instead, it provides a simple direction-aware enhancement for the input image, so that the following PARSeq recognizer receives a representation where character strokes and receipt-line patterns have been strengthened. The spatial resolution and channel number are kept unchanged.
Given an input image x R H × W × 3 , the CoordAtt stem first uses a 3 × 3 convolution to obtain shallow visual features:
X = Conv 3 × 3 ( x ) , X R H × W × C .
This operation gives the stem a small local receptive field, allowing it to capture stroke edges, local contrast changes, and weak texture patterns before directional aggregation. Since it is only a shallow transformation, the added computational cost remains limited.
Next, global pooling is performed separately along the two spatial directions:
z c h ( h ) = 1 W w = 1 W X c ( h , w ) , z c w ( w ) = 1 H h = 1 H X c ( h , w ) ,
where z h R H × 1 × C describes the height-direction context, and z w R 1 × W × C describes the width-direction context. The former summarizes information across each row and keeps the vertical position of text responses, while the latter summarizes information across each column and helps retain horizontal text continuity. Compared with ordinary two-dimensional global pooling, this factorized design preserves positional information in one direction while collecting context in the other, which is more suitable for the row-wise structure of receipts.
The two directional descriptors are concatenated along the spatial dimension and processed by a shared transformation:
F = δ BN Conv 1 × 1 [ z h , z w ] ,
where [ · , · ] denotes concatenation, BN ( · ) is batch normalization, and δ ( · ) is the h-swish activation function. The shared 1 × 1 convolution mixes the coordinate-aware information from both directions, so that horizontal text continuity and vertical row separation can be modeled jointly. The fused feature F is then divided back into two parts:
F = [ F h , F w ] .
Two independent 1 × 1 convolution branches followed by sigmoid functions are used to generate the height-wise and width-wise attention maps:
α h = σ Conv 1 × 1 h ( F h ) , α w = σ Conv 1 × 1 w ( F w ) ,
where σ ( · ) denotes the sigmoid activation function. The attention map α h modulates features along the height direction, helping the network distinguish different receipt rows. The attention map α w modulates features along the width direction, which is useful for preserving long text strings and numerical fields.
The enhanced feature map is obtained by element-wise multiplication:
X ^ = X α h α w ,
where ⊙ denotes element-wise multiplication. In this way, the stem can increase the responses of likely character-stroke regions and reduce the influence of less informative background areas. This is useful for receipt OCR, where the target text often appears together with red stamps, paper texture, compression artifacts, and low-contrast thermal printing.
Finally, another 3 × 3 convolution maps the enhanced feature map back to three channels, and the result is added to the original input image through a residual connection:
x ˜ = x + Conv 3 × 3 ( X ^ ) .
The residual design keeps the original visual appearance and avoids excessive changes caused by the lightweight stem. It also makes the CoordAtt stem a plug-in module, since its output has the same shape as the input:
x ˜ R H × W × 3 .
Therefore, x ˜ can be directly sent to the original ViT patch-embedding layer of PARSeq, without changing the encoder, decoder, positional queries, or decoding strategy.
With this design, the CoordAtt stem works as a direction-aware spatial filter before Transformer tokenization. The height branch provides cues for separating nearby text rows, and the width branch helps maintain the continuity of long receipt lines. Their combination strengthens character stroke regions, improves weak or small symbols, and reduces interference from stamps, folds, shadows, and low-contrast backgrounds. Thus, the ViT encoder receives patch tokens generated from a spatially refined receipt image rather than from the raw degraded crop.

3.3. Focal Loss

The original PARSeq model uses token-level cross-entropy:
L CE = t = 1 T log p t ,
where p t is the predicted probability assigned to the ground-truth character at position t. This objective treats frequent and rare characters with the same weight. For example, a common letter such as “e” and a rare but an important symbol such as a decimal point or the “$” sign contribute equally to the loss. In WildReceipt, the character distribution is strongly long-tailed: decimal points account for 3.31 % of all tokens, and currency symbols account for only 0.72 % . Although these symbols are much less frequent than ordinary letters and digits, an error in them may change the financial meaning of a receipt item. For instance, misreading “$1.99” as “$199” would be unacceptable for downstream accounting.
To increase the training emphasis on such difficult and under-represented characters, we replace L CE with Focal Loss [21]:
L FCE = t = 1 T α y t ( 1 p t ) γ log p t ,
where the focusing parameter is selected from γ { 1 , 2 , 3 } . The class weight α y t is computed from the smoothed empirical character frequency on the training split. Let n c denote the number of occurrences of character class c, and let C denote the character vocabulary. We first compute
f c = n c + ϵ k C ( n k + ϵ ) ,
then form the raw inverse-frequency weight
α ˜ c = 1 f c .
To prevent extremely rare symbols from producing unstable gradients, the raw weights are normalized by their mean and clipped to a bounded interval:
α c = clip α ˜ c 1 | C | k C α ˜ k , α min , α max ,
where α min = 0.25 and α max = 4.0 . In the main experiments, we use γ = 2.0 with this clipped inverse-frequency weighting. We distinguish this setting from two special cases: γ = 0 with uniform α is standard cross-entropy, whereas γ = 0 with non-uniform inverse-frequency α is weighted cross-entropy. This formulation gives larger gradient contributions to hard or rare tokens, while gradually reducing the influence of easy and common tokens [19].

3.4. Network Architecture in Detail

Figure 2 shows the detailed structure of CoordAtt-PARSeq. A lightweight Coordinate Attention module is inserted before the PARSeq-tiny recognizer. The module contains two 3 × 3 convolutional layers. The first one maps the input image from three channels to 12 low-level feature channels. Adaptive average pooling is then applied separately in the vertical and horizontal directions to obtain coordinate-sensitive contextual features. The two directional features are concatenated and processed by a 1 × 1 convolution, batch normalization, and an h-swish activation function. Two separate branches then predict the height-wise and width-wise attention maps. After feature reweighting, another 3 × 3 convolution compresses the features back to three channels, and a residual connection fuses them with the original input. Therefore, the image passed to the ViT patch-embedding layer keeps the same spatial size and channel number as the original image.
The recognition backbone follows the PARSeq-tiny configuration. Each input image is resized and normalized to 32 × 128 . With a patch size of 4 × 8 , the encoder receives 128 visual tokens. The encoder consists of 12 Transformer layers with an embedding dimension of 192 and three attention heads. The decoder has one Transformer decoder layer with six attention heads. The original permuted autoregressive training strategy of PARSeq is retained. During inference, autoregressive decoding is first performed and then followed by one refinement step. The standard cross-entropy objective is replaced by focal cross-entropy, with the focusing parameter fixed at γ = 2.0 , so as to improve learning on rare and hard-to-recognize characters.
According to the current source-code statistics, PARSeq-tiny has approximately 6.018 M parameters, while CoordAtt-PARSeq has approximately 6.019 M parameters. The CoordAtt stem adds only 999 parameters, which corresponds to less than a 0.02 % increase in model size. This shows that the proposed modification is lightweight in terms of model capacity. However, parameter count alone does not fully describe deployment cost, because the CoordAtt stem also adds convolution, pooling, and element-wise operations before patch embedding. Therefore, the lightweight claim is evaluated together with measured FLOPs, latency, and throughput under the same CUDA setting in Section 4.3. Apart from inserting.

4. Experimental Analysis

4.1. Datasets

We evaluate CoordAtt-PARSeq on two complementary fiscal receipt benchmarks, WildReceipt and SROIE. The two datasets are selected because they reflect different acquisition conditions and therefore test different aspects of model robustness. WildReceipt emphasizes in-the-wild receipt photographs with strong visual interference, while SROIE focuses on scanned receipt images with dense business text and structured numerical fields. Evaluating on both datasets allows us to examine whether the proposed CoordAtt stem and Focal Loss improve only a single data source or provide a more general benefit for fiscal receipt OCR. Table 1 summarizes the dataset partitions and cropped text image statistics.
WildReceipt [10] is an in-the-wild receipt dataset containing 1739 photographs from 25 different merchant templates. It includes severe real-world degradations such as red official stamps, paper folds, perspective distortion, uneven lighting, low contrast, and micro-printed item codes. Following common STR evaluation practice [13,18], we extract word-level crops from the annotated ground-truth quadrilaterals, obtaining approximately 40k training crops and 15k test crops. This dataset is used as the primary benchmark because it directly captures the two difficulties targeted by our method: spatial degradation caused by receipt-specific visual noise, and recognition uncertainty caused by small or rare symbols.
SROIE [6], formally the ICDAR-2019 scanned receipt OCR and information extraction benchmark, contains 626 training images and 347 test images of English receipts annotated with bounding boxes and transcriptions. We crop word-level samples from the provided bounding boxes and evaluate on the official test split. Compared with WildReceipt, SROIE contains cleaner scanned receipts, but it still includes dense layouts, numerical fields, merchant-specific strings, and business-critical punctuation. It is therefore used as a complementary benchmark to test whether the proposed model generalizes from in-the-wild receipt photographs to scanned receipt documents.
For both datasets, we evaluate cropped word-level text recognition rather than full-page detection. WildReceipt provides quadrilateral text annotations, and SROIE provides bounding-box annotations. We convert each annotated text region into a rectangular crop by taking the tight enclosing rectangle of the quadrilateral or box, adding a small boundary margin when it remains inside the image, and resizing the crop to 32 × 128 for recognition. Crops with empty transcriptions, invalid coordinates, or unreadable labels marked by the dataset annotation are removed. Labels are normalized only by the evaluation protocol: case is preserved for strict accuracy and converted only for the ignore-case metric. Non-ASCII characters and labels containing unsupported control characters are excluded from the cropped-text benchmark because the PARSeq-tiny tokenizer used here is ASCII based. The maximum decoded label length is 25. Labels longer than this limit are not used for training or evaluation, so the reported scores measure recognition under a fixed-length STR setting rather than arbitrary-length document transcription. During decoding, BOS and EOS are internal sequence-control tokens, PAD is used only for batching and masked loss computation, and these special tokens are never counted as output characters in the evaluation metrics.

4.2. Baselines and Evaluation Metrics

We compare CoordAtt-PARSeq, denoted as Ours, with five representative STR baselines covering the main recognition paradigms. CRNN [12] represents the classical convolutional–recurrent family, which extracts visual features with a CNN and models character sequences with recurrent layers. Related CNN-RNN recognizers remain practical OCR baselines [24]. TRBA [13] represents the carefully standardized transformation-feature-sequence-prediction pipeline and provides a strong traditional STR reference. ViTSTR [15] is included as a pure ViT-based recognizer, which is particularly relevant because our method also uses a Transformer-based visual backbone. ABINet [16] represents language-driven recognition, where bidirectional language modeling is used to correct visually ambiguous predictions. Finally, PARSeq-tiny [18] is the direct backbone of our method and therefore serves as the most important baseline for evaluating the effect of the proposed modifications.
To isolate the contribution of each proposed component, we report two controlled ablation variants in addition to the full model. Base+CoordAtt adds only the CoordAtt stem to PARSeq-tiny while retaining the standard cross-entropy objective. Base + Loss keeps the original visual front-end of PARSeq-tiny but replaces cross-entropy with Focal Loss. The full model, Ours, combines both components. This experimental design tests three questions: whether the spatial stem alone improves receipt recognition, whether imbalance-aware token learning alone is beneficial, and whether the two components provide complementary gains.
We use four evaluation metrics following common STR practice [13,18]. Word accuracy (Ignore Case) measures exact string matching after case normalization and reflects the recognizer’s ability to recover the semantic content of a word or field. Word accuracy (Strict) requires exact case-sensitive matching and is more demanding for merchant names, addresses, and abbreviated fields. Normalized Edit Distance (NED) measures character-level similarity between prediction and ground truth, which is useful for long receipt strings where a single wrong character would make word accuracy zero. Character Error Rate (CER) reports normalized substitution, insertion, and deletion errors. Higher values indicate better performance for word accuracy and NED, while lower values indicate better performance for CER.

4.3. Implementation Details

All models were trained and evaluated on cropped receipt text images, and each crop was uniformly resized to 32 × 128 . The PARSeq-tiny backbone used a patch size of 4 × 8 , 12 Transformer encoder blocks, an embedding dimension of 192, and three encoder attention heads, together with a single-layer Transformer decoder using six decoder attention heads. The maximum label length was set to 25, and the training character set contained 94 visible ASCII characters. For the remaining baseline methods, their original network structures were kept, while training and evaluation were conducted under consistent data splits, input resolution, and evaluation criteria.
The models were trained for 20 epochs using the same optimization protocol as PARSeq-tiny. Specifically, all compared PARSeq-family variants used the AdamW optimizer with an initial learning rate of 7 × 10 4 , a step-level OneCycle learning-rate schedule with a warm-up proportion of 0.075 , a gradient-clipping threshold of 20, and mixed-precision training. The current configuration used weight_decay = 0.0. Data augmentation followed the RandAugment pipeline of the STRHub/PARSeq codebase (PyTorch 1.13.1, CUDA 11.7, Python 3.10). In the dataset-specific training configuration, the batch size was 64 for WildReceipt and 128 for SROIE; the default batch size in the main configuration was 384. Training and evaluation were conducted on an NVIDIA A100 GPU (CUDA 11.7) with random seed 42. No augmentation was applied during validation or testing; the images were only processed by bicubic interpolation, resizing, tensorization, and normalization.
CoordAtt-PARSeq introduces a Coordinate Attention stem ahead of the ViT patch-embedding layer. The stem begins with a 3 × 3 convolution to obtain shallow visual features, and then applies coordinate pooling separately in the height and width directions so that direction-aware attention responses can be estimated. These attention responses are multiplied with the feature map to strengthen text-stroke areas. After that, another 3 × 3 convolution maps the features back to three channels, and the result is combined with the original image by a residual connection. In this way, the spatial resolution and channel number remain the same before and after the stem.
For the training objective, the baseline model adopted the conventional cross-entropy loss, whereas CoordAtt-PARSeq used focal cross-entropy with γ = 2.0 . By weakening the contribution of easy-to-classify characters, this objective encourages the model to pay more attention to difficult cases, such as long-tailed receipt characters, special symbols, and rarely appearing text patterns. To make the comparison fair, all baseline methods, ablation variants, and the final model were trained and tested with identical data splits, input resolution, optimizer settings, learning-rate schedule, and evaluation protocol. Thus, the performance gap mainly reflects the effects of the architectural modification and the loss-function design.
The proposed model was trained under the same fine-tuning recipe and NVIDIA A100 CUDA mixed-precision environment as PARSeq-tiny. All models were fine-tuned for 20 epochs with random seed 42, using the same input resolution, optimizer, OneCycle learning-rate schedule, gradient clipping rule, augmentation policy, label-processing rules, and evaluation environment. The baseline PARSeq-tiny and CoordAtt-PARSeq were therefore compared under a matched protocol, with the only architectural change being the inserted CoordAtt stem and the only objective change being the focal character-learning loss. For the other baselines, the original model structures were retained and fine-tuned from their corresponding pretrained/public configurations under the same cropped-text protocol. The official test split was used only for final evaluation, and no early stopping or hyperparameter selection was performed on the test data. The reported numbers are from the seed-42 run; this is now stated explicitly to avoid implying repeated-run averages.
The efficiency results in Table 2 show that CoordAtt-PARSeq preserves a close computational profile to PARSeq-tiny. The additional CoordAtt stem increases the parameter count only from 6.018 M to 6.019 M and FLOPs from 1.533 G to 1.539 G, and it reduces throughput from 1108.46 FPS to 1050.82 FPS under the same NVIDIA A100 CUDA batch-128 setting, corresponding to an estimated latency change from 0.90 ms/image to 0.95 ms/image. This small overhead supports the claim that the proposed modification is lightweight in practical inference, while the main accuracy gains are reported in Table 3 and Table 4.

4.4. Main Results

Table 3 reports the comparison on WildReceipt, and Table 4 reports the comparison on SROIE. CoordAtt-PARSeq achieves the best performance on every reported main evaluation metric across both datasets. This is important because the metrics measure complementary properties: exact word-level correctness, case-sensitive fidelity, character-level similarity, and edit-error rate.
On WildReceipt, Ours reaches 86.07 % word accuracy (Ignore Case), 85.47 % strict word accuracy, 97.55 % NED, and 5.09 % CER. Compared with the PARSeq-tiny backbone, this corresponds to an absolute gain of 4.19 points in ignore-case word accuracy, 4.07 points in strict word accuracy, 1.11 points in NED, and an absolute CER reduction of 1.85 points. The improvement over PARSeq-tiny is particularly meaningful because both models share the same core recognition backbone. The gain is therefore unlikely to be explained by a larger decoder or a different recognition paradigm; instead, it is consistent with the intended effects of injecting spatial inductive bias and rare-character-aware optimization.
On SROIE, Ours reaches 81.20 % word accuracy (Ignore Case), 80.31 % strict word accuracy, 96.09 % NED, and 9.24 % CER. Compared with PARSeq-tiny, the ignore-case word accuracy improves by 4.47 points, strict word accuracy improves by 4.39 points, NED improves by 1.50 points, and CER is reduced by 1.84 points. The consistent improvement on SROIE shows that the proposed components are not over-specialized to WildReceipt. Instead, they also help with scanned receipt images, where dense numerical fields and punctuation remain challenging even when acquisition noise is weaker.

4.5. Ablation Study

Table 5 presents the controlled ablation results on WildReceipt and SROIE. The ablation study is designed to verify whether the two proposed components address different bottlenecks. The CoordAtt stem is expected to improve the visual representation before patch tokenization, while Focal Loss is expected to improve learning on difficult and under-represented characters.
On WildReceipt, adding only the CoordAtt stem improves the PARSeq-tiny baseline from 81.88 % to 84.21 % word accuracy (Ignore Case), while reducing CER from 6.94 % to 5.91 % . This confirms that spatial enhancement alone is useful for in-the-wild receipt photographs, where stamps, folds, shadows, and low contrast can corrupt the patch-token representation. Replacing only the loss with Focal Loss improves ignore-case word accuracy to 85.19 % and reduces CER to 5.78 % , indicating that imbalance-aware training is also effective even without modifying the visual front-end. When the two components are combined, Ours reaches 86.07 % word accuracy (Ignore Case) and 5.09 % CER, achieving the strongest overall performance.
The same trend appears on SROIE. Base+CoordAtt improves Word Accuracy (Ignore Case) from 76.73 % to 78.21 % and reduces CER from 11.08 % to 9.92 % . Base + Loss further improves ignore-case accuracy to 79.47 % and reduces CER to 9.85 % . The full model obtains the best result, with 81.20 % word accuracy (Ignore Case), 80.31 % strict word accuracy, 96.09 % NED, and 9.24 % CER. These results support the central claim of this work: spatial degradation and long-tailed character learning are complementary bottlenecks in fiscal receipt recognition, and addressing both produces the most robust recognizer.

4.6. Sensitivity Analysis of Focal Loss Parameter γ

To further examine the influence of the focusing parameter in Focal Loss, we conduct a sensitivity analysis on WildReceipt by varying γ from 0.0 to 3.0 . The setting γ = 0.0 is equivalent to the standard cross-entropy loss under the same CoordAtt-stem architecture because the class weights are disabled in this reference setting. Therefore, this experiment isolates the effect of the focal reweighting term while keeping the visual front-end unchanged.
As shown in Table 6, introducing the focal reweighting term consistently improves the CoordAtt-stem baseline. When γ = 0.0 , the model obtains 84.21% word accuracy (Ignore Case) and 5.91% CER. Increasing γ to 1.0 improves the ignore-case word accuracy to 85.69% and reduces CER to 5.16%, showing that down-weighting easy characters is beneficial for receipt text recognition. The best overall performance is achieved when γ = 2.0 , where the model reaches 86.07% word accuracy (Ignore Case), 85.47% strict word accuracy, 97.55% NED, and 5.09% CER.
When γ is further increased to 2.5 or 3.0 , the performance slightly decreases. This suggests that an excessively large focusing parameter may over-suppress easy or moderately difficult characters, which are still important for complete word recognition in receipt OCR. Therefore, we set γ = 2.0 in all main experiments, as it provides the best balance between emphasizing hard or under-represented characters and preserving stable learning on common receipt text patterns.
Following the reviewers’ request, we also summarize the loss-function controls in Table 7. The standard CE row corresponds to the γ = 0 setting with no class weighting, weighted CE isolates inverse-frequency class weighting without focal modulation, Focal Loss isolates the focusing term without class weighting, and weighted Focal Loss corresponds to the final CoordAtt-PARSeq objective with clipped inverse-frequency class weights and γ = 2 .
To address the need for stronger architectural controls, we add an attention module comparison on WildReceipt. Table 8 compares the proposed CoordAtt stem with a plain shallow convolutional stem, Squeeze-and-Excitation (SE), and CBAM under the same PARSeq-tiny backbone, focal character-learning objective, data split, and fine-tuning protocol. This design keeps the loss function fixed and changes only the front-end module, so it directly tests whether coordinate-factorized attention is more suitable for cropped receipt text recognition than simpler or more generic attention alternatives.
The added attention comparison narrows the architectural claim. The shallow convolutional stem performs slightly below Base + Loss, indicating that adding local convolution alone does not explain the improvement. SE and CBAM improve over Base + Loss, showing that lightweight channel or spatial attention is useful for cropped receipt recognition. CoordAtt-PARSeq achieves the best results among these controls, reaching 86.07% W.Acc. (IC), 85.47% strict word accuracy, 97.55% NED, and 5.09% CER. This supports the hypothesis that receipt-line directional factorization is better matched to this benchmark than generic channel or spatial attention. We therefore interpret the current evidence as support for the proposed receipt-specific design, not as a universal claim that CoordAtt is optimal among all lightweight front-end modules or OCR settings.

5. Discussion

5.1. Qualitative Behaviour

The quantitative results in Section 4 show that CoordAtt-PARSeq consistently improves word-level accuracy, NED, and CER on both WildReceipt and SROIE. This section further discusses where these gains come from. The central observation is that fiscal receipt recognition is not only a generic STR problem, but also a problem of recovering fragile financial symbols under severe visual interference. Therefore, qualitative comparisons are necessary to understand whether the proposed CoordAtt stem and focal character learning actually address the intended failure modes.
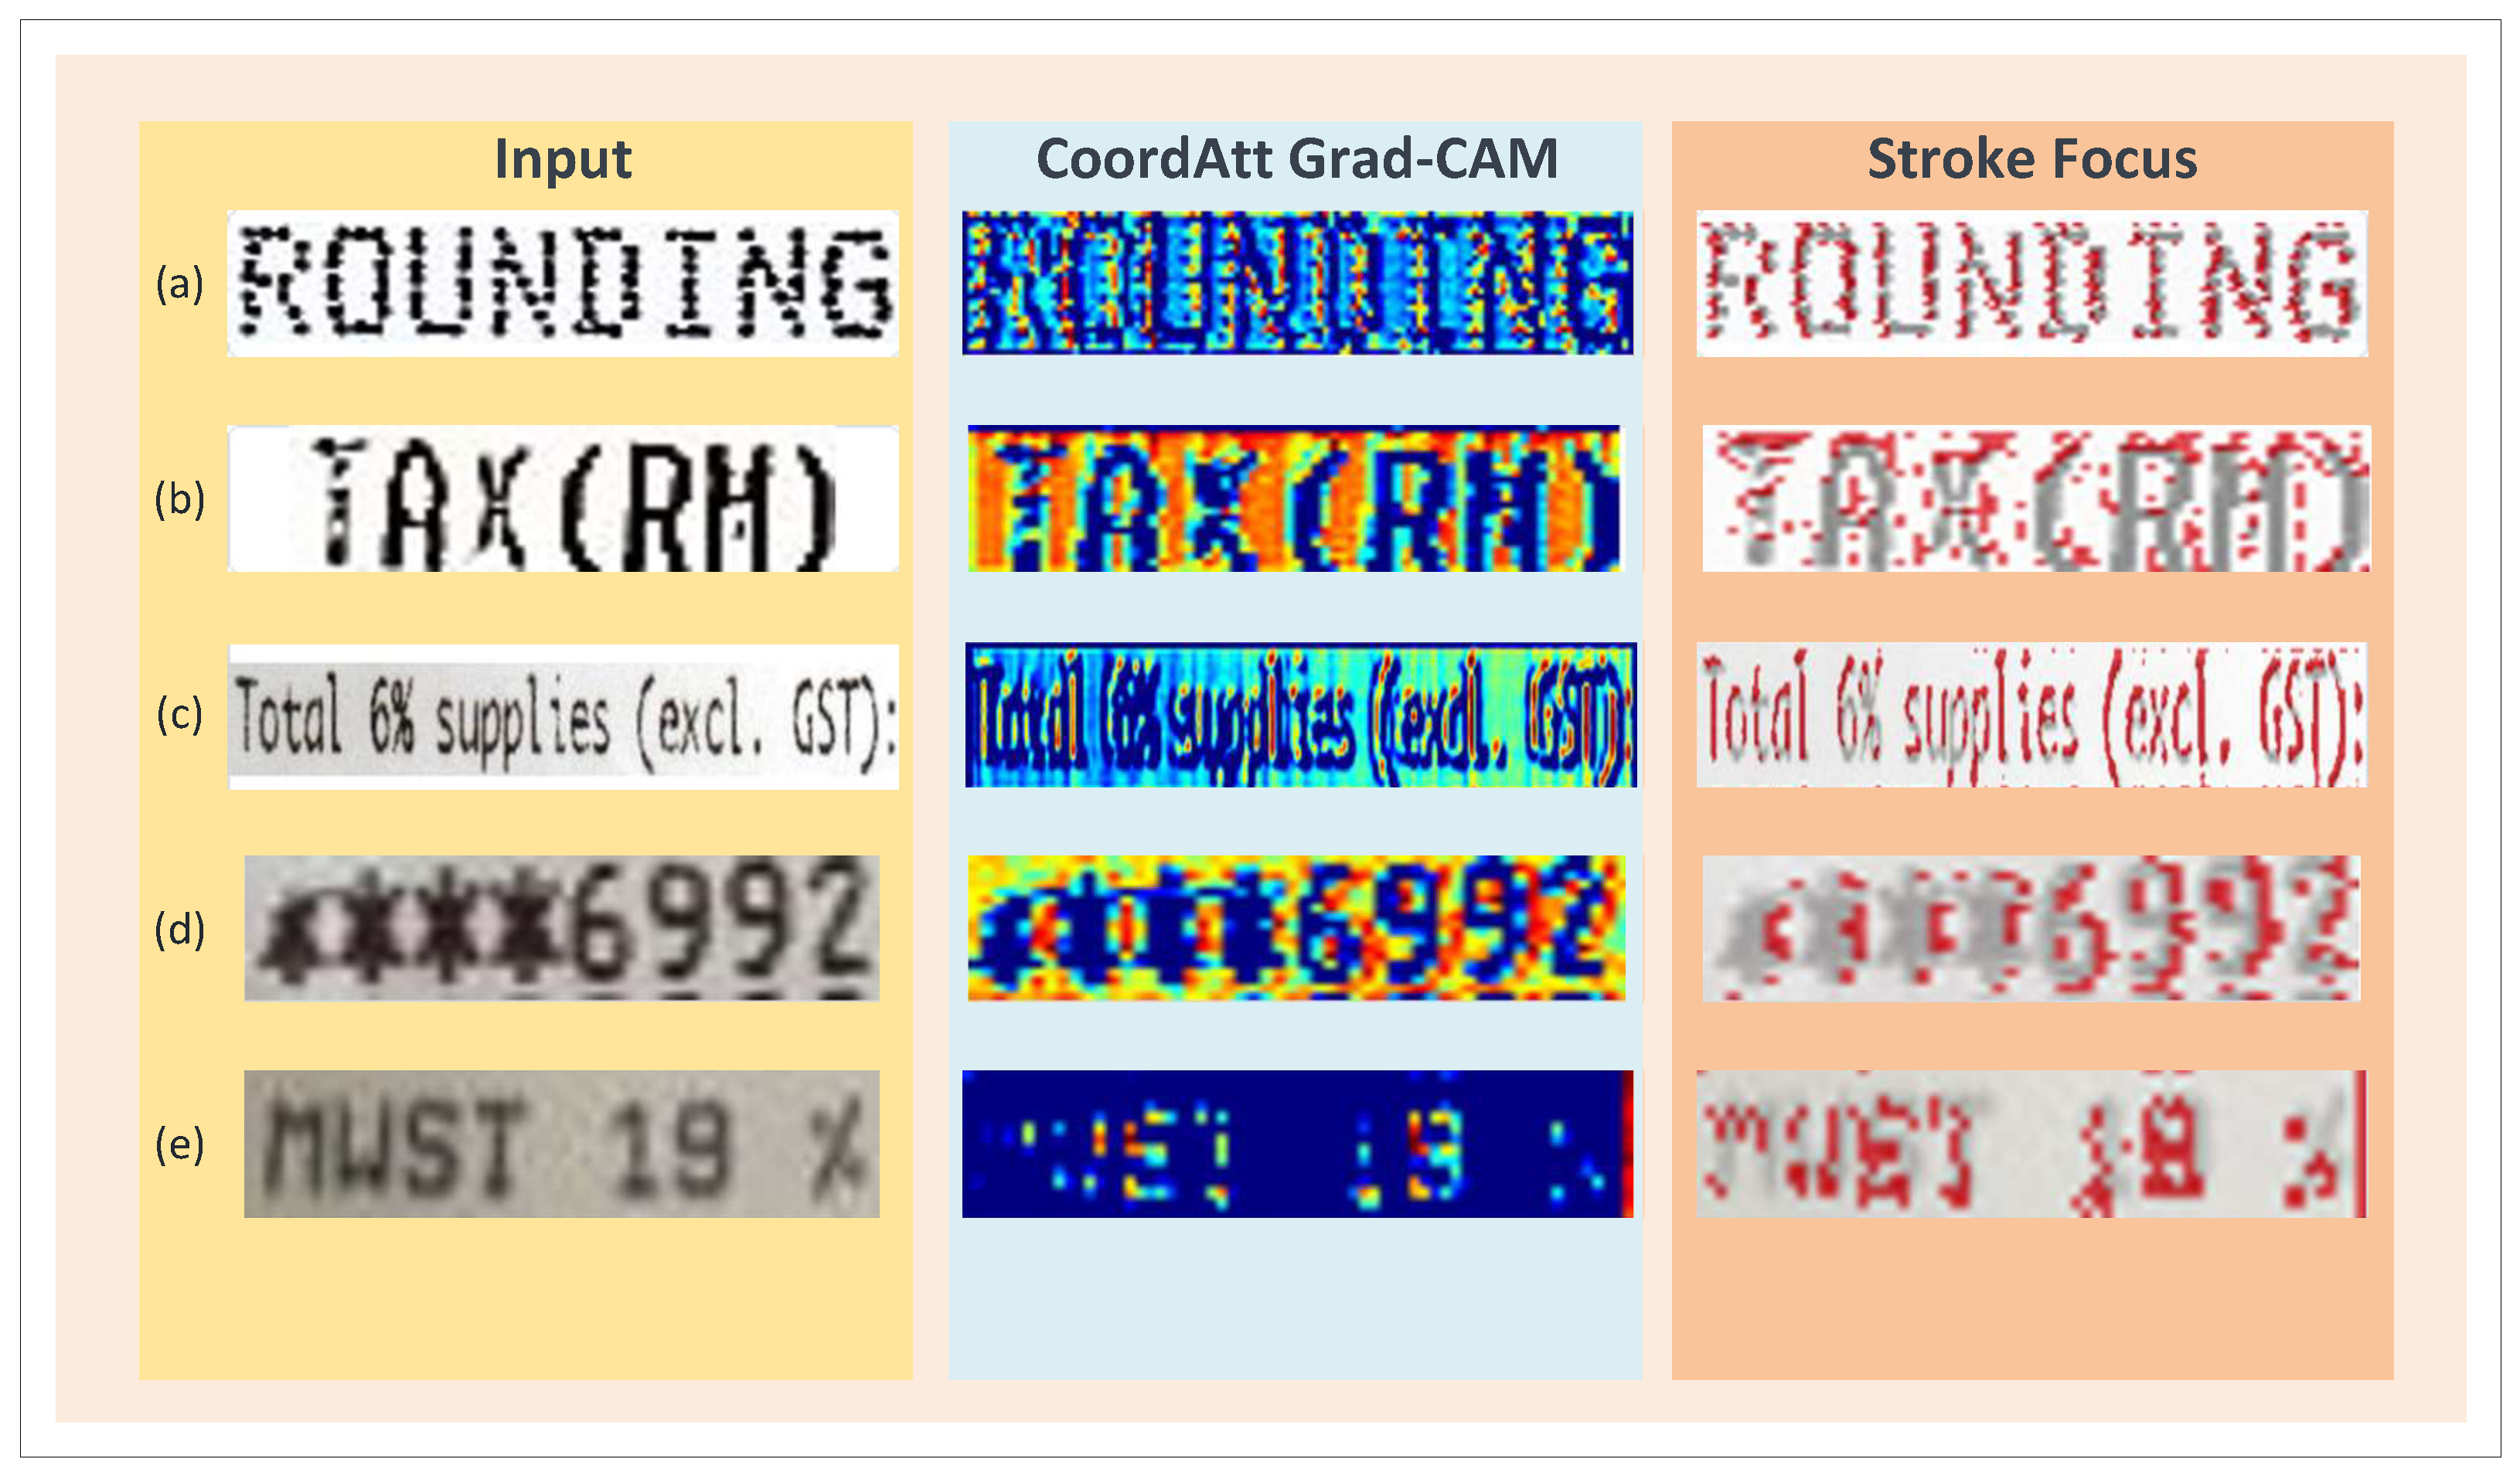
To further examine whether the proposed CoordAtt stem learns meaningful spatial cues, Figure 3 visualizes the Grad-CAM responses and stroke-focused regions of CoordAtt-PARSeq on representative receipt text crops.
The maps are used only as qualitative illustrations of the CoordAtt-enhanced recognizer, not as causal proof that the CoordAtt stem alone produces the improvement. Grad-CAM was computed at the final 3 × 3 convolution of the CoordAtt stem, immediately before the residual addition that feeds the patch-embedding stage. For each crop, the model first predicts the output sequence, and the scalar target is the mean of the top-1 logits over the predicted positions up to and including the end-of-sequence token. This target is back-propagated to obtain the gradient of the stem feature map. The channel-wise mean of the gradient is used to weight the feature map, and a ReLU is applied to the weighted sum to produce the class-activation response. The response is bicubically resized to the crop size and normalized between its lower and upper percentiles to [ 0 , 1 ] . The stroke-focused regions in the right column are obtained by combining the normalized response with an ink-and-edge map of the crop, where the ink term is the intensity-inverted grayscale and the edge term is a Canny edge map; pixels are highlighted when this combined score exceeds a high percentile threshold. The visualization shows that the model tends to activate around character strokes and horizontally continuous text regions, rather than spreading attention uniformly over the background. This result is in line with the motivation behind CoordAtt: the horizontal encoding path helps maintain the continuity of text lines, whereas the vertical encoding path offers row-aware information that is useful for distinguishing neighboring receipt lines. As a result, the enhanced representation supplied to the ViT encoder contains clearer local stroke information and stronger spatial regularity.
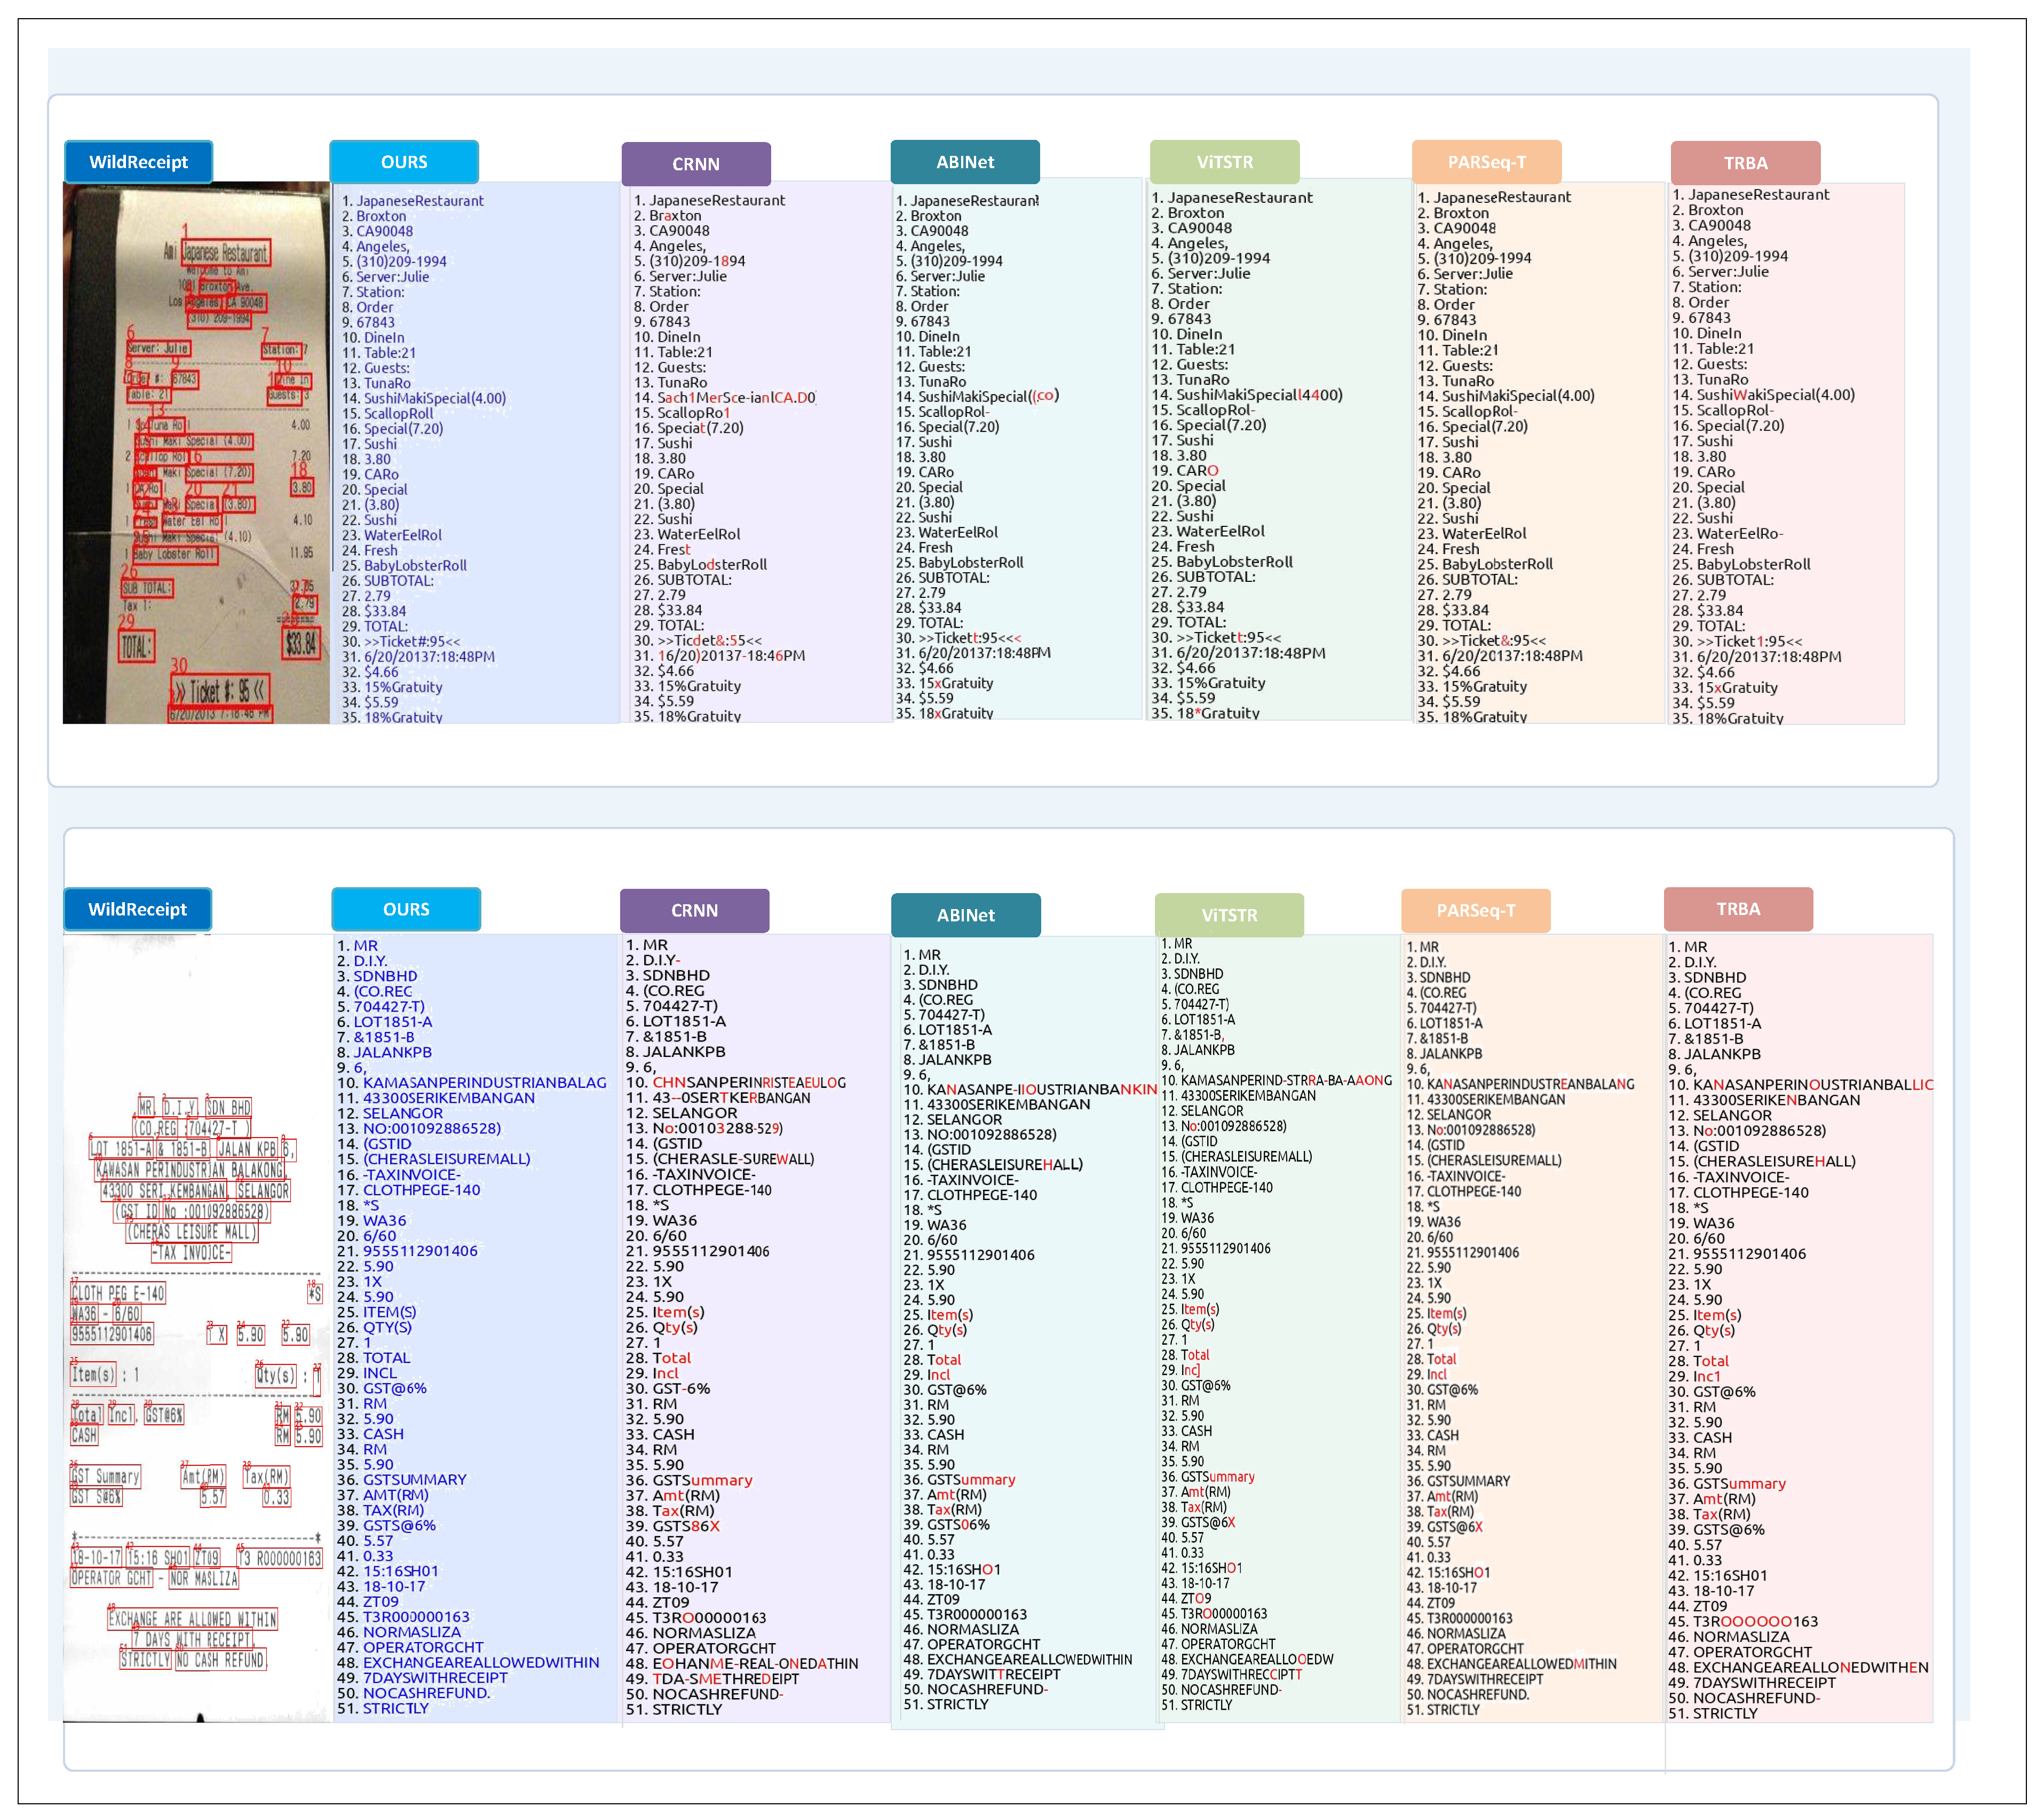
After verifying the spatial response of the proposed stem, we further compare the final recognition outputs of different OCR models. Figure 4 presents representative receipt and invoice samples under challenging layouts and visual degradation. The baseline models tend to make three types of errors. First, long strings may be partially omitted when the text line is compressed or affected by background noise. Second, numerical fields are vulnerable to local stroke confusion, especially when stamps or shadows overlap with digits. Third, rare symbols such as decimal points, slashes, and punctuation marks are frequently dropped or substituted. These errors are especially harmful in fiscal scenarios because a visually small mistake may change the value of a total amount, a tax number, or an address.
CoordAtt-PARSeq produces more stable predictions in these cases. The CoordAtt stem enhances horizontal text continuity and vertical row separation before patch tokenization, which helps the recognizer preserve complete text structure in dense layouts. Meanwhile, the Focal Loss increases the training emphasis on hard and under-represented characters. As a result, the proposed method produces more stable predictions on long text, numerical fields, and special-symbol regions. This qualitative observation also agrees with the quantitative results reported in Table 3 and Table 4, where the proposed method obtains the highest accuracy and the lowest CER on both datasets.
The examples in Figure 4 are therefore selected to illustrate recognition behaviour rather than to serve as additional quantitative evidence. They show cases in which visually small characters influence the semantic value of a fiscal record, including total amounts, addresses, and invoice identifiers. The comparison also makes clear that the proposed model is not merely correcting case-insensitive alphabetic strings; it improves the preservation of local strokes and punctuation in visually cluttered receipt crops. This observation is consistent with the design of the CoordAtt stem, which retains directional information before patch embedding, and with the focal objective, which gives harder characters a larger contribution during training.
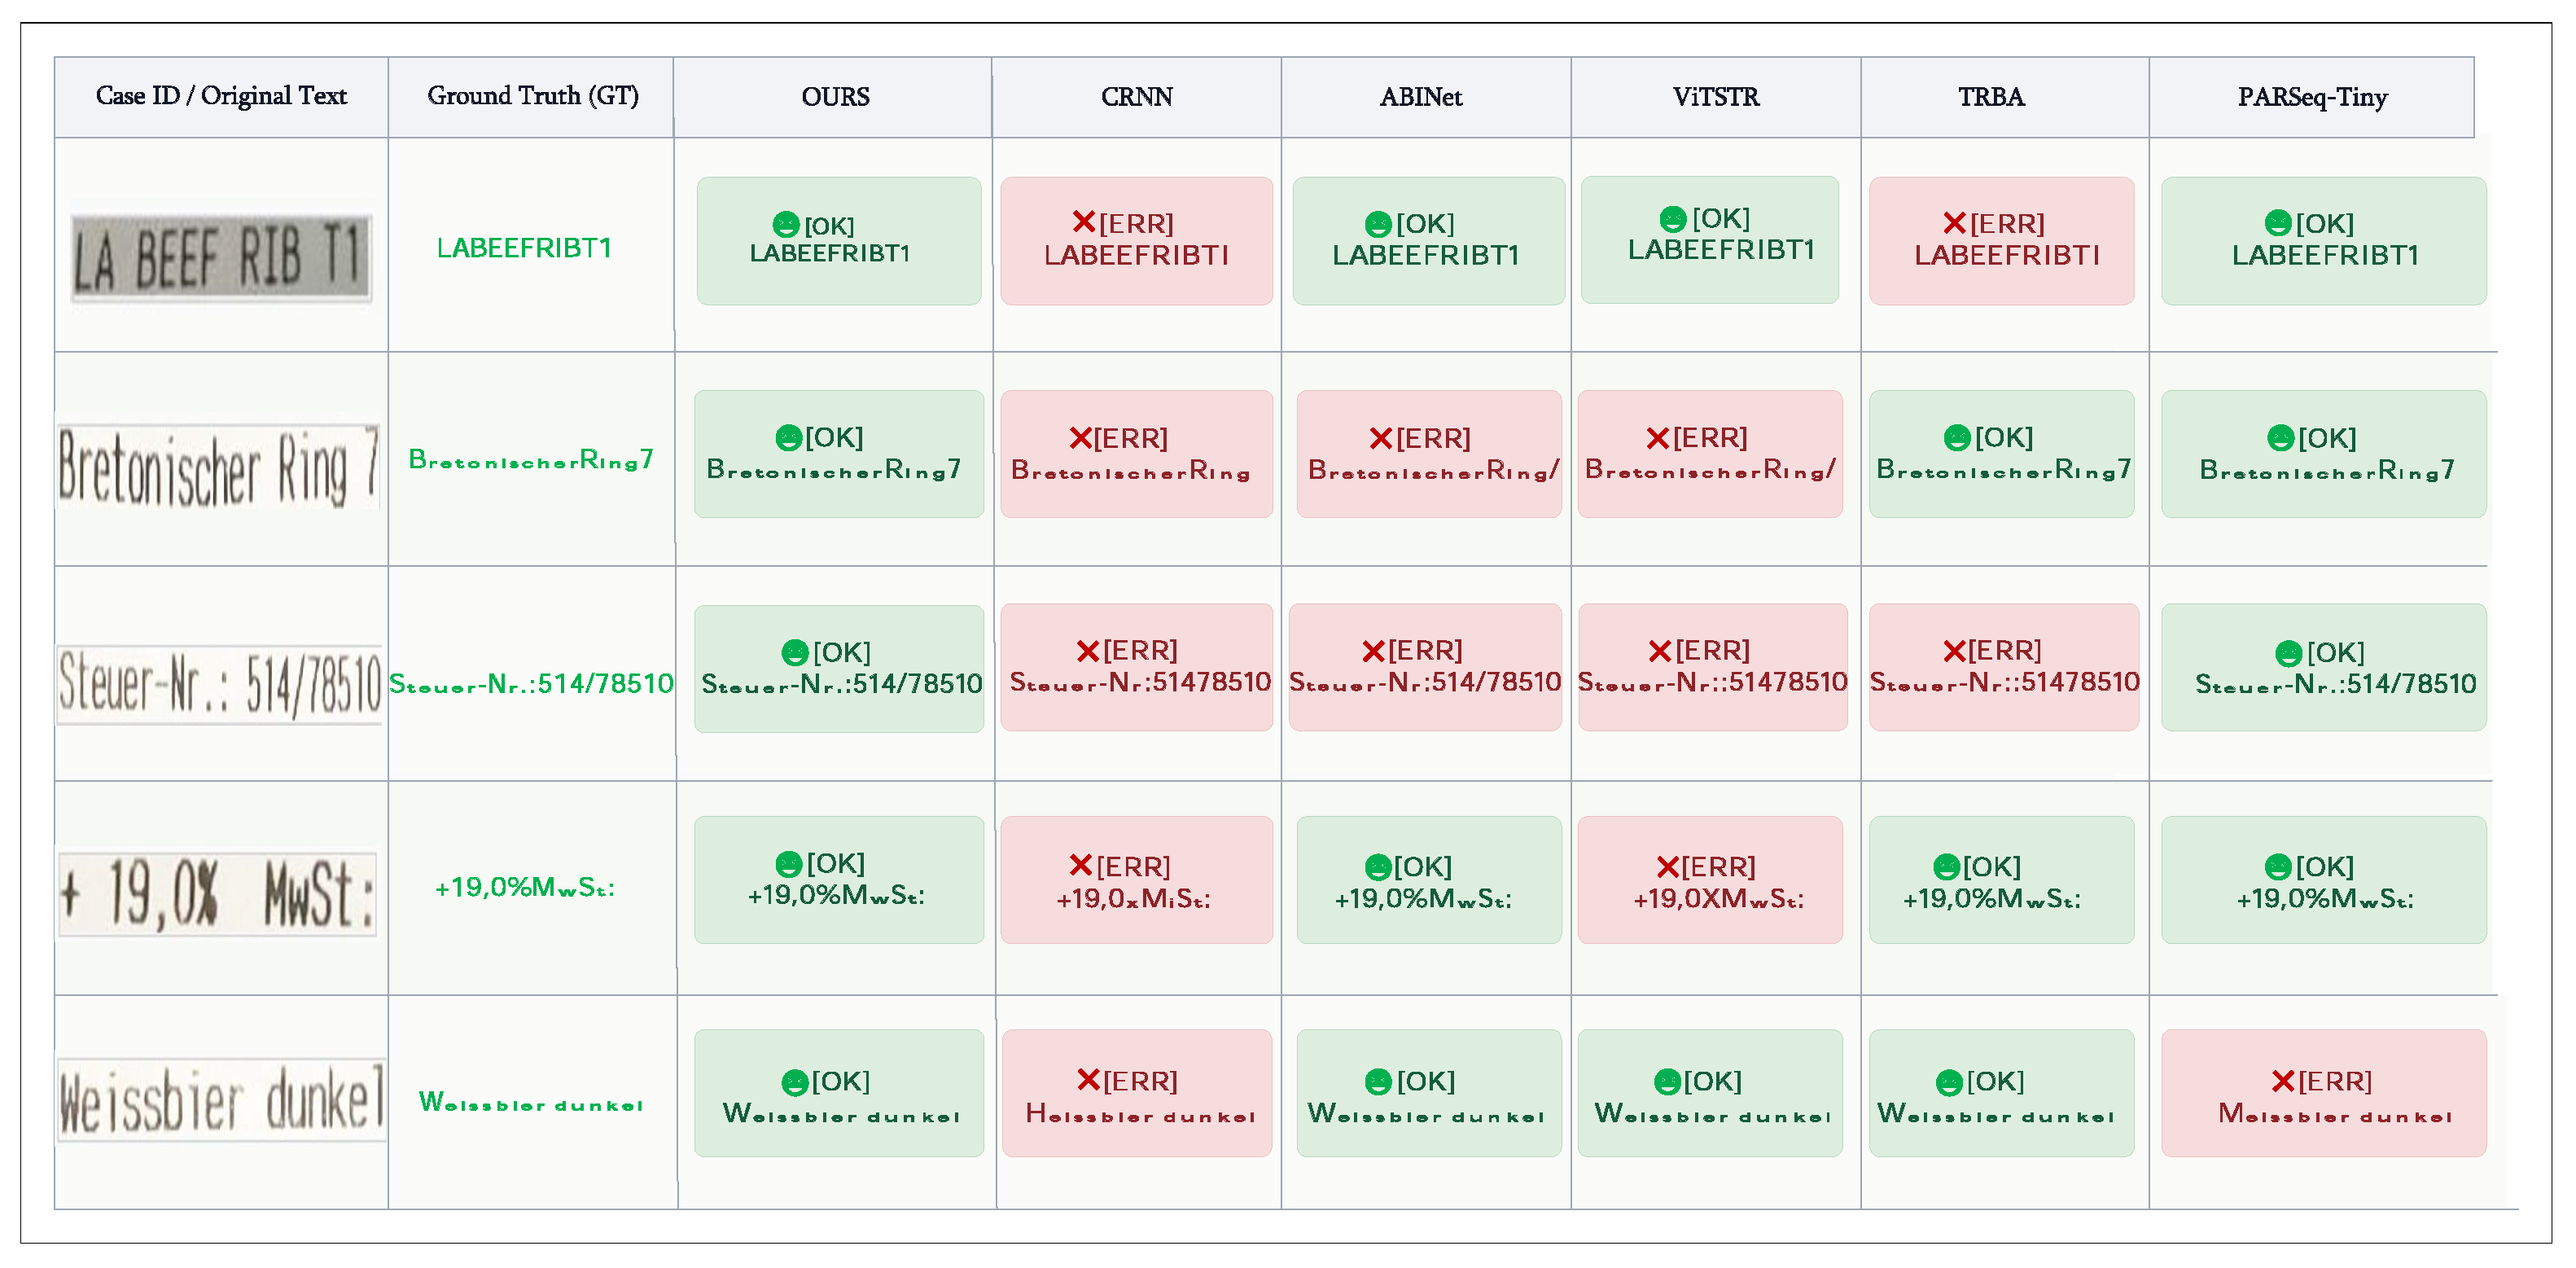
Figure 5 provides a more fine-grained ground-truth verification report on representative WildReceipt samples. Each row contains the source text crop, the ground-truth transcription, and the predictions from different OCR models. The green and red annotations make the error pattern visually explicit. Compared with the baselines, CoordAtt-PARSeq obtains more exact matches, especially on long words, mixed letter-digit strings, punctuation-containing expressions, and case-sensitive fields. This supports the claim that the proposed method does not merely improve aggregate metrics, but also reduces the specific recognition errors that are most disruptive in receipt OCR.

5.2. Error Analysis

For clarity, the per-symbol diagnostic analysis focuses on representative models from the convolutional–recurrent, language-aware, Transformer-backbone, and proposed categories. To better understand the remaining limitations, we further decompose character-level errors by symbol frequency. Table 9 reports the diagnostic per-symbol character error rates on WildReceipt. The results show a clear pattern. For high-frequency character groups, including uppercase letters, lowercase letters, and digits, CoordAtt-PARSeq consistently achieves the lowest error rate. This indicates that the proposed spatial enhancement is beneficial not only for rare symbols, but also for the dominant character categories that constitute most receipt text.
For medium- and low-frequency symbols, the behavior is more nuanced. CoordAtt-PARSeq substantially reduces errors on common punctuation, colons, currency symbols, and other rare symbols, which agrees with the motivation of focal character learning. However, for several extremely sparse classes, such as hyphens and slashes, PARSeq-tiny remains slightly better. This does not contradict the main experimental conclusion. Instead, it suggests that very rare symbols may still be sensitive to limited sample counts and annotation variability. The full model reduces the overall CER and improves all main recognition metrics, but some individual tail categories remain difficult.
Table 10 provides the same per-symbol diagnostic view on SROIE. The SROIE distribution is more skewed toward uppercase letters and digits, which is consistent with scanned English receipts. Again, CoordAtt-PARSeq improves the major head categories and obtains the best error rate on several important punctuation categories. The model also substantially reduces the error rate for “other symbols”, suggesting that focal learning is helpful when the symbol class is heterogeneous and visually ambiguous.
At the same time, the table reveals that not every rare category is fully solved. On SROIE, CoordAtt-PARSeq achieves the best result on decimal points and ties with PARSeq-tiny on hyphens, but slashes remain slightly worse than PARSeq-tiny. Currency symbols are extremely sparse in this dataset, so the corresponding per-symbol error rate should be interpreted cautiously. This observation prevents an overly broad interpretation of the results: CoordAtt-PARSeq improves overall receipt recognition performance, but rare-symbol recognition remains a difficult open problem under severe visual degradation and limited tail samples.

5.3. Limitations and Future Work

Although CoordAtt-PARSeq improves both WildReceipt and SROIE, it still inherits several limitations from the word-level PARSeq recognition pipeline. First, the method assumes that text crops are already available. Therefore, the final performance of a complete receipt OCR system still depends on the quality of the upstream text detector. Detection errors, incorrect crop boundaries, and missed small text regions may still propagate to the recognizer.
Second, the model does not explicitly exploit document-level layout relationships. Receipt fields often have strong structural regularities: merchant names appear near the top, totals appear near the bottom, and tax-related fields follow local key-value patterns. Layout-aware document models such as LayoutLMv2 [7] and BROS [8] demonstrate that such spatial relationships are valuable for document understanding. Integrating CoordAtt-PARSeq with layout-aware reasoning may further improve end-to-end receipt understanding.
Third, the remaining tail-symbol errors suggest that focal learning alone cannot completely solve rare-character recognition. Future work may combine focal character learning with visual restoration, symbol-aware augmentation, or multi-modal pretraining in the spirit of CLIP4STR [37] and Donut [40]. Another promising direction is to develop end-to-end detection-and-recognition variants inspired by ABINet++ [17], and to perform document-aware fine-tuning on the OCR sub-tasks of SROIE and WildReceipt [6,10]. Finally, because receipt OCR is often deployed in enterprise and mobile reimbursement scenarios, a distillation-friendly version of the CoordAtt stem may enable faster on-device inference for industrial applications.

6. Conclusions

This paper presented CoordAtt-PARSeq, a lightweight and targeted extension of PARSeq-tiny for robust fiscal receipt text recognition. The motivation of the method comes from two observations. First, receipt images contain a strong two-dimensional structure, but pure ViT-style patch embedding weakens local spatial cues before the Transformer encoder performs global modeling. Second, the receipt text contains a long-tailed character distribution in which rare symbols, such as decimal points, slashes, colons, hyphens, and currency marks, are often financially critical. To address these two issues, CoordAtt-PARSeq introduces a CoordAtt stem before patch embedding and uses a Focal Loss during training.
The experimental results on WildReceipt and SROIE confirm the effectiveness of this design. On WildReceipt, CoordAtt-PARSeq achieves 86.07 % word accuracy (Ignore Case), 85.47 % strict word accuracy, 97.55 % NED, and 5.09 % CER, outperforming CRNN, ViTSTR, ABINet, TRBA, and the PARSeq-tiny backbone. On SROIE, the method reaches 81.20 % word accuracy (Ignore Case), 80.31 % strict word accuracy, 96.09 % NED, and 9.24 % CER. Compared with PARSeq-tiny, it improves ignore-case word accuracy by 4.19 points on WildReceipt and 4.47 points on SROIE, while reducing CER by 1.85 and 1.84 points, respectively. These improvements are consistent with the ablation study, where the CoordAtt stem and Focal Loss each provide independent benefits and achieve the best performance when combined.
The qualitative and per-symbol analyses further show that the proposed method improves the recognition of long text strings, dense numerical fields, and several important punctuation or symbol categories. At the same time, not all tail categories are fully solved, and the remaining errors indicate that extremely rare symbols and severely degraded crops remain challenging. Future work will investigate symbol-aware augmentation, visual restoration, detector-recognizer joint optimization, and integration with layout-aware document understanding models. Overall, CoordAtt-PARSeq provides a practical OCR module for fiscal document understanding pipelines by combining receipt-aware spatial enhancement with imbalance-aware character learning.

Author Contributions

Conceptualization, J.M.; methodology, J.M.; software, J.M.; validation, J.M. and S.D.; formal analysis, S.D.; investigation, J.M.; resources, H.L. and H.J.; data curation, J.M.; writing—original draft preparation, J.M.; writing—review and editing, J.M.; visualization, S.D.; supervision, H.L. and H.J.; project administration, H.L. and H.J.; funding acquisition, H.L. and H.J. All authors have read and agreed to the published version of the manuscript.

Funding

This research was funded by the National Training Program of Innovation and Entrepreneurship for Undergraduates (Grant No. 202410240080), the Natural Science Foundation of Heilongjiang Province (Grant No. LH2024F042), and the Key Think Tank Project of the 2025 Heilongjiang Provincial Philosophy and Social Sciences Research Planning Program, “Research on the Optimization of Integrated Fiscal and Tax Policy Packages in Heilongjiang Province” (Grant No. 25ZKA007).

Data Availability Statement

The WildReceipt dataset is available from [10] and the SROIE dataset from [6].

Conflicts of Interest

The authors declare no conflicts of interest.

References

  1. Ribeiro, J.; Lima, R.; Eckhardt, T.; Paiva, S. Robotic process automation and artificial intelligence in industry 4.0—A literature review. Procedia Comput. Sci. 2021, 181, 51–58. [Google Scholar] [CrossRef]
  2. Zhang, Y.; Xiong, F.; Xie, Y.; Fan, X.; Gu, H. The impact of artificial intelligence and blockchain on the accounting profession. IEEE Access 2020, 8, 110461–110477. [Google Scholar] [CrossRef]
  3. Tang, Q.; Lee, Y.; Jung, H. The industrial application of artificial intelligence-based optical character recognition in modern manufacturing innovations. Sustainability 2024, 16, 2161. [Google Scholar] [CrossRef]
  4. Baviskar, D.; Ahirrao, S.; Potdar, V.; Kotecha, K. Efficient automated processing of the unstructured documents using artificial intelligence: A systematic literature review and future directions. IEEE Access 2021, 9, 72894–72936. [Google Scholar] [CrossRef]
  5. Mahadevkar, S.V.; Patil, S.; Kotecha, K.; Soong, L.W.; Choudhury, T. Exploring AI-driven approaches for unstructured document analysis and future horizons. J. Big Data 2024, 11, 92. [Google Scholar] [CrossRef]
  6. Huang, Z.; Chen, K.; He, J.; Bai, X.; Karatzas, D.; Lu, S.; Jawahar, C. Icdar2019 competition on scanned receipt ocr and information extraction. In Proceedings of the 2019 International Conference on Document Analysis and Recognition (ICDAR); IEEE: New York, NY, USA, 2019; pp. 1516–1520. [Google Scholar]
  7. Xu, Y.; Xu, Y.; Lv, T.; Cui, L.; Wei, F.; Wang, G.; Lu, Y.; Florencio, D.; Zhang, C.; Che, W.; et al. Layoutlmv2: Multi-modal pre-training for visually-rich document understanding. In Proceedings of the 59th Annual Meeting of the Association for Computational Linguistics and the 11th International Joint Conference on Natural Language Processing (Volume 1: Long Papers); Association for Computational Linguistics: Cambridge, MA, USA, 2021; pp. 2579–2591. [Google Scholar]
  8. Hong, T.; Kim, D.; Ji, M.; Hwang, W.; Nam, D.; Park, S. Bros: A pre-trained language model focusing on text and layout for better key information extraction from documents. Proc. AAAI Conf. Artif. Intell. 2022, 36, 10767–10775. [Google Scholar] [CrossRef]
  9. Ha, H.T.; Horák, A. Information extraction from scanned invoice images using text analysis and layout features. Signal Process. Image Commun. 2022, 102, 116601. [Google Scholar] [CrossRef]
  10. Sun, H.; Kuang, Z.; Yue, X.; Lin, C.; Zhang, W. Spatial dual-modality graph reasoning for key information extraction. arXiv 2021, arXiv:2103.14470. [Google Scholar]
  11. Zhang, H.; Whittaker, E.; Kitagishi, I. Extending TrOCR for text localization-free OCR of full-page scanned receipt images. In Proceedings of the IEEE/CVF International Conference on Computer Vision; IEEE: New York, NY, USA, 2023; pp. 1479–1485. [Google Scholar]
  12. Shi, B.; Bai, X.; Yao, C. An end-to-end trainable neural network for image-based sequence recognition and its application to scene text recognition. IEEE Trans. Pattern Anal. Mach. Intell. 2016, 39, 2298–2304. [Google Scholar] [PubMed]
  13. Baek, J.; Kim, G.; Lee, J.; Park, S.; Han, D.; Yun, S.; Oh, S.J.; Lee, H. What is wrong with scene text recognition model comparisons? dataset and model analysis. In Proceedings of the IEEE/CVF International Conference on Computer Vision; IEEE: New York, NY, USA, 2019; pp. 4715–4723. [Google Scholar]
  14. Dosovitskiy, A.; Beyer, L.; Kolesnikov, A.; Weissenborn, D.; Zhai, X.; Unterthiner, T.; Dehghani, M.; Minderer, M.; Heigold, G.; Gelly, S.; et al. An image is worth 16x16 words: Transformers for image recognition at scale. arXiv 2020, arXiv:2010.11929. [Google Scholar]
  15. Atienza, R. Vision transformer for fast and efficient scene text recognition. In Proceedings of the International Conference on Document Analysis and Recognition; Springer: Cham, Switzerland, 2021; pp. 319–334. [Google Scholar]
  16. Fang, S.; Xie, H.; Wang, Y.; Mao, Z.; Zhang, Y. Read like humans: Autonomous, bidirectional and iterative language modeling for scene text recognition. In Proceedings of the IEEE/CVF Conference on Computer Vision and Pattern Recognition; IEEE: New York, NY, USA, 2021; pp. 7098–7107. [Google Scholar]
  17. Fang, S.; Mao, Z.; Xie, H.; Wang, Y.; Yan, C.; Zhang, Y. Abinet++: Autonomous, bidirectional and iterative language modeling for scene text spotting. IEEE Trans. Pattern Anal. Mach. Intell. 2022, 45, 7123–7141. [Google Scholar] [CrossRef]
  18. Bautista, D.; Atienza, R. Scene text recognition with permuted autoregressive sequence models. In Proceedings of the European Conference on Computer Vision; Springer: Cham, Switzerland, 2022; pp. 178–196. [Google Scholar]
  19. Johnson, J.M.; Khoshgoftaar, T.M. Survey on deep learning with class imbalance. J. Big Data 2019, 6, 27. [Google Scholar] [CrossRef]
  20. Hou, Q.; Zhou, D.; Feng, J. Coordinate attention for efficient mobile network design. In Proceedings of the IEEE/CVF Conference on Computer Vision and Pattern Recognition; IEEE: New York, NY, USA, 2021; pp. 13713–13722. [Google Scholar]
  21. Lin, T.Y.; Goyal, P.; Girshick, R.; He, K.; Dollár, P. Focal loss for dense object detection. In Proceedings of the IEEE International Conference on Computer Vision; IEEE: New York, NY, USA, 2017; pp. 2980–2988. [Google Scholar]
  22. LeCun, Y.; Bottou, L.; Bengio, Y.; Haffner, P. Gradient-based learning applied to document recognition. Proc. IEEE 1998, 86, 2278–2324. [Google Scholar] [CrossRef]
  23. Graves, A.; Fernández, S.; Gomez, F.; Schmidhuber, J. Connectionist temporal classification: Labelling unsegmented sequence data with recurrent neural networks. In Proceedings of the 23rd International Conference on Machine Learning; Association for Computing Machinery: New York, NY, USA, 2006; pp. 369–376. [Google Scholar]
  24. Liu, Y.; Wang, Y.; Shi, H. A convolutional recurrent neural-network-based machine learning for scene text recognition application. Symmetry 2023, 15, 849. [Google Scholar] [CrossRef]
  25. Jaderberg, M.; Simonyan, K.; Vedaldi, A.; Zisserman, A. Synthetic data and artificial neural networks for natural scene text recognition. arXiv 2014, arXiv:1406.2227. [Google Scholar]
  26. Gupta, A.; Vedaldi, A.; Zisserman, A. Synthetic data for text localisation in natural images. In Proceedings of the IEEE Conference on Computer Vision and Pattern Recognition; IEEE: New York, NY, USA, 2016; pp. 2315–2324. [Google Scholar]
  27. Mishra, A.; Alahari, K.; Jawahar, C. Scene text recognition using higher order language priors. In Proceedings of the BMVC-British Machine Vision Conference; BMVA: Durham, UK, 2012. [Google Scholar]
  28. Karatzas, D.; Gomez-Bigorda, L.; Nicolaou, A.; Ghosh, S.; Bagdanov, A.; Iwamura, M.; Matas, J.; Neumann, L.; Chandrasekhar, V.R.; Lu, S.; et al. ICDAR 2015 competition on robust reading. In Proceedings of the 2015 13th International Conference on Document Analysis and Recognition (ICDAR); IEEE: New York, NY, USA, 2015; pp. 1156–1160. [Google Scholar]
  29. Shi, B.; Yang, M.; Wang, X.; Lyu, P.; Yao, C.; Bai, X. Aster: An attentional scene text recognizer with flexible rectification. IEEE Trans. Pattern Anal. Mach. Intell. 2018, 41, 2035–2048. [Google Scholar] [CrossRef] [PubMed]
  30. Luo, C.; Jin, L.; Sun, Z. Moran: A multi-object rectified attention network for scene text recognition. Pattern Recognit. 2019, 90, 109–118. [Google Scholar] [CrossRef]
  31. Vaswani, A.; Shazeer, N.; Parmar, N.; Uszkoreit, J.; Jones, L.; Gomez, A.N.; Kaiser, Ł.; Polosukhin, I. Attention is all you need. Adv. Neural Inf. Process. Syst. 2017, 30, 5998–6008. [Google Scholar]
  32. Yu, D.; Li, X.; Zhang, C.; Liu, T.; Han, J.; Liu, J.; Ding, E. Towards accurate scene text recognition with semantic reasoning networks. In Proceedings of the IEEE/CVF Conference on Computer Vision and Pattern Recognition; IEEE: New York, NY, USA, 2020; pp. 12113–12122. [Google Scholar]
  33. Qiao, Z.; Zhou, Y.; Yang, D.; Zhou, Y.; Wang, W. Seed: Semantics enhanced encoder-decoder framework for scene text recognition. In Proceedings of the IEEE/CVF Conference on Computer Vision and Pattern Recognition; IEEE: New York, NY, USA, 2020; pp. 13528–13537. [Google Scholar]
  34. Wang, Y.; Xie, H.; Fang, S.; Wang, J.; Zhu, S.; Zhang, Y. From two to one: A new scene text recognizer with visual language modeling network. In Proceedings of the IEEE/CVF International Conference on Computer Vision; IEEE: New York, NY, USA, 2021; pp. 14194–14203. [Google Scholar]
  35. Wan, Z.; He, M.; Chen, H.; Bai, X.; Yao, C. Textscanner: Reading characters in order for robust scene text recognition. Proc. AAAI Conf. Artif. Intell. 2020, 34, 12120–12127. [Google Scholar] [CrossRef]
  36. Wei, J.; Zhan, H.; Lu, Y.; Tu, X.; Yin, B.; Liu, C.; Pal, U. Image as a language: Revisiting scene text recognition via balanced, unified and synchronized vision-language reasoning network. Proc. AAAI Conf. Artif. Intell. 2024, 38, 5885–5893. [Google Scholar] [CrossRef]
  37. Zhao, S.; Quan, R.; Zhu, L.; Yang, Y. Clip4str: A simple baseline for scene text recognition with pre-trained vision-language model. IEEE Trans. Image Process. 2024, 33, 6893–6904. [Google Scholar] [CrossRef]
  38. He, Y.; Chen, C.; Zhang, J.; Liu, J.; He, F.; Wang, C.; Du, B. Visual semantics allow for textual reasoning better in scene text recognition. Proc. AAAI Conf. Artif. Intell. 2022, 36, 888–896. [Google Scholar] [CrossRef]
  39. Huang, Y.; Lv, T.; Cui, L.; Lu, Y.; Wei, F. Layoutlmv3: Pre-training for document ai with unified text and image masking. In Proceedings of the 30th ACM International Conference on Multimedia; ACM: New York, NY, USA, 2022; pp. 4083–4091. [Google Scholar]
  40. Kim, G.; Hong, T.; Yim, M.; Park, J.; Yim, J.; Hwang, W.; Yun, S.; Han, D.; Park, S. Donut: Document understanding transformer without ocr. arXiv 2021, arXiv:2111.15664. [Google Scholar]
  41. Li, M.; Lv, T.; Chen, J.; Cui, L.; Lu, Y.; Florencio, D.; Zhang, C.; Li, Z.; Wei, F. Trocr: Transformer-based optical character recognition with pre-trained models. Proc. AAAI Conf. Artif. Intell. 2023, 37, 13094–13102. [Google Scholar] [CrossRef]
  42. Yu, J.M.; Ma, H.J.; Kong, J.L. Receipt Recognition Technology Driven by Multimodal Alignment and Lightweight Sequence Modeling. Electronics 2025, 14, 1717. [Google Scholar] [CrossRef]
  43. Abdalla, M.; Kasem, M.S.; Mahmoud, M.; Yagoub, B.; Senussi, M.F.; Abdallah, A.; Hun Kang, S.; Kang, H.S. Receiptqa: A question-answering dataset for receipt understanding. Mathematics 2025, 13, 1760. [Google Scholar] [CrossRef]
  44. Li, D.L.; Lee, S.K.; Liu, Y.T. Printed document layout analysis and optical character recognition system based on deep learning. Sci. Rep. 2025, 15, 23761. [Google Scholar] [CrossRef] [PubMed]
  45. Singh, L.G.; Middleton, S.E. Tabular context-aware optical character recognition and tabular data reconstruction for historical records: LG Singh, SE Middleton. Int. J. Doc. Anal. Recognit. (IJDAR) 2025, 28, 357–376. [Google Scholar] [CrossRef]
  46. Heakl, A.; Sohail, M.A.; Ranjan, M.; Elbadry, R.; Ahmad, G.S.; El-Geish, M.; Maher, O.; Shen, Z.; Khan, F.S.; Khan, S. Kitab-bench: A comprehensive multi-domain benchmark for arabic ocr and document understanding. In Findings of the Association for Computational Linguistics: ACL; Association for Computational Linguistics: Vienna, Austria, 2025; pp. 22006–22024. [Google Scholar]
  47. Wang, S. Development of an automated transformer-based text analysis framework for monitoring fire door defects in buildings. Sci. Rep. 2025, 15, 43910. [Google Scholar] [CrossRef] [PubMed]
  48. Wang, S. Graph neural network–driven text classification for fire-door defect inspection in pre-completion construction. Sci. Rep. 2025, 15, 44382. [Google Scholar] [CrossRef] [PubMed]
  49. He, K.; Zhang, X.; Ren, S.; Sun, J. Deep residual learning for image recognition. In Proceedings of the IEEE Conference on Computer Vision and Pattern Recognition; IEEE: New York, NY, USA, 2016; pp. 770–778. [Google Scholar]
  50. Hu, J.; Shen, L.; Sun, G. Squeeze-and-excitation networks. In Proceedings of the IEEE Conference on Computer Vision and Pattern Recognition; IEEE: New York, NY, USA, 2018; pp. 7132–7141. [Google Scholar]
  51. Woo, S.; Park, J.; Lee, J.Y.; Kweon, I.S. Cbam: Convolutional block attention module. In Proceedings of the European Conference on Computer Vision (ECCV); IEEE: New York, NY, USA, 2018; pp. 3–19. [Google Scholar]
Figure 1. Qualitative comparison between representative existing PARSeq-based methods and the proposed CoordAtt-PARSeq on challenging receipt text recognition cases. Existing PARSeq methods tend to suffer from long-text collapse and fragile symbol recognition, leading to placeholder outputs or incorrect special characters. In contrast, CoordAtt-PARSeq introduces a CoordAtt stem to enhance stroke-aware spatial features and adopts focal character learning to improve rare-symbol decoding. As a result, the proposed method preserves long text more completely and recovers several financially critical symbols and amount fields more robustly. Symbols: a check mark denotes a correct prediction, a cross mark an incorrect prediction, “***” a collapsed or omitted output, and “#” a misrecognized special character. Different colors distinguish the compared methods.
Applsci 16 07003 g001
Figure 2. Overall structure of CoordAtt-PARSeq. (a) The CoordAtt stem extracts direction-aware spatial cues from the input image by modeling horizontal and vertical dependencies; green denotes the CoordAtt attention path. (b) The refined image is then processed by the ViT encoder and the visio-linguistic decoder of PARSeq, while focal cross-entropy is used during training to give more emphasis to difficult and rare characters. The “$” symbol and “TAX:” label in the example crop are receipt content shown for illustration.
Applsci 16 07003 g002
Figure 3. Visualization of CoordAtt stem responses and stroke-focused regions on representative receipt text samples: The left column shows the input text crops; The middle column presents the Grad-CAM responses computed at the final convolution of the CoordAtt stem; The right column highlights stroke-focused regions obtained by combining the normalized response with an ink-and-edge map of the crop. The visualization indicates that the proposed CoordAtt stem helps the model concentrate on character strokes and text-line structures while reducing interference from background noise, stamps, and low-contrast degradation.
Applsci 16 07003 g003
Figure 4. OCR benchmark comparison on Japanese restaurant receipt and Malaysian tax invoice samples. The figure illustrates the recognition outputs of different models under complex receipt and invoice layouts. The proposed method produces more stable outputs in long text recognition, numerical fields, and special-symbol decoding. In the revised presentation, the figure uses enlarged examples and focuses on representative errors to improve readability. Different colors distinguish the compared models; a check mark denotes a correct prediction, a cross mark an incorrect prediction, and red font highlights erroneous characters.
Applsci 16 07003 g004
Figure 5. WildReceipt OCR performance comparison with ground-truth verification. Each row presents an original text crop, the corresponding ground-truth label, and predictions from different OCR models. Green boxes indicate exact matches, while red boxes indicate incorrect predictions. A cross mark denotes an incorrect word and a smile face denotes a fully correct word. The proposed method achieves more stable and accurate recognition on challenging receipt text, including long words, digits, punctuation, and case-sensitive expressions. The revised presentation emphasizes the most informative error regions so that the visual comparison can be inspected more easily.
Applsci 16 07003 g005
Table 1. Dataset partition and cropped text image statistics.
DatasetSplitNumber of Original Receipt ImagesNumber of Cropped Text ImagesLMDB Usage
WildReceiptTraining Set126740,363Training
WildReceiptTest Set47215,201Final Evaluation
SROIETraining Set62633,618Training
SROIETest Set34718,703Final Evaluation
Table 2. Computational efficiency on WildReceipt under the same NVIDIA A100 CUDA environment and batch size 128. Latency is computed as 1000 / FPS .
ModelParams (M)FLOPs (G)FPSLatency (ms/img)
PARSeq-tiny6.0181.5331108.460.90
CoordAtt-PARSeq6.0191.5391050.820.95
Table 3. Comparison on WildReceipt. Base refers to PARSeq-tiny. The best score per column is shown in bold. ↑ indicates that higher is better and ↓ indicates that lower is better.
ModelW.Acc. (IC) ↑W.Acc. (Strict) ↑NED ↑CER ↓
CRNN [12]68.4367.8091.0018.00
ViTSTR [15]79.1278.6295.189.86
TRBA [13]81.6781.1096.227.60
ABINet [16]81.8881.2896.197.65
Base (PARSeq-tiny) [18]81.8881.4096.446.94
Ours (CoordAtt-PARSeq)86.0785.4797.555.09
All metrics are reported in %. W.Acc. (IC): case-insensitive word accuracy; W.Acc. (Strict): case-sensitive word accuracy; NED: normalized edit distance; CER: character error rate.
Table 4. Comparison on the ICDAR 2019 SROIE test split. The best score per column is shown in bold.
ModelW.Acc. (IC) ↑W.Acc. (Strict) ↑NED ↑CER ↓
CRNN [12]64.7463.8687.3527.02
ABINet [16]77.8176.9294.2112.19
ViTSTR [15]72.2271.3592.2516.63
Base (PARSeq-tiny) [18]76.7375.9294.5911.08
TRBA [13]78.9378.0494.7611.93
Ours (CoordAtt-PARSeq)81.2080.3196.099.24
Table 5. Ablation results and final comparison on WildReceipt and SROIE. BASE denotes PARSeq-tiny, BASE + CoordAtt denotes PARSeq-tiny with the CoordAtt stem, while BASE + Loss denotes PARSeq-tiny trained with the proposed focal character learning loss. The best result per column is shown in bold.
DatasetVariantW.Acc. (IC) ↑W.Acc. (Strict) ↑NED ↑CER ↓
WildReceiptBASE (PARSeq-tiny) [18]81.8881.4096.446.94
BASE + CoordAtt84.2183.6196.985.91
BASE + Loss85.1984.4897.115.78
OURS (CoordAtt-PARSeq)86.0785.4797.555.09
SROIEBASE (PARSeq-tiny) [18]76.7375.9294.5911.08
BASE + CoordAtt78.2177.3695.429.92
BASE + Loss79.4778.5594.859.85
OURS (CoordAtt-PARSeq)81.2080.3196.099.24
Table 6. Sensitivity analysis of the Focal Loss focusing parameter γ on WildReceipt. The setting γ = 0.0 uses uniform class weights and is therefore equivalent to standard cross-entropy loss. The best result per column is shown in bold.
γ W.Acc. (IC) ↑W.Acc. (Strict) ↑NED ↑CER ↓
0.0 (=CE)84.2183.6196.985.91
1.0 85.6985.1597.495.16
1.5 85.7385.1897.455.25
2.0 86.0785.4797.555.09
2.5 85.5384.9997.435.27
3.0 85.5384.9897.415.34
Table 7. Loss-function ablation on WildReceipt. All variants use the same CoordAtt stem, PARSeq-tiny backbone, and fine-tuning protocol.
LossClass Weight α γ W.Acc. (IC) ↑CER ↓
CENone084.215.91
Weighted CEInverse frequency085.145.47
FocalNone285.565.33
Weighted FocalClipped inverse frequency286.075.09
Table 8. Attention module comparison on WildReceipt. All variants use the same PARSeq-tiny backbone, focal character-learning objective, input resolution, data split, and fine-tuning protocol.
VariantFront-End ModuleW.Acc. (IC) ↑W.Acc. (Strict) ↑NED ↑CER ↓
Base + LossNone85.1984.4897.115.78
Shallow Conv 3 × 3 convolutional Stem85.0384.3696.995.86
SESqueeze-and-Excitation Stem85.6184.9597.325.40
CBAMConvolutional Block Attention Module Stem85.8285.1997.445.23
CoordAtt-PARSeqCoordinate Attention Stem86.0785.4797.555.09
Table 9. Per-symbol character error rate (%) on the WildReceipt test split, decomposed by frequency stratum. Bold marks the best result per row.
StratumSymbol ClassFreq.CRNNABINetPARSeq-TinyOurs
Head (>10% freq.)Uppercase A–Z34.1117.836.665.664.20
Head (>10% freq.)Lowercase a–z31.1122.8410.199.026.73
Head (>10% freq.)Digits 0–925.259.974.133.943.07
Body (1–10%)Decimal point “.”3.318.005.594.814.79
Body (1–10%)Common punctuation2.2551.7121.9226.1111.62
Body (1–10%)Colon “:”1.5118.645.726.904.11
Tail (<1% freq.)Hyphen “-”0.8713.737.475.266.99
Tail (<1% freq.)Currency symbols0.7226.1623.8723.9320.72
Tail (<1% freq.)Slash “/”0.6012.435.543.264.13
Tail (<1% freq.)Other symbols0.2775.3447.9443.4726.39
Overall CER 18.007.656.945.09
Table 10. Per-symbol character error rate (%) on the SROIE test split, decomposed by frequency stratum. Bold marks the best result per row.
StratumSymbol ClassFreq.CRNNABINetPARSeq-TinyOurs
Head (>10% freq.)Uppercase A–Z64.0834.4717.1815.5713.19
Head (>10% freq.)Digits 0–925.2911.682.482.421.74
Body (1–10%)Decimal point “.”3.417.422.822.112.00
Body (1–10%)Common punctuation3.3329.868.577.825.32
Body (1–10%)Colon “:”1.8318.882.822.722.07
Tail (<1% freq.)Hyphen “-”0.938.493.171.831.83
Tail (<1% freq.)Slash “/”0.6725.856.865.795.86
Tail (<1% freq.)Other symbols0.3532.5012.4113.972.88
Tail (<1% freq.)Currency symbols0.1117.650.000.460.26
Tail (<1% freq.)Lowercase a–z0.014.902.902.702.32
Overall CER 27.0212.1911.089.24
Disclaimer/Publisher’s Note: The statements, opinions and data contained in all publications are solely those of the individual author(s) and contributor(s) and not of MDPI and/or the editor(s). MDPI and/or the editor(s) disclaim responsibility for any injury to people or property resulting from any ideas, methods, instructions or products referred to in the content.