Article

Discovering Potential Taxonomic Biomarkers of Gastrointestinal Cancers from Various Human Microbiota via G-S-M Machine Learning Approach


by
Beyza Canakcimaksutoglu
1,†,
Nur Sebnem Ersoz
1,*,
Burcu Bakir-Gungor
1,2,† and
Malik Yousef
3,*
1
Department of Bioengineering, Graduate School, Abdullah Gul University, Kayseri 38080, Türkiye
2
Department of Computer Engineering, Faculty of Engineering, Abdullah Gul University, Kayseri 38080, Türkiye
3
Department of Software Engineering, Kinneret Academic College on the Sea of Galilee, Zemach 1513200, Israel
*
Authors to whom correspondence should be addressed.
These authors contributed equally to this work.
Appl. Sci. 2026, 16(14), 6879; https://doi.org/10.3390/app16146879
Submission received: 26 May 2026 / Revised: 15 June 2026 / Accepted: 23 June 2026 / Published: 9 July 2026
(This article belongs to the Section Applied Biosciences and Bioengineering)

Abstract

Analysis of microbial abundance profiles offers significant potential for improving cancer prediction and candidate biomarker discovery. This study aimed to identify cancer-associated microbial biomarkers across five gastrointestinal (GI) cancers: head and neck, esophagus, stomach, colon, and colorectal cancers by analyzing tissue and blood samples from the TCMA dataset in parallel. A novel machine learning model, MicrobiomeGSM, was developed to enhance biological interpretability and reduce computational complexity through a taxonomic grouping strategy. Classification performance of MicrobiomeGSM was rigorously evaluated using a Random Forest Classifier with 100-fold Monte Carlo Cross-Validation. MicrobiomeGSM model effectively identified colon adenocarcinoma (COAD) using a set of 30 genus-level species, achieving a 97% AUC and 97% specificity. Comparative analysis was also performed with six traditional feature selection (TFS) algorithms; CMIM, mRMR, FCBF, IG, XGB, and SKB. Comparison of MicrobiomeGSM with TFS methods showed that while TFS methods capture statistical patterns, MicrobiomeGSM effectively leverages biological structures to identify clinically relevant candidate biomarkers. Also, MicrobiomeGSM competes with TFS methods in the analysis of high-dimensional datasets. In conclusion, these findings demonstrate that incorporating microbial abundance profiles with their taxonomic information into machine learning improve the interpretability and effectiveness of microbiome-based candidate biomarker discovery and may support future precision oncology application.

1. Introduction

Gastrointestinal (GI) cancer includes a wide range of cancers that develop in the gastrointestinal tract, and it affects organs like the stomach, liver, esophagus, pancreas, and colorectal cancer (colon and rectum cancer). GI cancers represent more than a quarter of all cancers, and such cancers are increasing every year worldwide [1]. According to the study conducted by Kayali et al., it is estimated that GI cancers will cause 7.5 million new cases and 5.6 million deaths in 20 years [2]. GI cancers have a variety of etiologies and clinical management.
The human microbiome, consisting of trillions of microorganisms such as bacteria, viruses, eukaryotic fungi, and protozoa, significantly affects human health and metabolism [3,4,5]. Consequently, microbial imbalances, known as dysbiosis, can disrupt organ homeostasis and contribute to the pathogenesis of various severe diseases, including cancers [6].
During the progression from the adenoma stage to carcinoma, disruptions in the microbiome significantly influence this transition, accompanied by shifts in the abundance of specific microorganisms [5]. Certain pathogenic bacteria contribute to inflammation by producing genotoxic compounds, such as colibactin, which negatively impact host health. Additionally, they generate microbiome-specific metabolites, including secondary bile acids and short-chain fatty acids, which are implicated in the initiation and progression of cancer [5,6,7].
In addition to cancer, metabolic disorders, infectious diseases, and digestive tract diseases have a relationship with the human microbiome and there is strong evidence for this link [8]. The same article showed that the locations of the microorganisms were mainly in cancer tissue and cells of the immune system [8]. So, these microorganisms are not located in the extracellular compartment [6]. In the same article, it was stated that some bacteria were found close to the nuclear membrane in breast cancer tissue; It has been stated that the Fusobacterium nucleatum bacterium, on which many studies have been conducted, has a close interaction with colorectal cancer cells [6]. It is important to find out which microorganisms play a role in disease development. To enhance disease prediction, leveraging taxonomic profiles derived from patient metagenomic data is essential, a strategy that is increasingly being adopted across the contemporary literature [9].
The disease can be predicted from taxonomic profiles obtained using machine learning models, but not only that, but these models can also rank potential biomarkers by predicting which microorganism is more important for that disease. These methods allow the microbiome–disease relationship to be recognized more clearly [9]. In a study conducted by the Bakir-Gungor-Yousef lab [9], various feature selection methods were utilized to identify taxonomic biomarkers in the intestinal microbiota associated with colon cancer. Besides feature selection methods, multiple machine learning algorithms were employed, with the Random Forest (RF) classifier outperforming Adaboost, Support Vector Machine, Decision Tree, and Logitboost algorithms [10]. In a study in 2022 [11], β-diversity between samples was calculated using principal coordinate analysis in the evaluation of biomarkers of gastric and colorectal cancers. A study [12] compiled machine learning approaches and found that Gradient Boosting models were used to determine the type of cancer using microbiome data, RF [13] was generally used to detect bacteria from CRC stool samples, and deep learning and a deep neural network were used to evaluate biomarkers. An appropriate classification model was developed [14] to detect biomarkers of esophageal cancer, and logical regression Support Vector Machine (SVM), artificial neural network, RF, and XGBoost classification models were used for this model.
This study analyzed blood and tissue samples, focusing on head and neck, esophagus, stomach, colon, and colorectal cancers, processing them individually via the MicrobiomeGSM model and a TFS approach to find the common and unique biomarker candidates between these cancer types.
TFS approaches like Minimum Redundancy Maximum Relevance, Conditional Mutual Information Maximization, and Extreme Gradient Boosting exhibit several limitations when analyzing microbiome data. These methods treat each microorganism as an independent variable, ignoring the complex biological hierarchy and the relationships between species [9,15]. As a result, they often struggle with high-dimensional cancer datasets that have small sample sizes, leading to unstable results and a high risk of overfitting [12,16]. In contrast, the MicrobiomeGSM method offers significant strengths. By incorporating a hierarchical “Grouping” step based on biological taxonomy, it effectively addresses the challenge of data sparsity [9,13]. In contrast to traditional methods, MicrobiomeGSM maintains the integrity of taxonomic information, providing more stable and biologically meaningful biomarkers [9]. This integrated approach is more effective at capturing critical microbial signals in complex diseases like stomach and colorectal cancer, ultimately improving diagnostic accuracy [10,11,13].

2. Materials and Methods

2.1. Dataset

The Cancer Genome Atlas (TCGA) database (https://portal.gdc.cancer.gov/ accessed on 3 September 2024) contains bacterial and viral reads from 10,481 patients, 33 cancer types, and 18,116 samples [17]. The Cancer Microbiome Atlas (TCMA) database (https://tcma.pratt.duke.edu/ accessed on 3 September 2024) aimed to identify microbial signatures that distinguish cancer types within the data in the TCGA database [18]. The TCMA database includes a total of 620 samples and 221 taxa, including GI cancers, esophageal cancer, stomach cancer, colon cancer, and rectum cancer, as well as HNSC. These taxa include the relative abundance values of bacteria at the species level. These data consist of samples obtained from primary tumor tissue and tumor-free tissues close to the tumor tissue and belonging to the same organ. The TCMA database is a database that retrieves metagenomic data of cancer diseases (obtained by the next-generation sequencing method) from the TCGA database re-analysis [18]. Bioinformatics pipelines are used during this process such as the PathSeq tool were employed [18]. Contaminations in the data were filtered using the PathSeq tool, and bacterial genes are detected [18]. This database analyzes bacterial genes from the kingdom to the species level. The project utilized the relative abundance of bacteria associated with specific cancer types.

2.2. Data Manipulation

The data in the TCMA database includes metagenomics data from primary tumor tissue, blood, and tumor-free tissues, providing relative abundance values of bacteria at the species level for more detailed and reliable information. We focused on five specific cancer types: COAD, HNSC, STAD, ESCA, and CRC (a combination of COAD and READ). To prepare this data for MicrobiomeGSM and feature selection, we organized the samples into distinct groups: Primary tumor (positive) vs. Solid Tissue normal (negative), and Primary tumor (positive) vs. Blood-derived normal (negative). The final clean dataset consists of a total of 500 blood-derived negatives, 128 solid tissue negatives, and 642 positive cases. Specifically, CRC represents the largest group (140 blood negative, 25 solid negatives, 170 positives), followed by HNSC (130 blood negative, 21 solid negatives, 157 positives), STAD (89 blood negatives, 39 solid negatives, 128 positives), and COAD (99 blood negatives, 21 solid negatives, 125 positives) (Table 1). ESCA has the smallest distribution with 42 blood negatives, 22 solid negatives, and 62 positives cases. After creating separate files for each type, we removed invalid or missing data and replaced extremely small values (represented by Euler’s notation) with zero to ensure a high-quality dataset for analysis.

2.3. MicrobiomeGSM

One of the approaches used in this study is MicrobiomeGSM, which is a machine learning-based model. The MicrobiomeGSM tool was designed and developed by B. Bakir-Gungor and colleagues [9]. This tool uses metagenomics data as a feature set. In the introductory article of the model and its other article, metagenomics data of patients with diseases such as colorectal cancer and irritable bowel diseases were used, and biomarkers that may be important for these diseases were determined with a feature selection based on biological data-based grouping [9,13]. The performance of this model was calculated separately for each disease dataset. The main purpose of the model is to increase its prediction performance by using fewer features and machine learning techniques and to predict biomarkers of the disease at the taxonomic level. Within the grouping-based feature selection framework, microbial groups are defined at three key taxonomic ranks: family, order, and genus. It eliminates many less important features from the dataset, having levels at the species level and tries to provide a stronger classification by obtaining species that may be important at the end of this grouping. The model mentioned produces a separate result for each taxonomic class for family, order and genus ranks.
During this process, three main steps are implemented; grouping, scoring, and modeling (G-S-M approach). In the “grouping” step, the dataset with three main different taxonomic levels is grouped one by one as family, order, and genus according to the same taxonomic levels. Each specific species has its own abundance values found in that sample. In the second step, the ‘scoring’ component, the Random Forest model was applied for each group with 5-fold Monte Carlo cross-validation as an initial filtering step (Figure 1). Each group is assigned a feature importance score, allowing the groups to be ranked accordingly. The top k groups with the highest importance (e.g., the top 10 groups) are selected to proceed to the final ‘modeling’ stage. To ensure a fair and robust benchmark against the TFS approach, MicrobiomeGSM is re-trained with Random Forest in the 100-fold Monte Carlo cross-validation setting on the best groups. In the modeling step, new p-values for the features are calculated with the RobustRankAggreg algorithm [19], and the features are ranked. The RobustRankAggreg algorithm aims to check if there is any random sequence for the features. In that model, stratified sampling is used to achieve an even distribution between class labels (positive and negative) (Figure 1).
Additionally, G-S-M [20] approach forms the basis for developing tools like maTE [21], PriPath [22], GediNET [23], miRcorrNet [24], 3Mint [25], GeNetOntology [26], TextNetTopics [27], MicroBiomeGSM [9], miRGediNET [28], miRdisNET [29], miRModuleNet [30], CogNet [31] and AMP-GSM [32], which integrate biological networks and prior knowledge to provide a comprehensive understanding of genetic interactions.

2.4. Traditional Feature Selection Approaches

The total dimension of metagenomic data is large for classification and prediction operations. Therefore, feature selection and data cleaning are critical steps to reduce data dimensionality. In human microbiome research, high-dimensional datasets are frequently optimized using traditional feature selection methods to achieve favorable outcomes [15].
Among these methodologies, the Minimum Redundancy Maximum Relevance (mRMR) algorithm minimizes the interdependence among features while maximizing the correlation between each feature and the target class label [33]. This method typically utilizes forward selection techniques through a sequential search [33]. The Conditional Mutual Information Maximization (CMIM) approach selects features based on conditional entropy and mutual information [34,35]. It ensures that a feature is only picked if it provides new information alongside already selected variables [35]. The Fast Correlation-Based Filter (FCBF) ranks feature according to their mutual information with the target class [36]. It systematically eliminates redundant features below a defined threshold based on the concept of “predominant correlation,” operating independently of any specific classifier [36]. Additionally, the Select K Best (SKB) method scores individual features against the class label using specific statistical functions and retains only the top k highest-scoring variables [37].
In the literature, these traditional feature selection techniques have demonstrated robust performance in human microbiota analysis. For instance, they have been successfully applied to inflammatory bowel disease-associated metagenomic datasets [38] and various cancer-related microbial profiles [16]. In Python 3, these standard methodologies are efficiently implemented through the scikit-feature and scikit-learn libraries [37]. Consequently, to enhance classification performance and identify robust, clinically relevant biomarker candidates for gastrointestinal cancer prediction, this study utilizes a comprehensive suite of TFS algorithms. Specifically, we incorporate mRMR [33], CMIM [35], FCBF [36], Information Gain (IG), SKB [37] and Extreme Gradient Boosting (XGBoost).

2.5. Random Forest Algorithm

Due to the interpretability of tree-based models and their ability to be easily transformed into rule sets, RF was selected for subsequent experiments. Moreover, RF is widely regarded as one of the most frequently employed algorithms and has the best performance in human microbiome research [15,39]. Thanks to this best performance, RF was used in the MicrobiomeGSM as a main model.
Specifically, because of the RF’s success, the RF predictor node from the H2O library within Konstanz Information Miner (KNIME) was utilized for the solid normal tissue samples and normal blood tissue of all cancer types to compare the model performances. To establish a baseline, this Random Forest model was trained directly on the full dataset without incorporating any prior feature selection processes.

2.6. Classification Model Construction

In the preliminary analysis of TFS approach, Decision Tree, RF, LogitBoost, AdaBoost, an ensemble SVM with kNN (k nearest neighbors), and an ensemble Logitboost with kNN were applied to evaluate the effects of different classification methods on the blood and solid samples. The main purpose of this approach is to select the important features with multiple selections and try to achieve high performance with these features.
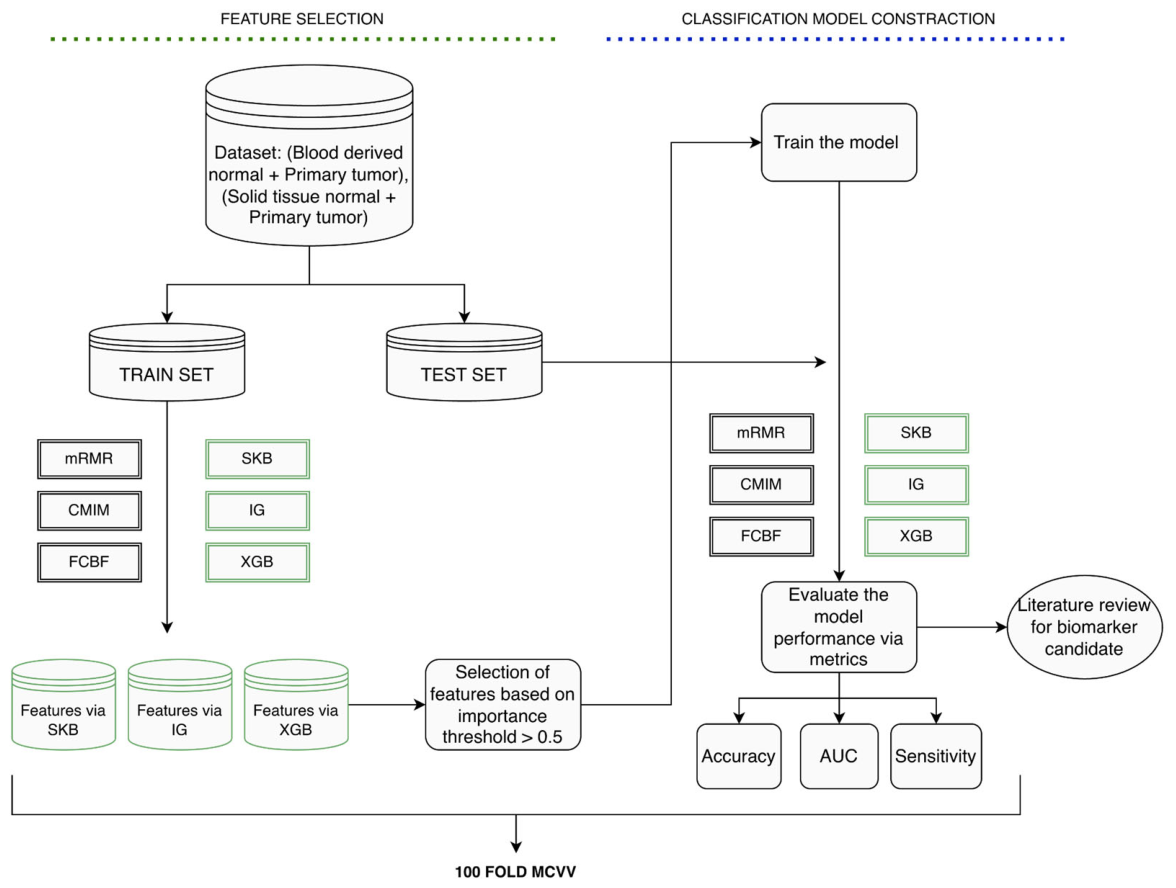
Our experimental design involved utilizing 100-fold Monte Carlo cross-validation (MCCV) in a TFS approach. This method involves randomly partitioning a subset of the dataset (without replacement) to form the training set, while the remaining data is allocated to the test set [40]. The process is repeated numerous times, with each iteration generating a new set of training and testing data [40]. For these experiments, 90% of the data was selected for training and 10% for testing. As depicted in Figure 2, feature selection techniques were applied only to the training set. The methodology was implemented using the KNIME platform [41].
As seen in the results, SKB, IG, and XGB feature selections produced the best performance results among all feature selection models, and it was decided to use these feature selections in the subsequent experiments. To account for the varying scales and ranges of importance values across different TFS algorithms, all importance scores were normalized between 0 and 1 using MinMax scaling. Following this normalization, a standardized threshold of greater than 0.5 (the mathematical midpoint) was applied as a strict filter to select the top features. The obtained model performances were shown in the Results section. These steps were performed one by one for both solid normal tissue and blood-derived data. In addition, the model performances of all cancer data increased to and stabilized at the highest level in the experiments conducted with features above the 0.5 thresholds.

2.7. Model Performance Evaluation

All datasets were tested with both the combination of solid normal tissue and primary tumor to create positive and negative classes. In addition, other positive–negative classes were created with the combination of normal blood samples and primary tumor. These datasets were tested with both TFS/classification models and the pre-existing biological data-based MicrobiomeGSM tool and Random Forest model. As shown below, the performance metrics include Accuracy, Precision, Specificity and F1-score, which are calculated based on true positives (TP), false positives (FP), true negatives (TN), and false negatives (FN). In addition, the Area Under the Curve (AUC) is used to evaluate how well the classifier can distinguish between classes. Although MicrobiomeGSM promises high performance, its main purpose is to try to correctly detect biomarker candidates by reducing the number of features it uses during prediction.
Sensitivity (SEN) = TP/(TP + FN),
Specificity (SPE) = TN/(TN + FP),
Accuracy (ACC) = (TP + TN)/(TP + FP + FN)
These formulas are provided by all models used.

2.8. Jaccard Similarity Index Between Species of Cancer Types

Two different word clusters may contain similar or different words (feature sets) or even more than one of the same words [42]. The similarities of these two different sets of words can be measured with the similarity scores obtained from the Jaccard similarity index. It is also known as Intersection-Over-Union and is the ratio of the size of the intersection to the size of the union of the two datasets. The similarity score ranges between 0 and 1; as the value gets closer to 1, the similarity increases [42,43]. In this study, these word sets represent potential biomarker candidates for various cancers. We used the Jaccard similarity index to compare the results of five cancer types, using both traditional and biological feature selection methods. Following the identification of potential biomarkers, a comparative analysis was performed to determine their overlap. This approach allows us to clearly show the differences and commonalities between GI cancers based on their potential biomarkers in the Section 3.

3. Results

3.1. MicrobiomeGSM Results

As the biological data-based approach, the MicrobiomeGSM model described above was implemented within KNIME 4.6. The Random Forest Classifier was applied using a standard setup, with 90% of the data used for training and 10% for testing in MicrobiomeGSM. To address the class imbalance in the datasets, a subsampling strategy was used, aiming for a 2:1 ratio between classes during model training. To evaluate the model’s performance, Monte Carlo cross-validation is used. The results were averaged over 10 repetitions to reduce variation and improved reliability. This method helps provide a more accurate and objective assessment of the model. The cancer type that gave the best result was COAD from blood and solid tissue normal samples. As seen in Table 2, Table 3 and Table 4, the AUC values of the measurements made at the family-order-genus levels of blood samples were 95%, 94%, and 97%. In comparison, the specificity values are 92%, 97%, and 97%, and the sensitivity values are 87%, 88%, and 87%, respectively. In contrast, the performance metrics derived from the solid normal tissue samples of COAD exhibited AUC values of 83%, 88%, and 90% at the family, order, and genus levels, respectively. For these solid tissue models, the specificity values were recorded at 70%, 65%, and 55%, while the sensitivity values reached 98%, 96%, and 90%.
This Table 5 shows the differences between the used approaches for the COAD dataset with blood tissue as a negative control. The performance metrics reported for MicrobiomeGSM-genus represent the exact mean values obtained from Cluster 1 (30 species) in Table 4. Almost all performance metric results across all approaches are more than 90%. Specifically, MicrobiomeGSM used 30 different species, while the best TFS approach (IG with XGBoost) used 23 species in the second run. On the other hand, the standard Random Forest model does not use a feature selection process to find biomarker candidates in the COAD dataset.
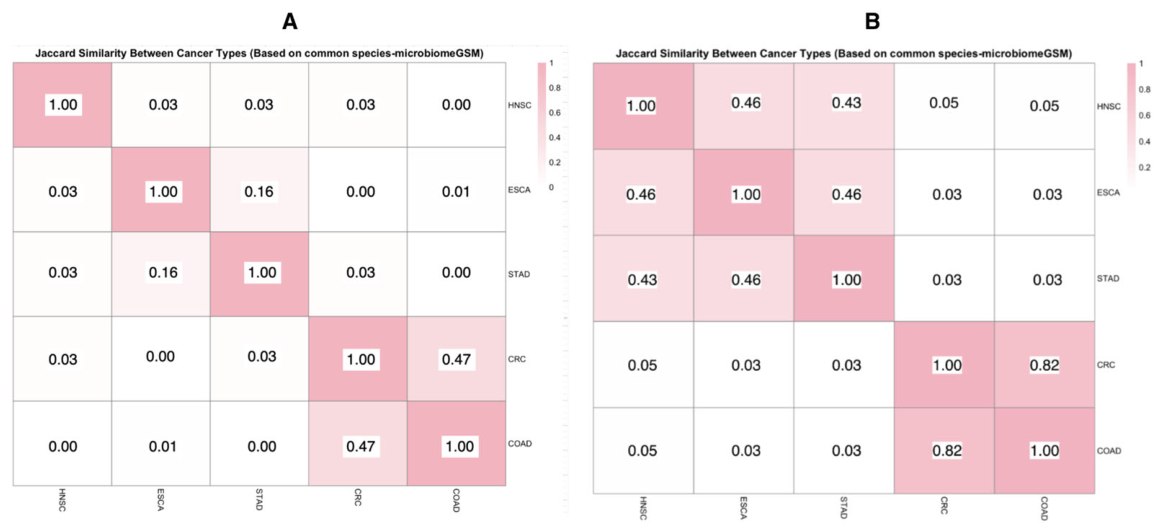
The 15 most important genera and their top five species from blood-primary tumor samples were used in this similarity analysis. According to Figure 3B, the Jaccard similarity index between CRC and COAD is 0.82, indicating an 82% microbiome similarity between primary tumors when blood is used as a negative control. This suggests that CRC and COAD form a distinct group separate from other GI cancer types, with shared species comprising 81% of the key taxa. HNSC, ESCA, and STAD show moderate similarity, with Jaccard indices of 0.43 and 0.46, suggesting that nearly half of their key microbial species overlap. In contrast, the similarity between HNSC and CRC-COAD is only 5%, while ESCA and STAD share just 3% similarity with CRC-COAD.
These findings suggest that distinct gastrointestinal cancers may share common biomarker signatures. While each group retains some common species, their overall microbiota compositions remain distinct.
The 15 most important genera and their top five species from normal tissue-primary tumor samples were used in this similarity analysis. According to the Jaccard similarity index Figure 3A, CRC and COAD have 47% microbiome similarity between primary tumors when normal solid tissue of the patient is used as a negative control. While the STAD and CRC cancer types share 3% common biomarker candidates, STAD and COAD have no common biomarker candidates. While STAD and ESCA have 16% same important microorganisms, STAD shares just 3% similarity with HSNC.
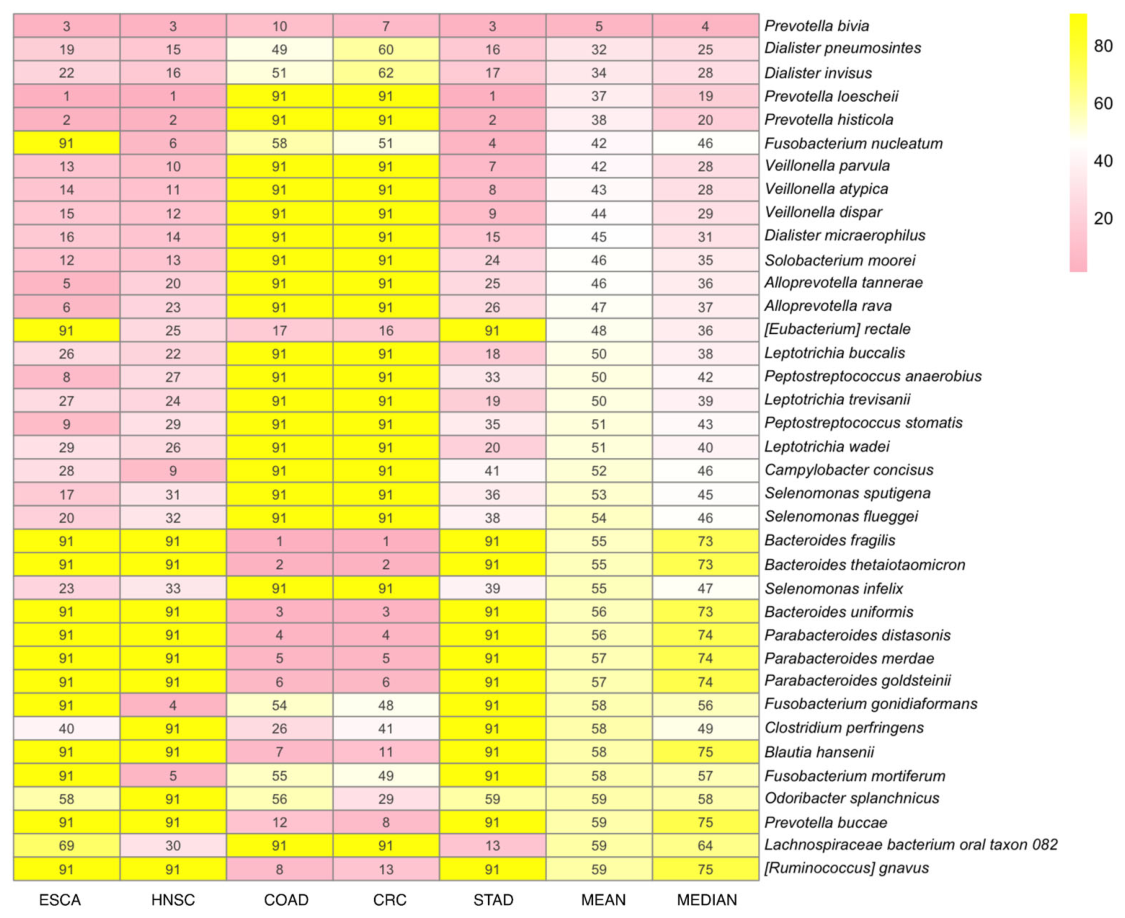
This heatmap Figure 4 compares the top 35 genus and their top three species taxonomic biomarker candidates across different GI cancer types based on p-values of species from the MicrobiomeGSM model from the blood tissue sample. This heatmap is ordered based on mean value; hence, we can see the most common and important biomarker for each cancer with one figure. The mean represents the average of the importance rankings of biomarker candidates for all cancer types. Median shows the middle of the important places of specific biomarker candidates for each cancer type. Prevotella bivia is the third-most important microorganism for ESCA, HNSC, and STAD, while the 10th most important microorganism for COAD and the 7th microorganism for CRC. Dialister pneumosintes is the 15th microorganism with the best p-value in HNSC, 16th in STAD, 19th in ESCA, 49th in colon cancer, and 60th in colorectal cancer. Dialister invisus is a common and important species for five cancer types as well. Provetella loescheii and Provetella histicola may be the first two essential biomarker candidates for ESCA, HNSC and STAD. The 91st place of species means this species is not important among the first 35 genus and their top three species of cancers. Fusobacterium nucleatum is another most common biomarker candidate with four cancer types, HNSC, COAD, CRC and STAD. Another Fusobacterium species Fusobacterium conidiaformans and Fusobacterium mortiferum are shared species in HNSC, COAD and CRC. Veillonella parvula, Veillonella atypica and Veillonella dispar are shared species ESCA, HNSC and STAD from 7th to 15th place. While Solobacterium moorei is common for STAD, ESCA and HNSC, Eubacterium rectale are shared among HNSC, COAD and CRC.
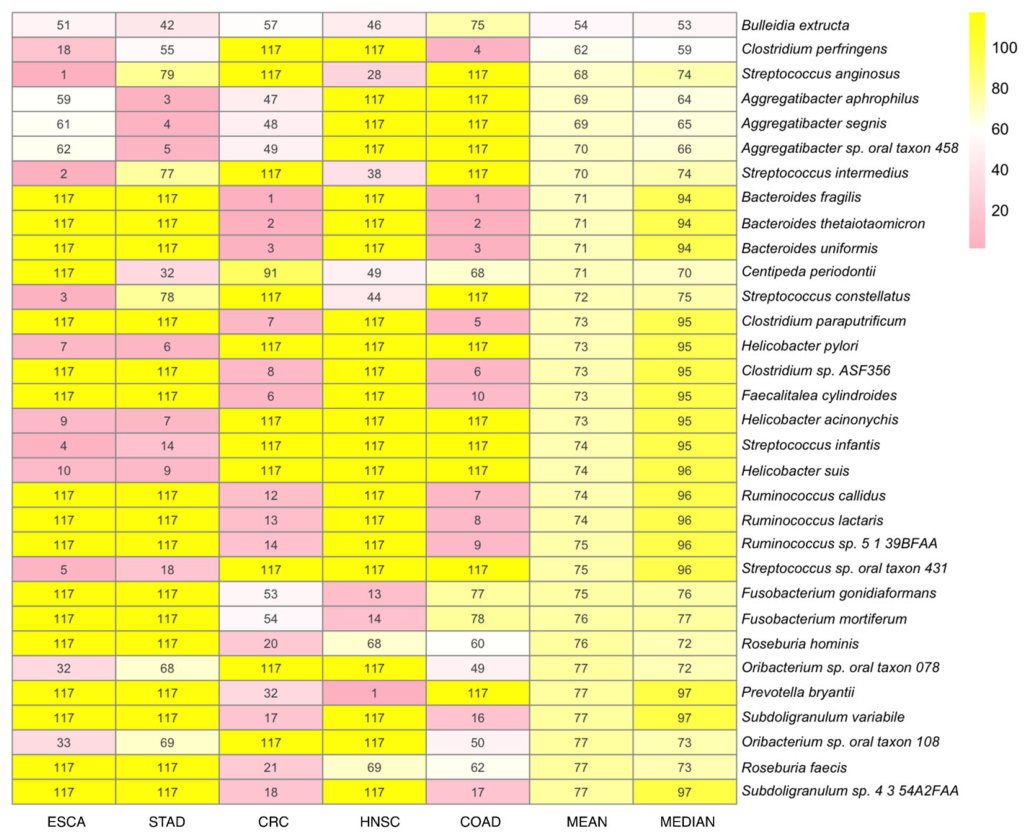
Figure 5 compares the top 40 genus and their top three species taxonomic biomarker candidates across different GI cancer types based on p-values of species from the MicrobiomeGSM model from solid normal tissue and primary tumor samples. These candidates are common for at least two cancer types. All results are obtained from the microbiomeGSM model. Among these top biomarker candidates for each cancer type, HNSC has the fewest shared candidates with other cancer types. HNSC shares the Prevotella bryantii and Fusobacterium species with another cancer type, CRC. Bulleidia extructa has a moderately important place in disease but it is the most common species for each cancer. Bulleidia extructa is the 42nd microorganism with the best p-value in STAD, 46th in HNSC, 51st in ESCA, 57th in colorectal cancer, and 75th in colon cancer.

3.2. Traditional Feature Selection Results

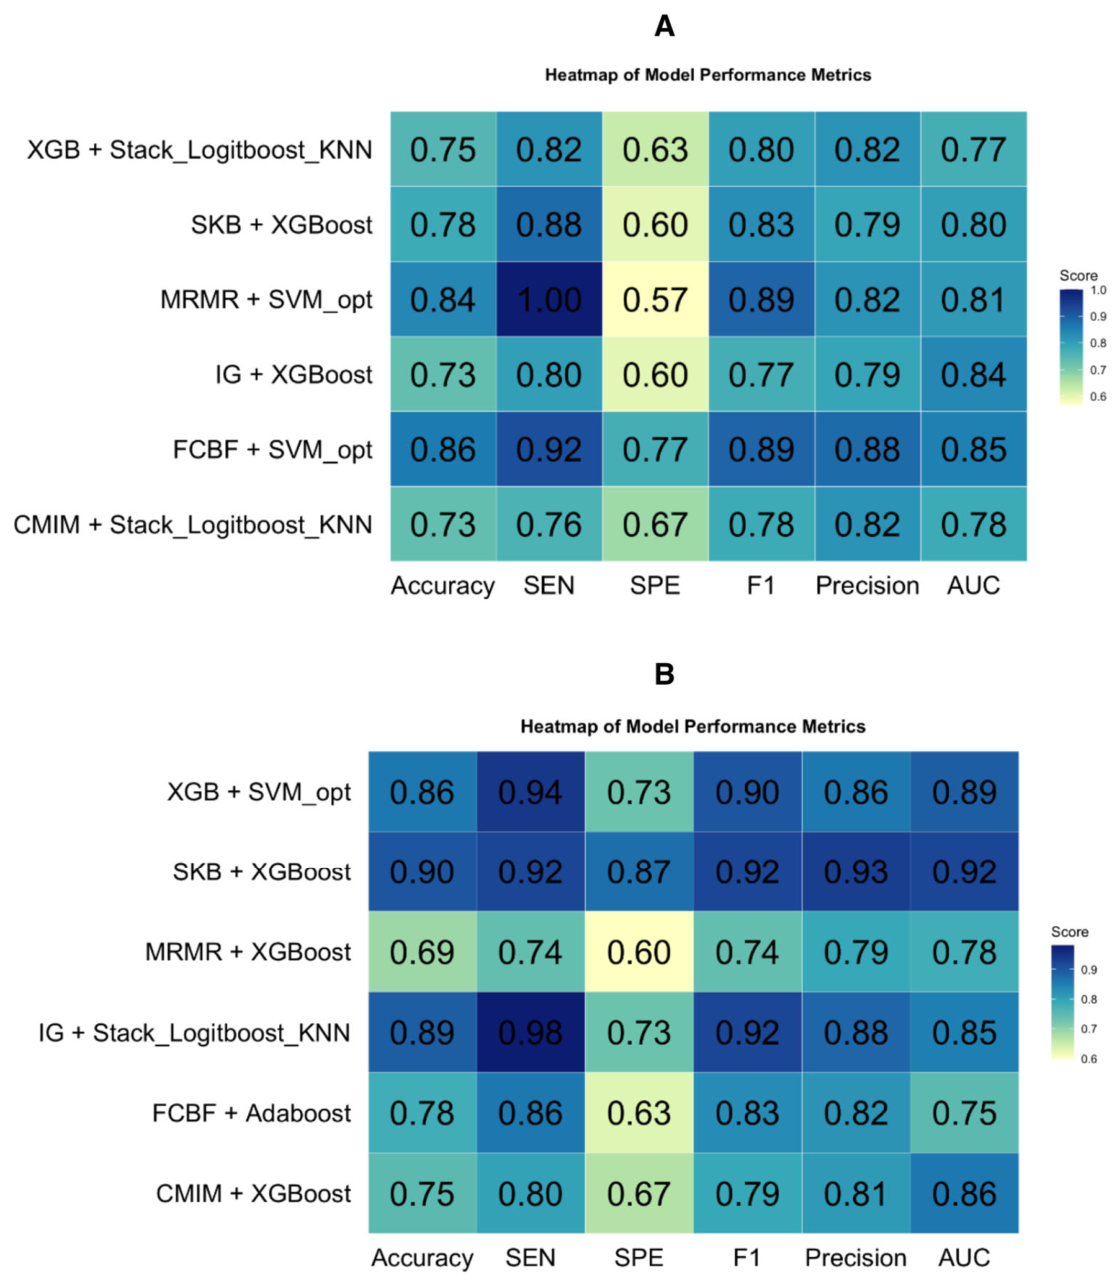
The COAD dataset was combined with rectum adenocarcinoma data to construct a unified colorectal cancer (CRC) dataset, given that colorectal cancer encompasses both colon and rectum malignancies [44]. After organizing the COAD and CRC data, a TFS approach was utilized for the CRC dataset, and all features (685) were used and evaluated without feature selection as in Figure 6A. Among the AUC values, the FCBF, IG, and MRMR feature selection models have the highest values: 85%, 84%, and 81%, respectively. Then, the experiment was repeated by selecting a total of 17 features from the FCBF, IG, and MRMR feature selection models, with a threshold of 0.5, as seen in Figure 6B. The model performances reached the top point with 17 features. Among the AUC values of the prediction made with fewer features, the SKB, XGB, CMIM, and feature selection models again have the highest values, 92%, 89%, and 86%, respectively. Minimizing the feature space substantially reduces computational complexity and down-stream diagnostic costs; in this regard, utilizing a refined signature of only 17 features for CRC successfully yielded highly comparable and robust predictive performance.
After the initial TFS approach, potential species that could be significant across all cancer types were identified and added to the table. As a result, the traditional FS approach is not enough for selecting biomarkers and it needs an extra feature selection process.
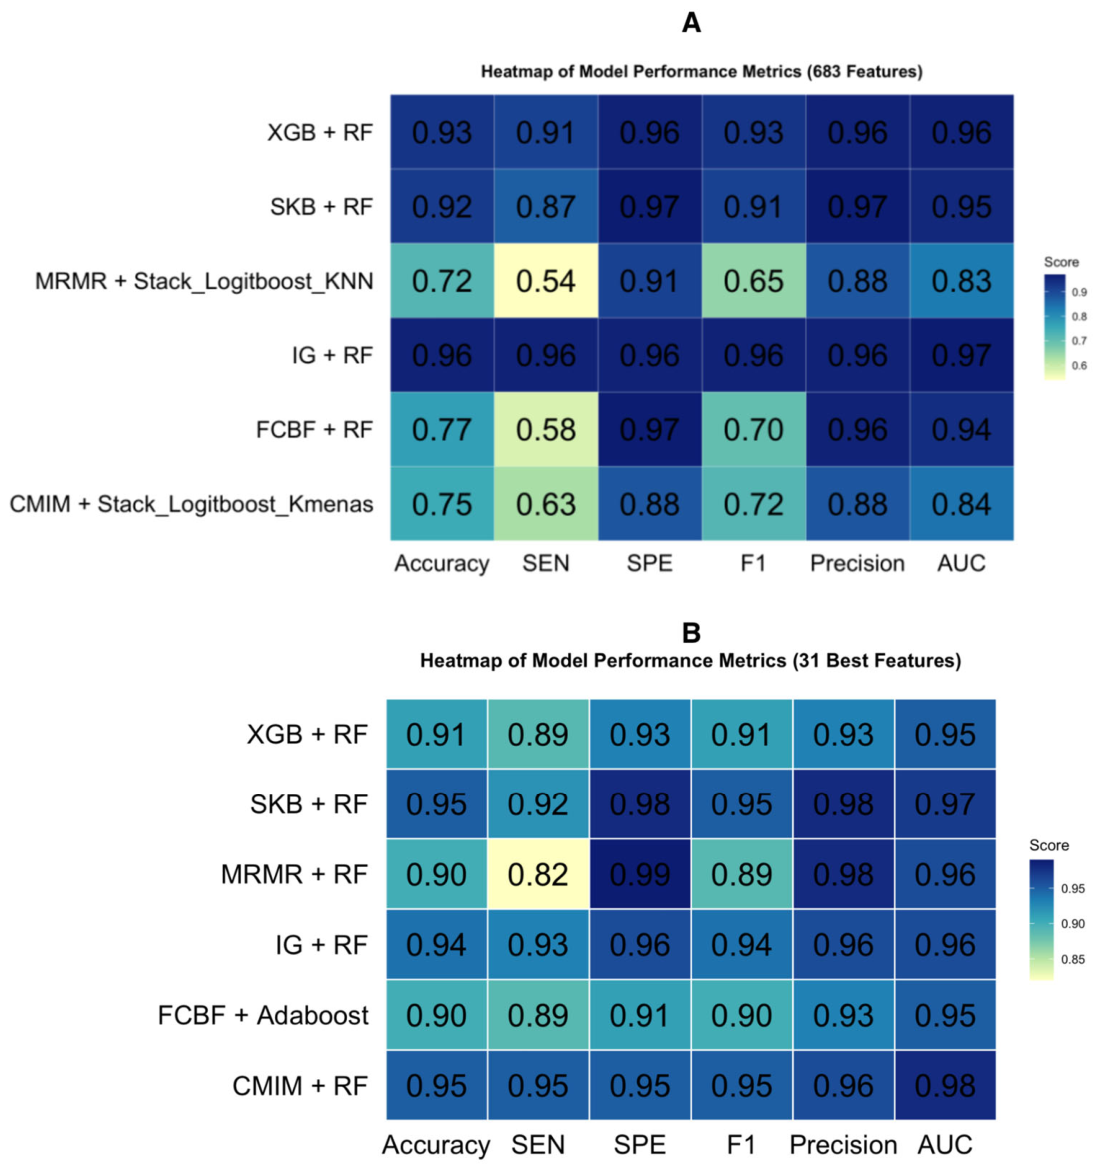
A TFS approach was applied to the CRC dataset derived from normal blood samples and primary tumor profiles. Initially, all 683 features were evaluated without prior filtering to establish a baseline performance, as illustrated in Figure 7A. Among the AUC values, the RF with IG, RF with XGB, and RF with SKB feature selection models have the highest values: 97%, 96%, and 95%, respectively. Then, the experiment was repeated by selecting a total of 31 features from the SKB, IG, and XGB feature selection models, with a 0.5 threshold as seen in Figure 7B. All model performances, including the CMIM feature selection model, reached the top point with 31 features. Among the AUC values of the prediction made with fewer features, the RF with CMIM, RF with SKB, RF with mRMR and RF with IG feature selection models have the highest values, 98%, 97%, 96% and 96%, respectively. The best accuracy values belong to RF with CMIM and RF with SKB, 95% for both.
CMIM demonstrated the most significant improvement compared to the baseline, with the AUC increasing from 84% to 98% and accuracy improving from 75% to 95%. Almost all accuracy values are increased after selecting the best features from the first result. Controlling the number of features means less time and cost. In this respect, using only 31 features for CRC produced comparable evaluation criteria.
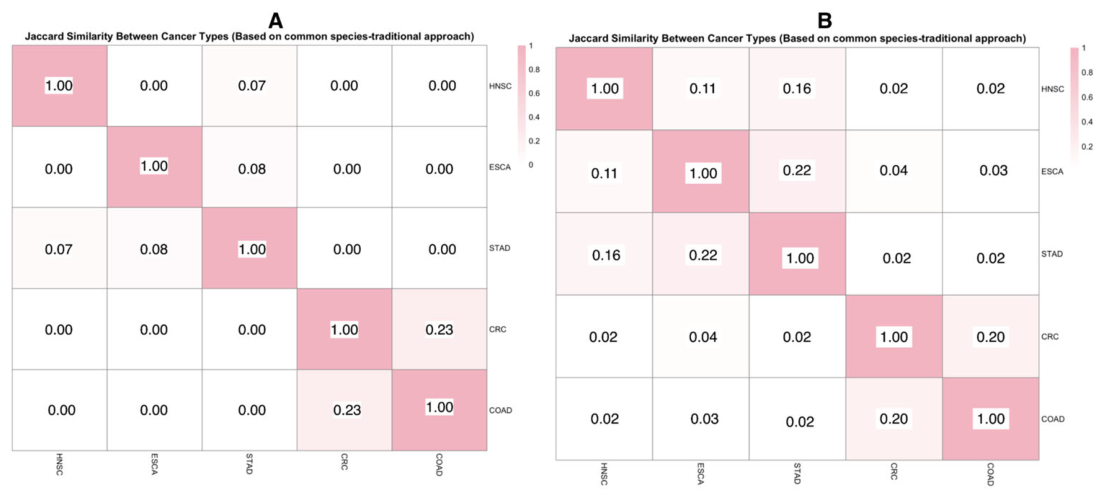
Then, Jaccard similarity index was applied to all datasets. With the Jaccard similarity index, we can see the correlation in common possible biomarkers between these five types of cancers in solid normal tissue and blood normal tissue samples. Within this TFS framework, features demonstrating a normalized importance score greater than 0.5 in each respective model output were selected for performance evaluation. This filtering strategy simultaneously enhanced model performance while reducing the number of utilized species to a refined subset of 15 to 20 taxa. As the number of species decreased, the number of species that could be common also tended to decrease.
According to this TFS approach from the solid tissue sample results in Figure 8A, there is no similarity between the ESCA, HNSC, and STAD triple group and the COAD and CRC binary group. When the similarities between ESCA, HNSC, and STAD cancers are examined, the similarity percentages are 8% at the highest. When the COAD and CRC pairs are examined, the similarity increases to 23%.
The similarities of these five types of cancers from the blood sample and primary tumor are slightly higher than the solid normal tissue results of the TFS approach, as seen in Figure 8B. When the similarities of ESCA, HNSC, and STAD cancers are examined, the highest similarity is between STAD and ESCA with 22%. The similarity between HNSC and ESCA is 11%, while the similarity between HNSC and STAD is 16%. There is a 4% similarity between the ESCA and CRC cancer types in terms of biomarker candidates, while there is a 3% similarity between ESCA and COAD. The similarity between the STAD-HNSC and COAD-CRC binary groups is 2%. When the COAD and CRC binary groups are examined, the similarity reaches 20%.

3.3. Random Forest Performance Results

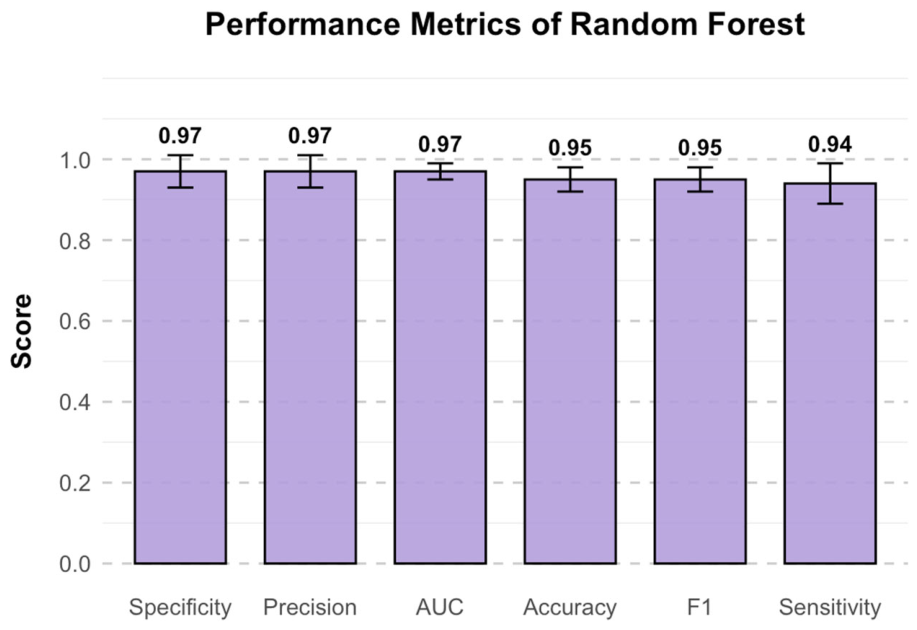
The main idea of this RF experiment was to compare the performance of models. Microorganisms were not ranked and considered in Section 3. Figure 9 presents the results of the Random Forest prediction algorithm. The MicrobiomeGSM tool also employs a Random Forest model, and this table specifically evaluates the performance of the RF model alone. The results demonstrate the high performance of this model, indicating that MicrobiomeGSM was developed using the optimal model. All performance metrics reached to almost 95% or above for the COAD dataset with blood tissue.

4. Discussion

4.1. Model Performance Results of MicrobiomeGSM

This study aims to identify both unique and shared biomarker candidates present in the microbiota of these cancers using solid tissue and blood samples. These biomarkers may play a significant role in cancer progression, producing either beneficial or detrimental effects on human health [45]. In this context, biomarkers include not only pathogenic species that increase during malignancy but also beneficial bacteria whose significant decline reflects a state of dysbiosis. The depletion of these protective microorganisms in cancerous samples can be as clinically informative as the presence of harmful ones. Additionally, this research explores whether common biomarker candidates among these cancer types could correspond to patterns observed in metastasis. While confirming active metastatic pathways requires direct experimental validation, identifying shared microbial signatures across different primary sites may offer clinically valuable clues. For instance, detecting these signatures could guide clinicians to closely monitor potential risk areas, potentially anticipating early-stage alterations before they become visible through standard imaging modalities like positron emission tomography (PET) scans. Although detection at the microorganism level does not replace clinical diagnostics, evaluating how carcinogenic microbes colonize and alter the local environment provides insights into how dysbiosis aligns with cancer progression.
The MicrobiomeGSM model was developed to identify biomarkers from biological data using the Grouping-Scoring-Modeling approach, providing species-level insights. This model was compared with the TFS method, consisting of feature selection models such as FCBF, SelectKBest, XGB, CMIM, mRMR, and IG. The RF model was also evaluated alone to compare performance across all three approaches. Since RF generally handles complex data well, it was used as the main algorithm in the MicrobiomeGSM model, demonstrating robust performance on the dataset (Figure 9). This reliability stems from several factors: microbiome data contain several thousand features, and RF, as an ensemble learning approach, can handle high dimensionality and noise without severe overfitting. Furthermore, RF effectively ranks feature importance for individual species and does not require a specific data distribution, making it highly flexible for sparse microbiome datasets [15].
Following RF, AdaBoost provided acceptable performance with fewer features for blood samples after the second run. For solid tissue samples, a stacking approach combining LogitBoost with KNN—as suggested by Marcos-Zambrano et al. [15]—yielded high sensitivity and F1 values for the CRC dataset using only 17 features. In this stacking configuration, LogitBoost provides class probabilities which KNN uses for final predictions, making the combination more robust than a single model. Meanwhile, traditional workflows also showed strong results; the full CRC dataset (685 features) achieved high performance using FCBF with SVM, while the reduced 17-feature set was successfully predicted using SKB with XGBoost. XGBoost demonstrated moderate to high performance on solid tissue data from CRC patients using a reduced feature set. In the blood sample analysis of the CRC dataset involving 683 features, the combination of IG and RF achieved highly competitive classification performance. Following feature selection via the SKB method, which reduced the feature set to 31, the RF model reached 95% accuracy and 98% AUC. Similarly, the CMIM-RF configuration demonstrated robust performance, matching the 95% accuracy and 98% AUC, while achieving a balanced sensitivity and specificity of 95%.
In multiple feature selection and multiple classifier TFS workflow, RF, LogitBoost (occasionally stacked with KNN), SVM, and XGBoost have consistently demonstrated high classification performance in both blood and solid tissue samples. Regarding feature selection, IG, XGBoost, and SelectKBest have frequently yielded superior results. The consistent success of these methods can be attributed to their robustness against high-dimensional data, ability to handle non-linear relationships, and effectiveness in identifying relevant microbial features. RF is robust against overfitting and can handle high-dimensional, sparse data typical of microbiome datasets. Logitboost provides high performance on the dataset with fewer features, as like to the study in the literature [46]. This boosting algorithm focuses on difficult-to-classify samples by iteratively adjusting weights, enhancing prediction accuracy in noisy and imbalanced datasets, such as those found in cancer microbiome studies [46]. SVMs are effective in high-dimensional spaces and can model complex boundaries using kernel functions. They are particularly useful when the number of features exceeds the number of samples, a common scenario in microbiome data [16]. By combining multiple weak learners, AdaBoost creates a strong classifier that emphasizes misclassified instances, improving performance in datasets with subtle patterns, such as microbial signatures associated with cancer [47]. IG Ranks features based on their ability to reduce entropy, which helps in identifying microbiome features with high discriminative power [38]. XGB, as a gradient boosting method, naturally ranks features by importance while training, enabling selection of the most predictive microbial taxa [48]. SKB is a straightforward method that selects the top k features based on univariate statistical tests and is effective when combined with strong classifiers, especially in high-dimensional microbiome data.
When evaluating these performance metrics, a critical balance must be acknowledged. As shown in our results, the absolute classification performance (AUC and accuracy) of MicrobiomeGSM is highly similar and comparable to these traditional, robust TFS approaches. This indicates that the main contribution of MicrobiomeGSM does not lie in achieving substantial gains in raw predictive accuracy, but rather in its superior capacity for dimensional reduction and biological interpretability.
While traditional “black-box” models or massive feature sets achieve high performance by using hundreds or thousands of variables, MicrobiomeGSM achieves matching accuracy while narrowing the vast microbiome space into a concise, highly informative set of biomarker candidates.
The primary advantage of the MicrobiomeGSM model is the opportunity to examine microorganisms in the target disease at multiple taxonomic levels, unlike traditional approaches. It identifies microorganisms not only at the species level but also at the family, order, and genus levels by grouping their importance levels, allowing for a structured analysis of differences across taxonomic hierarchies. Consequently, the value of MicrobiomeGSM comes from its ability to distinguish entire functional communities of species rather than isolated single microbial entities. By emphasizing groups of bacteria and viruses instead of single entities, the tool provides a holistic perspective and identifies microbial communities potentially involved in specific diseases, thereby translating competitive predictive scores into deep biological interpretations. However, moving these computational patterns into real clinical practice has some limitations. While finding broad taxonomic groups gives deep biological insights, direct clinical use still needs more lab validation to show the exact roles of these groups. In the future, as cancer microbiome datasets grow to include more diverse real-world patient data, this framework can serve as a helpful diagnostic tool. This will help doctors identify broad microbial dysbiosis patterns alongside standard clinical checks.
Our results also show that model performances obtained from blood samples are generally superior to those obtained from normal solid tissue samples. This suggests that detecting potential microbial biomarkers from blood may be more feasible during machine learning training than using adjacent normal tissue as a negative control. Healthy tissue samples taken from cancer patients often possess an unbalanced microbiome, making it difficult for classification algorithms to separate positive and negative patterns in the first run. According to the literature, tumor initiation triggers microbial shifts that begin near the dysplastic epithelium and eventually spread to the luminal compartment [45]. This localized dysbiosis can alter the microbiome of surrounding healthy areas, explaining why all feature selection models initially struggled with normal tissue data and required a second run with optimized, high-importance features.
Additionally, although blood has traditionally been viewed as sterile, recent research shows that microbial signatures—including whole bacteria and cell-free DNA—can be present, especially in individuals with inflammation or dysbiosis [49]. These microbes likely originate from the gut or oral cavity and translocate into the bloodstream when epithelial barriers are compromised. Since most microbial DNA in blood is concentrated within the buffy coat, where immune cells like leukocytes may internalize bacterial components, blood samples provided a highly stable and discriminative signal for our classification models. Consequently, upon examining the final results, it is evident that the highest predictive performances for each cancer type were consistently achieved when using blood samples.
When solid tissue samples were used as the negative control, fewer common biomarker candidates were identified across different cancer types, whereas using blood samples led to the detection of more shared biomarker candidates. Since these negative controls were obtained from the same patients as the positive controls, critical confounding factors such as diet, BMI, age, disease history, and smoking habits remained constant, which significantly enhances the experimental reliability of our framework. Consequently, the observed differences primarily reflect the localized and systemic shifts in microbial compositions rather than patient-specific background noise.
According to the ranked heatmaps in Figure 4 and Figure 5, which list biomarker candidates, COAD and CRC do not share 100% of the same microorganisms; there are notable differences. For example, in Figure 4, Blautia hansenii ranks 11th in the COAD dataset but 17th in the CRC dataset. Similarly, Blautia obeum ranks 13th in COAD but 22nd in CRC. This variation is not specific to the Blautia genus, as other species also show ranking differences. The CRC dataset was created by merging COAD and rectal cancer datasets, as they are often not separated in the literature. However, these results suggest that some microbial species might be specific to anatomical regions, such as the rectum, indicating that CRC and COAD may not be entirely identical.
It may be suggested that the grouping logic of the model requires further refinement at the species level. Although the model consistently identifies groups, it is currently challenging to find literature that fully supports these groups at the species level. Since most interpretations in the literature are at the genus level, this discussion is mainly supported by genus-level evidence rather than species-level.
Ref. [45] researcher explained that the microbiota composition of early- and late-stage cancers can be different in humans, but this distinction is not available in the dataset used. So, it may affect the type and number of biomarker candidates which were obtained from machine learning models. Also, age-related changes in microbiota are possible in diseases according to the literature [50]. This age distinction is not visible for this study. Additionally, microbiome differences between stool and tissue samples may explain the variation between species found in this study and those reported in stool-based studies. With a larger dataset, it may also become possible to separate cancer types more clearly based on their anatomical location.

4.2. Biological Validation of Obtained Biomarkers Across Different Approaches

Liang, W. and other researchers [51] conducted a wet lab experiment to investigate the presence of the Prevotella genus in STAD tissue. Their positive results support their thesis that Prevotella could serve as a potential biomarker for gastric cancer (STAD). The number of Campylobacter decreases in STAD, which supports our model result where blood samples containing the top 35 biomarker candidates are used as negative samples [52]. Also, Castañeda-Corzo, G., and coworkers [53] conducted a case–control study about Prevotella intermedia, which is in the Prevotella genus group and frequently found in oropharyngeal cancer, which is one of the HNSC types. In addition to this study, Moreira’s article [54] highlighted that Prevotella sp. is significantly increased on cancer tissue in the esophagus compared to healthy individual samples. Our results supported that this genus has a chance to be a possible biomarker of the ESCA HNSC and STAD, like in the above research. P. buccae and P. buccalis play a role in the generally head and neck infections as well according to this research [55]. Microbiota contents may change depending on age; for example, it has been experimentally supported that Prevotella bivia species is associated with age in CRC patients (p < 0.05) [56]. In this study, the data were not separated according to age, so this may be another reason for the differences between the results obtained and the results in the literature.
Administration of Parabacteroides distasonis alleviates CRC metastasis, with its metabolite P-hydroxyphenyl acetic acid (4-HPAA) playing a crucial role [57]. At the genus level, Parabacteroides and Ruminococcus are abundantly found in samples of stage 3 and 4 colorectal cancer patients. For example, the Parabacteroides genus was observed to be more abundant in cancer tissue than in non-cancerous tissue, while the abundance of this genus was observed to indicate poor prognosis in cancer patients [58].
The study [59] results showed that Clostridium and Fusobacterium genera were more abundant in patients with STAD, but less abundant in healthy individuals. The article suggests that these may be biomarkers for STAD because it has been observed that Clostridium and Fusobacterium genera colonize and become quite prevalent in the gastric microenvironment of cancer patients. According to [60], HNSC patients can host Fusobacterium at a higher rate compared to healthy individuals, with this microorganism showing greater abundance in cancer lesions. Our results showed that Clostridium and Fusobacterium genera are highly associated with STAD and HNSC, especially for the Fusobacterium genus.
According to the literature, one of the evolved bacterial lineages in the early evolutionary process is Bacteroidetes, which affects the development process of colorectal cancer [61]. More than 90% of the microbiota diversity in the colon consists of Bacteroidetes and Actinobacteria. Animal experiments have shown that some species of Bacteroides bacteria disrupt the normal functioning of reactions in the colon, causing abnormal crypt foci and inducing the formation of CRC [61]. As we have seen in Figure 4 and Figure 5, Bacteroides fragilis, which belongs to the Bacteroides genus, has the potential to be a common biomarker candidate in colon and colorectal cancer. Bacteroides fragilis can cause inflammation in the intestines by producing toxins, and this inflammation can trigger colorectal cancer [62].
Enterotoxigenic form (ETBF) of Bacteroides fragilis linked to chronic colitis and colitis-associated colorectal cancer through its toxin of Bacteroides fragilis [63]. Bacteroides fragilis toxin triggers inflammation, activates the Signal Transducer and Activator of Transcription 3 (STAT3) pathway, promotes T helper type 17 responses, and elevates interleukin 17 (IL-17) levels, all contributing to tumor development. According to the same article, clinical and animal studies have shown higher ETBF presence in CRC patients [63]. In contrast, non-toxigenic B. fragilis appears to have anti-inflammatory and anti-tumor effects via polysaccharide A acting through Toll-like receptor 2 (TLR2), which suppresses CRC cell proliferation, migration, and epithelial–mesenchymal transition [63].
Dialister has been reported to be associated with several types of cancer, including esophageal, gastric, and HNSC Dialister pneumosintes, Dialister micraerophilus, and Dialister invisus are one of the Dialister species which is in the cellular content. In ESCA, results are inconsistent: [64] reported a decrease in Dialister abundance in saliva samples from cancer patients, whereas [65] observed an increase in tissue samples. For STAD, six studies have investigated this association. Except for the study—which used stool samples and found a decrease in Dialister—all other studies using tissue samples reported a higher abundance of Dialister in cancer patients [66]. Notably, the same study also observed that Dialister increased in postoperative samples compared to preoperative ones. In HNSC, including laryngeal carcinoma and head and neck squamous cell carcinoma, eight studies consistently reported a significant increase in Dialister abundance in cancer patients across various sample types, such as saliva, oral swabs, and tissue biopsies. Yang and their colleagues specifically identified Dialister pneumosintes in association with head and neck cancer [67].
The potential mechanisms through which Dialister may contribute to cancer development include its metabolic byproducts and immunomodulatory effects. Dialister produces acetate and lactate, which are known to support tumor growth and metastasis, while propionate may have anti-tumor properties. Furthermore, Dialister has been found to be more active in tumor sites [68]. It is also positively correlated with Forkhead box P3 + regulatory T cells (Tregs), which are known to suppress anti-tumor immune responses and are associated with poor clinical outcomes. Both acetate and lactate have been shown to induce the development of these Tregs, suggesting that Dialister may promote cancer progression through metabolic support and immune suppression. However, as observed in the contrasting abundance trends between saliva and tissue samples, the biological impact of Dialister is highly dependent on the specific anatomical site and local oxygen gradients of the tumor microenvironment.
Solobacterium moorei has been implicated in two distinct cancer-related contexts: colorectal and gastric. In colorectal tissue, high levels of Solobacterium moorei have been identified in tissues from colorectal adenomatous polyps, with a significant positive correlation to local inflammatory responses [69]. This inflammation appears to play a role in weakening the intestinal barrier and accelerating the development of polyps, which are known precursors to colorectal cancer [69].
Experimental findings show that S. moorei adheres to HT-29 colorectal cancer cells and enhances their growth [69]. This effect is mediated by a Cna B-type domain-containing surface protein, which allows the bacterium to interact with integrin α2 and β1 on tumor cells. The binding activates a cascade involving phospho-FAK and the PI3K-AKT-mTOR-C-myc signaling pathway, promoting tumor cell survival and suppressing apoptosis [70]. When integrin α2 and β1 genes were silenced using small interfering RNA, the cancer-promoting influence of S. moorei was significantly reduced. In both cell culture and animal models, blocking integrin α2/β1 effectively neutralized its tumor-enhancing activity [70].
In contrast, studies investigating STAD progression observed a reduction in S. moorei abundance in patients with precancerous gastric lesions, such as intestinal metaplasia (IM) and dysplasia [71]. This depletion pattern resembles the paradoxical behavior of Helicobacter pylori, which initiates gastric carcinogenesis but declines as the disease advances [72]. Although S. moorei is typically known for its association with halitosis and oral opportunistic infections [69,73], its diminished presence in gastric lesions suggests a potentially complex role in early gastric tumorigenesis. Further research is necessary to determine whether this decrease is protective, incidental, or part of a broader microbial shift during precancerous transformation. These contradictory patterns across colorectal, gastric, and esophageal tissues underscore that a single biomarker candidate can exhibit entirely distinct ecological behaviors depending on the physiological properties of the specific organ.
Solobacterium moorei has been linked to a reduced risk of esophageal adenocarcinoma, according to findings by Peters and his friends [74]. In contrast, its presence has also been documented in advanced laryngeal squamous cell carcinoma which is part of HNSC types. In a clinical case reported by Sarvari [75], S. moorei was isolated in high abundance from the surgical wound of a 43-year-old male patient with stage II laryngeal cancer, who had a history of heavy smoking and alcohol use. Despite undergoing multiple treatments, including radiotherapy and total laryngectomy, the bacterium was found along with other anaerobes such as S. moorei, Fusobacterium nucleatum, Prevotella nanceiensis, and Prevotella buccae, suggesting a potential role in the microbial environment of HNSC.
Clostridium perfringens enterotoxin (CPE) exhibits contrasting effects in colorectal cancer and STAD, depending on cellular context, receptor expression, and dosage. In colorectal cancer, recent findings suggest that low-dose CPE promotes tumor progression, particularly in sessile serrated adenomas/polyps with dysplasia through its enterotoxin [76]. This toxin impairs tight junctions, leading to activation and nuclear translocation of the Yes-associated protein (YAP) protein, a driver of tumor progression especially in BRAFV600E-mutant cells. These findings suggest a tumor-promoting role for C. perfringens in colorectal cancer and underline the importance of microbiota regulation [76].
In contrast, a study by Liang et al. [77] demonstrated that CPE has strong cytotoxic effects on STAD cells that overexpress Claudin-4 (CL4). In SGC7901 cells and mouse xenograft models, CPE induced significant tumor cell death by binding to CL4 and forming pores in the cell membrane. Suppression of CL4 expression reduced this cytotoxicity, confirming the specificity of the interaction. These findings position CPE as a potential therapeutic agent in STAD with high CL4 expression [77]. This stark dualism—acting as a low-dose tumor promoter in the colorectal environment but a highly cytotoxic agent in the gastric environment—highlights why shared microbial signatures across different cancer types must be interpreted with extreme caution, as the local microenvironment completely dictates the bacteria–host interaction.
Streptococcus anginosus has been detected in both STAD and ESCA patients, suggesting its potential role in carcinogenesis [78]. Studies have shown that S. anginosus abundance increases with age, possibly due to a heightened risk of infections such as endocarditis and upper GI malignancies [79,80]. In STAD cases, S. anginosus has been isolated from gastric mucosa and shown to induce a spectrum of gastric tissue damage in mice including inflammation, atrophy of parietal cells, and early precancerous changes such as metaplasia and dysplasia [81]. Regarding ESCA, a recent case highlighted a pericardial-esophageal fistula as an early sign of advanced ESCA, with S. anginosus identified in the resulting abscess [82]. These findings suggest that this bacterium may promote esophageal carcinogenesis through inflammation-driven mechanisms, and that its removal could help reduce cancer risk [80].
Recent studies have highlighted distinct microbial shifts in the oral cavity of STAD patients compared to healthy individuals [52]. In particular, the genera Veillonella, Prevotella, and Aggregatibacter are found in elevated abundance in both saliva and dental plaque samples from GC patients, suggesting a potential role in gastric carcinogenesis through inflammatory or immune-mediated mechanisms [83,84].
Further research has underscored the significance of Fusobacterium nucleatum in GC development. According to literature review, this species exerts strong proinflammatory effects by releasing outer membrane vesicles that activate Toll-like receptors, especially TLR4, promoting the secretion of inflammatory cytokines like tumor necrosis factor (TNF) and IL-8 [52]. These responses contribute to the establishment of a proinflammatory microenvironment that evolves into a tumor-promoting niche [52]. Additionally, F. nucleatum’s FadA adhesin protein interacts with E-cadherin on host cells to activate the Wnt/β-catenin signaling pathway, further promoting epithelial inflammation and carcinogenesis [52]. Campylobacter species, often co-detected with F. nucleatum in tumors, also play a proinflammatory role. Their enrichment—particularly in patients with gastritis—triggers the production of various cytokines and chemokines (e.g., TNF, IL-1β, IL-10, C-X-C motif chemokine ligand 1/2/9/10), and activates key inflammatory pathways such as Nuclear Factor kappa-light-chain-enhancer of activated B cells, Signal Transducer and Activator of Transcription, Cyclic Adenosine Monophosphate response element-binding protein 1, and interferon regulatory factor (IRF) signaling. These responses further contribute to mucosal damage and tumorigenesis [52].

5. Conclusions

Over the last twenty years, technological advances have allowed researchers to study the human microbiome using samples like tissue, blood, and stool. Understanding how the microbiome relates to diseases is essential for better diagnosis and treatment. Machine learning helps us find specific microorganisms, known as biomarkers, within complex data. These biomarkers include species that emerge during illness as well as beneficial ones that disappear when the healthy state is disrupted. This study focuses on GI cancers to identify common and unique biomarker candidates using the MicrobiomeGSM model. We also compare our results with TFS methods. By grouping microorganisms into levels like family, order, and genus, our model uses biological structures to find these biomarkers. Finally, this research aims to guide future studies and emphasizes the need for more high-quality data to better understand the link between the human host and the microbiome.
Another important limitation of this study is the absence of an independent external validation cohort. Recent large-scale, multicohort microbiome studies have repeatedly highlighted that reproducibility and external validation remain significant challenges in cancer-associated microbial signatures due to geographic, technical, and lifestyle variations. To achieve high-resolution biological insights, our framework specifically required comprehensive species-level taxonomy across five distinct GI cancer types and multiple sample matrices (blood vs. tissue). At the time of this analysis, alternative datasets lacked this level of taxonomic depth or consistent resolution, severely limiting the availability of an eligible cohort for external benchmarking. While our framework utilizes strict feature selection and extensive Monte Carlo cross-validation to ensure model stability, the technical and geographic variability of microbiome data means that multi-center cohorts with species-level resolution will be essential in future studies to fully validate these findings.
While these literature findings support the biological role of the biomarkers we listed, our study focuses on their predictive performance, and further experimental studies are needed to confirm these causal mechanisms.

Author Contributions

Conceptualization, B.C., B.B.-G., N.S.E. and M.Y.; methodology, B.C., M.Y. and B.B.-G.; software, M.Y.; formal analysis, B.C., M.Y., N.S.E. and B.B.-G.; investigation, B.B.-G., B.C. and M.Y.; resources, B.C.; data curation, B.C.; data application B.C.; writing—original draft preparation, B.C.; writing—review and editing, B.C., B.B.-G., N.S.E. and M.Y.; visualization, B.C.; supervision, M.Y. and B.B.-G.; project administration, B.C. and M.Y. All authors have read and agreed to the published version of the manuscript.

Funding

B.C. was supported by TÜBİTAK Directorate of Science Fellowships and Grant Programme (BİDEB) 2211- National Graduate Scholarship Program TBTK-0083-4441. N.S.E. was supported by TÜBİTAK Directorate of Science Fellowships and Grant Programme (BİDEB) 2211-A National PhD. Scholarship Program, The work of M.Y. has been supported by the Kinneret Academic College. The work of B.B.-G. has been supported by the Abdullah Gul University Support Foundation (AGUV) and L’Oréal-UNESCO Young Women Scientist Program. The funders had no role in study design, data collection and analysis, decision to publish or preparation of the manuscript.

Institutional Review Board Statement

Not applicable.

Informed Consent Statement

Not applicable.

Data Availability Statement

The main raw data are obtained from The Cancer Microbiome Atlas (TCMA) database. MicrobiomeGSM which was implemented on KNIME platform was uploaded in Malik Yousef GitHub profile (https://github.com/malikyousef/microBiomeGSM) (Accessed on 20 September 2023). Other data supporting the results of this article will be made available by the authors on request.

Conflicts of Interest

The authors declare no conflicts of interest.

Abbreviations

The following abbreviations are used in this manuscript:
CMIMConditional Mutual Information Maximization
COADColon adenoma
CRCColorectal cancer
ESCAEsophageal Cancer
FCBFFast Correlation-Based Filter
GIGastrointestinal Cancers
IGInformation Gain
HNSCHead and Neck Cancer
MRMRMaximum Likelihood and Minimum Redundancy
READRectum Cancer
RFRandom Forest
SEN/SNSensitivity
SKBSelect K Best
SPE/SP Specificity
STAD/GCStomach Cancer
TCGAThe Cancer Genome Atlas
TCMAThe Cancer Microbiome Atlas
XGBExtreme Gradient Boosting

References

  1. Arnold, M.; Abnet, C.C.; Neale, R.E.; Vignat, J.; Giovannucci, E.L.; McGlynn, K.A.; Bray, F. Global Burden of 5 Major Types of Gastrointestinal Cancer. Gastroenterology 2020, 159, 335–349.E15. [Google Scholar] [CrossRef]
  2. Kayali, S.; Marabotto, E.; Giannini, E. Gastrointestinal Tract Cancers, an Increasing Burden of the Modern Era: Epidemiology and Prevention. Cancers 2023, 15, 4634. [Google Scholar] [CrossRef] [PubMed]
  3. Wu, N.; Yang, X.; Zhang, R.; Li, J.; Xiao, X.; Hu, Y.; Chen, Y.; Yang, F.; Lu, N.; Wang, Z.; et al. Dysbiosis Signature of Fecal Microbiota in Colorectal Cancer Patients. Microb. Ecol. 2013, 66, 462–470. [Google Scholar] [CrossRef] [PubMed]
  4. Zhang, J.; He, Y.; Xia, L.; Yi, J.; Wang, Z.; Zhao, Y.; Song, X.; Li, J.; Liu, H.; Liang, X.; et al. Expansion of Colorectal Cancer Biomarkers Based on Gut Bacteria and Viruses. Cancers 2022, 14, 4662. [Google Scholar] [CrossRef] [PubMed]
  5. Zhou, Z.; Ge, S.; Li, Y.; Ma, W.; Liu, Y.; Hu, S.; Zhang, R.; Ma, Y.; Du, K.; Syed, A.; et al. Human Gut Microbiome-Based Knowledgebase as a Biomarker Screening Tool to Improve the Predicted Probability for Colorectal Cancer. Front. Microbiol. 2020, 11, 596027. [Google Scholar] [CrossRef] [PubMed]
  6. Zhang, H.; Chang, Y.; Zheng, Q.; Zhang, R.; Hu, C.; Jia, W. Altered Intestinal Microbiota Associated with Colorectal Cancer. Front. Med. 2019, 13, 461–470. [Google Scholar] [CrossRef] [PubMed]
  7. Chen, F.; Dai, X.; Zhou, C.-C.; Li, K.; Zhang, Y.; Lou, X.-Y.; Zhu, Y.-M.; Sun, Y.-L.; Peng, B.-X.; Cui, W. Integrated Analysis of the Faecal Metagenome and Serum Metabolome Reveals the Role of Gut Microbiome-Associated Metabolites in the Detection of Colorectal Cancer and Adenoma. Gut 2022, 71, 1315–1325. [Google Scholar] [CrossRef] [PubMed]
  8. Zhu, W.; Wang, J.-Z.; Liu, Z.; Wei, J.-F. The Bacteria inside Human Cancer Cells: Mainly as Cancer Promoters. Front. Oncol. 2022, 12, 897330. [Google Scholar] [CrossRef] [PubMed]
  9. Bakir-Gungor, B.; Temiz, M.; Jabeer, A.; Wu, D.; Yousef, M. microBiomeGSM: The Identification of Taxonomic Biomarkers from Metagenomic Data Using Grouping, Scoring and Modeling (G-S-M) Approach. Front. Microbiol. 2023, 14, 1264941. [Google Scholar] [CrossRef] [PubMed]
  10. Jabeer, A.; KoÇak, A.; Akkaş, H.; Yenisert, F.; Nalbantoğlu, Ö.U.; Yousef, M.; Bakir GÜngÖr, B. Identifying Taxonomic Biomarkers of Colorectal Cancer in Human Intestinal Microbiota Using Multiple Feature Selection Methods. In Proceedings of the 2022 Innovations in Intelligent Systems and Applications Conference (ASYU), Antalya, Turkey, 7–9 September 2022; pp. 1–6. [Google Scholar]
  11. Zhang, C.; Hu, A.; Li, J.; Zhang, F.; Zhong, P.; Li, Y.; Li, Y. Combined Non-Invasive Prediction and New Biomarkers of Oral and Fecal Microbiota in Patients with Gastric and Colorectal Cancer. Front. Cell. Infect. Microbiol. 2022, 12, 830684. [Google Scholar] [CrossRef] [PubMed]
  12. Freitas, P.; Silva, F.; Sousa, J.V.; Ferreira, R.M.; Figueiredo, C.; Pereira, T.; Oliveira, H.P. Machine Learning-Based Approaches for Cancer Prediction Using Microbiome Data. Sci. Rep. 2023, 13, 11821. [Google Scholar] [CrossRef] [PubMed]
  13. Wu, Y.; Jiao, N.; Zhu, R.; Zhang, Y.; Wu, D.; Wang, A.-J.; Fang, S.; Tao, L.; Li, Y.; Cheng, S.; et al. Identification of Microbial Markers across Populations in Early Detection of Colorectal Cancer. Nat. Commun. 2021, 12, 3063. [Google Scholar] [CrossRef] [PubMed]
  14. Li, M.-X.; Sun, X.-M.; Cheng, W.-G.; Ruan, H.-J.; Liu, K.; Chen, P.; Xu, H.-J.; Gao, S.-G.; Feng, X.-S.; Qi, Y.-J. Using a Machine Learning Approach to Identify Key Prognostic Molecules for Esophageal Squamous Cell Carcinoma. BMC Cancer 2021, 21, 906. [Google Scholar] [CrossRef] [PubMed]
  15. Marcos-Zambrano, L.J.; Karaduzovic-Hadziabdic, K.; Turukalo, T.L.; Przymus, P.; Trajkovik, V.; Aasmets, O.; Berland, M.; Gruca, A.; Hasic, J.; Hron, K.; et al. Applications of Machine Learning in Human Microbiome Studies: A Review on Feature Selection, Biomarker Identification, Disease Prediction and Treatment. Front. Microbiol. 2021, 12, 634511. [Google Scholar] [CrossRef] [PubMed]
  16. Teixeira, M.; Silva, F.; Ferreira, R.M.; Pereira, T.; Figueiredo, C.; Oliveira, H.P. A Review of Machine Learning Methods for Cancer Characterization from Microbiome Data. npj Precis. Oncol. 2024, 8, 123. [Google Scholar] [CrossRef] [PubMed]
  17. The Cancer Genome Atlas Program (TCGA)—NCI. Available online: https://www.cancer.gov/ccg/research/genome-sequencing/tcga (accessed on 3 September 2024).
  18. Dohlman, A.B.; Mendoza, D.A.; Ding, S.; Gao, M.; Dressman, H.; Iliev, I.D.; Lipkin, S.M.; Shen, X. The Cancer Microbiome Atlas: A Pan-Cancer Comparative Analysis to Distinguish Tissue-Resident Microbiota from Contaminants. Cell Host Microbe 2021, 29, 281–298.E5. [Google Scholar] [CrossRef] [PubMed]
  19. Kolde, R.; Laur, S.; Adler, P.; Vilo, J. Robust Rank Aggregation for Gene List Integration and Meta-Analysis. Bioinformatics 2012, 28, 573–580. [Google Scholar] [CrossRef] [PubMed]
  20. Yousef, M.; Allmer, J.; İnal, Y.; Gungor, B.B. G-S-M: A Comprehensive Framework for Integrative Feature Selection in Omics Data Analysis and Beyond. BioRxiv 2024. BioRxiv:2024.03.30.585514. [Google Scholar] [CrossRef]
  21. Yousef, M.; Abdallah, L.; Allmer, J. maTE: Discovering Expressed Interactions between microRNAs and Their Targets. Bioinformatics 2019, 35, 4020–4028. [Google Scholar] [CrossRef] [PubMed]
  22. Yousef, M.; Ozdemir, F.; Jaber, A.; Allmer, J.; Bakir-Gungor, B. PriPath: Identifying Dysregulated Pathways from Differential Gene Expression via Grouping, Scoring, and Modeling with an Embedded Feature Selection Approach. BMC Bioinform. 2023, 24, 60. [Google Scholar] [CrossRef] [PubMed]
  23. Qumsiyeh, E.; Showe, L.; Yousef, M. GediNET for Discovering Gene Associations across Diseases Using Knowledge Based Machine Learning Approach. Sci. Rep. 2022, 12, 19955. [Google Scholar] [CrossRef] [PubMed]
  24. Yousef, M.; Goy, G.; Mitra, R.; Eischen, C.M.; Jabeer, A.; Bakir-Gungor, B. miRcorrNet: Machine Learning-Based Integration of miRNA and mRNA Expression Profiles, Combined with Feature Grouping and Ranking. PeerJ 2021, 9, e11458. [Google Scholar] [CrossRef] [PubMed]
  25. Unlu Yazici, M.; Marron, J.S.; Bakir-Gungor, B.; Zou, F.; Yousef, M. Invention of 3Mint for Feature Grouping and Scoring in Multi-Omics. Front. Genet. 2023, 14, 1093326. [Google Scholar] [CrossRef] [PubMed]
  26. Ersoz, N.S.; Bakir-Gungor, B.; Yousef, M. GeNetOntology: Identifying Affected Gene Ontology Terms via Grouping, Scoring, and Modeling of Gene Expression Data Utilizing Biological Knowledge-Based Machine Learning. Front. Genet. 2023, 14. [Google Scholar] [CrossRef] [PubMed]
  27. Voskergian, D.; Bakir-Gungor, B.; Yousef, M. TextNetTopics Pro, a Topic Model-Based Text Classification for Short Text by Integration of Semantic and Document-Topic Distribution Information. Front. Genet. 2023, 14. [Google Scholar] [CrossRef] [PubMed]
  28. Qumsiyeh, E.; Salah, Z.; Yousef, M. miRGediNET: A Comprehensive Examination of Common Genes in miRNA-Target Interactions and Disease Associations: Insights from a Grouping-Scoring-Modeling Approach. Heliyon 2023, 9, e22666. [Google Scholar] [CrossRef] [PubMed]
  29. Jabeer, A.; Temiz, M.; Bakir-Gungor, B.; Yousef, M. miRdisNET: Discovering microRNA Biomarkers That Are Associated with Diseases Utilizing Biological Knowledge-Based Machine Learning. Front. Genet. 2023, 13, 1076554. [Google Scholar] [CrossRef] [PubMed]
  30. Yousef, M.; Goy, G.; Bakir-Gungor, B. miRModuleNet: Detecting miRNA-mRNA Regulatory Modules. Front. Genet. 2022, 13, 767455. [Google Scholar] [CrossRef] [PubMed]
  31. Yousef, M.; Ülgen, E.; Sezerman, O.U. CogNet: Classification of Gene Expression Data Based on Ranked Active-Subnetwork-Oriented KEGG Pathway Enrichment Analysis. PeerJ Comput. Sci. 2021, 7, e336. [Google Scholar] [CrossRef] [PubMed]
  32. Söylemez, Ü.G.; Yousef, M.; Bakir-Gungor, B. AMP-GSM: Prediction of Antimicrobial Peptides via a Grouping–Scoring–Modeling Approach. Appl. Sci. 2023, 13, 5106. [Google Scholar] [CrossRef]
  33. Ding, C.; Peng, H. Minimum Redundancy Feature Selection from Microarray Gene Expression Data. J. Bioinform. Comput. Biol. 2005, 03, 185–205. [Google Scholar] [CrossRef] [PubMed]
  34. Brown, G.; Pocock, A.; Zhao, M.-J.; Luján, M. Conditional Likelihood Maximisation: A Unifying Framework for Information Theoretic Feature Selection. J. Mach. Learn. Res. 2012, 13, 27–66. [Google Scholar]
  35. Fleuret, F. François Fleuret Fast Binary Feature Selection with Conditional Mutu-al Information. J. Mach. Learn. Res. 2004, 5, 1531–1555. [Google Scholar]
  36. Senliol, B.; Gulgezen, G.; Yu, L.; Cataltepe, Z. Fast Correlation Based Filter (FCBF) with a Different Search Strategy. In Proceedings of the 2008 23rd International Symposium on Computer and Information Sciences, Istanbul, Turkey, 27–29 October 2008; pp. 1–4. [Google Scholar]
  37. Pedregosa, F.; Varoquaux, G.; Gramfort, A.; Michel, V.; Thirion, B.; Grisel, O.; Blondel, M.; Prettenhofer, P.; Weiss, R.; Dubourg, V.; et al. Scikit-Learn: Machine Learning in Python. J. Mach. Learn. Res. 2011, 12, 2825–2830. [Google Scholar]
  38. Bakir-Gungor, B.; Hacılar, H.; Jabeer, A.; Nalbantoglu, O.U.; Aran, O.; Yousef, M. Inflammatory Bowel Disease Biomarkers of Human Gut Microbiota Selected via Different Feature Selection Methods. PeerJ 2022, 10, e13205. [Google Scholar] [CrossRef] [PubMed]
  39. D’Elia, D.; Truu, J.; Lahti, L.; Berland, M.; Papoutsoglou, G.; Ceci, M.; Zomer, A.; Lopes, M.B.; Ibrahimi, E.; Gruca, A.; et al. Advancing Microbiome Research with Machine Learning: Key Findings from the ML4Microbiome COST Action. Front. Microbiol. 2023, 14, 1257002. [Google Scholar] [CrossRef] [PubMed]
  40. Xu, Q.-S.; Liang, Y.-Z. Monte Carlo Cross Validation. Chemom. Intell. Lab. Syst. 2001, 56, 1–11. [Google Scholar] [CrossRef]
  41. Berthold, M.R.; Cebron, N.; Dill, F.; Gabriel, T.R.; Kötter, T.; Meinl, T.; Ohl, P.; Sieb, C.; Thiel, K.; Wiswedel, B. KNIME: The Konstanz Information Miner. In Proceedings of the Data Analysis, Machine Learning and Applications; Preisach, C., Burkhardt, H., Schmidt-Thieme, L., Decker, R., Eds.; Springer: Berlin/Heidelberg, Germany, 2008; pp. 319–326. [Google Scholar]
  42. Madhikermi, M.; Kubler, S.; Robert, J.; Buda, A.; Främling, K. Data Quality Assessment of Maintenance Reporting Procedures. Expert Syst. Appl. 2016, 63, 145–164. [Google Scholar] [CrossRef]
  43. Rizwan, I.; Haque, I.; Neubert, J. Deep Learning Approaches to Biomedical Image Segmentation. Inform. Med. Unlocked 2020, 18, 100297. [Google Scholar] [CrossRef]
  44. Yang, F.; Sun, S.; Yang, F. Prognostic and Predicted Significance of FENDRR in Colon and Rectum Adenocarcinoma. Front. Oncol. 2021, 11, 668595. [Google Scholar] [CrossRef] [PubMed]
  45. Ivleva, E.A.; Grivennikov, S.I. Microbiota-Driven Mechanisms at Different Stages of Cancer Development. Neoplasia 2022, 32, 100829. [Google Scholar] [CrossRef] [PubMed]
  46. Bang, S.; Yoo, D.; Kim, S.-J.; Jhang, S.; Cho, S.; Kim, H. Establishment and Evaluation of Prediction Model for Multiple Disease Classification Based on Gut Microbial Data. Sci. Rep. 2019, 9, 10189. [Google Scholar] [CrossRef] [PubMed]
  47. Bahrambanan, F.; Alizamir, M.; Moradveisi, K.; Heddam, S.; Kim, S.; Kim, S.; Soleimani, M.; Afshar, S.; Taherkhani, A. The Development of an Efficient Artificial Intelligence-Based Classification Approach for Colorectal Cancer Response to Radiochemotherapy: Deep Learning vs. Machine Learning. Sci. Rep. 2025, 15, 62. [Google Scholar] [CrossRef] [PubMed]
  48. Karwowska, Z.; Aasmets, O.; Metspalu, M.; Metspalu, A.; Milani, L.; Esko, T.; Kosciolek, T.; Org, E.; Estonian Biobank Research Team. Effects of Data Transformation and Model Selection on Feature Importance in Microbiome Classification Data. Microbiome 2025, 13, 2. [Google Scholar] [CrossRef] [PubMed]
  49. Park, G.; Oh, S.; Kim, M.; Jeong, Y.; Kim, G. Common Microbial Signatures in Blood and Their Amplification in Clinical Disorders. Gut Microbes Rep. 2025, 2, 2473450. [Google Scholar] [CrossRef] [PubMed]
  50. Wu, Y.; Xu, J.; Rong, X.; Wang, F.; Wang, H.; Zhao, C. Gut Microbiota Alterations and Health Status in Aging Adults: From Correlation to Causation. Aging Med. 2021, 4, 206–213. [Google Scholar] [CrossRef] [PubMed]
  51. Liang, W.; Zhou, Z.; Gao, Q.; Zhu, Z.; Zhu, J.; Lin, J.; Wen, Y.; Qian, F.; Wang, L.; Zhai, Y.; et al. Tumor-derived Prevotella Intermedia Aggravates Gastric Cancer by Enhancing Perilipin 3 Expression. Cancer Sci. 2024, 115, 1141. [Google Scholar] [CrossRef] [PubMed]
  52. Xia, R.; Jiang, Z.; Zhou, Y.; Pan, L.; Wang, Y.; Ma, Y.; Fan, L.; Yuan, L.; Cheng, X. Oral Microbiota and Gastric Cancer: Recent Highlights and Knowledge Gaps. J. Oral Microbiol. 2024, 16, 2391640. [Google Scholar] [CrossRef] [PubMed]
  53. Castañeda-Corzo, G.-J.; Infante-Rodríguez, L.-F.; Villamil-Poveda, J.-C.; Bustillo, J.; Cid-Arregui, A.; García-Robayo, D.-A. Association of Prevotella Intermedia with Oropharyngeal Cancer: A Patient-Control Study. Heliyon 2023, 9, e14293. [Google Scholar] [CrossRef] [PubMed]
  54. Moreira, C.; Figueiredo, C.; Ferreira, R.M. The Role of the Microbiota in Esophageal Cancer. Cancers 2023, 15, 2576. [Google Scholar] [CrossRef] [PubMed]
  55. Könönen, E.; Fteita, D.; Gursoy, U.K.; Gursoy, M. Prevotella Species as Oral Residents and Infectious Agents with Potential Impact on Systemic Conditions. J. Oral Microbiol. 2022, 14, 2079814. [Google Scholar] [CrossRef] [PubMed]
  56. Qin, Y.; Tong, X.; Mei, W.-J.; Cheng, Y.; Zou, Y.; Han, K.; Yu, J.; Jie, Z.; Zhang, T.; Zhu, S.; et al. Consistent Signatures in the Human Gut Microbiome of Old- and Young-Onset Colorectal Cancer. Nat. Commun. 2024, 15, 3396. [Google Scholar] [CrossRef] [PubMed]
  57. Yu, J.; Feng, L.; Luo, Z.; Yang, J.; Zhang, Q.; Liu, C.; Liang, D.; Xie, Y.; Li, H.; Gong, J.; et al. Interleukin-10 Deficiency Suppresses Colorectal Cancer Metastasis by Enriching Gut Parabacteroides Distasonis. J. Adv. Res. 2024. [Google Scholar] [CrossRef] [PubMed]
  58. Liu, J.; Huang, X.; Chen, C.; Wang, Z.; Huang, Z.; Qin, M.; He, F.; Tang, B.; Long, C.; Hu, H.; et al. Identification of Colorectal Cancer Progression-Associated Intestinal Microbiome and Predictive Signature Construction. J. Transl. Med. 2023, 21, 373. [Google Scholar] [CrossRef] [PubMed]
  59. Hsieh, Y.-Y.; Tung, S.-Y.; Pan, H.-Y.; Yen, C.-W.; Xu, H.-W.; Lin, Y.-J.; Deng, Y.-F.; Hsu, W.-T.; Wu, C.-S.; Li, C. Increased Abundance of Clostridium and Fusobacterium in Gastric Microbiota of Patients with Gastric Cancer in Taiwan. Sci. Rep. 2018, 8, 158. [Google Scholar] [CrossRef] [PubMed]
  60. Bronzato, J.D.; Bomfim, R.A.; Edwards, D.H.; Crouch, D.; Hector, M.P.; Gomes, B.P.F.A. Detection of Fusobacterium in Oral and Head and Neck Cancer Samples: A Systematic Review and Meta-Analysis. Arch. Oral Biol. 2020, 112, 104669. [Google Scholar] [CrossRef] [PubMed]
  61. Cao, Y.; Shang, F.; Jin, M.; Deng, S.; Gu, J.; Mao, F.; Qin, L.; Wang, J.; Xue, Y.; Jiang, Z.; et al. Changes in Bacteroides and the Microbiota in Patients with Obstructed Colorectal Cancer: Retrospective Cohort Study. BJS Open 2023, 7, zrad105. [Google Scholar] [CrossRef] [PubMed]
  62. Cheng, W.T.; Kantilal, H.K.; Davamani, F. The Mechanism of Bacteroides Fragilis Toxin Contributes to Colon Cancer Formation. Malays. J. Med. Sci. MJMS 2020, 27, 9–21. [Google Scholar] [CrossRef] [PubMed]
  63. Matsumiya, Y.; Suenaga, M.; Ishikawa, T.; Kudo, T.; Nakagawa, T.; Okamoto, K.; Tokunaga, M.; Hurtado, C.; Yamada, Y.; Oka, K.; et al. Clinical Significance of Bacteroides Fragilis as a Potential Prognostic Factor in Colorectal Cancer. Anaerobe 2023, 84, 102784. [Google Scholar] [CrossRef] [PubMed]
  64. Chen, X.; Winckler, B.; Lu, M.; Cheng, H.; Yuan, Z.; Yang, Y.; Jin, L.; Ye, W. Oral Microbiota and Risk for Esophageal Squamous Cell Carcinoma in a High-Risk Area of China. PLoS ONE 2015, 10, e0143603. [Google Scholar] [CrossRef] [PubMed]
  65. Elliott, D.R.F.; Walker, A.W.; O’Donovan, M.; Parkhill, J.; Fitzgerald, R.C. A Non-Endoscopic Device to Sample the Oesophageal Microbiota: A Case-Control Study. Lancet Gastroenterol. Hepatol. 2017, 2, 32–42. [Google Scholar] [CrossRef] [PubMed]
  66. Liang, W.; Yang, Y.; Wang, H.; Wang, H.; Yu, X.; Lu, Y.; Shen, S.; Teng, L. Gut Microbiota Shifts in Patients with Gastric Cancer in Perioperative Period. Medicine 2019, 98, e16626. [Google Scholar] [CrossRef] [PubMed]
  67. Yang, C.-Y.; Yeh, Y.-M.; Yu, H.-Y.; Chin, C.-Y.; Hsu, C.-W.; Liu, H.; Huang, P.-J.; Hu, S.-N.; Liao, C.-T.; Chang, K.-P.; et al. Oral Microbiota Community Dynamics Associated with Oral Squamous Cell Carcinoma Staging. Front. Microbiol. 2018, 9, 862. [Google Scholar] [CrossRef] [PubMed]
  68. Yost, S.; Stashenko, P.; Choi, Y.; Kukuruzinska, M.; Genco, C.A.; Salama, A.; Weinberg, E.O.; Kramer, C.D.; Frias-Lopez, J. Increased Virulence of the Oral Microbiome in Oral Squamous Cell Carcinoma Revealed by Metatranscriptome Analyses. Int. J. Oral Sci. 2018, 10, 32. [Google Scholar] [CrossRef] [PubMed]
  69. Yu, S.; Wang, X.; Li, Z.; Jin, D.; Yu, M.; Li, J.; Li, Y.; Liu, X.; Zhang, Q.; Liu, Y.; et al. Solobacterium moorei Promotes the Progression of Adenomatous Polyps by Causing Inflammation and Disrupting the Intestinal Barrier. J. Transl. Med. 2024, 22, 169. [Google Scholar] [CrossRef] [PubMed]
  70. Chen, Y.; Qin, Y.; Fan, T.; Qiu, C.; Zhang, Y.; Dai, M.; Zhou, Y.; Sun, Q.; Guo, Y.; Hao, Y.; et al. Solobacterium moorei Promotes Tumor Progression via the Integrin A2/Β1-PI3K-AKT-mTOR-C-Myc Signaling Pathway in Colorectal Cancer. Int. J. Biol. Sci. 2025, 21, 1497–1512. [Google Scholar] [CrossRef] [PubMed]
  71. Barrak, I.; Stájer, A.; Gajdács, M.; Urbán, E. Small, but Smelly: The Importance of Solobacterium moorei in Halitosis and Other Human Infections. Heliyon 2020, 6, e05371. [Google Scholar] [CrossRef] [PubMed]
  72. Ferreira, R.M.; Pereira-Marques, J.; Pinto-Ribeiro, I.; Costa, J.L.; Carneiro, F.; Machado, J.C.; Figueiredo, C. Gastric Microbial Community Profiling Reveals a Dysbiotic Cancer-Associated Microbiota. Gut 2018, 67, 226–236. [Google Scholar] [CrossRef] [PubMed]
  73. Alauzet, C.; Aujoulat, F.; Lozniewski, A.; Ben Brahim, S.; Domenjod, C.; Enault, C.; Lavigne, J.-P.; Marchandin, H. A New Look at the Genus Solobacterium: A Retrospective Analysis of Twenty-Seven Cases of Infection Involving S. moorei and a Review of Sequence Databases and the Literature. Microorganisms 2021, 9, 1229. [Google Scholar] [CrossRef] [PubMed]
  74. Peters, B.A.; Wu, J.; Pei, Z.; Yang, L.; Purdue, M.P.; Freedman, N.D.; Jacobs, E.J.; Gapstur, S.M.; Hayes, R.B.; Ahn, J. Oral Microbiome Composition Reflects Prospective Risk for Esophageal Cancers. Cancer Res. 2017, 77, 6777–6787. [Google Scholar] [CrossRef] [PubMed]
  75. Sárvári, K.P.; Sántha, D.; Kovács, R.; Körmöndi, S.; Pető, Z.; Vereb, T.; Sztanó, B. Six Cases of Solobacterium moorei Isolated Alone or in Mixed Culture in Hungary and Comparison with Previously Published Cases. Anaerobe 2020, 65, 102241. [Google Scholar] [CrossRef] [PubMed]
  76. Fujiwara-Tani, R.; Fujii, K.; Mori, S.; Kishi, S.; Sasaki, T.; Ohmori, H.; Nakashima, C.; Kawahara, I.; Nishiguchi, Y.; Mori, T.; et al. Role of Clostridium Perfringens Enterotoxin on YAP Activation in Colonic Sessile Serrated Adenoma/Polyps with Dysplasia. Int. J. Mol. Sci. 2020, 21, 3840. [Google Scholar] [CrossRef] [PubMed]
  77. Liang, Z.-Y.; Kang, X.; Chen, H.; Wang, M.; Guan, W.-X. Effect of Clostridium Perfringens Enterotoxin on Gastric Cancer Cells SGC7901 Which Highly Expressed Claudin-4 Protein. World J. Gastrointest. Oncol. 2017, 9, 153–159. [Google Scholar] [CrossRef] [PubMed]
  78. Xia, K.; Zhou, Y.; Wang, W.; Cai, Y. Streptococcus anginosus: The Potential Role in the Progression of Gastric Cancer. J. Cancer Res. Clin. Oncol. 2025, 151, 143. [Google Scholar] [CrossRef] [PubMed]
  79. Morita, E.; Narikiyo, M.; Yokoyama, A.; Yano, A.; Kamoi, K.; Yoshikawa, E.; Yamaguchi, T.; Igaki, H.; Tachimori, Y.; Kato, H.; et al. Predominant Presence of Streptococcus anginosus in the Saliva of Alcoholics. Oral Microbiol. Immunol. 2005, 20, 362–365. [Google Scholar] [CrossRef] [PubMed]
  80. Narikiyo, M.; Tanabe, C.; Yamada, Y.; Igaki, H.; Tachimori, Y.; Kato, H.; Muto, M.; Montesano, R.; Sakamoto, H.; Nakajima, Y.; et al. Frequent and Preferential Infection of Treponema denticola, Streptococcus mitis, and Streptococcus anginosus in Esophageal Cancers. Cancer Sci. 2004, 95, 569–574. [Google Scholar] [CrossRef] [PubMed]
  81. Isakov, V. Autoimmune Gastritis Studies and Gastric Cancer: True Renaissance or Bibliometric Illusion. World J. Gastroenterol. 2024, 30, 3783–3790. [Google Scholar] [CrossRef] [PubMed]
  82. Peixoto Vieira Viseu Ferreira, C.M.; Souaf, S.; Martínez Monzonís, A.; El-Diasty, M.M.; Fernandez, A.L. Purulent Pericarditis as the First Manifestation of Esophageal Carcinoma. Port. J. Card. Thorac. Vasc. Surg. 2024, 31, 59–62. [Google Scholar] [CrossRef] [PubMed]
  83. Shu, J.; Yu, H.; Ren, X.; Wang, Y.; Zhang, K.; Tang, Z.; Dang, L.; Chen, W.; Li, B.; Xie, H.; et al. Role of Salivary Glycopatterns for Oral Microbiota Associated with Gastric Cancer. Int. J. Biol. Macromol. 2022, 209, 1368–1378. [Google Scholar] [CrossRef] [PubMed]
  84. Kageyama, S.; Takeshita, T.; Takeuchi, K.; Asakawa, M.; Matsumi, R.; Furuta, M.; Shibata, Y.; Nagai, K.; Ikebe, M.; Morita, M.; et al. Characteristics of the Salivary Microbiota in Patients with Various Digestive Tract Cancers. Front. Microbiol. 2019, 10, 1780. [Google Scholar] [CrossRef] [PubMed]
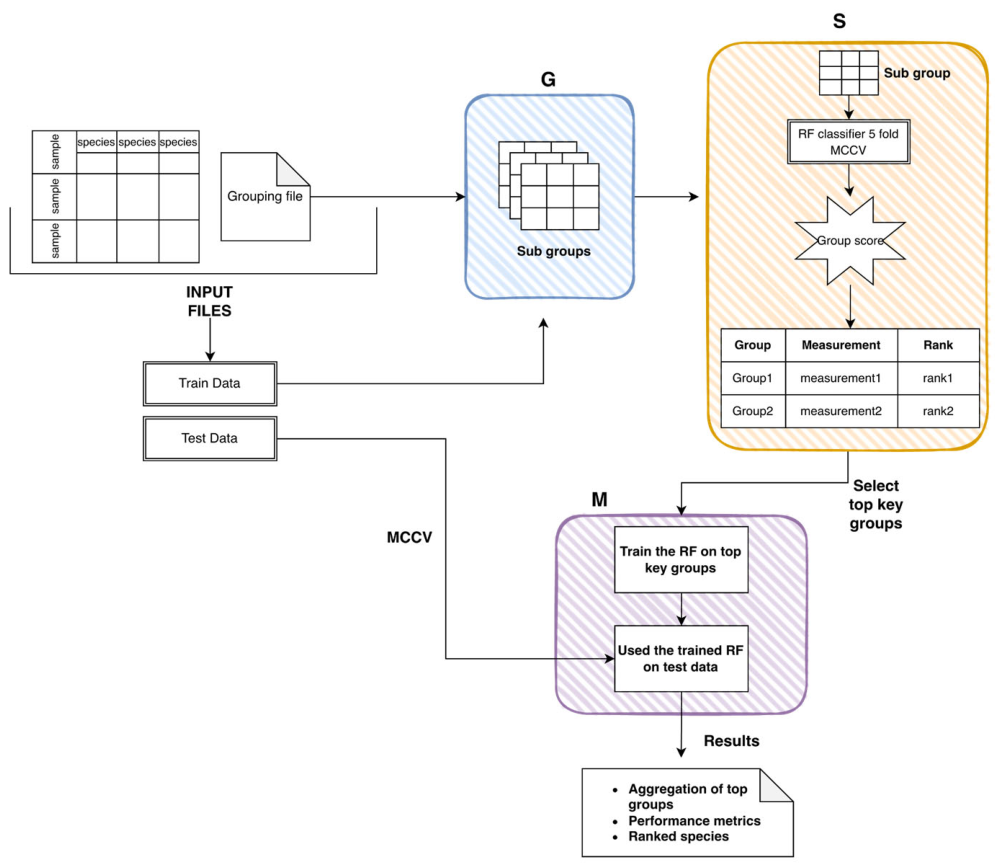
Figure 1. MicrobiomeGSM workflow.
Applsci 16 06879 g001
Figure 2. The process of the TFS approach. In all steps, Decision Tree, RF, LogitBoost, AdaBoost, an ensemble SVM with kNN (k nearest neighbors), and an ensemble Logitboost with kNN were used.
Applsci 16 06879 g002
Figure 3. Jaccard similarity indices of GI cancer types using the microbiomeGSM approach. (A) Similarity between solid normal tissue and primary tumor samples. (B) Similarity between blood normal tissue and primary tumor samples.
Applsci 16 06879 g003
Figure 4. Heatmap of biomarker candidacy rankings for microbial species identified in blood samples across five GI cancer types. “This figure illustrates the candidacy order of potential biomarkers, specifically selecting species from the top 35 genera that are common to at least two cancer types. The lowest numerical values (deep pink) represent the primary biomarker candidates, while the transition to lighter colors and higher values (up to rank 91) indicates a lower priority for that specific malignancy. The distribution highlights that while certain species hold top-tier candidacy rankings across multiple cancers, their relative importance varies between the ESCA, HNSC, COAD, CRC, and STAD profiles.”.
Applsci 16 06879 g004
Figure 5. Heatmap of biomarker candidacy rankings for microbial species identified in solid tissue samples across five GI cancer types. “This figure illustrates the candidacy order of potential biomarkers, specifically selecting species from the top 40 genera that are common to at least two cancer types. The lowest numerical values (deep pink) represent the primary biomarker candidates, while the transition to lighter colors and higher values (up to rank 117) indicates a lower priority for that specific malignancy. The distribution highlights that while certain species hold top-tier candidacy rankings across multiple cancers, their relative importance varies between the ESCA, HNSC, COAD, CRC, and STAD profiles.”.
Applsci 16 06879 g005
Figure 6. Heatmap of TFS approach performances for CRC solid tissue and primary tumor samples, comparing (A) the original 685 features and (B) the top-ranked 17 features.
Applsci 16 06879 g006
Figure 7. Heatmaps showing the performance of the TFS approach on the CRC dataset: (A) results using all 683 features across blood tissue and primary tumor samples, and (B) results using the top 31 selected features for the same samples.
Applsci 16 06879 g007
Figure 8. Jaccard Similarity Index of the top-ranked species across GI cancer datasets. (A) Similarity results between solid tissue normal and primary tumor samples after the TFS approach. (B) Similarity results between blood tissue normal and primary tumor samples after the TFS approach.
Applsci 16 06879 g008
Figure 9. The prediction results of the Random Forest model from COAD with blood-derived normal tissue as a negative control.
Applsci 16 06879 g009
Table 1. Overview of 5 datasets used in this study.
Cancer TypesNumber of Samples of Blood (Negative)Number of Samples of Solid (Negatives)Number of Positives
Colon adenoma cancer9921125
Colon cancer-rectum cancer (CRC)
colorectal cancer
14025170
Esophageal cancer422262
Head and neck cancer13021157
Stomach cancer8939128
Table 2. MicrobiomeGSM performance of blood-derived normal + primary tumor sample of COAD at the family level at 10 iterations.
ClustersSpeciesAccuracySensitivitySpecificityF1AUCPrecision
10191.70.95 + −0.030.94 + −0.080.96 + −0.050.95 + −0.040.99 + −0.010.96 + −0.05
9185.10.95 + −0.030.94 + −0.080.96 + −0.050.95 + −0.040.99 +−0.010.96 + −0.05
8177.40.95 + −0.040.93 + −0.080.96 + −0.050.94 + −0.040.98 + −0.02 0.96 + −0.05
7165.80.95 + −0.030.93 + −0.080.96 + −0.050.95 + −0.030.99 + −0.020.96 +−0.05
6157.80.96 + −0.030.95 + −0.070.96 + −0.050.95 + −0.030.99 + −0.020.96 + −0.05
51440.95 + −0.020.94 + −0.070.96 + −0.050.95 + −0.030.98 + −0.020.96 + −0.05
4127.20.95 + −0.030.93 + −0.080.96 + −0.040.94 + −0.030.98 + −0.010.96 + −0.05
3109.70.95 + −0.030.93 + −0.060.96 + −0.050.94 + −0.030.98 + −0.030.96 +−0.05
281.40.94 + −0.040.91 + −0.070.96 + −0.050.93 + −0.040.98 + −0.040.96 + −0.05
143.20.92 + −0.050.87 + −0.10.97 + −0.050.91 + −0.060.95 + −0.040.97 + −0.05
Table 3. MicrobiomeGSM performance of blood-derived normal + primary tumor sample of COAD at order level at 10 iterations.
ClustersSpeciesAccuracySensitivitySpecificityF1AUCPrecision
102600.94 + −0.030.92 + −0.060.95 + −0.070.93 + −0.070.9 +−0.040.95 + −0.06
9257.10.94 + −0.030.92 + −0.060.95 + −0.070.93 + −0.030.95 + −0.040.95 + −0.06
8254.20.93 + −0.040.91 + −0.040.94 + −0.100.92 + −0.040.94 + −0.040.95 + −0.08
7248.60.94 + −0.030.92 + −0.060.95 + −0.070.93 + −0.030.94 + −0.050.95 + −0.06
6242.10.93 + −0.040.92 + −0.060.93 + −0.090.93 + −0.040.95 + −0.040.94 + −0.08
5235.60.92 + −0.050.90 + −0.080.93 + −0.090.91 + −0.050.95 + −0.040.94 + −0.08
4230.50.92 + −0.040.91 + −0.070.93 + −0.040.92 + −0.050.95 + −0.040.94 + −0.08
3216.20.92 + −0.040.90 + −0.070.94 + −0.100.92 + −0.040.95 + −0.040.95 + −0.08
21980.91 + −0.050.89 + −0.070.93 + −0.090.91 + −0.050.95 + −0.040.94 + −0.08
1112.80.90 + −0.050.88 + −0.080.92 + −0.080.90 + −0.050.94 + −0.040.92 + −0.07
Table 4. MicrobiomeGSM performance of blood-derived normal + primary tumor sample of COAD at the genus level at 10 iterations.
ClustersSpeciesAccuracySensitivitySpecificityF1AUCPrecision
1088.90.92 + −0.050.86 + −0.100.98 + −0.040.91 + −0.050.97 + −0.040.98 + −0.04
977.30.94 + −0.050.88 + −0.100.99 + −0.030.93 + −0.050.97 + −0.040.99 + −0.03
873.40.94 + −0.050.88 + −0.100.99 + −0.030.93 + −0.050.97 + −0.040.99 + −0.03
769.60.93 + −0.050.88 + −0.100.98 + −0.040.92 + −0.060.97 + −0.040.98 + −0.04
662.40.93 + −0.050.88 + −0.100.98 + −0.040.92 + −0.060.97 + −0.040.98 + −0.04
557.10.91 + −0.060.85 + −0.110.97 + −0.050.90 + −0.070.97 + −0.040.97 + −0.05
4540.93 + −0.050.87 + −0.100.98 + −0.040.92 + −0.060.97 + −0.040.98 + −0.04
347.10.93 + −0.050.80 + −0.100.99 + −0.030.92 + −0.060.97 + −0.040.99 + −0.03
241.30.92 +−0.060.87 + −0.110.97 + −0.050.91 + −0.060.97 + −0.040.97 + −0.05
1300.92 +−0.070.87 +−0.130.97 + −0.050.91 + −0.080.97 + −0.060.97 + −0.05
Table 5. Model comparison for COAD dataset with normal blood tissue and primary tumor.
ApproachesSpeciesAccuracySNSPF1AUCPrecision
MicrobiomeGSM-genus300.920.870.970.910.970.97
TFSA-IG-XGB-
(2. Run)
230.960.970.940.960.980.95
RF6820.950.940.970.950.970.97
Disclaimer/Publisher’s Note: The statements, opinions and data contained in all publications are solely those of the individual author(s) and contributor(s) and not of MDPI and/or the editor(s). MDPI and/or the editor(s) disclaim responsibility for any injury to people or property resulting from any ideas, methods, instructions or products referred to in the content.