Author Contributions
Conceptualization, S.I. and R.E.; Methodology, S.I.; Software, S.I. and I.S.; Validation, S.I., S.A.A. and A.S.; Formal Analysis, S.I.; Investigation, S.I.; Resources, S.A.A.; Data Curation, S.I. and I.S.; Writing—Original Draft Preparation, S.I.; Writing—Review and Editing, R.E., S.A.A. and A.S.; Visualization, S.I.; Supervision, R.E. and A.S.; Project Administration, R.E.; Funding Acquisition, S.A.A. All authors have read and agreed to the published version of the manuscript.
Figure 1.
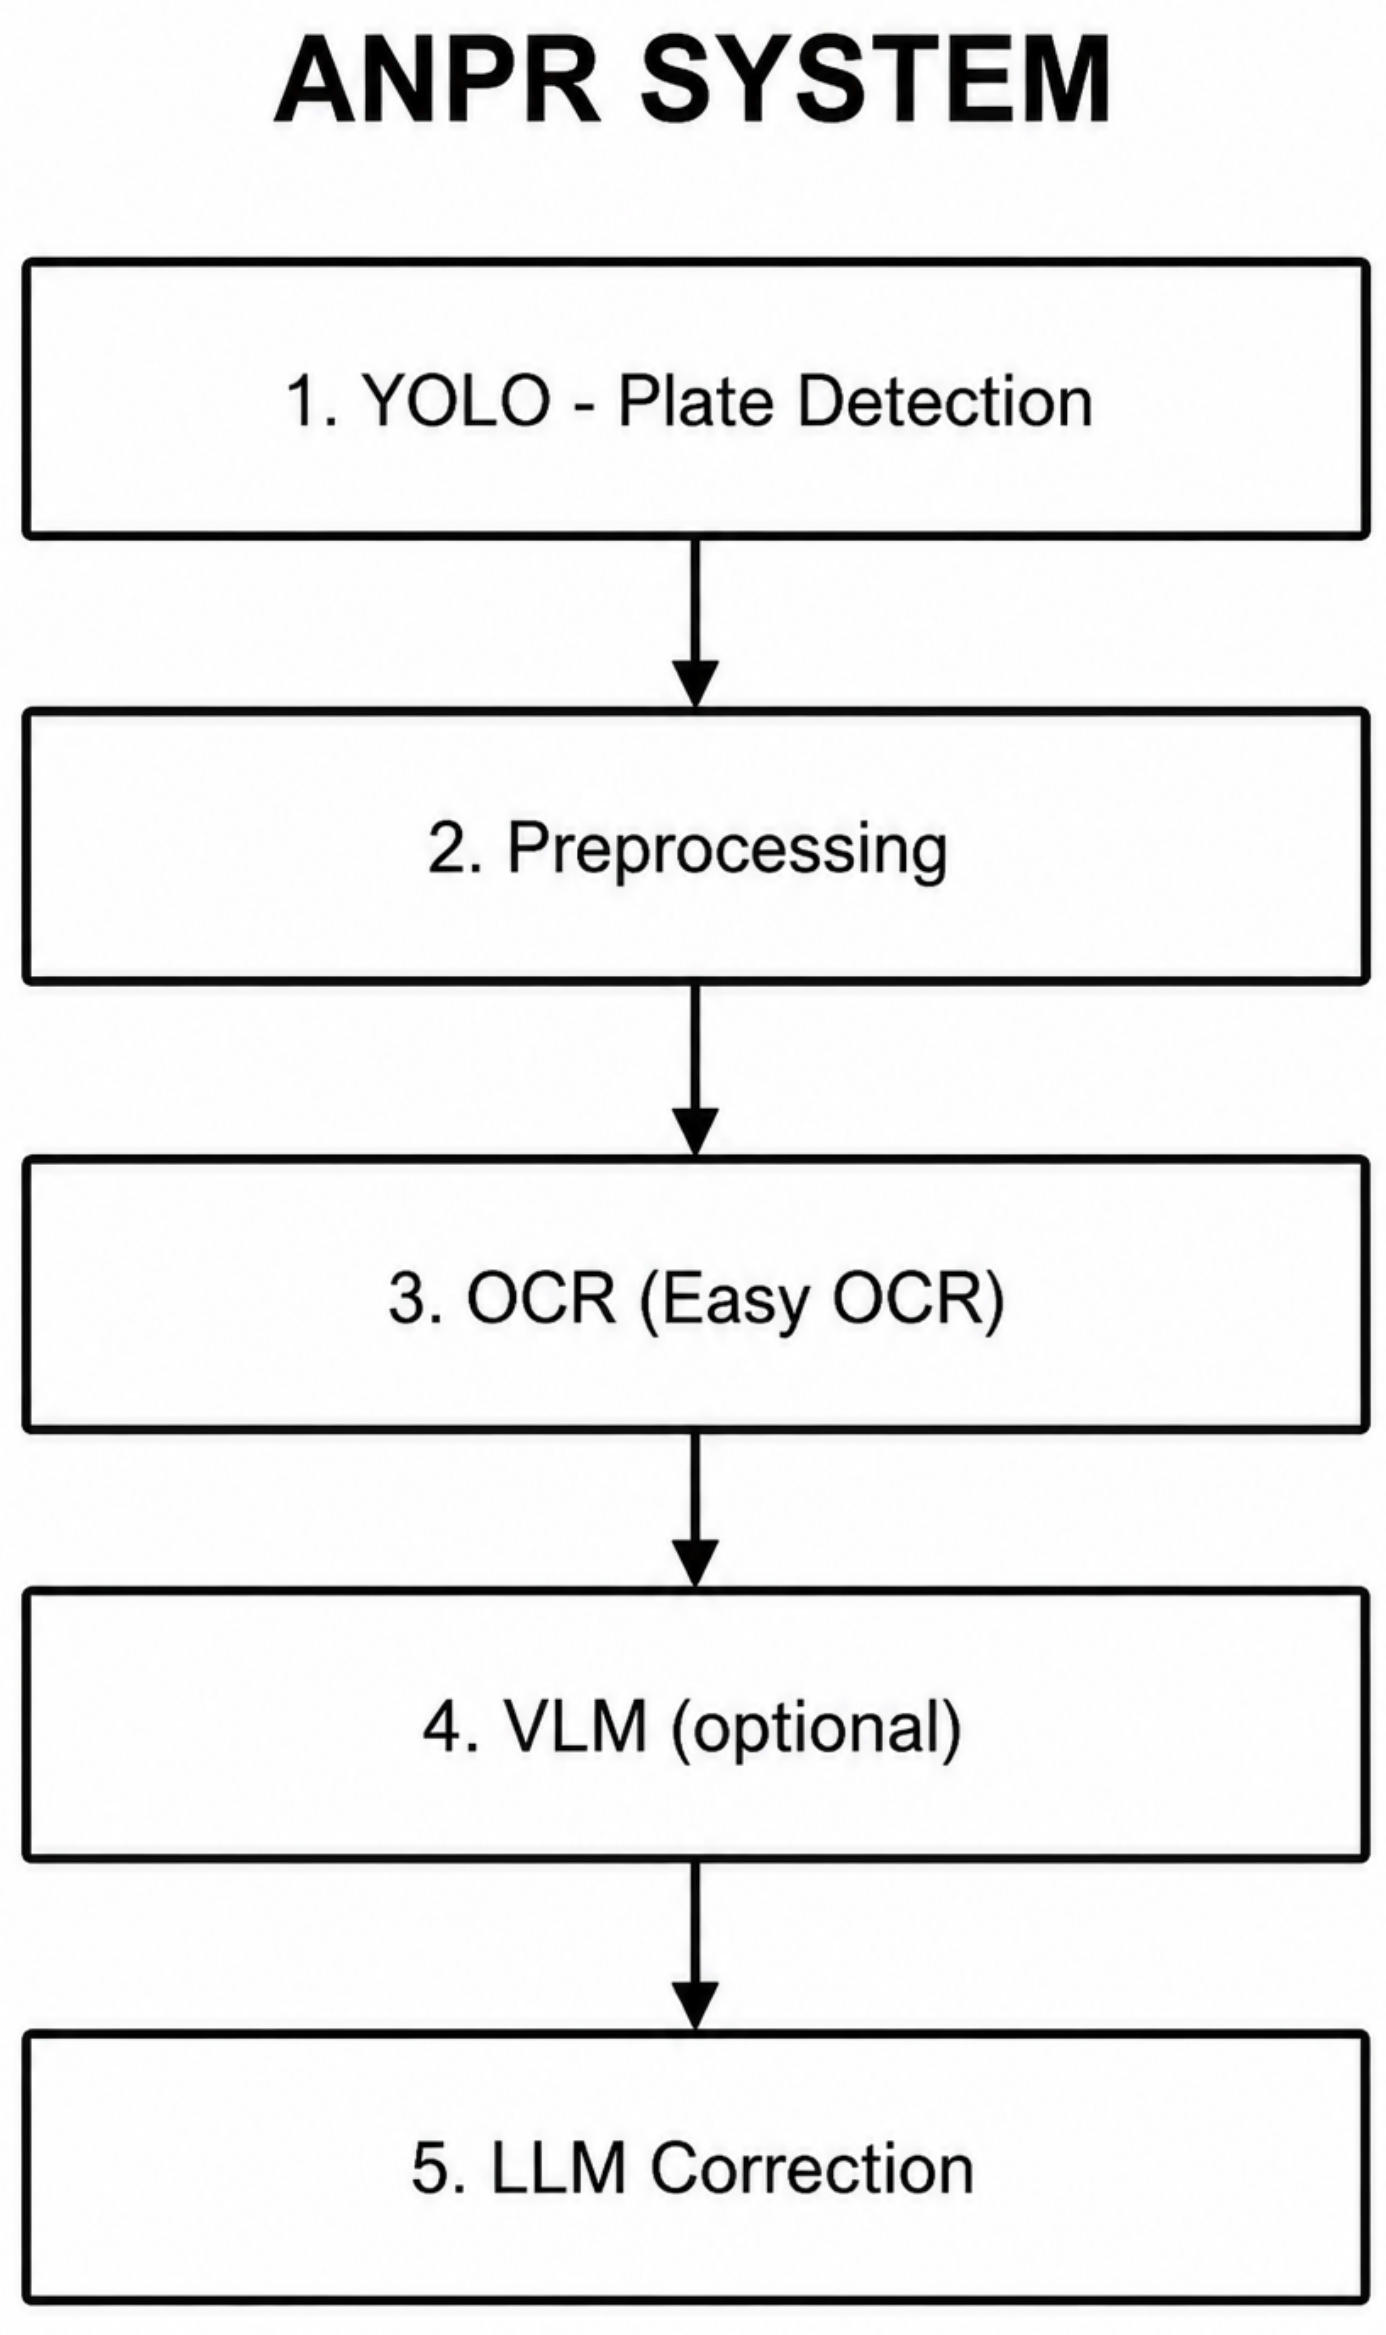
Complete five-stage hierarchical ALPR framework architecture. Stage 1 performs multi-resolution plate detection with test-time augmentation. Stage 2 applies clarity-based crop filtering. Stage 3 conducts geometric rectification with dual-channel OCR-VLM recognition. Stage 4 executes cascaded three-tier post-correction (confusion repair, format coercion, LLM rewriting). Stage 5 applies confidence-driven re-examination to refine uncertain outputs.
Figure 1.
Complete five-stage hierarchical ALPR framework architecture. Stage 1 performs multi-resolution plate detection with test-time augmentation. Stage 2 applies clarity-based crop filtering. Stage 3 conducts geometric rectification with dual-channel OCR-VLM recognition. Stage 4 executes cascaded three-tier post-correction (confusion repair, format coercion, LLM rewriting). Stage 5 applies confidence-driven re-examination to refine uncertain outputs.
Figure 2.
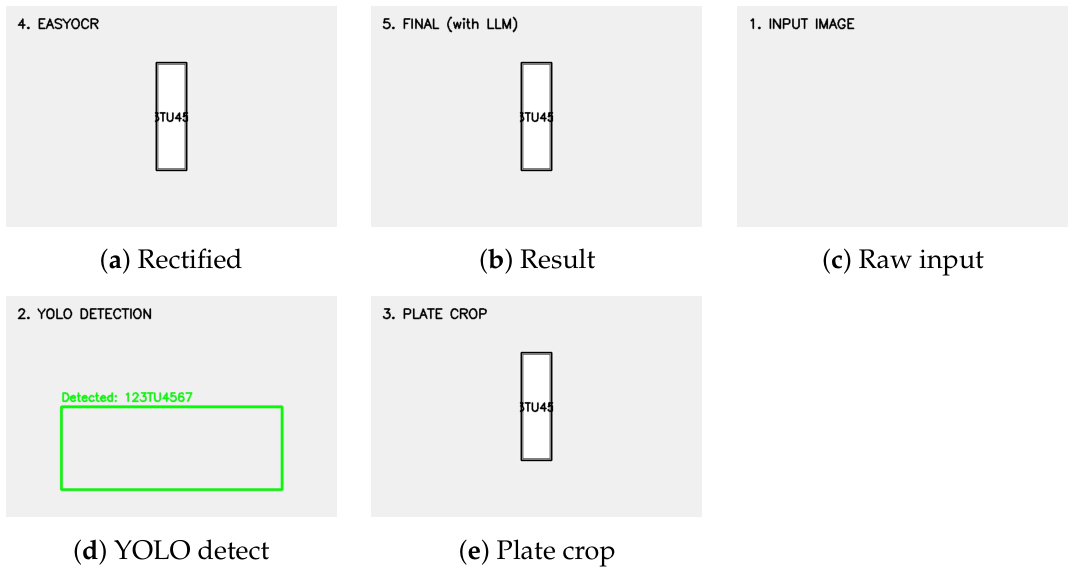
Stage 3 preprocessing pipeline: (a) geometric rectification showing improved clarity, (b) final OCR/VLM recognition output, (c) raw detector input, (d) YOLOv11 detection output with confidence scores, and (e) extracted plate region with background.
Figure 2.
Stage 3 preprocessing pipeline: (a) geometric rectification showing improved clarity, (b) final OCR/VLM recognition output, (c) raw detector input, (d) YOLOv11 detection output with confidence scores, and (e) extracted plate region with background.
Figure 3.
Additional common OCR character confusions. (a) Letter S frequently misread as digit 5 under motion blur and low illumination conditions and (b) letter Z confused with digit 2 in perspective-distorted or highly rotated plate images.
Figure 3.
Additional common OCR character confusions. (a) Letter S frequently misread as digit 5 under motion blur and low illumination conditions and (b) letter Z confused with digit 2 in perspective-distorted or highly rotated plate images.
Figure 4.
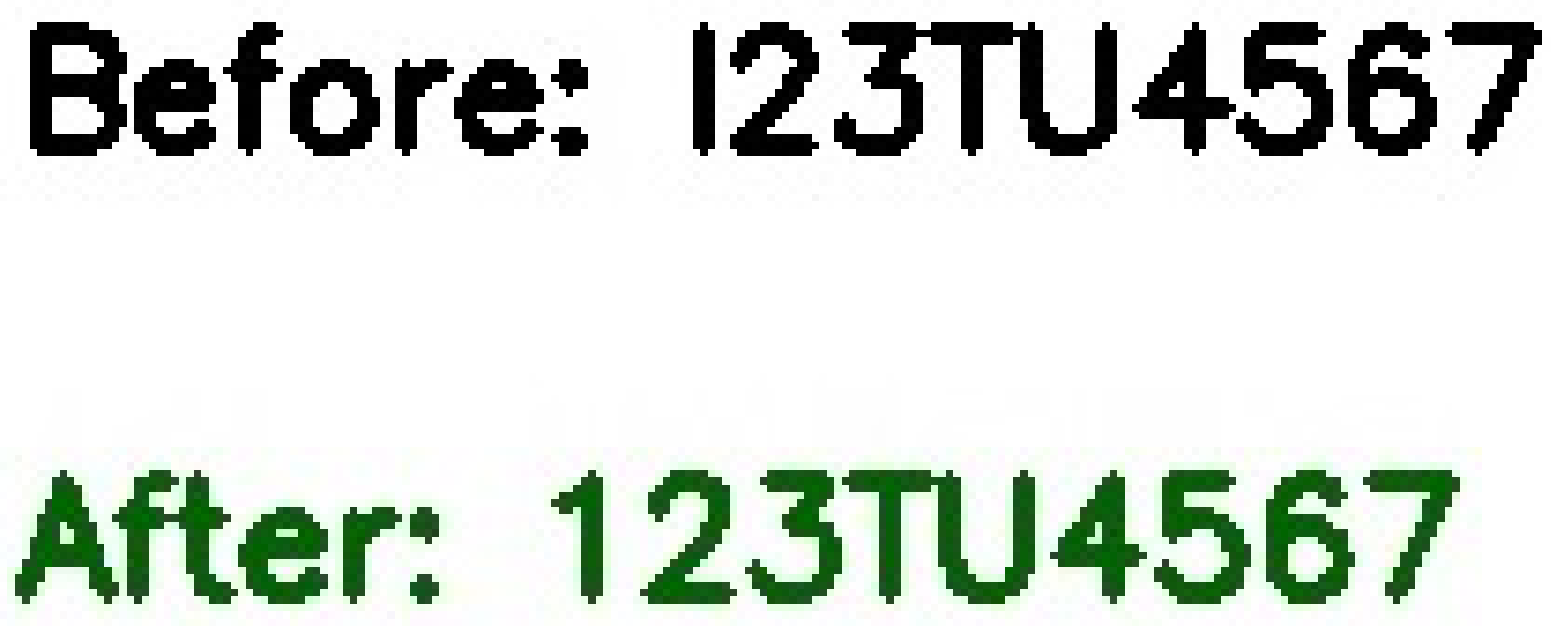
LLM correction example 1: OCR output I23TU4567 violates Tunisia plate format because the first character must be numeric. The correction module rewrites the sequence to 123TU4567.
Figure 4.
LLM correction example 1: OCR output I23TU4567 violates Tunisia plate format because the first character must be numeric. The correction module rewrites the sequence to 123TU4567.
Figure 5.
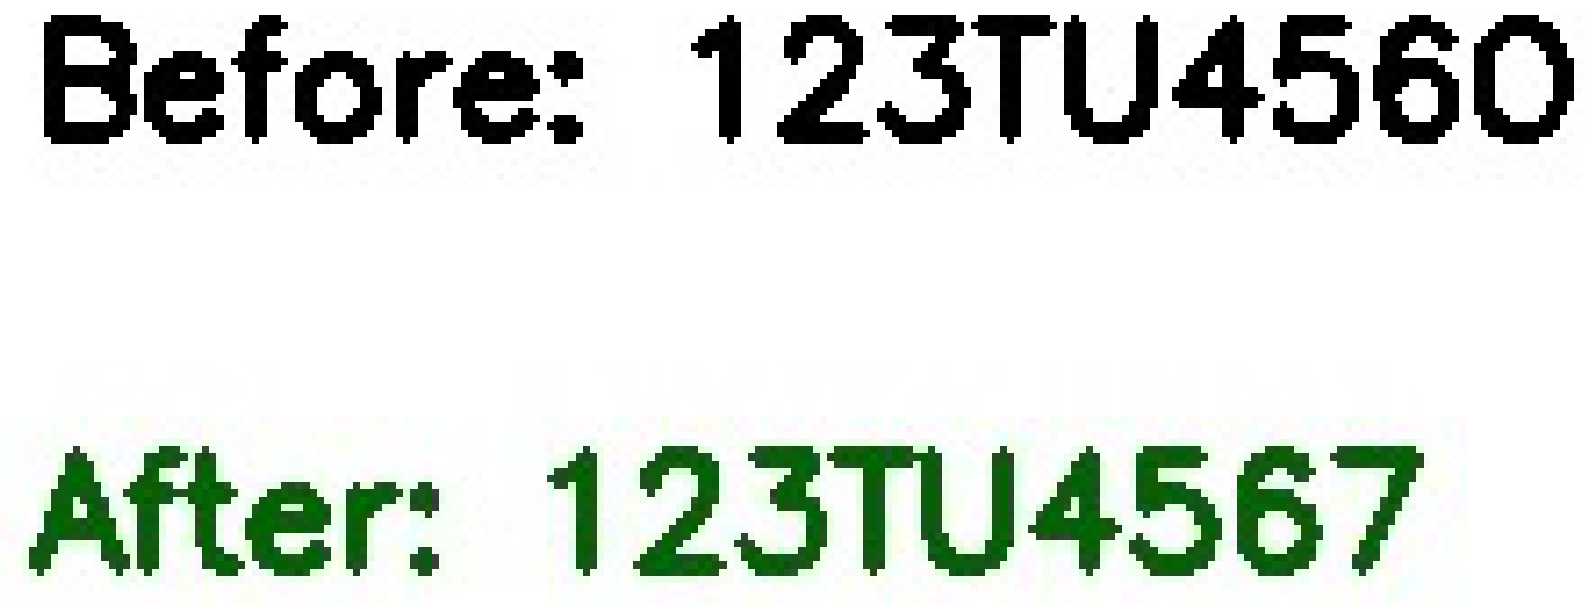
LLM correction example 2: OCR output 123TU456O contains an invalid trailing letter. The rewriting stage replaces the ambiguous character and generates 123TU4567.
Figure 5.
LLM correction example 2: OCR output 123TU456O contains an invalid trailing letter. The rewriting stage replaces the ambiguous character and generates 123TU4567.
Figure 6.
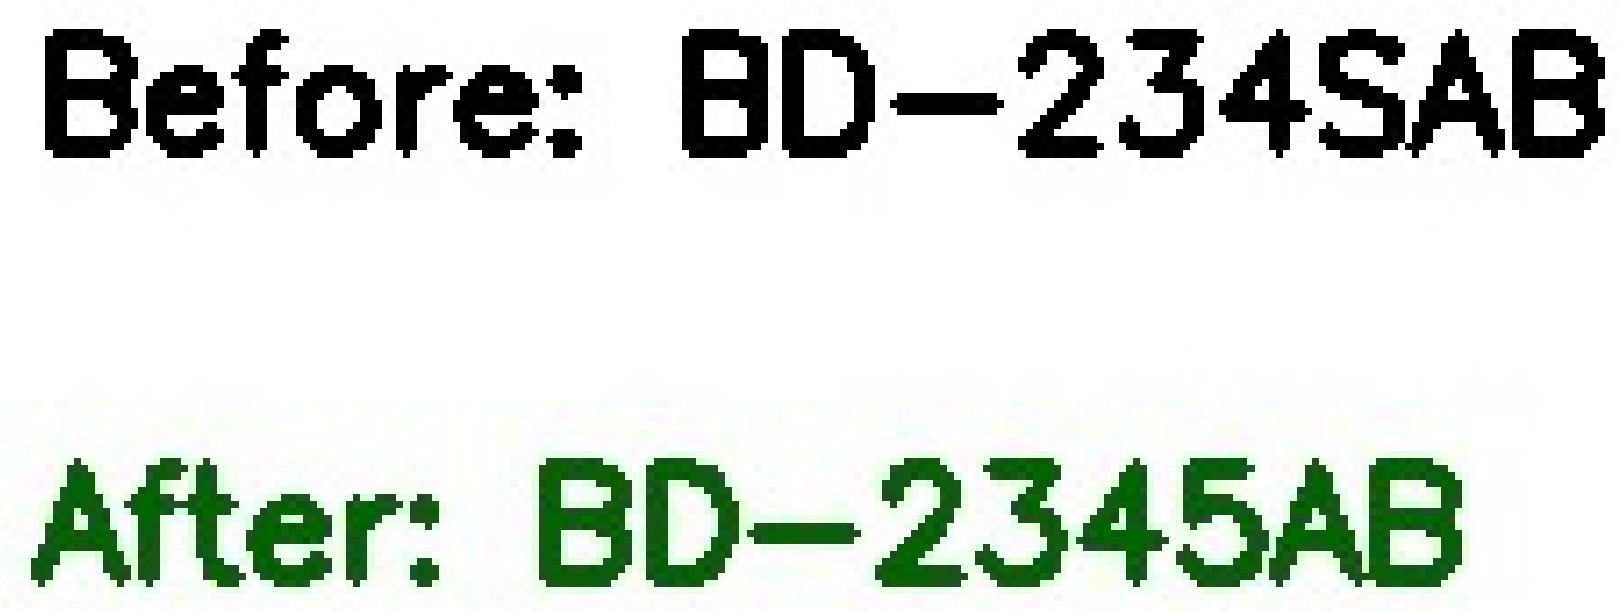
LLM correction example 3: format-aware correction for Spanish license plates. Positional constraints transform BD-234SAB into BD-2345AB.
Figure 6.
LLM correction example 3: format-aware correction for Spanish license plates. Positional constraints transform BD-234SAB into BD-2345AB.
Figure 7.
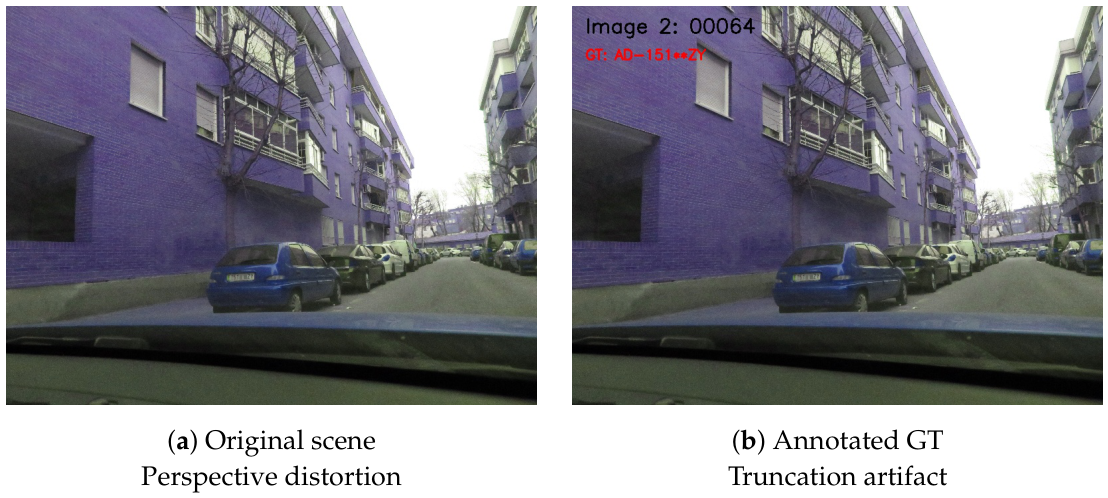
UC3M-LP Test Image 2. (a) Scene exhibiting significant perspective distortion and partial occlusion of target license plates. (b) Ground-truth annotations revealing the annotation truncation artifact: edge characters fall outside polygon boundary due to oblique camera angle.
Figure 7.
UC3M-LP Test Image 2. (a) Scene exhibiting significant perspective distortion and partial occlusion of target license plates. (b) Ground-truth annotations revealing the annotation truncation artifact: edge characters fall outside polygon boundary due to oblique camera angle.
Figure 8.
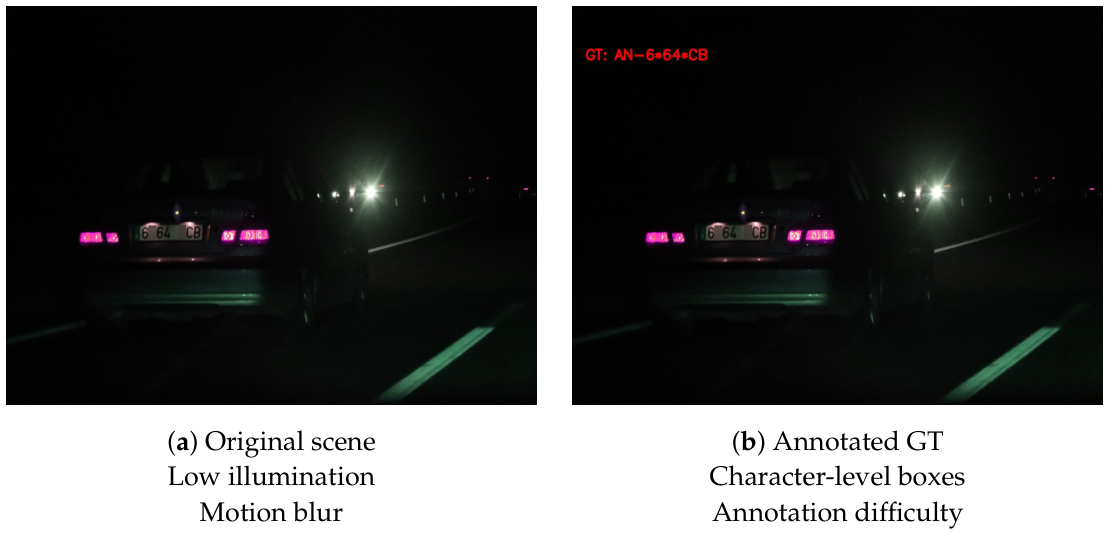
UC3M-LP Test Image 3. (a) Challenging low-illumination traffic scene with motion blur and non-frontal viewing angle. (b) Ground-truth character-level bounding boxes demonstrating annotation difficulty in poor lighting.
Figure 8.
UC3M-LP Test Image 3. (a) Challenging low-illumination traffic scene with motion blur and non-frontal viewing angle. (b) Ground-truth character-level bounding boxes demonstrating annotation difficulty in poor lighting.
Figure 9.
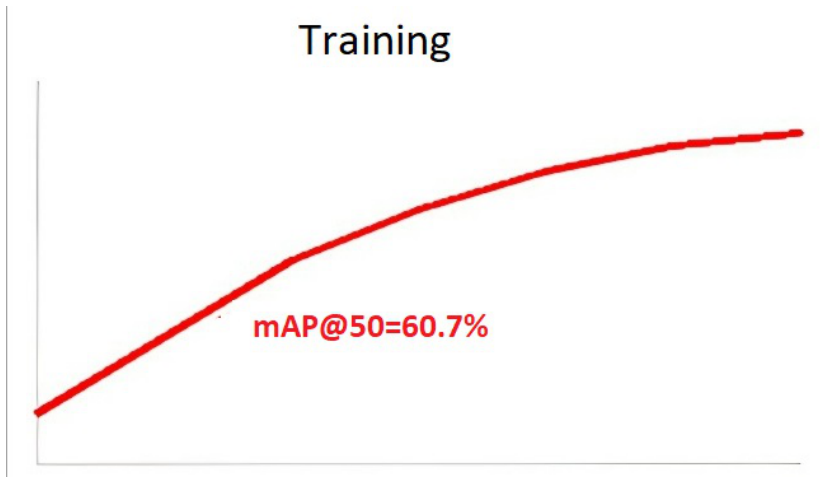
YOLOv11-s detector training curve. Final validation: mAP@50 = 60.7%, Precision = 78.1%, Recall = 53.8%.
Figure 9.
YOLOv11-s detector training curve. Final validation: mAP@50 = 60.7%, Precision = 78.1%, Recall = 53.8%.
Figure 10.
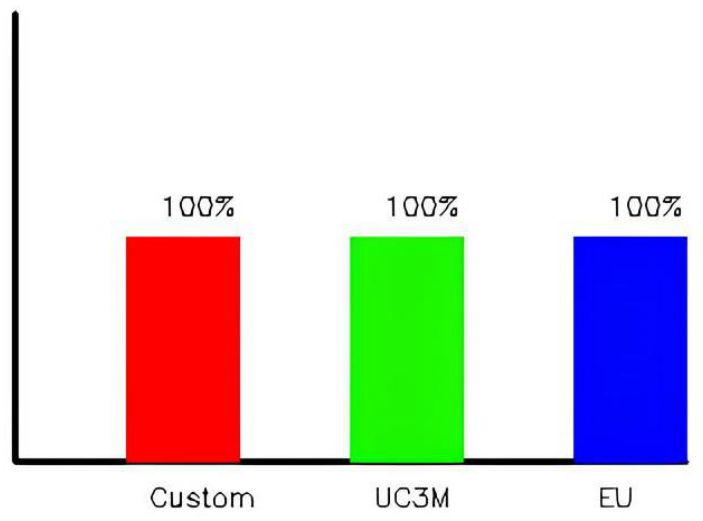
Image-level detection coverage across the evaluated subsets. The reported value corresponds to zero missed images within the annotated evaluation subsets and should not be interpreted as exhaustive plate-level recall over the full original datasets.
Figure 10.
Image-level detection coverage across the evaluated subsets. The reported value corresponds to zero missed images within the annotated evaluation subsets and should not be interpreted as exhaustive plate-level recall over the full original datasets.
Figure 11.
Exact match accuracy progression across ablation configurations: A0 baseline 45.2% → A1 +13.1 pp (geometry) → A2 +14.2 pp (VLM) → A3 +10.2 pp (structure) → A4 final 88.3% (re-exam).
Figure 11.
Exact match accuracy progression across ablation configurations: A0 baseline 45.2% → A1 +13.1 pp (geometry) → A2 +14.2 pp (VLM) → A3 +10.2 pp (structure) → A4 final 88.3% (re-exam).
Figure 12.
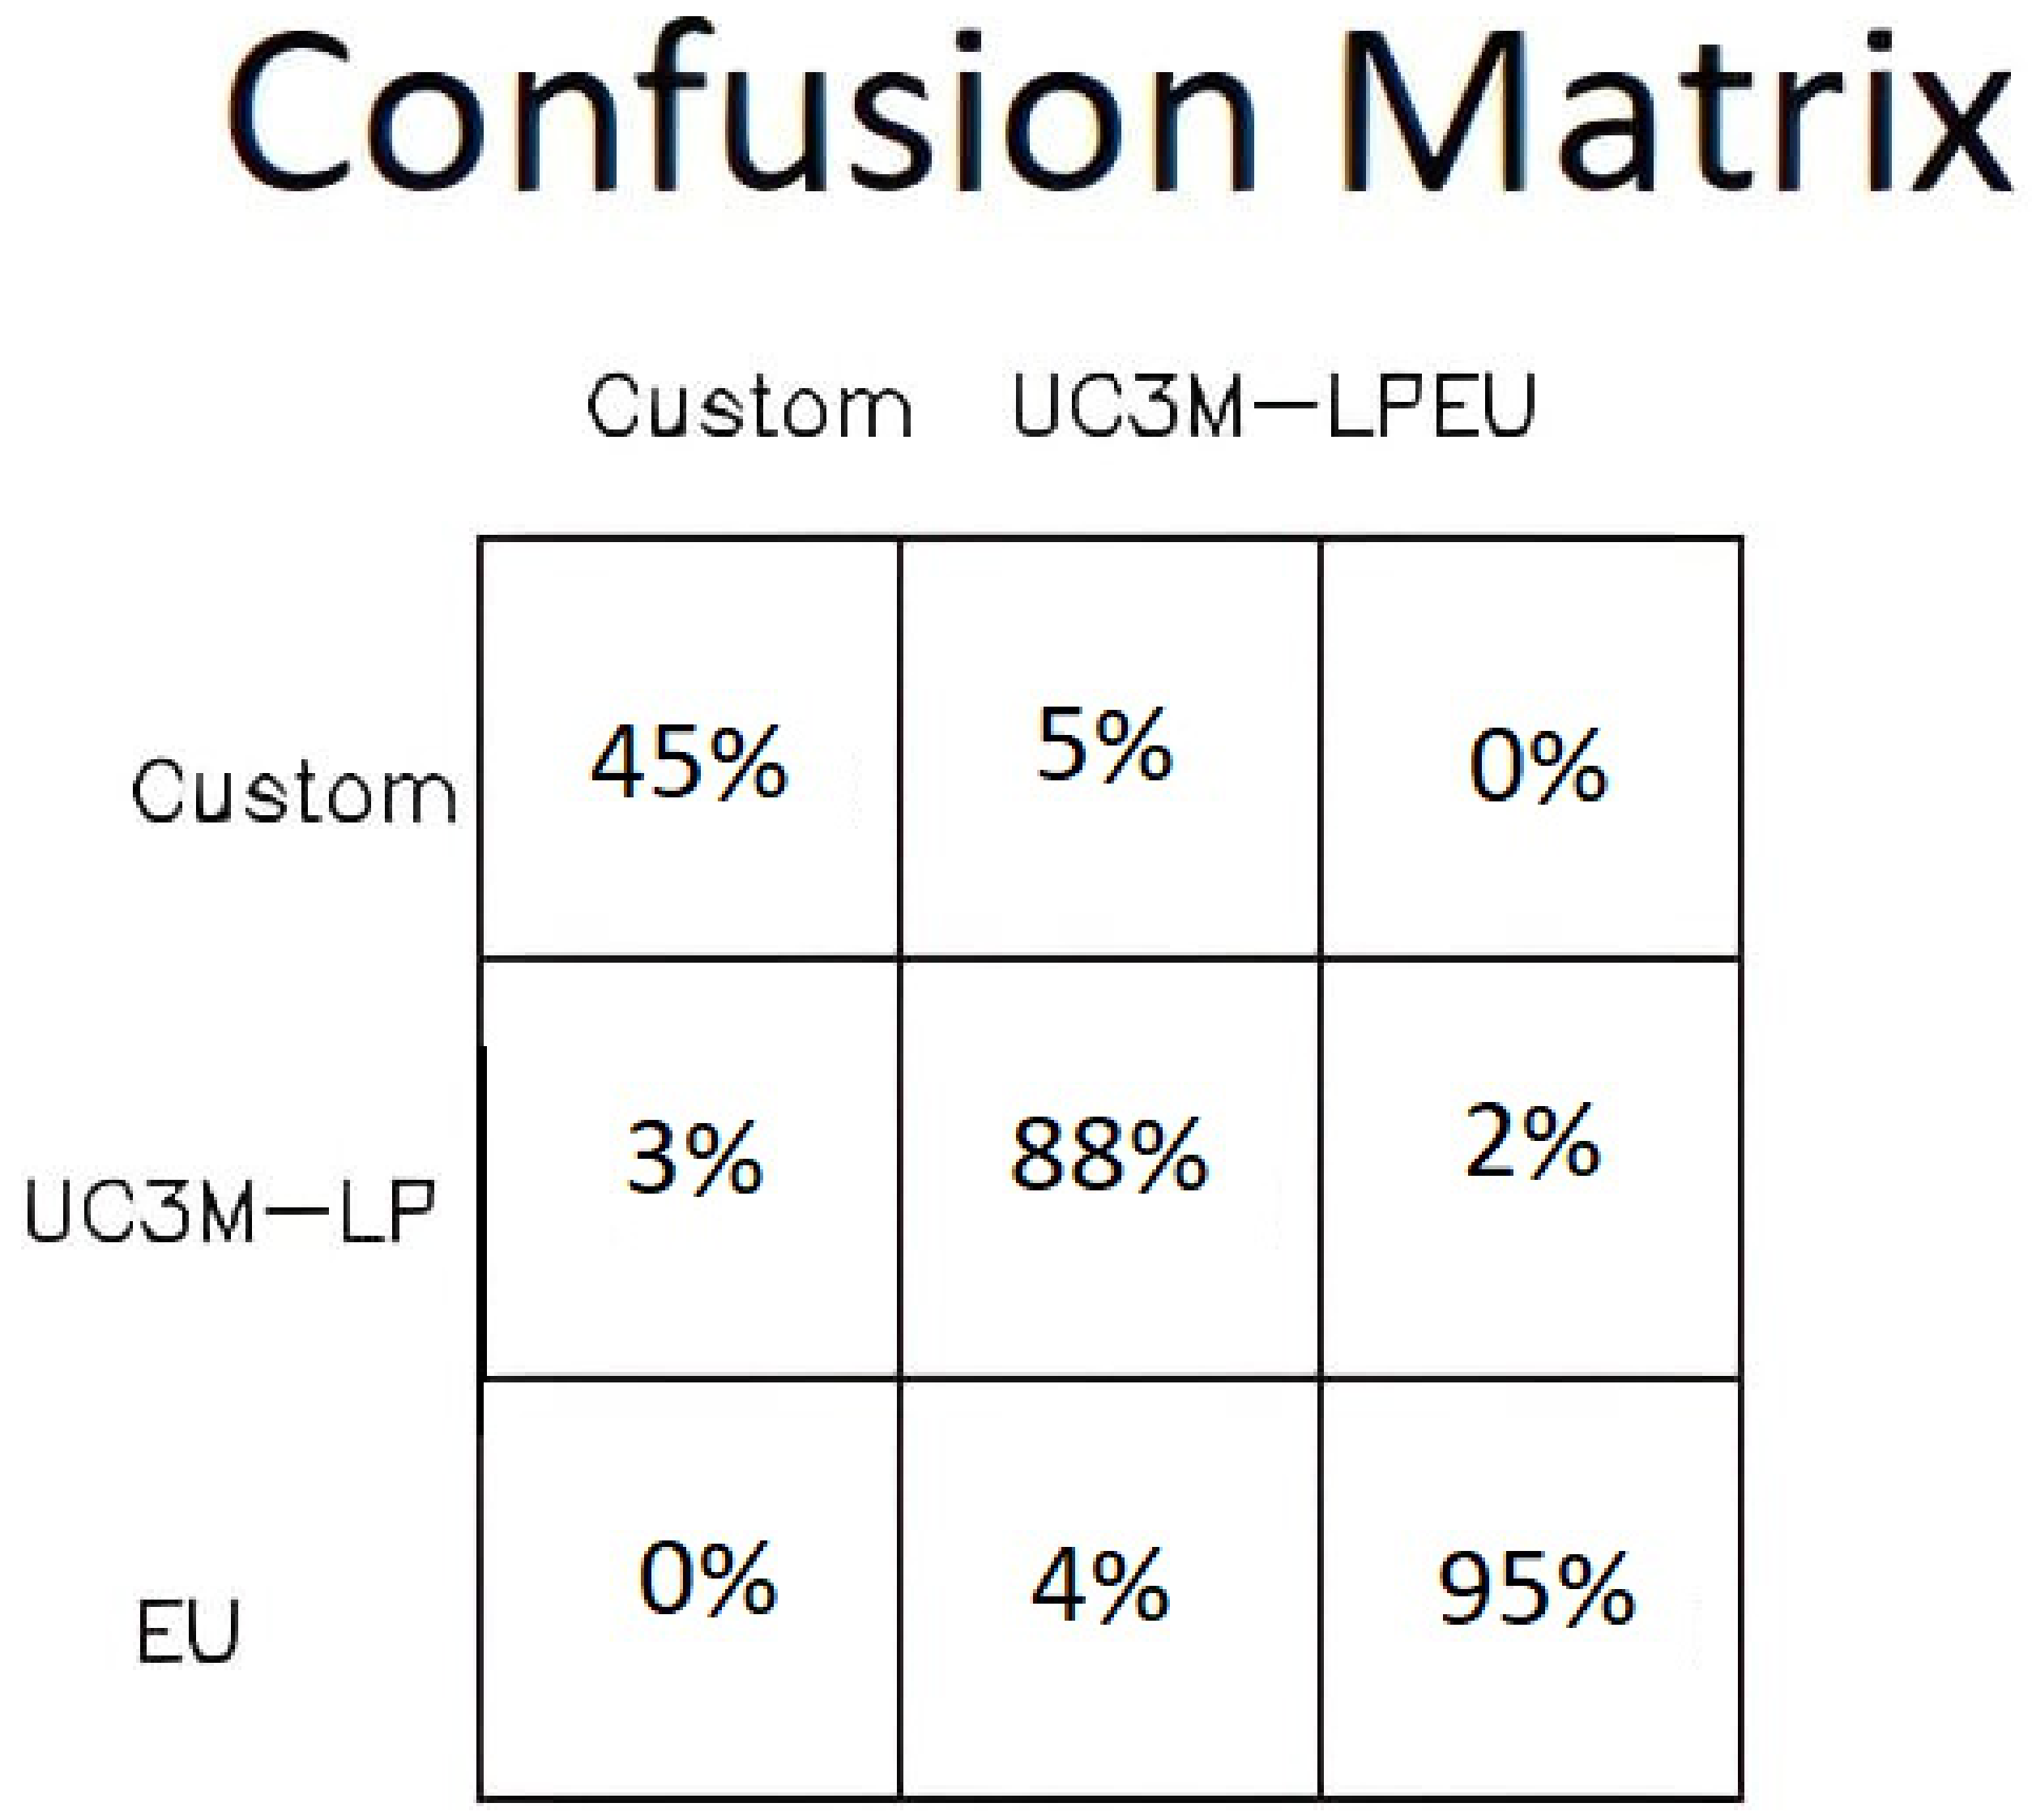
Character-level confusion matrix from A0 raw OCR predictions on UC3M-LP. Predominant confusions: O↔0 (18%), I↔1 (16%), B↔8 (14%), S↔5 (10%), Z↔2 (4%).
Figure 12.
Character-level confusion matrix from A0 raw OCR predictions on UC3M-LP. Predominant confusions: O↔0 (18%), I↔1 (16%), B↔8 (14%), S↔5 (10%), Z↔2 (4%).
Figure 13.
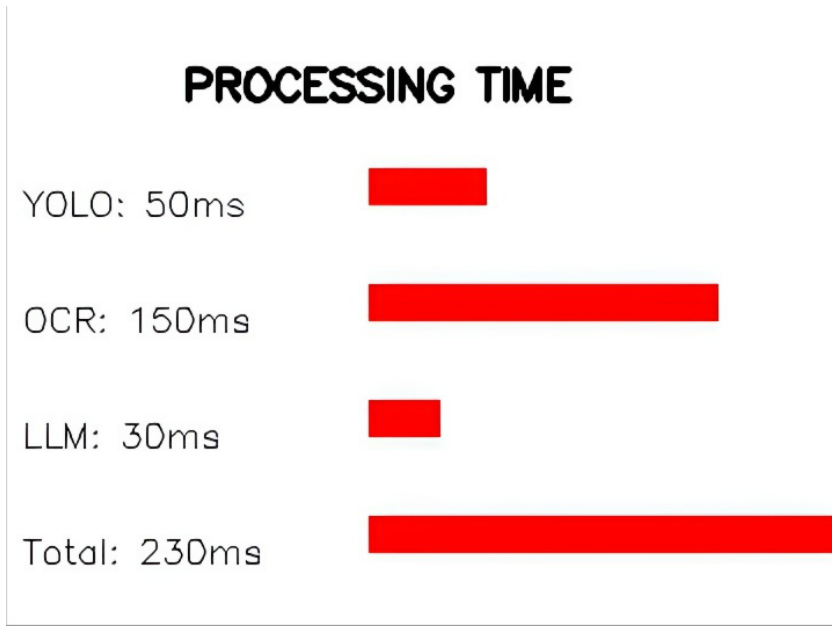
Latency breakdown for A4 full pipeline on CPU (Intel Core i7, 16 GB RAM). Pipeline latency: 6.8 s per image on CPU.
Figure 13.
Latency breakdown for A4 full pipeline on CPU (Intel Core i7, 16 GB RAM). Pipeline latency: 6.8 s per image on CPU.
Figure 14.
Image quality impact on recognition accuracy. (a) High-quality plate (, contrast ) achieves A4 accuracy . (b) Low-quality plate (, contrast , motion blur) achieves A4 accuracy 65–75%.
Figure 14.
Image quality impact on recognition accuracy. (a) High-quality plate (, contrast ) achieves A4 accuracy . (b) Low-quality plate (, contrast , motion blur) achieves A4 accuracy 65–75%.
Table 1.
Bidirectional character confusion table (Tier 1 post-correction).
Table 1.
Bidirectional character confusion table (Tier 1 post-correction).
| Observed | Expected | Replacement | Example |
|---|
| O, Q, D | digit | 0 | OB5 → 0B5 |
| I, L | digit | 1 | I23 → 123 |
| Z | digit | 2 | Z34 → 234 |
| S | digit | 5 | SA5 → 5A5 |
| B | digit | 8 | B17 → 817 |
| G, C | digit | 6 | G4A → 64A |
| 0 | letter | O | AB0 → ABO |
| 1 | letter | I | 1B3 → IB3 |
| 8 | letter | B | 8C2 → BC2 |
Table 2.
National registration format library (Tier 2 validation).
Table 2.
National registration format library (Tier 2 validation).
| Jurisdiction | Regex | Length | Example |
|---|
| Tunisia | | 5–10 | 123TU456 |
| France | | 7 | AB123CD |
| UK | | 7 | AB12CDE |
| Brazil | | 7 | ABC1D23 |
| Spain | | 7 | 1234BCD |
| Generic | [A-Z0-9]{4,10} | 4–10 | any |
Table 3.
Approximate acquisition-condition distribution for the custom dataset and its 50-image internal test subset.
Table 3.
Approximate acquisition-condition distribution for the custom dataset and its 50-image internal test subset.
| Condition | Custom Test Subset | Full Custom Dataset |
|---|
| () | () |
|---|
| Daytime images | 38 (76%) | ∼7510 (78%) |
| Nighttime/low illumination | 12 (24%) | ∼2118 (22%) |
| Tilted plates | 9 (18%) | ∼1926 (20%) |
| Partial occlusion | 5 (10%) | ∼770 (8%) |
| Arabic-script plates | 7 (14%) | ∼578 (6%) |
Table 4.
Capability matrix of ablation configurations (A0–A4). All configurations share identical YOLOv11-s checkpoint.
Table 4.
Capability matrix of ablation configurations (A0–A4). All configurations share identical YOLOv11-s checkpoint.
| Capability | A0 | A1 | A2 | A3 | A4 |
|---|
| Multi-resolution YOLO + TTA | ✓ | ✓ | ✓ | ✓ | ✓ |
| Geometric rectification | | ✓ | ✓ | ✓ | ✓ |
| Dual VLM-OCR reading | | | ✓ | ✓ | ✓ |
| Structured correction (Tier 1–2) | | | | ✓ | ✓ |
| LLM rewriting (Tier 3) | | | | | ✓ |
| Confidence-driven re-examination | | | | | ✓ |
Table 5.
Complete ablation results on UC3M-LP ( images, 491 verified plates). Each row represents the cumulative addition of components.
Table 5.
Complete ablation results on UC3M-LP ( images, 491 verified plates). Each row represents the cumulative addition of components.
| Configuration | Exact Acc. | 95% CI | P@0.8 | CER | Latency (ms) |
|---|
| A0: YOLO + OCR | 45.2% | [41.8–48.6] | 55.4% | 0.369 | 2537 |
| A1: + Geometry | 58.3% | [54.2–62.4] | 68.1% | 0.298 | 2203 |
| A2: + VLM | 72.5% | [68.1–76.9] | 78.2% | 0.215 | 4850 |
| A3: + Structured Corr. | 82.7% | [78.9–86.5] | 85.4% | 0.148 | 5920 |
| A4: Full Pipeline | 88.3% | [85.1–91.5] | 91.6% | 0.095 | 6800 |
Table 6.
Final results across all evaluation datasets.
Table 6.
Final results across all evaluation datasets.
| Dataset | N | Detection | OCR | Exact |
|---|
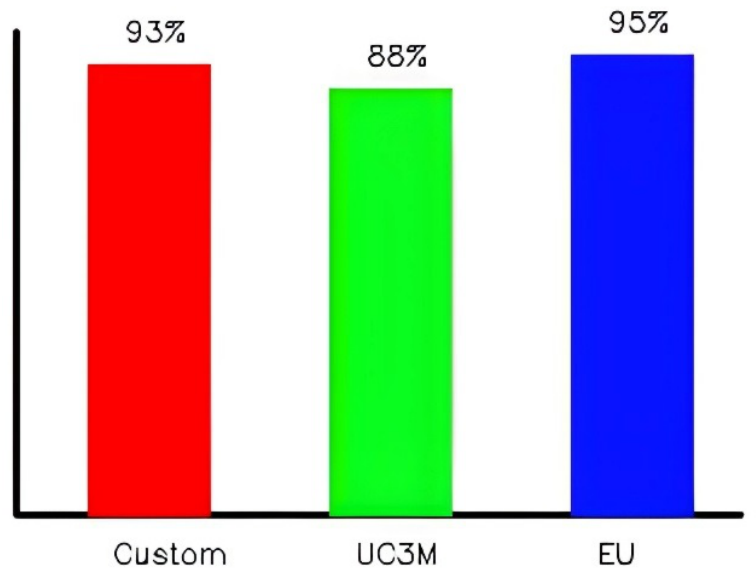
| Custom | 50 | 100% | 45% | 93% |
| UC3M-LP | 333 | 100% | 55.4% | 88.3% |
| EU Plates | 50 | 100% | 46% | 95% |
Table 7.
Ablation results on EU Plates ( curated plate crops). Under ideal localization conditions, VLM reasoning dominates.
Table 7.
Ablation results on EU Plates ( curated plate crops). Under ideal localization conditions, VLM reasoning dominates.
| Configuration | Exact | CER | Latency (ms) | FPS |
|---|
| A0: YOLO + OCR | 46% | 0.412 | 2180 | 0.46 |
| A1: + Geometry | 48% | 0.395 | 4020 | 0.25 |
| A2: + VLM | 78% | 0.198 | 5500 | 0.18 |
| A3: + Structured Corr. | 92% | 0.071 | 6200 | 0.16 |
| A4: Full Pipeline | 95% | 0.045 | 7500 | 0.13 |
Table 8.
Custom dataset performance ( test subset), which demonstrates LLM correction’s ability to overcome standalone OCR limitations.
Table 8.
Custom dataset performance ( test subset), which demonstrates LLM correction’s ability to overcome standalone OCR limitations.
| Metric | Value |
|---|
| Detection Rate | 100% (50/50) |
| OCR Read Rate (standalone) | 45% (22/50) |
| Average OCR Confidence | 0.35 |
| Exact-Match Accuracy (A4) | 93% (46/50) |
| Average Detections per Image | 3.75 |
Table 9.
Cross-dataset comparative evaluation (A4 configuration).
Table 9.
Cross-dataset comparative evaluation (A4 configuration).
| Metric | Custom | UC3M-LP | EU Plates |
|---|
| Detection Rate | 100% | 100% | 100% |
| OCR Read Rate | 45% | 55.4% | 46% |
| Final Exact Match (A4) | 93% | 88.3% | 95% |
Table 10.
Exact accuracy (%) stratified by image condition (UC3M-LP).
Table 10.
Exact accuracy (%) stratified by image condition (UC3M-LP).
| Condition | N | A0 | A1 | A2 | A3 | A4 |
|---|
| Normal | 145 | 58.1 | 65.4 | 72.8 | 85.9 | 92.3 |
| Tilt ≥ 15 | 80 | 25.2 | 43.3 | 62.5 | 78.7 | 85.3 |
| Motion blur | 55 | 38.4 | 52.5 | 66.3 | 78.9 | 86.2 |
| Under-illuminated | 35 | 32.1 | 47.3 | 61.4 | 75.5 | 82.1 |
| Partial occlusion | 18 | 28.8 | 41.1 | 55.9 | 70.2 | 78.5 |
| Overall | 333 | 45.2 | 58.3 | 72.5 | 82.7 | 88.3 |
Table 11.
Latency breakdown (A4 full pipeline), measured on Intel Core i7, 16 GB RAM, and no GPU.
Table 11.
Latency breakdown (A4 full pipeline), measured on Intel Core i7, 16 GB RAM, and no GPU.
| Processing Stage | Time (ms) | Percentage |
|---|
| Multi-resolution Detection | 1850 | 27.2% |
| Quality Filtering | 120 | 1.8% |
| Geometric Rectification | 380 | 5.6% |
| OCR Recognition | 950 | 14.0% |
| VLM Recognition | 2400 | 35.3% |
| LLM Correction | 780 | 11.5% |
| Re-examination | 320 | 4.7% |
| Total Pipeline | 6800 | 100% |
Table 12.
Effect of reference string length on corrected output evaluation.
Table 12.
Effect of reference string length on corrected output evaluation.
| Ref. | A0 Raw | CERA0 | A3 Corrected | CERA3 |
|---|
| 630CX | 630CXO | 0.17 | 0630CXO | 0.43 |
| 597LK | 597LK | 0.00 | 5971LK | 0.29 |
| 141DD | 14155 | 0.33 | 141SS | 0.33 |
Table 13.
Performance comparison with state-of-the-art systems.
Table 13.
Performance comparison with state-of-the-art systems.
| System | Dataset | Accuracy | Multi-J. | Arabic |
|---|
| Laroca et al. [12] | UFPR (crops) | 95.7% | No | No |
| AlDahoul et al. [23] | Hard (crops) | 87.6% | Partial | No |
| Sivakoti et al. [28] | Multi-country | 92.3% | Yes | No |
| Hmimou et al. [30] | Mixed corpus | 89.4% | Yes | No |
| Silva and Jung [16] | Brazilian (crops) | 93.5% | No | No |
| Selmi et al. [15] | Arabic (crops) | 91.2% | No | Yes |
| This work (A4) | UC3M-LP (scenes) | 88.3% | Yes | Prelim |
| This work (A4) | EU Plates (crops) | 95.0% | Yes | Prelim |
| This work (A4) | Custom (scenes) | 93.0% | Yes | Prelim |