1. Introduction
Rockburst is one of the most severe dynamic instability hazards in deep underground engineering. It is generally associated with the sudden release of elastic strain energy from highly stressed brittle rock masses and is strongly affected by in situ stress conditions, rock brittleness, geological structures, excavation disturbance, and the capacity of the rock mass to store and release strain energy [
1,
2,
3,
4,
5]. With the increasing depth of mines, tunnels, hydropower caverns, and other underground openings, rockburst prediction has become an essential task for support design, construction safety, and risk management [
6,
7]. Previous studies have shown that rockburst occurrence is controlled by coupled stress conditions, energy accumulation, lithological brittleness, excavation disturbance, and geological structures, which makes its prediction a complex nonlinear problem [
8,
9,
10].
In engineering practice, rockburst intensity is usually assessed through a combination of damage observations and quantitative geomechanical indicators. Existing rock-mechanics studies commonly describe rockburst-prone conditions using stress-related indices, brittleness-related indices, and energy-related indices, such as the stress concentration factor, brittleness coefficient, strain energy storage index, and energy-based burst potential indicators [
2,
3,
11,
12]. Stress-based indicators characterize the degree of stress concentration relative to rock strength, brittleness indicators describe the tendency of hard rock to fail abruptly, and energy indices quantify the capacity of rock to store and release elastic strain energy. In general, higher rockburst intensity is associated with higher stress concentration, stronger brittle failure tendency, and greater elastic energy storage. However, the numerical ranges and threshold values reported in the literature vary with geological setting, lithology, in situ stress regime, excavation method, and grading criterion. Therefore, rockburst intensity grades should be regarded as ordered engineering categories with transitional boundaries rather than as universally fixed numerical intervals.
Machine learning methods have been increasingly used for rockburst intensity prediction because they can capture nonlinear relationships between multiple geomechanical indicators and rockburst grades. Early comparative studies demonstrated the feasibility of supervised learning for rockburst classification using limited engineering cases [
12]. Later studies further improved prediction performance using ensemble learning, tree-based models, neural networks, deep forest, Bayesian optimization, and class-imbalance processing strategies [
13,
14,
15,
16,
17,
18]. More recent studies have emphasized model interpretability, feature attribution, hyperparameter optimization, and deep-learning architectures for rockburst intensity assessment [
19,
20,
21]. Together, these studies establish the main hard-label machine learning baselines for rockburst intensity prediction, covering conventional supervised classifiers, ensemble-tree models, neural networks, automated hyperparameter optimization, class-imbalance processing, and model interpretation. However, most of these methods still formulate rockburst intensity prediction as ordinary hard-label classification. In this formulation, none, light, moderate, and strong rockbursts are treated as mutually independent classes, although they are physically ordered states with progressively increasing damage severity. This treatment may be inconsistent with the transitional nature of rockburst intensity, especially when adjacent grades have overlapping feature distributions.
The database used in this study was constructed by integrating three published rockburst datasets, including the global benchmark dataset ofZhou et al. [
12], the engineering case dataset of Ahmad et al. [
22], and the monitoring-based dataset of Shen et al. [
21]. Integrating multiple sources increases the sample size and provides a broader basis for data-driven modeling. However, the resulting database should not be regarded simply as an independent and identically distributed sample pool. The three datasets were collected from different engineering backgrounds and may involve different data screening rules, feature distributions, and labeling tendencies. In machine learning, such distributional differences are commonly discussed as domain or source shifts, under which models trained on one data source may not generalize reliably to another [
23,
24]. Therefore, random train–test splitting alone may overestimate model robustness, because samples from the same source can appear simultaneously in the training and test subsets.
Existing rockburst prediction studies have mainly focused on improving classification accuracy, optimizing model structures, constructing physical or empirical indices, balancing imbalanced samples, explaining feature importance, or quantifying prediction uncertainty [
7,
13,
15,
19,
25]. These efforts have significantly advanced data-driven rockburst prediction. Nevertheless, the label representation problem itself has received relatively limited attention. A single one-hot label assumes that the observed class is fully certain and that all other classes are equally incorrect. This assumption is problematic for ordered labels, where adjacent classes are usually more similar than distant classes. In machine learning, ordinal regression and ordinal classification have been developed to handle naturally ordered labels [
26], but they usually still assign each sample to a single ordered category or learn ordered decision boundaries, rather than representing the ambiguity shared by neighboring grades. Label distribution learning provides a way to represent the degree to which multiple labels describe one sample [
27], and ordinal label distribution learning further emphasizes the sequential structure among ordered labels [
28]. However, existing ordinal learning and label distribution learning methods mainly focus on the label side, while domain adaptation and domain generalization methods mainly focus on reducing source-dependent distribution shifts. Few studies have combined these two aspects for heterogeneous rockburst databases, where adjacent-grade ambiguity and source heterogeneity coexist. These ideas are particularly relevant to rockburst intensity prediction because adjacent grades are physically related and often difficult to separate using sparse static indicators [
29,
30]. Therefore, the methodological gap addressed in this study is to combine neighborhood-adaptive ordinal label distribution learning with source-invariant representation learning, so that rockburst intensity can be modeled as an ordered probability distribution rather than a rigid nominal class.
From a sustainable development perspective, improving the reliability of rockburst intensity assessment is also important for safer deep resource extraction and resilient underground infrastructure. Unexpected rockburst events may cause worker injuries, equipment damage, excavation interruption, and excessive support or remediation costs. A more robust and transferable risk assessment model can support safer working conditions, more rational support design, and more efficient underground engineering management. These objectives are consistent with the safety- and infrastructure-oriented aspects of the United Nations Sustainable Development Goals, particularly SDG 8 related to decent work and economic growth and SDG 9 related to industry, innovation, and infrastructure. Therefore, the main goal of this study is not only to improve predictive accuracy, but also to provide a more reliable data-driven basis for sustainable and safety-oriented underground engineering decision-making.
From the perspective of rockburst mechanisms, the Stress Coefficient (SC), Brittleness Coefficient (BC), and Elastic Energy Index (EEI) correspond to three important but simplified controlling dimensions: stress concentration, brittle failure tendency, and elastic energy storage potential. Specifically, SC characterizes the stress concentration level of the surrounding rock at the engineering scale, BC measures the inherent brittle failure tendency of the rock mass, and EEI quantifies the capacity of the rock to store elastic strain energy and release it abruptly. These indicators are widely used in rockburst intensity assessment and are among the most consistently available variables in public rockburst datasets, which makes them suitable for constructing a comparable multi-source benchmark database. Nevertheless, these three static indicators cannot fully represent the complete dynamic triggering process of rockbursts. Geological structures, excavation sequence, support conditions, in situ stress evolution, microseismic activity, and historical damage evolution may also strongly affect site-specific rockburst occurrence. Therefore, the present SC–BC–EEI feature set should be regarded as a simplified and comparable benchmark representation rather than a complete description of all rockburst-controlling factors.
To address these issues, this study proposes a source-invariant ordinal label distribution learning framework for heterogeneous rockburst intensity prediction. The aim is not to replace existing preprocessing strategies, ensemble-learning models, deep learning models, or automated model-selection methods for rockburst prediction. Instead, the contribution of this work is to provide a more precise methodological extension for literature-compiled heterogeneous rockburst databases, where adjacent-grade ambiguity and source-dependent distribution shifts coexist.
The main contributions are as follows. First, rockburst intensity prediction is reformulated from conventional hard-label classification into ordinal label distribution learning, so that the ordered and transitional nature of rockburst grades can be represented more explicitly. Second, a neighborhood-adaptive soft-label generation strategy is developed to describe local ambiguity in the SC–BC–EEI feature space. Third, source-invariant representation learning is incorporated to reduce source-specific dependence during training, while leave-one-source-out validation is used to evaluate cross-source generalization on the heterogeneous benchmark. Fourth, ordinal evaluation metrics, including mean absolute grade error, quadratic weighted Kappa, adjacent-grade accuracy, and severe misclassification rate, are used to assess not only whether the predicted grade is correct, but also how serious the grade error is. For clarity, the principal abbreviations used throughout this study are summarized in
Table 1.
3. Methodology
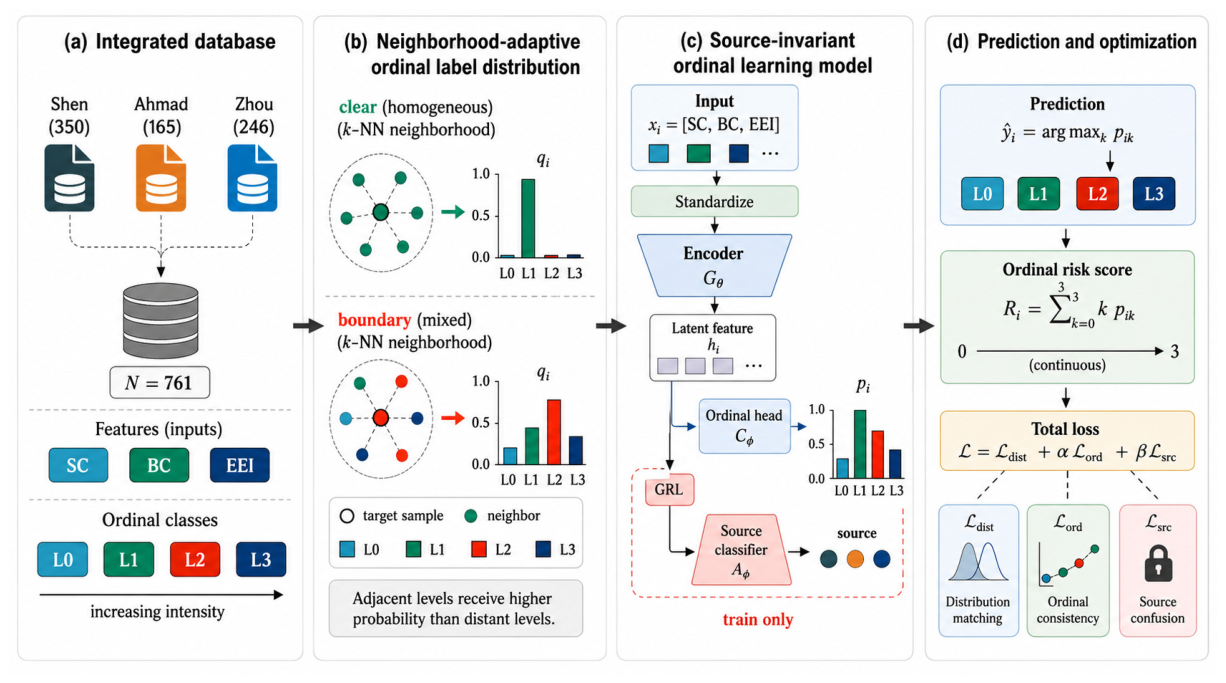
This section presents the proposed source-invariant ordinal label distribution learning framework for rockburst intensity prediction. The framework is designed for heterogeneous small-sample tabular data, where rockburst intensity levels are ordered but not sharply separable. Instead of learning a deterministic mapping from SC, BC, and EEI to a single hard class, the proposed method learns an ordinal probability distribution that reflects both the observed intensity label and the local ambiguity of neighboring samples. Source-invariant learning is further introduced to reduce dependence on source-specific patterns in the integrated database.
Figure 3 illustrates the proposed source-invariant ordinal label distribution learning framework. The framework consists of neighborhood-adaptive ordinal label distribution generation, a feature encoder, an ordinal distribution prediction head, and a source-confusion branch used only during training.
3.1. Problem Formulation
The diagnostic results in
Section 2 show that rockburst intensity prediction based on SC, BC, and EEI is affected by two major characteristics: adjacent intensity levels are highly overlapping, and the integrated database contains source-dependent distributional differences. Therefore, the prediction problem should not be formulated as a conventional nominal classification task in which the four intensity levels are treated as mutually independent categories. Instead, rockburst intensity should be considered as an ordered risk state with transitional boundaries between adjacent levels.
Let the integrated database be denoted as:
where
is the input feature vector of the
-th sample,
is the observed rockburst intensity label, and
denotes the data source. The input vector contains three geomechanical indicators:
where
,
, and
represent the stress coefficient, brittleness coefficient, and elastic energy index, respectively. The rockburst intensity label is defined as an ordered categorical variable:
where 0, 1, 2, and 3 correspond to none, light, moderate, and strong rockburst, respectively. The source label is defined as:
The source label is not used as an engineering predictor during inference. It is used only during model development to characterize source heterogeneity and to guide source-invariant representation learning.
In a conventional hard-label classifier, the learning objective is to obtain a mapping from the input space to a single intensity level:
This formulation forces each sample to be assigned to one deterministic class. However,
Section 2 shows that many samples lie in transitional regions where adjacent intensity levels share similar SC, BC, and EEI values. A single one-hot label may therefore impose an artificially sharp boundary on a physically continuous risk process.
To address this limitation, this study reformulates rockburst intensity prediction as an ordinal label distribution learning problem. The model outputs a probability distribution over the four ordered intensity levels:
where
denotes the predicted probability that sample i belongs to intensity level k. The final hard prediction can still be obtained from the maximum probability:
However, the predicted distribution is retained because it provides information about whether a sample is clearly associated with one intensity level or located near a transitional region between adjacent levels. A continuous ordinal risk score is further defined as:
where
ranges from 0 to 3. A larger
indicates a higher expected rockburst intensity. Compared with a single hard class label,
provides a smoother description of transitional rockburst risk.
Under this formulation, the objective is to learn a distributional prediction function:
This function is expected to satisfy three requirements: it should match the observed rockburst intensity labels, respect the ordinal relationship among intensity levels, and reduce sensitivity to source-specific data patterns. These requirements are addressed by the neighborhood-adaptive label distribution strategy and the source-invariant learning architecture described below.
3.2. Neighborhood-Adaptive Ordinal Label Distribution
The observed label provides the central intensity level of a sample, but it does not describe how close the sample is to adjacent levels. To represent this local ambiguity, the hard label is converted into a soft ordinal label distribution . The conversion is not fixed for all samples; instead, it adapts to the local neighborhood structure in the normalized feature space.
First, the input features are standardized using the mean and standard deviation estimated from the training set:
where
is the standardized feature vector, and
and
denote the training-set mean and standard deviation. Standardization is used only to compute local neighborhoods and to stabilize neural network training; it does not alter the physical meaning of SC, BC, and EEI.
For each sample, its K nearest neighbors in the standardized SC–BC–EEI space are identified and denoted as
. The local ambiguity degree is defined as:
where
is the number of K nearest neighbors in
that share the same intensity label as sample
. If most neighbors have the same intensity level as the target sample,
is small and the sample is treated as locally reliable. If the neighborhood contains multiple intensity levels, ρ
i becomes larger, indicating that the sample lies near a transitional boundary.
The smoothness of the target label distribution is then controlled by an adaptive bandwidth:
where
and
are the minimum and maximum bandwidths, respectively. A small
produces a sharp distribution close to the original hard label, whereas a large
generates a smoother distribution over adjacent intensity levels. The target ordinal label distribution is defined as:
where
is the target probability assigned to intensity level
. This construction ensures that the observed label
receives the highest probability, while adjacent levels receive smaller but non-zero probabilities according to their ordinal distance. Distant levels are strongly suppressed. Therefore, the generated target distribution preserves the observed label while avoiding an unrealistically sharp boundary in ambiguous regions.
This strategy differs from traditional label smoothing methods. Standard label smoothing applies a uniform smoothing intensity to all samples and typically treats all incorrect categories equally, underestimating the uncertainty of boundary samples and violating the ordered risk pattern of rockburst. This makes it difficult for the model to distinguish between clear samples and overlapping boundary samples during training, often leading to poor convergence. In contrast, this strategy features neighborhood adaptation and ordered perception, enabling boundary samples to receive more smoothly adjusted target labels. Probability mass is prioritized for adjacent intensity levels rather than distant ones, allowing the model to accurately characterize sample ambiguity during training, effectively suppressing high-risk cross-level misclassification, and yielding predictions that better align with gradual geological transitions.
Therefore, the adaptive strategy is intended to assign sharper target distributions to locally reliable samples and smoother adjacent-grade distributions to samples located in mixed-grade neighborhoods, which is more consistent with the transitional nature of rockburst intensity.
3.3. Source-Invariant Ordinal Learning Model
The prediction model consists of a feature encoder, an ordinal distribution prediction head, and a source-confusion branch. The feature encoder maps the standardized input vector into a latent representation:
where
denotes the encoder parameterized by
, and
is the learned latent representation. The ordinal prediction head maps
to the predicted intensity distribution:
where
is the ordinal prediction head parameterized by
. The softmax operation guarantees that the output probabilities are non-negative and sum to one.
To reduce source-dependent bias, a source-confusion branch is attached to the latent representation through a gradient reversal layer. The source prediction is given by:
where
(·) is the source classifier,
(·) is the gradient reversal layer with reversal strength
, and
is the predicted source distribution. During forward propagation, the gradient reversal layer acts as an identity mapping. During backpropagation, it reverses the gradient passed to the encoder. As a result, the source classifier is trained to distinguish the data source, whereas the encoder is encouraged to remove source-specific information from h
i.
The source-confusion branch is used only during training. During inference, only the encoder and the ordinal prediction head are retained. Therefore, the model does not require the source label of a new engineering sample when making a prediction.
The predicted ordinal distribution can be summarized by two outputs: a hard intensity label and a continuous risk score. The hard label is obtained using Equation (8), while the continuous score is computed using Equation (9). This dual-output form allows the model to retain compatibility with conventional four-level rockburst classification while providing additional information on transitional risk.
3.4. Training Objective and Prediction Output
The model is trained to match the neighborhood-adaptive ordinal target distribution while preserving the ordered structure of rockburst intensity and reducing source-specific information in the learned representation. The distribution matching loss is defined as the cross-entropy between the target distribution q
i and the predicted distribution
:
Although
encourages the predicted distribution to approximate the adaptive target distribution, it does not explicitly measure cumulative ordinal discrepancy. Therefore, an ordinal distance-sensitive loss is further introduced using cumulative class probabilities:
This loss penalizes severe cross-grade deviations more strongly than adjacent-level deviations, because errors that shift probability mass across several ordered levels lead to larger cumulative distribution differences.
The source-classification loss is defined as:
where
is the one-hot source indicator for sample
and source
. Due to the gradient reversal layer, minimizing
improves the source classifier but drives the encoder toward source-invariant representations.
The overall objective is written as:
where α and β control the relative contributions of the ordinal loss and the source-confusion loss. The gradient reversal layer determines how
affects the encoder parameters, so Equation (21) can be optimized using standard backpropagation.
After training, the model outputs an ordinal probability distribution for each sample. The final prediction consists of a hard intensity level and a continuous risk score:
where
is the predicted intensity level,
is the expected ordinal risk score, and
is the full four-level probability distribution. A sharply concentrated p
i indicates a relatively clear sample, whereas a distribution spread over adjacent levels indicates a transitional state. This output form is consistent with the diagnostic finding that rockburst intensity levels are ordered but partially overlapping.
In summary, the proposed method differs from conventional hard-label classifiers in three aspects. First, the target label is represented as a neighborhood-adaptive ordinal distribution rather than a one-hot vector. Second, the model is trained with ordinal distance-sensitive learning to reduce severe cross-grade errors. Third, source-invariant representation learning is used to improve robustness under heterogeneous data sources. These components jointly provide a compact ordinal and source-aware learning framework for rockburst intensity prediction using limited tabular data.
To further clarify the implementation sequence, the training procedure of SI-OLDL is summarized in Algorithm 1. Because the SC–BC–EEI features are fixed tabular variables, the neighborhood-adaptive target distributions are constructed once within each training split using only the training subset, rather than being updated with validation or test samples during training.
| Algorithm 1. Training procedure of the SI-OLDL framework |
Input: Training set , validation set , neighborhood size , bandwidth range and , loss weights and , gradient reversal coefficient , maximum epochs , early-stopping patience .
Output: Trained encoder and ordinal prediction head . Standardize SC, BC, and EEI using the mean and standard deviation estimated from . For each training sample , identify its nearest neighbors in the standardized SC–BC–EEI space within . Compute the local ambiguity degree according to the proportion of neighboring samples with different intensity labels. Compute the adaptive bandwidth using , , and . Generate the ordinal target distribution q_i by assigning the highest probability to the observed label and smaller probabilities to other labels according to ordinal distance. Initialize the feature encoder, ordinal prediction head, source-confusion branch, and gradient reversal layer. For each training epoch: Sample mini-batches from . Predict the ordinal probability distribution p_i and the source distribution . Compute the distribution matching loss, ordinal distance-sensitive loss, and source-classification loss. Optimize the total loss using backpropagation with gradient reversal. Evaluate the model on and apply early stopping according to validation performance.
Retain the encoder and ordinal prediction head for inference, and remove the source-confusion branch. For a new sample, output the predicted intensity level, continuous ordinal risk score, and full four-level probability distribution.
|
The differences between traditional hard label classification, standard label smoothing, ordinal label distribution learning, and the SI-OLDL framework presented in this paper are illustrated in
Table 4.
4. Experiments and Results
4.1. Experimental Setup
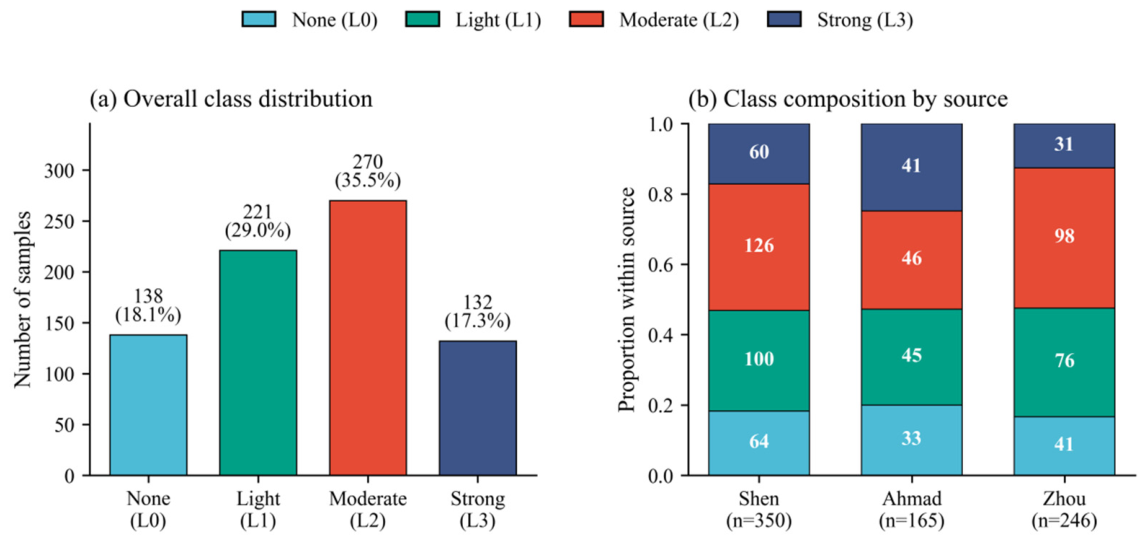
The experiments were designed to evaluate the proposed source-invariant ordinal label distribution learning framework from three perspectives: overall predictive performance, cross-source generalization, and the contribution of each methodological component. All experiments were conducted on the integrated 761-sample database described in
Section 2, using SC, BC, and EEI as input features and the four ordered rockburst intensity levels, L0–L3, as target labels.
Two validation protocols were adopted. First, repeated stratified random validation was used to evaluate general predictive performance under a conventional data-splitting setting. In each run, the database was divided into training, validation, and test subsets while preserving the class distribution. The training subset was used for model fitting and neighborhood-adaptive label distribution construction, the validation subset was used for early stopping and hyperparameter selection, and the test subset was used only for final performance evaluation. The ratio of training set, validation set, and test set is 6:2:2. Second, leave-one-source-out (LOSO) validation was used to assess cross-source generalization. In this protocol, one complete data source was held out as the test domain, while the other two sources were used for model training and validation. This procedure was repeated three times, with Shen et al. [
21], Ahmad et al. [
22], and Zhou et al. [
12] serving as the unseen source in turn. Compared with repeated random splitting, LOSO validation provides a stricter cross-source test because no sample from the held-out source is used during model training or hyperparameter selection. However, it should be regarded as an internal cross-source validation strategy based on available public datasets, rather than a full substitute for independent external validation using newly collected engineering cases.
To avoid information leakage, all preprocessing operations were performed strictly within each training split. Feature standardization was based only on the mean and standard deviation of the training subset, and the same transformation was then applied to the validation and test subsets. The neighborhood-adaptive soft labels were also constructed using only the training samples. Validation and test labels were used exclusively for performance evaluation and were not involved in neighborhood construction or label smoothing. In the proposed model, source labels were used only during training through the source-confusion branch. During inference, the model required only SC, BC, and EEI as input.
The proposed SI-OLDL model was compared with representative hard-label classifiers, including Logistic Regression, Support Vector Machine, K-Nearest Neighbors, Random Forest, XGBoost, and a standard Multilayer Perceptron. These baselines were selected to cover linear, margin-based, instance-based, ensemble-tree, and neural-network learning paradigms. In addition, several ablation variants were evaluated to isolate the effects of the proposed components. These variants included a hard-label Multilayer Perceptron (MLP), a fixed ordinal soft-label MLP, an adaptive ordinal label distribution learning model without source-invariant learning, a source-invariant MLP without adaptive ordinal labels, and the full SI-OLDL model.
Model performance was evaluated using both conventional classification metrics and ordinal error metrics. Accuracy, Macro-F1, and balanced accuracy were used to measure overall classification performance under class imbalance. Because rockburst intensity levels are ordered, additional metrics were introduced to quantify the severity of grade errors. The mean absolute grade error was used to measure the average distance between predicted and observed intensity levels. Quadratic weighted Kappa was used to evaluate ordinal agreement while penalizing larger grade deviations. Adjacent-grade accuracy was defined as the proportion of samples for which the predicted level differed from the observed level by no more than one grade. Severe misclassification rate was defined as the proportion of samples with a prediction error of two or more grades. These ordinal metrics are particularly important for evaluating whether a model reduces severe cross-level errors rather than merely improving nominal classification accuracy.
All neural models were trained using the Adam optimizer with early stopping based on the validation loss. To ensure the fairness of performance comparisons across different models and the rigor of the experimental conclusions, all baseline models involved in the comparison, together with the proposed SI-OLDL model, were subjected to a unified Bayesian hyperparameter optimization strategy. Under each data split corresponding to the respective validation method, all models were optimized based on exactly the same training and validation subsets, with the validation-set Macro-F1 adopted as the optimization objective, and the automatic hyperparameter search was conducted within the predefined search space of each model’s core hyperparameters. The search space covered the key structural parameters and training hyperparameters of each model, ensuring that all competing models could achieve their optimal performance. The entire hyperparameter optimization process was performed without any access to the test set information, strictly avoiding data leakage and thereby guaranteeing the fairness of cross-model performance comparisons as well as the reproducibility of the results. The experimental configuration is summarized in
Table 5.
Implementation Details and Parameter Settings
All experiments were implemented in Python 3.10 and conducted on a laptop equipped with an NVIDIA GeForce RTX 3050 Laptop GPU with 4 GB of graphics memory (NVIDIA Corporation, Santa Clara, CA, USA). To improve reproducibility, the main implementation details and parameter settings of SI-OLDL are summarized in
Table 4. Because the input space contains only three tabular geomechanical indicators—namely, SC, BC, and EEI—a compact Multilayer Perceptron was used to avoid over-parameterization under the small-sample setting. The encoder consisted of two fully connected layers with 64 and 32 hidden units, respectively, followed by ReLU activation. A dropout rate of 0.10 was applied after the first hidden layer. The ordinal prediction head was a linear layer with four output units followed by softmax activation, corresponding to the four ordered rockburst intensity levels. The source-confusion branch consisted of a hidden layer with 16 units and a final source-classification layer. During training, the gradient reversal coefficient was gradually increased during the first 50 epochs and then kept at its maximum value.
The main parameters listed in
Table 6 were selected according to preliminary validation performance and then kept fixed for all repeated runs under the same validation protocol. The final settings used in the random-validation and LOSO experiments were (K = 15), (
), (
), (
), (
), (
), learning rate (=
), weight decay (=
), batch size (=32), maximum epochs (=300), and early-stopping patience (=30). Validation Macro-F1 was used as the primary early-stopping criterion, with MAGE used as a secondary criterion when Macro-F1 values were nearly identical. The test set was never used for parameter selection. The combined-loss weights α and β were determined using validation-based hyperparameter tuning together with the other core SI-OLDL parameters. Validation Macro-F1 was used as the primary optimization objective, while MAGE was used as a secondary criterion to avoid parameter settings that improved nominal classification but increased ordinal deviation. The final values α = 1 and β = 0.1 were then fixed for all repeated runs under the corresponding validation protocol. To reduce the dependence on a single random split, all main experiments were repeated 20 times with different random seeds. The repeated random validation used seeds from 2026 to 2045, and the LOSO validation used seeds from 3026 to 3045.
Although an exhaustive grid search over all hyperparameters was not performed due to the limited sample size and the computational cost of repeated LOSO evaluation, the stability of the main conclusions was assessed through three complementary checks. First, all main results were reported as mean ± standard deviation over 20 repeated runs. Second, a LOSO protocol was used to test whether the model behavior was stable when an entire data source was held out. Third, an ablation study was used to isolate the effects of adaptive ordinal labels and source-invariant learning. Therefore, the reported performance does not rely on a single random split, a single source composition, or a single uncontrolled training run.
In addition, the main adaptive-label parameters were checked around the final setting to assess whether the model was overly sensitive to their values. The neighborhood size K controls the locality of ambiguity estimation: an excessively small K may make the estimated ambiguity unstable, whereas an excessively large K may weaken local boundary information by including samples from broader feature regions. The bandwidth parameters and control the sharpness range of the target label distribution. A very narrow bandwidth range makes the target labels close to hard labels, while an overly wide range may produce excessive smoothing across grades. In preliminary validation, the model showed stable performance when K and the bandwidth range were moderately varied around the final setting, and the final parameters were selected because they provided a favorable balance between preserving the observed label and representing adjacent-grade uncertainty.
4.2. Comparison with Baseline Models
The first set of experiments compared the proposed SI-OLDL model with representative baseline classifiers under repeated stratified random validation. This validation protocol evaluates within-distribution predictive performance, where training, validation, and test samples are drawn from the same integrated database while preserving the class distribution. The compared models include linear, margin-based, instance-based, ensemble-tree, gradient-boosting, and neural-network classifiers. All models were evaluated using the same data splits, preprocessing procedure, and test subsets.
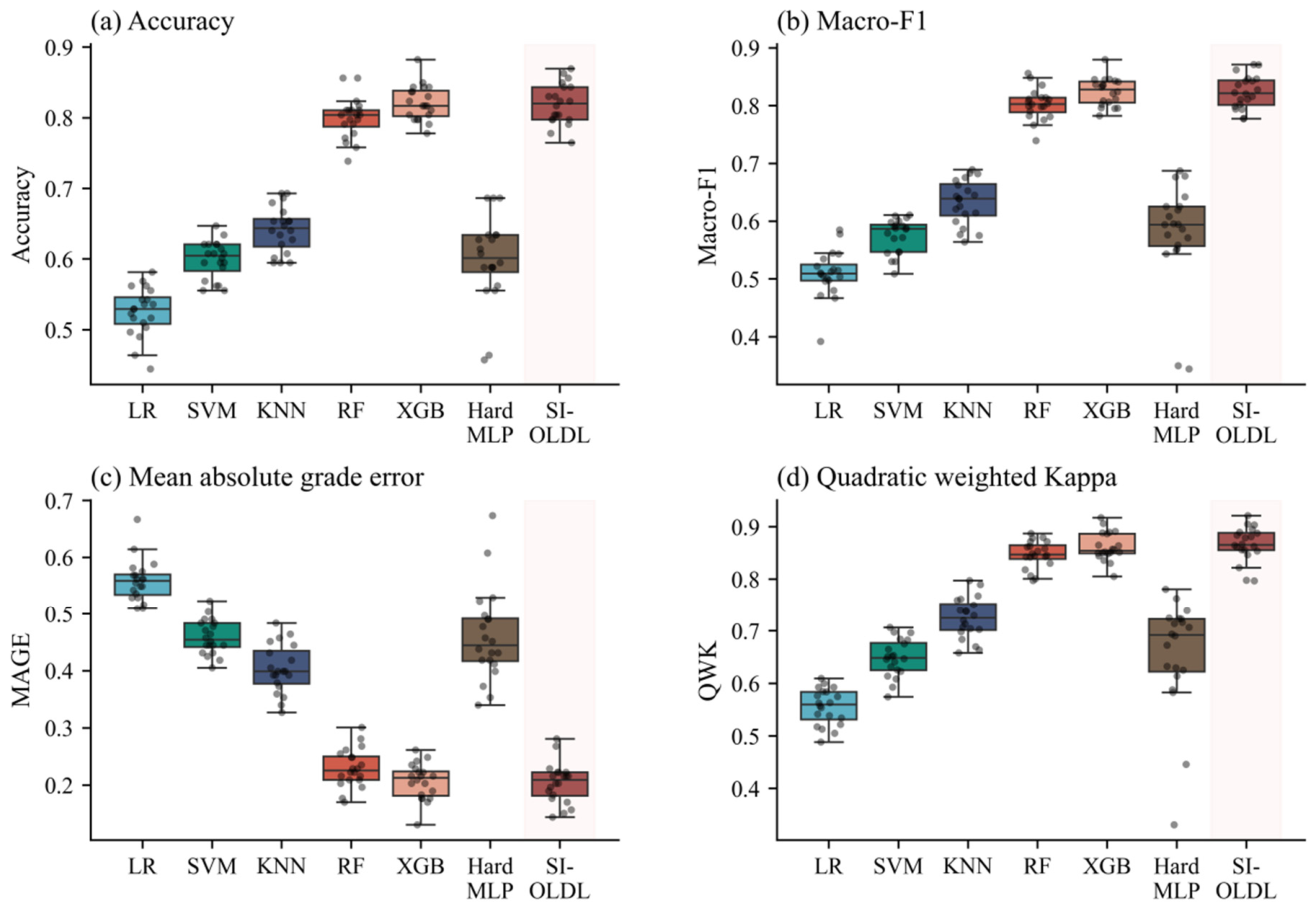
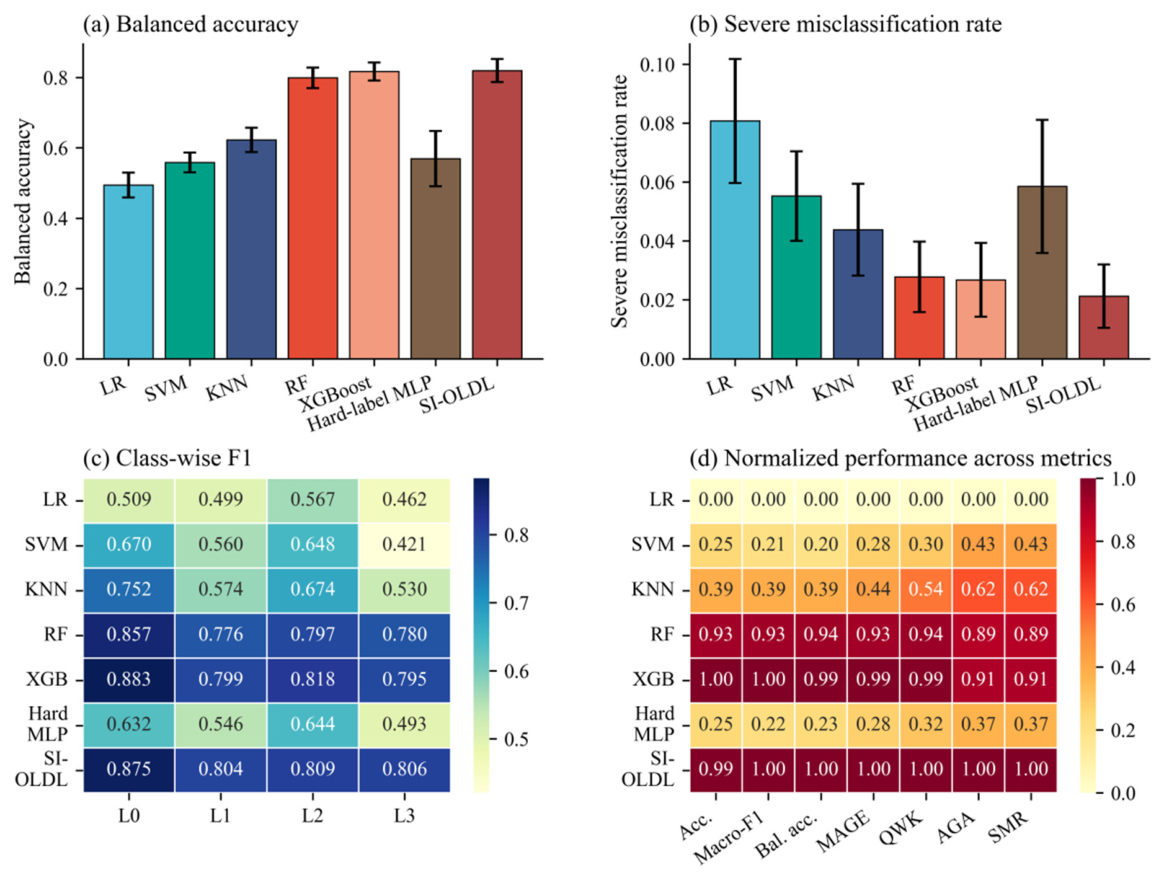
Table 7 reports the mean performance and standard deviation over 20 repeated stratified random splits. Logistic Regression (LR), Support Vector Machine (SVM), and K-Nearest Neighbors (KNN) showed relatively limited performance, indicating that simple linear, margin-based, or local instance-based decision rules were insufficient to fully capture the nonlinear relationship between SC, BC, EEI, and rockburst intensity. Random Forest (RF), XGBoost, and SI-OLDL substantially improved the prediction results, confirming that nonlinear ensemble methods and ordinal distribution learning are more suitable for tabular rockburst intensity classification. Among the conventional baselines, XGBoost achieved the strongest overall performance, with the highest balanced accuracy and the best ordinal error metrics, including the lowest MAGE and SMR and the highest QWK and AGA.
The proposed SI-OLDL model achieved the highest Accuracy and Macro-F1 among all compared models, with values of 0.821 ± 0.025 and 0.824 ± 0.024, respectively. However, the differences between SI-OLDL and XGBoost under repeated random validation were very small. XGBoost achieved an Accuracy of 0.819 ± 0.029 and a Macro-F1 of 0.823 ± 0.028, and it remained slightly better in several ordinal-error metrics, including MAGE, QWK, AGA, and SMR. Therefore, the random-validation results should be interpreted as comparable performance relative to a strong tree-based baseline, rather than as evidence of a statistically verified or practically decisive advantage of SI-OLDL. From an engineering perspective, such small differences under within-database random validation are unlikely to produce meaningful benefits by themselves. The main value of SI-OLDL should therefore be evaluated together with its ordinal label representation, error structure, and cross-source performance.
Compared with the hard-label MLP, SI-OLDL showed a substantial improvement across all evaluation metrics. Accuracy increased from 0.599 to 0.821, Macro-F1 increased from 0.579 to 0.824, and balanced accuracy increased from 0.569 to 0.818. Meanwhile, MAGE decreased from 0.460 to 0.206, QWK increased from 0.655 to 0.862, AGA increased from 0.942 to 0.973, and SMR decreased from 0.058 to 0.027. These improvements demonstrate that replacing one-hot hard labels with neighborhood-adaptive ordinal label distributions can significantly enhance neural-network learning under heterogeneous small-sample conditions, particularly by improving class recognition stability and reducing ordinal prediction errors.
Figure 4 further illustrates the distribution of the main performance metrics across repeated runs. SI-OLDL achieved consistently high accuracy and Macro-F1, with performance comparable to or slightly better than the strongest ensemble baseline. In terms of ordinal metrics, SI-OLDL obtained a low MAGE and a high QWK, both close to the best values achieved by XGBoost. This suggests that the proposed model does not merely improve nominal classification accuracy; it also maintains strong ordinal consistency by reducing large deviations between predicted and observed intensity levels.
Figure 5 provides additional insight into balanced accuracy, severe misclassification, class-wise F1, and normalized multi-metric performance. The class-wise F1 heatmap shows that SI-OLDL achieved consistently high recognition performance across all four intensity levels, with particularly strong F1 scores for L1 and L3. Its severe misclassification rate was also close to the lowest value among all models, indicating that the model effectively suppressed cross-grade errors. The normalized performance heatmap further confirms that SI-OLDL provided one of the most balanced overall performances across both conventional and ordinal metrics.
Overall, the random-validation results should be interpreted from the perspective of model behavior rather than only from metric ranking. XGBoost remained a very strong baseline for this small tabular dataset because tree-based ensembles can effectively capture nonlinear threshold-like relationships among SC, BC, and EEI. SI-OLDL did not show a decisive advantage over XGBoost under random validation, but it achieved comparable predictive performance while providing an ordinal probability distribution rather than only a hard class output. This indicates that the main benefit of SI-OLDL under within-database validation is not a large nominal accuracy gain, but its ability to represent adjacent-grade uncertainty in a structured form. This property provides the basis for examining whether the ordinal and source-aware representation remains useful under stricter cross-source testing.
4.3. Cross-Source Generalization
Although repeated stratified random validation provides a useful estimate of within-distribution predictive performance, it does not fully evaluate whether a model can generalize to an unseen data source. Because the integrated database was assembled from three studies with different feature and label distributions, a model may perform well under random splitting by learning source-specific patterns shared between the training and test subsets. Therefore, leave-one-source-out validation was conducted to evaluate cross-source generalization more strictly. In each setting, one complete source dataset was held out as the test domain, while the remaining two sources were used for model training and validation.
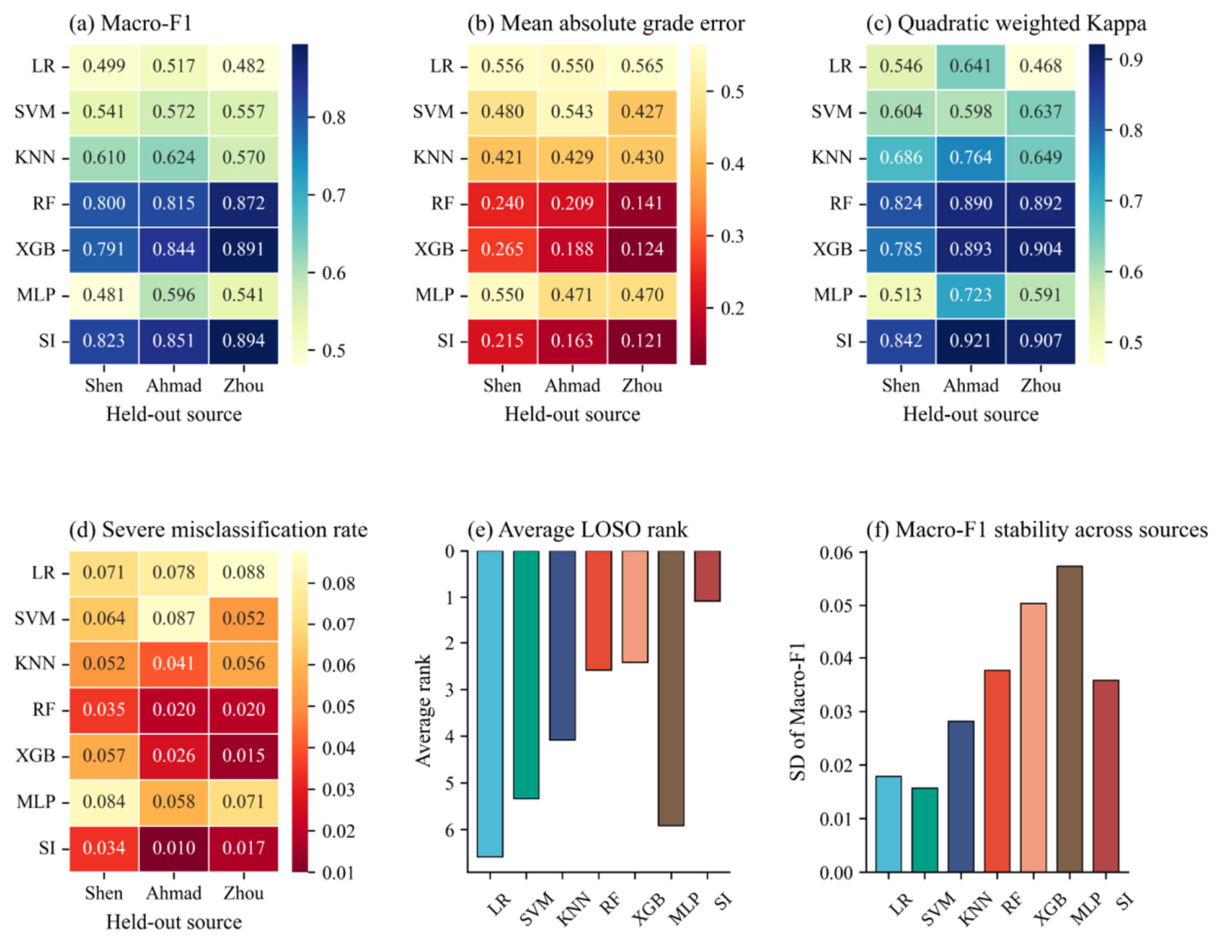
Table 8 summarizes the leave-one-source-out results. SI-OLDL achieved the highest average Macro-F1 among all models, reaching 0.856, followed by XGBoost and RF. More importantly, SI-OLDL also obtained the best average ordinal metrics, with the lowest MAGE of 0.166, the highest QWK of 0.890, and the lowest SMR of 0.020. Compared with XGBoost, SI-OLDL increased the average Macro-F1 from 0.842 to 0.856, reduced MAGE from 0.192 to 0.166, increased QWK from 0.861 to 0.890, and reduced SMR from 0.032 to 0.020. These differences are reported as descriptive comparisons within the tested benchmark and should not be interpreted as statistically verified superiority. Nevertheless, the reductions in MAGE and SMR have clearer engineering relevance than the very small differences observed under random validation, because they indicate fewer large ordinal deviations and fewer severe cross-grade errors under unseen-source testing. In preliminary rockburst risk assessment, reducing severe grade errors is important because underestimation or overestimation by two or more intensity levels may lead to inappropriate monitoring priorities or support-related decisions. Therefore, the LOSO results provide auxiliary evidence that SI-OLDL improves cross-source ordinal robustness, although they should not be interpreted as proof that the model can independently support site-specific engineering decisions.
The source-wise results further show that SI-OLDL performed consistently across the three held-out datasets. When Shen et al. [
21] was held out, SI-OLDL achieved a Macro-F1 of 0.823, outperforming RF and XGBoost. When Ahmad et al. [
22] was held out, SI-OLDL reached a Macro-F1 of 0.851 and produced the lowest MAGE and SMR. When Zhou et al. [
12] was held out, SI-OLDL achieved the highest Macro-F1 of 0.894 and the lowest MAGE of 0.121. This consistency suggests that the model learned transferable ordinal risk patterns rather than relying only on source-specific decision boundaries.
Figure 6 provides a more detailed comparison of the LOSO results. The heatmaps show that SI-OLDL maintained strong performance across Macro-F1, MAGE, QWK, and SMR for all three held-out sources. RF and XGBoost also showed strong cross-source performance, but SI-OLDL achieved the best overall average rank and the most favorable combination of high Macro-F1, low MAGE, high QWK, and low SMR. This result supports the effectiveness of combining neighborhood-adaptive ordinal label distributions with source-invariant representation learning.
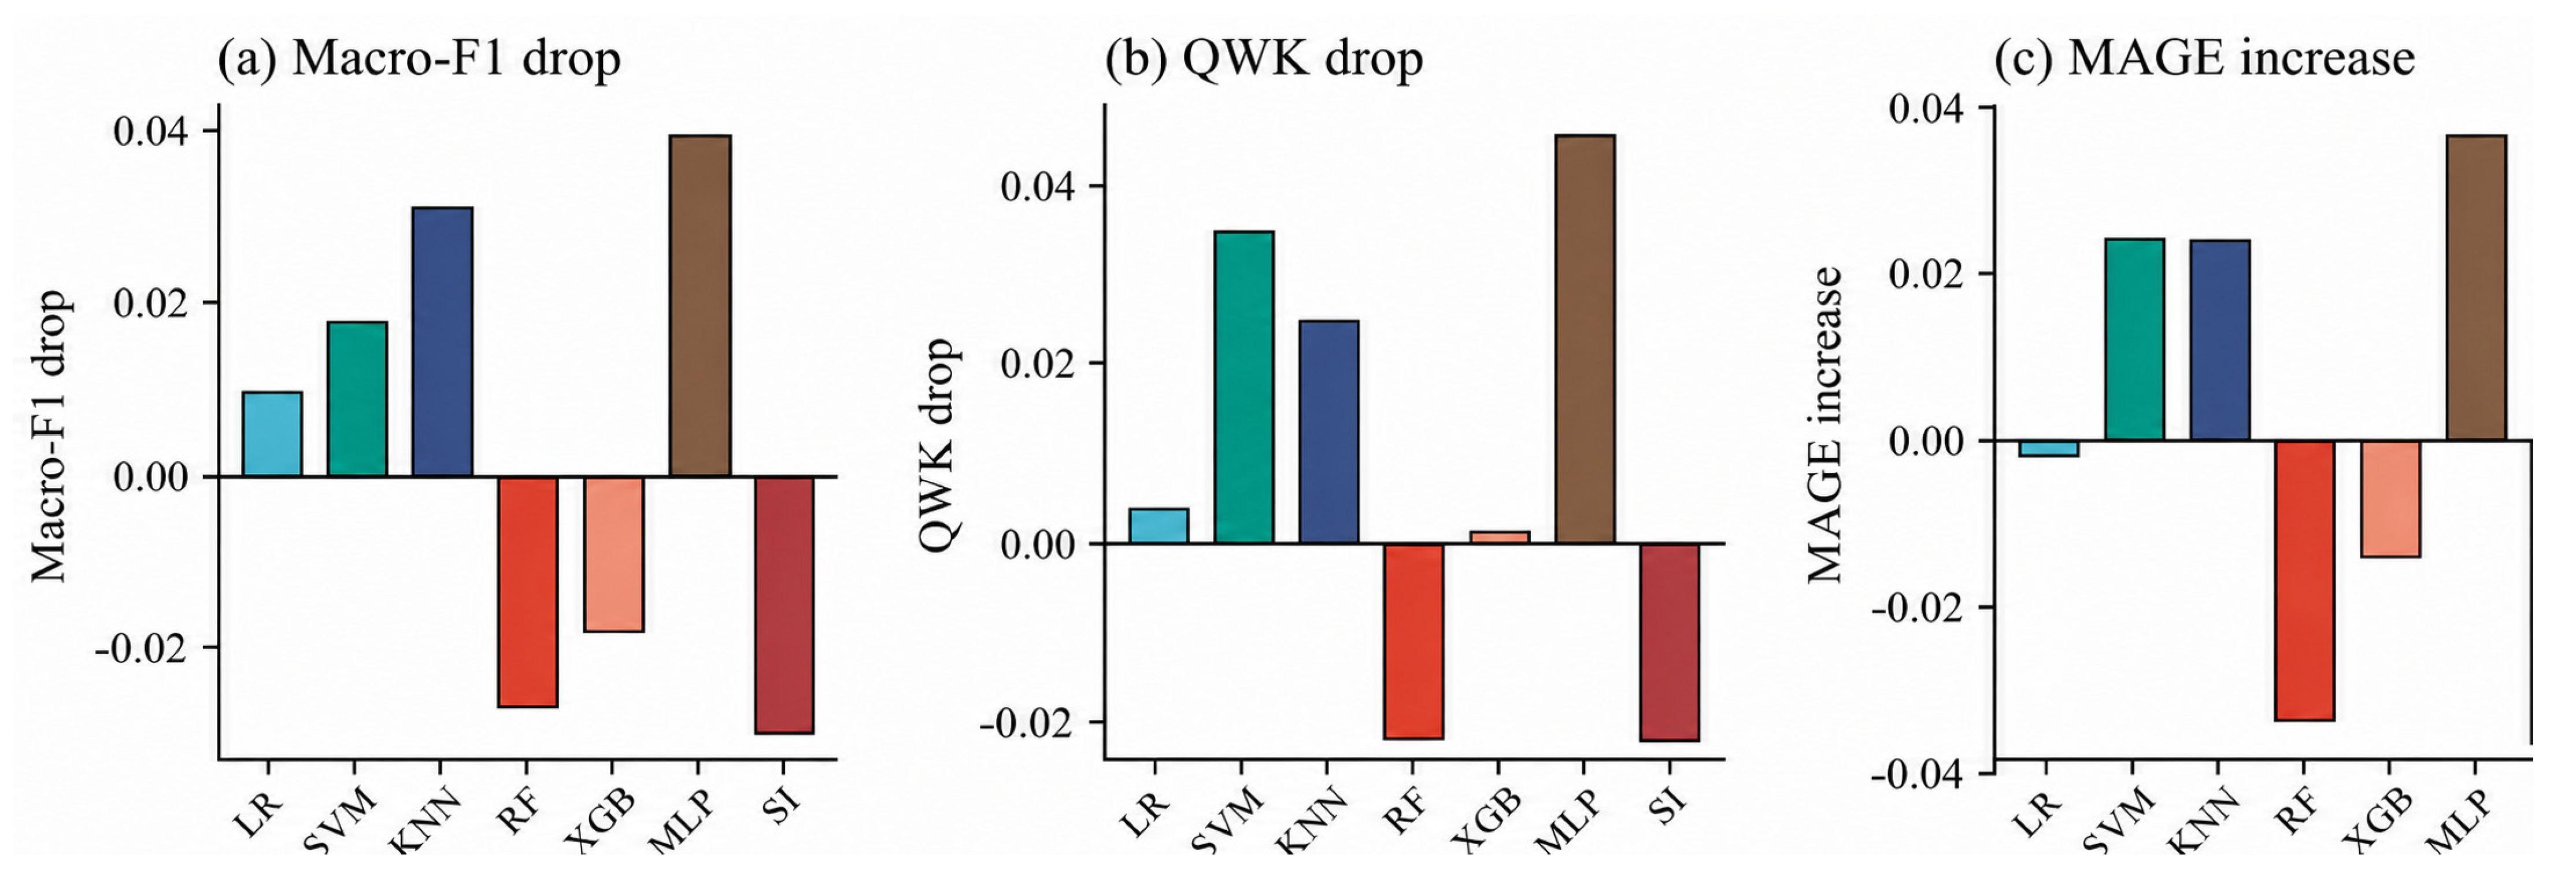
Figure 7 compares the performance shift between repeated random validation and leave-one-source-out validation. Several baseline models showed positive Macro-F1 or QWK drops, indicating performance degradation when evaluated on unseen sources. In contrast, SI-OLDL exhibited a negative Macro-F1 drop and a negative MAGE increase, meaning that its average LOSO performance was not degraded relative to random validation. This finding further indicates that the proposed source-invariant learning strategy improved robustness under source shifts.
Overall, the cross-source results suggest that the benefit of SI-OLDL becomes more visible when the test samples come from an unseen source rather than from the same mixed database. This behavior is consistent with the design of the framework. The neighborhood-adaptive ordinal labels reduce the rigidity of one-hot supervision in overlapping adjacent-grade regions, while the source-confusion branch discourages the encoder from relying excessively on source-specific feature patterns. As a result, the model is less dependent on sharp source-specific decision boundaries and tends to preserve the ordered relationship among rockburst grades under LOSO testing. These results should be interpreted as benchmark-level evidence of improved source-aware ordinal robustness, rather than as proof of universal cross-project generalization.
4.4. Ablation Study and Error Analysis
To further clarify the contribution of each component in the proposed framework, ablation experiments were conducted under the leave-one-source-out validation protocol. Five neural variants were compared: hard-label MLP, fixed soft-label MLP, adaptive OLDL, source-invariant MLP, and the full SI-OLDL model. The hard-label MLP used conventional one-hot labels and did not include source-invariant learning. The fixed soft-label MLP replaced one-hot labels with a globally fixed ordinal soft-label distribution. Adaptive OLDL further introduced neighborhood-adaptive ordinal label distributions, while source-invariant MLP retained hard labels but used the source-confusion branch. The full SI-OLDL model combined neighborhood-adaptive ordinal label distribution learning with source-invariant representation learning.
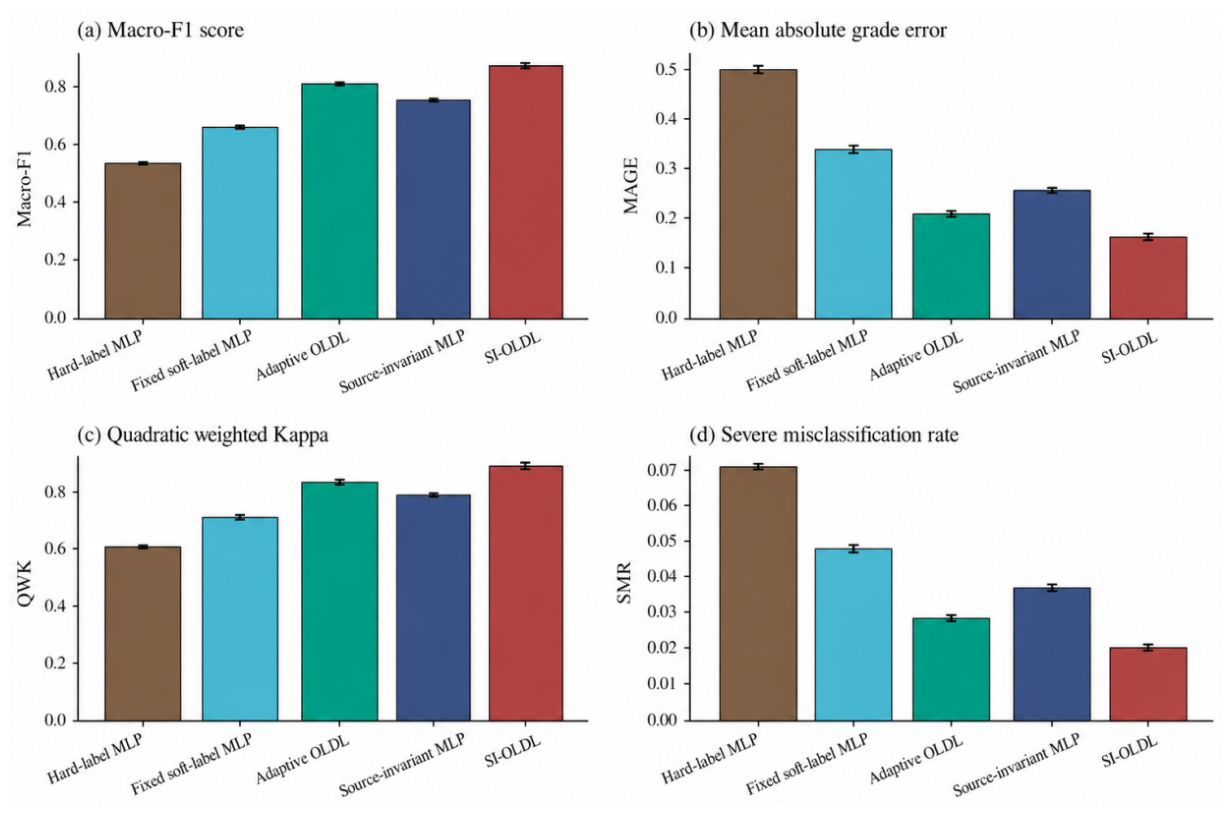
Table 9 summarizes the ablation results. The hard-label MLP produced the weakest performance, with a Macro-F1 of 0.539, an MAGE of 0.496, a QWK of 0.605, and an SMR of 0.071. Replacing one-hot labels with fixed ordinal soft labels improved Macro-F1 to 0.650 and reduced MAGE to 0.340, indicating that ordinal soft labels can partially alleviate the overly rigid class boundaries imposed by hard-label learning. When the smoothing strength was further adapted to the local neighborhood structure, Adaptive OLDL achieved a much higher Macro-F1 of 0.804, a lower MAGE of 0.207, and a higher QWK of 0.827. This result confirms that sample-dependent label smoothing is more suitable than globally fixed smoothing for representing locally ambiguous rockburst intensity samples.
The ablation results provide further insight into why the full framework performs more stably than the hard-label neural baseline. Fixed ordinal soft labels already improve the learning target by recognizing that adjacent rockburst grades are more similar than distant grades. The adaptive OLDL variant further improves this idea by making the smoothing strength sample-dependent: samples located in mixed-grade neighborhoods receive smoother targets, whereas locally consistent samples retain sharper targets. This explains why adaptive OLDL is more effective than globally fixed smoothing. Source-invariant learning addresses a different aspect of the problem by reducing the tendency of the encoder to rely on source-specific feature patterns. However, source-invariant learning alone cannot fully resolve adjacent-grade ambiguity. The full SI-OLDL model combines these two mechanisms, suggesting that label ambiguity and source heterogeneity are both relevant to the present heterogeneous SC–BC–EEI database.
Figure 8 visualizes the ablation results across four representative metrics. The performance trend is consistent across Macro-F1, MAGE, QWK, and SMR. Fixed soft-label learning improved over hard-label learning, adaptive ordinal label distribution learning provided a larger improvement, and the full SI-OLDL model achieved the strongest overall performance. The reduction in MAGE and SMR is particularly important because it shows that the proposed method does not merely increase nominal classification accuracy but also reduces ordinal prediction deviations and severe cross-grade errors. This supports the methodological motivation that rockburst intensity should be modeled as an ordered and transitional risk state rather than as a set of independent nominal classes.
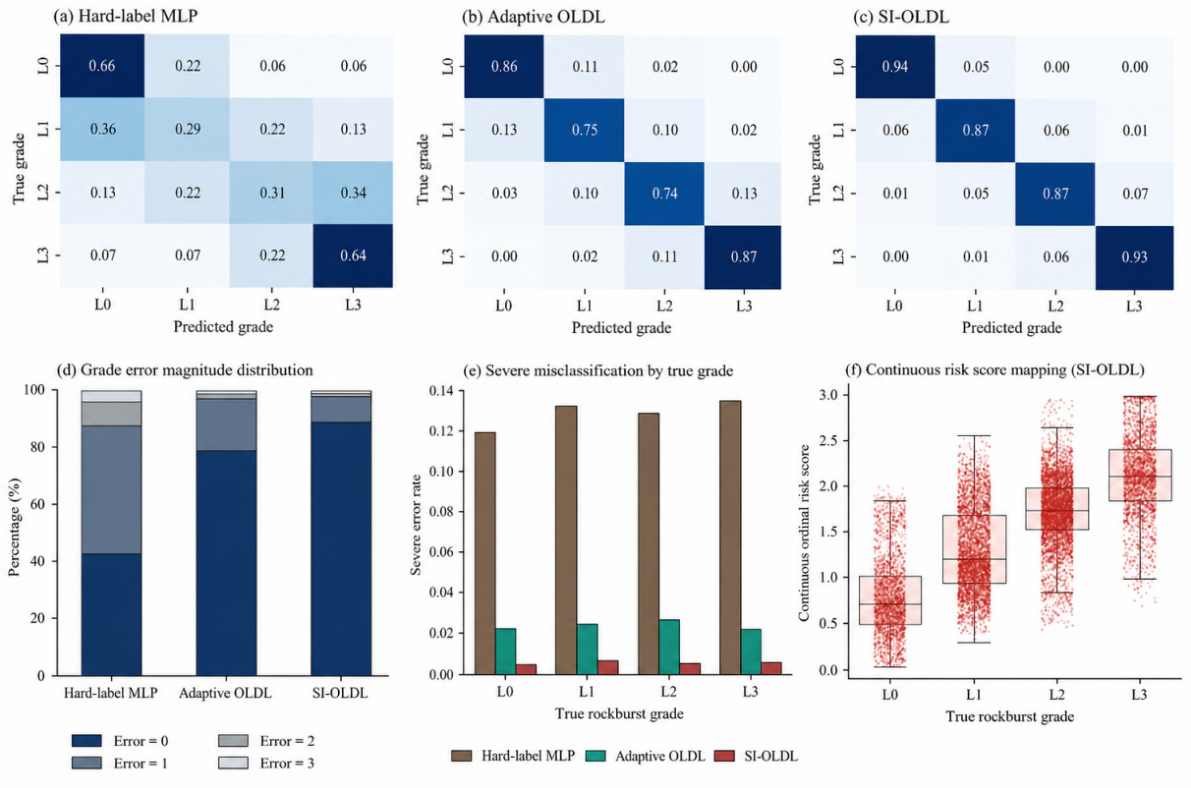
Figure 9 further analyzes the error structure of the representative neural variants. The row-normalized confusion matrices show that the hard-label MLP suffered from substantial confusion among adjacent and non-adjacent intensity levels, especially for L1 and L2. Adaptive OLDL improved the diagonal dominance of the confusion matrix and reduced off-diagonal errors. SI-OLDL further strengthened this pattern, with diagonal proportions of 0.94, 0.87, 0.87, and 0.93 for L0, L1, L2, and L3, respectively. This indicates that the full model produced more reliable predictions across all four intensity levels.
The grade-error distribution in
Figure 9d shows that SI-OLDL greatly increased the proportion of exact predictions and reduced the proportion of large grade deviations. The severe misclassification analysis in
Figure 9e further confirms that severe cross-grade errors were substantially suppressed for all true intensity levels. Compared with the hard-label MLP, both Adaptive OLDL and SI-OLDL reduced severe errors, but SI-OLDL achieved the lowest severe misclassification rate overall. Therefore, the proposed framework improves not only the number of correct predictions but also the ordinal structure of the remaining errors.
The continuous risk score predicted by SI-OLDL also shows a clear monotonic relationship with the true rockburst intensity level. As shown in
Figure 9f, the distribution of the ordinal risk score increases progressively from L0 to L3. This result demonstrates that the probability distribution output of SI-OLDL contains meaningful ordinal information beyond the final hard class label. In engineering terms, such a continuous score can provide a smoother indication of transitional rockburst risk, especially for samples located near boundaries between adjacent intensity levels.
4.5. Comparison with the Original Source-Dataset Studies
Since the integrated database used in this study was constructed from the datasets of Zhou et al. [
12], Ahmad et al. [
22], and Shen et al. [
21], a focused comparison with these three original source-dataset studies is necessary to clarify the methodological positioning of the proposed framework. The purpose of this comparison is not to rank the models solely by reported accuracy, because the source studies used different sample sizes, feature systems, preprocessing strategies, balancing methods, and validation protocols. Instead, the comparison aims to show how the present study extends the existing single-source hard-label classification studies toward heterogeneous multi-source ordinal risk modeling.
Table 10 summarizes the main differences between the present study and the three original source-dataset studies. Zhou et al. [
12] examined 246 rockburst cases using ten categories of supervised-learning methods and showed that ensemble models, especially Random Forest (RF) and Gradient Boosting Machine (GBM), achieved the best overall performance among the compared classifiers. Their work provided an important benchmark for machine learning-based rockburst classification and demonstrated the feasibility of using supervised learning for nonlinear rockburst intensity assessment. However, the main task remained conventional hard-label classification, and source-dependent heterogeneity was not explicitly evaluated.
Ahmad et al. [
22] further evaluated J48 and random tree models using 165 rockburst cases and reported high test accuracy under a small hold-out testing set. Their results indicated that tree-based models can achieve strong performance and provide relatively transparent decision rules for engineering use. Nevertheless, the testing set contained only 28 samples, and the evaluation was conducted within a single dataset. Therefore, although the reported accuracy was high, the study did not directly examine whether the trained model could generalize across independent literature sources with different feature distributions and label compositions.
Shen et al. [
21] developed an interpretable Optuna–Random Forest model based on 350 rockburst samples. Their study incorporated isolation forest for outlier processing, SMOTE for class balancing, Optuna for hyperparameter optimization, and SHAP for model interpretation. This framework achieved strong prediction performance and improved model interpretability. Compared with Shen et al. [
21] the present study uses the same three sparse indicators—namely, SC, BC, and EEI—but retains the heterogeneous structure of three literature sources and focuses on ordinal label ambiguity and cross-source generalization rather than single-source performance optimization after data cleaning and balancing.
Compared with the three source-dataset studies, the main contribution of the present work is therefore different. This study does not aim to replace the best single-source classifiers under ordinary random or hold-out validation. Instead, it integrates the three source datasets into a 761-sample heterogeneous database and explicitly diagnoses adjacent-grade overlap and source-dependent distribution shifts. Under repeated stratified random validation, SI-OLDL achieved an accuracy of 0.821 and a Macro-F1 of 0.824, showing performance comparable to XGBoost. More importantly, under leave-one-source-out validation, SI-OLDL achieved an average Macro-F1 of 0.856, MAGE of 0.166, QWK of 0.890, and SMR of 0.020. These results indicate that the proposed framework is particularly useful when rockburst intensity prediction is formulated as an ordinal and source-aware learning problem rather than as a conventional single-source hard-label classification task.
5. Discussion
Before discussing the physical and methodological implications of the proposed framework, it is necessary to interpret the comparison with XGBoost objectively. Under repeated stratified random validation, SI-OLDL achieved slightly higher Accuracy and Macro-F1 than XGBoost, whereas XGBoost showed comparable or slightly better performance in several ordinal-error metrics. Therefore, the improvement of SI-OLDL under random validation should not be interpreted as an overwhelming accuracy advantage. This result is reasonable because tree-based ensemble models are particularly effective for small tabular geomechanical datasets and have also shown strong performance in the original source-dataset studies. For example, Zhou et al. [
12] identified RF and GBM as strong supervised-learning models, Ahmad et al. [
22] reported high test accuracy using decision-tree-based models, and Shen et al. [
21] further demonstrated the strong performance of an optimized random forest model. Recent rockburst prediction studies based on ensemble learning, Bayesian optimization, model interpretation, and deep-learning architectures have also shown that advanced machine learning models can achieve strong nominal classification performance under conventional validation settings [
14,
20,
21]. Therefore, the present study should not be viewed as simply replacing these state-of-the-art hard-label classifiers. Instead, its main value lies in testing whether ordinal distributional labels and source-aware training are useful for heterogeneous SC–BC–EEI benchmark data. This interpretation is descriptively supported by the leave-one-source-out results within the present benchmark, where SI-OLDL showed more favorable average ordinal performance than XGBoost. These observations do not prove a physically source-invariant latent representation, but they suggest that reducing source-specific dependence may be beneficial for literature-compiled rockburst databases with observable source shifts.
5.1. Rockburst Intensity as an Ordinal Risk Continuum Rather than Hard Classes
A key implication of this study is that rockburst intensity should not be treated simply as a nominal four-class classification problem. Although the available labels are expressed as discrete levels, namely, L0, L1, L2, and L3, these levels represent ordered stages of an underlying risk process rather than four independent categories. From a physical perspective, the transition from no rockburst to strong rockburst is governed by the progressive accumulation and release of elastic strain energy under high stress, brittle failure conditions, and excavation-induced disturbance. Therefore, the boundaries between adjacent intensity levels are unlikely to be sharply separated in the SC–BC–EEI feature space.
This interpretation is supported by the diagnostic results in
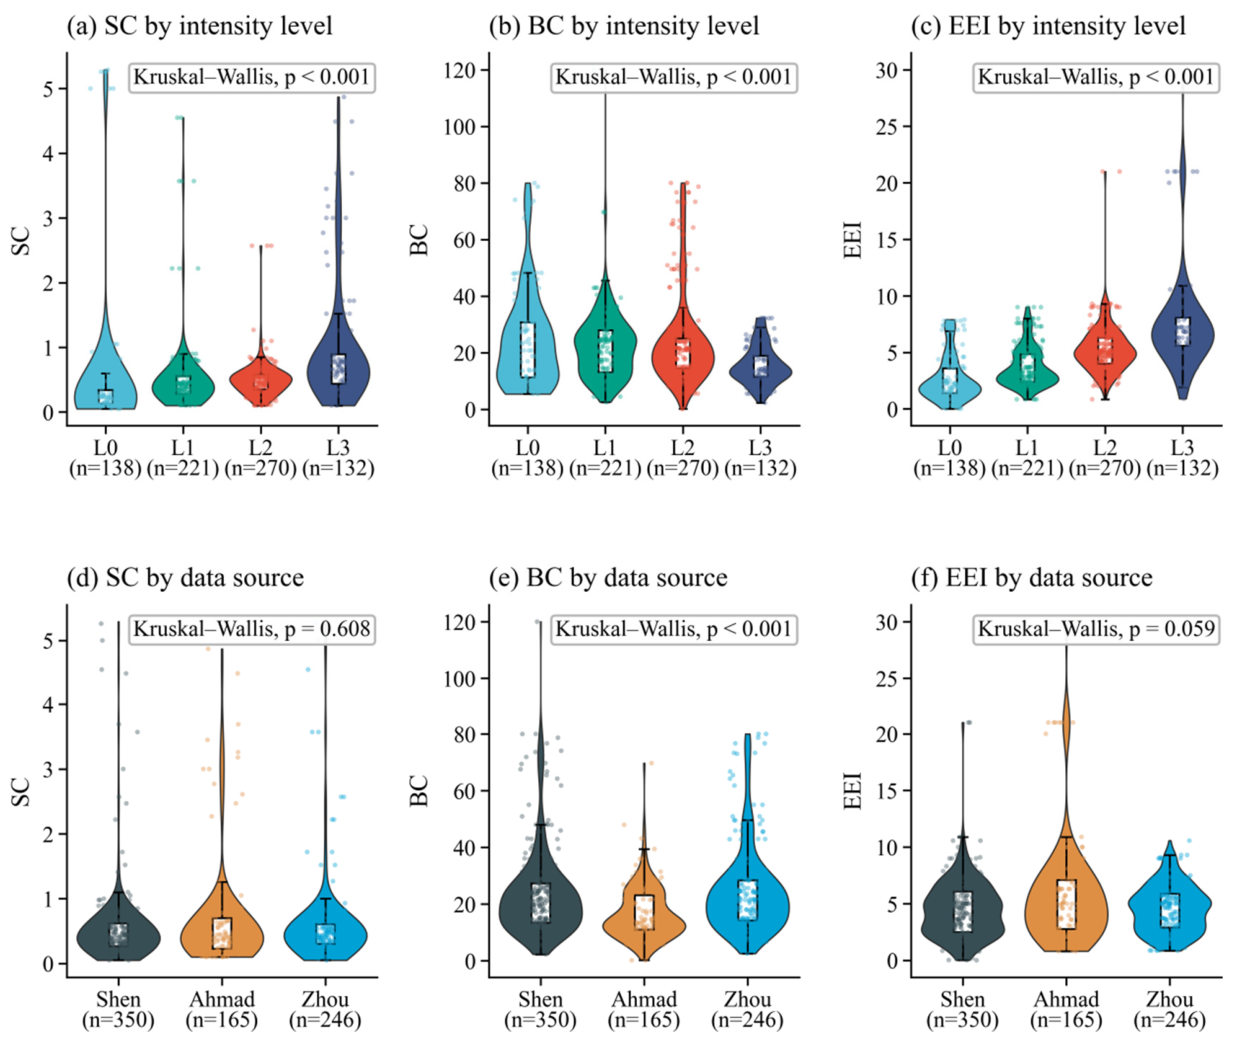
Section 2. As shown in
Figure 2 and
Table 2, SC, BC, and EEI exhibit statistically significant differences among intensity levels, but their adjacent-level distributions remain highly overlapping. For example, the overlap coefficients between neighboring levels are substantial for all three indicators, especially for BC. This indicates that samples with similar geomechanical indicator values may be assigned to different adjacent rockburst grades. Such overlap is not merely a statistical inconvenience; it reflects the limited ability of three static indicators to fully describe the complex transition from stable rock conditions to dynamic rockburst failure.
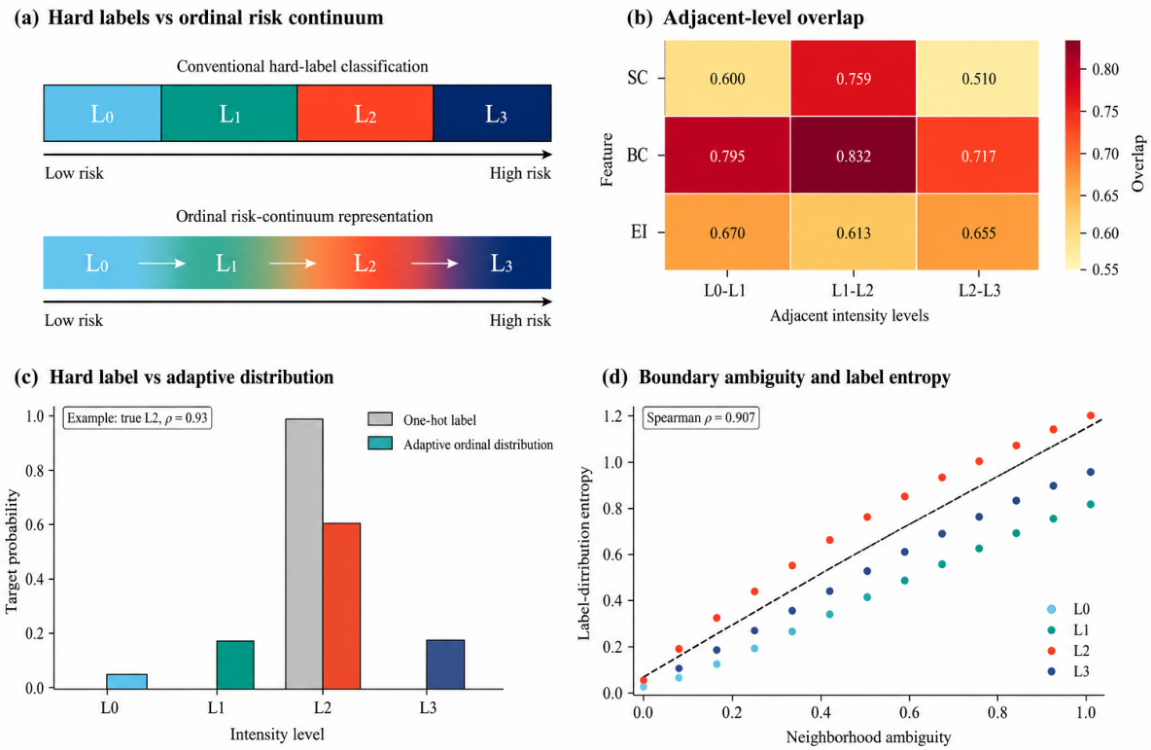
Figure 10 summarizes why an ordinal distributional representation is more appropriate than conventional hard labels. A sample labeled as L2 may still be close to L1 or L3 in the feature space, especially when its local neighborhood contains mixed adjacent grades. In this case, a one-hot label such as [0, 0, 1, 0] overstates the certainty of the observed label and penalizes neighboring grades as severely as distant grades.
The ordinal label distribution used in this study provides a more realistic learning target. As illustrated in
Figure 10c, a boundary sample with an observed L2 label is no longer represented as a rigid one-hot vector. Instead, its target distribution still peaks at L2 but retains probability mass for L1 and L3. This design is consistent with the fact that adjacent grades are more physically related than distant grades. Therefore, predicting an L2 sample as L1 or L3 should not be treated as equally severe as predicting it as L0.
More importantly, the proposed label distribution is not a fixed smoothing operation applied uniformly to all samples.
Figure 10d shows that the entropy of the adaptive label distribution increases with local neighborhood ambiguity. Samples surrounded mainly by the same intensity level receive sharper target distributions, whereas samples located in mixed-grade neighborhoods receive smoother distributions. This behavior allows the model to distinguish between clear samples and transitional samples. In other words, the target label becomes more certain when the local evidence is consistent and more uncertain when the local evidence indicates an ambiguous boundary state.
The experimental results further confirm the value of this representation. In the ablation study, replacing one-hot hard labels with fixed ordinal soft labels improved the hard-label MLP, indicating that even simple ordinal smoothing is more suitable than treating the four grades as independent classes. Adaptive OLDL produced a larger improvement, showing that sample-dependent smoothing better reflects the local ambiguity of rockburst labels. The full SI-OLDL model further reduced MAGE and SMR while improving QWK, indicating that the proposed representation improves not only classification performance but also ordinal consistency.
Therefore, ordinal label distribution learning transforms the classification problem with fixed boundaries into an ordered risk continuum modeling problem, making the rockburst data based on sparse indicators more consistent with their physical and statistical characteristics: labels have an ordered hierarchy, with transitions between adjacent levels, and existing static indicators cannot fully distinguish all risk states. Because of this, compared to traditional hard labels, ordinal label distribution can provide a more reasonable and reliable data representation method for rockburst intensity prediction.
From the perspective of rock mechanics, rockburst is a dynamic instability process related to the accumulation and sudden release of elastic strain energy in brittle rock masses under high-stress conditions. The four-level intensity classification used in engineering practice can be regarded as a discretized description of an underlying continuous risk evolution process. Therefore, adjacent intensity levels are unlikely to have completely sharp physical boundaries, especially when only three static indicators, SC, BC, and EEI, are available. The overlap among adjacent levels in the feature space should not be interpreted solely as statistical noise; it may also reflect the progressive and transitional nature of rockburst development under limited indicator conditions. The neighborhood-adaptive ordinal label distribution provides a data-driven way to approximate this transitional uncertainty. Boundary samples located in overlapping feature regions can receive smoother target distributions, whereas clearer samples can retain sharper distributions. In this way, the proposed representation avoids imposing unrealistically rigid boundaries between physically related adjacent grades.
For practical engineering applications, the continuous ordinal risk score and the full probability distribution should be interpreted as auxiliary risk information rather than as direct support-design instructions. A risk score located between two adjacent levels indicates that the sample may lie in a transitional region of the SC–BC–EEI feature space. The corresponding probability distribution can further show whether the prediction is concentrated in one grade or dispersed over adjacent grades. Such information may help engineers identify boundary samples, prioritize cases requiring additional checking, and reserve appropriate safety margins during preliminary risk zoning. However, final engineering decisions should not be made solely from the model output. They should be combined with site-specific geological investigation, excavation conditions, support design requirements, stress monitoring, microseismic observations, and expert judgment.
5.2. Dataset Shift and Cross-Source Generalization in Literature-Compiled Rockburst Databases
Another important issue revealed by this study is that a literature-compiled rockburst database should not be regarded as a single independent and identically distributed sample pool. Although all samples are described using the same three indicators—namely, SC, BC, and EEI—they were collected from different studies, engineering contexts, screening criteria, and labeling procedures. Therefore, the integrated database contains not only rockburst intensity information, but also source-dependent distributional characteristics. Ignoring this source structure may lead to an overly optimistic assessment of model robustness.
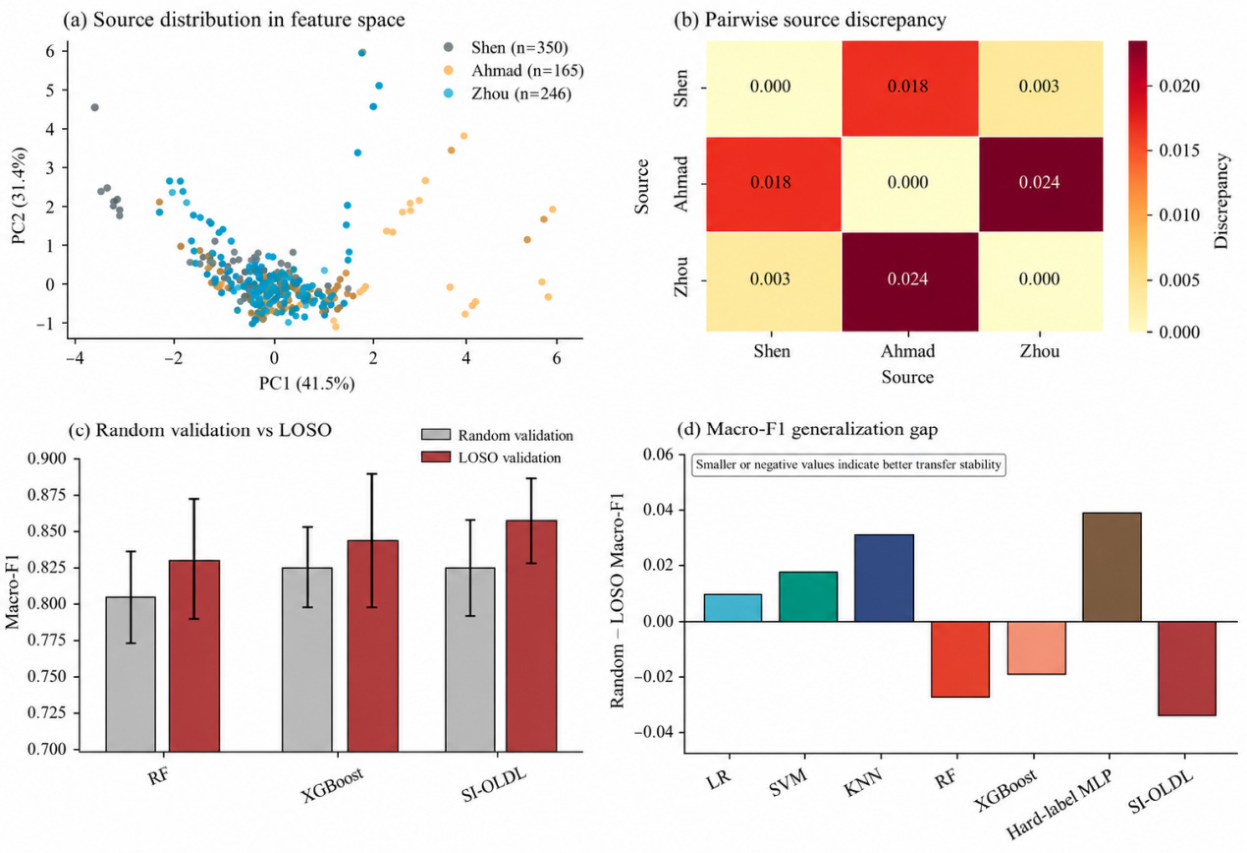
Figure 11a shows the PCA projection of the standardized SC–BC–EEI feature space. The three data sources partly overlap in the central region, suggesting that they share a common geomechanical feature space. However, the source distributions are not completely identical. Ahmad and Zhou contain more samples extending toward the positive direction of PC1, whereas Shen is more concentrated around the central region with several distinct outlying samples. This pattern indicates that the integrated dataset contains both shared information and source-specific distributional characteristics.
The pairwise MMD results in
Figure 11b further quantify this source discrepancy. The largest discrepancy appears between Ahmad and Zhou, whereas Shen and Zhou show the smallest discrepancy. This confirms that the three datasets are not simply random subsets drawn from the same underlying distribution. Instead, they should be interpreted as multiple source domains. In this context, a model trained and tested by repeated random splitting may benefit from source overlap between the training and test subsets. Such validation evaluates within-distribution fitting ability, but it does not fully test whether the model can generalize to a new engineering or literature source.
This distinction is important for rockburst prediction. In practical applications, a model is often expected to be transferred from existing cases to a new tunnel, mine, or engineering database, where geological background, excavation conditions, data screening rules, and label criteria may differ from the training data. Leave-one-source-out validation better reflects this situation because one complete source is excluded from training and used only for testing. Therefore, LOSO validation provides a stricter and more realistic assessment of cross-source generalization than random validation.
The comparison in
Figure 11c shows that the three representative strong models—namely, RF, XGBoost, and SI-OLDL—all maintained competitive performance under LOSO validation. However, SI-OLDL achieved the highest LOSO Macro-F1 among these models. This result is consistent with the detailed LOSO results in
Table 5 and
Figure 6, where SI-OLDL obtained the best average Macro-F1, the lowest MAGE, the highest QWK, and the lowest SMR. These findings indicate that the proposed model is not only effective under random validation, but also robust when the test samples come from an unseen data source.
Figure 11d further illustrates the generalization gap between repeated random validation and LOSO validation. A positive gap indicates performance degradation under cross-source testing, whereas a smaller or negative gap indicates stronger transfer stability. The hard-label MLP shows the largest positive Macro-F1 gap, implying that a conventional neural network trained with one-hot labels is more sensitive to source shifts. In contrast, SI-OLDL exhibits a negative gap, meaning that its average LOSO Macro-F1 is not degraded relative to random validation. RF and XGBoost also show negative gaps, but SI-OLDL achieves the most favorable overall cross-source performance when the ordinal error metrics are also considered.
The source-confusion component should be interpreted operationally rather than as proof of a physically source-invariant latent space. The present experiments only show that, within this benchmark, adding source-aware training is associated with more favorable LOSO behavior and lower ordinal error. Each source dataset may contain real geological differences as well as reporting, screening, and labeling biases, and these effects cannot be completely removed by a learning algorithm. Therefore, the role of source-confusion learning is to discourage excessive reliance on source-specific statistical patterns and to encourage representations that remain useful for the ordered grading task across the available sources.
Nevertheless, cross-source generalization remains a challenging problem. A model trained on three literature sources may still require recalibration when applied to a new project with substantially different lithology, stress regime, excavation method, or label definition. Therefore, the value of SI-OLDL lies not in claiming universal transferability, but in providing a more robust learning framework for heterogeneous small-sample rockburst databases. Therefore, although the LOSO results strengthen the evidence for cross-source generalization within the available benchmark database, independent external validation on newly collected mine or tunnel cases remains necessary before the model can be considered fully verified for broad engineering deployment. The LOSO results suggest that explicitly considering source heterogeneity is necessary for evaluating and improving the reliability of data-driven rockburst intensity prediction.
5.3. Limitations and Deployment Boundary of Sparse Index-Based Rockburst Prediction
Despite its improved ordinal and cross-source performance, SI-OLDL should be interpreted as a sparse index-based static risk assessment model rather than a complete rockburst early-warning system. The present framework uses only SC, BC, and EEI as input variables. These indicators reflect stress concentration, brittle failure tendency, and elastic energy storage potential, but they cannot fully describe the complete dynamic triggering process of rockbursts. Important factors such as excavation sequence, geological structures, in situ stress evolution, support conditions, microseismic activity, mine pressure response, and historical damage evolution are not included in the current dataset. In particular, lithology, jointing, fault proximity, bedding or foliation, rock mass integrity, and regional stress regime may substantially influence rockburst occurrence and intensity, but these geological-setting variables are not consistently available in the three source datasets. Therefore, the proposed framework should be interpreted as a sparse static intensity assessment model rather than a complete dynamic rockburst early-warning system. It is more suitable for literature-compiled benchmark modeling, early-stage intensity assessment, and preliminary risk zoning when only limited geomechanical indicators are available. It should not be used alone for real-time warning, failure-time prediction, or site-specific disaster control decisions. In practical engineering applications, its output should be regarded as a probabilistic ordinal risk indication and should be combined with site-specific geological investigation, excavation and support information, stress monitoring, microseismic activity, and historical damage records.
It is necessary to objectively point out that due to the inconsistency in the on-site collection process and data filtering rules of various original datasets, there will inevitably be issues of artificial annotation bias in the classification of rockburst intensity. Furthermore, the geological conditions of the mine and tunnel engineering areas covered by the samples vary. At the same time, the data summarized from literature inevitably contains certain publication biases, and the overall engineering scenario representativeness of the integrated database is still limited. All of the above factors may potentially affect the actual generalization ability of the model across entirely new engineering scenarios.
The proposed framework is also complementary to grey-box and reliability-based methods. Grey-box models can incorporate physical mechanisms, empirical thresholds, and engineering knowledge, while reliability frameworks are useful for uncertainty propagation and safety-margin evaluation. In contrast, SI-OLDL provides a data-driven way to learn ordered risk distributions from heterogeneous small-sample databases. Its strength lies in improving label representation and cross-source robustness under limited input conditions, not in replacing mechanism-based analysis.
Future work should extend the present static framework toward dynamic spatiotemporal ordinal risk learning. Additional information such as microseismic event rate, energy release, b-value, stress monitoring, roof separation, excavation distance, structural proximity, and historical failure records could be integrated to describe the temporal evolution of rockburst risk. Combining ordinal distribution learning with physical constraints, reliability analysis, and monitoring streams would further improve the interpretability and deployability of rockburst prediction models.
6. Conclusions
This study proposes a source-invariant ordinal label distribution learning framework for predicting rockburst intensity based on sparse indicators. An analysis of the inherent limitations in the classification modeling of rockburst intensity reveals that rockburst intensity belongs to an ordered gradual risk process. There is significant feature overlap among adjacent disaster levels for three static indicators: stress, brittleness, and elastic energy. Using one-hot labels artificially disrupts the continuous evolution of risk. SI-OLDL relies on neighborhood-adaptive ordinal label distribution to characterize hierarchical ambiguity and introduces a source confusion branch to suppress data source-specific biases. It achieved performance comparable to the strongest tree-based baseline under repeated random validation and showed the most favorable average ordinal and cross-source performance under leave-one-source-out validation. Ablation experiments and error structure analysis further confirm that the SI-OLDL framework can reduce ordinal bias and minimize severe cross-level misclassifications, indicating that modeling rockburst intensity as an ordered gradual risk state is more reasonable.
Several limitations should also be acknowledged. The present framework uses only SC, BC, and EEI as input variables and should therefore be interpreted as a sparse static risk assessment model rather than a complete dynamic rockburst warning system. The dataset does not include excavation sequence, geological structures, in situ stress evolution, support conditions, microseismic activity, mine pressure monitoring, or historical disaster evolution. Therefore, the model output should be regarded as a probabilistic ordinal risk indication rather than a deterministic prediction of rockburst occurrence or failure time.
Subsequent research can further expand upon the existing foundation. By incorporating time-series monitoring data such as microseismic event frequency and b-value, the current static index framework can be extended to a dynamic spatiotemporal risk assessment system, thus addressing the limitation of relying solely on static mechanical parameters to characterize the real-time evolution process of rockburst disasters. Secondly, multi-dimensional geotechnical mechanical indicators such as the integrity coefficient of surrounding rock and the occurrence of geological structures can be expanded to improve the model input feature system. At the same time, more engineering cases from different regions and under different mining conditions can be integrated to construct a larger-scale and more comprehensive multi-source rockburst dataset, mitigating the regional geological limitations and publication biases present in existing databases, and further enhancing the interpretability and practical value on-site of data-driven rockburst prediction models.