Article

Spatiotemporal Evolution of Ecosystem Service Value and Landscape Ecological Risk and the Construction of Ecological Zoning Based on Land-Use Changes


1
College of International Tourism and Public Administration, Hainan University, Haikou 570228, China
2
School of Public Affairs, Arizona State University, Phoenix, AZ 85001, USA
*
Author to whom correspondence should be addressed.
Appl. Sci. 2026, 16(13), 6662; https://doi.org/10.3390/app16136662
Submission received: 1 May 2026 / Revised: 21 June 2026 / Accepted: 25 June 2026 / Published: 3 July 2026

Abstract

Land-use change poses a growing threat to ecological security, yet existing regional assessments often rely on a single ecological indicator and lack direct linkage to territorial spatial planning. This study develops an integrated ESV–ERI framework coupled with quadrant zoning to provide spatially explicit, planning-compatible guidance for ecological protection in tropical island regions. Taking Hainan, China, as a case study, this research draws on land-use data from 1994 to 2024, applying ESV and ERI assessments coupled with Z-score standardization to examine their spatiotemporal evolution characteristics. The results indicate the following: (1) forest land persistently dominated land use (>63%), while construction land expanded by 197.68% and forest land and grassland decreased by 9.36% and 93.78%, respectively. (2) ESV showed a downward trend, decreasing by 14.683 billion yuan, with forest land accounting for over 83% of total ESV. Spatially, ESV exhibited a “high inland, low coast” pattern, with high-value zones across inland water bodies and central nature reserves and low-value zones in coastal urban agglomerations. (3) ERI increased from 0.0371 to 0.0539, with low-risk zones in the middle mountains and high-risk zones around the island. (4) Based on the dual dimensions of ESV and ERI, the entire island was delineated into four ecological zones. These findings provide scientific decision support for territorial spatial planning and differentiated ecological protection in tropical island regions.

1. Introduction

Land-use change driven by accelerated urbanization and intensified human activities has emerged as the primary driver of terrestrial ecosystem transformation worldwide [1]. The Intergovernmental Science-Policy Platform on Biodiversity and Ecosystem Services (IPBES) Global Assessment reports that approximately 75% of the Earth’s terrestrial surface has been significantly altered by human activities, that 66% of the ocean area is experiencing cumulative impacts, and that land-use change—together with direct exploitation—accounts for the largest share of ecosystem degradation since 1970 [2,3]. These transformations have accelerated the loss of ecosystem service functions and intensified landscape ecological risk, thereby threatening regional ecological security and undermining the United Nations Sustainable Development Goals, particularly SDG 11, SDG 13, and SDG 15 [4,5]. China exemplifies this global trend: between 2000 and 2020, built-up land expanded by more than 80% nationally, while forest, grassland, and wetland underwent persistent fragmentation and functional decline, with tropical islands among the most severely affected [6,7]. Against this backdrop, assessing the spatiotemporal dynamics and interactions between ecosystem services and landscape ecological risk has become essential for formulating regional ecological protection policies and sustainable development strategies [8].
Among the available diagnostic frameworks, ecosystem service value (ESV) and the landscape ecological risk index (ERI) have been widely employed as two complementary diagnostic tools [9,10]. ESV economically quantifies the provisioning, regulating, supporting and cultural services that ecosystems provide, thereby identifying ecosystem benefits and priority areas for conservation [11,12]. Complementing this, the ERI captures the likelihood and magnitude of adverse changes in landscape patterns under natural or anthropogenic disturbances, thereby identifying areas vulnerable to ecological degradation [8]. Together, the two indices capture the complex dynamics between ecosystem service provision and ecological degradation, forming the core of ecological security pattern research [13,14]. A rapidly expanding body of empirical work has applied this dual-diagnostic logic across a widening range of regions and methodological designs, and the field has gradually converged on standardization-based quadrant zoning as the most operationally promising direction [15,16]. Despite this progress, three gaps persist: most assessments rely on a single indicator rather than a coupled ESV–ERI framework; temporal horizons rarely exceed 20 years, which is insufficient for capturing the slow-turnover dynamics of tropical island landscapes; and the resulting ecological zones are seldom linked to territorial spatial planning instruments, limiting their operational policy uptake.
This study uses Hainan Island, China, as a case to demonstrate how these gaps can be addressed by integrating ESV and ERI within a quadrant zoning framework linked to territorial spatial planning. China has developed a multi-tiered policy framework for ecological governance. The Overall Plan for the Reform of the Ecological Civilization System (2015), the National Territorial Spatial Planning Outline (2021–2035), and the nationwide delineation of the Ecological Protection Red Line—covering approximately 3.19 million km2 (about 3.04 million km2 terrestrial and 0.15 million km2 marine, equivalent to over 30% of the national land area)—have collectively established a “three-zone, three-line” management paradigm that requires spatially explicit, function-oriented zoning at the regional scale [17,18]. At the sub-national level, Hainan Province has been designated as both a National Ecological Civilization Pilot Zone (2019) and the Hainan Free Trade Port (2020), placing the island at the intersection of intensive socioeconomic development and strict biodiversity conservation [19,20,21]. This development–conservation tension creates a pressing need for ecological assessments that go beyond description and produce operational zoning directly compatible with the planning system. However, conventional assessments frequently rely on a single indicator, which cannot fully capture the coupled dynamics of ecosystem degradation and risk accumulation, thus providing limited guidance for spatially targeted policy implementation [22,23]. This study contributes to the development of integrated, multi-indicator frameworks that couple ESV and ERI within a planning-compatible zoning approach, responding to the recognized methodological priority for spatial management for both science and policy [24,25].

2. Literature Review

Ecosystem service value (ESV) and the landscape ecological risk index (ERI) have emerged as two of the most widely applied diagnostic tools for regional ecological assessments, attracting growing attention across diverse geographic settings, indicator systems, and modeling approaches. Internationally, the foundational work emerged in the late 1990s, when Costanza et al. [26] established the value-transfer paradigm for ESV accounting, subsequently complemented by hazard-based landscape risk frameworks developed for agricultural and watershed systems [27]. In the Chinese context, the field consolidated rapidly after Xie et al. [28] introduced the “equivalent factor per unit area” method for sub-national ESV accounting. Alongside this, the “disturbance–vulnerability” composite model became the prevailing operationalization of ERI, quantified through landscape metrics such as fragmentation, separation, and dominance [27,29].
Two broad methodological trajectories can be distinguished. The first trajectory treats ESV and ERI as parallel surfaces and examines their spatial relationships through bivariate Moran’s I, Pearson correlation, or geographically weighted regression, providing descriptive evidence that ecosystem value and landscape risk are negatively correlated [4,6,11,13]. While informative, this trajectory stops short of translating findings into actionable spatial guidance. The second trajectory treats them as coupled surfaces and translates them into ecological zoning, through either reclassification-and-intersection overlay [8,10,14,24] or, more recently, Z-score standardization combined with a two-dimensional quadrant model that places benefit and risk on commensurable axes [16,30,31]. Compared to single-indicator evaluations, the coupled ESV–ERI approach offers a multi-dimensional, planning-relevant view of regional ecological status and has been increasingly adopted as the methodological mainstream in this field [13,14].
Table 1 and Table 2 summarize, respectively, internationally and Chinese representative studies that have applied ESV, ERI, or their coupling to ecological zoning. The two tables make explicit the diversity of geographic settings, temporal horizons, coupling methods, and zoning outputs that characterize the current literature.
Despite this progress, three gaps persist. First, although the coupled ESV–ERI approach has matured methodologically and has begun to converge on Z-score-based quadrant zoning as the most planning-relevant direction [15,16], its empirical base remains concentrated in continental contexts, particularly arid and semi-arid cities, river basins, and mountain protected areas. Tropical island systems, whether in China or globally, have been assessed largely through single-indicator, single-period studies [39]. This geographic blind spot limits the transferability of existing frameworks to ecologically distinct island settings. Second, the temporal horizons examined are typically 20 years or shorter [4,6,11,16]. This is insufficient to capture the slow turnover of forest-dominated tropical island landscapes whose ecological transitions unfold over multi-decadal scales. Third, while several studies propose ecological zones, the resulting zones are seldom articulated against the operational language of territorial spatial planning systems, leaving a translational distance between scientific output and policy instrument [40,41]. Each of these gaps—geographic, temporal, and policy-translational—points to the same underlying need: a long-term, coupled assessment framework explicitly designed for tropical island governance.
The present study calculates ESV and ERI on Hainan Island over four periods spanning 1994–2024, embeds the two standardized indices in a two-dimensional quadrant model to derive ecological zoning, and articulates the resulting zones against the territorial spatial planning system and the dual mandate of the Hainan National Ecological Civilization Pilot Zone and Free Trade Port. The objectives of this study are as follows: (1) to quantify ESV and ERI based on land-use changes on Hainan Island and unravel their spatiotemporal evolution from 1994 to 2024; (2) to construct an ESV–ERI quadrant-based zoning framework that delineates ecological zones at a 3 km × 3 km grid resolution; and (3) to propose differentiated management strategies that are directly compatible with China’s territorial spatial planning instruments, thereby providing a transferable reference for ecological governance in tropical island regions.

3. Materials and Methods

3.1. Study Area

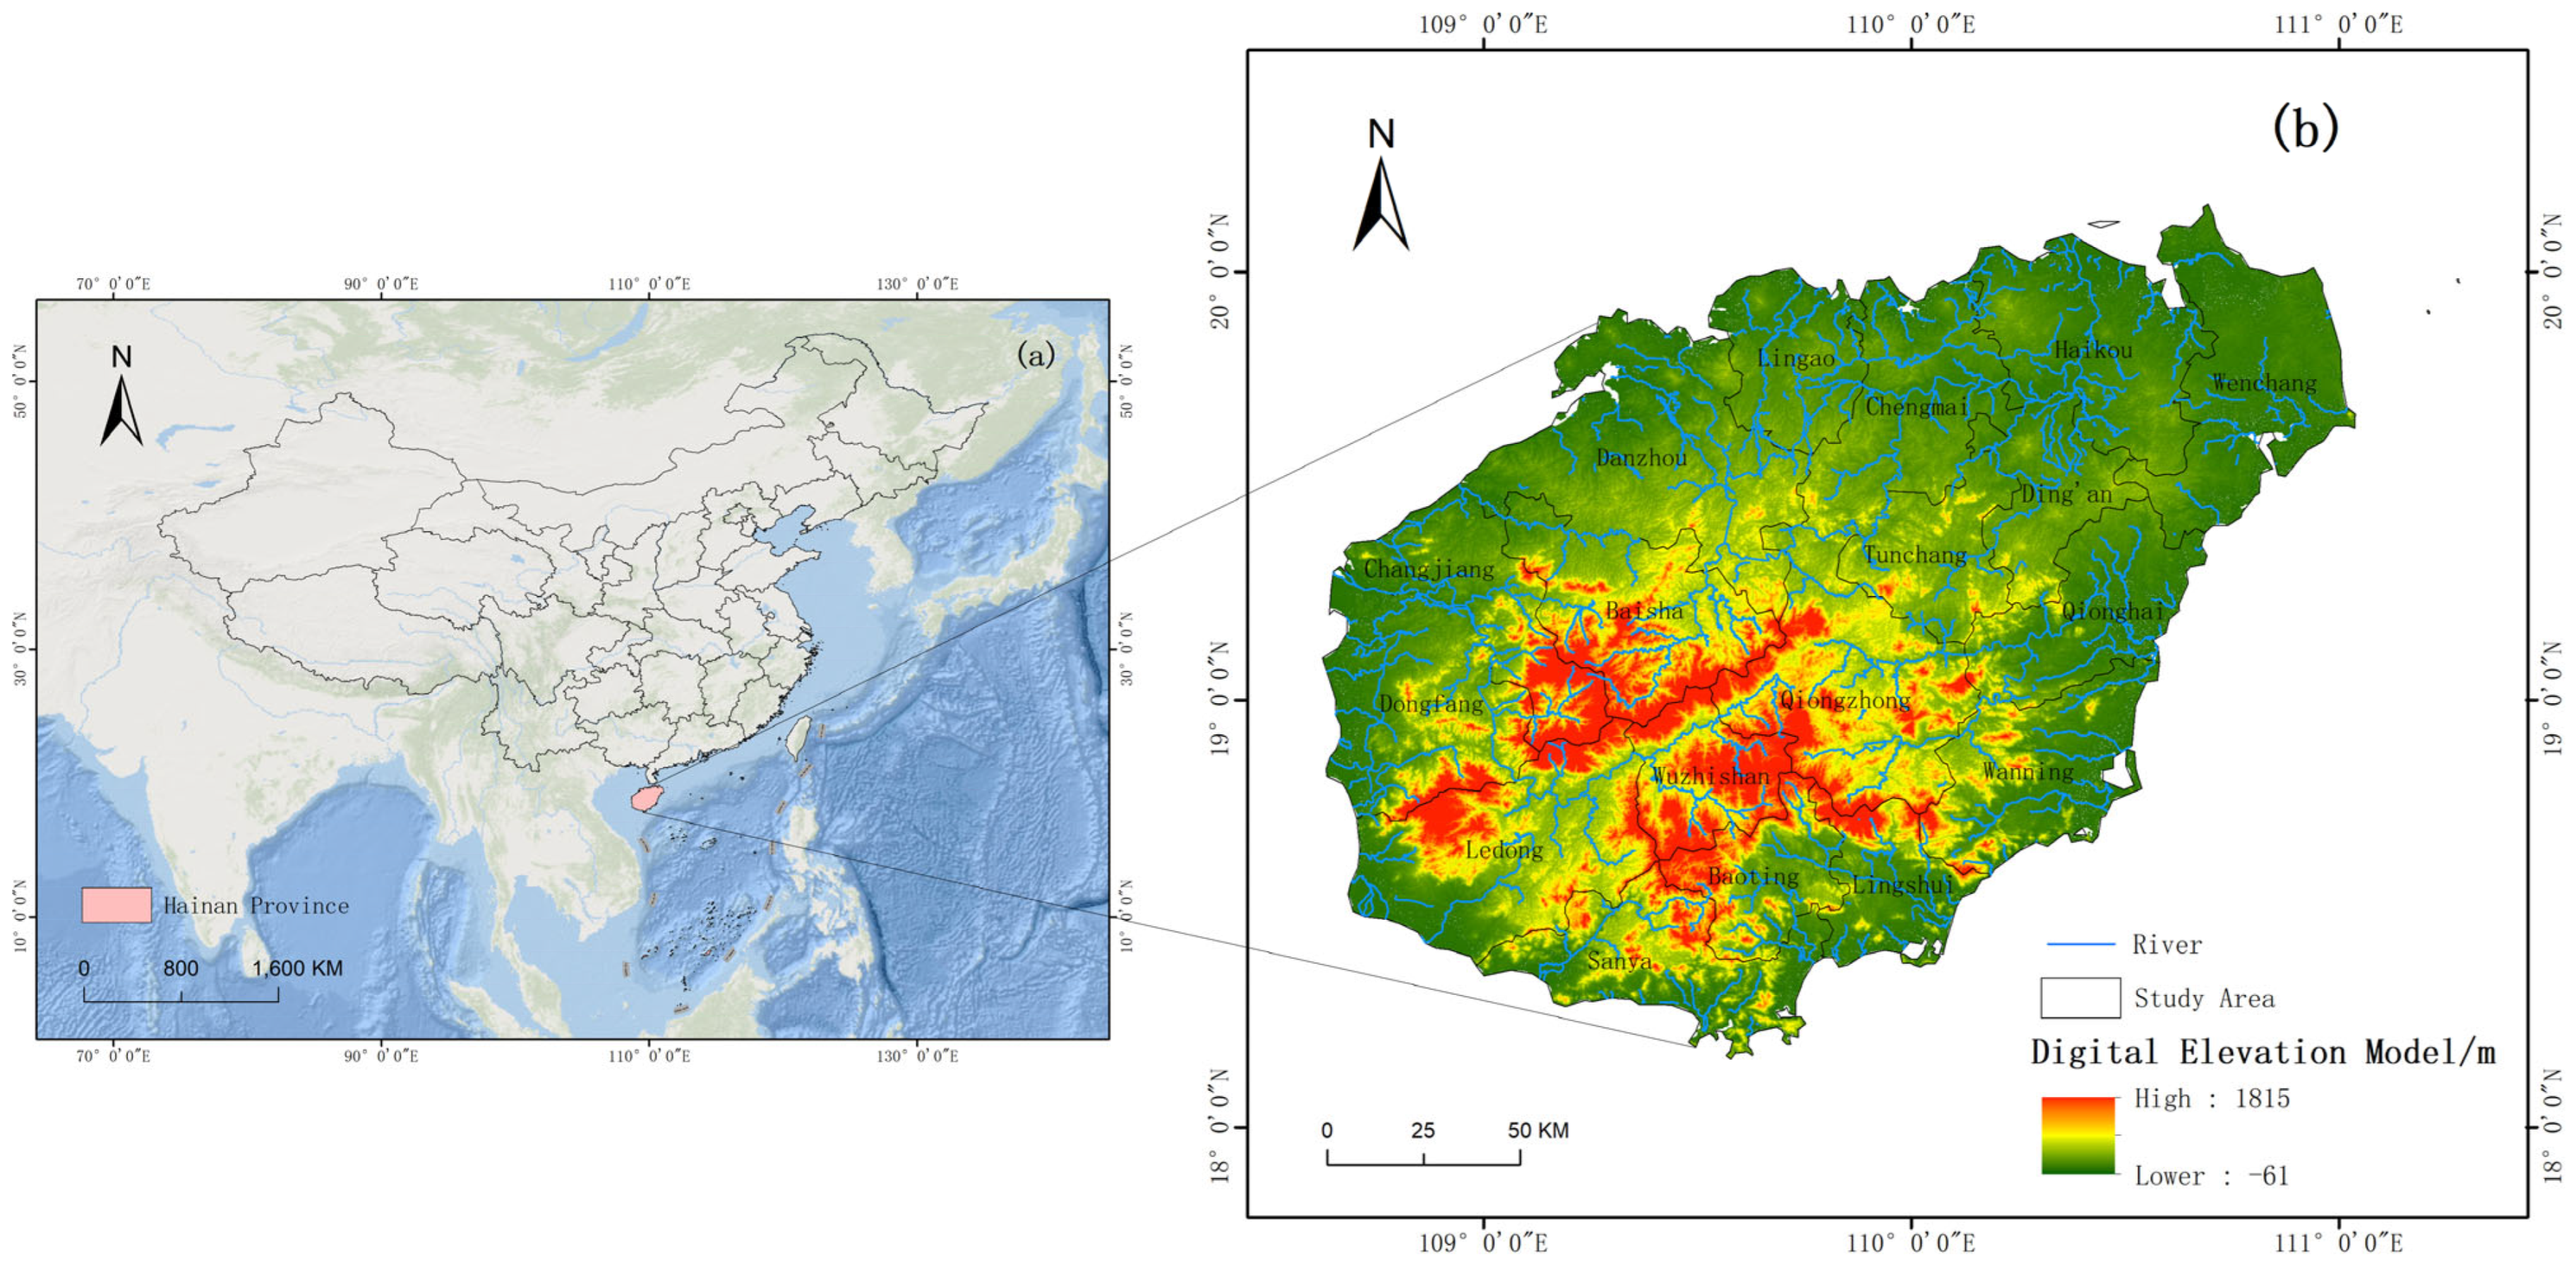
Hainan Island is located between 18°10′–20°10′ N and 108°37′–111°03′ E in the northern South China Sea, with a land area of approximately 33,900 km2, making it China’s second-largest island and its only province-level tropical island (Figure 1). Topographically, the island is characterized by mountainous central highlands and lower peripheral plains, with the Wuzhi–Yinggeling massif forming the ecological core of the interior and land use becoming progressively more intensive toward the coastal zone. The island has a tropical monsoon maritime climate, with mean annual temperatures of 22.5–25.6 °C and annual precipitation generally ranging from 1500 to 2500 mm, although rainfall is spatially uneven, with wetter eastern and mountainous areas and drier western coastal areas. These natural conditions support exceptionally rich tropical ecosystems in central Hainan, where the Hainan Tropical Rainforest National Park covers 4269 km2 and represents the most concentrated, diverse and best-preserved tropical rainforest on a continental island in China.
From the perspective of the national development strategy, Hainan is a National Ecological Civilization Pilot Zone and the country’s largest Free Trade Port, giving the region both ecological and institutional significance. At the same time, island ecosystems are widely recognized as inherently vulnerable because their limited area, spatial isolation, and strong interaction between terrestrial and marine processes make them highly sensitive to disturbance and relatively difficult to restore once degraded [42,43]. In Hainan, this vulnerability has been further intensified by rapid land-use conversion associated with urban expansion, tourism development, and infrastructure construction [44]. Recent evidence from Sanya shows a decline in ecological quality between 2014 and 2018, with degradation concentrated in economic development hotspots [45], while island-scale research indicates a marked increase in construction land and a concurrent deterioration in landscape ecological security during 2000–2020 [46]. Against this background, Hainan provides a representative and policy-relevant case for examining the long-term coupled evolution of ecosystem service value and landscape ecological risk under rapid development and territorial spatial regulation, and the continuous 30 m annual land-cover record of the CLCD employed in this study further enables a consistent observation of these dynamics over time.

3.2. Data Sources and Preprocessing

The data used in this study include land-use data, socio-economic data, and physical-geography data (Table 3). Land-use data for 1994, 2004, 2014, and 2024 were derived from the China Land Cover Dataset (CLCD, 30 m, Yang and Huang [47]), which is the first Landsat-derived, continuous, annual 30 m land-cover product for mainland China. Following the original product released for 1990–2019 [47], the dataset has since been extended to a continuous 1985–2025 annual series, and this study used the updated version archived on Zenodo so that the four time slices (1994, 2004, 2014, and 2024) are drawn from a single internally consistent record. It has been widely adopted in recent ecosystem service value and landscape-ecological-risk studies [6,10]. In accordance with the geographical conditions of Hainan Island, the original CLCD classes were reclassified into six categories—cultivated land, forest land, grass land, water bodies, construction land, and unutilized land—following the LUCC reclassification scheme widely used in Chinese ESV and ERI research [48,49]. Socio-economic and physical-geography auxiliary variables (population density, gross domestic product, grain yield and unit price, digital elevation model, slope, aspect, normalized difference vegetation index, temperature, precipitation, and administrative boundaries) were collected from the Hainan Statistical Yearbook, the Resource and Environment Science and Data Center of the Chinese Academy of Sciences, the Geospatial Data Cloud, and Open Street Map. All raster layers were resampled to a common 30 m grid in CGCS2000 and clipped to the Hainan boundary. To enable a spatially uniform cross-period comparison and quadrant zoning, the island was partitioned into 4026 equidistant grid cells of 3 km × 3 km—a scale that decouples the analysis from administrative units and is well aligned with the 30 m resolution of the input land-cover data. A grid resolution at the kilometer scale is consistent with the practice of comparable coupled ESV–ERI studies [13,50], which likewise aggregate indices to regular kilometer-scale grids.
It is worth acknowledging at the outset that ESV and ERI in this study are derived from the same land-use data and therefore share a common input dependency. Although the two indices are computed through mathematically independent procedures—an equivalent-factor valuation for ESV and a disturbance–vulnerability landscape-pattern formulation for ERI—they are both conditioned by the same set of land-cover transitions, which may inflate their apparent spatial-temporal association and partly reflect a shared land-use signal rather than two independent ecological processes. The joint use of the two indices is therefore positioned in this study as a complementary, two-perspective diagnostic—ESV summarizing the supply side and ERI summarizing the disturbance side of the same landscape change—rather than as a test of an independent ESV–ERI causal relationship. The implications of this shared dependency for the interpretation of the results are discussed explicitly in Section 5.4.

3.3. Methodology

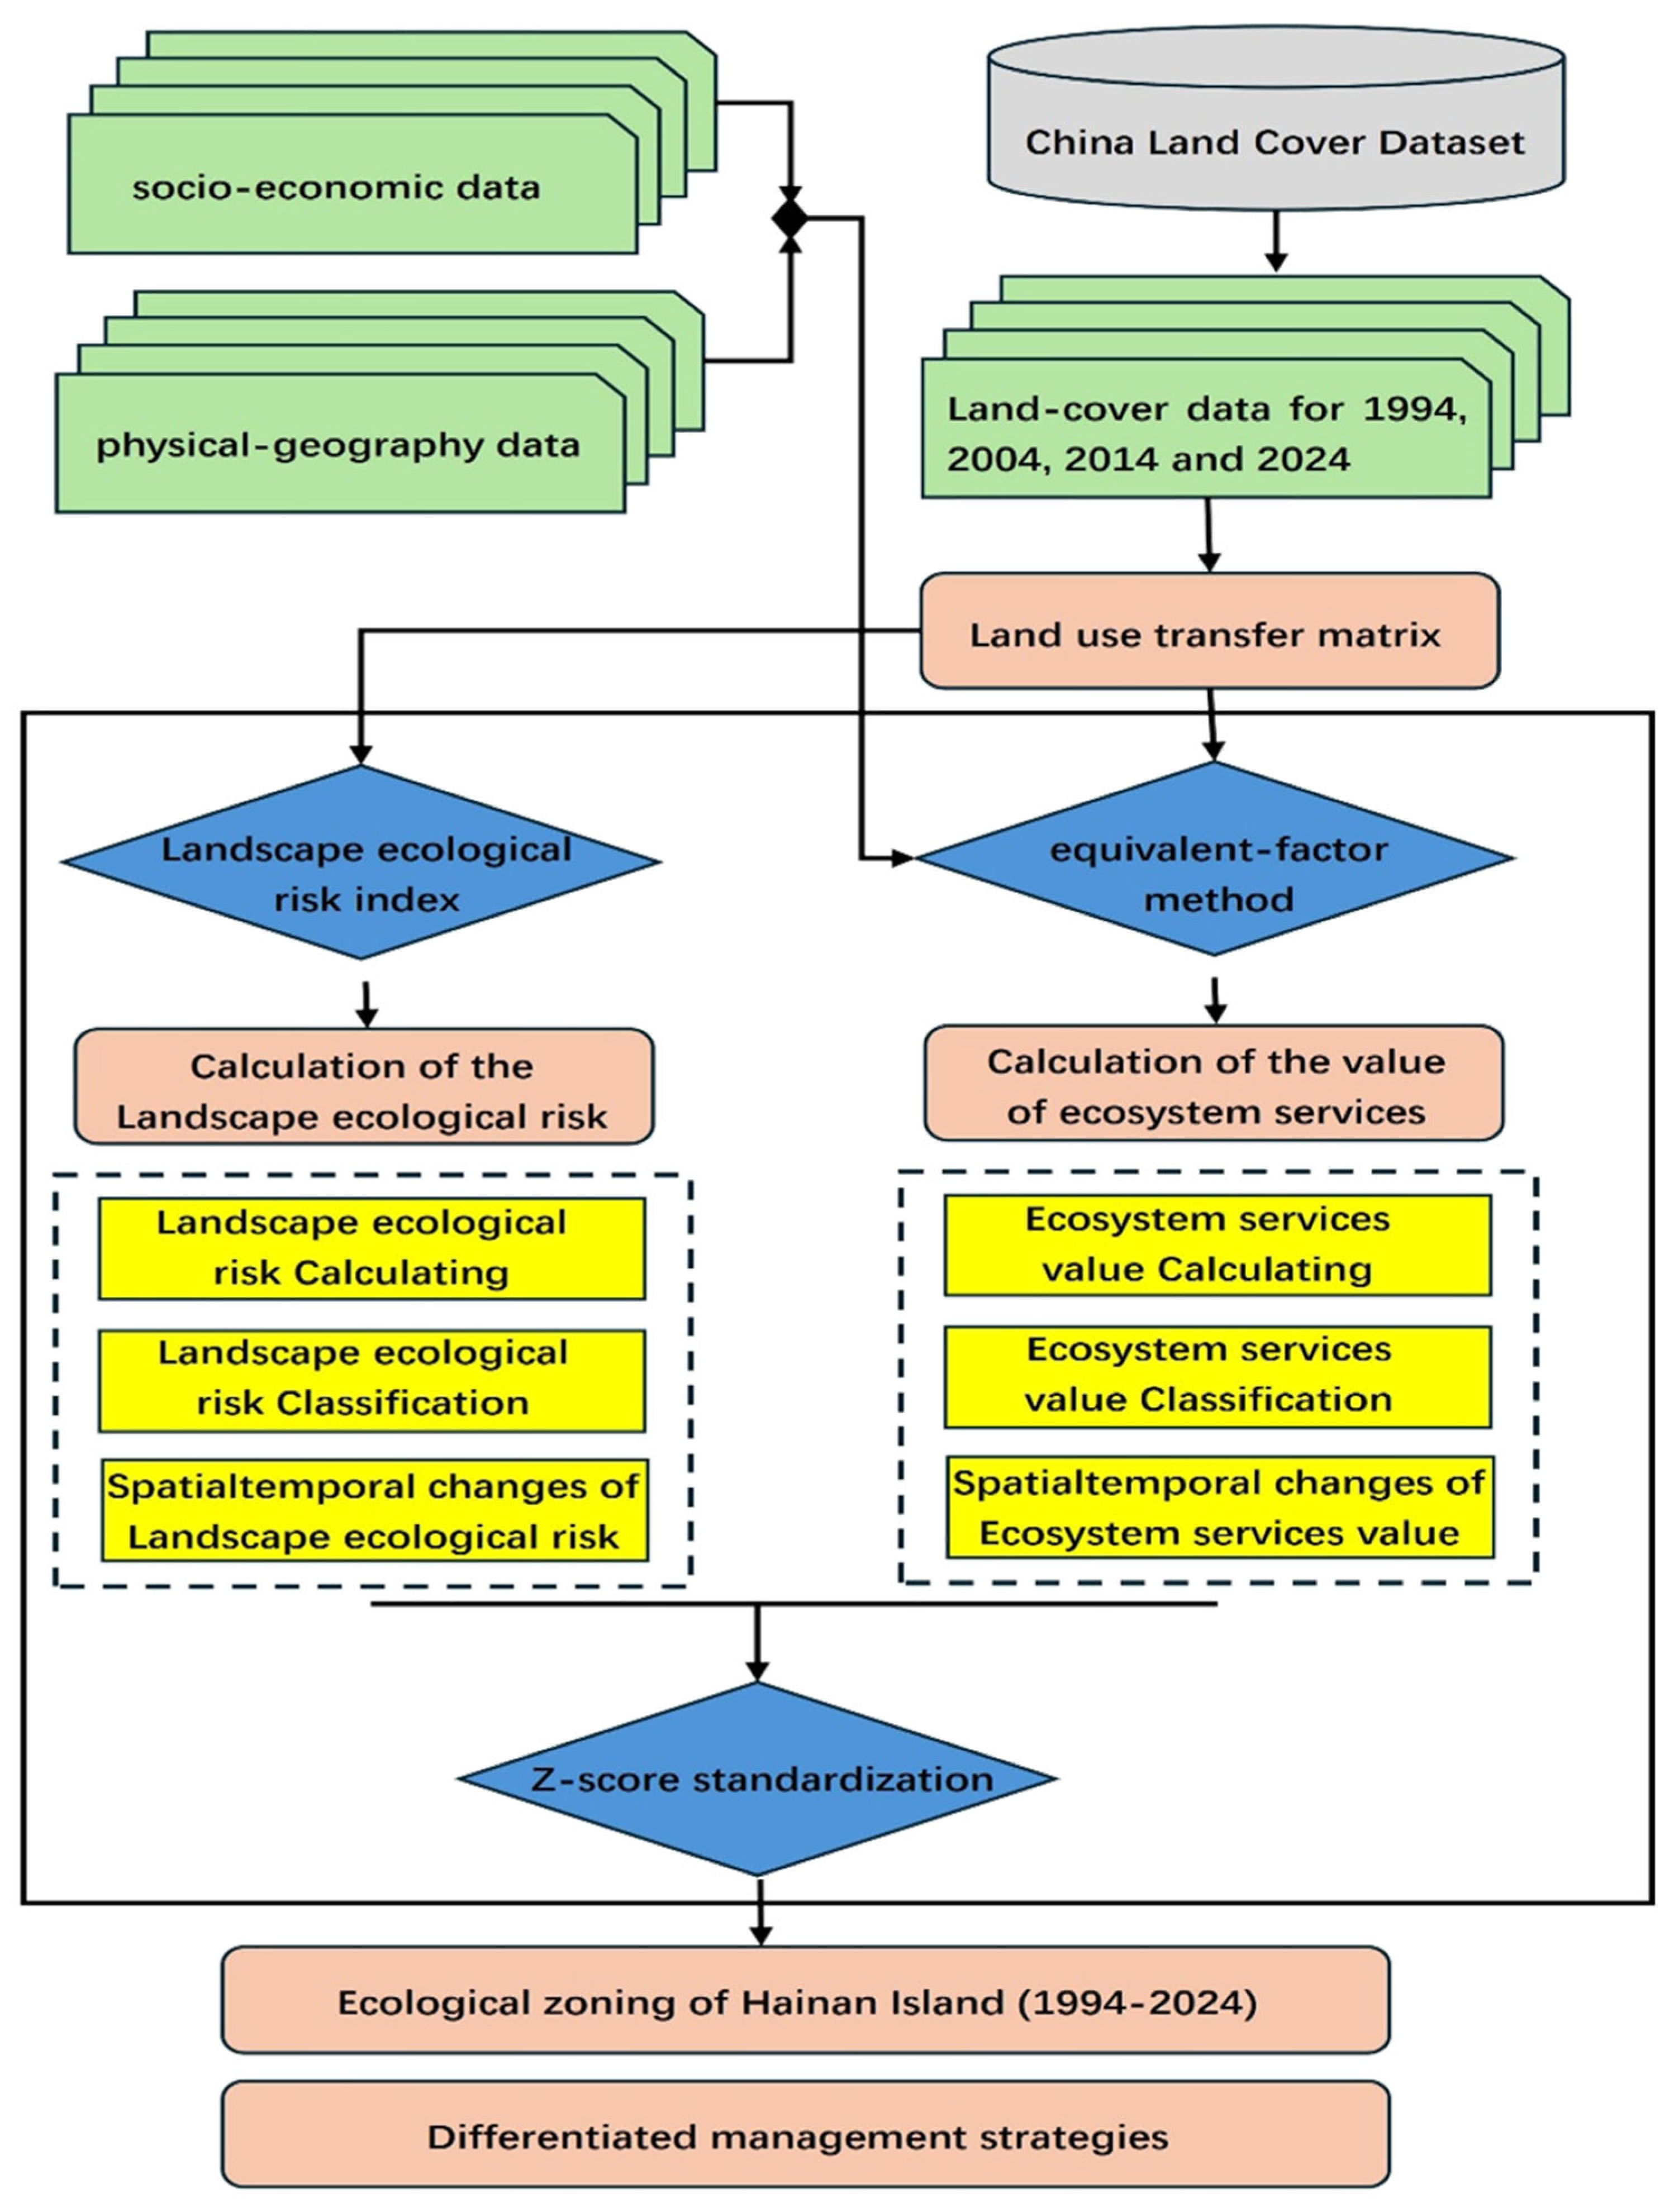
Building on the data described above, Figure 2 shows the overall workflow of this study, which integrates the two diagnostic indices into a single zoning procedure. The workflow comprises four sequential modules. (i) Data acquisition and pre-processing: the four time slices of CLCD land-use data (1994, 2004, 2014, 2024) were retrieved, clipped to Hainan Island, reclassified into the six categories defined in Section 3.2, and projected to CGCS2000; auxiliary socio-economic and physical-geography layers were resampled to the same 30 m grid. (ii) Land-use dynamics: based on the four pre-processed land-cover maps, a land-use transition matrix was constructed and the area and percentage change in each category were quantified to characterize the dynamic conversion among types from 1994 to 2024 (Section 3.3.1). (iii) Coupled diagnostic indices: the ESV was calculated for each period using the equivalent-factor method of Xie et al. [28], regionally corrected following Lei et al. [44] (Section 3.3.2), and the ERI was calculated from landscape fragmentation, separation, and dominance integrated with a landscape vulnerability index, following the disturbance–vulnerability framework consolidated in prior landscape-pattern risk studies [40,41,51] (Section 3.3.3); both indices were aggregated to the 3 km × 3 km grid established in Section 3.2. (iv) Ecological zoning: the gridded ESV and ERI were standardized by Z-score, mapped onto a two-dimensional quadrant model, and intersected to delineate four ecological zones, which were then articulated against the Ecological Protection Red Line and the territorial spatial planning system to derive differentiated management strategies (Section 3.3.4). The choice of methods at each stage follows the methodological mainstream documented in Table 1 and Table 2 of Section 2, ensuring that the framework is both reproducible and directly comparable with prior ESV–ERI zoning studies [6,15,16,37].

3.3.1. Land-Use Transfer Matrix

The land-use transition matrix is a primary method for quantitatively characterizing the mutual conversion relationships among land-use types across different periods [49,52]. Based on the land-use data of Hainan Island from 1994 to 2024, this study constructs a land-use transition matrix to reveal the dynamic evolutionary patterns of land use over the study period, which provides the land-cover basis for the subsequent ESV and ERI calculations. The formula for calculation is as follows:
A i j = A 11 A 12 A 1 n A 21 A 22 A 2 n A n 1 A n 2 A n n
where A denotes the area, n denotes the number of land-use types, i denotes the land-use type at the beginning of the study period, and j denotes the land-use type at the end of the study period.

3.3.2. Calculation of the Value of Ecosystem Services

This study adopted the equivalent-factor method of Xie et al. [28], whose per-unit-area equivalent table was subsequently refined through the expert-knowledge approach [53] and the improved equivalent-factor revision of Xie et al. [54], regionally corrected following Lei et al. [44], wherein the economic value of one standard equivalent factor was set at 3406 yuan/hm2. To align with the specific realities of Hainan Island and eliminate the impacts of economic and geographical factors such as currency appreciation and uneven regional development, the standard equivalent factor was tailored and revised [11,24]. During the study period, the average actual grain yield per unit area in Hainan Province was 4822.45 kg/hm2, compared to the national average of 4974 kg/hm2, yielding a regional correction coefficient of 0.97. Consequently, the economic value of one standard equivalent factor for the study area was adjusted to 3305 yuan/hm2. Based on this revised standard equivalent and the respective areas of different ecosystems, the total ESV of the study area was calculated, with construction land assigned a value of zero. The finalized ESV equivalent table per unit area for Hainan Island is shown in Table 4. The calculation formula is as follows:
E S V j = A i j × V C i
E S V = j = 1 n E S V j
where E S V j denotes the value of the ith land use type in the grid unit, A i j denotes the area of the ith land use type in the jth grid unit, V C i denotes the ESV coefficient per unit area for the ith land use type, and n denotes the number of land-use types.

3.3.3. Calculation of the Landscape Ecological Risk

The ERI evaluation reflects the spatial differentiation characteristics of regional ecological risks through the construction of landscape pattern indices. Building upon existing research [40,41,51], this study selected landscape fragmentation, landscape separation, and landscape dominance to construct a landscape disturbance index. By integrating this with a landscape vulnerability index, the landscape loss index was calculated, which subsequently enabled the determination of the ERI for each grid cell.
E R I = i = 1 n A k i A k × R i
R i = E i × V i
E i = a C i + b N i + c D i
where n denotes the number of landscape types in the study area, A k i denotes the area of the ith landscape type within the kth risk sub-region, A k denotes the total area of the kth risk sub-region, R i denotes the landscape loss index, E i denotes the landscape disturbance index, V i denotes the landscape vulnerability index, C i denotes the landscape fragmentation index, N i denotes the landscape separation index, and D i denotes the landscape dominance index. a, b, and c denote the weights of the corresponding landscape indices, which were assigned the values of 0.5, 0.3, and 0.2, respectively [55], following previous research and taking the actual conditions of the study area into consideration; the landscape vulnerability index is set as follows: construction land = 1, forest land = 2, grass land = 3, cultivated land = 4, water bodies = 5, unutilized land = 6; after normalization these values are 0.0476, 0.0952, 0.1429, 0.1905, 0.2381, and 0.2857, respectively [40].

3.3.4. Ecological Zoning

To comprehensively identify the ecological space types of Hainan Island, this study employed the Z-score standardization method to non-dimensionalize the ESV and ERI of the grid cells, thereby eliminating the influence of varying dimensions and placing the two indicators on commensurable axes—a procedure that has been adopted as the methodological mainstream for coupled ESV–ERI zoning in recent literature [15,16,30,31]. Based on the standardized results, a two-dimensional quadrant model was constructed with ESV as the X-axis and ERI as the Y-axis, classifying the ecological space of Hainan Island into four distinct types: the High ESV–High ERI zone (I), the Low ESV–High ERI zone (II), the Low ESV–Low ERI zone (III), and the High ESV–Low ERI zone (IV) [11,56]. Through the spatial allocation of these quadrants, the ecological zoning types of different grid cells were accurately identified, providing a scientific basis for the subsequent formulation of differentiated management and control strategies, which are further articulated against the territorial spatial planning system in Section 5.3. The formula is as follows:
x = x i x ¯ s
x ¯ = 1 n i = 1 n x i
s = 1 n i = 1 n x i x ¯ 2
where x denotes the standardized ESV and ERI of the grid cell, x i denotes the initial ESV and ERI of the ith grid cell, x ¯ denotes the mean value, s denotes the standard deviation, and n denotes the total number of grid cells.
All spatial operations (clipping, reclassification, fishnet generation, zonal statistics, transition-matrix calculation, and quadrant intersection) were performed in ArcGIS 10.8; landscape pattern indices were calculated in Fragstats 4.2; and Z-score standardization and zoning aggregation were implemented in Python 3.10 (numpy, pandas, geopandas). The full workflow can be reproduced using these widely available, license-stable tools and the data sources listed in Table 3.

4. Results

4.1. Analysis of Land-Use Changes

Based on the land-use raster data, the area of each land-use type on Hainan Island from 1994 to 2024 is shown in Table 5. During the study period, the land-use structure of Hainan Island underwent significant changes. Forest land was the dominant type, accounting for more than 63% of the total area, followed by cultivated land, which accounted for over 27% of the total area. From 1994 to 2024, the area of cultivated land exhibited a fluctuating increase, expanding from 9375.65 km2 to 11,279.68 km2, representing a growth rate of 20.31%. Conversely, the area of forest land showed an overall fluctuating decrease, declining from 23,588.88 km2 to 21,380.21 km2, with a reduction rate of 9.36%. The areas of grass land and unutilized land experienced a continuous decline, dropping from 123.91 km2 and 38.22 km2 to 7.71 km2 and 1.50 km2, marking substantial decreases of 93.78% and 96.08%, respectively. Meanwhile, construction land underwent a continuous and rapid expansion, surging from 242.13 km2 to 720.77 km2, an increase of 197.68%. The water bodies exhibited an initial increase followed by a subsequent decrease, resulting in a net reduction of 21.08 km2. Overall, the land-use types on Hainan Island underwent significant changes between 1994 and 2024. This was primarily characterized by the continuous expansion of construction land, an overall increase in cultivated land, varying degrees of reduction in forest land, grass land, and unutilized land, and fluctuating changes in water bodies.
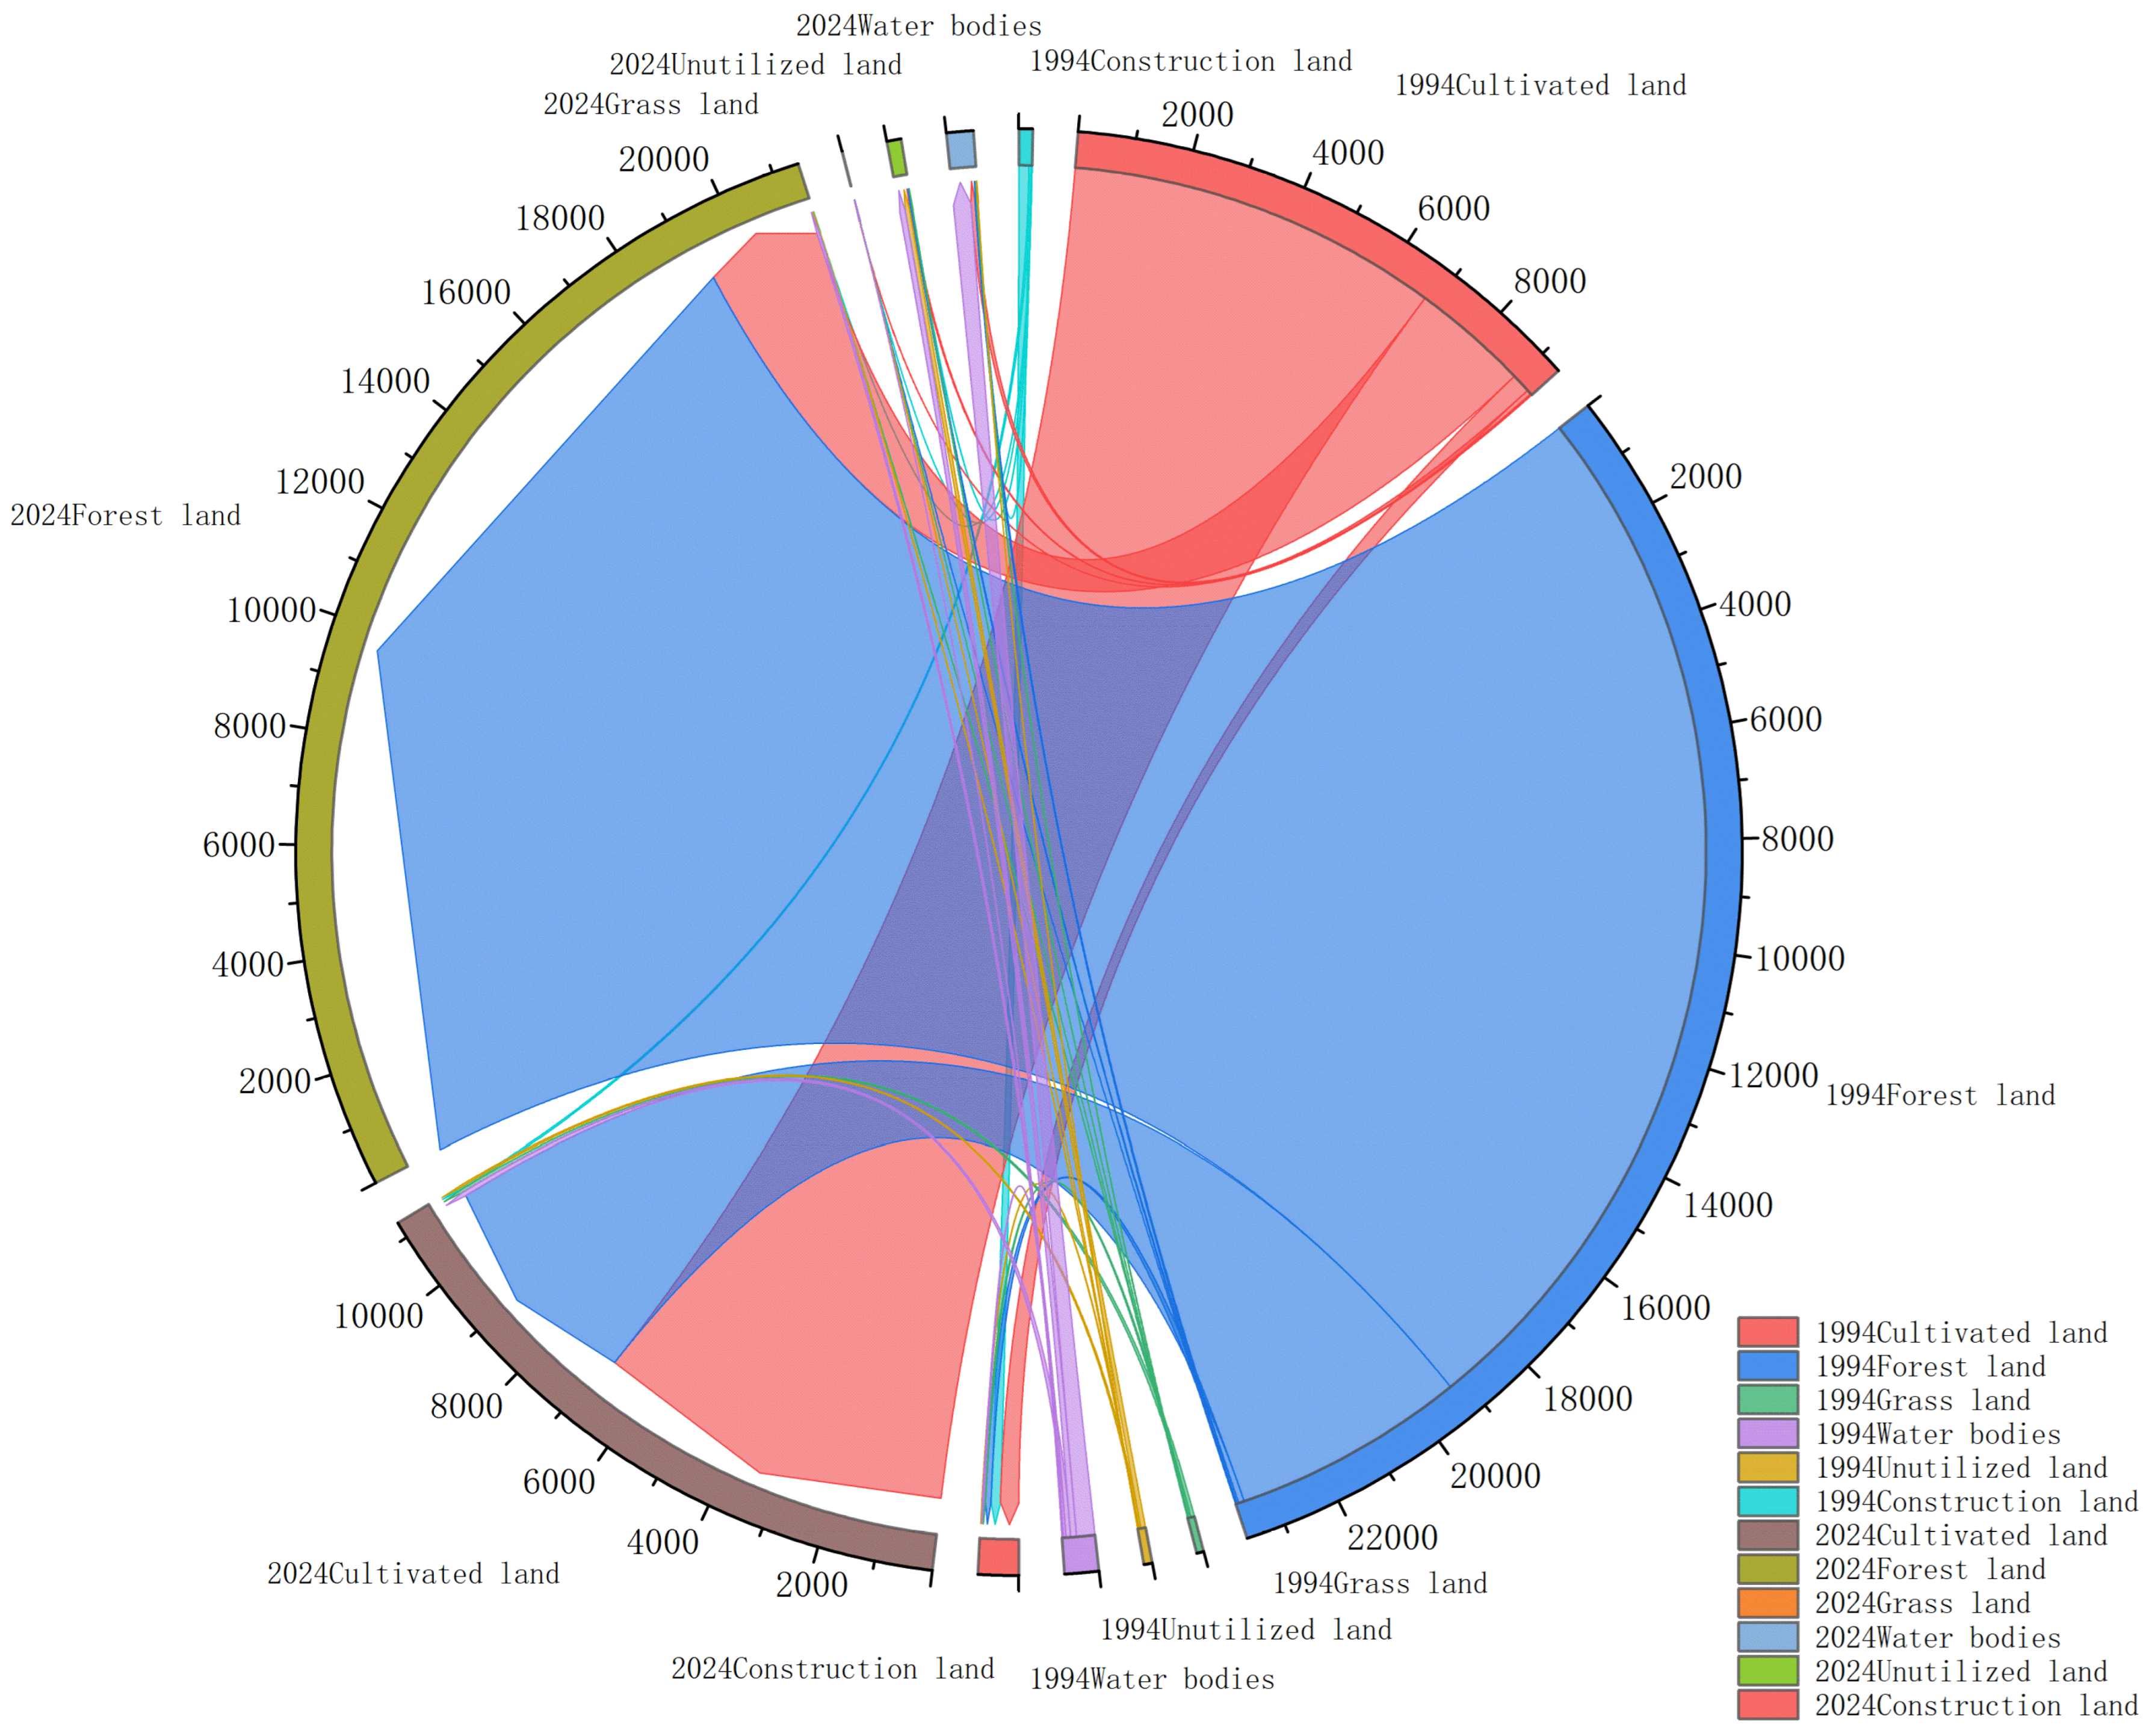
The transformation of different land-use types on Hainan Island from 1994 to 2024 was further analyzed using the land-use transfer matrix (Figure 3). Regarding the conversion out of specific types, forest land exhibited the largest outward transfer area, reaching 4309.60 km2, which was primarily converted into cultivated land (4195.39 km2) and construction land (96.22 km2). This was followed by cultivated land, which saw 2060.94 km2 and 331.59 km2 transferred to forest land and construction land, respectively. The outward transfer areas of water bodies and grass land were 134.83 km2 and 121.83 km2, respectively, both of which were predominantly converted into cultivated land (80.98 km2 and 66.12 km2, respectively). Regarding the conversion into specific types, cultivated land recorded the largest inward transfer area at 4375.89 km2, mainly derived from forest land, water bodies, and grass land, with areas of 4195.39 km2, 80.98 km2, and 66.12 km2, respectively. This was followed by forest land, construction land, and water bodies, with inward transfer areas of 2100.93 km2, 492.28 km2, and 113.75 km2, respectively. Specifically, the primary source of the inward transfer to forest land was cultivated land (2060.94 km2), the major sources for construction land were cultivated land and forest land (331.59 km2 and 96.22 km2, respectively), and the primary source for water bodies was also cultivated land (75.99 km2). Overall, the land-use transitions on Hainan Island between 1994 and 2024 were dominated by the mutual conversion between forest land and cultivated land, while the expansion of construction land primarily originated from the transfer of cultivated land and forest land.

4.2. Spatial and Temporal Changes in ESV

These land-use changes directly reshaped the supply of ecosystem services. Based on the area of each land-use type and the revised coefficients for ESV, we further calculated the ESV of the study area (Table 6). During the specific years of 1994, 2004, 2014, and 2024, the total ESV of Hainan Island was recorded at 200.961 billion CNY, 191.197 billion CNY, 200.364 billion CNY, and 186.278 billion CNY, respectively. The overall trajectory exhibited a fluctuating downward trend, characterized initially by a decline, followed by a subsequent increase, and ultimately concluding with another decline. This trajectory indicates a certain degree of degradation risk within the regional ecosystem service functions. The forest ecosystem consistently served as the primary contributor to the total ESV, accounting for over 83% across all observed periods. However, its specific ESV experienced a fluctuating decline from 171.482 billion CNY to 155.425 billion CNY, representing a reduction of 9.36%. The ESV of water bodies displayed an initial upward trend before experiencing a downturn, peaking at 18.017 billion CNY in 2014 and then sharply dropping to 14.941 billion CNY, which constitutes a 17.07% decrease compared to the 2014 level. This notable decline is likely associated with the intensified exploitation of water resources and the degradation of wetland ecosystems. Conversely, the ESV of cultivated land showed a fluctuating upward trend, increasing from 13.191 billion CNY to 15.869 billion CNY, with its proportional contribution rising from 6.56% to 8.52%. Notably, the cultivated land ESV reached its peak within the study period in 2024. This suggests an enhanced role of cultivated land in maintaining regional ecosystem service functions, a shift that is potentially linked to the implementation of farmland-protection policies and agricultural structural adjustments. Meanwhile, the ESV of grass land exhibited a continuous downward trajectory, plummeting from 0.667 billion CNY in 1994 to 0.041 billion CNY in 2024, marking a severe drop of 93.85%. This reflects the drastic reduction of grass land area across Hainan Island. Furthermore, the contribution of unutilized land to the overall ESV was negligible, dropping from 0.014 billion CNY in 1994 to 0.001 billion CNY in 2024. Overall, forest land, water bodies, and cultivated land constituted the principal components of the ESV on Hainan Island. The most prominent characteristics of this transition were the decline in the ESV of forest land and water bodies, coupled with the significant shrinkage of grass land.
As shown in Table 7, the individual ecosystem service of Hainan Island can be classified into three distinct tiers. Climate regulation and hydrological regulation belong to the first tier, serving as the core functions of the regional ecosystem services, with their combined proportion consistently exceeding 49.00%. Notably, in 2024, the ESV of these two services dropped to 47.316 billion CNY and 44.653 billion CNY, respectively, both reaching their lowest values during the study period. This indicates a certain degree of weakening in the regional climate and hydrological regulation functions. Soil conservation, biodiversity maintenance, gas regulation, and environmental purification constitute the second tier. The combined proportion of these four functions ranges from 38.00% to 39.00%. Among them, soil conservation ranks first, while the other three functions generally exhibit a fluctuating downward trend. Aesthetic landscape provision, raw material production, food production, and nutrient cycle maintenance fall into the third tier, with the individual proportion of each being less than 5.00%. Within this tier, food production shows minor fluctuations, whereas the maintenance of nutrient cycles consistently remains the lowest, at approximately 2 billion CNY. Furthermore, the water supply service experienced abnormal fluctuations, recording negative values of −0.131 billion CNY and −0.380 billion CNY in 2004 and 2024, respectively. This phenomenon indicates a net consumption and regulatory imbalance in the regional water supply service, which is highly associated with the intensified contradiction between water resource supply and demand, frequent drought events, and the excessive intensity of water resource exploitation.
As a tropical island ecological function region, Hainan Island relies heavily on essential ecosystem service functions, including climate regulation, hydrological regulation, and biodiversity maintenance, to provide fundamental support for regional sustainable development. During the study period, the declining trend in the value of core regulating functions, coupled with the emergence of negative values in water supply services, highlighted a distinct degradation risk within the ecosystem service functions and a weakened capacity for the stable provision of ecological products. In summary, the declining core regulating functions and the emergence of negative water-supply values together signal a clear degradation risk, underscoring the need to prioritize the protection and restoration of climate- and hydrology-regulating services in the subsequent zoning.
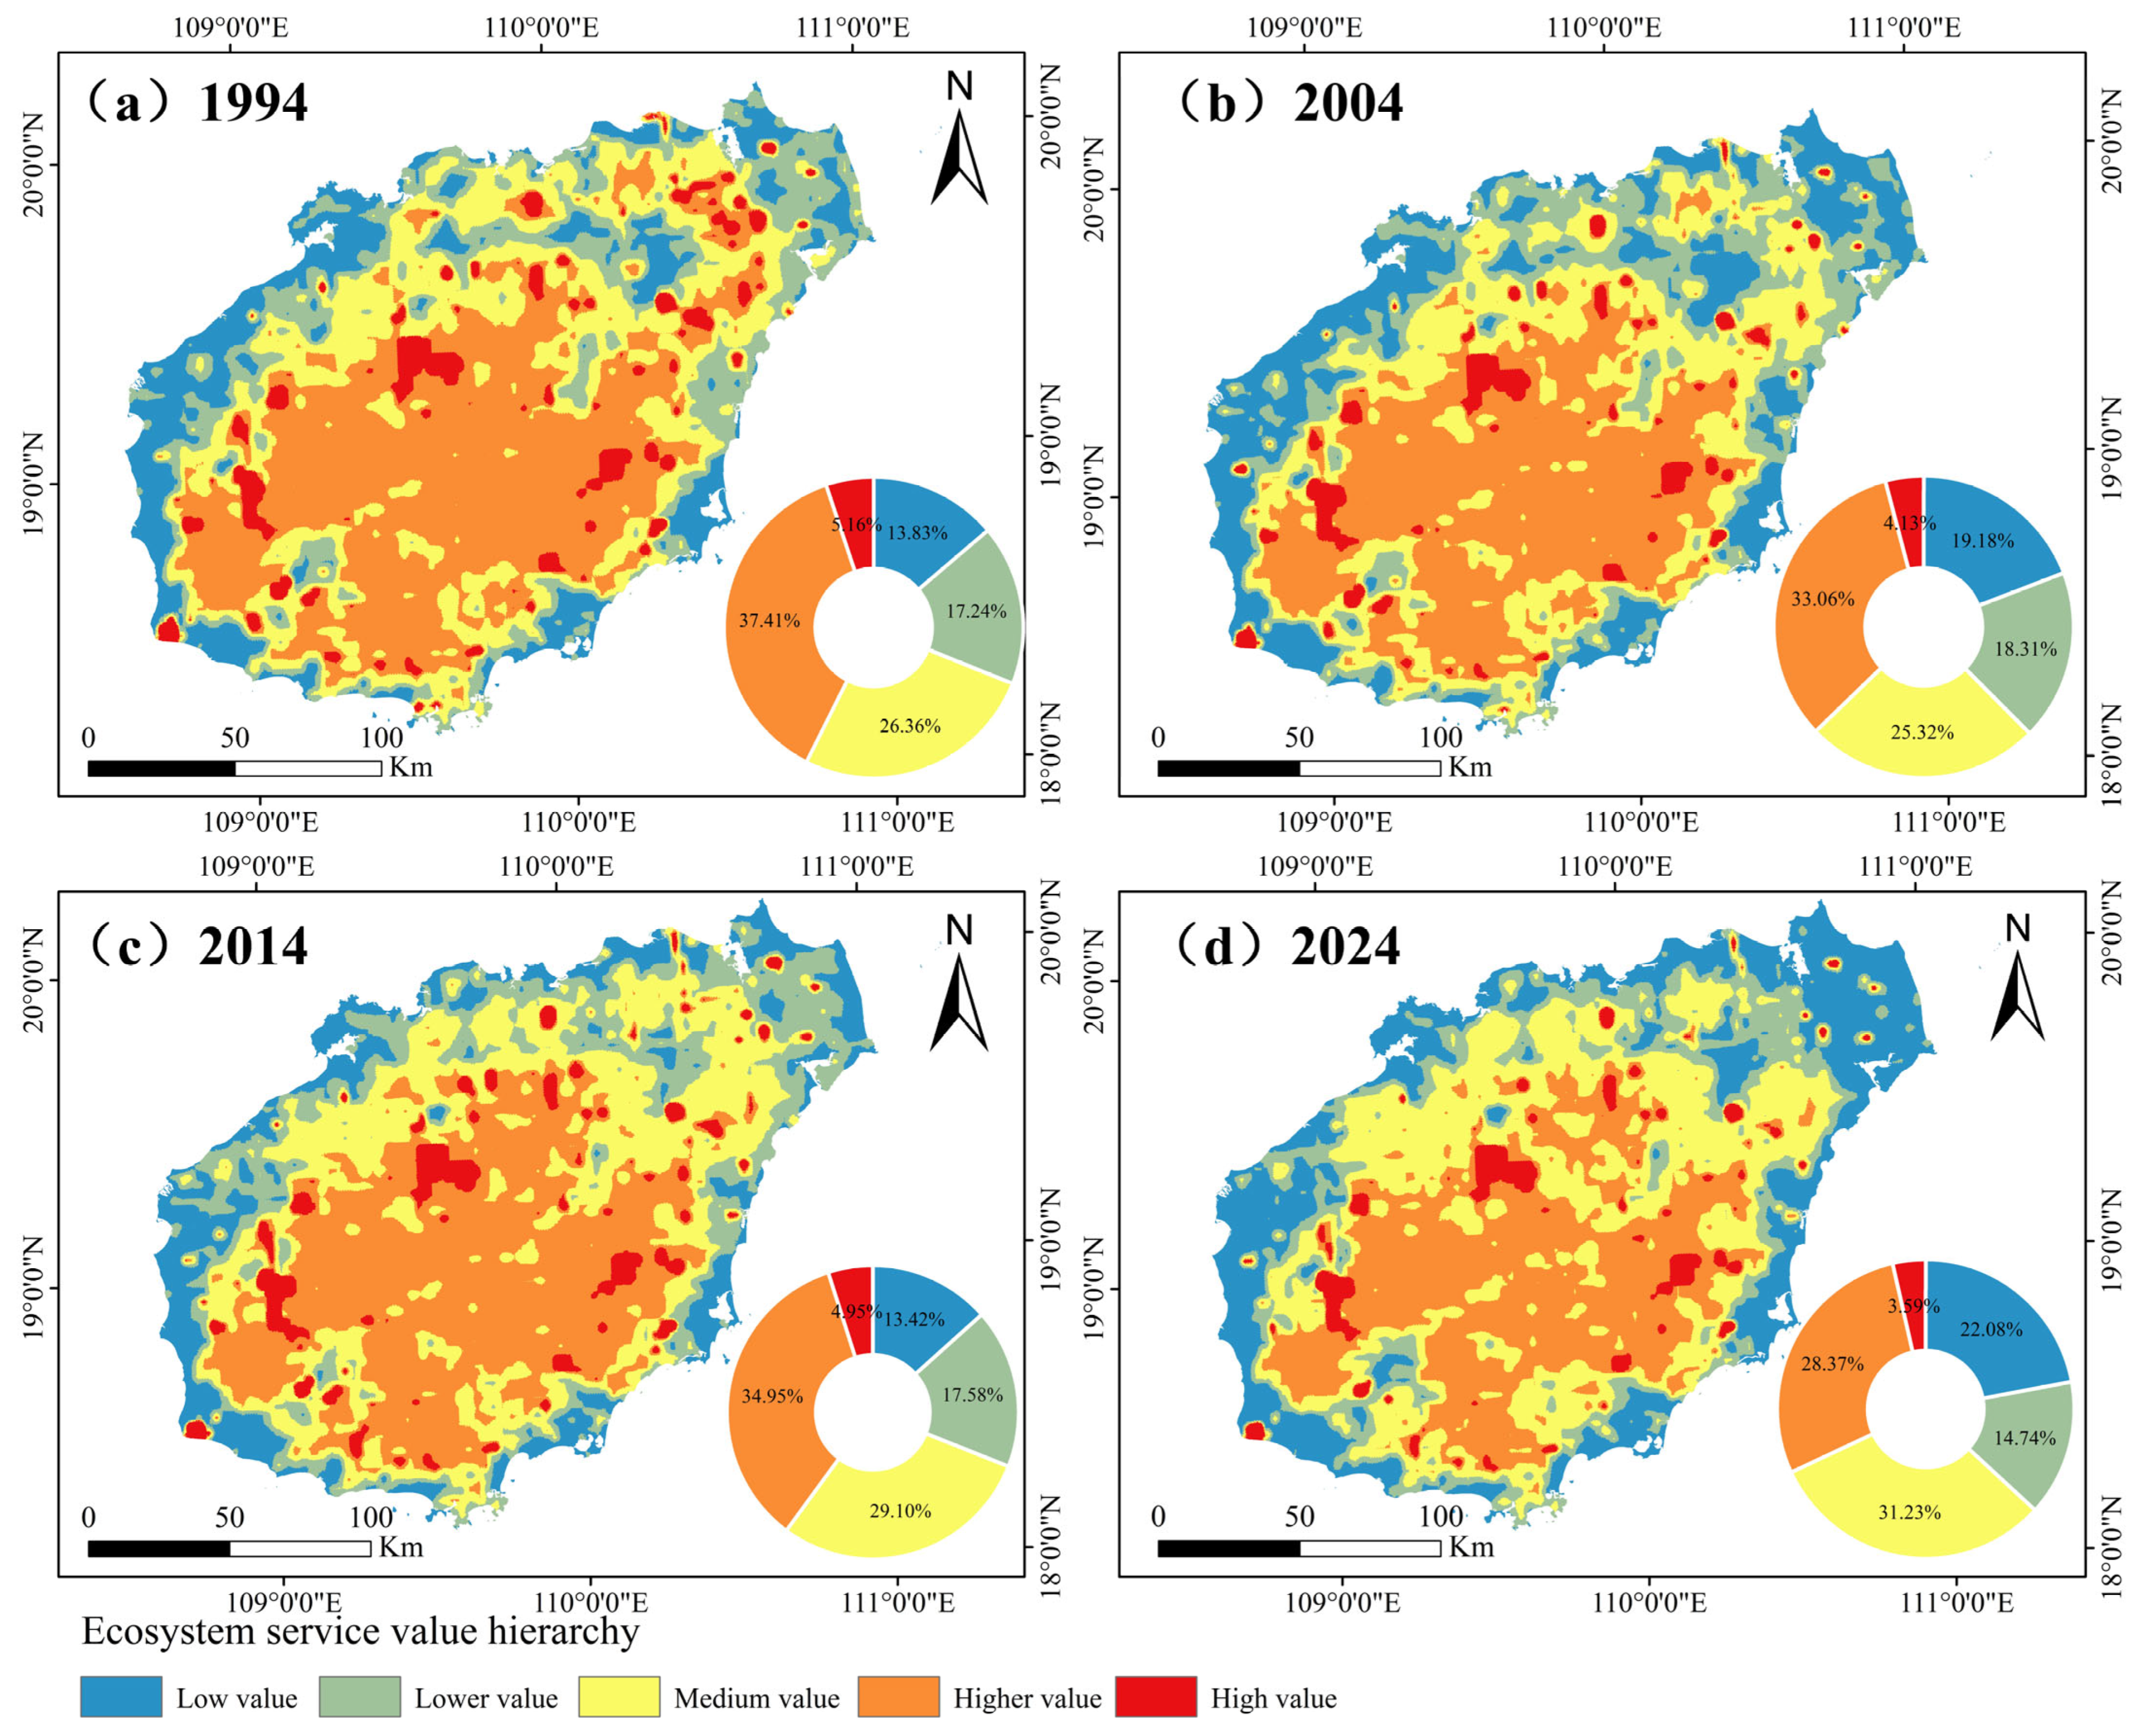
To elucidate the spatial pattern of ESV on Hainan Island, a grid-scale spatial visualization of the ESV from 1994 to 2024 was conducted. Utilizing the Natural Breaks (Jenks) method, the ESV was classified into five distinct grades: low-, lower-, medium-, higher-, and high-value zones [37]. As shown in Figure 4, the spatial pattern of ESV on Hainan Island underwent significant evolution during the study period. The overall landscape was predominantly characterized by higher-value and medium-value zones, the combined proportion of which consistently exceeded 58% across all observed periods. In contrast, the high-value zones accounted for the lowest proportion, remaining persistently below 5.50%.
From the perspective of the overall evolution of the spatial pattern, the grade structure of the ESV on Hainan Island during the study period exhibited the characteristics of “fluctuation in the low-value zones, expansion in the medium-value zones, and shrinkage in the high value-zones.” Specifically, the proportion of the low-value zones expanded to 22.08%, primarily agglomerating in coastal plains, the peripheries of urban agglomerations, and along major transportation corridors. This expansion reflects the significant stress exerted by urbanization and land-use changes on ecosystem services. The proportion of the lower-value zones decreased from 17.24% to 14.74%, gradually transitioning into the medium-value zones. The medium-value zones experienced continuous expansion and extended deeper into the inland areas, with its proportion increasing from 26.36% to 31.23%. Spatially, these zones evolved from fragmented distribution to a concentrated and contiguous pattern. Conversely, the higher-value zones shifted from continuous distribution to a fragmented state, with its proportion declining from 37.41% to 28.37%. This shrinkage was particularly pronounced in the northeastern and southwestern marginal areas of the island. Furthermore, the proportion of the high-value zones decreased from 5.16% to 3.59%. These zones were mainly distributed across key ecological patches, such as medium- and large-scale reservoirs, vital wetlands, and nature reserves, presenting an “insularization” pattern. This spatial configuration indicates that the distribution of aquatic ecosystems exerts a constraining effect on the spatial pattern of the high-value zones.

4.3. Spatial and Temporal Changes in ERI

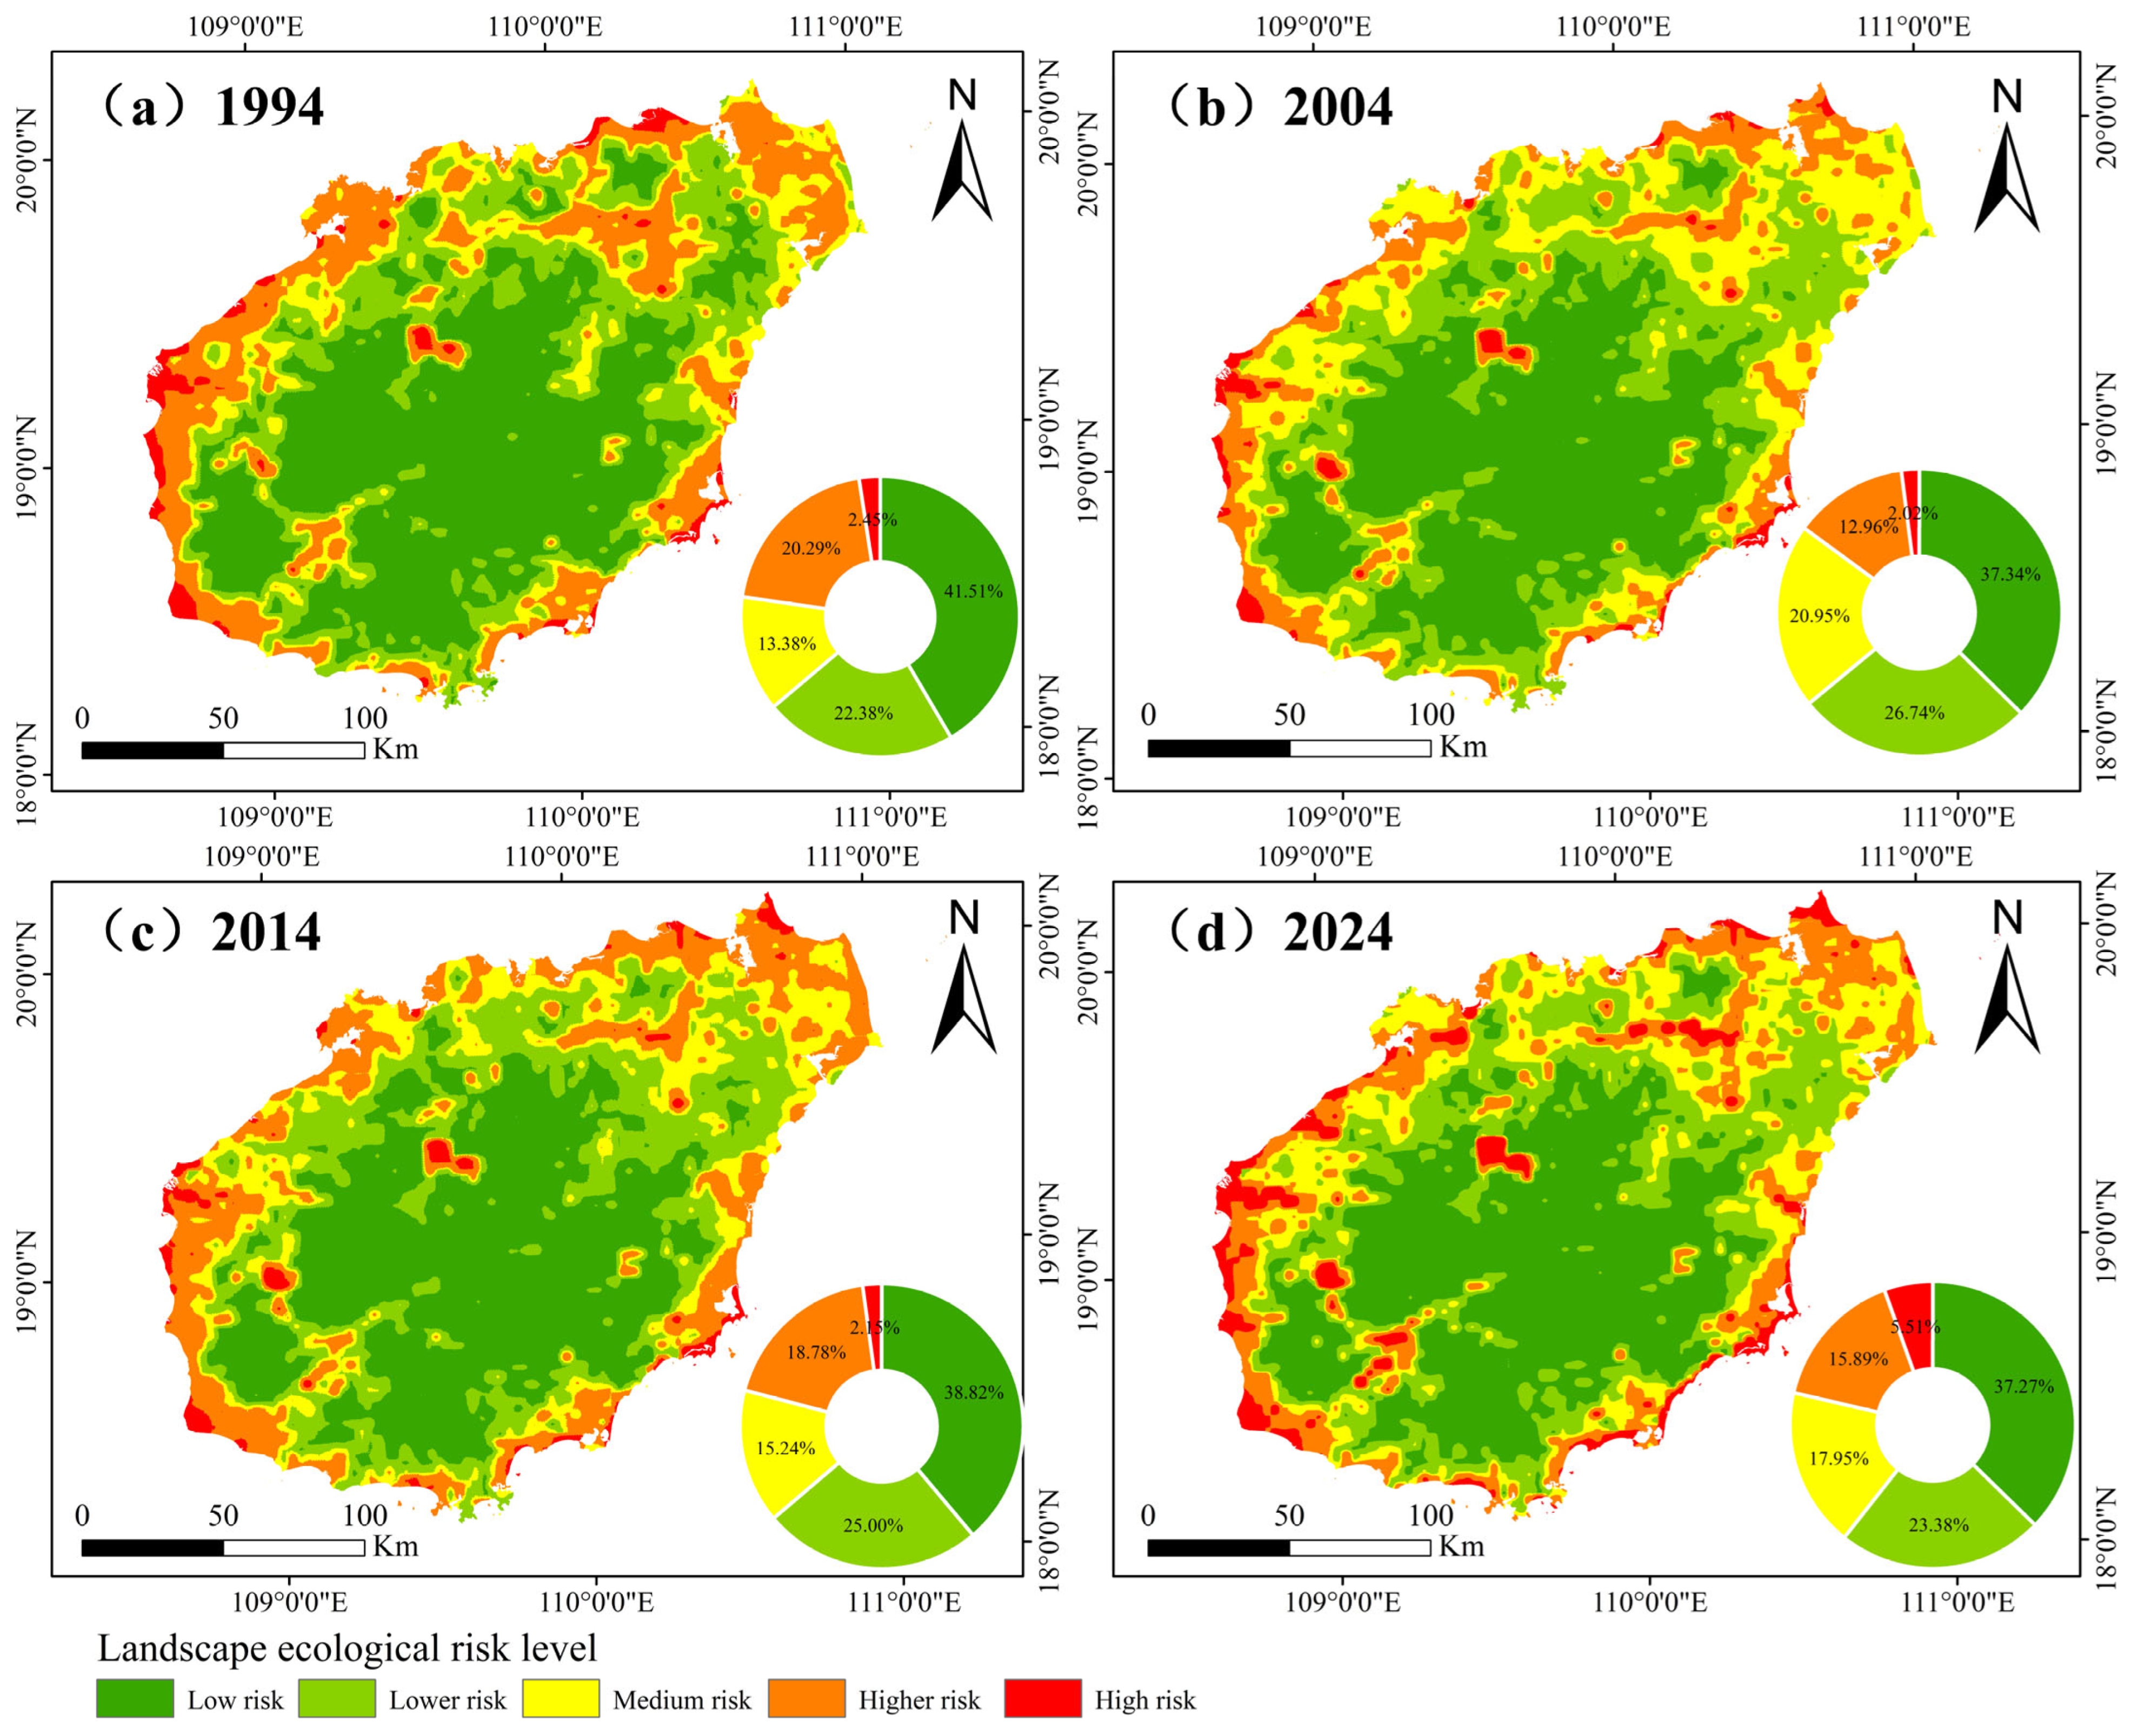
While ESV characterizes the supply side of ecological security, the ERI reflects its disturbance side. According to the ERI calculation results, the ERI of Hainan Island in 1994, 2004, 2014, and 2024 was 0.0371, 0.0368, 0.0381, and 0.0539, respectively. The overall trend exhibited a fluctuating upward trajectory, indicating that the regional ecological security pressure has continuously intensified over the past 30 years. This upward trajectory is consistent with island-scale evidence that the landscape ecological security of Hainan deteriorated markedly alongside the expansion of construction land during 2000–2020 [46], confirming that the intensification captured here is not an artifact of the present grid scale but a robust, independently reported regional trend. Following established practice in landscape ecological risk assessment, the Natural Breaks (Jenks) method was employed to classify the ERI into five distinct risk grades: low, lower, medium, higher, and high risk [57]. The area changes of each risk level from 1994 to 2024 were statistically analyzed, as shown in Table 8.
The results demonstrate that the areas of different risk levels exhibited distinct characteristics of structural evolution. Specifically, both the low-risk and higher-risk zones displayed a trend of initially decreasing, subsequently increasing, and then decreasing again. The lower-risk zones experienced an initial increase followed by a decrease, whereas the medium-risk zones showed an overall expansion. Conversely, the high-risk zones exhibited a continuous fluctuating upward trend. In detail, from 1994 to 2024, the area of the medium-risk zones expanded from 4529.77 km2 to 6078.14 km2, representing an increase of 34.18%. Simultaneously, the area of the high-risk zones surged from 828.91 km2 to 1866.37 km2, marking a dramatic increase of 125.16%. These changes reflect the exacerbation of ecological degradation and the escalation of ecological risks in localized areas. Overall, the contraction of the low-risk zones, coupled with the expansion of the high-risk zones, collectively drove the elevation of the ERI on Hainan Island. Moving forward, it is imperative to implement differentiated ecological restoration and spatial management strategies targeting the higher risk and high-risk zones. Such measures are crucial to halting the expansion of high-risk zones and promoting the optimization of the risk grade structure toward a lower risk orientation.
As shown in Figure 5, the spatial pattern of ERI grades on Hainan Island from 1994 to 2024 exhibited a distinct spatial differentiation feature, characterized generally by higher risks in coastal areas and lower risks in inland regions. The low-risk and lower-risk zones were predominantly distributed across the central mountainous areas, including Bawangling and Jianfengling. Owing to higher elevations, extensive vegetation coverage, and minimal human disturbance, these areas maintained robust ecosystem stability. The combined proportion of these two zones decreased from 63.89% in 1994 to 60.65% in 2024. Although they remained the dominant landscape components, they experienced an overall fluctuating shrinkage. The medium-risk zones were primarily located between the inland low-risk zones and the coastal high-risk zones, constituting an ecological gradient belt that transitions from lower to higher risks. Geographically, these zones were mainly distributed in southwestern Danzhou, central Tunchang, north-central Lingao, and eastern Qionghai. The proportion of these zones increased from 13.38% in 1994 to 17.95% in 2024, indicating a clear expansion of the risk-transition area. Conversely, the higher-risk and high-risk zones primarily agglomerated along the coastal economic belt. These zones extended in a linear pattern along the Eastern Expressway, the Island Ring Tourist Highway, and the Western Industrial Corridor, demonstrating a distinct spatial characteristic of agglomerating along major axes and distributing around bays. Although their combined proportion slightly decreased from 22.74% to 21.40%, the specific proportion of the high-risk zones surged from 2.45% to 5.51%, exhibiting a prominent fluctuating expansion.
Overall, the low-risk zones in the central mountainous area remained relatively stable, serving as a crucial ecological security barrier for Hainan Island. In contrast, the coastal high-risk zones experienced continuous expansion, gradually emerging as the primary source of regional ecological risks. Meanwhile, the medium-risk zones assumed the role of transition and transformation between the inland low-risk zones and the coastal high-risk zones.

4.4. Ecological Zoning Construction

4.4.1. Characteristics of the Spatial and Temporal Evolution of Ecological Zones

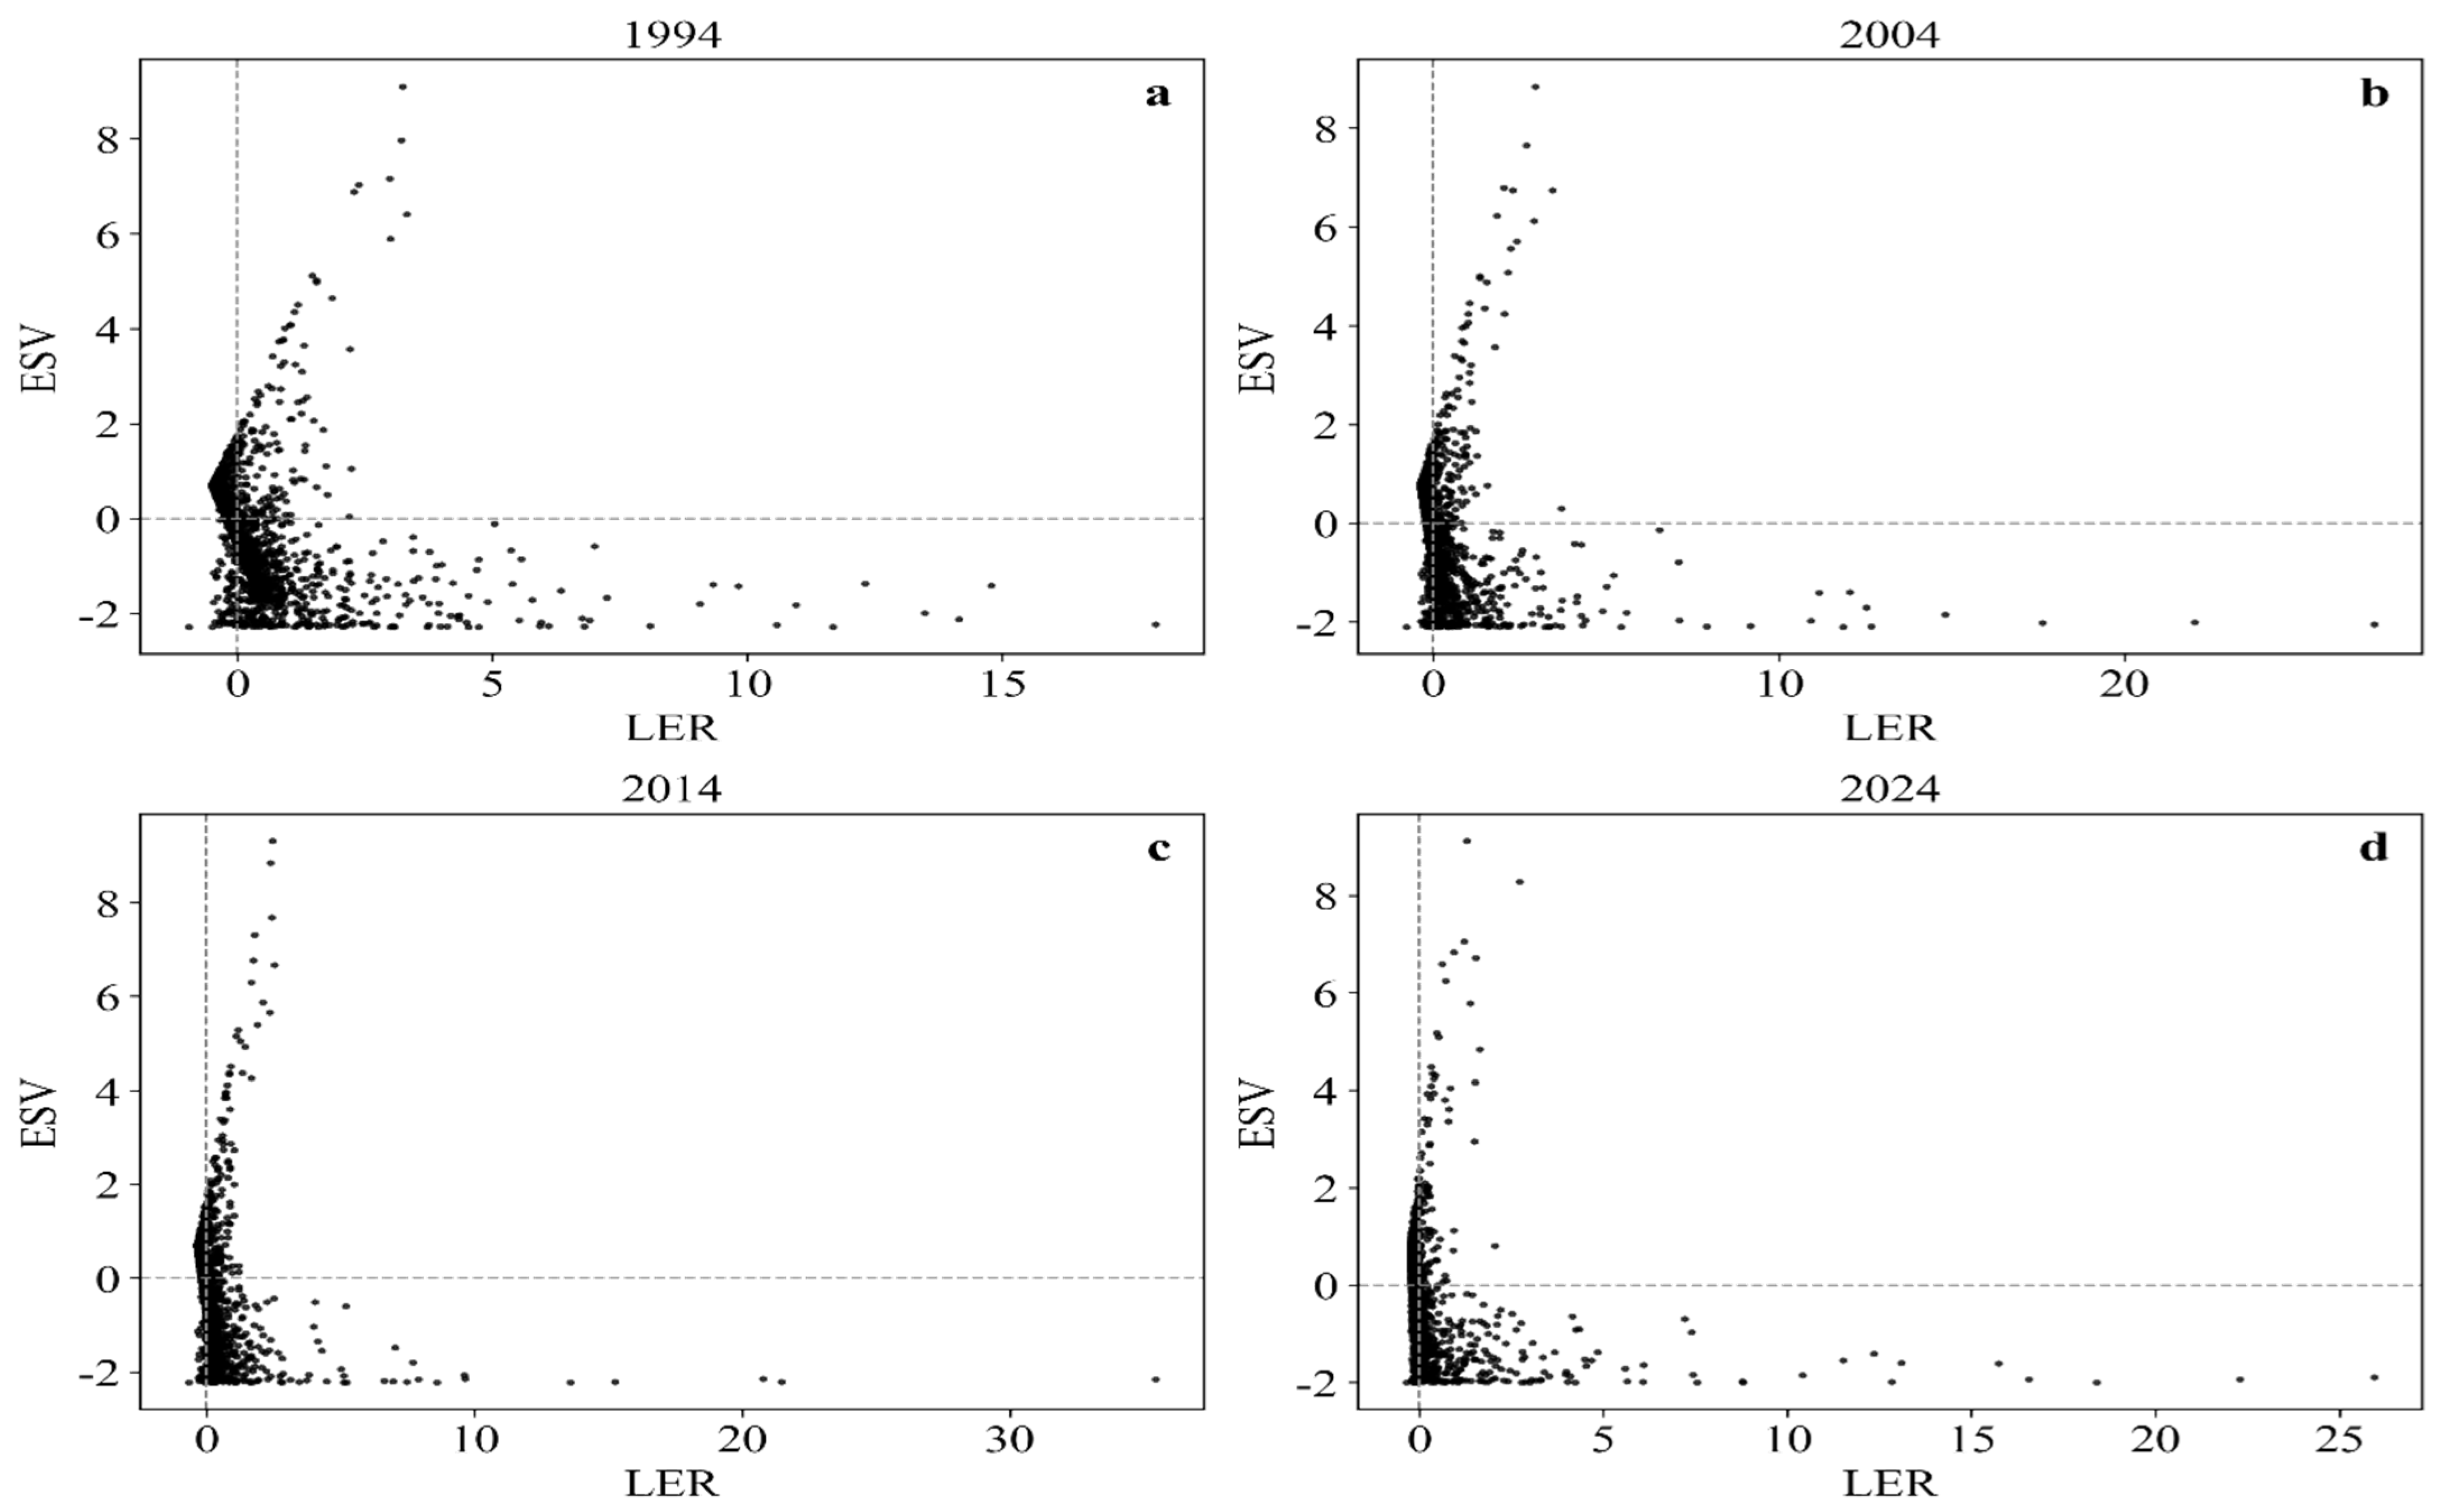
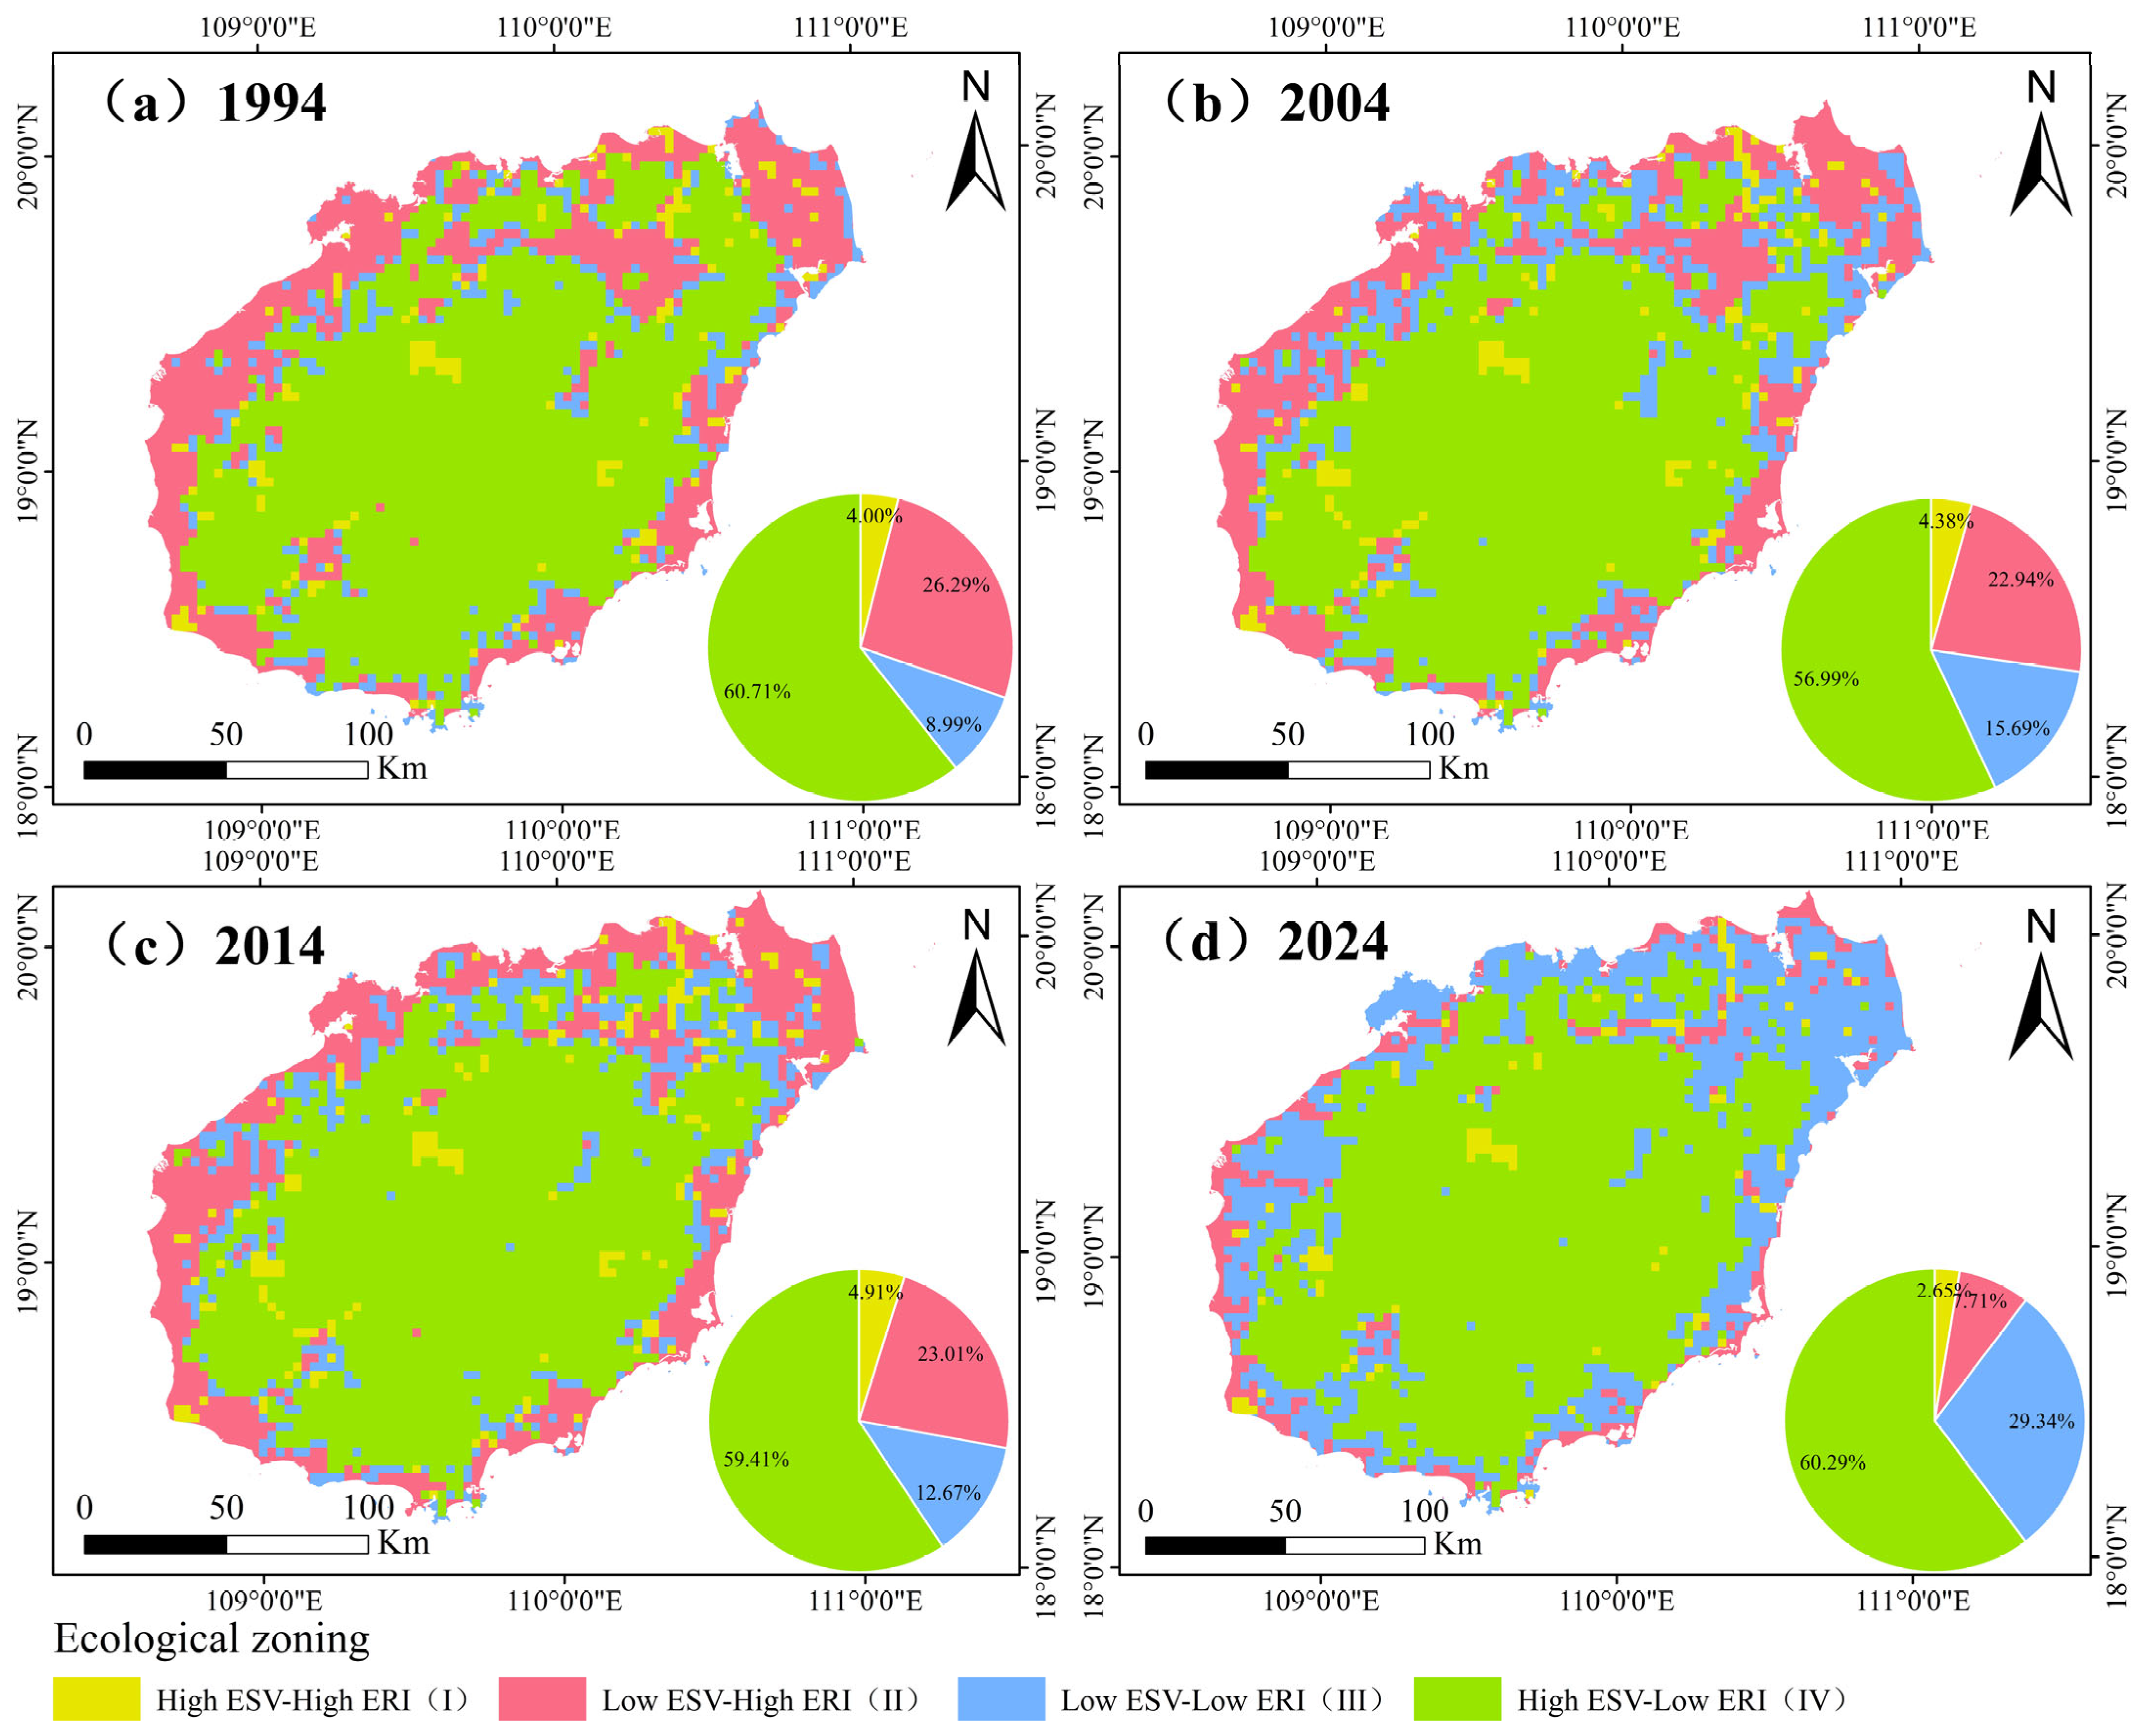
Having characterized the two indices separately, we next coupled them to delineate ecological zones. By applying Z-score standardization to both the ESV and the ERI, the quadrant distribution map and the spatial pattern map of ecological zones on Hainan Island from 1994 to 2024 were constructed, as shown in Figure 6 and Figure 7. Subsequently, a statistical analysis of the ecological zones across the four periods was conducted (Table 9). Based on the respective high and low values of the standardized ESV and ERI, the entire island was classified into four distinct types of ecological zones: ecological conservation and quality improvement zone (high ESV-high ERI), ecological risk prevention and control zone (low ESV-high ERI), ecological improvement and development zone (low ESV-low ERI), ecological barrier protection zone (high ESV-low ERI).
From the perspective of different zone types, the study area was dominated by the ecological barrier protection zone (IV), which accounted for 56.99% to 60.71% of the total area of the island, fluctuating between 19,298.02 km2 and 20,557.89 km2 during 1994–2024. This sub-zone was concentrated in the central mountainous areas, such as Wuzhishan, Qiongzhong, and Baisha, where the land types were mainly forestland and high-coverage grassland, making it the core stable area for regional ecological security.
The area of the ecological improvement and development zone (III) showed a significant expansion trend, increasing from 3045.51 km2 to 9936.46 km2, an increase of 226.27%. Spatially, it was mainly distributed in the transition belt between inland hills and coastal plains in 2024, predominantly consisting of cultivated land and medium-to-low-coverage grassland.
In contrast, the ecological risk prevention and control zone (II) showed a continuous decreasing trend, and the area decreased sharply from 8902.41 km2 to 2612.43 km2, with a decreasing rate of 70.66%. This sub-zone was widely distributed in the coastal plains, the peripheries of urban built-up areas, and along major transportation corridors, heavily overlapping with areas of intense human activities.
The ecological conservation and quality improvement zone (I) showed a fluctuating trend of an inverted “V” shape. The area dropped from 1356.17 km2 to 896.74 km2, with a total decrease of 33.88%. Spatially scattered, it was agglomerated along rivers, reservoirs, and wetlands.
Overall, Hainan Island was dominated by the ecological barrier protection zone (IV), accompanied by a gradual expansion of the ecological improvement and development zone (III), while the ecological conservation and quality improvement zone (I) and the ecological risk prevention and control zone (II) showed a shrinking trend.

4.4.2. Differentiated Management and Control Strategies for Ecological Zones

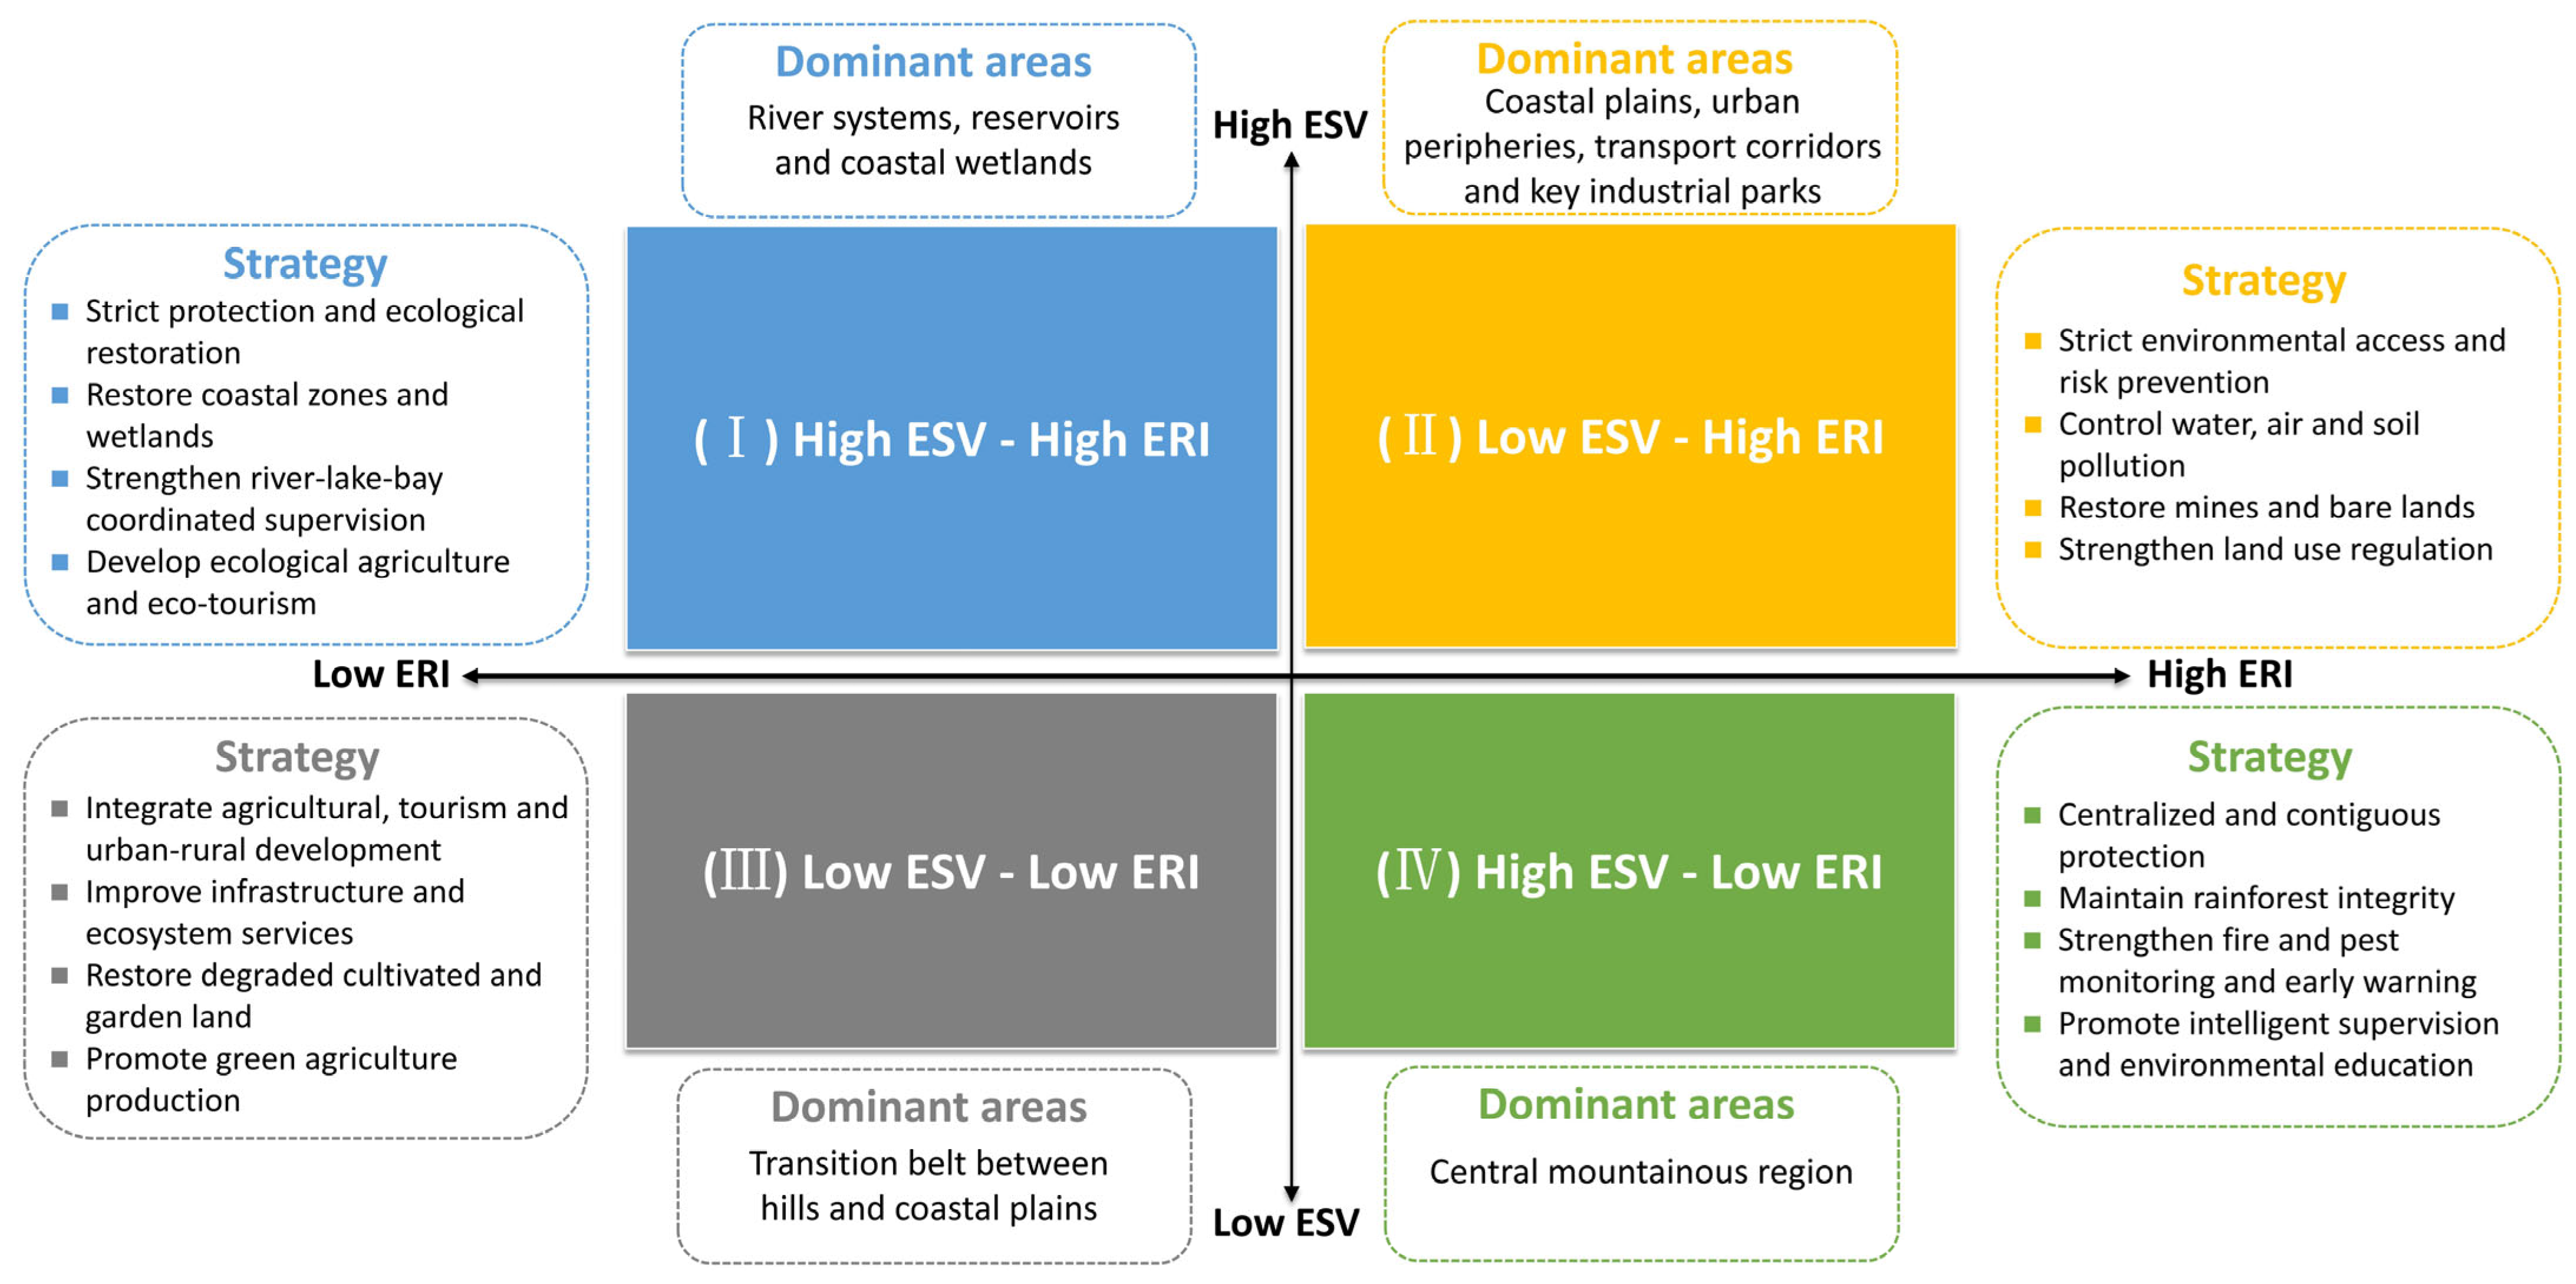
Based on the characteristics of ESV and ERI in the grid cells, coupled with the physical geographical conditions, current land-use status, and socio-economic development features of Hainan Island, differentiated management and control strategies were implemented for the four types of ecological zones (Figure 8). The specific strategies are as follows:
(1)
The ecological conservation and quality improvement zone (I) serves as a crucial supply area for ecological service functions and a priority area for ecological restoration on Hainan Island. It is mainly distributed in river systems, reservoirs, and concentrated coastal wetland areas, such as mangroves and coral reefs. This zone should prioritize strict protection and ecological restoration. Development activities incompatible with its functional positioning must be gradually phased out. Furthermore, it is essential to advance the restoration of coastal zones and wetlands, strengthen the coordinated supervision of rivers, lakes, and bays, and explore the integrated development of ecological agriculture, tourism, and science popularization on cultivated land.
(2)
The ecological risk-prevention and control zone (II) represents the weak link in the ecological security pattern of Hainan Island. It is primarily distributed in coastal plains, urban peripheries, transportation corridors, and key industrial parks. This zone should emphasize environmental access thresholds and risk prevention. The layout of high-water-consuming and high-emission industries must be strictly restricted. Additionally, efforts should be made to strengthen the treatment of water, air, and soil pollution, promote the restoration of mines and bare lands, reinforce territorial spatial use control, and curb the disorderly expansion of high-risk zones.
(3)
The ecological improvement and development zone (III) is a potential area for advancing ecological restoration and green development. Located mainly in the transition belt between inland hills and coastal plains, it serves as a vital carrying capacity area for agricultural production and urban-rural integrated development. It is necessary to coordinate ecological restoration with industrial upgrading, continuously restore degraded cultivated and garden land, and promote green agricultural practices.
(4)
The ecological barrier protection zone (IV) constitutes the most critical ecological security barrier and water conservation area of Hainan Island. It is concentrated in the central mountainous areas, including Wuzhishan, Qiongzhong, Baisha, and Baoting, with tropical rainforest ecosystems and nature reserves of various levels as its main body. This zone should adhere to centralized and contiguous protection to strictly maintain the authenticity and integrity of the tropical rainforest ecosystem. Moreover, it is crucial to improve the monitoring and early warning systems for forest fires and pests, promote intelligent supervision, and carry out ecological experience and environmental education activities.
Overall, the ecological zoning management of Hainan Island should follow the principle of “Core conservation, barrier prioritization, collaborative improvement, and simultaneous prevention and control.” Through zoning management, the region can solidify the ecological barrier in the central mountains, stabilize the ecological functions of coastal wetlands, enhance the ecological performance of agricultural areas, and strictly control the ecological risks of key development zones, ultimately driving the elevation of ESV and the reduction of ERI.

5. Discussion

5.1. Response of ESV and ERI to Land-Use Changes

The Millennium Ecosystem Assessment Report released by the United Nations indicates that approximately 60% of the global ecosystem services examined are being degraded or used unsustainably, and the IPBES Global Assessment further documents that around 75% of the terrestrial environment has been “severely altered” by human action [3,58]. Against this background, the quantity and direction of land-use and land-cover change (LUCC) directly reshape ecological processes such as energy exchange, water cycling, and nutrient cycling, thereby altering both the supply of ecosystem services and the level of landscape ecological risk [48,49]. The Hainan Island record from 1994 to 2024 is fully consistent with this general mechanism but reveals a distinctly tropical-island variant of it: construction land expanded by 197.68%, forest land and grassland contracted by 9.36% and 93.78% respectively, total ESV declined from 200.961 to 186.278 billion CNY (−7.31%), and ERI rose from 0.0371 to 0.0539 (+45.28%). The two indices therefore moved in mirrored but coupled directions, driven by the same land-use sequence.
The direction of the ESV response—ESV declining in step with construction-land expansion—echoes a substantial body of recent evidence. Wu et al. [59] for Jiangsu Province and Zhang and Li [60] for the Shennongjia Nature Reserve both report that ESV decreases in lockstep with the expansion of built-up land; Li et al. [61] observe the same pattern in the middle and lower reaches of the Yellow River, where the conversion of cultivated land to construction land in northwestern Henan Province reduced regional ESV; and Bai et al. [62] find that, in the Qinling–Daba Mountains, geosocial drivers exerted a predominantly negative effect on the ecosystem service composite index. Where the Hainan record departs from these inland references is in the velocity and spatial signature of the decline: the contraction unfolded under three successive macro-policy regimes—the Special Economic Zone real-estate liberalization of the 1990s, the International Tourism Island strategy of the 2010s, and the Hainan Free Trade Port construction since 2018—each of which lowered the institutional cost of converting forest, grassland, and coastal wetland into construction land along the ring-island corridor [19,20,21]. As a result, the ESV loss is not evenly distributed: it is concentrated in the coastal plains around Haikou, Sanya, and the eastern transport corridor, while the central mountainous core has retained most of its supply capacity, with forest land continuing to contribute over 83% of the remaining ESV.
The spatial signature of the ERI rise is consistent with this same mechanism. Forest-dominated landscapes tend to exhibit lower landscape ecological risk because of their relatively stable structure and high connectivity [63]; this is precisely why the central mountainous core of Hainan, where forest cover still approaches 60%, retained low-to-medium ERI throughout the four study periods. The same dynamic has been documented in the Gaoligong Mountains, where Yang et al. [64] attribute persistently low ERI to forest-dominated landscapes (forest cover exceeding 45%) and limited human disturbance, with the average landscape ecological risk declining by nearly 20% over 2000–2020 as low-risk forest areas expanded. Conversely, the expansion of built-up land is the dominant pathway through which ERI rises: Gao et al. [65] show that, in the Yangtze River Delta, the encroachment of built-up land on ecological land increased landscape fragmentation and broadened the spatial extent of high-risk zones; Lin and Wang [66] reach a similar conclusion for the mountainous city of Guiyang, with the highest risk concentrated in the urban core. The Hainan ring-island belt corresponds to this same archetype, but at a tropical-island scale at which the high-risk land directly abuts coastal wetlands, mangroves, and reef-adjacent waters—landscape elements whose loss would feed back into further ERI increases in subsequent periods.
Seen jointly, the ESV decline and the ERI rise form a coupled trajectory: the same construction-land expansion that erodes the supply of regulating services also amplifies the exposure–sensitivity component of landscape risk. This coupling is, in our view, the principal reason why single-indicator zoning frameworks—whether based on ESV alone or on landscape risk alone—tend to under-identify the transition belt between the inland mountains and the coastal plains, where supply is moderate but pressure is rising fastest [22,23]. This coupled, transition-belt signal is precisely what the integrated ESV–ERI framework is designed to capture, and the translation of this finding into the operational language of territorial spatial planning is taken up in Section 5.3.

5.2. Advantages and Applicability of Integrating ESV and ERI to Delineate Ecological Zones

Building on this coupled mechanism, ESV and ERI are both established indicators of regional ecological security, and both respond to alterations in the landscape pattern [9,10]. They differ, however, in what they reveal: ERI emphasizes the sensitivity of ecosystems to internal and external disturbances and reflects the ecological status from a negative perspective, whereas ESV reflects the benefits ecosystems deliver to human welfare and represents a positive reflection of ecological security [8,11,12]. Used jointly, the two indices offer a two-dimensional perspective from which ecological security can be diagnosed simultaneously from its positive and negative sides—an analytical capability that single-indicator approaches, such as Zhou et al. [39]’s risk-only zoning of the Hainan Tropical Rainforest National Park or Bai et al.’s [62] service-only zoning of the Qinling–Daba Mountains, are structurally unable to deliver.
Beyond this diagnostic complementarity, the applicability of the integrated framework to Hainan is grounded in a setting that is structurally different from the closest published precedents summarized in Section 2 (Table 2): a humid tropical island with a steep inland–coastal ecological gradient, a 30-year, four-period observational record, and an unusually dense sequence of national-level policy regimes. As such, the present application extends the Z-score quadrant logic to a biogeographic and policy context in which ecological supply and development pressure are spatially adjacent rather than diffuse and in which zoning results must be articulated against operational planning instruments rather than against the generic conservation principles emphasized in low-pressure inland or mountain settings [15,16,30,31]. As Liu et al. [67] have argued, ecological zoning is a crucial instrument for ecosystem management precisely because it allows decision-makers to identify priority areas for ecological protection and to anticipate, rather than react to, the negative impacts of natural and anthropogenic disturbances. The four ecological zones delineated here perform exactly this function on Hainan: they translate a complex spatiotemporal ESV–ERI record into a small number of management-actionable categories, each of which corresponds to a distinct combination of supply and pressure and therefore to a distinct portfolio of protection, restoration, control, and improvement measures. In this respect, the present study advances beyond the single-region, single-period coupling reported for inland and mountain settings (Section 2, Table 2) by demonstrating that the quadrant logic remains diagnostic across four decades and along a steep tropical-island gradient.

5.3. From Ecological Zones to Policy Instruments

Translating these diagnostic zones into actionable policy is the final step of our framework. A persistent limitation of much prior ESV–ERI zoning work is that the zones produced, even when scientifically defensible, are not articulated in the operational language used by Chinese territorial spatial planning, leaving a translational distance between scientific output and policy instrument [68]. The four-zone scheme proposed here is designed to close this gap.
The ecological barrier protection zone, distributed across the central mountainous core where high ESV coincides with low ERI, is conceptually aligned with the priority delineation logic of the Ecological Protection Red Line (EPRL), China’s most stringent terrestrial conservation instrument [18]. For Hainan, this zone overlaps with the Hainan Tropical Rainforest National Park and the inland water-source protection areas; planners should adhere strictly to the ecological red line and combine the afforestation and restoration of degraded forests to consolidate the integrity of the natural ecosystem [69].
The ecological risk-prevention and control zone, concentrated along the ring-island coastal belt where low ESV coincides with high ERI, is conceptually aligned with the urban development boundary and coastal-zone management line specified in the National Territorial Spatial Planning Outline (2021–2035) [17]. Local governments must therefore strictly control construction activities, prioritize industries compatible with the area’s ecological-improvement function, and embed risk-graded environmental access thresholds, stricter constraints on coastal wetland conversion, and limits on reef-adjacent reclamation into the negative list of the Free Trade Port’s spatial governance framework [70].
The ecological improvement and development zone, occupying the inland-hill-to-coastal-plain transition belt where ESV and ERI are both at intermediate levels, is conceptually aligned with the permanent basic farmland and rural-revitalization layers of territorial spatial planning [17]. Here supply-side restoration (agroforestry, riparian buffer reconstruction) needs to be combined with risk-side mitigation (point-source pollution control along secondary tributaries), deployed through coordinated instruments such as high-standard farmland construction, mine ecological restoration, and watershed-scale soil and water conservation management [71].
The ecological conservation and quality-improvement zone, clustered along rivers and reservoirs, is conceptually aligned with the water-source conservation area and the watershed-scale ecological compensation instruments [72]. This zone supplies a disproportionate share of the island’s hydrological-regulation ESV while simultaneously bearing rising point-source pressures from upstream agricultural and tourism activity, justifying closed management, ecological protection demonstration zones, and strict monitoring against destructive behaviors such as illegal logging and reservoir-side encroachment [73].
By aligning the four zones with established planning instruments—ecological protection red line (EPRL), urban development boundary, permanent basic farmland and water-source conservation areas—the framework provides a quantitative, multi-period decision-support layer on which the conservation mandate of the National Ecological Civilization Pilot Zone and the development mandate of the Hainan Free Trade Port can be co-managed in tropical-island settings facing comparable pressures [17,18,21].

5.4. Limitations

Several limitations should nevertheless be acknowledged. Firstly, the ESV evaluation employed the unit-area equivalent factor method [28,44], which, while widely adopted in the Chinese ESV literature for its data efficiency and cross-region comparability [2,4,6], underrepresents the scarcity of services and the variation in their marginal values; future research should integrate ecosystem service flow models and value-correction coefficients to enhance accuracy and dynamic adaptability [74]. Secondly, the ecological zones were identified on a regular 3 km × 3 km grid. Although this captures spatial heterogeneity well, the resulting boundaries do not align tightly with current administrative divisions and physical geographic boundaries, which limits direct implementation. Subsequent work should explore hybrid grid–watershed–administrative units or adopt the township-level “zoning unit” approach used in recent territorial spatial planning practice [75]. Thirdly, Hainan Island lies in a typhoon-prone zone, and the current ESV and ERI estimates do not explicitly incorporate extreme-event disturbances. With tropical cyclone intensity and frequency projected to shift under climate change, future work should integrate the dynamic response models of ecosystem services and ecological risks under extreme weather, providing a scientific basis for climate-adaptive ecological security management [76].

6. Conclusions

In this paper, an integrated ESV–ERI ecological zoning framework was constructed for Hainan Island over 1994–2024 based on the unit-area equivalent factor method and the landscape ecological risk index, respectively, with the two indices coupled through Z-score standardization and resolved on a 3 km × 3 km grid. The four resulting ecological zones were then articulated against the operational instruments of China’s territorial spatial planning system. The findings revealed the following: from 1994 to 2024, land use on Hainan Island shifted markedly under the successive policy regimes of the Special Economic Zone, the International Tourism Island, and the Free Trade Port, with construction land expanding by 197.68% and forest and grassland contracting by 9.36% and 93.78%, respectively. Driven by this trajectory, total ESV declined from 200.961 to 186.278 billion CNY (−7.31%), with forest land contributing over 83% of the remaining value, while ERI rose from 0.0371 to 0.0539 (+45.28%). ESV and ERI exhibited mirrored spatial patterns—high inland and low coast for ESV, low inland and high coast for ERI—forming a centrifugal gradient of ecological supply and pressure. On this basis, four ecological zones were delineated from the ESV–ERI quadrant: the ecological barrier protection zone in the central mountains, the ecological risk-prevention and control zone along the ring-island coastal belt, the ecological improvement and development zone in the inland-hill-to-coastal-plain transition, and the ecological conservation and quality-improvement zone along rivers and reservoirs. These four zones correspond directly to the Ecological Protection Red Line, the urban development boundary and coastal-zone management line, the permanent basic farmland and rural revitalization layers, and the water-source conservation areas, respectively, thereby providing a transferable, evidence-based zoning instrument for the dual-mandate governance of the Hainan National Ecological Civilization Pilot Zone and Free Trade Port and, more broadly, for tropical-island regions facing the same tension between coastal development and inland conservation. Future work integrating ecosystem-service flow models and extreme-event disturbances would further enhance the dynamic adaptability of this framework under climate change.

Author Contributions

Conceptualization, S.G.; methodology, S.G.; software, M.H.; validation, S.G. and M.H.; formal analysis, S.G.; investigation, S.G.; resources, S.G.; data curation, I.P.L.; writing—original draft preparation, S.G.; writing—review and editing, S.G.; visualization, M.H.; supervision, I.P.L.; project administration, I.P.L. All authors have read and agreed to the published version of the manuscript.

Funding

This research received no external funding.

Institutional Review Board Statement

Not applicable.

Informed Consent Statement

Not applicable.

Data Availability Statement

The data presented in this study are available on request from the corresponding author.

Conflicts of Interest

The authors declare no conflicts of interest.

Abbreviations

The following abbreviations are used in this manuscript:
ESVEcosystem Service Value
ERILandscape Ecological Risk Index

References

  1. Yi, Y.; Zhao, Y.; Ding, G.; Gao, G.; Shi, M.; Cao, Y. Effects of urbanization on landscape patterns in a mountainous area: A case study in the Mentougou District, Beijing, China. Sustainability 2016, 8, 1190. [Google Scholar] [CrossRef]
  2. Geng, T.W.; Chen, H.; Zhang, H.; Shi, Q.Q.; Liu, D. Spatiotemporal evolution of land ecosystem service value and its influencing factors in Shaanxi province based on GWR. J. Nat. Resour. 2020, 35, 1714–1727. [Google Scholar] [CrossRef]
  3. IPBES. Global Assessment Report on Biodiversity and Ecosystem Services of the Intergovernmental Science-Policy Platform on Biodiversity and Ecosystem Services; IPBES Secretariat: Bonn, Germany, 2019; 1148p. [Google Scholar] [CrossRef]
  4. Zhu, R.M.; Chen, S.L. Spatial relationship between landscape ecological risk and ecosystem service value in Fujian Province, China during 1980–2020. J. Appl. Ecol. 2022, 33, 1599–1607. [Google Scholar] [CrossRef] [PubMed]
  5. United Nations. Transforming Our World: The 2030 Agenda for Sustainable Development; A/RES/70/1; United Nations: New York, NY, USA, 2015; 35p.
  6. Zhang, Y.L.; Hu, X.J.; Wei, B.J.; Zhang, X.; Tang, L.; Chen, C.Y.; Wang, Y.Z.; Yang, X.J. Spatiotemporal exploration of ecosystem service value, landscape ecological risk, and their interactive relationship in Hunan Province, Central-South China, over the past 30 years. Ecol. Indic. 2023, 156, 111066. [Google Scholar] [CrossRef]
  7. Xie, G.D.; Zhang, C.X.; Zhen, L.; Zhang, L.M. Dynamic changes in the value of China’s ecosystem services. Ecosyst. Serv. 2017, 26, 146–154. [Google Scholar] [CrossRef]
  8. Wang, Y.; Liu, H. Integrating landscape ecological risk and ecosystem services for ecological zoning and management in the Wuling Mountain Area. Ecol. Indic. 2025, 179, 114179. [Google Scholar] [CrossRef]
  9. Wu, H.; Zhang, Z.; Zhou, J.; Chen, X.; Kong, Y.; Kong, X. Spatial differentiation and association between ecosystem service value and landscape ecological risk index in Anning River dry valley. PeerJ 2026, 14, e20914. [Google Scholar] [CrossRef] [PubMed]
  10. Li, Y.; Xie, H. Spatial–temporal variation and correlation analysis of ecosystem service values and ecological risks in winter city Shenyang, China. Sci. Rep. 2024, 14, 18182. [Google Scholar] [CrossRef] [PubMed]
  11. Li, Y.; Qiu, L.; Luo, G.; Wu, L. Zoning optimization of ecosystem service value and landscape ecological risk in typical karst areas in southwest China. Sci. Rep. 2025, 15, 33374. [Google Scholar] [CrossRef] [PubMed]
  12. Duarte, G.T.; Ribeiro, M.C.; Paglia, A.P. Ecosystem services modeling as a tool for defining priority areas for conservation. PLoS ONE 2016, 11, e0154573. [Google Scholar] [CrossRef] [PubMed]
  13. Liang, S.H.; Li, W.; Gao, Y.; Liu, B.Z. Correlations between ecosystem service value and landscape ecological risk and its spatial heterogeneity in Jilin Province, China. J. Appl. Ecol. 2024, 35, 769–779. [Google Scholar] [CrossRef] [PubMed]
  14. Chen, C.Y.; Jia, X.; Zhao, Y.H.; Shan, L.S.; Si, S.C.; Zhao, M.; Zhang, P. Ecological zoning of Hexi Corridor, Northwest China with coupled ecosystem service value and ecological risk assessment. J. Appl. Ecol. 2026, 37, 213–222. [Google Scholar] [CrossRef] [PubMed]
  15. Gao, J.; Pan, N.; Zhou, D. Integrating landscape ecological risk and ecosystem services for ecological zoning in the Qilian Mountain National Park. Ecosyst. Health Sustain. 2025, 11, 0441. [Google Scholar] [CrossRef]
  16. Wang, Z.; Wang, B.; Zhang, Y.; Sa, R.; Zhang, Q.; Hao, S. Ecological zone construction and multi-scenario simulation in Western China combining landscape ecological risk and ecosystem service value. Sci. Rep. 2025, 15, 11297. [Google Scholar] [CrossRef] [PubMed]
  17. Central Committee of the Communist Party of China; State Council of the People’s Republic of China. National Territorial Spatial Planning Outline (2021–2035); State Council of the People’s Republic of China: Beijing, China, 2022.
  18. Ministry of Natural Resources of the People’s Republic of China. Blue Book on Ecological Protection Red Lines (2023); China Land Surveying and Planning Institute: Beijing, China, 2023. [Google Scholar]
  19. Liu, H.; Zhang, G.; Li, T.; Ren, S.; Chen, B.; Feng, K.; Li, W.; Zhao, X.; Qin, P.; Zhao, J. Importance of ecosystem services and ecological security patterns on Hainan Island, China. Front. Environ. Sci. 2024, 12, 1323673. [Google Scholar] [CrossRef]
  20. Lei, J.; Chen, Y.; Li, L.; Chen, Z.; Chen, X.; Wu, T.; Li, Y. Spatiotemporal change of habitat quality in Hainan Island of China based on changes in land use. Ecol. Indic. 2022, 145, 109707. [Google Scholar] [CrossRef]
  21. Central Committee of the Communist Party of China; State Council of the People’s Republic of China. Overall Plan for the Construction of Hainan Free Trade Port; State Council of the People’s Republic of China: Beijing, China, 2020.
  22. Wei, X.; Abulizi, A.; Yuan, L.; Wang, J.; Bai, S.; Tang, S.; Yerkenhazi, A. A study on ecological risk identification based on ecosystem service supply and demand in Xinjiang. Sci. Rep. 2025, 15, 28575. [Google Scholar] [CrossRef] [PubMed]
  23. Guo, Y.; Zheng, H.; Wu, T.; Wu, J.; Robinson, B.E. A review of spatial targeting methods of payment for ecosystem services. Geogr. Sustain. 2020, 1, 132–140. [Google Scholar] [CrossRef]
  24. Xu, F.; Yan, S.; Wang, X.; Wang, X. Ecological management zoning through integration of ecosystem service and landscape ecological risk: A case study in Chongli, China. Land 2025, 14, 1133. [Google Scholar] [CrossRef]
  25. Huang, X.; Liu, X.; Jin, Y.; Gao, X.; Chen, Y. Identification and attribution analysis of integrated ecological zones based on the XGBoost-SHAP model: A case study of Chengdu, China. Ecol. Indic. 2025, 177, 113787. [Google Scholar] [CrossRef]
  26. Costanza, R.; d’Arge, R.; de Groot, R.; Farber, S.; Grasso, M.; Hannon, B.; Limburg, K.; Naeem, S.; O’Neill, R.V.; Paruelo, J.; et al. The value of the world’s ecosystem services and natural capital. Nature 1997, 387, 253–260. [Google Scholar] [CrossRef]
  27. Cao, Q.; Zhang, X.; Lei, D.; Guo, L.; Sun, X.; Kong, F.E.; Wu, J. Multi-scenario simulation of landscape ecological risk probability to facilitate different decision-making preferences. J. Clean. Prod. 2019, 227, 325–335. [Google Scholar] [CrossRef]
  28. Xie, G.D.; Lu, C.X.; Leng, Y.F.; Zheng, D.; Li, S.C. Ecological assets valuation of the Tibetan Plateau. J. Nat. Resour. 2003, 18, 189–196. [Google Scholar]
  29. Zhang, W.; Chang, W.J.; Zhu, Z.C.; Hui, Z. Landscape ecological risk assessment of Chinese coastal cities based on land use change. Appl. Geogr. 2020, 117, 102174. [Google Scholar] [CrossRef]
  30. Wang, F.; Wu, Y.; Zhang, Y.; Wang, J.; Xue, Z.; Tan, X.; Jia, W. Research on ecosystem service value and landscape ecological risk prediction and zoning: Taking Fujian province as an example. Ecol. Model. 2025, 507, 111173. [Google Scholar] [CrossRef]
  31. Wu, M.H.; Cui, J.J.; Yun, L.Y.; Jin, W.D.; Li, H.; Zhang, R.F. Ecological restoration zoning regulation coupled with landscape ecological risk and ecosystem service value in the plain section of Yongding River. J. Appl. Ecol. 2026, 37, 1187–1201. [Google Scholar] [CrossRef] [PubMed]
  32. Nguyen, A.K.; Liou, Y.A.; Li, M.H.; Tran, T.A. Zoning eco-environmental vulnerability for environmental management and protection. Ecol. Indic. 2016, 69, 100–117. [Google Scholar] [CrossRef]
  33. Sarker, S.; Rahman, M.J.; Rahman, M.M.; Akter, M.; Rahman, M.S.; Wahab, M.A. MPA zoning integrating socio-ecological data in the South East coast of Bangladesh. Mar. Policy 2021, 133, 104736. [Google Scholar] [CrossRef]
  34. Raj, A.; Sharma, L.K. Spatial E-PSR modelling for ecological sensitivity assessment for arid rangeland resilience and management. Ecol. Model. 2023, 478, 110283. [Google Scholar] [CrossRef]
  35. Sadeghi, S.H.; Chamani, R.; Zabihi Silabi, M.; Tavosi, M.; Katebikord, A.; Khaledi Darvishan, A.; Moosavi, V.; Sadat Sadeghi, P.; Vafakhah, M.; Moradi Rekabdarkolaei, H. Watershed health and ecological security zoning throughout Iran. Sci. Total Environ. 2023, 905, 167123. [Google Scholar] [CrossRef] [PubMed]
  36. Gong, J.; Cao, E.; Xie, Y.; Xu, C.; Li, H.; Yan, L. Integrating ecosystem services and landscape ecological risk into adaptive management: Insights from a western mountain-basin area, China. J. Environ. Manag. 2021, 281, 111817. [Google Scholar] [CrossRef] [PubMed]
  37. Jin, T.T.; Zhang, Y.X.; Zhu, Y.H.; Gong, J.; Yan, L.L. Spatiotemporal changes of ecosystem service value and landscape ecological risk and their correlations in forest regions of the Loess Plateau: A case study of the Ziwuling area. J. Appl. Ecol. 2021, 32, 1623–1632. [Google Scholar] [CrossRef] [PubMed]
  38. Sun, X.; Tang, H.; Yang, P.; Hu, G.; Liu, Z.; Wu, J. Spatio-temporal variations and coupling of human activity intensity and ecosystem services based on the four-quadrant model on the Qinghai-Tibet Plateau. Sci. Total Environ. 2020, 703, 135005. [Google Scholar] [CrossRef] [PubMed]
  39. Zhou, H.Y.; Luo, W.X.; Xie, G.Z.; Qiu, P.H. Spatiotemporal distribution and change characteristics of landscape ecological risk in Hainan Tropical Rainforest National Park over the past 40 years. Acta Ecol. Sin. 2025, 45, 7401–7414. [Google Scholar] [CrossRef]
  40. Liu, Q.; Zhao, Y.; Zhuo, S.; Mo, Y.; Zhou, P. Prediction of ecological zoning and optimization strategies based on ecosystem service value and ecological risk. Land 2025, 14, 1824. [Google Scholar] [CrossRef]
  41. Wang, H.; Liu, X.; Zhao, C.; Chang, Y.; Liu, Y.; Zang, F. Spatial-temporal pattern analysis of landscape ecological risk assessment based on land use/land cover change in Baishuijiang National Nature Reserve in Gansu Province, China. Ecol. Indic. 2021, 124, 107454. [Google Scholar] [CrossRef]
  42. Veron, S.; Mouchet, M.; Govaerts, R.; Haevermans, T.; Pellens, R. Vulnerability to climate change of islands worldwide and its impact on the tree of life. Sci. Rep. 2019, 9, 14471. [Google Scholar] [CrossRef] [PubMed]
  43. Kueffer, C.; Kinney, K. What is the importance of islands to environmental conservation? Environ. Conserv. 2017, 44, 311–322. [Google Scholar] [CrossRef]
  44. Lei, J.R.; Chen, Z.Z.; Chen, X.H.; Li, Y.L.; Wu, T.T. Spatio-temporal changes of land use and ecosystem services value in Hainan Island from 1980 to 2018. Acta Ecol. Sin. 2020, 40, 4760–4773. [Google Scholar] [CrossRef]
  45. Hu, K.; Han, N.L.; Yu, M.; Zhang, Y.C. Land use change simulation in Sanya City based on the remote sensing ecological index. Sci. Soil Water Conserv. 2023, 21, 101–109. [Google Scholar] [CrossRef]
  46. Zhao, L.M.; Guan, Y.H.; Zhou, J.X. Landscape pattern evolution and ecological security evaluation of Hainan Island under background of land use transformation. J. Beijing For. Univ. 2025, 47, 43–54. [Google Scholar]
  47. Yang, J.; Huang, X. The 30 m annual land cover dataset and its dynamics in China from 1990 to 2019. Earth Syst. Sci. Data 2021, 13, 3907–3925. [Google Scholar] [CrossRef]
  48. Li, B.J.; Du, X.Y.; Chu, S. Multi-scenario simulation of landscape ecological risk in the Huaihai Economic Zone. China Environ. Sci. 2025, 45, 2112–2121. [Google Scholar] [CrossRef]
  49. Zhang, Y.Q.; Han, N.L. Response of ecosystem service value to land use change on tropical islands: A case study of Hainan Island. J. Subtrop. Resour. Environ. 2023, 18, 19–27. [Google Scholar] [CrossRef]
  50. Zhang, X.D.; Zhao, Z.P.; Zhao, Y.X.; Gao, X.H.; Ma, Y.X.; Liu, N.J.; Ji, W.B. Landscape ecological risk assessment and ecological security pattern optimization in Yinchuan City. Arid Land Geogr. 2022, 45, 1626–1636. [Google Scholar] [CrossRef]
  51. Wang, Y.X.; Liu, S.K.; Lu, R.C.; Lin, S.G.; Liang, Q.X.; Bao, B.J. Landscape Ecological Risk Assessment and Terrain Gradient Analysis of Guangxi’s Border Areas in the Past 40 Years from the “Production-Living-Ecological” Space. J. Ecol. Rural Environ. 2021, 37, 1586–1595. [Google Scholar] [CrossRef]
  52. Wu, C.X.; Feng, Y.Z.; Zhao, H.; Bao, Q.; Lei, Y.Q.; Feng, J. Study on ecosystem service value of the Yellow River Basin in Gansu Province based on land use change. J. Desert Res. 2022, 42, 304–316. [Google Scholar]
  53. Xie, G.D.; Zhen, L.; Lu, C.X.; Xiao, Y.; Chen, C. Expert knowledge based valuation method of ecosystem services in China. J. Nat. Resour. 2008, 23, 911–919. [Google Scholar]
  54. Xie, G.D.; Zhang, C.X.; Zhang, L.M.; Chen, W.H.; Li, S.M. Improvement of the evaluation method for ecosystem service value based on per unit area. J. Nat. Resour. 2015, 30, 1243–1254. [Google Scholar] [CrossRef]
  55. Wang, Y.S.; Yang, Z.H.; Yu, M.H.; Lin, R.Y.; Zhu, L.; Bai, F.P. Integrating Ecosystem Health and Services for Assessing Ecological Risk and its Response to Typical Land-Use Patterns in the Eco-fragile Region, North China. Environ. Manag. 2023, 71, 867–884. [Google Scholar] [CrossRef] [PubMed]
  56. Qiao, B.; Cao, X.Y.; Sun, W.J.; Gao, Y.Y.; Chen, Q.; Yu, H.Y.; Wang, Z.; Wang, N.A.; Cheng, H.Y.; Wang, Y.P.; et al. Ecological zoning identification and optimization strategies based on ecosystem service value and landscape ecological risk: Taking Qinghai area of Qilian Mountain National Park as an example. Acta Ecol. Sin. 2023, 43, 986–1004. [Google Scholar] [CrossRef]
  57. Yang, Y.C.; Jiao, S.; Lu, J.; Chen, Y.; Pan, Y.Q. Ecological zoning based on landscape ecological risk and ecosystem service supply-demand: A case study of the Liuyang River Basin. Resour. Environ. Yangtze Basin 2025, 34, 2104–2117. [Google Scholar]
  58. Millennium Ecosystem Assessment. Ecosystems and Human Well-Being: Synthesis; Island Press: Washington, DC, USA, 2005. [Google Scholar]
  59. Wu, C.; Chen, B.; Huang, X.; Wei, Y.D. Effect of land-use change and optimization on the ecosystem service values of Jiangsu province, China. Ecol. Indic. 2020, 117, 106507. [Google Scholar] [CrossRef]
  60. Zhang, B.; Li, L. Evaluation of ecosystem service value and vulnerability analysis of China national nature reserves: A case study of Shennongjia Forest Region. Ecol. Indic. 2023, 149, 110188. [Google Scholar] [CrossRef]
  61. Li, Y.; Tian, Z.; Kong, L.; Zhang, D.; Tao, S.; Zhao, Y.; Han, L. Study on the Impact of Land Use Variations in Uncontrolled Areas of the Middle and Lower Reaches of the Yellow River on Ecosystem Service Values under Multiple Scenarios. Pol. J. Environ. Stud. 2026, 35, 3803–3822. [Google Scholar] [CrossRef] [PubMed]
  62. Bai, J.; Wang, X.; Tu, Y.; Zhou, J.; Wang, X.; Yao, W.; Sun, Z. Integration of ecosystem service composite index and driving thresholds for ecological zoning management: A case study of Qinling-Daba Mountain, China. J. Environ. Manag. 2025, 384, 125309. [Google Scholar] [CrossRef] [PubMed]
  63. Yu, Y.; Meng, J.H.; Song, Z.M.; Xu, L. Construction of ecological network in Xinfeng based on MCR model and landscape connectivity. J. Nanjing For. Univ. (Nat. Sci. Ed.) 2023, 47, 226–234. [Google Scholar] [CrossRef]
  64. Yang, J.; Duan, H.X.; Song, F.Q.; Wang, J.; Ren, Z.T.; Jiang, Z.C.; Chen, Y.H. Spatiotemporal evolution of landscape ecological risk in the Gaoligong Mountain, 2000–2020. J. Southwest For. Univ. (Nat. Sci.) 2024, 44, 54–63. [Google Scholar]
  65. Gao, Z.Q.; Tao, F.; Wang, Y.H.; Zhou, T. Potential ecological risk assessment of land use structure based on MCCA model: A case study in Yangtze River Delta Region, China. Ecol. Indic. 2023, 155, 110931. [Google Scholar] [CrossRef]
  66. Lin, X.; Wang, Z. Landscape ecological risk assessment and its driving factors of multi-mountainous city. Ecol. Indic. 2023, 146, 109823. [Google Scholar] [CrossRef]
  67. Liu, H.; Tang, D. Ecological zoning and ecosystem management based on landscape ecological risk and ecosystem services: A case study in the Wuling Mountain Area. Ecol. Indic. 2024, 166, 112421. [Google Scholar] [CrossRef]
  68. Chen, D.; Duan, Y.; Jiang, P.; Li, M. Spatial zoning to enhance ecosystem service co-benefits for sustainable land-use management in the Yangtze River economic Belt, China. Ecol. Indic. 2024, 159, 111753. [Google Scholar] [CrossRef]
  69. Wei, L.; Li, M.; Ma, Y.; Wang, Y.; Wu, G.; Liu, T.; Gong, W.; Mao, M.; Zhao, Y.; Wei, Y.; et al. Construction of an ecological security pattern for the national park of Hainan tropical rainforest on the basis of the importance of the function and sensitivity of its ecosystem services. Land 2024, 13, 1618. [Google Scholar] [CrossRef]
  70. Wang, H.; Zeng, Y. Policy optimization for Hainan tropical rainforest national park based on quantitative comparison of regional policies of free trade port areas. Front. Environ. Sci. 2022, 10, 891432. [Google Scholar] [CrossRef]
  71. Lu, X.; Chen, J.; Guo, J.; Wu, H.; Zuo, Q.; Chen, Y.; Huang, X.; Qi, S. Evaluating comprehensive watershed management sustainability based on the emergy ecological footprint model: A case study of Hainan Island, China. Ecol. Model. 2025, 505, 111120. [Google Scholar] [CrossRef]
  72. State Council of the People’s Republic of China. Regulations on Ecological Protection Compensation; State Council of the People’s Republic of China: Beijing, China, 2024.
  73. Wang, S.; Xie, C. Securing the future of Hainan’s Tropical Rainforest: Challenges and strategies for conservation. Front. For. Glob. Change 2025, 8, 1576900. [Google Scholar] [CrossRef]
  74. Goulder, L.H.; Kennedy, D. Interpreting and estimating the value of ecosystem services. In Natural Capital: Theory and Practice of Mapping Ecosystem Services; Kareiva, P., Tallis, H., Ricketts, T.H., Daily, G.C., Polasky, S., Eds.; Oxford University Press: Oxford, UK, 2011; pp. 15–33. [Google Scholar]
  75. Sun, L.; Shu, C.; Ding, L.; Tian, Z.; Liu, H. Zoning method of aquatic ecosystem functional management fourth-level region in the Daqing River Basin, China. J. Environ. Manag. 2023, 327, 116870. [Google Scholar] [CrossRef] [PubMed]
  76. Huang, M.; Wang, Q.; Liu, M.; Lin, N.; Wang, Y.; Jing, R.; Sun, J.; Murakami, H.; Lou, W. Increasing typhoon impact and economic losses due to anthropogenic warming in Southeast China. Sci. Rep. 2022, 12, 14048. [Google Scholar] [CrossRef] [PubMed]
Figure 1. Study area: (a) location of Hainan Province in China; (b) digital elevation model (DEM), rivers, and study area boundary of Hainan Island.
Applsci 16 06662 g001
Figure 2. Flowchart of the study. In the flowchart, the gray cylinder represents the source database, green boxes represent the input data, blue diamonds represent the methods/models, orange boxes represent the calculation or output steps, and yellow boxes represent the specific analytical procedures.
Applsci 16 06662 g002
Figure 3. Land-use transfer matrix on Hainan Island from 1994 to 2024. In the chord diagram, each color corresponds to a specific land-use type in a given year, as indicated in the legend; the colored ribbons represent the area of land-use conversion between types, with each ribbon colored according to its source category.
Applsci 16 06662 g003
Figure 4. Spatial pattern of ESV on Hainan Island from 1994 to 2024.
Applsci 16 06662 g004
Figure 5. Spatial pattern of ERI on Hainan Island from 1994 to 2024.
Applsci 16 06662 g005
Figure 6. Quadrant distribution of ecological zones on Hainan Island from 1994 to 2024: (a) 1994; (b) 2004; (c) 2014; (d) 2024. ESV denotes ecosystem service value, and ERI denotes ecological risk index.
Applsci 16 06662 g006
Figure 7. Spatial distribution of ecological zones on Hainan Island from 1994 to 2024. ESV denotes ecosystem service value, and ERI denotes ecological risk index. The four ecological zones are defined as follows: (I) High ESV-High ERI; (II) Low ESV-High ERI; (III) Low ESV-Low ERI; and (IV) High ESV-Low ERI.
Applsci 16 06662 g007
Figure 8. Dominant areas and optimization strategies of the four ecological zones on Hainan Island. ESV denotes ecosystem service value, and ERI denotes ecological risk index. The four ecological zones are defined as follows: (I) High ESV-High ERI; (II) Low ESV-High ERI; (III) Low ESV-Low ERI; and (IV) High ESV-Low ERI. In the figure, blue represents the High ESV–High ERI zone, yellow represents the Low ESV–High ERI zone, grey represents the Low ESV–Low ERI zone, and green represents the High ESV–Low ERI zone.
Applsci 16 06662 g008
Table 1. Internationally representative studies on ecosystem service value (ESV)–landscape ecological risk index (ERI)-based ecological zoning.
Study AreaTemporal HorizonCoupling MethodZoning OutputReferenceDoi
Thua Thien–Hue Province, Vietnam2010–2015Hydrometeorology, land-resource–based vulnerability assessmentThree ecological zones based on ecological vulnerabilityNguyen et al. [32]https://doi.org/10.1016/j.ecolind.2016.03.026
South-East coast of Bangladesh2005–2018Social–economic–ecological multi-criteria evaluationFour classes of marine protected areasSarker et al. [33]https://doi.org/10.1016/j.marpol.2021.104736
Aravalli Range, India2000–2020Ecosystem-stress, sensitivity, and resilience (E-PSR) modelFour ecologically sensitive areasRaj and Sharma [34]https://doi.org/10.1016/j.ecolmodel.2023.110283
30 s-order watersheds of Iran2010–2020Pressure-state-response (PSR) model-based watershed health and ecological assessmentEcological security zonesSadeghi et al. [35]https://doi.org/10.1016/j.scitotenv.2023.167123
Table 2. Chinese representative studies on ecosystem service value (ESV)–landscape ecological risk index (ERI)-based ecological zoning.
Study AreaTemporal HorizonCoupling MethodZoning OutputReferenceDoi
Hunan Province2000–2020Value-equivalent ESV, landscape ERI, spatial autocorrelationFour ecological zones based on ESV–ERI bivariate relationshipZhang et al. [6]https://doi.org/10.1016/j.ecolind.2023.111066
Bailongjiang Watershed2002–2018InVEST-based ESV, ERI overlay analysisFour ecological regionalization typesGong et al. [36]https://doi.org/10.1016/j.jenvman.2020.111817
Loess Plateau1980–2017Landscape-pattern ecological risk index (ERI)Five ecological zones based on vulnerability levelJin et al. [37]https://doi.org/10.13287/j.1001-9332.202105.030
Qinghai-Tibet Plateau2000–2015Supply–demand of ecosystem services, human activity intensityFour types via four-quadrant modelSun et al. [38]https://doi.org/10.1016/j.scitotenv.2020.140721
Hohhot, Western China2000–2020Z-score standardization of ESV and ERI, PLUS-based multi-scenario simulationFour ecological zones; forward simulation to 2040Wang et al. [16]https://doi.org/10.1038/s41598-025-94181-0
Qilian Mountain National Park2000–2020Median-threshold ESV–ERI (LERI–CESI) quadrant zoningFour ecological management zonesGao et al. [15]https://doi.org/10.34133/ehs.0441
Hainan Tropical Rainforest National Park1980–2020Landscape ecological risk index (single indicator)Risk-level zonation within the park boundaryZhou et al. [39]https://doi.org/10.20103/j.stxb.202409022095
Table 3. Data information.
Data TypeData NameSpatial SpanTime SpanData Source
Land use dataLand use30 m1994,
2004,
2014,
2024
The 30 m annual land cover datasets and its dynamics in China from 1985 to 2025 (https://zenodo.org/records/18180184, accessed on 16 March 2026)
Socio-economic dataPopulation density
Gross domestic product
Grain yield
Grain unit price
1 km1994,
2004,
2014,
2024
Resource and Environment Science and Data Center of the Chinese Academy of Sciences (https://www.resdc.cn, accessed on 16 March 2026)
the Hainan Provincial Bureau of Statistics (https://stats.hainan.gov.cn/tjj/wzss/search.html?searchWord, accessed on 16 March 2026), Information for Agricultural Product
Physical-geography dataDigital elevation model
Slope
Aspect
Normalized difference vegetation index
30 m2024Geospatial data cloud (https://www.gscloud.cn, accessed on 16 March 2026)
Temperature1 km1994,
2004,
2014,
2024
Resource and Environment Science and Data Center of the Chinese Academy of Sciences (https://www.resdc.cn, accessed on 16 March 2026)
Precipitation1 km1994,
2004,
2014,
2024
Resource and Environment Science and Data Center of the Chinese Academy of Sciences (https://www.resdc.cn, accessed on 16 March 2026)
Administrative
boundaries
2024Open Street Map (https://www.openstreetmap.org, accessed on 16 March 2026)
Table 4. Ecosystem service value coefficient per unit area on Hainan Island.
Service FunctionEcosystem Service Value
First-Level TypeSecond-Level TypeCultivated LandForest LandGrass LandWater BodiesConstruction LandUnutilized Land
Provisioning serviceFood production1.030.260.290.6600.01
Raw material production0.290.600.430.3700.03
Water supply−0.910.310.245.4400.02
Regulating serviceGas regulation0.431.981.511.3400.10
Climate regulation0.125.924.002.9500.09
Environmental remediation0.131.731.324.5800.29
Hydrological regulation1.133.872.9363.2400.19
Support serviceSoil conservation0.672.411.841.6200.12
Maintaining nutrient cycling0.140.180.140.1300.01
Biodiversity Conservation0.162.191.675.2100.11
Cultural serviceAesthetic landscape0.070.960.743.3100.05
Table 5. Area of land-use types on Hainan Island from 1994 to 2024.
Land Use Type1994200420142024
Area (km2)Area (km2)Area (km2)Area (km2)
Cultivated land9375.6510,997.689435.0211,279.68
Forest land23,588.8821,832.7223,232.1321,380.21
Grass land123.9175.4234.097.71
Water bodies493.20524.54569.31472.12
Construction land242.13421.92587.89720.77
Unutilized land38.229.703.551.50
Table 6. Ecosystem service value (ESV) and proportion of land-use types on Hainan Island from 1994 to 2024.
Land Use Type1994200420142024
ESV/108 YuanProportion/%ESV/108 YuanProportion/%ESV/108 YuanProportion/%ESV/108 YuanProportion/%
Cultivated land131.916.56154.738.09132.746.63158.698.52
Forest land1714.8285.331587.1583.011688.8884.291554.2583.44
Grass land6.670.334.060.211.830.090.410.02
Water bodies156.087.77166.008.68180.178.99149.418.02
Construction land0.000.000.000.000.000.000.000.00
Unutilized land0.140.010.040.000.010.000.010.00
Total2009.61100.001911.97100.002003.64100.001862.78100.00
Table 7. Ecosystem service value (ESV) values of each ecosystem service on Hainan Island from 1994 to 2024.
Primary ClassificationSecondary Classification1994200420142024
ESV/108 YuanProportion/%ESV/108 YuanProportion/%ESV/108 YuanProportion/%ESV/108 YuanProportion/%
Supply servicesFood production57.532.8661.883.2457.502.8762.303.34
Raw material production60.943.0358.833.0860.203.0057.983.11
Water supply5.320.26−1.31−0.076.130.31−3.80−0.20
Regulating servicesGas regulation196.779.79189.009.89194.309.70186.029.99
Climate regulation518.7125.81483.7925.30510.7925.49473.1625.40
Environmental remediation158.037.86148.157.75156.647.82144.307.75
Hydrological regulation475.3023.65464.1524.28486.8024.30446.5323.97
Support servicesSoil conservation228.5311.37217.1811.36225.4511.25213.2211.45
Maintaining nutrient cycling20.091.0019.761.0319.880.9919.551.05
Biodiversity Conservation199.259.91186.769.77197.369.85182.019.77
Cultural servicesAesthetic landscape89.144.4483.784.3888.594.4281.504.38
Total2009.61100.001911.97100.002003.64100.001862.78100.00
Table 8. Area changes in each risk level on Hainan Island from 1994 to 2024.
Landscape Ecological Risk LevelArea/km2Area Change/km2
19942004201420241994–20042004–20142014–20241994–2024
Low ecological risk14,057.3212,643.9313,146.1812,619.93−1413.39502.25−526.25−1437.39
Relatively low ecological risk7576.769053.358466.137918.301476.59−587.22−547.83341.54
Medium ecological risk4529.777094.085160.306078.142564.31−1933.78917.841548.36
Relatively high ecological risk6869.224386.876360.345379.24−2482.351973.47−981.10−1489.97
High ecological risk828.91683.75729.031866.37−145.1645.281137.341037.46
Table 9. Statistics on the ecological zones of Hainan Island from 1994 to 2024.
QuadrantEcological Zoning TypeNumber of Grids/(Grid Cells)Area/(km2)
19942004201420241994200420142024
first quadrantecological conservation and quality improvement zone1531671861001356.171483.011662.24896.74
second quadrantecological risk prevention and control zone1196107410894558902.417766.567793.112612.43
third quadrantecological improvement and development zone38963751211993045.515314.394289.309936.46
forth quadrantecological barrier protection zone228821482239227220,557.8919,298.0220,117.3320,416.35
Disclaimer/Publisher’s Note: The statements, opinions and data contained in all publications are solely those of the individual author(s) and contributor(s) and not of MDPI and/or the editor(s). MDPI and/or the editor(s) disclaim responsibility for any injury to people or property resulting from any ideas, methods, instructions or products referred to in the content.