1. Introduction
Autism Spectrum Disorder (ASD) is a complex neurodevelopmental disorder (NDD) that affects millions of children worldwide, and accurate as well as timely diagnosis is critical for effective intervention and improved developmental outcomes. However, the conventional diagnostic process remains challenging due to limited access to trained specialists, extensive behavioral assessments, and the subjective nature of clinical evaluations, which often delay early intervention. In recent years, artificial intelligence (AI) and machine learning techniques have shown significant promise in improving the efficiency, scalability, and accuracy of ASD diagnosis, thereby facilitating earlier detection across diverse populations.
Autism Spectrum Disorder (ASD) involves impairments in social interaction and communication, along with restricted behaviors, and is often reflected in atypical speech patterns such as monotonic intonation and reduced emotional expressiveness. Approximately 75–80% of verbal individuals with ASD exhibit echolalia, a distinctive communication feature involving the repetition of previously heard phrases or sentences [
1]. The developmental trajectory of children with ASD varies widely, particularly in language acquisition and communication abilities. Studies indicate that nearly 75% of children with ASD demonstrate language-related difficulties by kindergarten age, ranging from mild impairments in comprehension to severe expressive communication deficits, whereas approximately 25% may develop relatively typical language skills at early stages [
2]. Clinically, ASD is categorized into three levels based on the level of support required: Level 1 (“Requiring Support”), Level 2 (“Requiring Substantial Support”), and Level 3 (“Requiring Very Substantial Support”) [
3,
4]. Early identification remains challenging; therefore, timely diagnostic tools are essential to enable early therapeutic interventions such as speech therapy and behavioral support, which are known to significantly improve communication and social outcomes.
Recent advances in AI have encouraged the development of automated ASD screening and prediction models. Further, several studies have explored machine learning and deep learning approaches using diverse modalities such as facial expressions, behavioral patterns, sensor data, and speech signals. For instance, a deep neural network with multi-label classification was proposed to detect ASD using facial emotion analysis in children [
5]. Behavioral studies have also highlighted that children with ASD often participate less frequently in physical and social activities, preferring solitary play compared to typically developing peers [
6]. Furthermore, a CNN-based ASD screening framework integrated with mobile applications and web services has demonstrated improved accuracy, sensitivity, and specificity compared with traditional diagnostic scoring systems [
7].
Other research efforts have investigated multimodal AI frameworks for ASD prediction. Video-based behavioral analysis using machine learning models such as Support Vector Machines (SVM), CNN, Inception V3, ResNet50, and Long Short-Term Memory (LSTM) networks achieved prediction accuracy of up to 91% [
8]. Similarly, deep learning approaches have been applied to analyze behavioral responses of children to external stimuli for early ASD detection [
9]. AI-based monitoring systems that utilize sensor data and emotional feedback have also been proposed to track behavioral changes and provide adaptive interventions for children with ASD [
10]. Additionally, several machine learning algorithms including Decision Tree, Random Forest, SVM, K-Nearest Neighbors (KNN), and Gated Recurrent Units (GRU) have been explored for ASD classification, with some studies reporting prediction accuracy approaching 100% after optimization [
11,
12]. Comparative studies evaluating multiple classifiers have also demonstrated the effectiveness of CNN-based architecture, achieving accuracies of 99.53%, 98.30%, and 96.88% across adult, child, and adolescent ASD datasets respectively [
13]. Other investigations reported strong predictive performance using Random Forest models and automated classifiers trained on minimal behavioral datasets for early ASD prediction [
14,
15].
Communication impairments represent a core diagnostic feature of ASD. Children with ASD frequently exhibit delayed speech development and unique communication patterns such as echolalia, where repeated phrases are used as a form of expression rather than spontaneous language generation [
16]. In addition to verbal communication differences, individuals with ASD often demonstrate atypical non-verbal communication behaviors, including reduced eye contact, limited facial expressions, and restricted use of gestures, which can hinder social interaction and social referencing abilities [
17]. Early therapeutic interventions, particularly speech therapy, have been shown to improve communication skills and social engagement among children with ASD [
18]. Various communication support strategies, including augmentative and alternative communication (AAC) systems, visual schedules, and structured interaction techniques, have demonstrated improvements in both expressive and receptive communication abilities [
19]. Nevertheless, the effectiveness of these interventions may vary due to heterogeneity in ASD symptoms, limited access to trained speech-language pathologists, and disparities in therapy availability [
20]. Visual communication aids such as the Picture Exchange Communication System (PECS) and visual schedules further support communication development by leveraging visual learning strengths commonly observed in individuals with ASD [
21]. Additionally, social stories—structured narratives describing appropriate behaviors in social contexts—have been shown to enhance social understanding and conversational abilities in children with ASD [
22]. In parallel with these domain-specific interventions, recent advancements in artificial intelligence have provided powerful tools for analyzing complex behavioral and speech patterns in ASD.
To further strengthen the methodological foundation of the proposed framework, relevant advancements from other domains employing deep learning and attention mechanisms are also considered. For instance, Gu et al. proposed an enhanced air pollution prediction framework integrating Adam-optimized multi-head attention with hybrid deep learning, demonstrating improved temporal feature fusion and model robustness [
23]. This approach provides valuable insights into hyperparameter optimization and attention-based temporal modeling in complex sequential data, which are directly relevant to the CNN–BiLSTM–Attention framework adopted in this study. Similarly, Shahid and Zohaib developed a deep CNN-based model for cucumber leaf disease recognition, highlighting the effectiveness of hierarchical feature extraction from image-based inputs [
24]. These findings support the use of CNN architectures for learning discriminative patterns, which are conceptually transferable to spectrogram-based acoustic feature extraction in speech analysis. Furthermore, Haider et al. introduced a strip pooling coordinate attention mechanism combined with directional learning for intelligent fire recognition, achieving enhanced feature localization and representation [
25]. This attention-based strategy offers valuable insights for improving saliency modeling and adaptive feature weighting in heterogeneous emotional speech classification. In addition, Hassan et al. proposed a pyramid attention-based cross-modal collaboration framework for RGB–thermal saliency detection, enabling effective fusion of multimodal data representations [
26]. This provides methodological inspiration for extending the proposed approach toward multimodal ASD diagnosis by integrating speech with complementary physiological and behavioral signals. Furthermore, Transformer-driven anomaly detection and manifold learning approaches have demonstrated strong capability in modeling complex high-dimensional data distributions, providing valuable insights for future healthcare-oriented speech analysis and abnormality detection systems [
27].
Building upon these developments, recent research by Ding et al. further highlight the potential of cross-modal AI frameworks for Autism Spectrum Disorder, particularly in enabling personalized and adaptive interventions. Their DeepSeek-based platform demonstrates how multimodal integration can support both early detection and individualized learning experiences. These advancements further emphasize the importance of developing scalable and intelligent AI systems within the “AI + Autism” domain [
28]. Moreover, recent advances in Large Language Models (LLMs) have further expanded the potential of AI-assisted healthcare systems. Geometric prompt optimization frameworks have demonstrated improved knowledge representation and reasoning capabilities, highlighting future opportunities for intelligent ASD screening and multimodal clinical decision support [
29].
Unlike conventional Speech Emotion Recognition (SER), which primarily focuses on classifying emotional states, this study investigates ASD-related abnormalities through ASD vs. emotional non-ASD speech classification. Speech produced by individuals with ASD often exhibits reduced prosodic variation, irregular pitch modulation, altered rhythm, and diminished expressive intensity, reflecting underlying impairments in social communication. The novelty of the proposed work lies in the development of a hybrid dual-path framework designed to jointly capture spectral, temporal, and probabilistic speech characteristics, enabling robust and reliable ASD detection.
2. Methodology
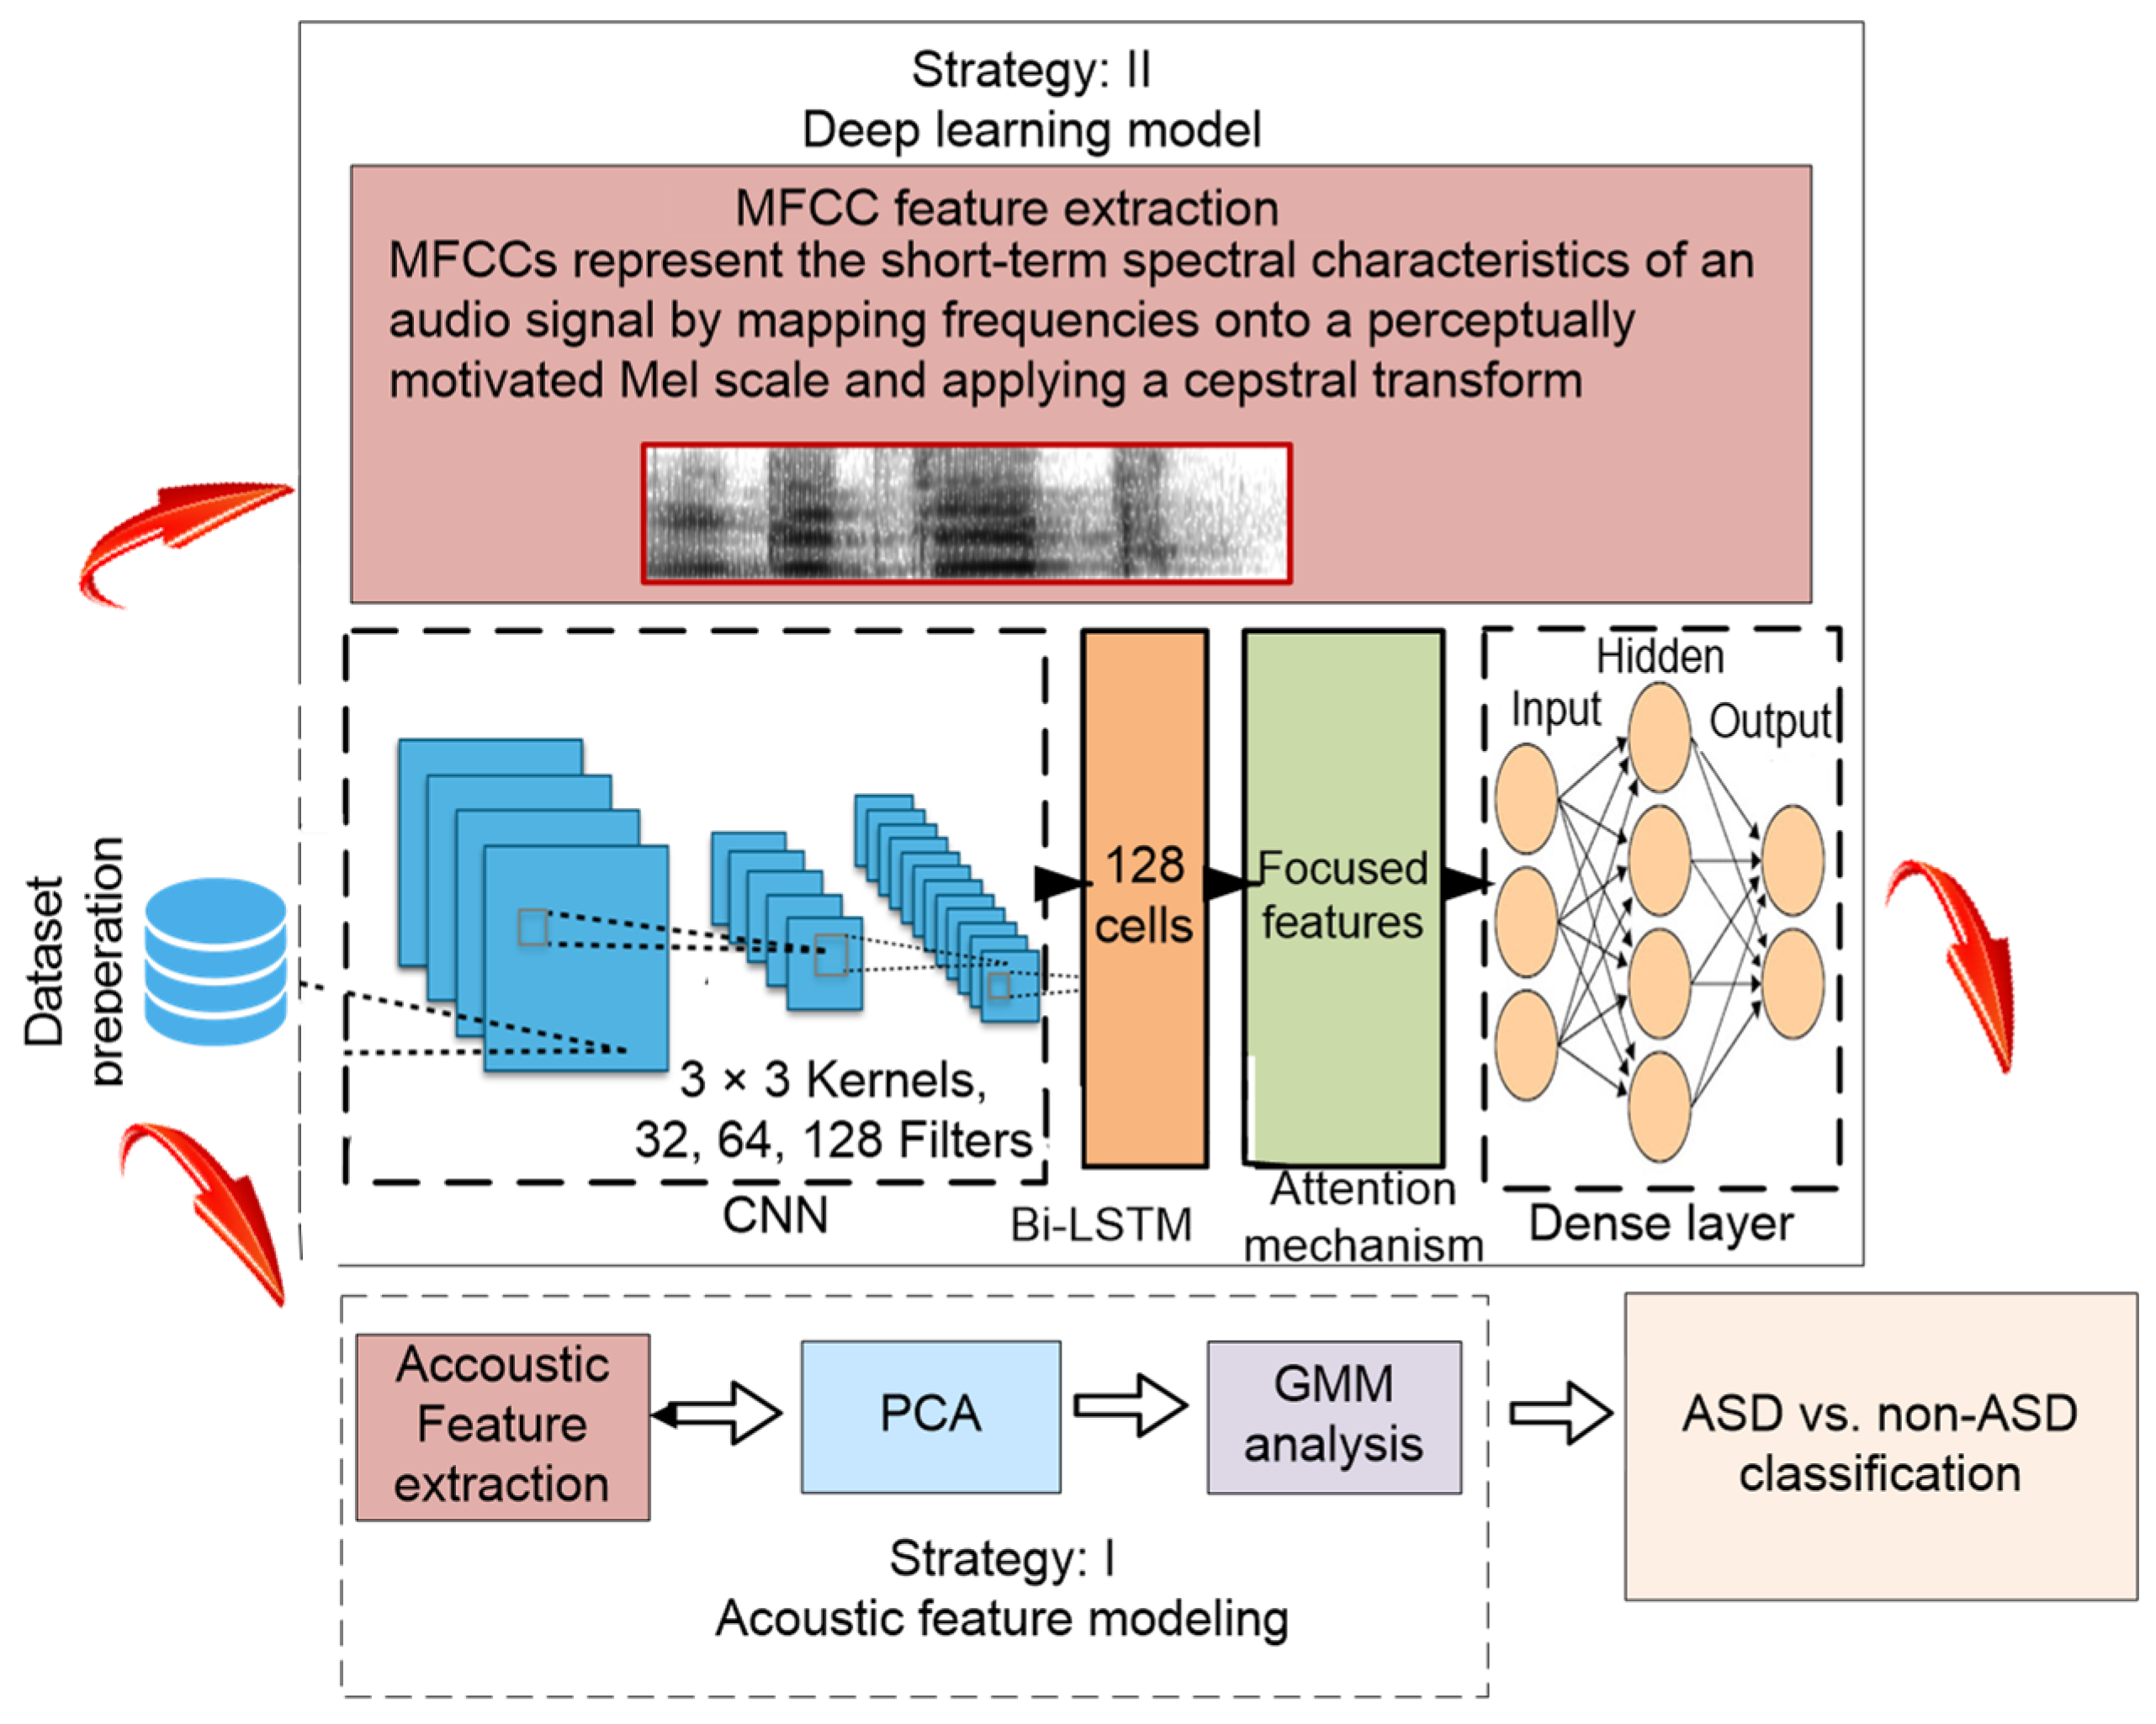
The proposed framework uses two strategies, as shown in
Figure 1, for ASD and non-ASD speech classification. The first strategy employs a traditional machine learning approach in which acoustic features are extracted from the preprocessed speech signals. The extracted features are reduced in dimensionality using Principal Component Analysis (PCA), and modeled using a Gaussian Mixture Model (GMM) to estimate class-wise probability distributions, enabling probabilistic classification. The second approach uses a deep learning framework. In this approach, speech signals are recorded, preprocessed to remove noise and normalize amplitude, and converted into MFCC feature vectors. These features are processed using a Convolutional Neural Network (CNN) to extract spatial-spectral representations, followed by a Bidirectional Long Short-Term Memory (Bi-LSTM) to model temporal dependencies, and an attention mechanism to focus on the most relevant speech segments; the resulting features are then classified using a dense layer into ASD or non-ASD classes. The use of Strategy I is motivated by the need to investigate the effect of variability due to gender, pitch, speaking style, and dialect on the ASD vs. non-ASD classification. The MFCC-based model in the second approach learns rich spectral–temporal patterns. The methodology of the investigations may be categorized into four main blocks: Dataset preparation, Acoustic feature modeling, Deep learning modeling, and ASD vs. non-ASD classification as per the following detail.
2.1. Dataset Preparation
The dataset used in this study comprises a total of 14,523 speech recordings from both ASD and non-ASD individuals. Specifically, it includes 8500 recordings from non-ASD participants (64 speakers: 34 males and 30 females) and 6023 recordings from individuals diagnosed with ASD (50 speakers: 22 females and 28 males). Emotion labels (angry, sad, surprised, neutral and happy) are available only for non-ASD samples, while ASD recordings are treated as a single class. The inclusion of multiple emotions in the non-ASD group was intentional to evaluate whether emotional speech could be misclassified as ASD speech.
Speech samples were collected across multiple age groups to capture variability in acoustic characteristics associated with ASD. Both male and female speakers were included to ensure demographic diversity. A detailed demographic summary of the participants is provided in
Table 1, including age range, gender distribution, and ASD severity levels. Moreover, due to practical and clinical constraints, including limited accessibility, privacy considerations, and challenges in recruiting ASD participants, the number of ASD subjects was limited to 50. Additionally, the number of non-ASD recordings per subject and per class is summarized in
Table 2, which presents the distribution across ASD and non-ASD samples and across emotional categories.
Audio recordings were acquired using digital recording equipment in controlled acoustic environments to minimize ambient noise and recording artifacts. All speech signals were recorded at a sampling rate of 16 kHz, which is widely used in speech processing applications and provides sufficient temporal resolution for acoustic feature analysis. The non-ASD emotional speech recordings were obtained from a combination of controlled recordings and publicly available RAVDESS Dataset (Ryerson Audio-Visual Database of Emotional Speech and Song) [
30]. The RAVDESS dataset consists of 24 professional actors (12 males and 12 females) speaking North American English across five emotional categories (angry, happy, sad, surprised, and neutral), while the remaining 40 non-ASD participants (22 males and 18 females) were recruited from the North Indian population and recorded under controlled conditions, with an age range of 7–40 years. However complete individual age information was not available for all recordings included in the combined dataset, particularly those obtained from the publicly available RAVDESS dataset; therefore, age ranges are reported to provide a consistent demographic description of the study population.
In contrast, the ASD samples were collected directly from North Indian participants in a clinically controlled and acoustically treated environment. Although both datasets were acquired under controlled conditions, differences in recording setups, microphones, and speaker characteristics may introduce unintended biases. To mitigate this, consistent preprocessing and normalization were applied across both datasets, including amplitude normalization and feature standardization, to reduce variability arising from recording conditions. Additionally, to further assess the influence of recording environment differences, recordings from 30 non-ASD speakers were collected under the same clinical conditions. These non-ASD recordings were acquired using the same recording equipment, acoustic environment, and preprocessing procedures as the ASD dataset. Evaluation using this clinically matched subset yielded performance comparable to the primary results, suggesting that the proposed framework primarily captures ASD-related acoustic characteristics rather than recording-environment artifacts. Nevertheless, future work will include larger cross-corpus evaluations to further validate model generalizability.
It should be noted that ASD participants included in this study had prior diagnoses confirmed by qualified medical professionals based on established diagnostic criteria (DSM-5) [
31], and all recordings were conducted under clinical supervision to ensure data authenticity. Moreover, the non-ASD recordings collected under controlled conditions were screened to confirm the absence of neurological or speech-related disorders.
The dataset was partitioned into training, validation, and testing sets in a 70:20:10 ratio using subject-wise splitting, ensuring that no samples from the same subject appear across different subsets. In addition, 5-fold cross-validation was implemented during model training to reduce overfitting and improve the generalizability of the classification framework.
The collected data was subsequently subjected to preprocessing steps, as described in
Section 2.2.
2.2. Acoustic Features Modeling
In Strategy-I, the acoustic feature modeling block comprises a sequence of subtasks for extracting speech parameters and subsequently modeling their probabilistic density using a Gaussian Mixture Model (GMM).
2.2.1. Acoustic Feature Extraction
The speech signals were preprocessed to eliminate inconsistencies and reduce noise variations. Amplitude normalization was applied to ensure uniform signal amplitude across all recordings, followed by noise removal to eliminate background artifacts and enhance signal quality. The speech signals were segmented into frames using a fixed window length (20 ms) with appropriate overlap (10 ms) to preserve temporal continuity. Each frame was smoothly processed using Hamming window to minimize abrupt signal changes at the boundaries, ensuring more reliable feature extraction. These steps ensure that the non-stationary characteristics of speech signals are effectively captured for subsequent feature extraction.
A set of 27 acoustic features was extracted from each speech segment for statistical analysis. These features capture key aspects of speech production and include formant frequencies, pitch-related parameters, jitter, shimmer, energy distribution metrics, and pause-duration statistics. The acoustic features—such as pitch, energy, jitter, shimmer, and pause-related parameters, was extracted to capture complementary aspects of speech production and prosody [
30]. Together, these descriptors provide a comprehensive representation of both prosodic and voice quality characteristics that are known to reflect emotional expression and atypical speech patterns associated with autism spectrum disorder [
31].
Formant-based features were used to characterize the resonant frequencies of the vocal tract, influenced by articulatory configuration. Pitch-related parameters were included to capture variations in fundamental frequency (F0) that reflect prosodic modulation in speech. Measures of jitter and shimmer quantify cycle-to-cycle variations in frequency and amplitude, respectively, providing indicators of voice stability and phonatory control. Additionally, energy-related features describe the distribution and intensity of speech signals, while pause-duration statistics capture temporal speech patterns that may differ between ASD and non-ASD speakers.
For each recording, the extracted acoustic parameters were aggregated into a 27-dimensional feature vector, providing a compact numerical representation of the speech signal suitable for machine learning analysis.
2.2.2. Principal Component Analysis (PCA)
High-dimensional acoustic feature representations often contain redundant and correlated variables, which can increase computational complexity and negatively affect model generalization. To address this issue, Principal Component Analysis (PCA) was employed as a dimensionality reduction technique to transform the extracted feature space into a smaller set of orthogonal components while preserving the most informative variance within the data.
PCA is a statistical method that projects the original feature vectors onto a new coordinate system defined by principal components, which are linearly uncorrelated variables ordered according to the amount of variance they explain in the dataset. The first principal component captures the largest proportion of the total variance, while subsequent components represent progressively smaller contributions. By selecting a subset of the leading principal components, the dimensionality of the feature space can be reduced while retaining the most relevant information. In this study, the original 27-dimensional acoustic feature vectors were transformed using PCA. The first three principal components, which captured the dominant variance in the dataset, were retained and used as the reduced feature representation for subsequent classification tasks. This reduced representation preserves the most informative acoustic patterns while removing redundant or less informative features. Dimensionality reduction through PCA provides several advantages for machine learning applications. By eliminating feature redundancy and noise, it improves computational efficiency, reduces the risk of model overfitting, and enhances the generalization capability of the classification model, thereby effective in speech classification and analysis.
2.2.3. Gaussian Mixture Model Analysis (GMM)
To further analyze the distributional characteristics of the PCA-reduced feature space, a probabilistic modeling approach was employed. A Gaussian mixture model, which represents data as a weighted combination of multiple Gaussian distributions, was used with three components (K = 3) to capture the underlying variability in the acoustic features. This approach assumes that the reduced feature vectors are generated from a mixture of Gaussian densities, enabling effective modeling of complex and multi-modal speech patterns. Separate GMMs were developed for ASD and non-ASD speech classes to capture class-specific acoustic distributions. Each Gaussian component is defined by a mean vector, covariance matrix, and mixture weight indicating its contribution to the overall distribution. The GMM is mathematically expressed as:
where x denotes the three-dimensional feature vector, ωk (k = 1, 2,…, K) represents the mixture weights, and g(x|μ
k, Σ
k), k = 1, 2,…, K, denotes the individual Gaussian density components. Furthermore, μ
k represents the mean vector, while Σ
k denotes the covariance matrix associated with the k-th Gaussian component.
Following this statistical modeling stage, the CNN–BiLSTM–Attention framework described in
Section 3.5 is employed for hierarchical feature learning and classification of ASD and non-ASD speech.
2.3. Deep Learning Modeling
In Strategy-II, the deep learning modeling block is designed to learn discriminative spectral–temporal representations of speech signals for ASD classification.
The process begins with MFCC feature extraction, which captures perceptually relevant spectral characteristics of speech. Moreover, prior studies demonstrate that MFCCs outperform other parametric representations, such as LPC and filter bank energies, in both speech recognition and emotion recognition tasks [
32]. These features are then processed through a convolutional neural network (CNN) to extract hierarchical spatial patterns [
33]. Convolutions are performed using 3 × 3 kernels with 32, 64, and 128 filters, allowing the network to extract increasingly abstract feature representations hierarchically. ReLU activations were applied after each convolutional layer to introduce non-linearity, and 2 × 2 max-pooling layers were used to reduce spatial dimensions while retaining the most salient features. It is then followed by a Bidirectional Long Short-Term Memory (BiLSTM) network to model temporal dependencies in both forward and backward directions [
34]. An attention mechanism is subsequently applied to emphasize the most informative speech segments [
35], and the resulting feature representations are finally classified using fully connected dense layers into ASD and non-ASD.
While previous studies have applied CNNs or LSTMs individually for ASD speech detection [
36,
37,
38,
39], the proposed framework combines convolutional feature extraction, bidirectional temporal modeling, and attention-based feature within a deep learning pipeline, enabling complementary learning and improved representation of ASD-related speech patterns.
The CNN–BiLSTM–Attention model employed the Adam optimizer to efficiently update the network weights during training. A learning rate of 0.001 was used to ensure stable convergence, and the model was trained for 100 epochs, facilitating efficient learning of discriminative speech patterns. These training parameters were specifically chosen to optimize model performance while minimizing the risk of overfitting.
2.4. ASD vs. Non-ASD Classification
The ASD vs. non-ASD classification block in
Figure 1 employs a deep learning-based approach, where features processed through dense layers are automatically classified, and an acoustic feature-based approach, where parameters modeled using a GMM are analyzed manually through visualizations such as scree plots, PCA-based 3D parameter plots, and GMM density distributions.
3. Results and Discussions
The performance evaluation of the proposed framework is presented using two complementary strategies. Strategy-I focuses on statistical acoustic feature analysis using PCA and GMM-based modeling, while Strategy-II evaluates the CNN–BiLSTM–Attention framework for deep learning-based ASD classification. Together, these analyses validate the effectiveness of the proposed system in distinguishing ASD from non-ASD speech. Emotion-wise results are obtained by evaluating the same trained model on subsets of non-ASD emotional speech against the same ASD test samples; no separate models are trained for each emotion.
Moreover, the performance remained consistent across all emotional categories, including the Neutral condition, indicating stable discrimination between ASD and non-ASD speech under varying speaking conditions. The Mixed class is constructed by aggregating samples from multiple emotion categories (Happy, Angry, Neutral, Sad, and Surprise), resulting in a larger sample size compared to individual emotion classes. Moreover, Evaluation with an additional clinically matched non-ASD subset (30 speakers recorded under identical clinical conditions as the ASD cohort) showed no significant performance degradation, indicating that the model performance is not primarily driven by recording-environment differences.
The reported performance metrics were computed using subject-wise 70:20:10 train–validation–test splitting along with 5-fold cross-validation. Evaluation was performed based on the aggregated confusion matrix across all emotional categories to ensure robustness and generalizability of the results.
In Strategy-I, the effectiveness of acoustic feature modeling is validated through spectral analysis, PCA explained variance analysis, 3-dimensional feature visualization, and Gaussian distribution analysis using GMM. The confirmation of the high accuracy is also supported by the results obtained in the strategy-I, i.e., using PCA based acoustic feature analysis. The analysis shows that non-ASD speech is characterized by broad dynamic range of acoustic parameters as compared to ASD speech.
3.1. Spectrogram and Acoustic Feature Visualization
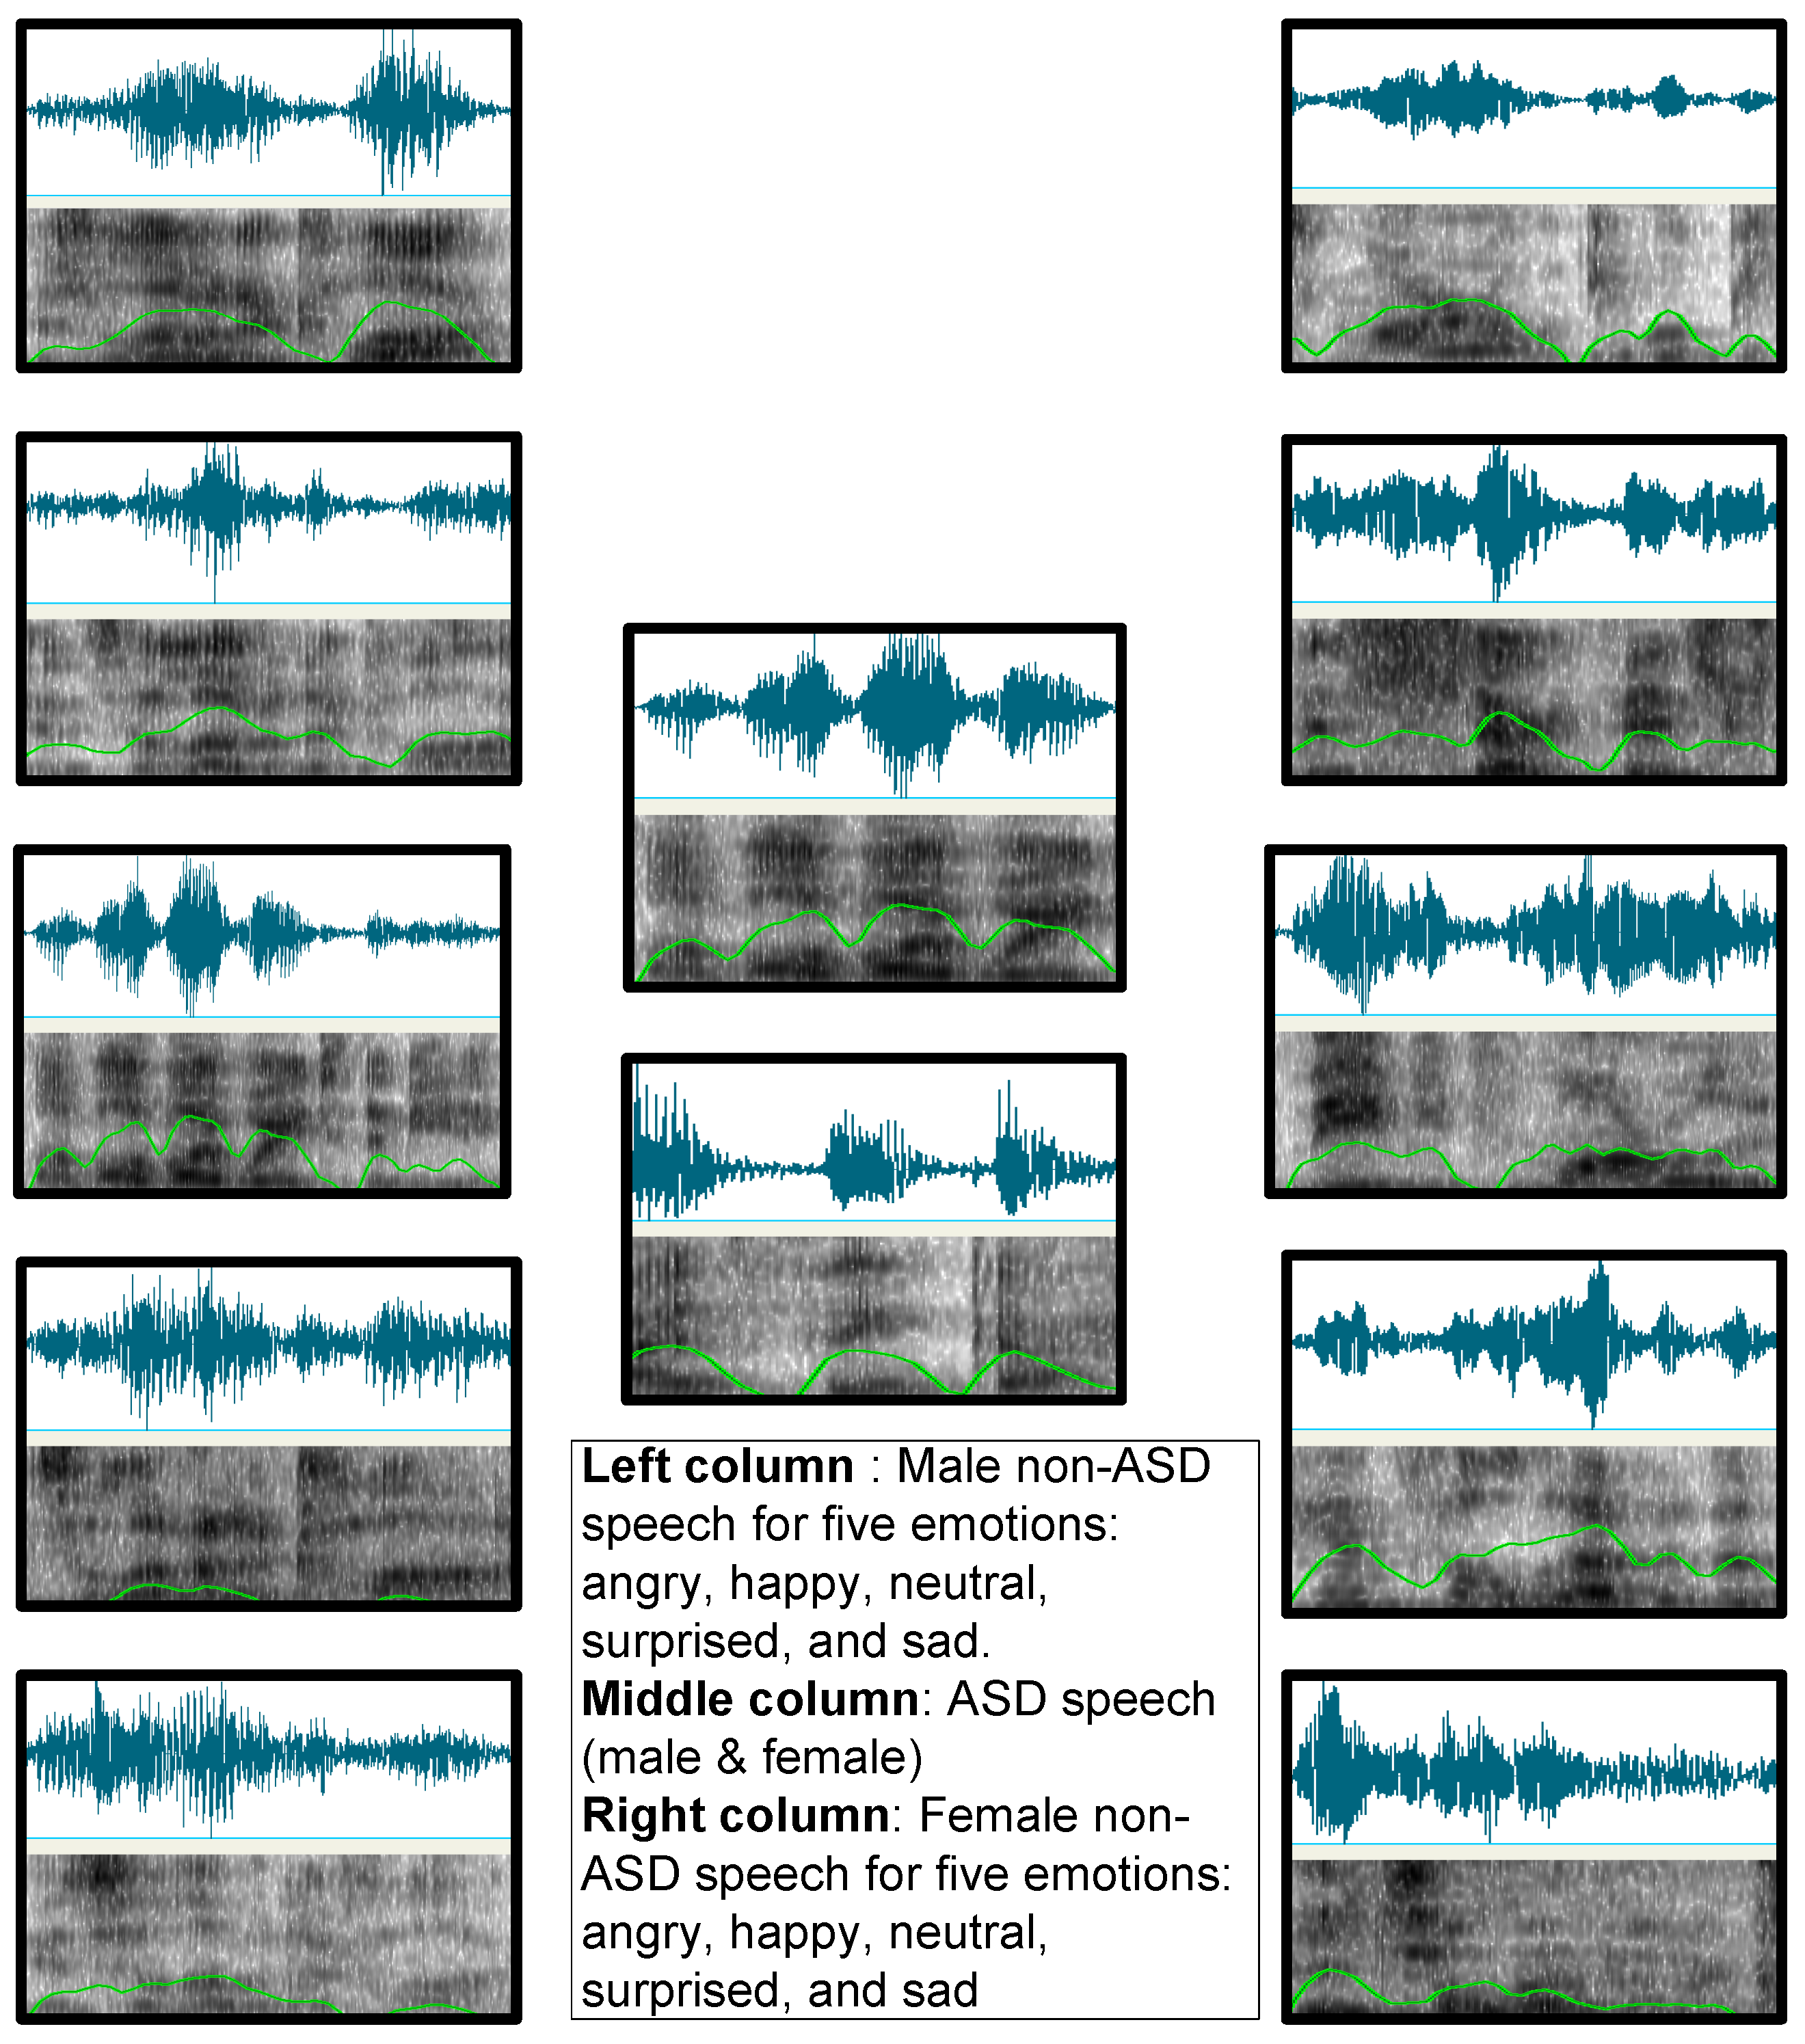
The evaluation began with spectrogram analysis to examine the acoustic characteristics of ASD vs. non-ASD speech classification, as illustrated in
Figure 2. The spectrograms reveal noticeable differences in time–frequency distributions, pitch behavior, and energy variation across emotional categories. ASD speech exhibits comparatively irregular pitch trajectories, inconsistent energy patterns, and reduced prosodic variation, whereas non-ASD speech demonstrates more stable and structured acoustic behavior.
In
Figure 2, ASD and non-ASD speech is represented using speech intensity (blue), the spectrogram (gray), and pitch variation (green). The middle column corresponds to ASD speech without emotional labels, while the left and right columns represent non-ASD emotional speech samples. Across emotions such as happy, angry, neutral, sad, and surprised, ASD speech shows greater variability and less consistent spectral organization compared with non-ASD speech. These observations highlight atypical prosodic and acoustic characteristics commonly associated with ASD.
To further investigate feature separability and distribution patterns, PCA-based dimensionality reduction and feature visualization were subsequently performed.
3.2. PCA Explained Variance Analysis
To evaluate the effectiveness of dimensionality reduction, PCA explained variance analysis was performed on the extracted acoustic feature set.
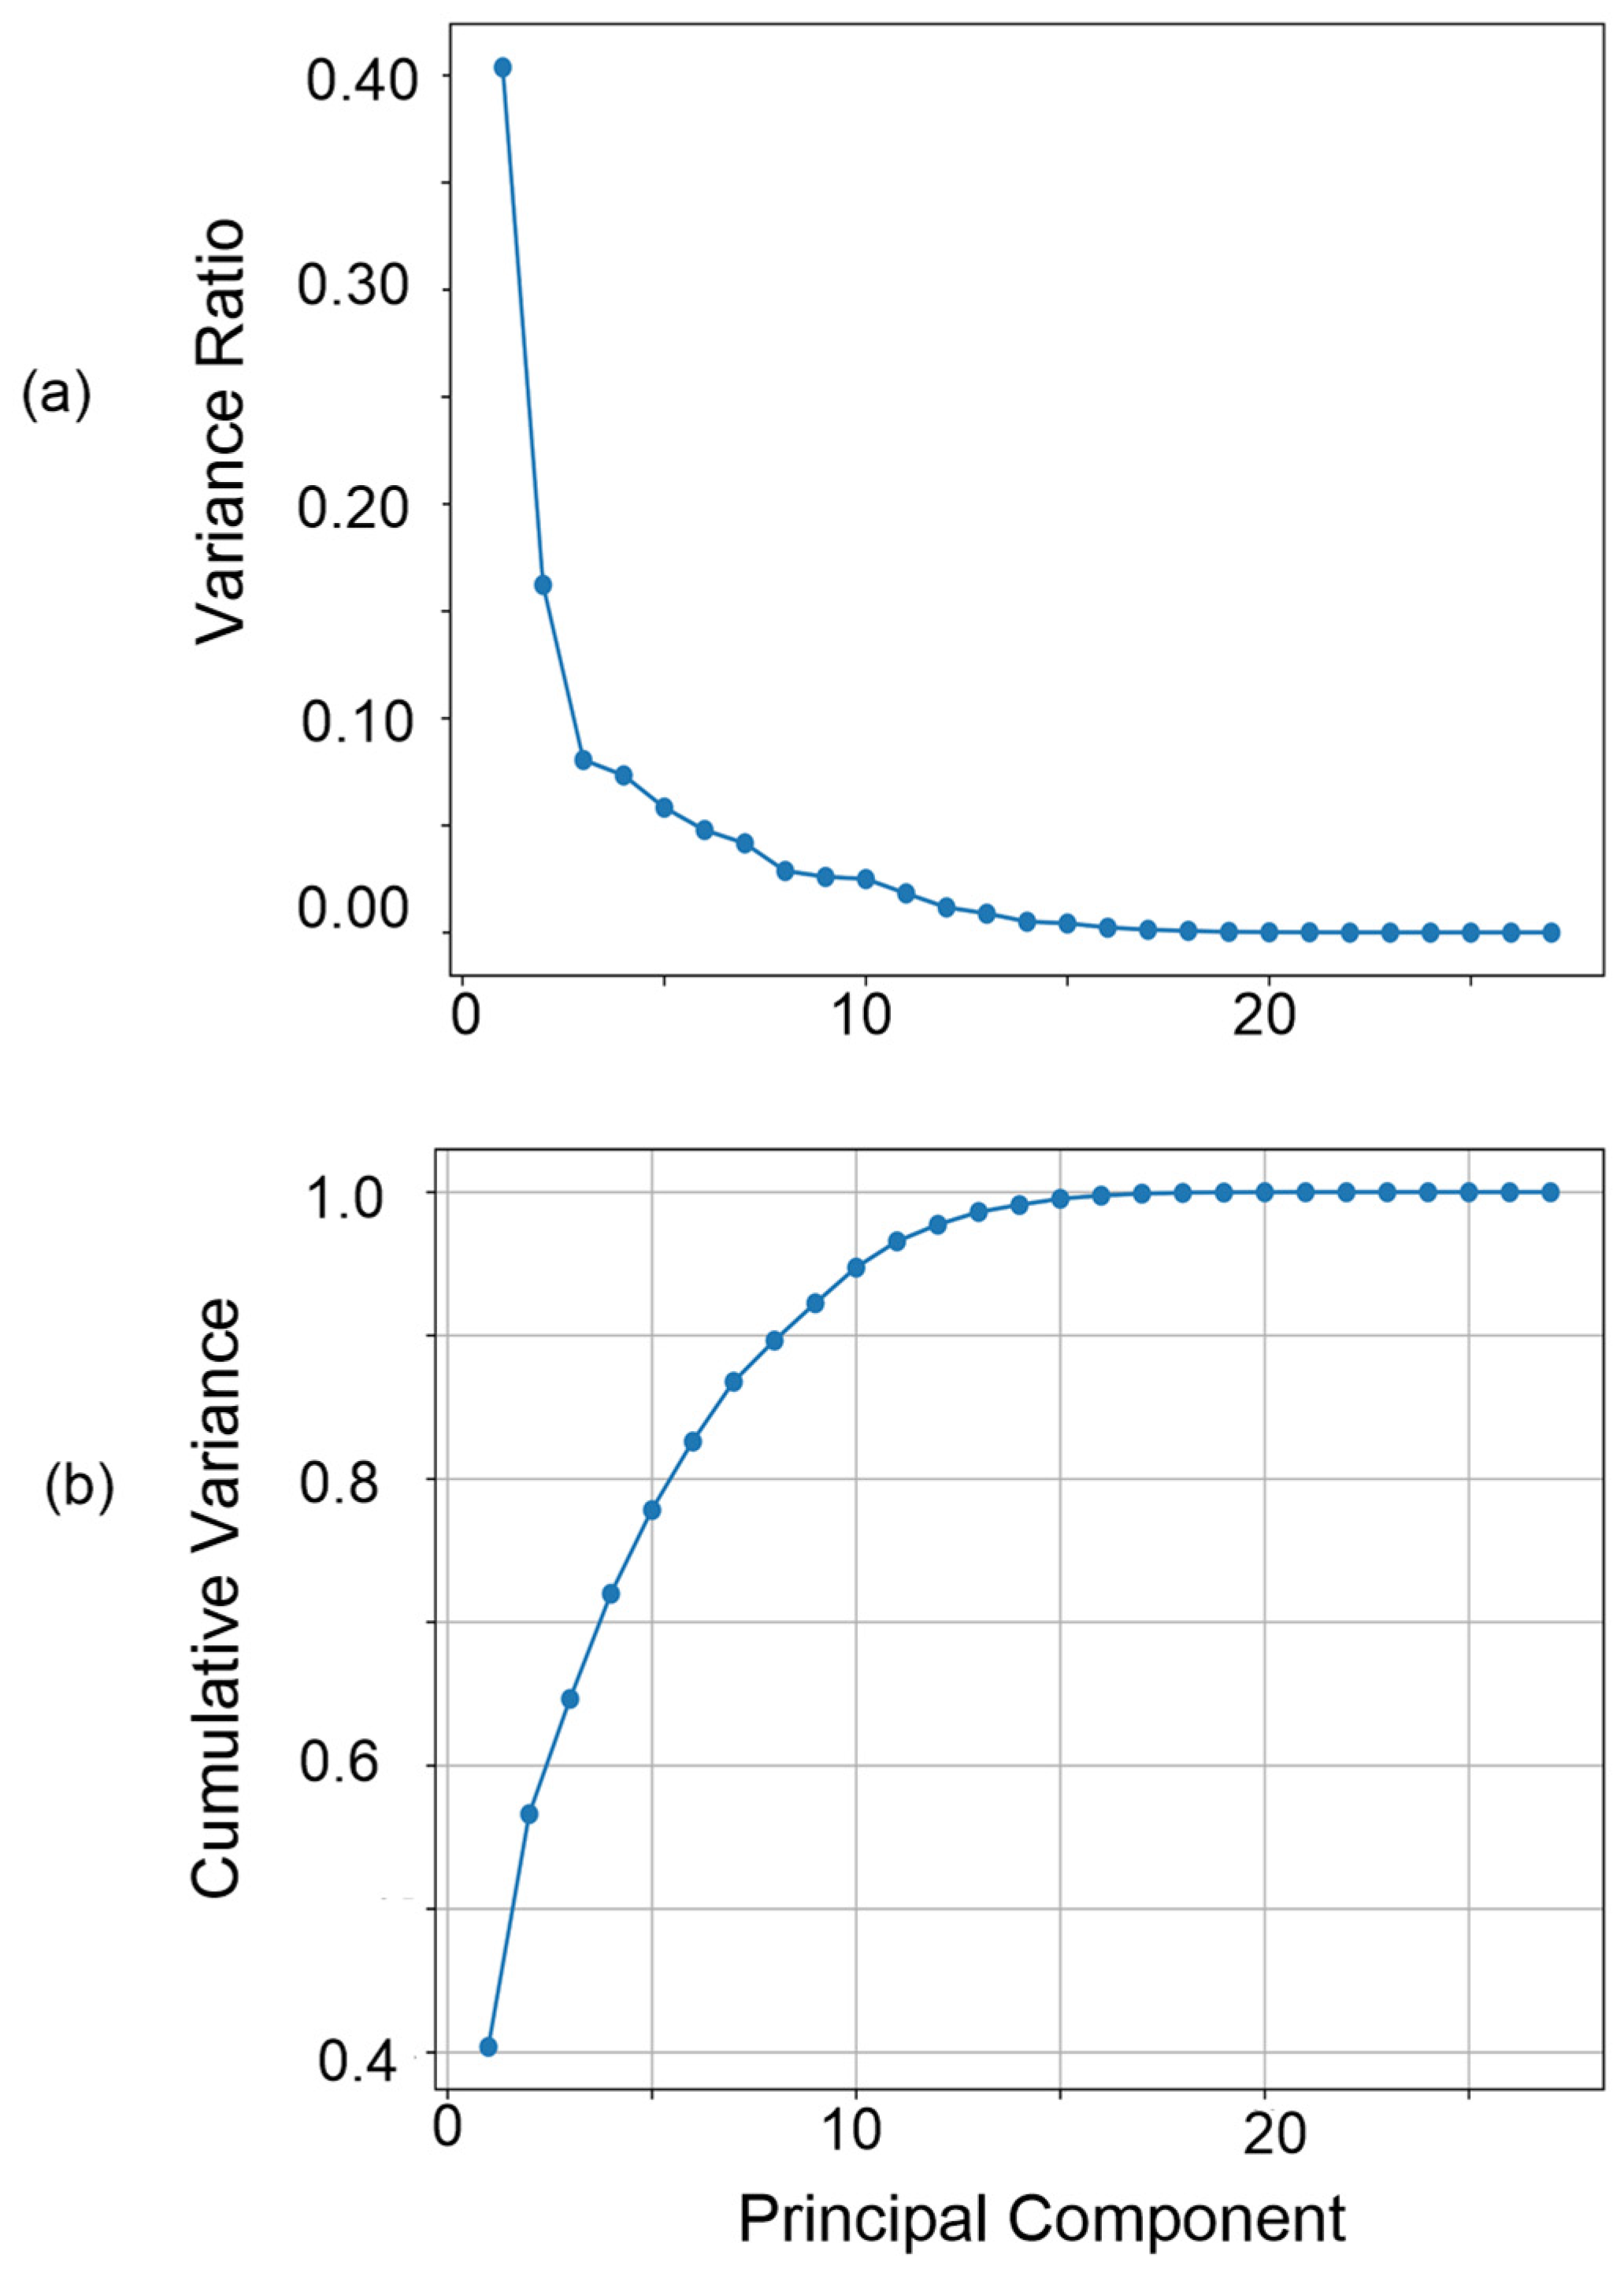
Figure 3a presents the Scree Plot illustrating the variance explained by each principal component, while
Figure 3b shows the cumulative explained variance.
The results indicate that the first three principal components capture approximately 64% of the total variance, demonstrating that the reduced feature space preserves a substantial portion of the original acoustic information. A sharp decline in variance contribution is observed after the third component, indicating that subsequent components contribute minimally to the overall data representation.
Feature loading analysis further reveals that acoustic parameters such as pause (0.51–0.35), shimmer (0.36–0.30), and jitter (0.28–0.09) contribute significantly to the dominant principal components. These features are strongly associated with prosodic variation, voice stability, and temporal speech characteristics, which are known to differ between ASD and non-ASD speech.
The PCA confirms that the reduced feature space effectively preserves discriminative acoustic information while minimizing redundancy and noise. Feature loading analysis further indicates that pause, shimmer, and jitter contribute significantly to the dominant principal components. The selected three-component representation provides an optimal balance between dimensionality reduction and information preservation, improving feature separability and supporting efficient ASD vs. non-ASD classification.
3.3. Three-Dimensional Feature Visualization
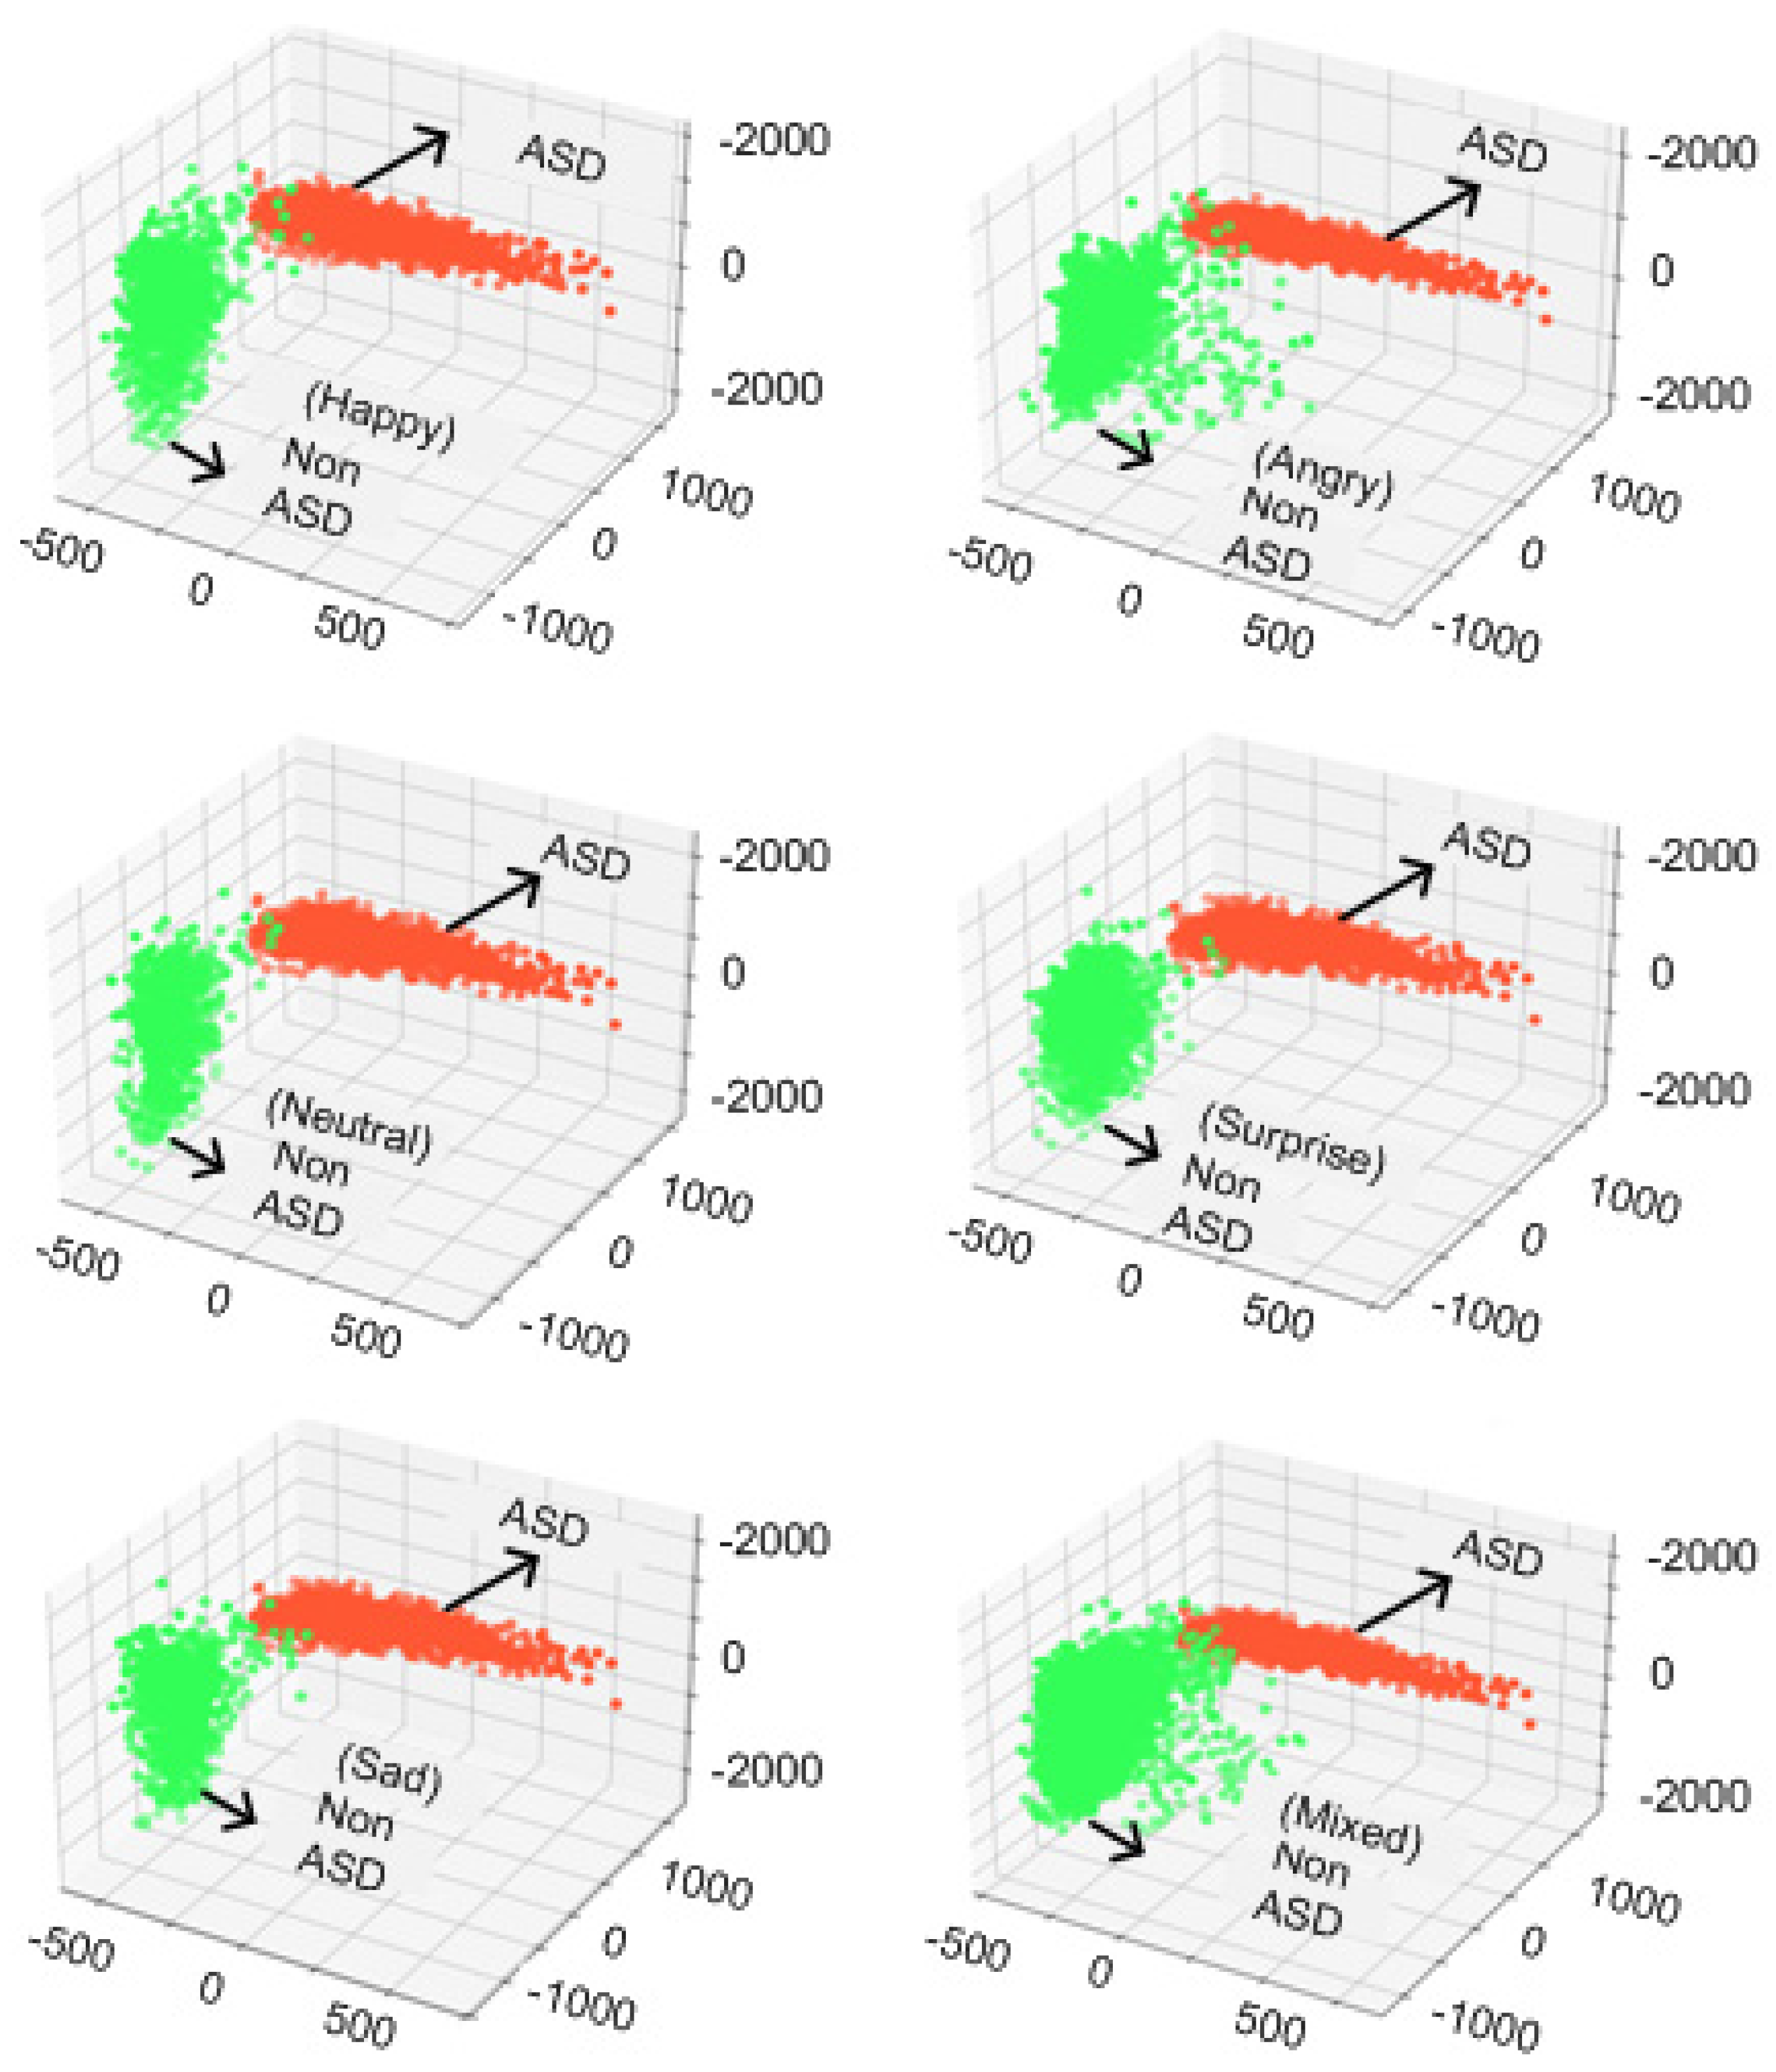
Figure 4 illustrates the three-dimensional distribution of the PCA-reduced acoustic features for ASD vs. non-ASD speech samples, where the x-, y-, and z-axes correspond to Principal Component 1 (PC1), Principal Component 2 (PC2), and Principal Component 3 (PC3), respectively. Each point represents an individual speech sample projected onto the reduced feature space.
The visualization demonstrates clear clustering and noticeable separability between ASD and non-ASD speech classes, with minimal overlap across emotional categories. ASD speech samples occupy comparatively compact and distinct regions, whereas non-ASD emotional speech exhibits broader feature distributions due to greater prosodic variability.
The observed separability confirms that the extracted acoustic features retain strong discriminative information relevant to ASD detection. Furthermore, the clustering behavior validates the effectiveness of PCA in preserving meaningful speech characteristics while reducing feature redundancy. Although the non-ASD dataset includes both North Indian and RAVDESS recordings, the observed clustering patterns and comparable performance on the North Indian ASD and non-ASD recordings suggest that the proposed framework is minimally influenced by accent- or dataset-source-related bias. These findings support the robustness of the proposed feature representation approach and its suitability for subsequent classification tasks.
3.4. Gaussian Distribution Analysis Using GMM
To further analyze the statistical characteristics of the learned acoustic representations, Gaussian Mixture Model (GMM)-based density analysis was performed for ASD and non-ASD speech classes.
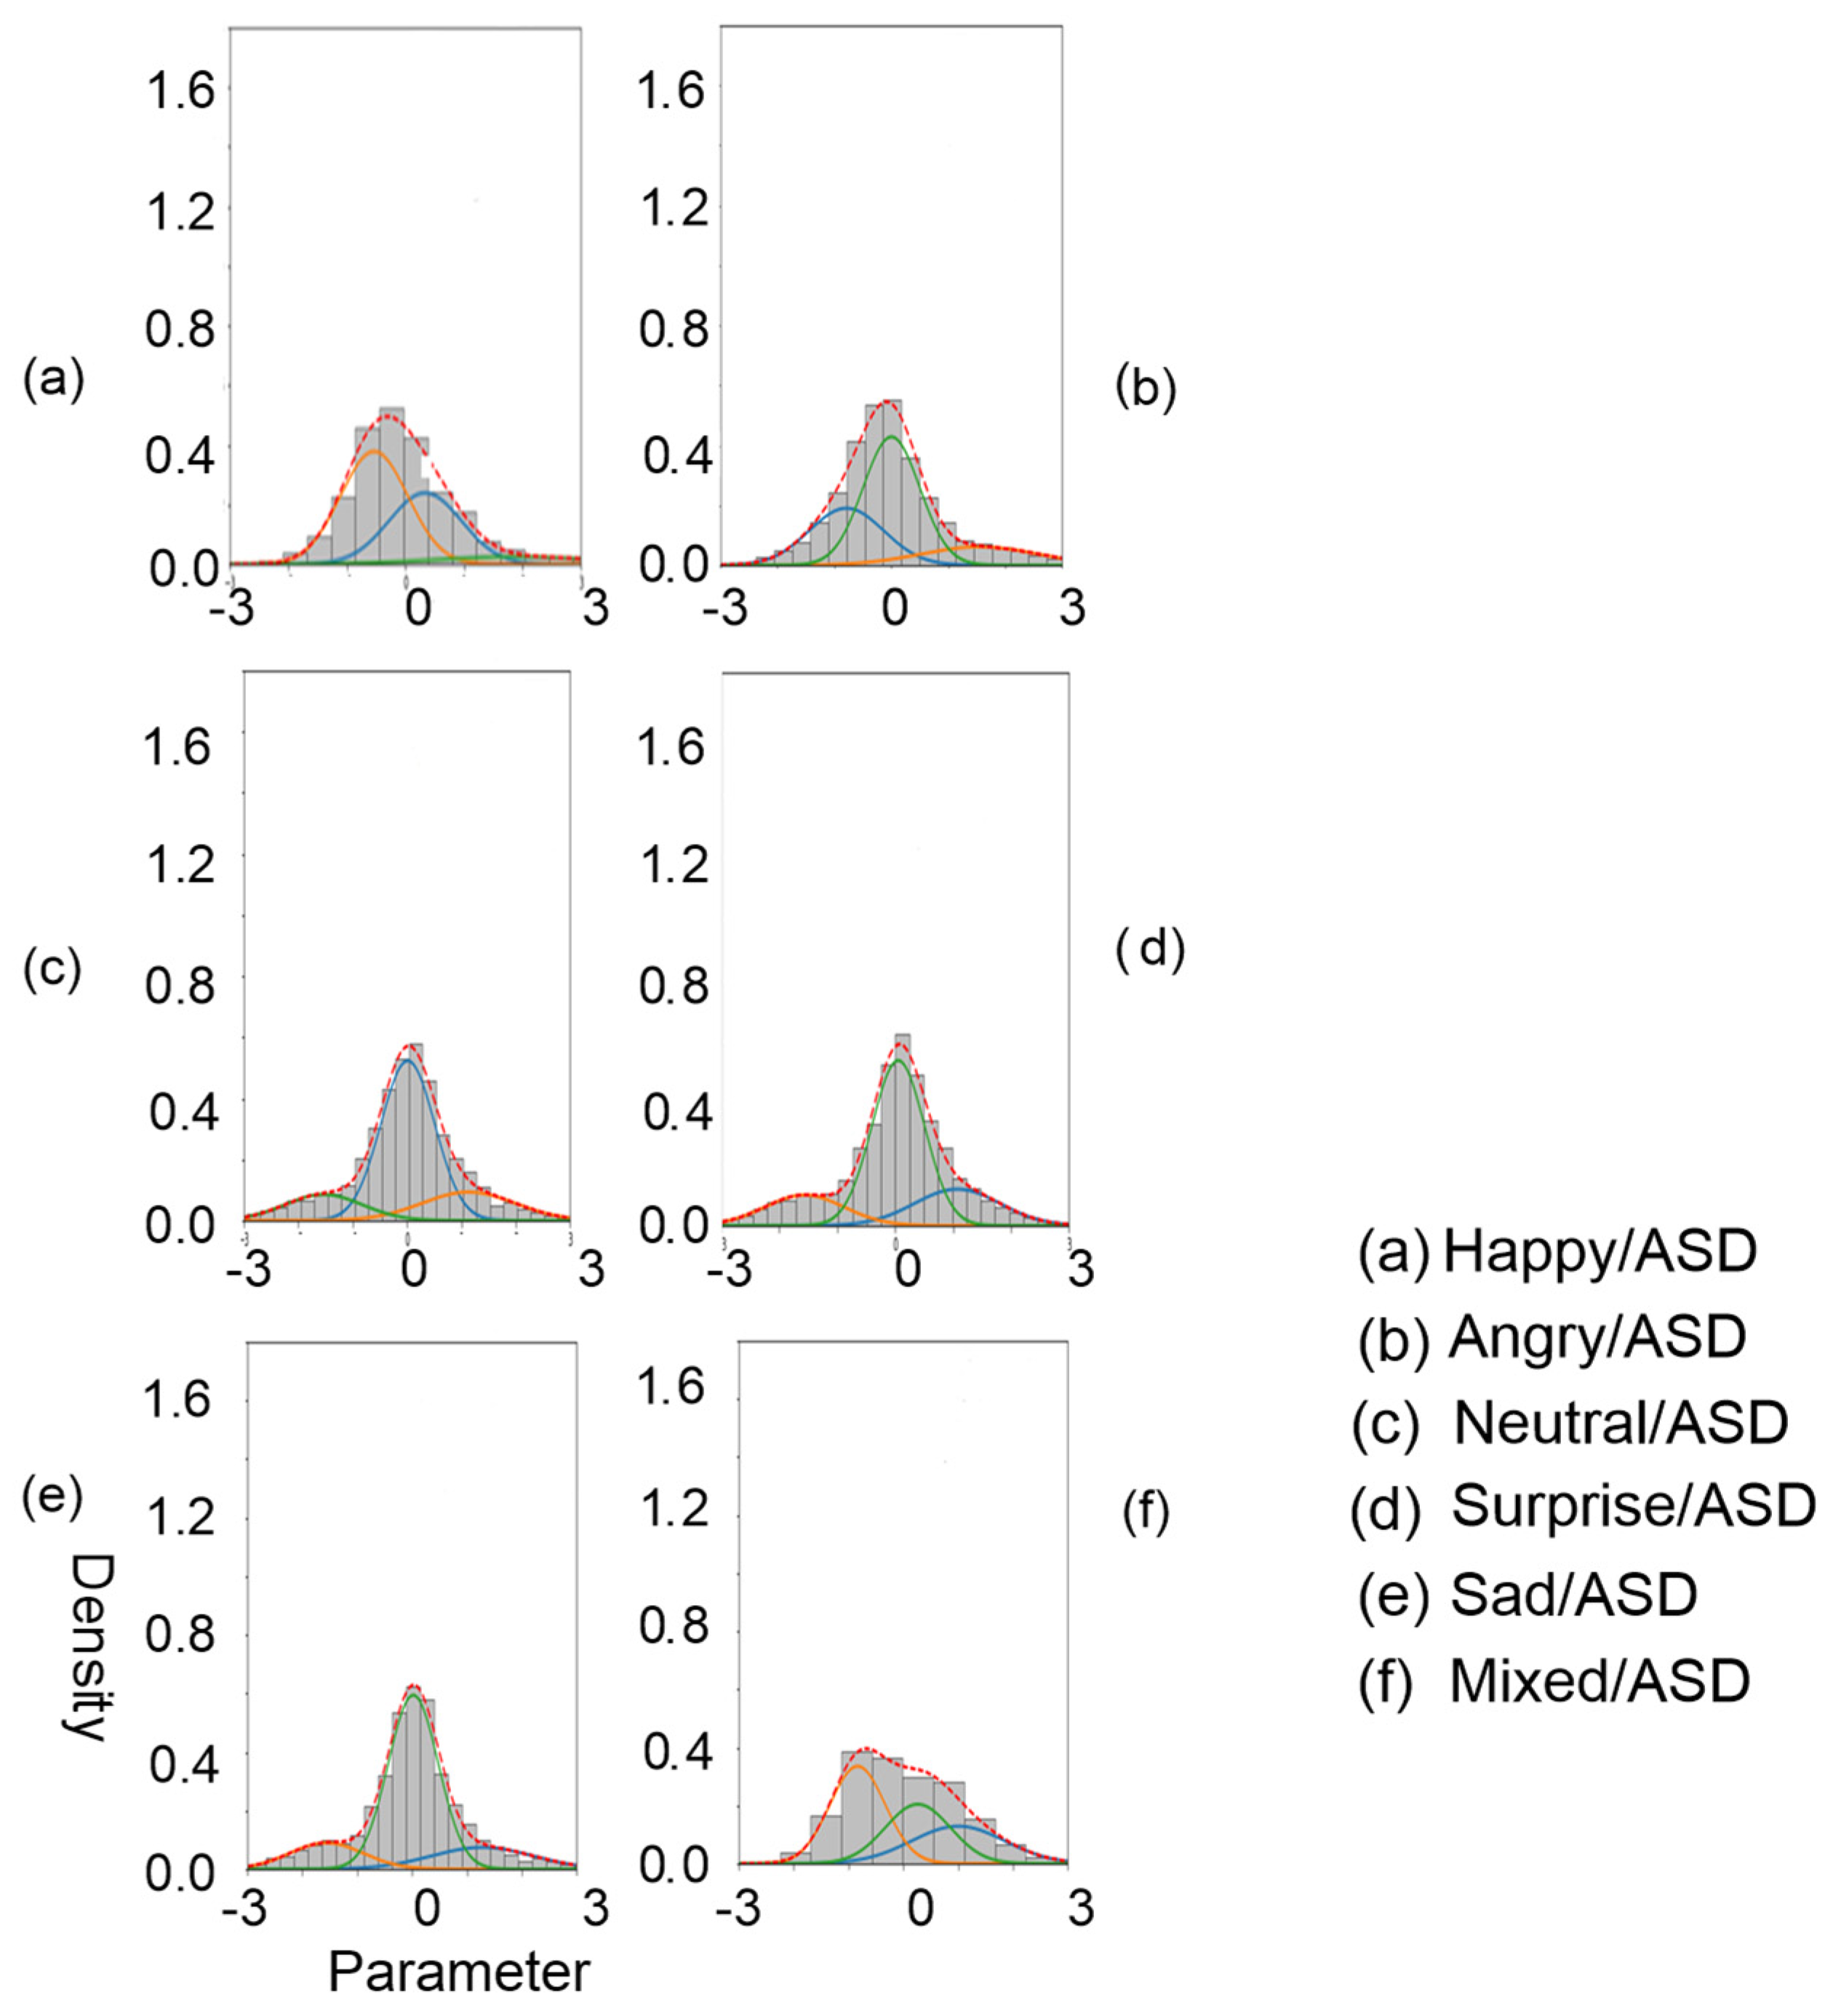
Figure 5 presents the Gaussian distributions of learned acoustic parameters for ASD vs. non-ASD classification.
The density plots exhibit multiple Gaussian components corresponding to different acoustic feature clusters, while the vertical lines indicate the mean positions of the distributions. Across all emotional categories, the distributions remain relatively compact and well-centered, reflecting stable and consistent feature learning.
Although minor overlaps are observed due to natural emotional variability, the majority of distributions remain distinctly separated, confirming effective statistical discrimination between ASD and non-ASD speech. The mixed emotional category also demonstrates stable feature distribution with preserved class separability. Overall, the GMM analysis validates the statistical consistency of the extracted acoustic features and supports the effectiveness of the proposed framework for ASD speech modelling.
Overall Findings—Strategy-I
The acoustic feature analysis demonstrates that ASD and non-ASD speech exhibit distinct spectral, prosodic, and statistical characteristics. The PCA–GMM framework effectively captures these variations, where non-ASD speech exhibits a broader dynamic range of acoustic parameters compared with ASD speech, enabling strong feature separability and contributing to robust classification performance.
In Strategy-II, the performance of the proposed CNN–BiLSTM–Attention framework was evaluated using multiple deep learning-based performance metrics, including training and validation accuracy, loss analysis, ROC analysis, CMC curves, F1-score evaluation, and confusion matrix analysis. These investigations were performed to assess the classification capability, optimization stability, discriminative performance, and generalization ability of the proposed framework for ASD vs. non-ASD speech classification across different emotional conditions. A detailed analysis of each metric is presented in the following subsection. Moreover, to better simulate real clinical conditions, 20 dB Gaussian noise was introduced into the non-ASD testing sample, as the original recordings were acquired in an acoustically controlled environment.
3.5. Training and Validation Accuracy
The classification efficiency of the proposed CNN–BiLSTM–Attention model was assessed by analyzing training and validation accuracy curves.
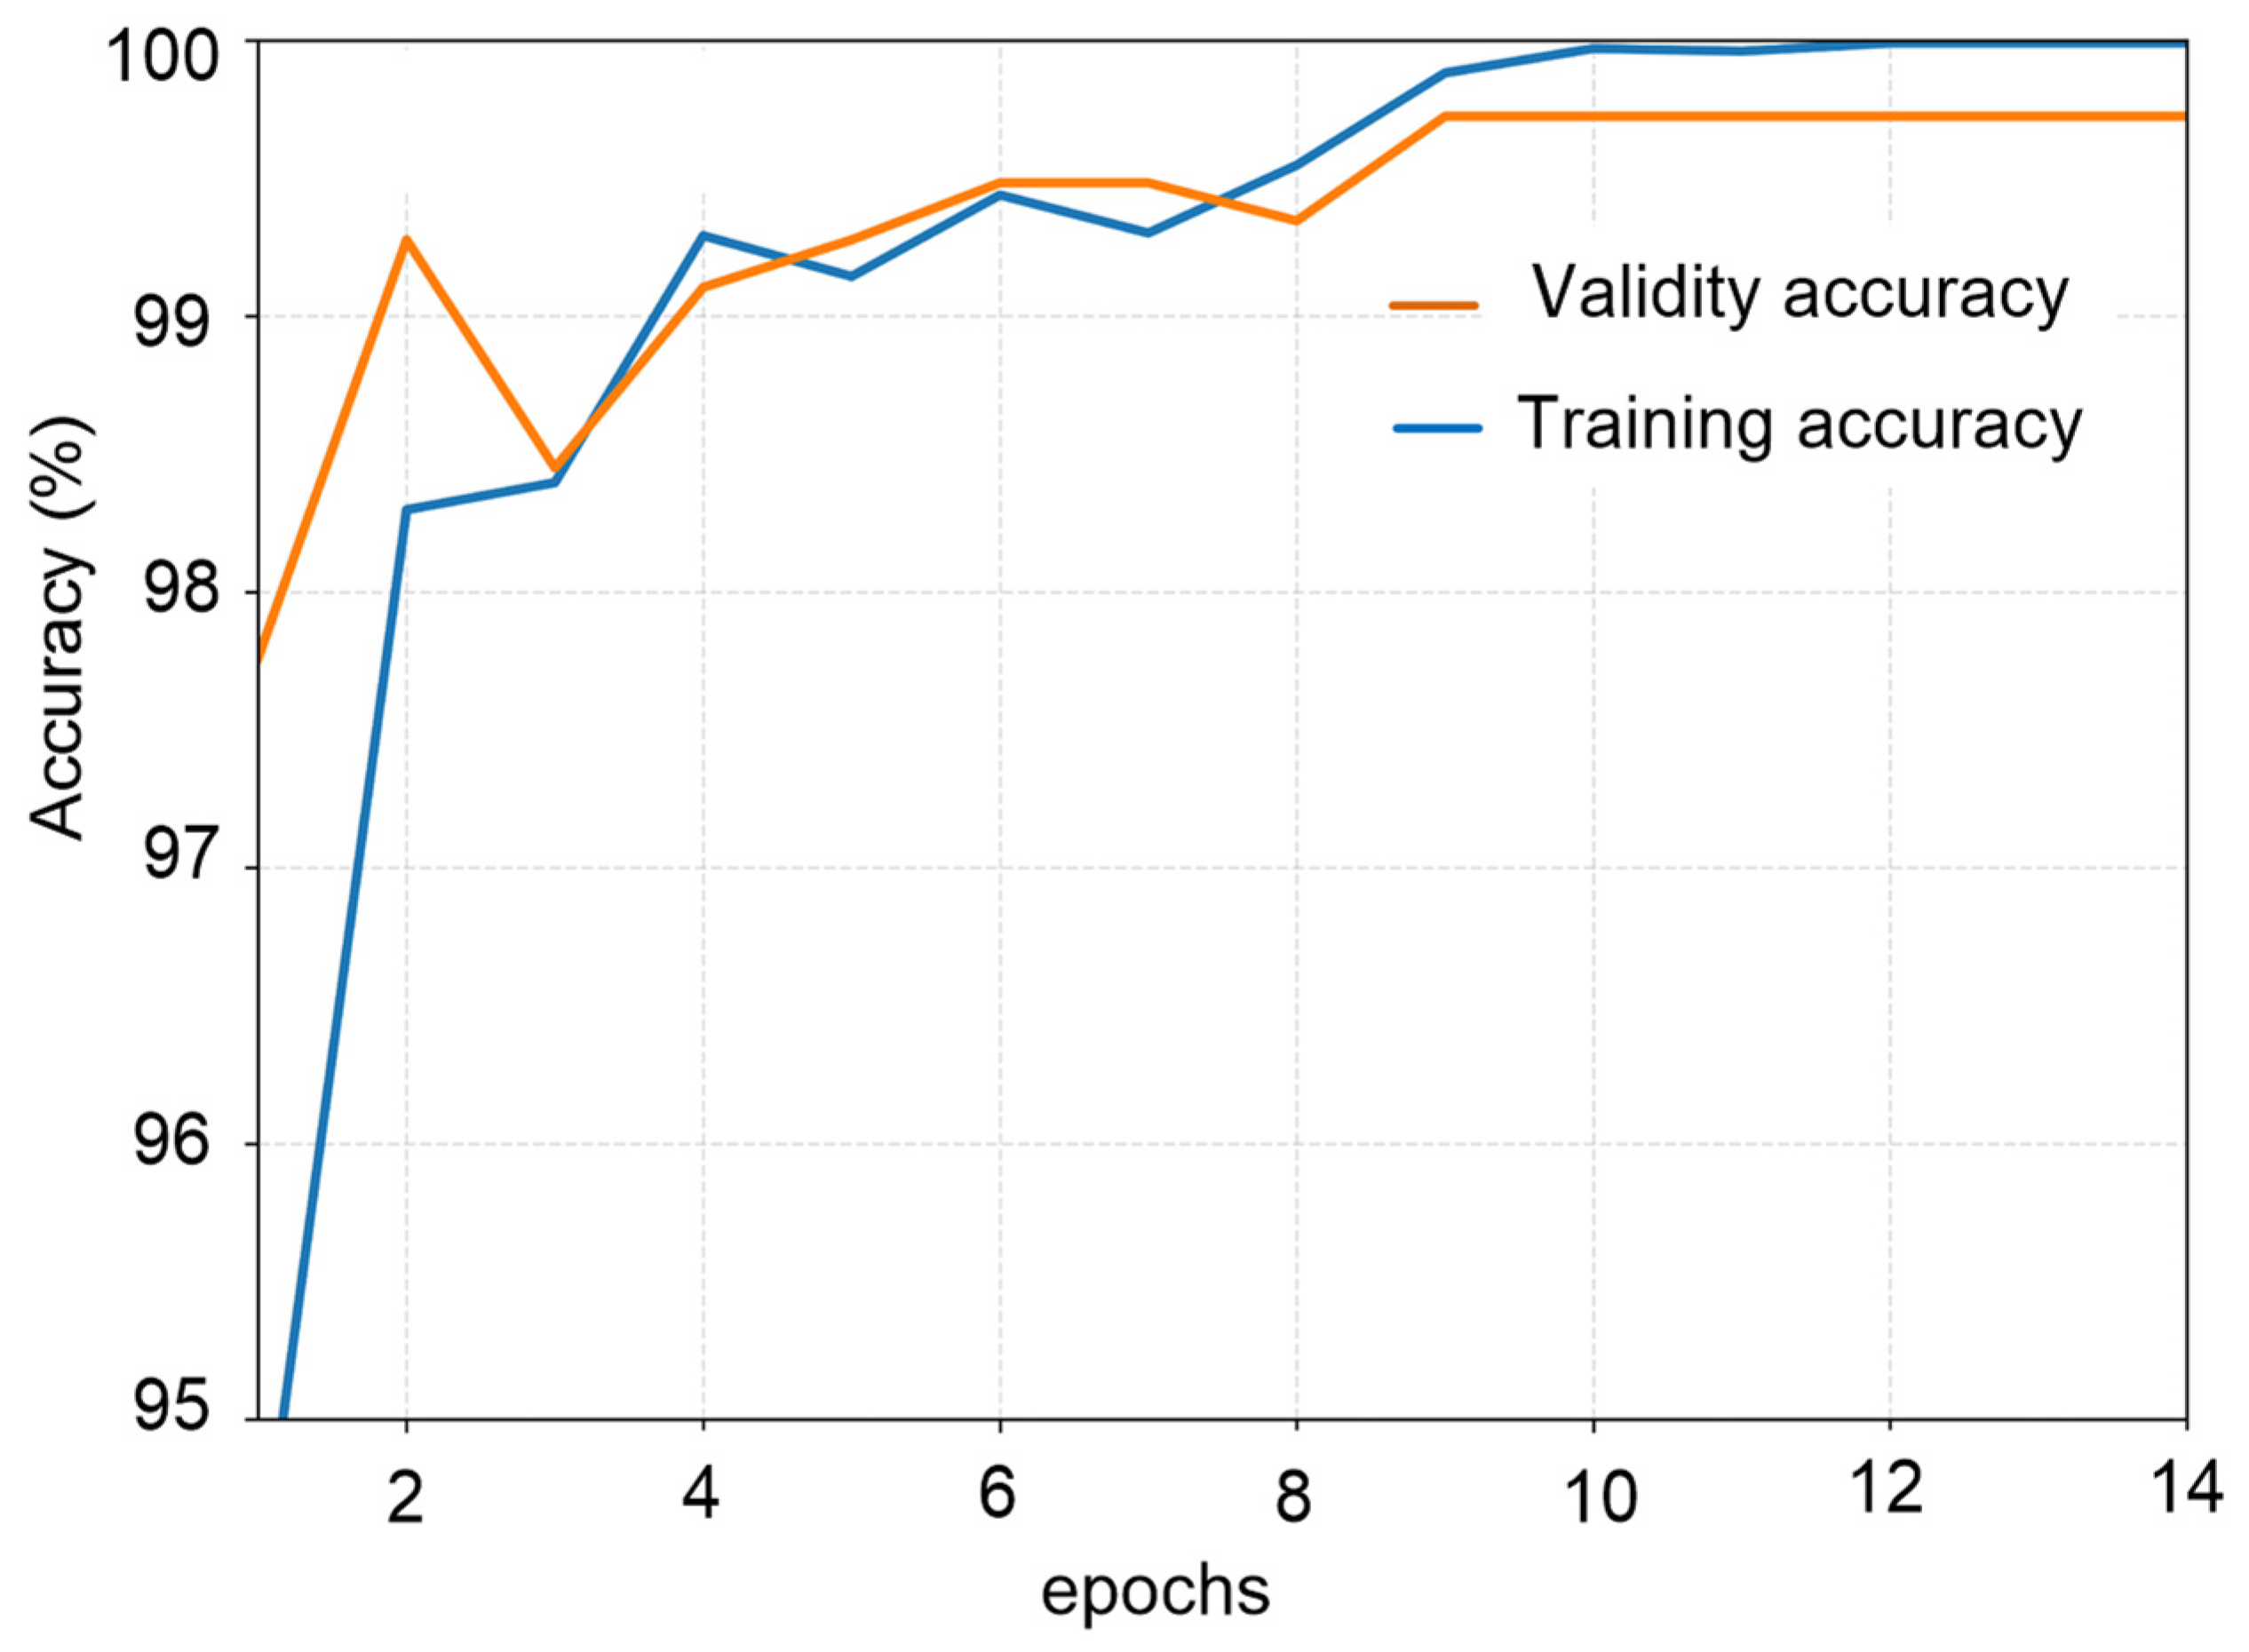
Figure 6 illustrates the Training and Validation Accuracy for ASD vs. non-ASD classification. The accuracy curves demonstrate a rapid and stable convergence, with both training and validation accuracies increasing steadily during the initial epochs and stabilizing after approximately 10–14 epochs. The final training and validation accuracies reached approximately 100% and 99.7%, respectively, indicating effective learning of discriminative ASD-related speech characteristics.
A key observation is the close alignment between training and validation curves, suggesting minimal overfitting and strong generalization capacity. This indicates that the model can effectively classify previously unseen speech samples while maintaining high predictive performance.
To further ensure model robustness, loss-based analysis was conducted to monitor the optimization process.
3.6. Training and Validation Loss
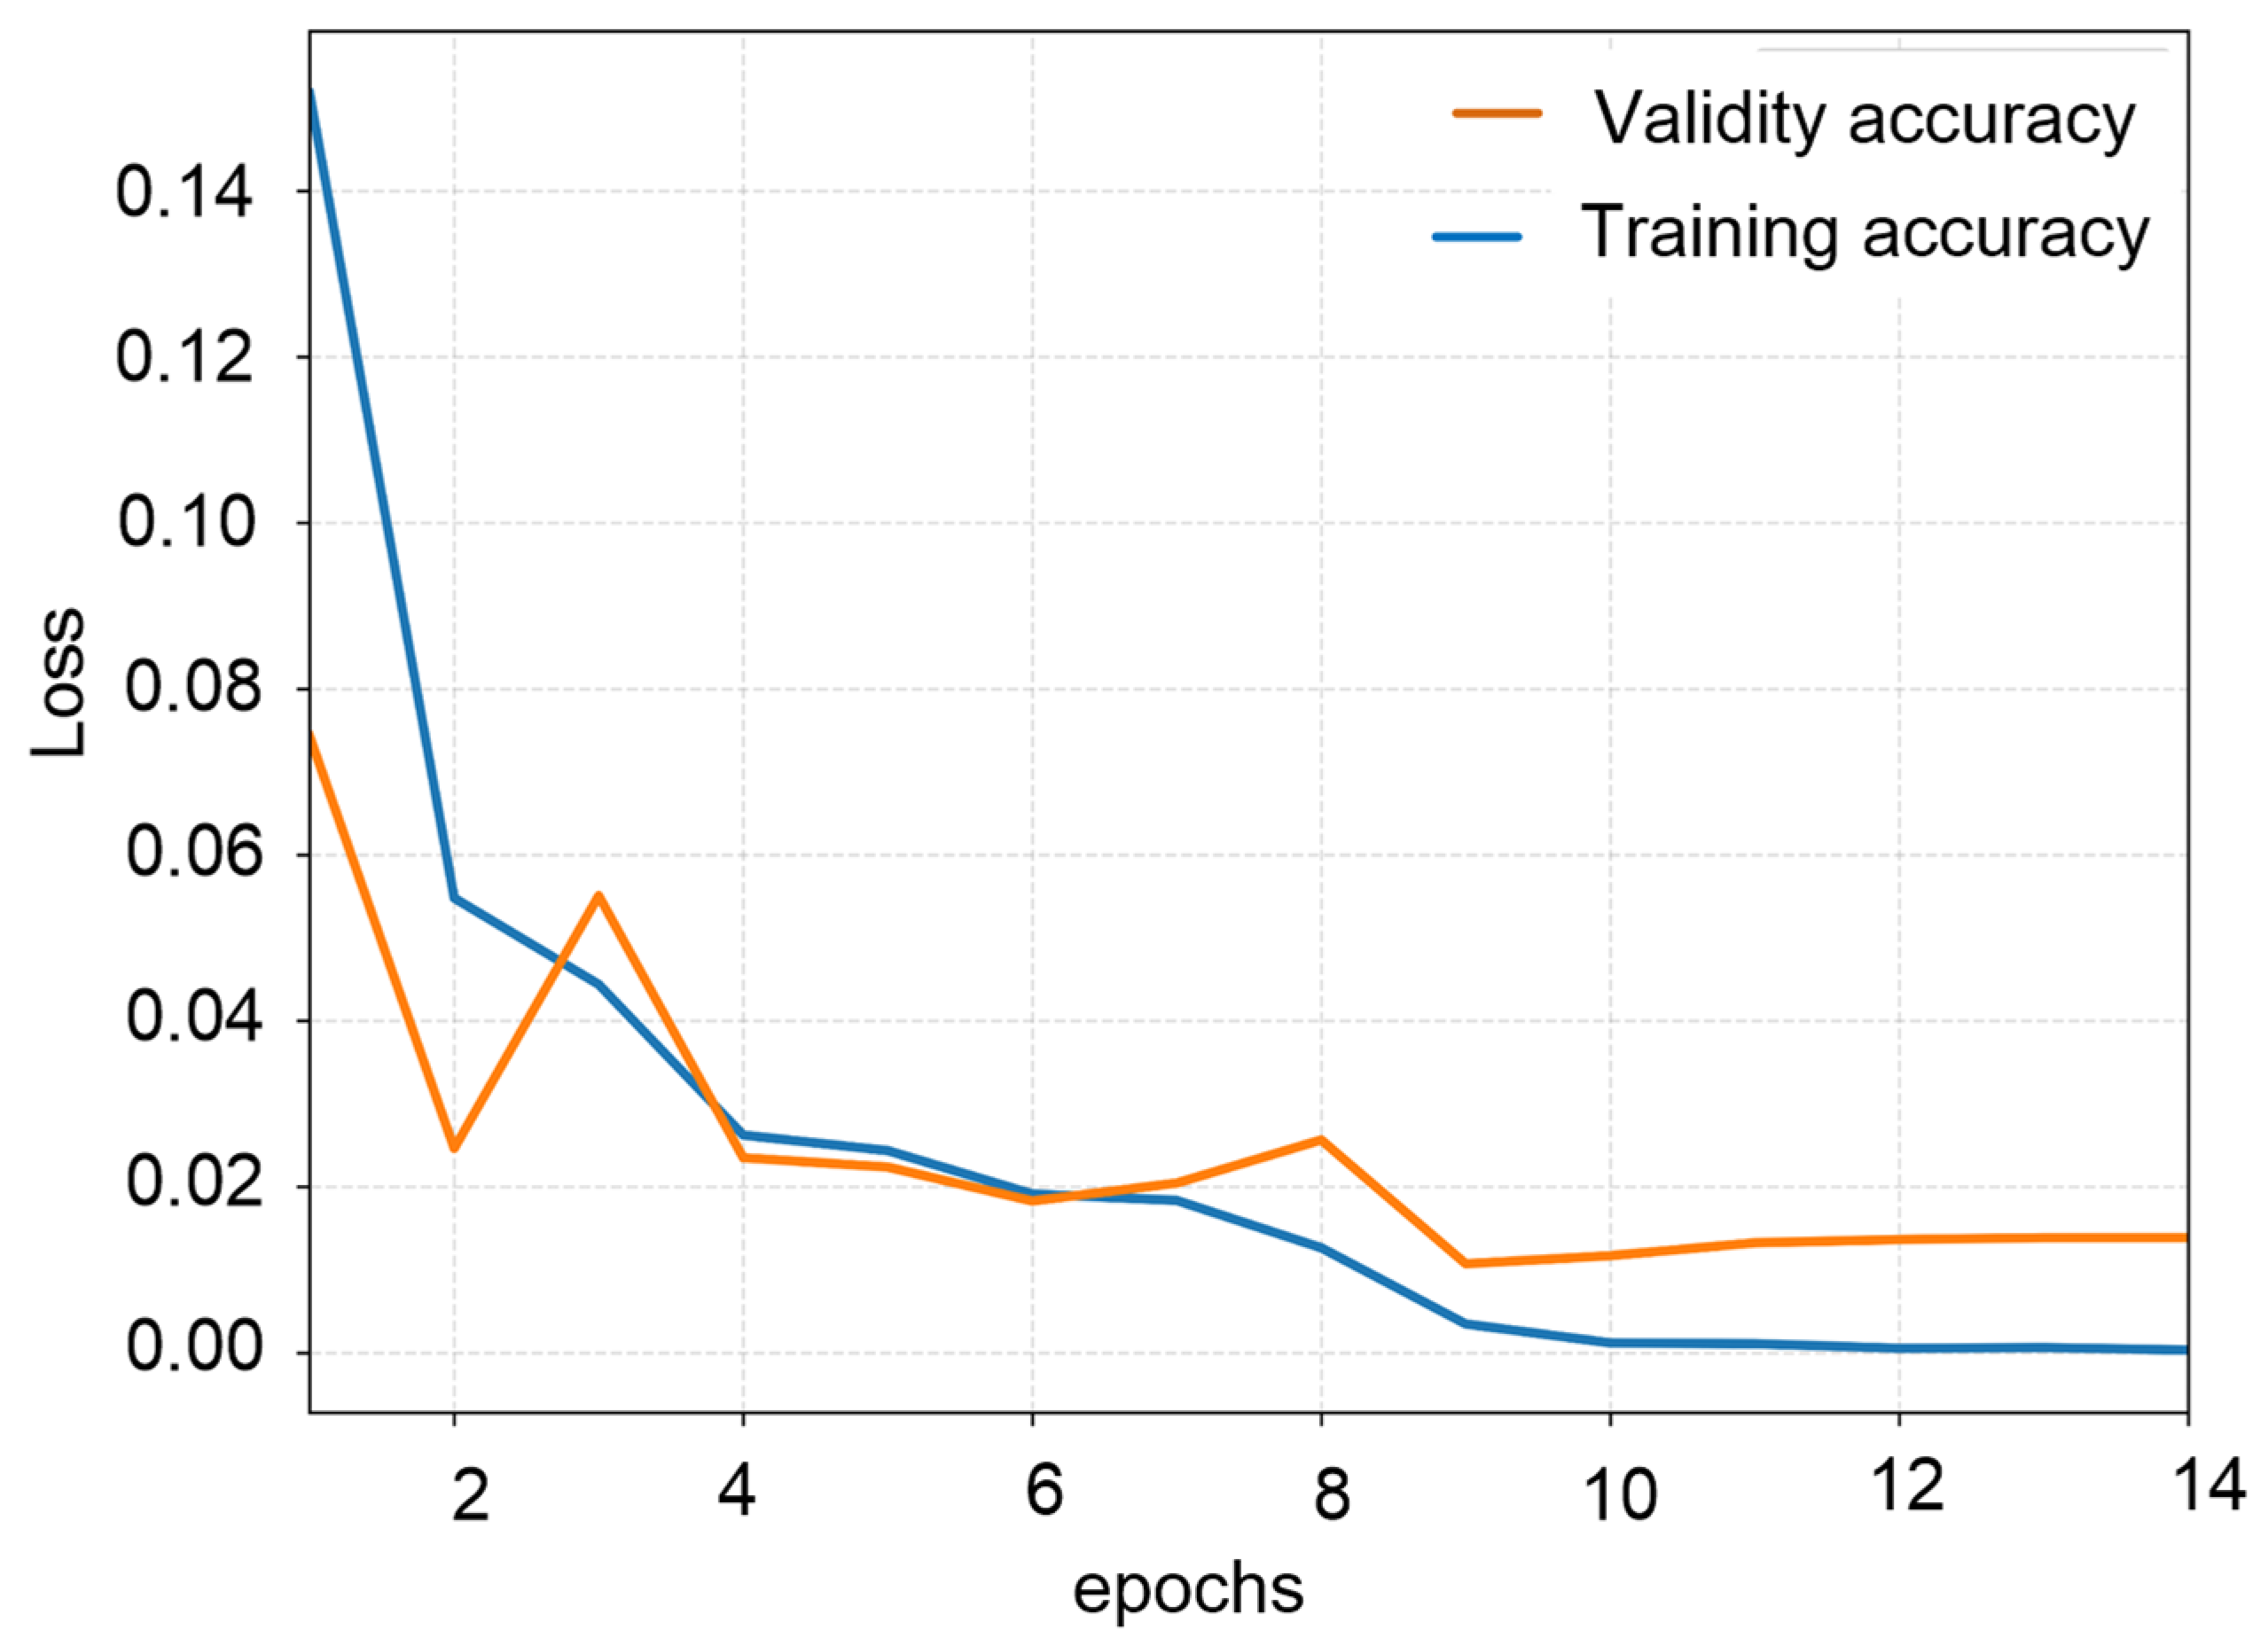
To further evaluate optimization stability, training and validation loss curves were analyzed, as shown in
Figure 7.
Both the loss curves exhibit a rapid decline during the initial training epochs followed by stable convergence at low loss values. The validation loss remained low and followed a trend similar to the training loss throughout the training process, indicating stable optimization and effective feature representation learning. The close correspondence between training and validation loss confirms minimal overfitting and highlights the robustness of the proposed framework in classifying ASD-related vocal patterns. Overall, the accuracy and loss analyses demonstrate that the CNN–BiLSTM–Attention model achieves stable convergence, effective optimization, minimal overfitting, and strong classification performance for ASD vs. non-ASD speech classification. Although a maximum of 100 training epochs was specified, the Early Stopping criterion terminated training once the validation performance ceased to improve, resulting in convergence within approximately 10–14 epochs.
3.7. ROC Curve Analysis
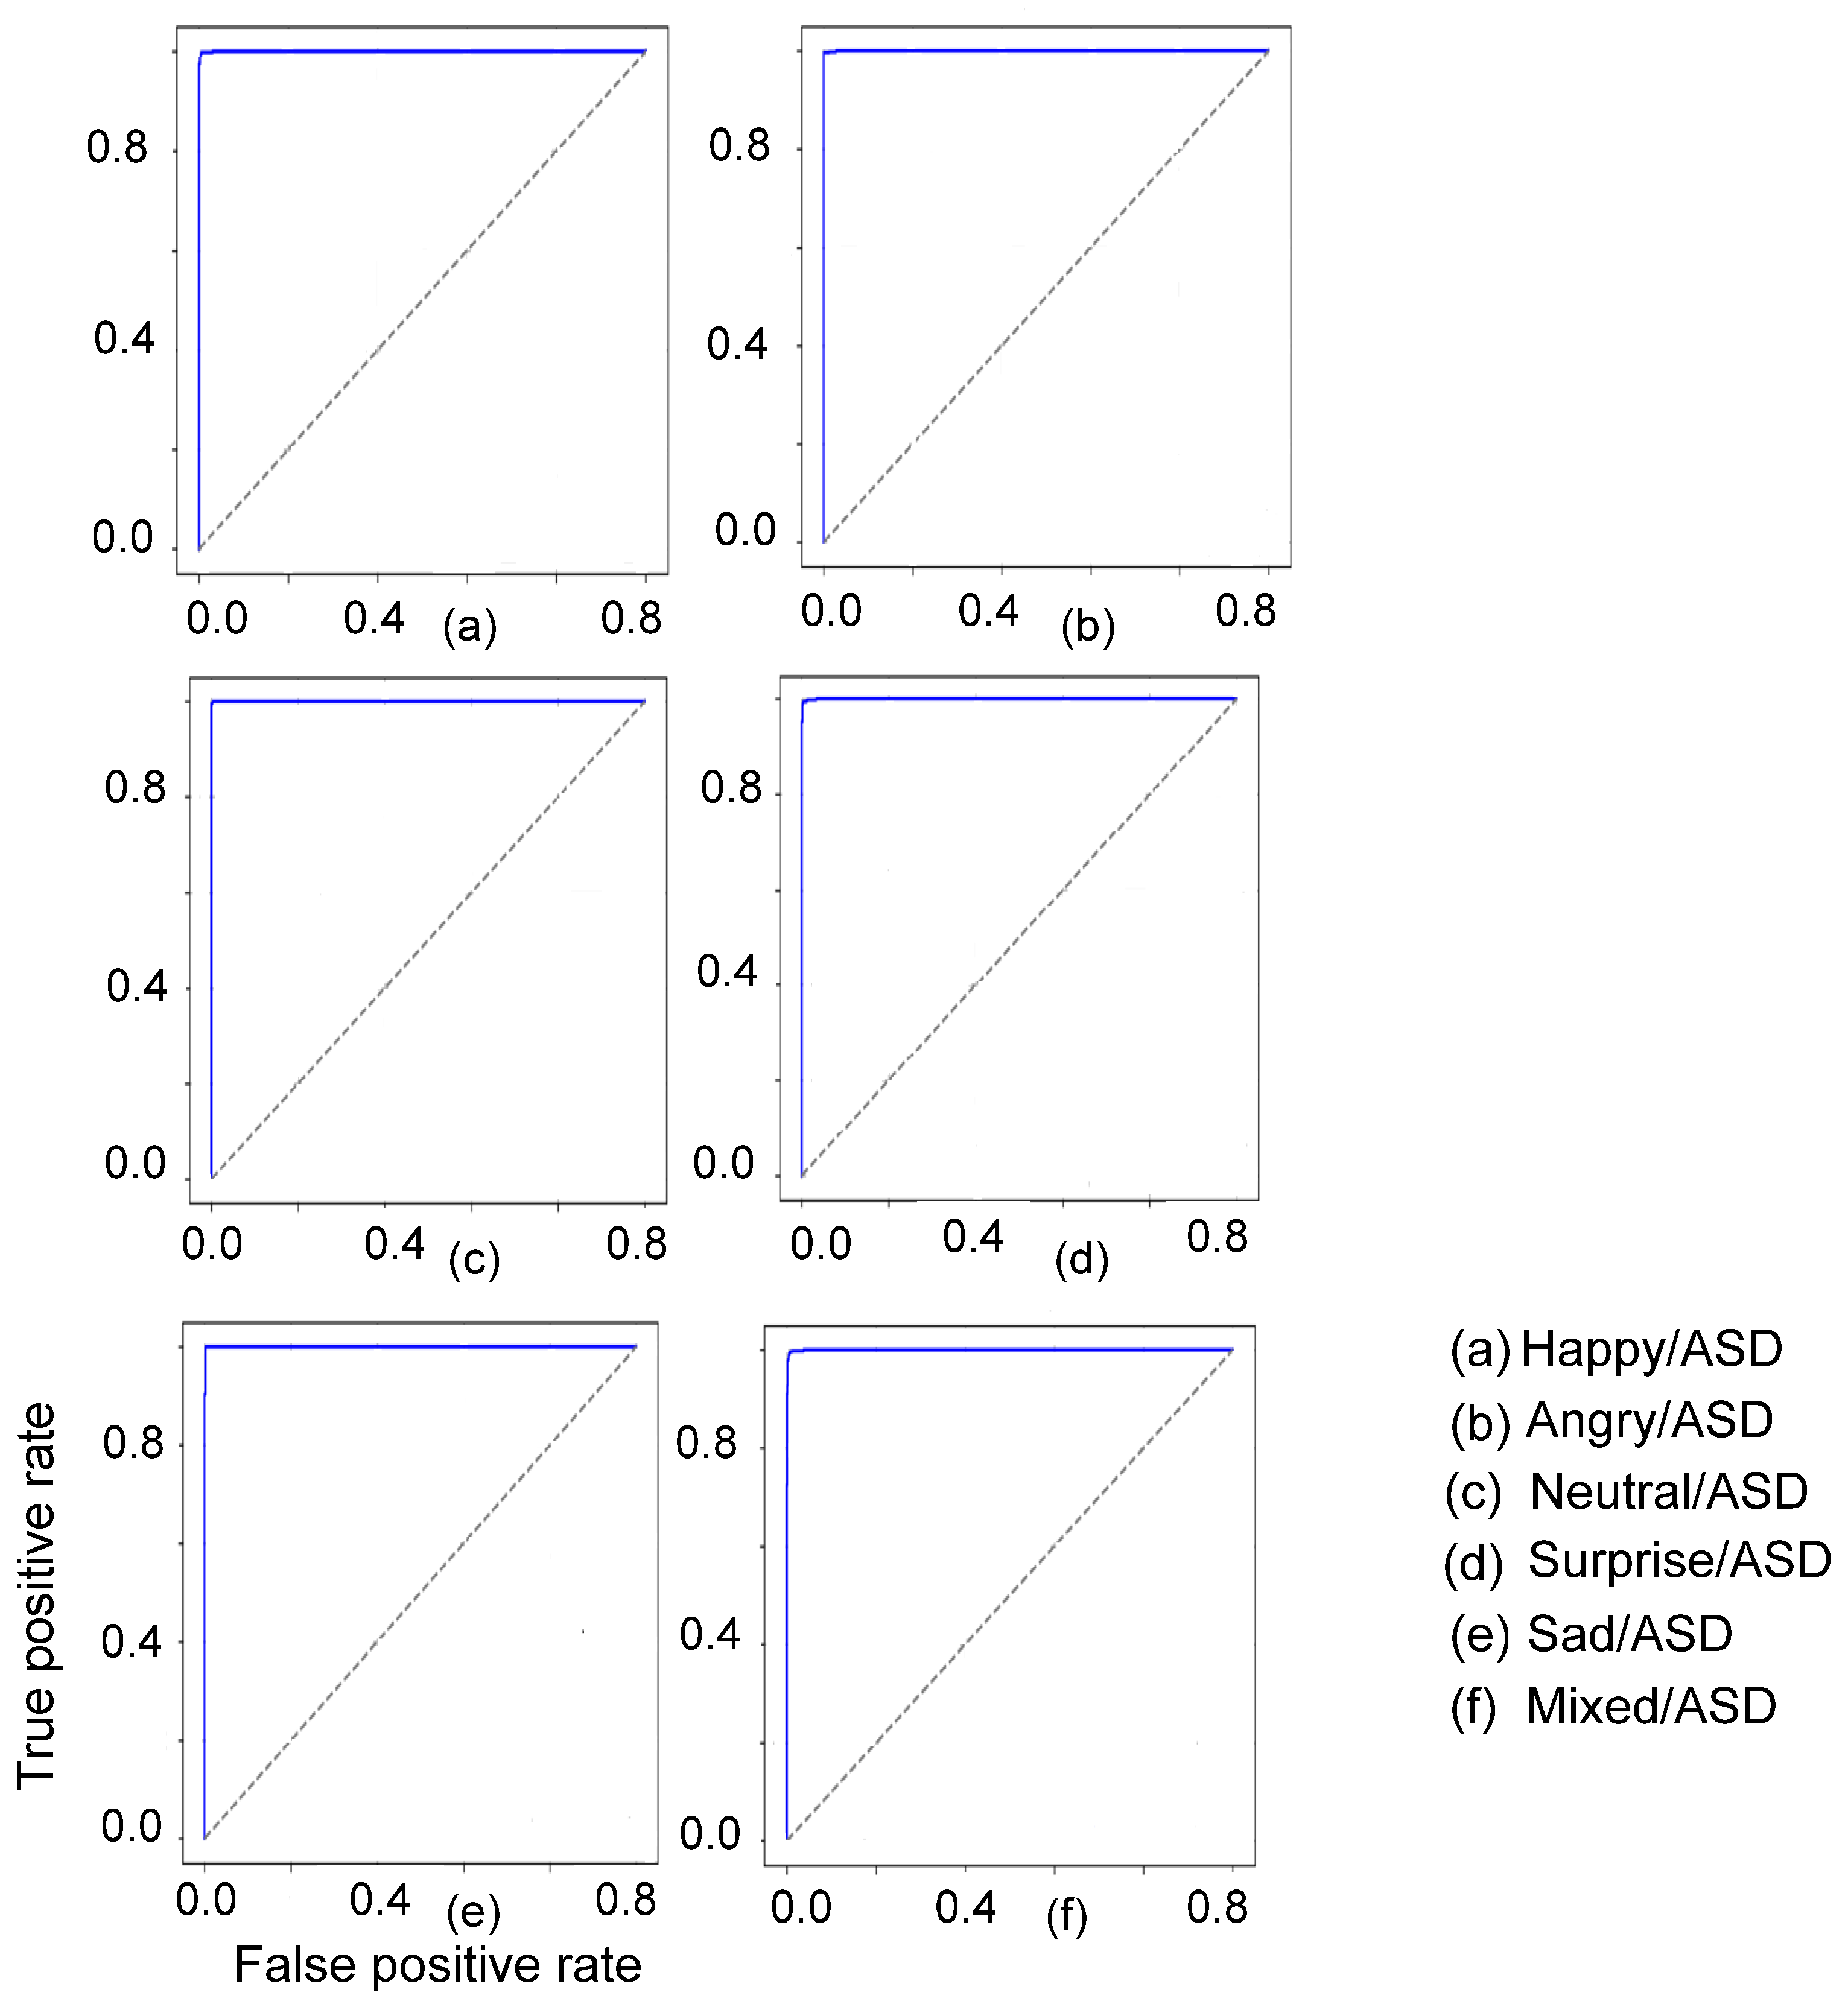
To evaluate the discriminative capability of the proposed framework, Receiver Operating Characteristic (ROC) analysis was performed
Figure 8 presents the ROC curves for ASD vs. non-ASD classification.
All ROC curves remain almost close to the top-left corner and consistently above the diagonal reference line, indicating strong classification performance with high true positive rates and low false positive rates. The Area under the Curve (AUC) values range from 0.9699 to 0.9864, as summarized in
Table 3, confirming excellent separability between ASD and non-ASD speech patterns. Despite variations in emotional expression, all categories maintain consistently high AUC values, demonstrating the robustness and generalization capability of the proposed framework.
These findings indicate that the extracted speech representations effectively capture ASD-related acoustic characteristics while remaining largely emotion-invariant, thereby minimizing misclassification across heterogeneous emotional conditions.
3.8. CMC Curve Analysis
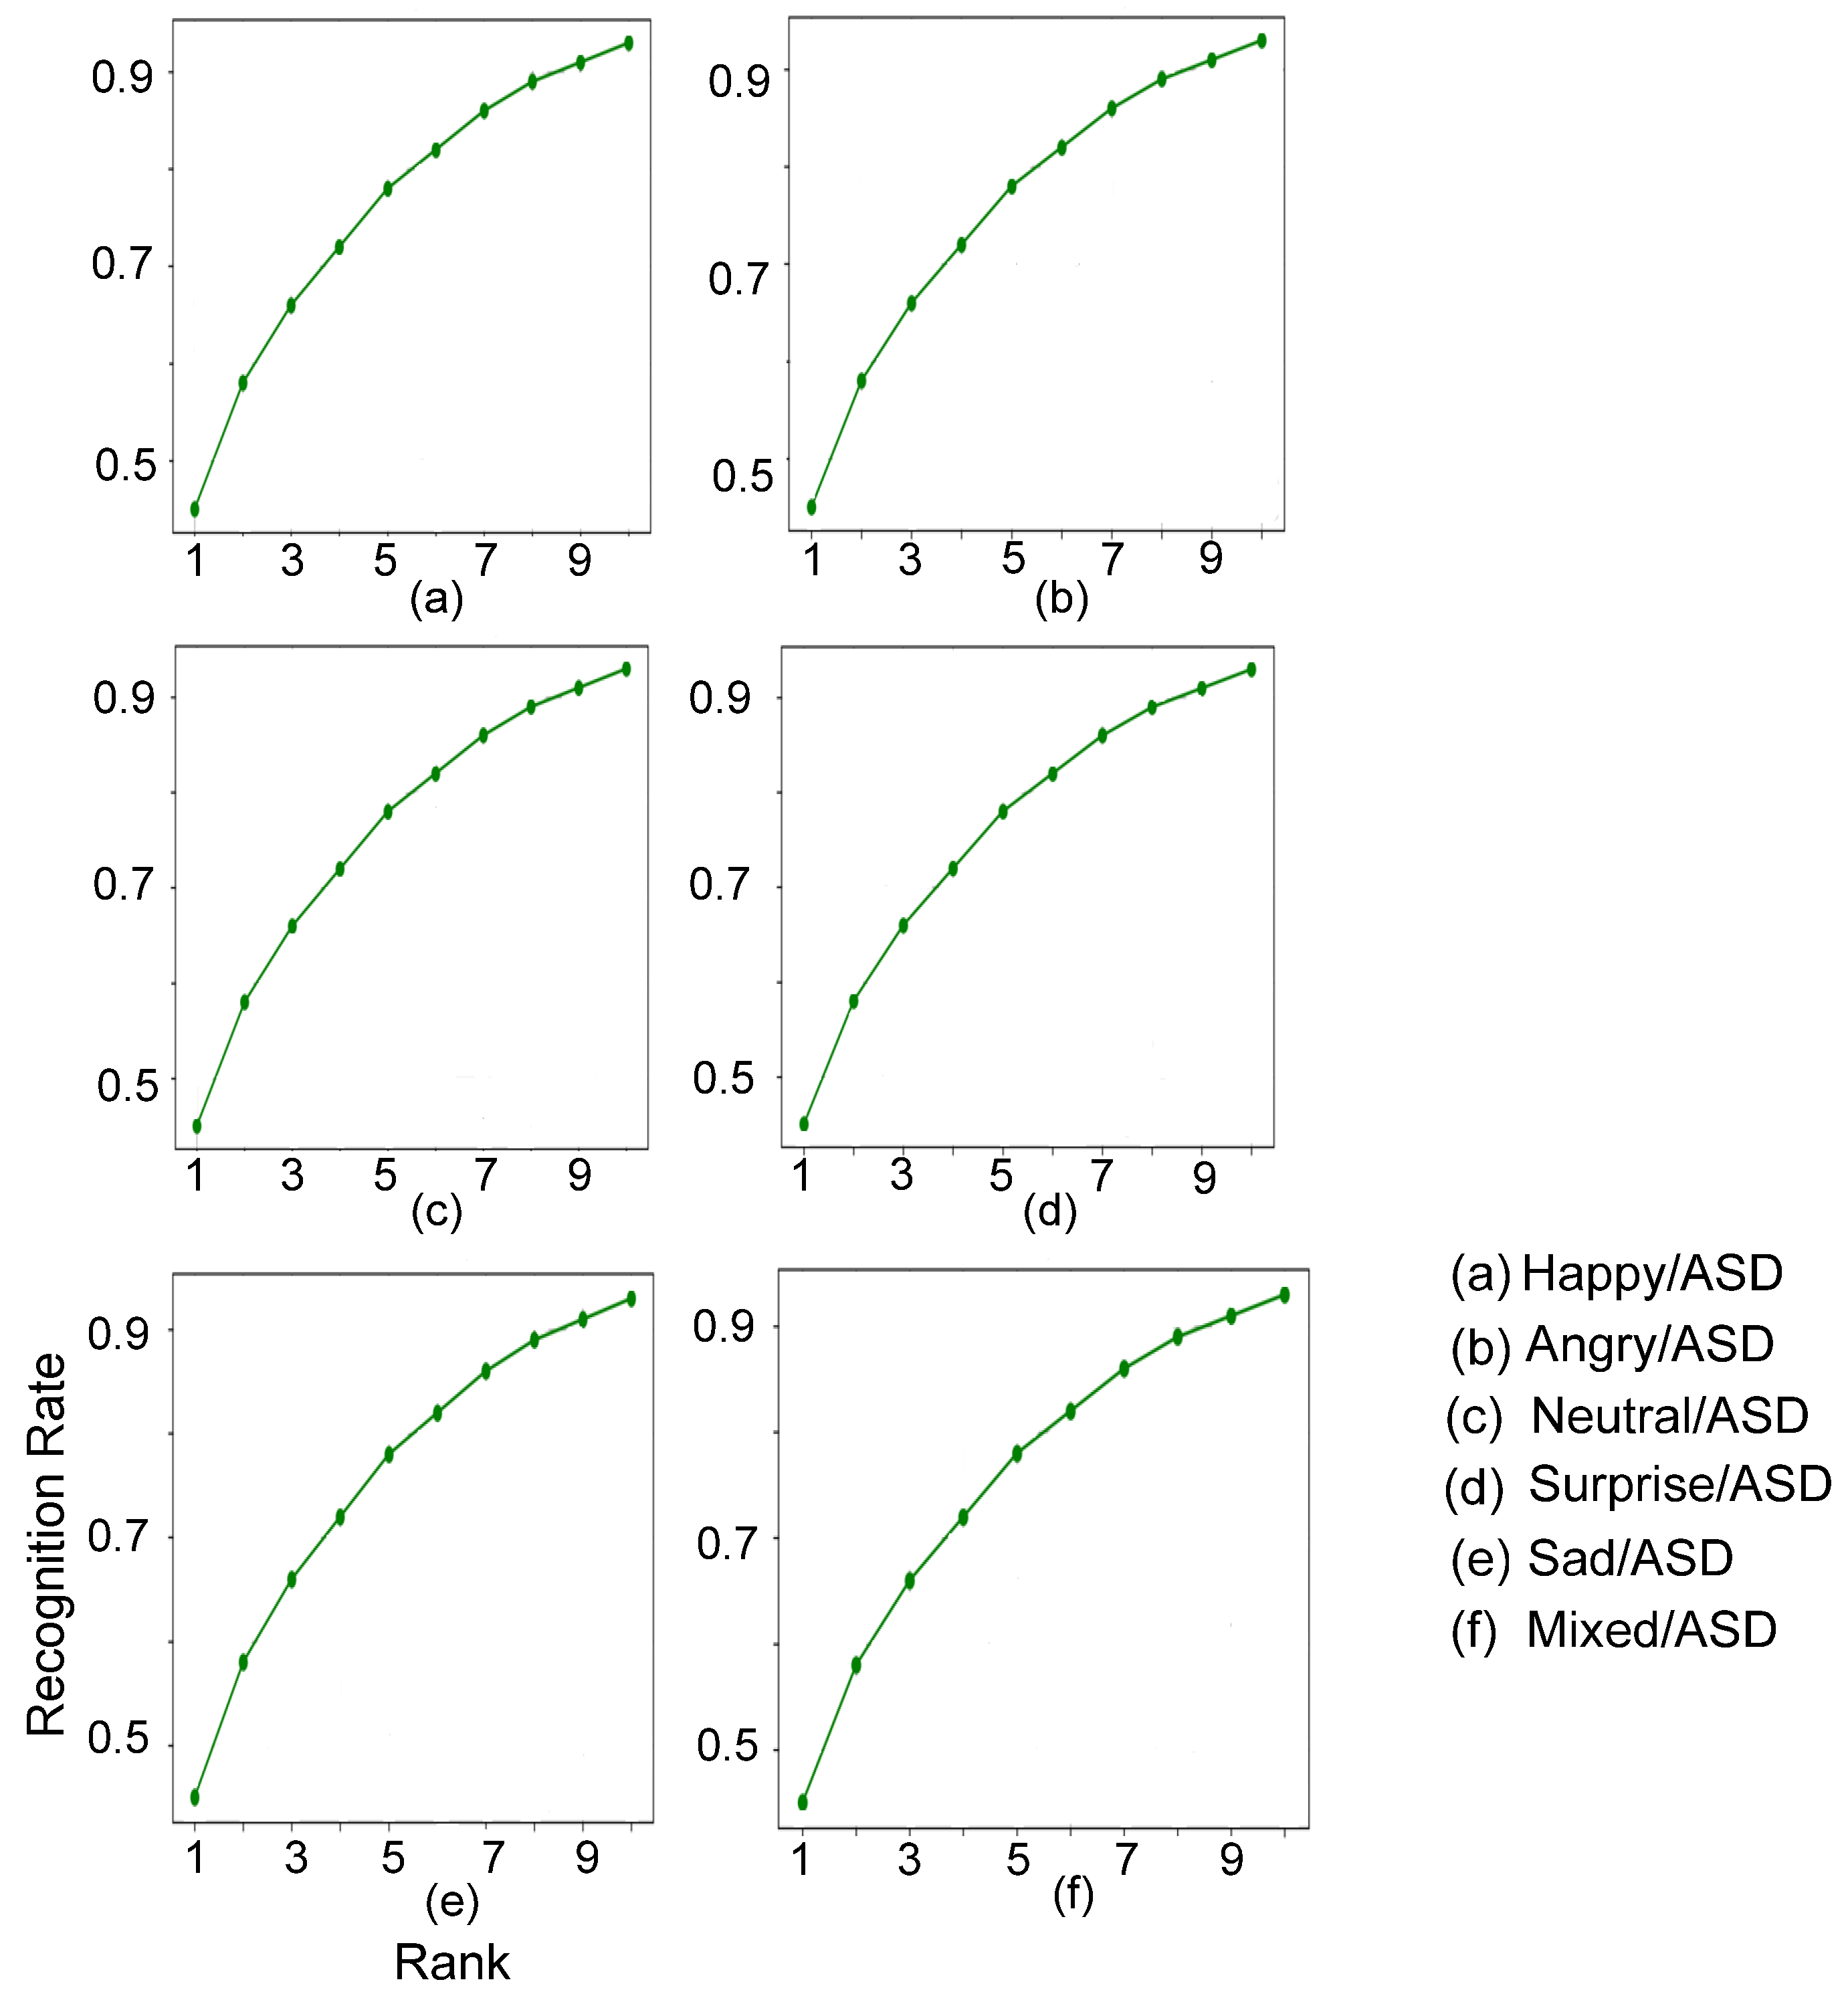
Cumulative Match Characteristic (CMC) analysis was performed to evaluate the rank-wise recognition capability of the proposed CNN–BiLSTM–Attention framework.
Figure 9 presents the CMC curves for ASD versus emotional non-ASD classification.
The recognition accuracy increases steadily with increasing rank across all emotional categories, demonstrating the effectiveness of the proposed framework in identifying ASD speech relative to diverse emotional speech conditions. Notably, the recognition accuracy improves rapidly at lower ranks and gradually approaches higher recognition levels, indicating strong discriminative capability and reliable classification performance.
These results confirm that the combined CNN–BiLSTM–Attention architecture effectively captures discriminative ASD-related speech characteristics across multiple emotional states. Furthermore, the framework maintains consistent recognition performance despite emotional variability, highlighting its robustness and generalization capability.
3.9. F1-Score Analysis
To further evaluate classification performance, precision, recall, F1-score, specificity, and balanced accuracy metrics were computed, as summarized in
Table 4. The F1-score, representing the harmonic mean of precision and recall, provides a balanced assessment of model effectiveness.
The results demonstrate consistently high performance across all emotional categories, with precision values ranging from 0.9594 to 0.9983 and stable recall of 0.9801. The highest F1-score of 0.9891 was achieved for the surprised category, while balanced accuracy values ranged from 0.9699 to 0.9864.
Specificity and balanced accuracy further confirm strong discrimination capability between ASD and non-ASD speech with minimal classification bias. Overall, the proposed framework demonstrates robust, balanced, and reliable classification performance.
3.10. Confusion Matrix
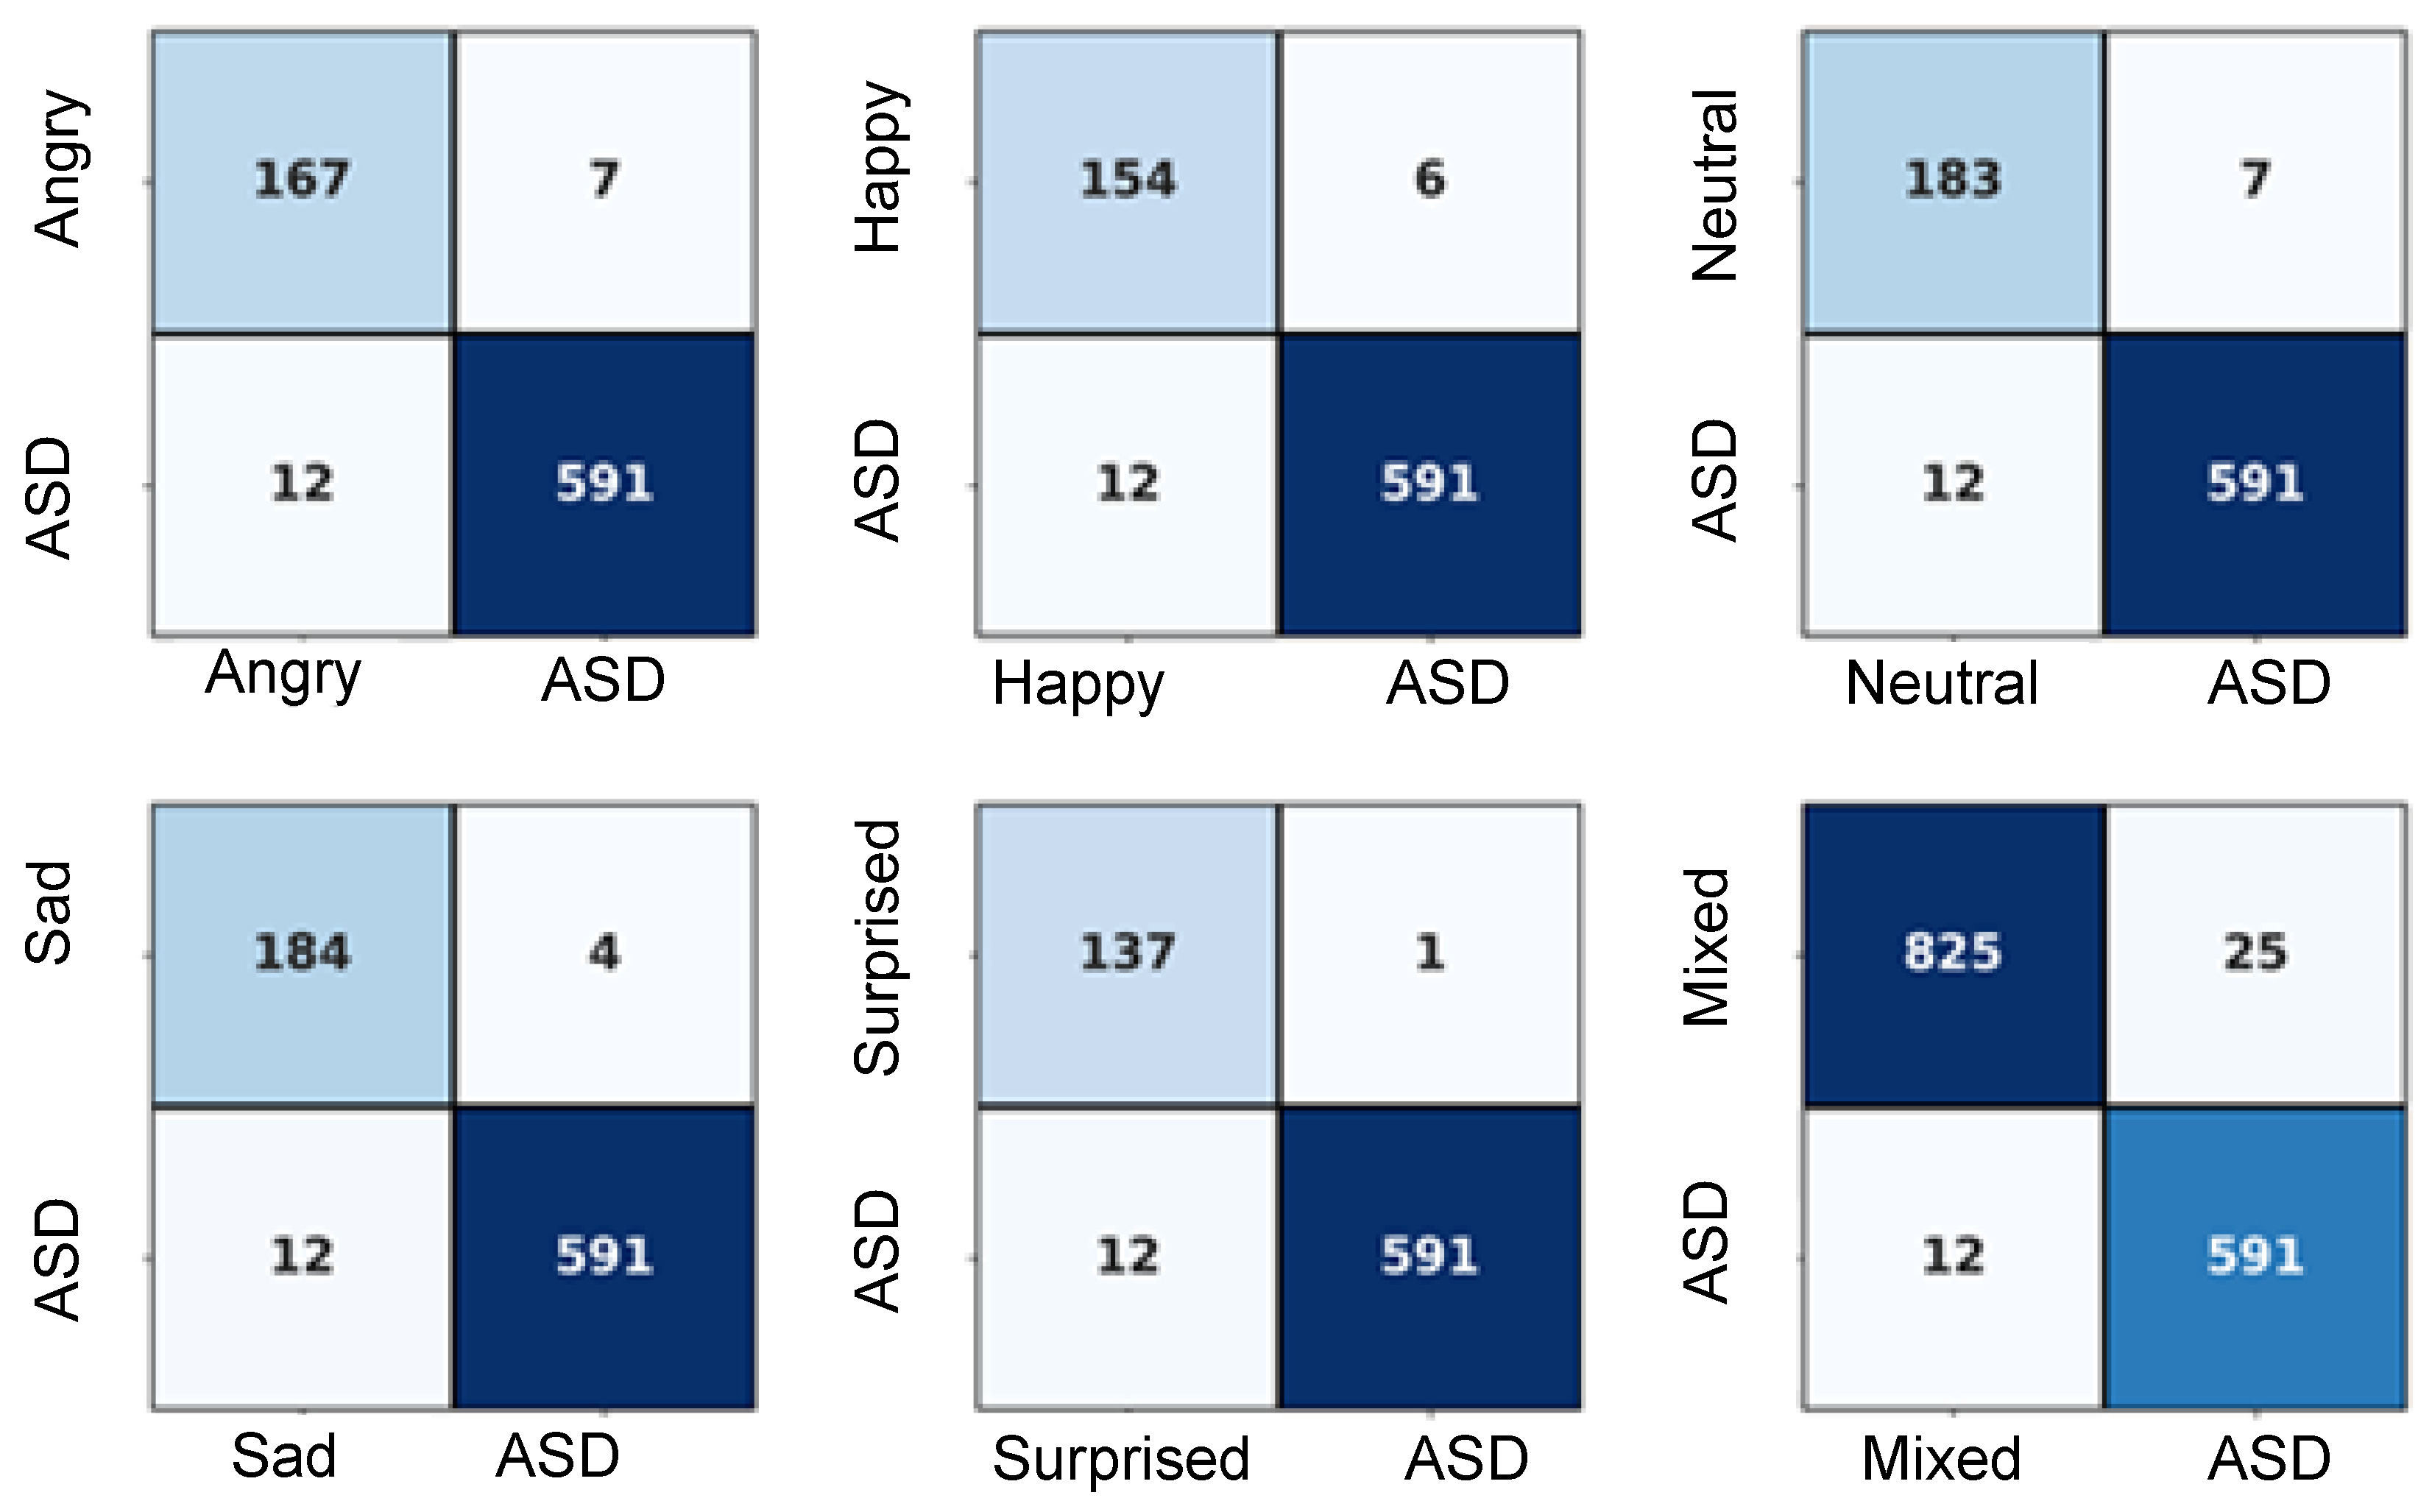
To further interpret the classification performance of the proposed framework, confusion matrix analysis was conducted across all emotion–ASD categories.
Figure 10 presents the confusion matrix for ASD versus non-ASD classification.
The matrix demonstrates that the majority of samples are correctly classified into their respective categories, with only limited misclassification observed between emotional classes. The high number of true positive and true negative classifications confirms the effectiveness of the proposed framework in distinguishing ASD-related speech characteristics from emotionally expressive non-ASD speech.
Additionally, the confusion matrix values correspond only to the test samples used in each experiment and do not represent the total collected dataset. The same ASD test samples were used across all emotion-wise evaluations; therefore, ASD counts remain constant across confusion matrices.
The low false positive and false negative rates further validate the robustness, reliability, and generalization capability of the CNN–BiLSTM–Attention framework for emotion-based ASD speech recognition.
3.11. Comparative Performance Analysis with Baseline Models
To further validate the effectiveness of the proposed architecture, its performance was compared with several widely used deep learning models commonly employed in speech-based classification tasks, including CNN, CNN–LSTM, and CNN–BiLSTM frameworks.
Table 5 summarizes the Comparative analysis of baseline deep learning models for effective classification.
As shown in
Table 5, the comparative results are included for contextual reference rather than direct experimental benchmarking. CNN–BiLSTM–Attention model achieved a classification accuracy of 98.3%, demonstrating competitive performance compared with baseline deep learning models. CNN [
40] and CNN–LSTM [
41] achieved lower accuracies of 83.6% and 88.5%, respectively, while CNN–BiLSTM [
42] improved performance to 97.8% through bidirectional temporal modeling. The results highlight the effectiveness of the proposed framework in learning discriminative ASD-related speech characteristics. A CNN–LSTM-based model described by Lakhan et al, 2003 [
43] reports 99.0% accuracy. The superior performance of the proposed model demonstrates the effectiveness of attention in enhancing discriminative feature learning and classification robustness. These baseline models are widely used in speech analysis, providing a fair comparison.
It is important to note that this study addresses a binary classification task (ASD vs. non-ASD), whereas the comparative works in [
40,
41,
42] focus on multi-class emotion recognition, which is inherently more complex due to fine-grained acoustic variability. Nevertheless, the proposed method achieves performance comparable to the closely related work in further validating its effectiveness.
The proposed model demonstrates improved accuracy and strong generalization across various ASD vs. non-ASD classification, when compared with baseline approaches.
Overall Findings—Strategy-II
The CNN–BiLSTM–Attention framework demonstrates high classification accuracy, stable optimization behavior, and strong generalization capability across multiple emotional conditions. The integration of spatial, temporal, and attention-based learning enables robust and reliable detection of ASD-related speech characteristics while maintaining minimal misclassification across heterogeneous emotional speech datasets.
Therefore, both Strategy-I and Strategy-II confirm the effectiveness of the proposed framework for ASD vs. non-ASD speech classification. Strategy-I validates the acoustic and statistical separability of ASD speech through PCA–GMM analysis, while Strategy-II demonstrates robust classification performance using the CNN–BiLSTM–Attention framework. Together, the proposed system achieves reliable ASD detection with high accuracy and strong generalization.
4. Conclusions
The study demonstrated the effectiveness of a hybrid dual-path framework for ASD detection from emotional speech using PCA–GMM-based acoustic analysis and a CNN–BiLSTM–Attention deep learning architecture. PCA explained variance analysis showed that the first three principal components were able to retain about 64% of the total variance, keeping the most discriminative acoustic information and reducing the feature redundancy. Feature loading analysis indicated that jitter, shimmer and pause related parameters were major contributors to these principal components which dominated the analysis. The PCA–GMM analysis further revealed clear statistical separability between ASD and non-ASD speech patterns. In parallel, the CNN–BiLSTM–Attention framework achieved robust and stable classification performance across multiple emotional conditions, attaining 98.3% accuracy, AUC values ranging from 0.9699 to 0.9864, and F1-scores up to 0.9891. Comparative evaluation demonstrated competitive performance against baseline deep learning models, highlighting the effectiveness of attention-based temporal feature learning for ASD speech classification. Overall, the proposed framework demonstrates the potential of AI-driven speech analysis as a scalable, robust, and non-invasive approach for intelligent ASD screening and predictive healthcare applications.
Future work will focus on expanding the dataset with more diverse samples, evaluating baseline models under identical experimental conditions, performing ablation studies to assess the contribution of individual network components, and incorporating multimodal features such as facial and behavioral cues for improved ASD detection. Additionally, advanced architectures, including Transformer-based models, will be explored under standardized experimental conditions for more comprehensive evaluation. Future investigations will also consider emotion-wise annotation and analysis of ASD speech to better understand emotional variability in ASD-related vocal characteristics.