Article

Weighing Accuracy of Individual Total Mixed Ration Components in Mixer Feed Wagons for Dairy Cows


by
Roman Gálik
1,
Štefan Boďo
1,*,
Angélique Lűttmerding
1 and
Gürkan Alp Kagan Gurdil
2
1
Institute of Agricultural Engineering, Transport and Bioenergetics, Faculty of Engineering, Slovak University of Agriculture in Nitra, Tr. A. Hlinku 2, 949 76 Nitra, Slovakia
2
Department of Agricultural Machinery and Technologies Engineering, Faculty of Agriculture, Ondokuz Mayis University, 55139 Samsun, Turkey
*
Author to whom correspondence should be addressed.
Appl. Sci. 2026, 16(13), 6558; https://doi.org/10.3390/app16136558
Submission received: 14 April 2026 / Revised: 5 June 2026 / Accepted: 12 June 2026 / Published: 1 July 2026

Featured Application

Our work provides analysis and extends current knowledge in the field of dairy nutrition management through an in-depth analysis of operational inaccuracies in the feeding management process of dairy cow farming. Our findings have direct application potential within this agricultural sector. We did not notice any significant difference while comparing the loading inaccuracies between farm A and farm B with corn silage (p = 0.055), alfalfa haylage (p = 0.001), and core concentrate (p = 0.015).

Abstract

Monitoring the quantity of feed provided is of fundamental importance for dairy cows and the entire farm operation, as feed costs account for 60–70% of total operating expenses. Monitoring the precise amount of feed delivered, using automated weighing systems on mixer wagons, ensures that dairy cows are fed an accurately calculated ration tailored to their age, production phase, and performance. Deviations in the delivered quantity can lead to an imbalanced diet and a decline in milk production. Our objective was to propose changes in feeding management and to optimize the workflow to minimize operator error during the dosing of feed components. The innovation of our research lies in the statistically supported identification and quantification of differences within the feeding process. Although the average feeding error over the mentioned period (one month, June) was statistically low, which might suggest good control over feed delivery, the monthly variability in individual components was unacceptably high. For instance, on Farm B, the average surplus of alfalfa haylage was 5.89%, yet values fluctuated significantly between days (standard deviation for the June period of 22.03%), indicating high variability and the likely occurrence of extremes (134.5%). Although it might look like the average monthly error may be controllable, this error hides an unacceptably high daily fluctuation.

1. Introduction

Mixer feed wagons are used for the preparation, transport, and delivery of complete feeds, which facilitate labor organization and allow for a reduction in livestock feeding time [1]. Within the framework of precision agriculture, livestock management is one of the current challenges of the industry [2]. Total Mixed Rations (TMRs) are currently the primary method of feeding cattle in larger agricultural holdings [3]. During TMR intake, dairy cows receive a designated ratio of concentrate feed, including macro- and micro-elements and vitamins mixed together. While the zootechnician calculates a theoretical ration, the ration that cows actually receive at the feed bunk is referred to as the actual ration [4]. However, as ref. [1] adds, it will never perfectly correspond to the actual composition of the TMR. Technology can provide a systematic tool for detecting unforeseen problems that are difficult to notice through visual inspection during occasional checks [4]. Many factors influence the discrepancy between the theoretical and the actually accepted nutritional value. Utilizing precision livestock feeding can reduce protein intake by 25% and nitrogen excretion into the environment by 40%, while simultaneously increasing profitability by nearly 10% [5,6,7]. Monitoring health issues through the early detection of clinical signs of disease on the farm is one of the key issues that led to the emergence of precision livestock farming [8,9]. This data is stored in a digital format. The current industrial revolution is heading towards a complete transformation of traditional production processes in organizations through the integration of modern industrial revolution technologies into established production workflows [10]. It is undeniable that digitalization increases productivity and efficiency while reducing costs. Innovation progresses every day, and its expansion is gradually affecting the development of human resources and the skill requirements that workers must possess [11,12]. Precision feeding strategies can enable the alignment of nutrient supply with animal requirements to improve animal productivity while reducing environmental pollution and production costs [13]. Currently, the presence of several technologies on farms that allow for automatic data collection—such as concentrate feed intake, yield, milk composition, body weight, or animal behavior—can facilitate the application of precision feeding strategies. Ref. [14] proposed limiting feed intake for less efficient dairy cows using individual feeding devices with a Total Mixed Ration, while ref. [15] suggested modulating the amount of concentrate feed added in automatic milking systems depending on the milking performance of individual animals. Information technologies for data collection on a granular scale can support efficiency and decision-making on dairy farms [16]. It is evident that information technologies, such as the Internet of Things (IoT), and Computer Vision (CV), demonstrate potential for enhancing livestock management processes within the environment of precision agriculture [17,18]. The fundamental and ultimate goal of AI is to develop Machine Intelligence (MI) using smart machines to perceive, reason, learn, discover, optimize, act, communicate, and deliberate in a human, rational, and ethical manner [19]. Acquiring knowledge about the nutrient content in cow feed ingredients and accurately predicting animal nutrient requirements are certainly major challenges for dairy farmers [20]. Precision animal nutrition and precision feeding aim to optimize nutrient supply and demand relative to the animals for targeted animal outcomes and dairy product characteristics, as well as economic and environmental farm performance [13,14,15,21,22]. It is reported that dry matter (DM) concentrations of alfalfa and corn silage in samples collected on farms show great variability in both the long and short term [23]. Furthermore, the daily nutritional requirements of individual lactating cows, such as metabolizable energy (ME), exhibited deviations due to climate, diet, and animal-related factors. Ref. [24] observed that the deviation of estimated daily total ME requirements for individual cows from the actual ME delivered per cow in the herd varied considerably. Moreover, many minerals have vital functions in mammals; for example, phosphorus (P) plays a role in energy metabolism, while copper (Cu) and zinc (Zn) are involved in immune functions [25]. However, more than 75% of cows in commercial dairy herds received a ration with excesses of Co, Cu, Fe, Mn, and Zn compared to National Research Council recommendations, which can lead to harmful environmental impacts [26]. Nutrient concentrations in feeds are characterized by significant variability, which could alter the nutrient composition of the TMR and affect the health and yield of dairy cows, with subsequent implications for farm economic benefits and sustainability [27]. As ref. [28] states, the variability in TMR consistency, which can be influenced by nutrient variability, the condition of the mixing equipment, and the loading sequence of ingredients, plays a major role in production efficiency and overall herd profitability. Ration composition can change from day to day due to transient changes in the dry matter content of individual ingredients and the total dry matter content of the ration. Short-term changes in silage dry matter content can have temporary effects on dry matter intake and milk yield. However, cows adapt quickly to these dietary changes [29]. Regardless, measures should be taken to reduce the daily variability in the TMR, including regular feed analyses, precise ration preparation, and the training of personnel responsible for ration formulation, to ensure maximum herd health and profitability [30]. From this introduction, we can see that, when modern technology is used on farms, this technology is equipped with various sensors, which can monitor any chosen parameter. The knowledge gap is not defined as a lack of knowledge about nutritional needs, yet it is defined as a lack of data in the daily variability in the delivery of TMR components caused by the “human–machine” interface. While previous research addressed nutrition (feed formulas), we want to address the operational accuracy of delivering these feed formulas in real-world practice.
These days, when humanity possesses the control mechanisms to monitor the actual amount of loaded feed vs. planned, it is very certainly possible to monitor the actual amount of loaded feed on a daily basis. Statistical software is able to point out the difference between the amount of loaded feed and planned feed. In our experiment, we could like to focus on how this works in real life on dairy farms.

2. Materials and Methods

As evident from the literature review, the precise composition of feed, as well as its actual delivery to the animals, is crucial for both planned performance and animal health. In our observation, we want to focus primarily on the group of dairy cows with the highest milk yield. In this group, the recommended volume to core ratio (60:40) is increased many times due to even higher yield, up to 55:45. With such a ratio, the accuracy of the required component dose is very crucial. We focused on adherence to the precise daily loading of the required ration over the course of one month, as well as the exact proportion of individual primary components such as corn silage, alfalfa silage, and concentrate feed mixture. There are three key components used in the feeding operation, which we have focused our attention on in terms of maintaining the required amount. It is common practice in most agricultural holdings to monitor the quantity of feed consumed over a certain period against the planned consumption. On both farms, all the core concentrate was fed to dairy cows in Total Mixed Ration. We monitored selected TMR data by random observation. The data for the given period of the amount of required feed and the actual feed fed were obtained from the online data server. In this article, we present an evaluation of one month (June).

2.1. Characteristics of the Dairy Farms

Data regarding the loading precision of selected TMR components into specific feeding systems were collected over a period of six months at two selected dairy farms in the southern part of the Slovak Republic. Two identical types (Trioliet Solomix 2 ZK) of cattle feeding systems were utilized to obtain the required data and parameters. Trioliet Solomix 2 ZK mixer wagons were used on both farms to obtain the required data and parameters. The only difference between these two types is the volume of wagon, as there was Solomix 2 1200 ZK with 12 m3 capacity and Solomix 2 1400 ZK with 15 m3 capacity. The feed was prepared and added using these Trioliet mixer feed wagons. Trioliet Solomix 2 ZK is a feeding system without a built-in loader, equipped with two vertical mixing augers. For the purposes of anonymity and the protection of personal data of the selected dairy farms, the designations Farm A and Farm B were used.

2.2. Monitored Parameters

  • Corn silage, alfalfa silage, and concentrate feed mixture, which formed the basis of the TMR.
  • Target weight of selected TMR components (Farms A and B) [kg].
  • Actual weight of selected TMR components (Farms A and B) [kg].
  • Difference between the target and loaded weight of selected TMR components (Farms A and B) [kg, %].

2.3. Farm A

Farm A, located in the southern part of the Nitra Region, specializes in Holstein cattle breeding, with 350 cows. For the purpose of monitoring the selected parameters, one group of 50 high-yielding dairy cows with a milk yield of 10,000 L per year, fed the same TMR, was selected. The dairy cows were in their second and higher lactations, at the peak of lactation between the 100th and 200th day. The TMR weight was adjusted several times during the selected months. Farm A utilizes a feeding system without a built-in loader, equipped with a real-time digital weighing monitoring system, which ensures that the amount of feed loaded into the diet mixer wagon (DMW) corresponds precisely to the prescribed recipe. Farm A owns the 1200 ZK model, which is loaded externally using a Weidemann WD 3070 CX80 loader. Farm A tried to maintain a ±5% tolerance between the target and delivered amounts of feed.

2.4. Farm B

Farm B, located in the central part of the Nitra Region, also specializes in Holstein cattle breeding, with 300 cows. For measurement purposes, one group of 40 high-yielding dairy cows with a milk yield of 10,000 L per year, fed the same TMR, was selected. The TMR weight was adjusted several times during the selected months. Farm B owns the 1400 ZK model, which is loaded externally using a Manitou Maniscopis MLT 735-120 LSU TURBO loader. Farm B utilizes a feeding system without a built-in loader and without a monitoring device in the telehandler cab. Farm B tried to maintain a ±5% tolerance between the target and delivered amounts of feed.

2.5. Workflow

  • Through the implementation of digitalization in dairy feeding, data regarding individual components and total TMR weights were transferred from the feeding system to the dairy farm’s data server.
  • Subsequently, the data were exported from the farm server to a portable data storage device.
  • The data were then imported into data processing software (Excel), where they were organized by date, time, and other criteria.
  • The organized data were exported to statistical software (STATISTICA), where appropriate statistical methods were applied. The data were expressed as means ± SD (standard deviation). Descriptive statistics and a one-way ANOVA were utilized. A 95% confidence interval was selected (p ≤ 0.05). We used the ANOVA statistical test to compare the means of multiple independent groups to determine whether there was a statistically significant difference between them.
  • The data outputs were used to generate tables and charts.
Feed preparation and delivery were carried out using trailed diet mixer wagons. These are feeding systems without built-in loaders, featuring two vertical mixing augers. On Farm A, the mixer wagon was filled externally using a telehandler equipped with a “Cab Control” system; on Farm B, a telehandler without a monitoring device was used. Software dedicated to feed management was used to export data from the feeding system’s Trioliet TFM Tracker. Feeding system specifications: 2 vertical mixing augers, 2 counter-blades; the mixer wagon was controlled directly via the tractor’s hydraulics; the weighing system precision was <1%, or <1.8% of the actual weight. The software was used to acquire and export data (number of cows, milk yield, loaded ration quantities) from the mixer wagon systems used on both farms. Data transfer was conducted via a USB flash drive, used to extract the necessary information from the mixer wagon. Feed components, recipes, and animal groups were entered via a PC. A wireless Datalink or a USB flash drive was used to send information to the programmable weighing indicator on the feeding system loader. During feeding, the actual loaded weights are recorded, stored, and sent back via Datalink (wirelessly) or via a USB flash drive.

2.6. Statistical Methods for Result Evaluation

Microsoft Office Excel

Microsoft Office Excel software (Microsoft Corporation, Redmond, WA, USA) was used for initial data processing. Basic descriptive statistics of the sample were applied for preliminary processing. Subsequently, data analysis was performed using the one-way analysis of variance (ANOVA) function to evaluate the outputs.

3. Results

3.1. Values of Delivered Components

At both farms, a tolerance of ±5% between the target and delivered amount of feed was established and considered acceptable. Our research focused on the daily scheduled amount of feed and the mixture of its primary components, silage, haylage, and concentrate feed, as well as the actual quantities delivered for both the total ration and these key components.

3.2. Farm A

3.2.1. Overview of Daily Feed Delivery Quantities

On Farm A, efforts were made to adhere to the principle of not exceeding the actual quantity of delivered feed within a ±5% tolerance of the required ration. Regarding the precision of the daily ration on Farm A, we recorded values that are presented in detail in the following sections.

3.2.2. Corn Silage

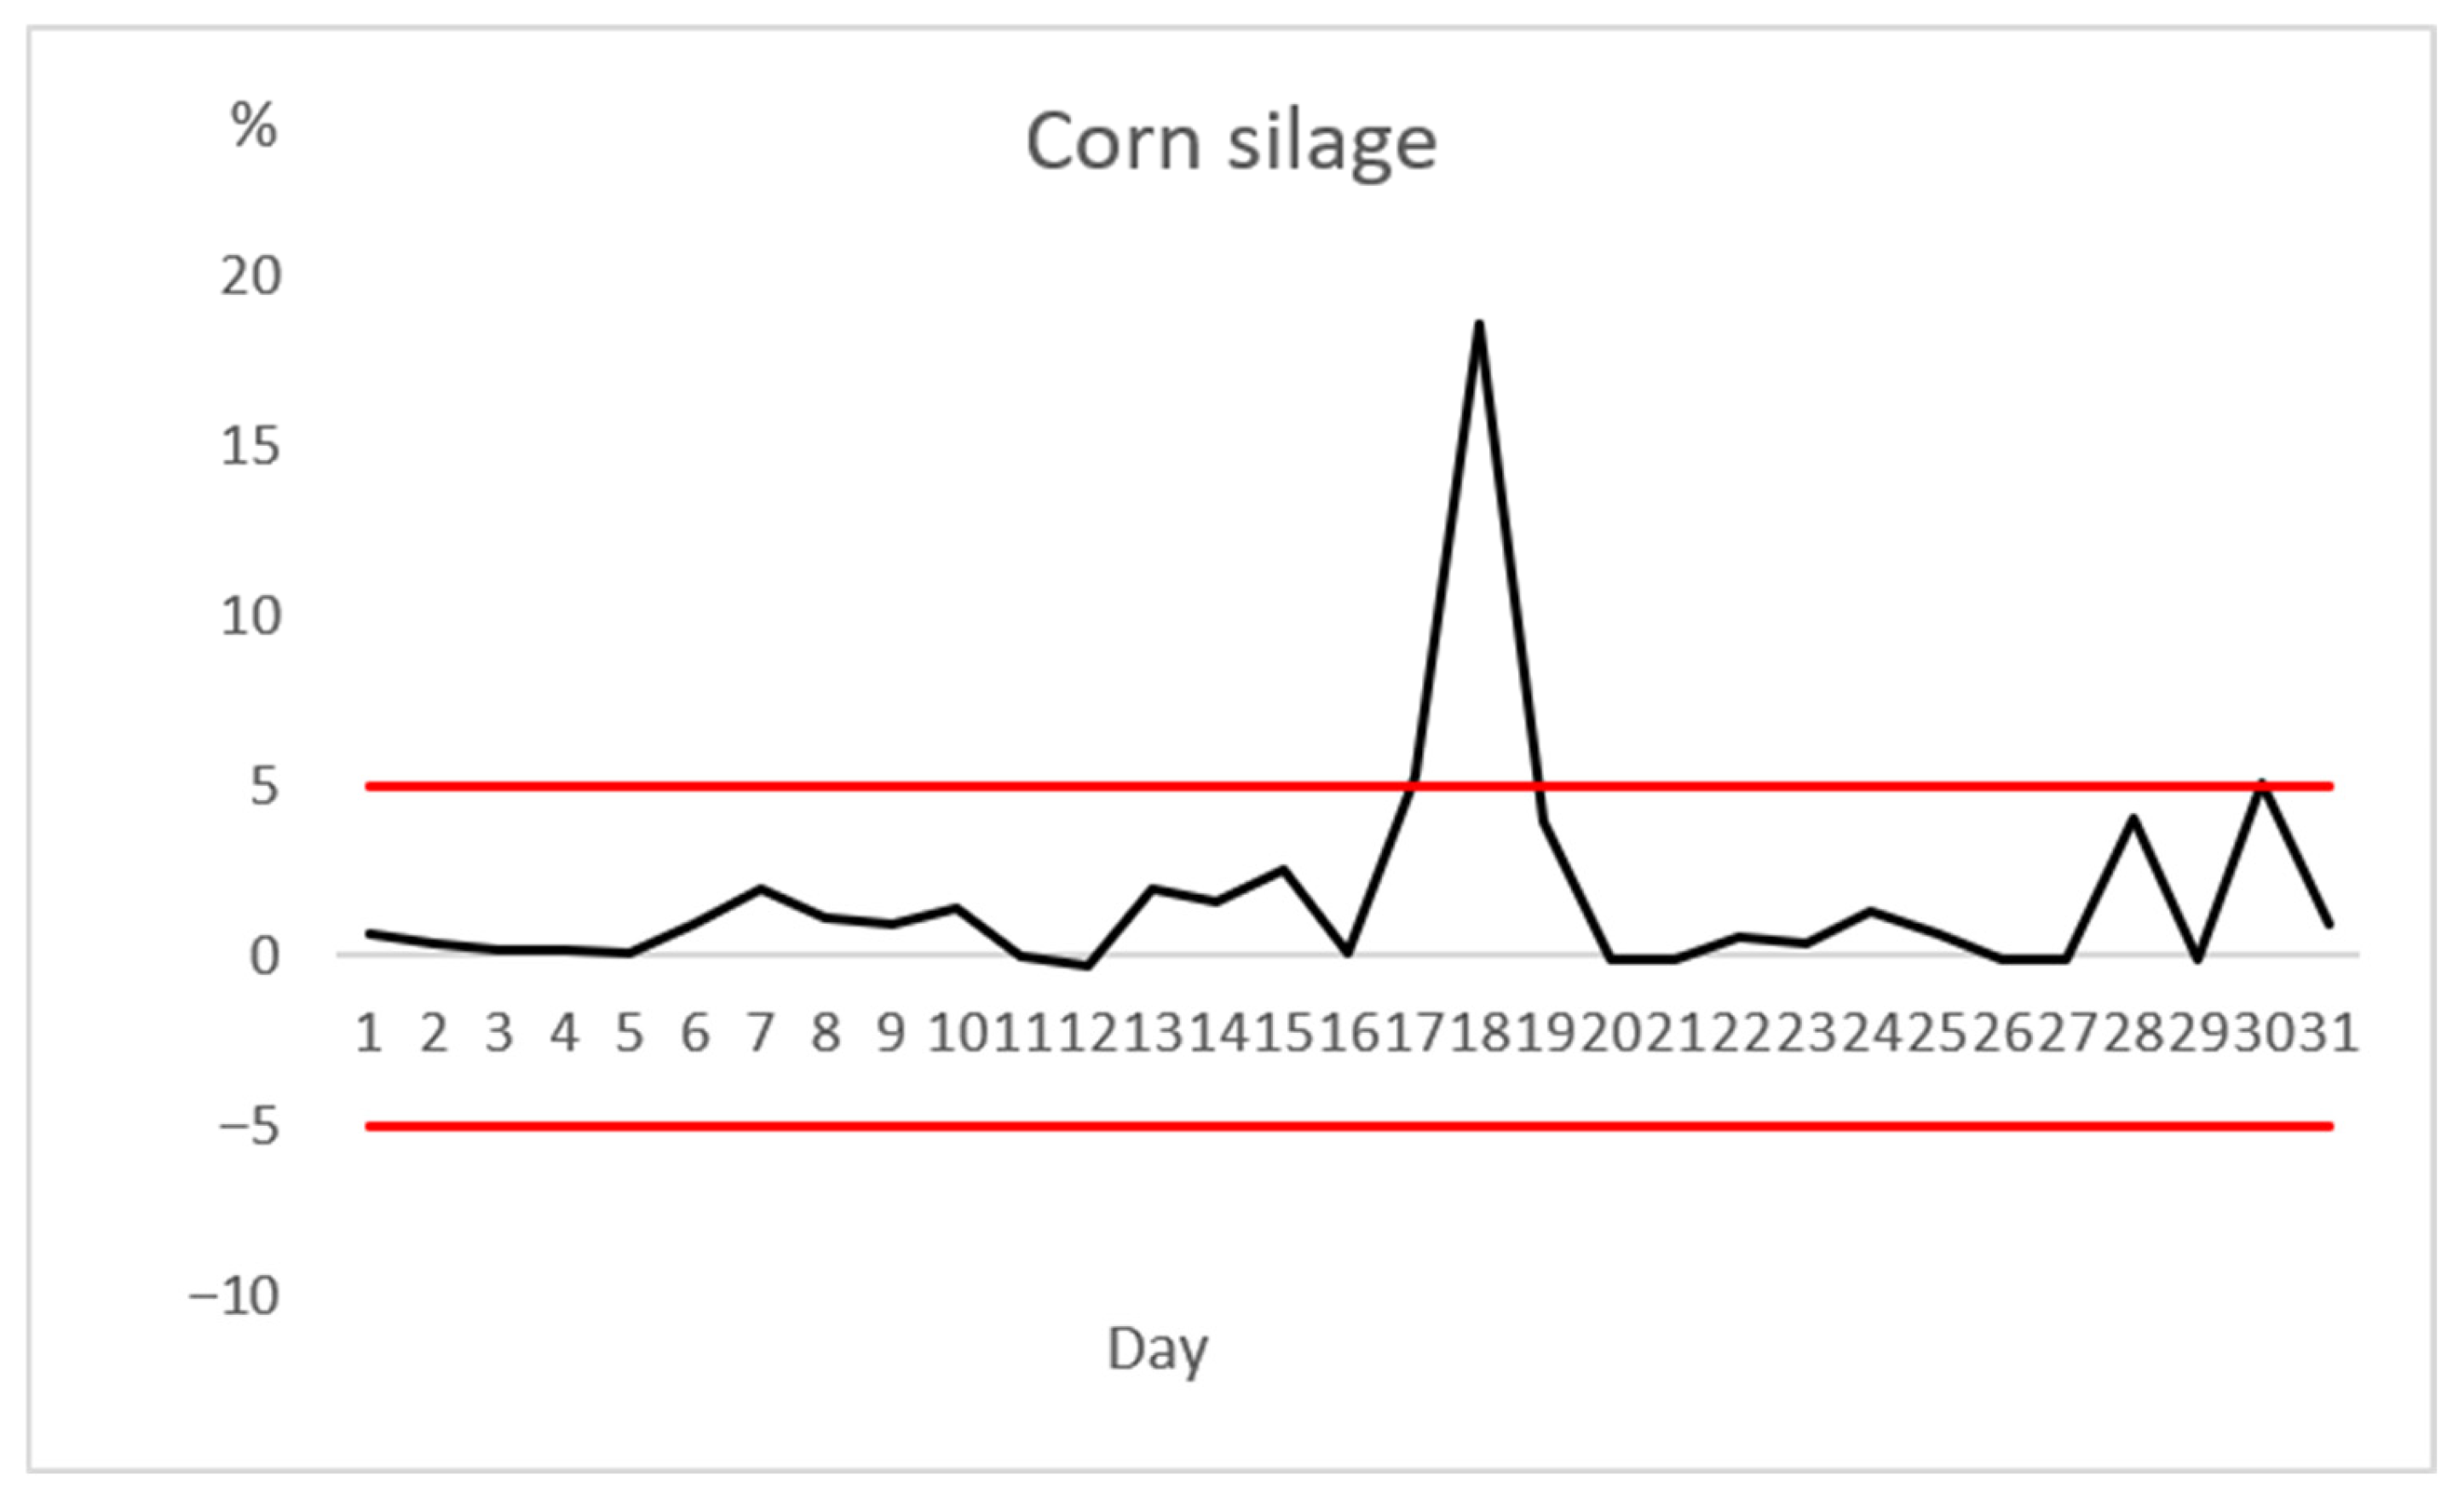
During a one-month period, we monitored the loading precision of the target weight of corn silage on a daily basis. Selected descriptive statistics (Farm A) are presented in Table 1. The average overage of corn silage was 0.8%, yet the values between individual days did not differ. Standard deviation for the June period of 2.06% suggested moderate variability and the likely occurrence of outliers (11.8%).
Figure 1 shows the allowed tolerance of ±5%. The largest discrepancies compared to the required ration were recorded between Day 16 (5.3%) and Day 17 (18.6%), which is more than three times above the allowed 5% tolerance.

3.2.3. Alfalfa Silage

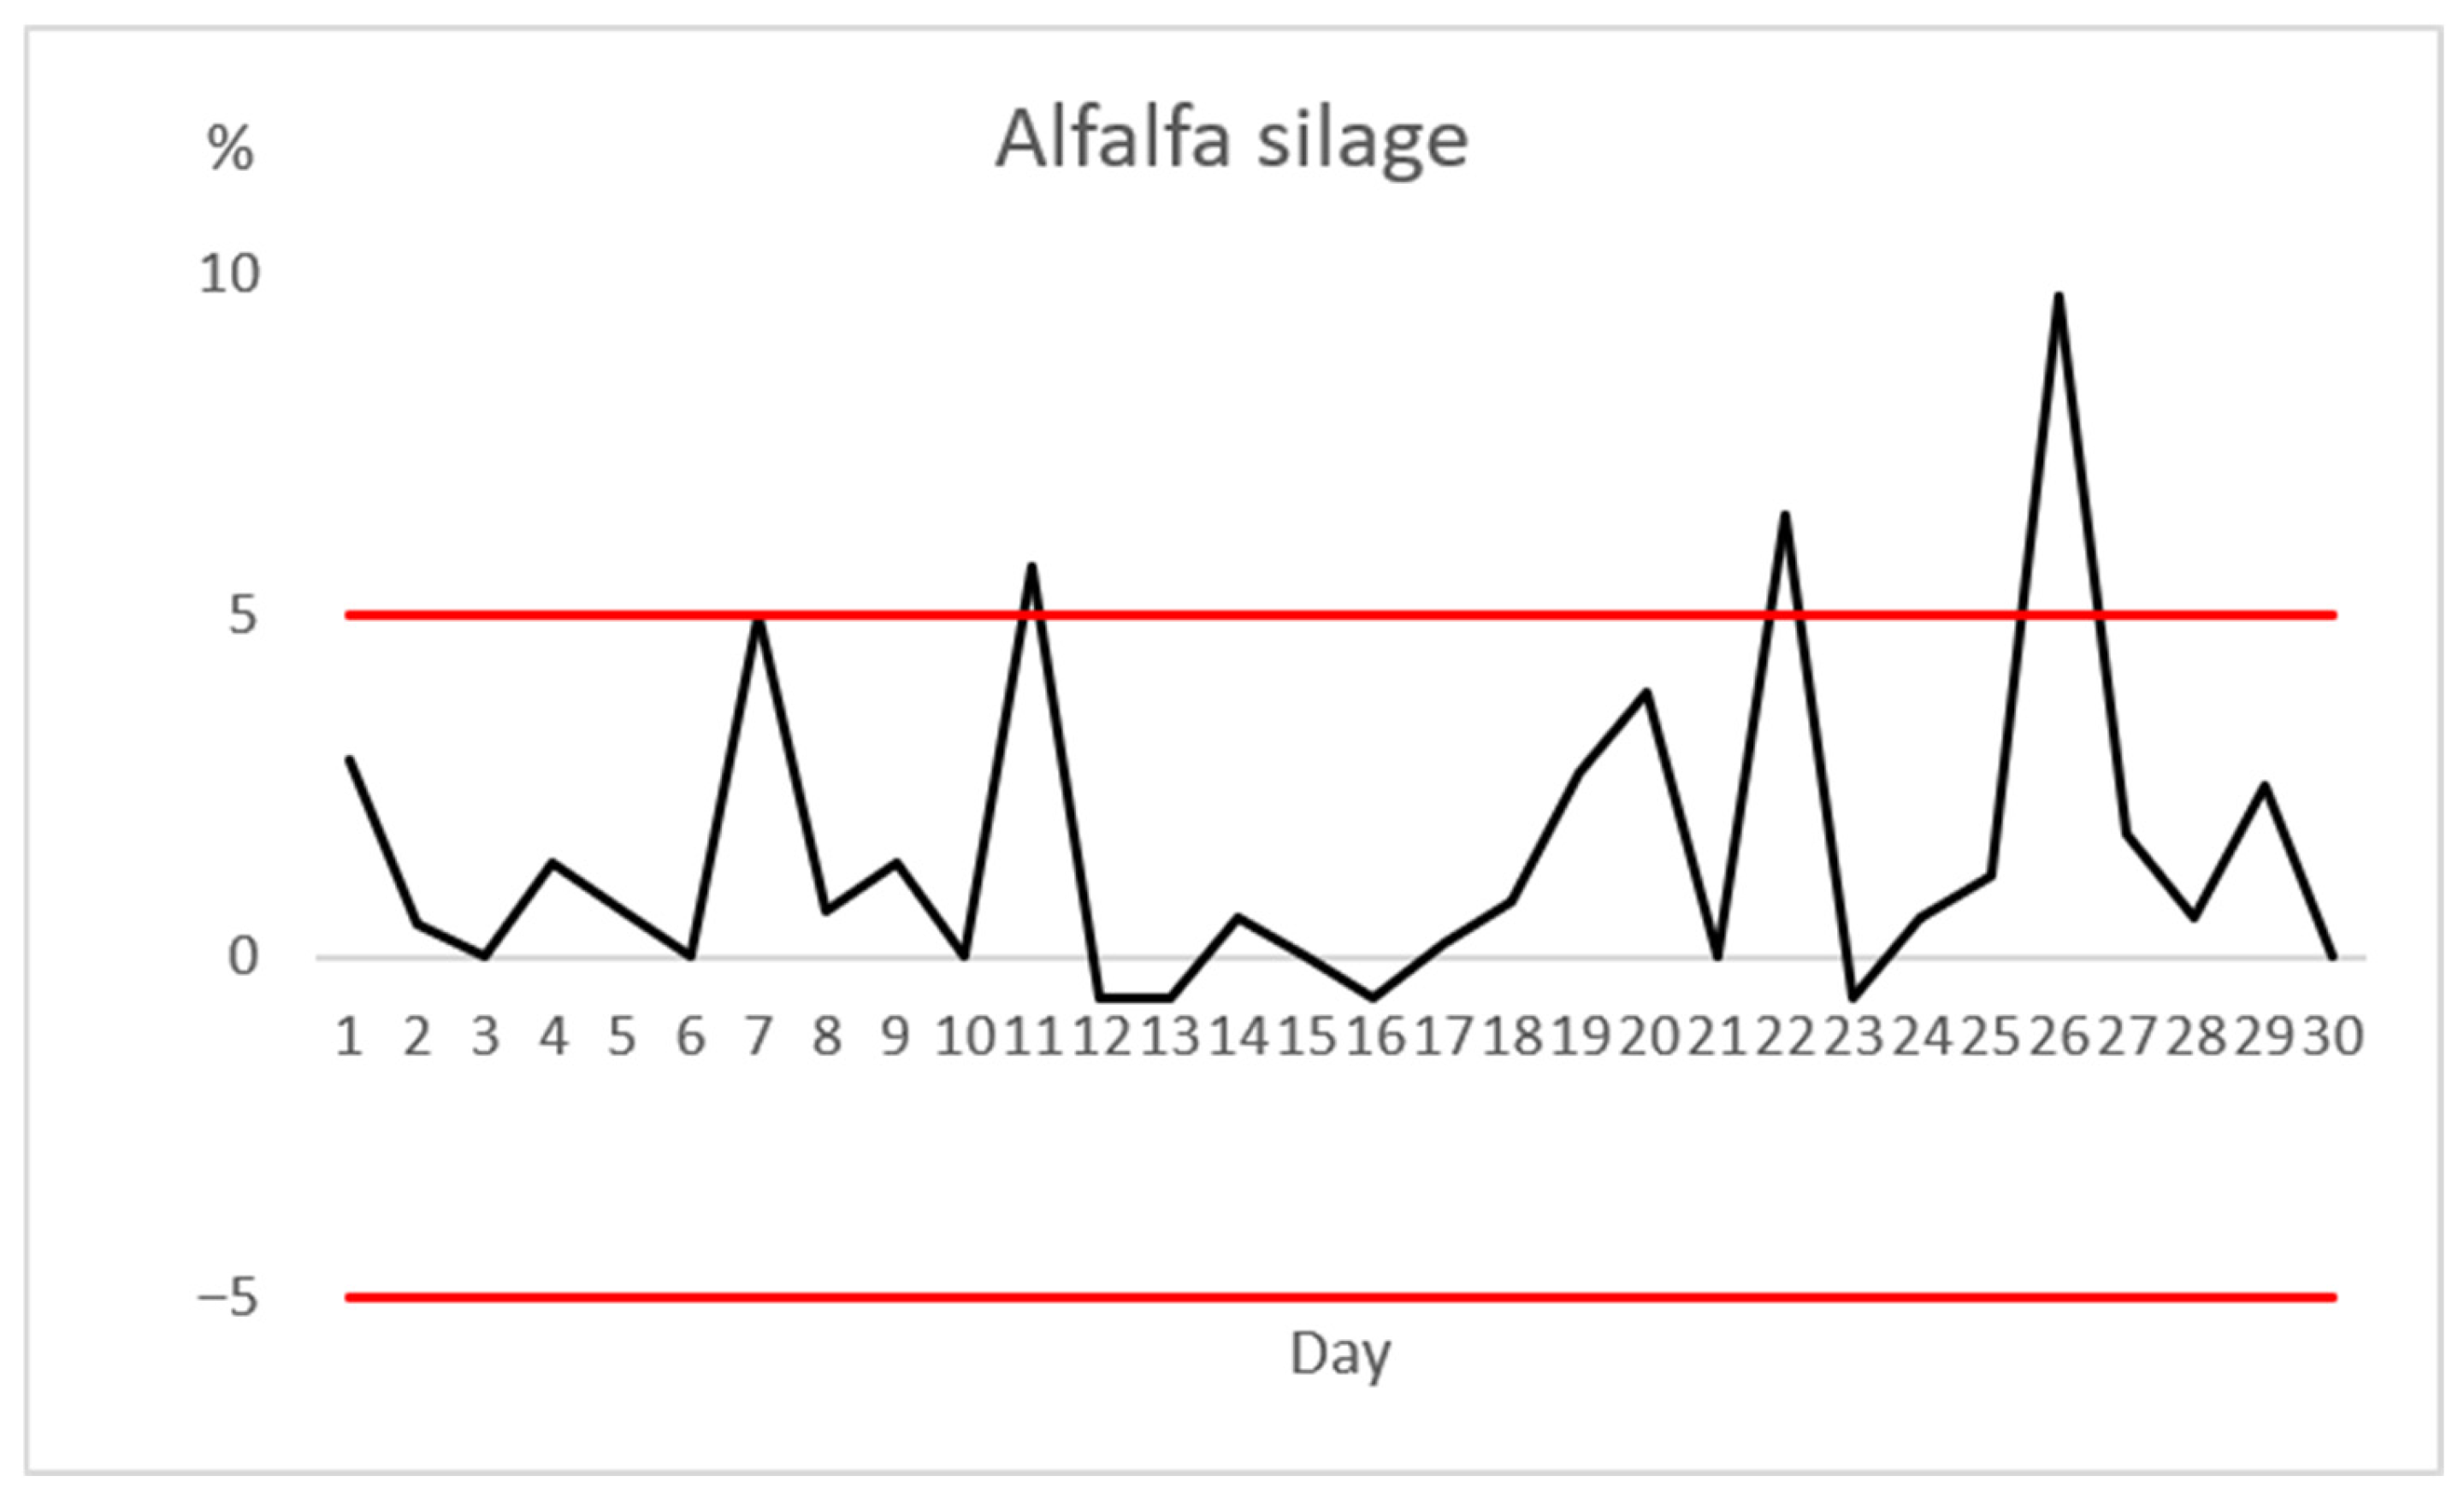
During a one-month period, we monitored the loading precision of the target weight of alfalfa silage on a daily basis. The 5% silage tolerance limit was exceeded on Farm A on 3 days. The average overage for alfalfa silage was 1.57%, but the values between individual days did not differ. Standard deviation for the June period was 2.42%, indicating moderate variability and the likely occurrence of outliers (10.3%). Figure 2 shows the allowed tolerance of ± 5%. It is clear from the figure that the indicated tolerance zone was exceeded three times, precisely: on the 11th day by 5.3%, on the 22nd day by 6.5%, and on the 26th day by 9.7%, almost twice the 5% limit.

3.2.4. Concentrate Feed Mixture

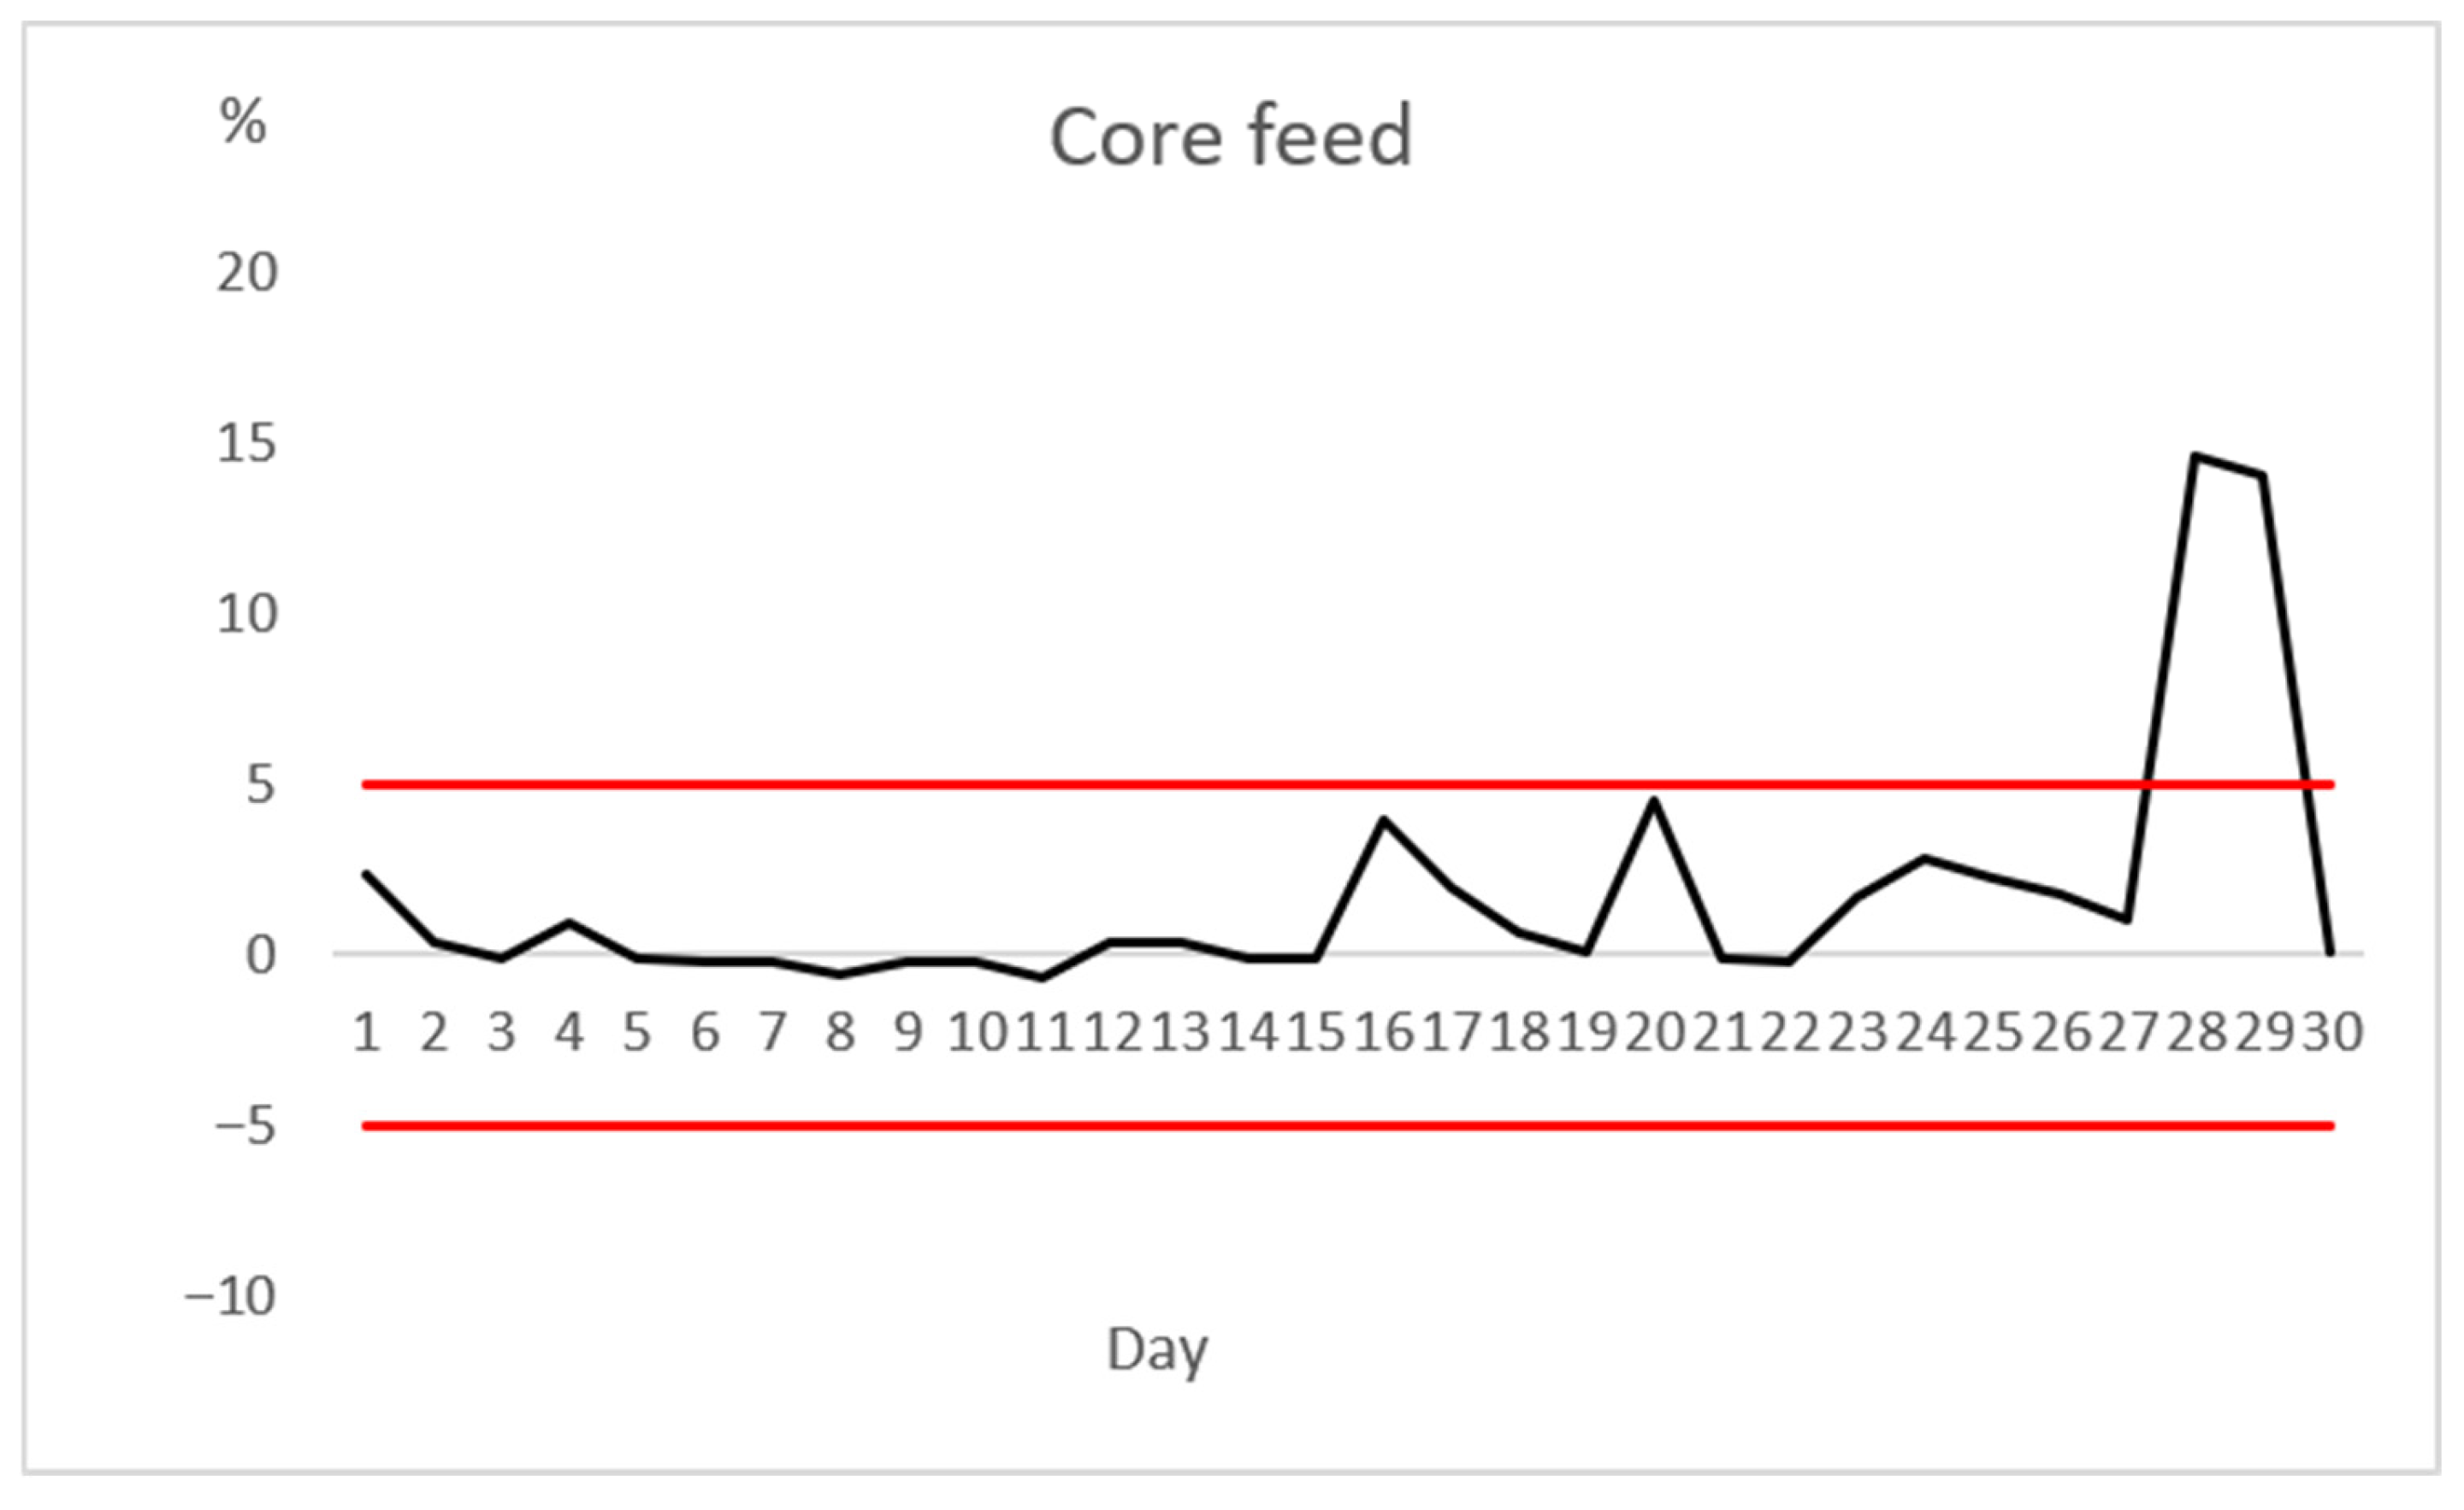
During a one-month period, we monitored the loading precision of the concentrate feed mixture on a daily basis. The 5% core feed tolerance limit was exceeded on Farm A on 2 days. The average overage for the concentrate was 1.7%, but the values between individual days did not differ. Standard deviation for the June period was 3.67%, indicating moderate variability and the likely occurrence of outliers (15.3%). The progression of the planned and actual quantities of the concentrate ration for each day of the month is illustrated in Figure 3. On Farm A, efforts were made to adhere to the principle of not exceeding the actual quantity of delivered feed within a ±5% tolerance of the required ration. We recorded almost three times the allowed tolerance of 5% on the 28th and 29th days.

3.3. Farm B

On Farm B, the principle of not exceeding the actual quantity of delivered feed within a ±5% tolerance of the required ration was followed. Regarding the precision of the daily ration on Farm B, we recorded values that are presented in detail in the following sections.

3.3.1. Corn Silage

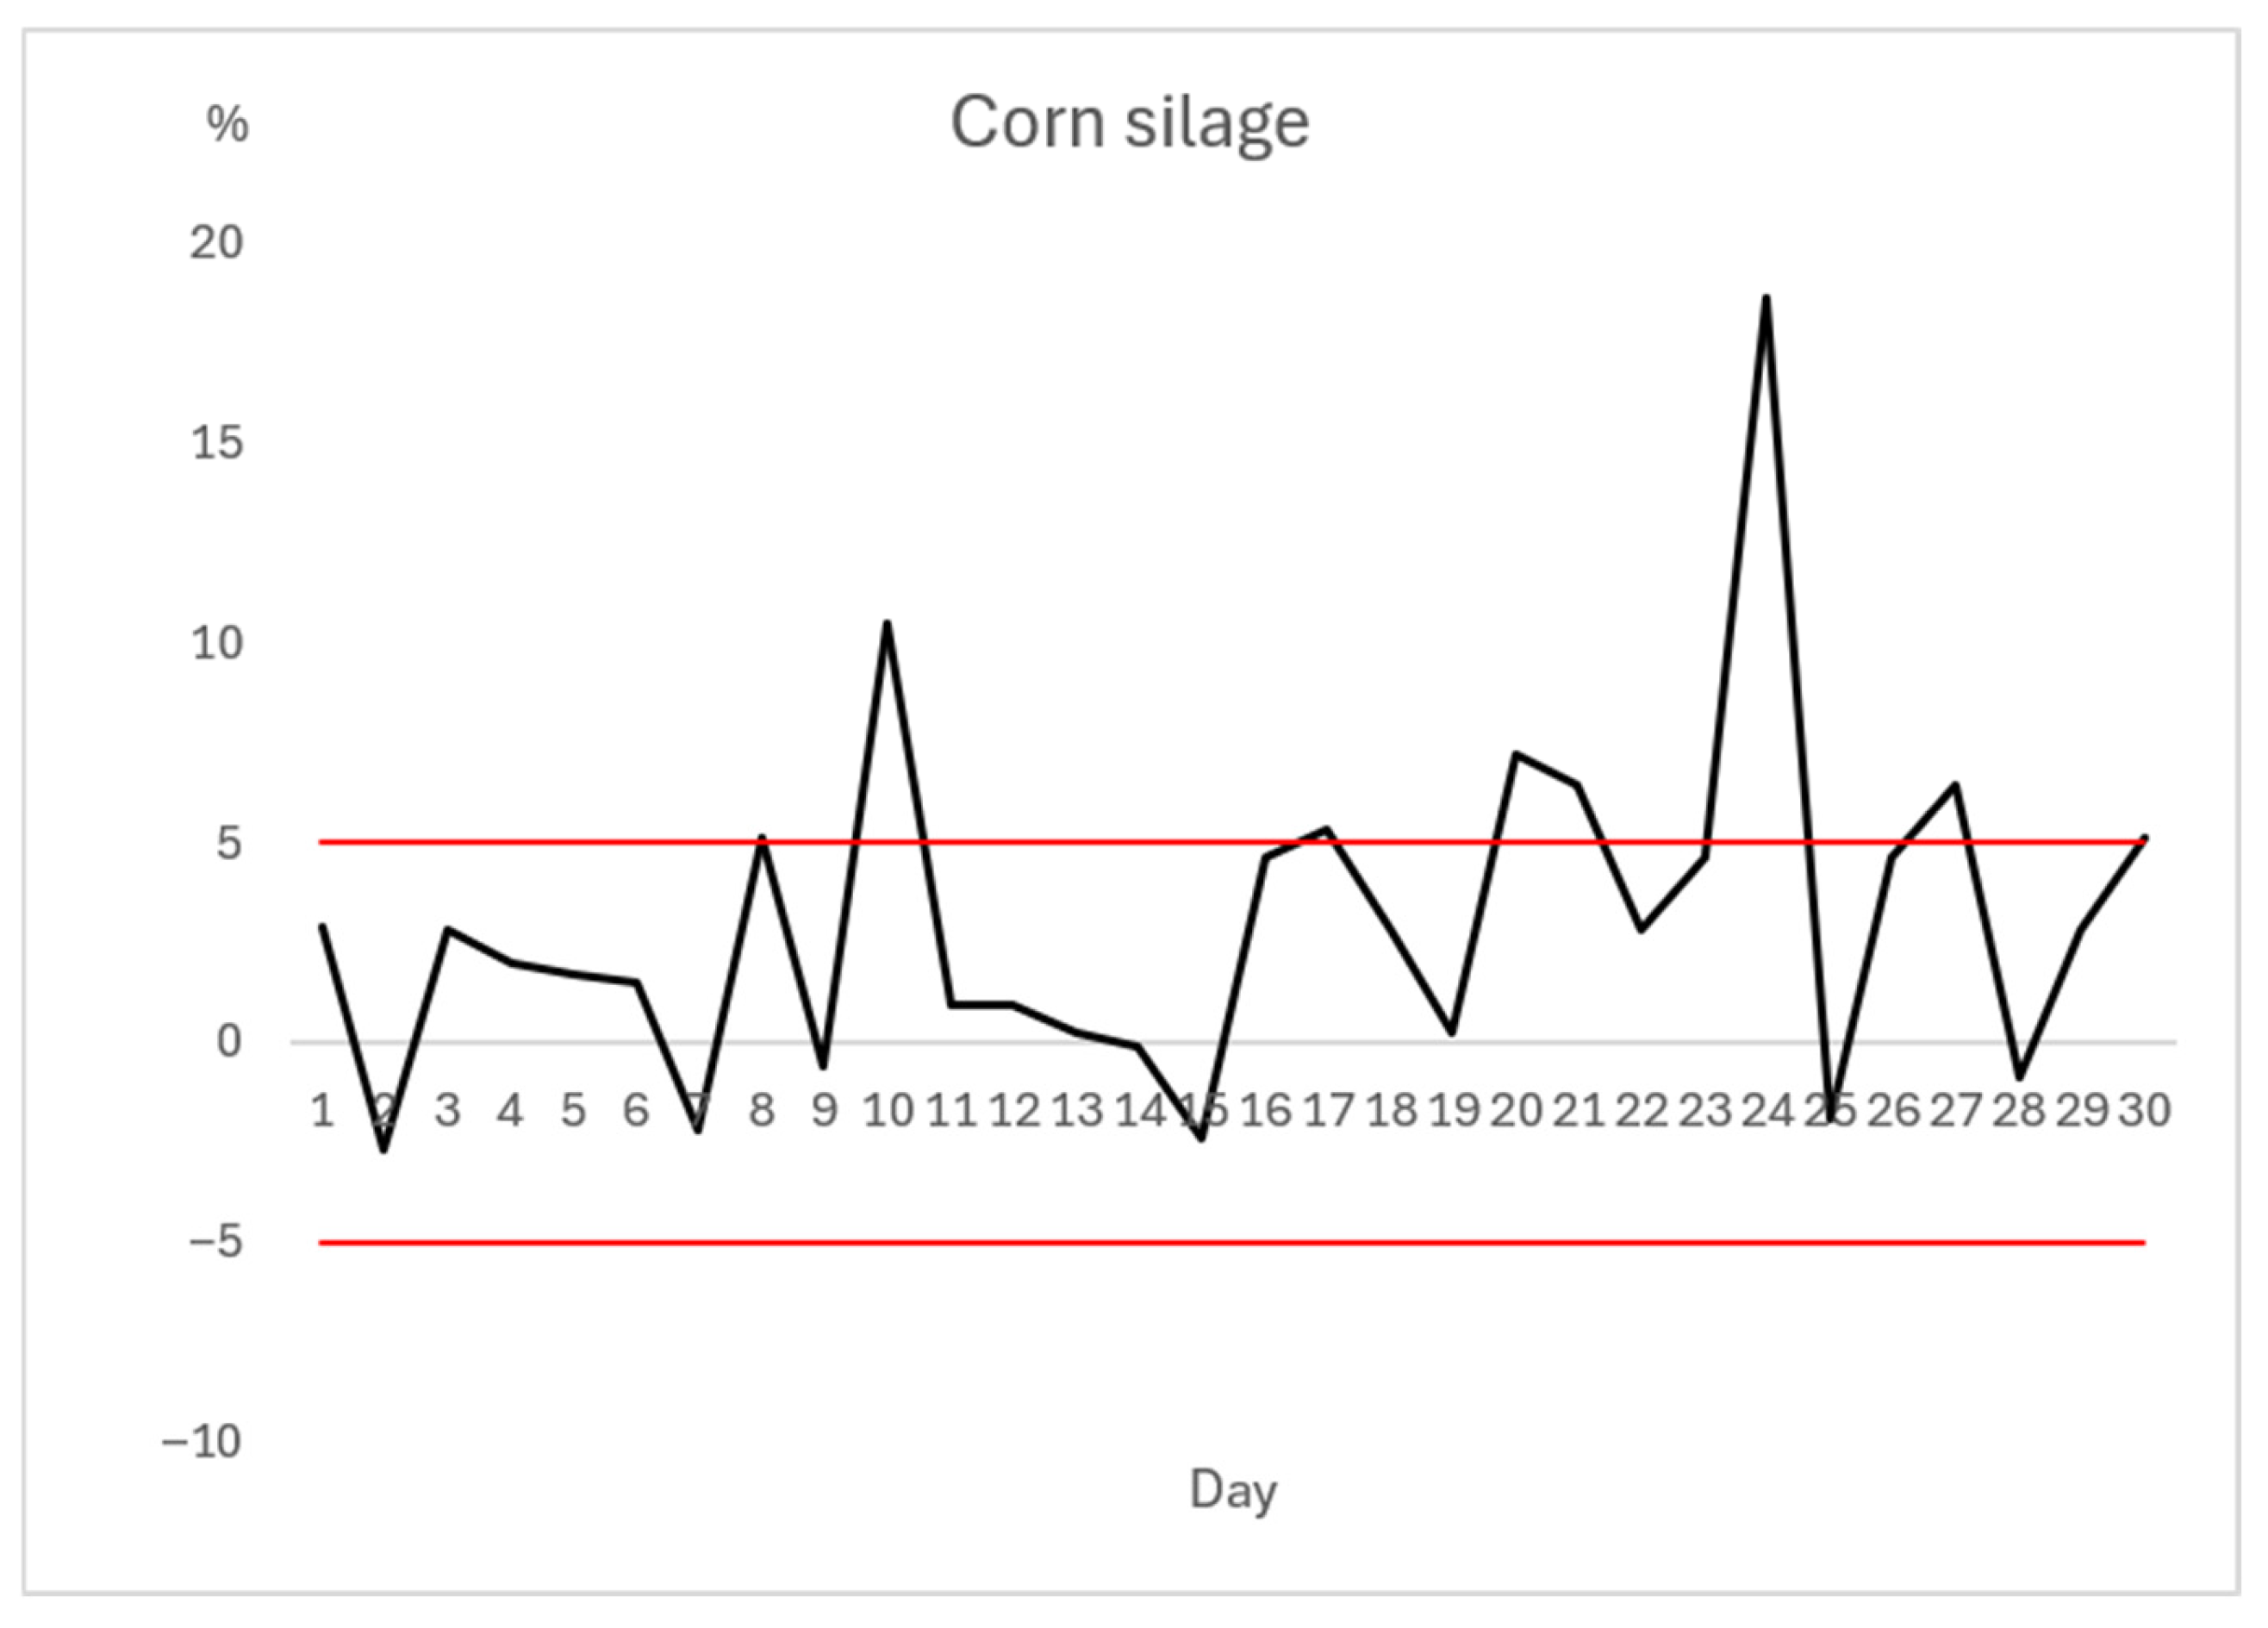
During a one-month period, we monitored the loading precision of the target weight of corn silage on a daily basis. The 5% corn silage tolerance limit was exceeded on Farm B on 7 days. The largest discrepancy was recorded between Day 24 (+358 kg) and Day 25 (−37 kg). Compared to the previous day, the difference was higher by 395 kg. This increase represents an 18.6% rise over the target quantity. During the month, we recorded seven days where the 5% limit was exceeded. Selected descriptive statistics (Farm B) are presented in Table 2. The average overage of corn silage for the June period was 2.97%, but the values between individual days did not differ. Standard deviation for the June period was 4.32%, indicating high variability and the likely occurrence of outliers (21.3%).
Figure 4 shows that, on Farm B, the corn silage laying accuracy was significantly higher than established limit of ±5%. Specifically: 8th day (+5.1%), 10th day (+10.5%), 20th day (+7.2%), 21st day (+6.4%), 24th day (+18.6%), more than three times above the allowed 5% tolerance, and 27th day (+6.4%). The progression of the planned and actual quantities of the corn silage ration for each day of the month is illustrated in Figure 4. When comparing the inaccuracies of loading corn silage on both Farm A and Farm B, no significant differences (p > 0.05) were found.

3.3.2. Alfalfa Silage

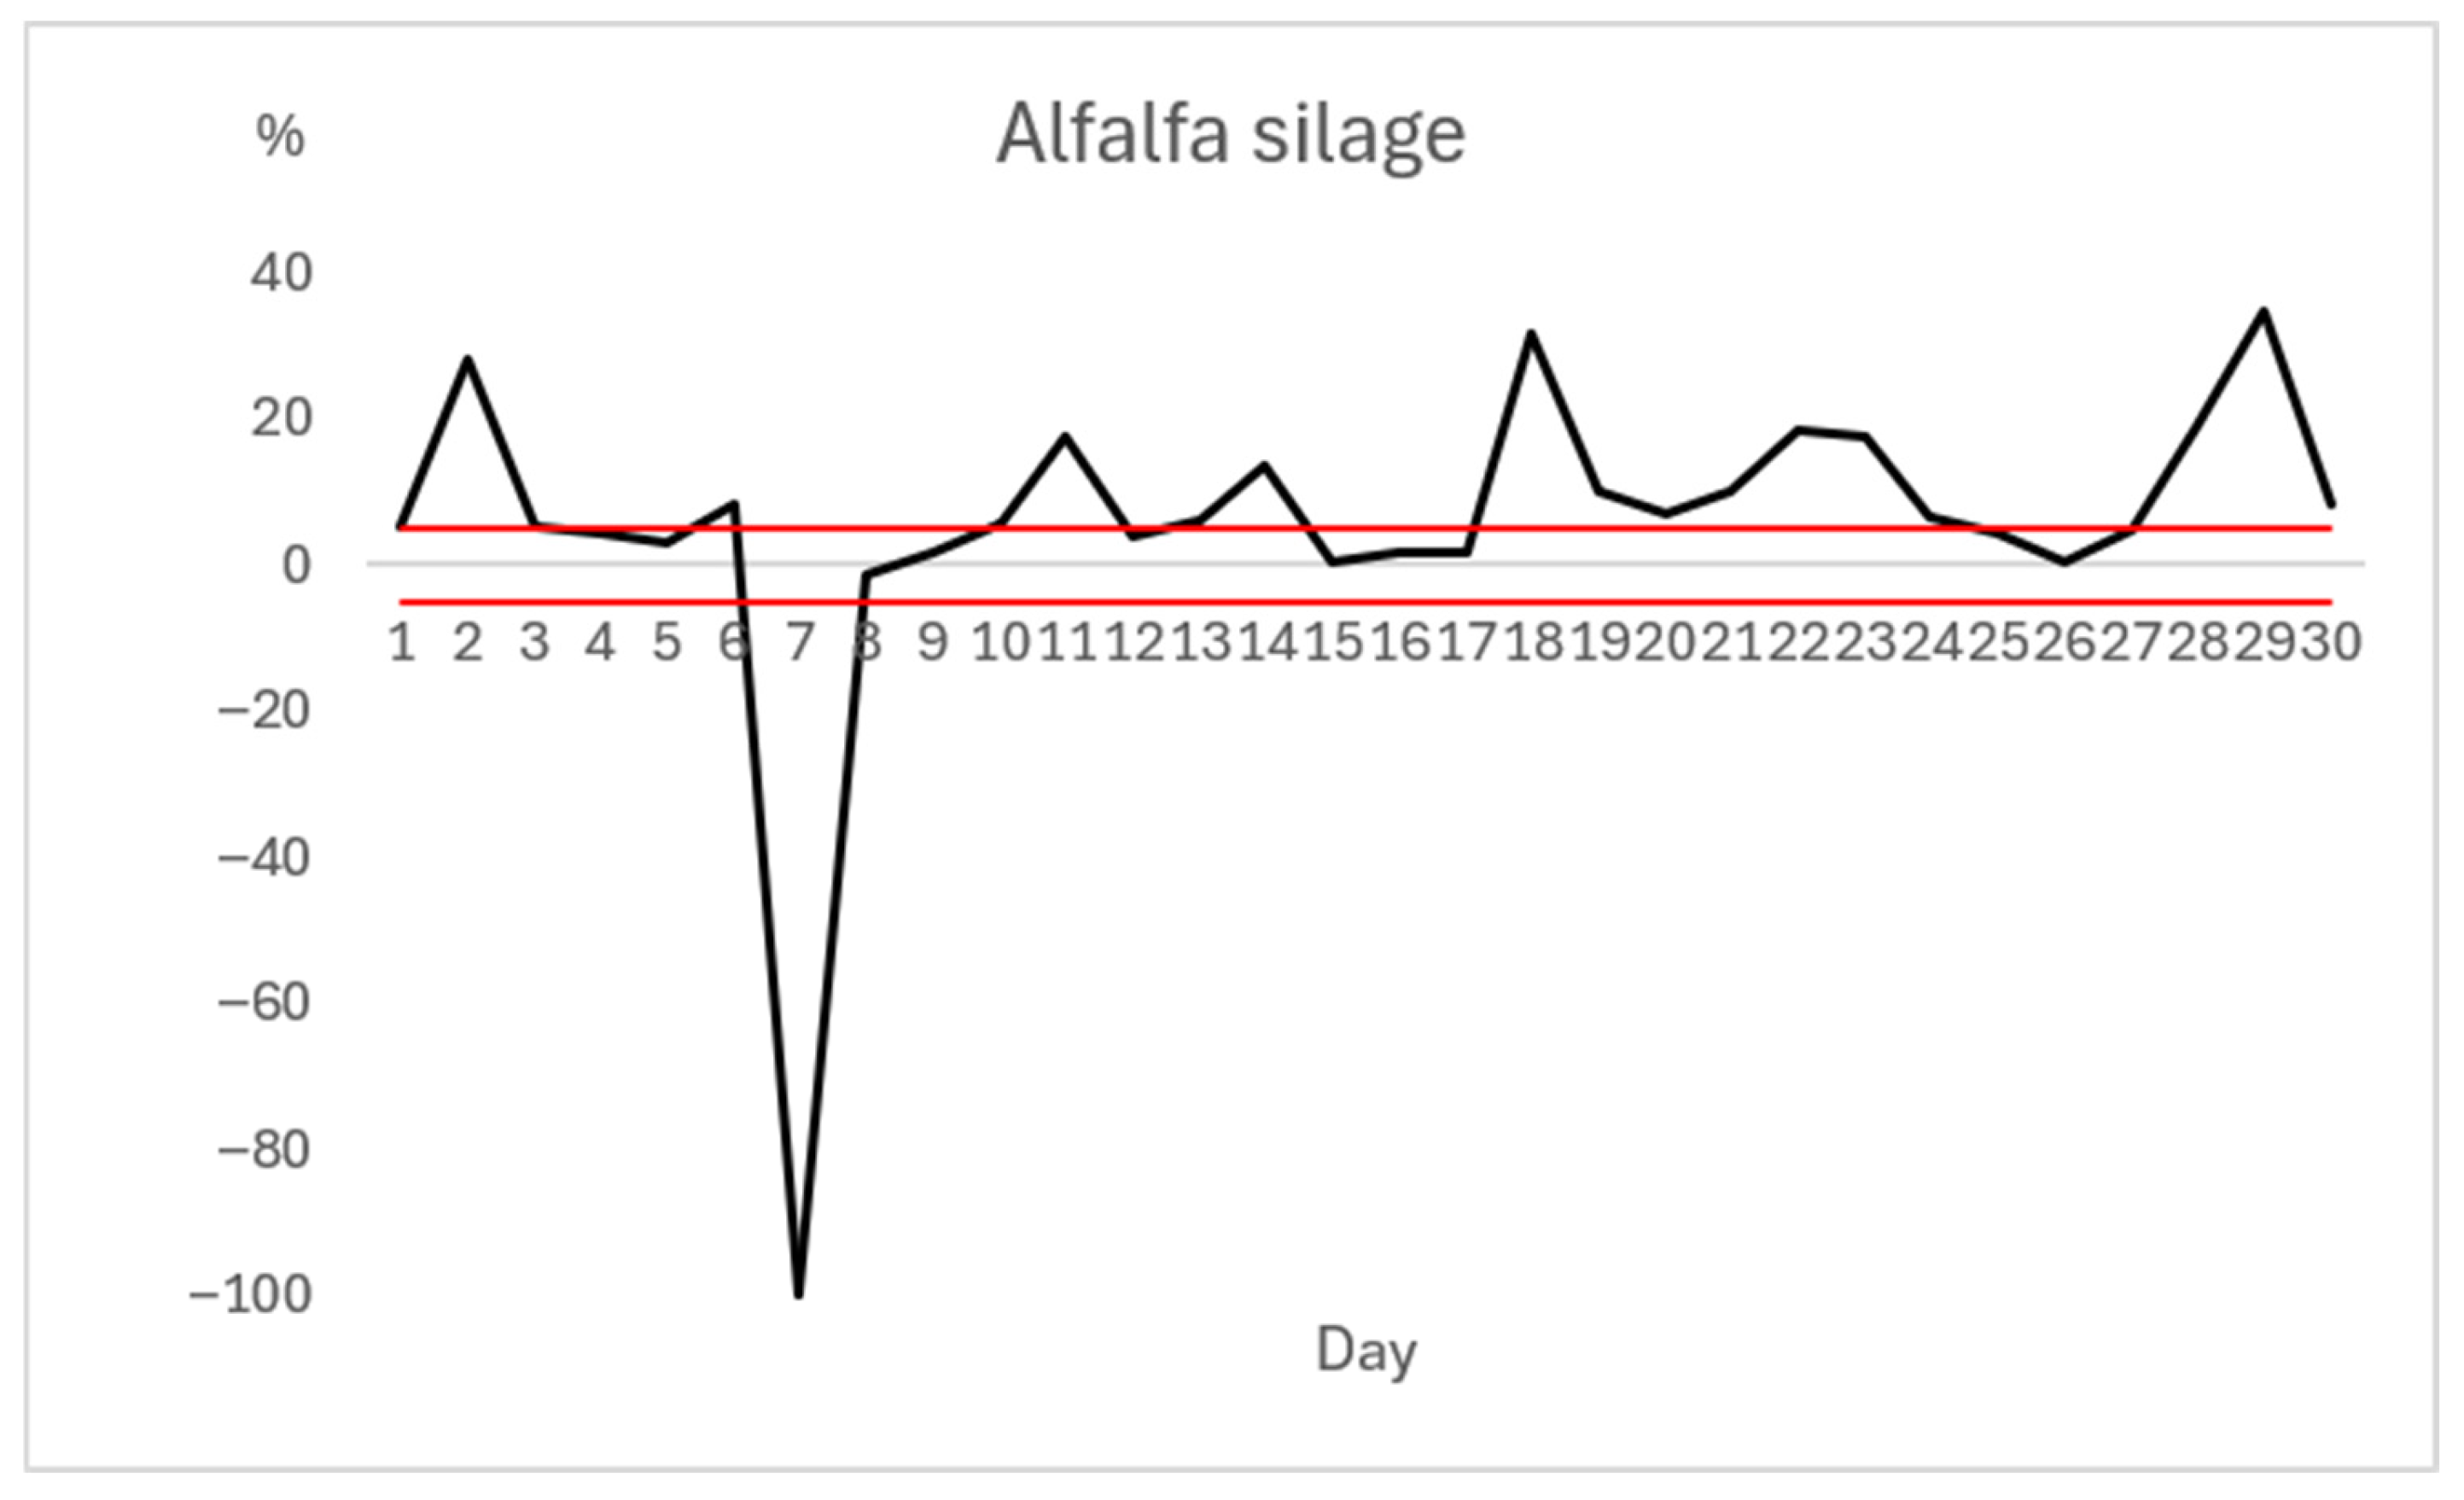
During a one-month period, we monitored the loading precision of the target weight of alfalfa silage on a daily basis. The largest discrepancy was recorded between Day 6, when an overage of +123 kg was delivered, and Day 7, when a shortage of 1517 kg compared to the target quantity was recorded, representing a 100% decrease (zero delivery). This resulted in a total difference of 1640 kg. Selected descriptive statistics (Farm B) are presented in Table 2. The average overage for alfalfa silage was 5.89%. Standard deviation for the June period was 22.03%, indicating high variability and the likely occurrence of outliers (134.5%). Figure 4 shows that, on Farm B, the alfalfa silage laying accuracy was higher than established limit of ±5%. The 5% alfalfa silage tolerance limit was exceeded on Farm B on 19 days. Excesses of the 5% tolerance are shown in Figure 5. When comparing the inaccuracies of loading the alfalfa silage on both Farm A and Farm B, significant differences (p < 0.05) were found for the June period. The 5% limit was exceeded 19 times during this month.

3.3.3. Concentrate Feed Mixture

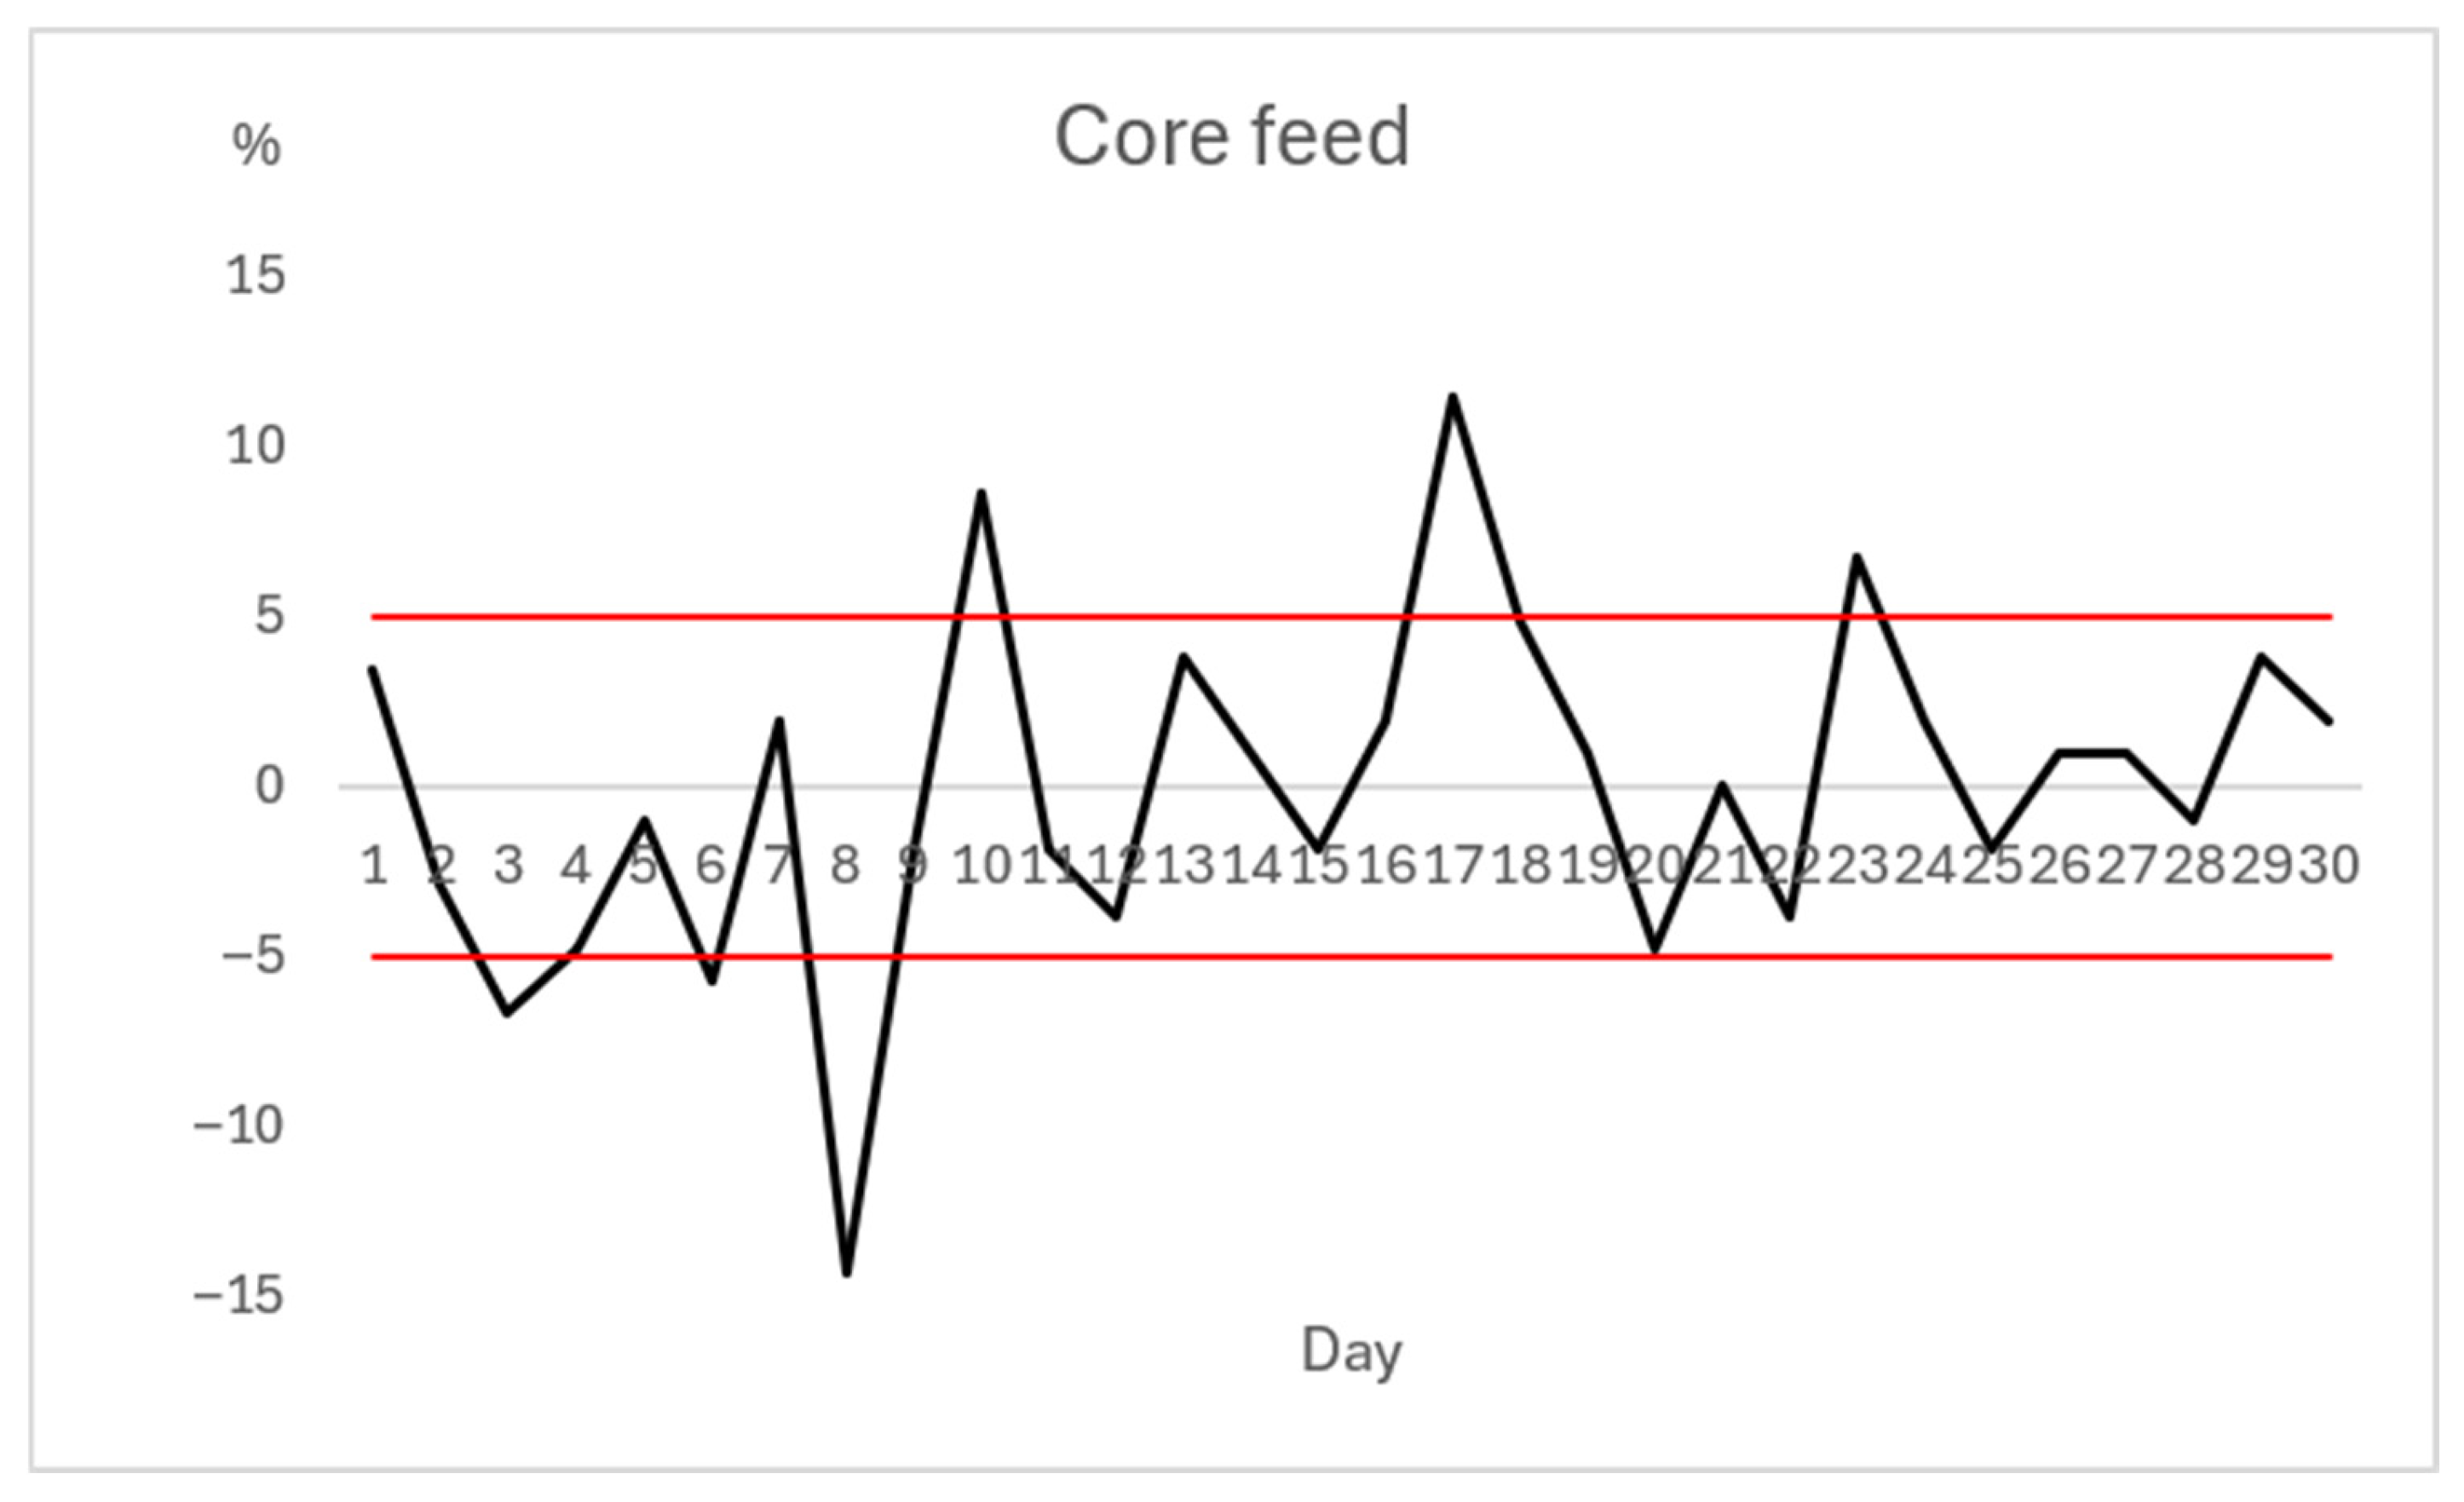
During a one-month period, we monitored the loading precision of the target weight of the concentrate on a daily basis. The largest discrepancy was recorded between Day 7, when an overage of +10 kg was delivered, and Day 8, when 75 kg less than the target quantity was delivered. This resulted in a total difference of 85 kg, representing a 14.3% decrease compared to the target quantity. The 5% tolerance limit was exceeded six times during the month. The average overage for the concentrate was −2.09%. Standard deviation for the June period was 13.16%, indicating high variability and the likely occurrence of outliers (78.4%). Values exceeding the established limit of ±5% were recorded for 6 days in Figure 6. When comparing the inaccuracies of loading the core concentrate on both Farm A and Farm B, significant differences (p < 0.05) were found. The 5% limit was exceeded 6 times during this month.

4. Discussion

Based on the information obtained, both Farm A and Farm B aimed to maintain a ±5% tolerance in the loading precision of individual components, as well as a ±5% tolerance for the total TMR (Total Mixed Ration) quantity over a given period. Continuous monitoring of feed consumption was carried out every seven days on Farm A, and every fourteen days on Farm B. We primarily focused on monitoring the accuracy of loading three basic feed components that fulfill the needs of the animal. When comparing the inaccuracies of loading the corn silage on both Farm A and Farm B, no significant differences (p > 0.05) were found. When comparing the inaccuracies of loading both the alfalfa silage and core concentrate, on both Farm A and Farm B, significant differences (p < 0.05) were found. Our analysis shows that, on average, a higher quantity of individual components was delivered than planned. As indicated by the individual measurements, we recorded several variability instances where the prescribed ration was exceeded or not met. This was particularly evident on Farm B, where value variability exceeded the established range. This study demonstrates that the evaluation of TMR dosing accuracy must shift from focusing on monthly totals to monitoring daily component fluctuations. Relying solely on average data masks the daily operational risks, which can lead to fluctuations in dairy cow performance and also end in feed waste. The same results were also recorded by the authors of [31,32], who found many excesses of loaded feed. As noted by [28], the consistency of the TMR—which can be affected by nutrient variability, the condition of the mixing equipment, and the order of component mixing—plays a major role in production efficiency and the overall profitability of the herd. Ration composition can change from day to day due to transient fluctuations in the dry matter content of individual components and the total dry matter content of the ration. Short-term changes in the dry matter content of silage can have immediate effects on dry matter intake and milk yield. However, cows adapt quickly to these dietary changes [29]. We can agree with this author’s findings, but only if the volume of feed would be increased. If the amount of core concentrate is increased (as happened on Farm B) by not loading the required amount of alfalfa silage, the proportion of core concentrate will increase significantly. Oversupply of concentrate on Farm B triggered shifts in the VFA profile and increased the risk of Subacute Ruminal Acidosis (SARA). We should always keep this in mind. It is very positive that the value of core concentrate in the total TMR dose decreased on the second day, but this should not happen. This suggests that changes in feed quality can influence dry matter intake and milk yield. Furthermore, the quality of preserved forage is not consistent throughout the entire storage space, resulting in nutrient variations in the actual feed compared to the target ration [1]. At the same time, several instances of variability in operational deviations and non-adherence to loading protocols suggest lack of discipline (see Farm B: alfalfa silage and subsequent concentrate feed). We think that there is no need for long-term monitoring of loading component accuracy. During the six months of monitored accuracy, we did not notice any improvement during individual months, especially on Farm B. We recommend taking immediate measures to reduce the inaccuracies in loading of these individual components. Differences are found, in dairy cow farming with high milk yield, between the required and delivered amounts of individual components, as these can affect the health of dairy cows. It was demonstrated that extracting feed and subsequently loading it with a telehandler equipped with a front-end bucket is not an ideal method. During extraction, the integrity of the silo face is compromised, leading to feed oxidation and reduced quality. During loading, even the most skilled operator cannot ensure that only the exact required amount of feed is discharged from the bucket. This extends the loading time and requires two workers for feed preparation. Furthermore, upon closer inspection of the TMR preparation on Farm B, we found that, despite possessing a new diet mixer wagon, the tractor operator monitored the loaded quantity on the weighing display and then used hand signals to communicate the weight to the telehandler operator. This resulted in significant discrepancies in the loaded quantities of individual components.
We do recommend the acquisition of real-time digital weighing monitoring systems for application by the telehandler operator, allowing them to monitor the loading of components directly in their own cab. This application communicates wirelessly with specific weighing systems, via Wi-Fi or Bluetooth, and is financially accessible for the enterprise. This investment could improve feed economy and provide further benefits through more precise adherence to individual components and the overall ration. As ref. [32] states, measures should be taken to reduce daily TMR variability, including regular feed analysis, precise ration preparation, and the education of personnel involved in feed preparation, to ensure maximum herd health and profitability.

5. Conclusions

As we have the control mechanisms to monitor the actual amount of loaded vs. planned feed, it is desirable to monitor the actual amount of feed provided on a daily basis. Monitoring only the total amount of feed consumed on a weekly basis, or even worse—every second week, is totally unacceptable. In general, within the context of TMR feeding, farmers strive for the highest possible precision; however, common operational errors often range between 1% and 5% of the total ration. The skill and routine of the operator are equally important in this regard. This analysis reveals a deceptive precision in the loading of individual TMR components within feed management, where monthly averages mask harmful daily fluctuations that exceed management tolerances (e.g., the 22.03% standard deviation recorded on Farm B). Our results suggest that it is the responsibility of farm management to monitor the precision of delivered feed. If discrepancies are as significant as those identified on Farm B, measures must be taken to ensure improved precision between the target and delivered ration, as well as between individual components. Using standard deviation and the coefficient of variation, we have demonstrated that, although the average weighing error over the monitored period was statistically low (suggesting good cost control), the daily variability in the three key feed components, which we put focus on, was unacceptably high. For instance, the standard deviation (σ) for corn silage was σ = 4.32%, for alfalfa silage σ = 22.03%, and for concentrate feed σ = 13.16%, all of which exceed the management-accepted threshold for precision.
In conclusion, our analysis demonstrates that quality management of the feeding process must shift from monitoring total monthly quantities to daily quantities. By allowing the telehandler operator to monitor the quantity of components loaded into the diet mixer wagon, it is ensured that each ration component is delivered in the target amount. It is important to point out that it is desirable for farm management to focus on these drawbacks, and subsequently eliminate these drawbacks caused by the human factor to the very minimum, in order to meet the required 5% tolerance. Another option is to upgrade the software, in order to control the loading of the given component. Simply, this means that the software will not allow the next step if the given component is not loaded, and this would probably be the most appropriate solution.
Future research should aim to include a more diverse range of farming systems and extended temporal frameworks to further consolidate these findings.

Author Contributions

Conceptualization, Š.B., G.A.K.G. and A.L.; methodology, Š.B.; software, Š.B.; validation, R.G. and Š.B.; formal analysis, R.G.; investigation, Š.B. and A.L.; resources, R.G. and A.L.; data curation, Š.B. and A.L.; writing—original draft preparation, Š.B. and G.A.K.G.; writing—review and editing, R.G., G.A.K.G. and Š.B.; visualization, Š.B. and R.G.; supervision, R.G.; project administration, R.G.; funding acquisition, R.G. All authors have read and agreed to the published version of the manuscript.

Funding

This research received no external funding.

Data Availability Statement

The datasets generated and analyzed during this study are not publicly available, but are available from the corresponding author on a reasonable request.

Conflicts of Interest

The authors declare no conflicts of interest.

References

  1. Schingoethe, D.J. A 100-Year Review: Total mixed ration feeding of dairy cows. J. Dairy Sci. 2017, 100, 10143–10150. [Google Scholar] [CrossRef] [PubMed]
  2. Halachmi, I.; Guarino, M. Editorial: Precision livestock farming: A ‘per animal’ approach using advanced monitoring technologies. Animal 2016, 10, 1482–1483. [Google Scholar] [CrossRef] [PubMed]
  3. Allen, M.S. Grouping to Increase Milk Yield and Decrease Feed Costs. In Tri-State Dairy Nutrition Conference; Ohio State University Press: Columbus, OH, USA, 2009; pp. 61–65. Available online: https://yumpu.com/en/document/view/38263840/grouping-to-increase-milk-yield-and-decrease-feed-costs-dairy-web (accessed on 10 December 2025).
  4. Nierenberg, D. As the World’s Farmers Age, New Blood is Needed. 2014. Available online: https://eu.desmoinesregister.com/story/opinion/readers/2014/10/17/worlds-farmers-age-new-blood-needed/17393901/ (accessed on 2 December 2025).
  5. Hendriks, W.H.; Verstegen, M.W.A.; Babinszky, L. Poultry and Pig Nutrition; Wageningen Academic Publishers: Wageningen, The Netherlands, 2019. [Google Scholar] [CrossRef]
  6. Hokestra, N.J.; Schulte, R.P.O.; Forrestal, P.J.; Hennessy, D.; Krol, D.J.; Lanigan, G.J.; Müller, C.; Shalloo, L.; Wall, D.P.; Richards, K.G. Scenarios to limit environmental nitrogen losses from dairy expansion. Sci. Total Environ. 2019, 707, 134606. [Google Scholar] [CrossRef] [PubMed]
  7. Zhang, Q.; Ren, F.; Li, F.; Chen, G.; Yang, G.; Wang, J.; Du, K.; Liu, S.; Li, Z. Ammonia nitrogen sources and pollution along soil profiles in an in-situ leaching rare earth ore. Environ. Pollut. 2020, 267, 115449. [Google Scholar] [CrossRef] [PubMed]
  8. Lovarelli, D.; Bacenetti, J.; Guarino, M. A review on dairy cattle farming: Is precision livestock farming the compromise for an environmental, economic and social sustainable production? J. Clean. Prod. 2020, 262, 121409. [Google Scholar] [CrossRef]
  9. Akbar, M.O.; Khan, M.S.S.; Ali, M.J.; Hussain, A.; Qaiser, G.; Pasha, M.; Pasha, U.; Missen, M.S.; Akhtar, N. loT for development of smart dairy farming. J. Food Qual. 2020, 2020, 4242805. [Google Scholar]
  10. Raptis, T.P.; Passarella, A.; Conti, M. Data Management in Industry 4.0: State of the Art and Open Challenges. IEEE Access 2019, 7, 97052–97093. [Google Scholar] [CrossRef]
  11. Wang, J.; Xu, C.; Zhang, J.; Zhong, R. Big data analytics for intelligent manufacturing systems: A review. J. Manuf. Syst. 2022, 62, 738–752. [Google Scholar] [CrossRef]
  12. Cíbiková, N. Sektorová Rada pre Poľnohospodárstvo, Veterinárstvo a Rybolov Vypracovala Komplexnú Stratégiu Rozvoja Ľudských Zdrojov. 2022. Available online: https://istp.sk/clanok/16271/sektorova-rada-pre-polnohospodarstvo-veterinarstvo-a-rybolov-vypracovala-komplexnu-strategiu-rozvoja-ludskych-zdrojov (accessed on 13 April 2026).
  13. Van Empel, M.; Makkar, H.P.S.; Dijkstra, J.; Lund, P. Nutritional, technological and managerial parameters for precision feeding to enhance feed nutrient utilization and productivity in different dairy cattle production systems. CAB Rev. Perspect. Agric. Vet. Sci. Nutr. Nat. Resour. 2016, 11, 1–27. [Google Scholar] [CrossRef]
  14. Fisher, A.; Edouard, N.; Faverdin, P. Precision feed restriction improves feed and milk efficiencies and reduces emissions of less efficient lactating Holstein cows without impairing their performance. J. Dairy Sci. 2020, 103, 4408–4422. [Google Scholar] [CrossRef] [PubMed]
  15. Bach, A.; Cabrera, V. Robotic milking: Feeding strategies and economic returns. J. Dairy Sci. 2017, 100, 7720–7728. [Google Scholar] [CrossRef] [PubMed]
  16. Jago, J.; Eastwood, C.; Kerrisk, K.; Yule, I. Precision dairy farming in Australasia: Adoption, risks and opportunities. Anim. Prod. Sci. 2013, 53, 907–916. [Google Scholar] [CrossRef]
  17. Grinter, L.N.; Campler, M.R.; Costa, J.H.C. Validation of a behavior-monitoring collar’s precision and accuracy to measure rumination, feeding, and resting time of lactating dairy cows. J. Dairy Sci. 2019, 102, 3487–3494. [Google Scholar] [PubMed]
  18. Yu, W.; Li, X.; Zhao, H.; Gu, S.; Pan, B. Preliminary analysis of smart dairy farm construction. China Dairy 2019, 10, 50–54. [Google Scholar]
  19. Cao, L. A new age of AI: Features and future. IEEE Intell. Syst. 2022, 37, 25–37. [Google Scholar] [CrossRef]
  20. Oosthuizen, P. Achieving robustness through precision nutrition. Dairy Mail. 2022, 29, 51–52. [Google Scholar]
  21. González, L.A.; Kyriazakis, I.; Tedeschi, L.O. Precision nutrition of ruminants: Approaches, challenges and potential gains. Animals 2018, 12, 246–261. [Google Scholar] [CrossRef]
  22. Moore, S.M.; King, M.T.M.; Carpenter, A.J.; Devries, T.J. Behavior, health, and productivity of early-lactation dairy cows supplemented with molasses in automated milking systems. J. Dairy Sci. 2020, 103, 10506–10518. [Google Scholar] [CrossRef] [PubMed]
  23. Weiss, W.P.; Shoemaker, D.E.; Mc Beth, L.R.; Yoder, P.; St-Pierre, N.R. Within farm variation in nutrient composition of feeds. In Proceedings of the Tri-State Dairy Nutrition Conference, Fort Wayne, IN, USA, 24–25 April 2012. [Google Scholar]
  24. Duranovich, F.; López-Villalobos, N.; Shadbolt, N.; Draganova, I.; Yule, I.; Morris, S. The deviation between dairy cow metabolizable energy requirements and pasture supply on a dairy farm using proximal hyperspectral sensing. Agriculture 2021, 11, 240. [Google Scholar] [CrossRef]
  25. Weiss, W.P. A 100-Year Review: From ascorbic acid to zinc—Mineral and vitamin nutrition of dairy cows. J. Dairy Sci. 2017, 100, 10045–10060. [Google Scholar] [CrossRef] [PubMed]
  26. Duplessis, M.; Fadul-Pacheco, L.; Santschi, D.E.; Pellerin, D. Toward Precision Feeding Regarding Minerals: What Is the Current Practice in Commercial Dairy Herds in Québec, Canada? Animals 2021, 11, 1320. [Google Scholar] [CrossRef] [PubMed]
  27. Piccioli-Cappelli, F.; Calegari, F.; Calamari, L.; Bani, P.; Minuti, A. Application of a NIR device for precision feeding in dairy farms: Effect on metabolic conditions and milk production. Ital. J. Anim. Sci. 2019, 18, 754–765. [Google Scholar] [CrossRef]
  28. Mikus, J.H. Diet consistency: Using TMR auditsTM to deliver more from your feed, equipment, and people to the bottom line. In High Plains Dairy Conference Proceedings, Amarillo, TX; Texas Animal Nutrition Council: Dallas, TX, USA, 2012; pp. 27–36. [Google Scholar]
  29. Mc Beth, L.R.; St-Pierre, N.R.; Shoemaker, D.E.; Weiss, W.P. Effects of transient changes in silage dry matter concentration on lactating dairy cows. J. Dairy Sci. 2013, 96, 3924–3935. [Google Scholar] [CrossRef] [PubMed]
  30. Stone, B. Reducing the variation between formulated and consumed rations. Adv. Dairy Technol. 2008, 20, 145–162. [Google Scholar]
  31. Sirakaya, S.; Küçük, O. Deviations of feedstuffs loading in TMR preparation. Turk. J. Vet. Anim. Sci. 2019, 43, 364–371. [Google Scholar] [CrossRef]
  32. Moallem, U.; Lifshitz, L. Accuracy and homogeneity of total mixed rations processed through trailer mixer or self-propelled mixer, and effects on the yields of high-yielding dairy cows. Anim. Feed. Sci. Technol. 2020, 270, 114708. [Google Scholar] [CrossRef]
Figure 1. The tolerance zone and recorded exceeded deviations obtained from corn silage analysis on farm A.
Applsci 16 06558 g001
Figure 2. The tolerance zone and recorded exceeded deviations obtained from alfalfa silage analysis on Farm A.
Applsci 16 06558 g002
Figure 3. The tolerance zone and recorded exceeded deviations obtained from core feed analysis on Farm A.
Applsci 16 06558 g003
Figure 4. The tolerance zone and recorded exceeded deviations obtained from corn silage analysis on Farm B.
Applsci 16 06558 g004
Figure 5. The tolerance zone and recorded exceeded deviations obtained from alfalfa silage analysis on Farm B.
Applsci 16 06558 g005
Figure 6. The tolerance zone and recorded exceeded deviations obtained from core feed analysis on Farm B.
Applsci 16 06558 g006
Table 1. Descriptive statistics—Farm A.
Corn SilageAlfalfa
Silage
Core Feed
Mean [%]0.801.571.7
Standard Deviation [%]2.062.423.67
Range [%]11.810.315.3
Margin of Error [95%]0.770.911.37
Coefficient Variance257.5154.1215.9
Table 2. Descriptive statistics—Farm B.
Corn SilageAlfalfa
Silage
Core Feed
Mean [%]2.975.89−2.09
Standard Deviation [%]4.3222.0313.16
Range [%]21.3134.578.4
Margin of Error [95%]1.618.234.92
Coefficient Variance145.4374.0629.7
Disclaimer/Publisher’s Note: The statements, opinions and data contained in all publications are solely those of the individual author(s) and contributor(s) and not of MDPI and/or the editor(s). MDPI and/or the editor(s) disclaim responsibility for any injury to people or property resulting from any ideas, methods, instructions or products referred to in the content.