Article

Simulation of Light Propagation in Media with Air-Filled Structures Using the Radiative Transfer Equation: Implications for Diffuse Optical Tomography for Thyroid Cancer


1
Biophotonics Innovation Laboratory, Institute of Photonics Medicine, Hamamatsu University School of Medicine, 1-20-1 Handayama, Chuo-ku, Hamamatsu 431-3192, Shizuoka, Japan
2
Center for Computational Sciences, University of Tsukuba, Tennodai, 1-1-1, Tsukuba 305-8577, Ibaraki, Japan
3
Biomedical Instrumentation Laboratory, Institute of Photonics Medicine, Hamamatsu University School of Medicine, 1-20-1 Handayama, Chuo-ku, Hamamatsu 431-3192, Shizuoka, Japan
*
Author to whom correspondence should be addressed.
Appl. Sci. 2026, 16(13), 6502; https://doi.org/10.3390/app16136502
Submission received: 17 May 2026 / Revised: 23 June 2026 / Accepted: 26 June 2026 / Published: 30 June 2026
(This article belongs to the Section Optics and Lasers)

Abstract

For image reconstruction in diffuse optical tomography (DOT), both accurate mathematical modeling of light propagation in biological tissue and robust inverse modeling are essential. This study evaluates the validity of the radiative transfer equation (RTE) as a forward model for DOT of the thyroid gland, which surrounds the air-filled trachea anteriorly, by comparing it with the photon diffusion equation (PDE). Distributions of photon time-of-flight (DTOFs) were obtained from numerical solutions of the RTE and the PDE in a homogeneous phantom and in a phantom containing four cylindrical holes. The refractive-index mismatch at the cylindrical hole walls (refractive index 1.511) was explicitly modeled by incorporating boundary conditions into the RTE solver, where refraction angles were determined using Snell’s law and the reflection coefficient was calculated based on Fresnel’s law. These simulated DTOFs were compared with experimental measurements acquired using a time-domain near-infrared spectroscopy (TD-NIRS) system. The results demonstrate that the RTE describes light propagation in media containing hollow regions more accurately than the PDE. Future work will apply this RTE framework to model light propagation in the human thyroid gland and improve the diagnostic accuracy of thyroid nodules.

1. Introduction

Cancer is a leading cause of death worldwide, and in Japan it has been the number one cause of death since 1981. This is mainly attributed to aging society, in which co-occurrence of dementia and cancer is a serious problem. Although enormous efforts have been made to develop methods of cancer prevention, diagnosis and treatment, several cancers, such as pancreatic and ovarian cancers, are still difficult to diagnose. Compared to these cancers, thyroid cancer is generally less malignant, and especially papillary thyroid cancer (PTC), which accounts for 80–85% of all thyroid cancer types, grows slowly [1]. However, follicular thyroid cancer (FTC), which is the second most common type, is a bit more aggressive and diagnosis is very difficult [2]. Thyroid cancers are in general diagnosed by ultrasound scanning and fine-needle aspiration biopsies. Since, however, FTC lacks the nuclear atypia and is encapsulated like a benign follicular thyroid adenoma, a diagnosis of FTC is based on histological demonstration of vascular and/or capsular invasion after a total thyroidectomy [3]. However, it is still difficult to diagnose capsular invasion because of a lack of consensus on the histological interpretation of findings [3,4]. Thus, alternative more sensitive diagnostic approaches to FTC are required.
Recent studies on cancer microenvironment have revealed the existence of hypoxic regions in cancer tissues, where hypoxia-inducible factor 1 (HIF-1) appears and plays a key role in metastasis and angiogenesis, causing resistance to therapy [5,6]. It is, therefore, expected that monitoring of tissue oxygenation is useful for cancer diagnosis and treatment. Diffuse optical tomography (DOT) reconstructs images of the distribution of the optical properties (absorption and reduced scattering coefficients, μa and μs′) from boundary measurements of near-infrared light in biological tissue. The μa values provide oxygenated and deoxygenated hemoglobin concentrations and tissue oxygen saturations. Thus, we have been developing DOT for the thyroid gland to detect hypoxic regions within lesions. In our preliminary study, in which the photon diffusion equation (PDE) was used as a forward model, three-dimensional (3D) maps of tissue oxygen saturation in the human thyroid were reconstructed [7]. However, the reconstructed thyroid gland was located closer to the skin than its actual position. This suggests that the image reconstruction algorithm needs improvement, particularly in the forward model.
The radiative transfer equation (RTE) accurately describes light propagation in biological tissues; however, solving it requires substantial computational time and memory. In contrast, the PDE provides a diffusion approximation of the RTE and is widely used as a forward model. Nevertheless, it is well known that this approximation breaks down in weakly scattering and non-scattering regions, such as void regions [8,9,10]. Cerebrospinal fluid (CSF) spaces, including the subarachnoid space and the ventricles, are representative void regions in biological tissues. The refractive-index mismatch between the CSF and the surrounding tissues (skull, dural membrane, pial membrane, and gray matter) is small and is therefore often neglected. However, the trachea is a hollow region and the refractive-index mismatch between the air and the surrounding tissue is large and must be considered in the forward model [11,12]. In our previous study, we created a finite element model of the human neck excluding the trachea to avoid the breakdown of the diffusion approximation and the refractive index mismatch at the tracheal wall. However, this approach was insufficient, as the reconstructed thyroid images were shifted anteriorly from their true locations. This discrepancy is likely due to the use of the diffusion approximation and the neglect of the refractive-index mismatch at the tracheal wall.
Recently, we have developed a new 3D time-dependent radiative transfer calculation code (TRINITY: Time-dependent Radiative transfer In Near-Infrared TomographY) as a forward solver of DOT [13], which is based on an ART (authentic radiative transfer) method developed for the cosmological simulations [14]. Simulation studies with TRINITY, which takes into account the effects of the reflection and refraction at the boundary of a scattering medium with holes, demonstrated that light propagation in a phantom with air-filled holes was faster than in a homogenous phantom.
Despite previous efforts, accurate modeling of light propagation in the presence of hollow regions and refractive-index mismatches remains a challenge. In particular, the validity of the conventional PDE-based forward model under such conditions has not been fully investigated. Therefore, the research problem addressed in this study is whether an RTE-based forward model can more accurately describe light propagation in phantoms with hollow regions than the conventional PDE-based model. In this study, we employ the TRINITY to simulate light propagation in a phantom with hollow regions and examine the validity of the RTE-based forward model by comparing DTOFs to measured and PDE-based calculated DTOFs.

2. Materials and Methods

2.1. Instrumentation

An eight-channel time-domain near-infrared spectroscopy (TD-NIRS) system (TRS-80, Hamamatsu Photonics K.K., Hamamatsu, Japan; Figure 1a) was employed to measure phantoms. The TRS-80 consists of three pulsed laser diodes (wavelengths: 763, 801, and 836 nm) with a pulse width of less than 100 ps and a repetition rate of 5 MHz, eight source fibers, and eight detector fibers. The source fibers are single fibers (core diameter 200 μm, numerical aperture (NA) 0.25), whereas the detector fibers are bundle fibers (diameter 3 mm, NA 0.29). Detected light was transferred via high-speed photomultiplier tubes in the TRS-80 to a multi-channel time-correlated single-photon counting (TCSPC) unit (HydraHarp 400, PicoQuant, Berlin, Germany; Figure 1b). This unit provided DTOFs with a time resolution of 1 ps over a time range of 0–10.24 ns for each wavelength.
Adequate signal-to-noise ratios (SNRs) in the DTOF were achieved by accumulating signals over 20–50 s, depending on the source–detector distance. The criterion for adequate SNR was a maximum DTOF count greater than 2000 and a dark count less than 10. In this study, DTOFs at 801 nm were analyzed.

2.2. Phantom Preparation

The phantom geometry was intentionally simplified and was not intended to reproduce the detailed anatomy of the human neck or thyroid gland. Rather, it was designed to isolate the effects of hollow regions and refractive-index mismatch on light propagation.
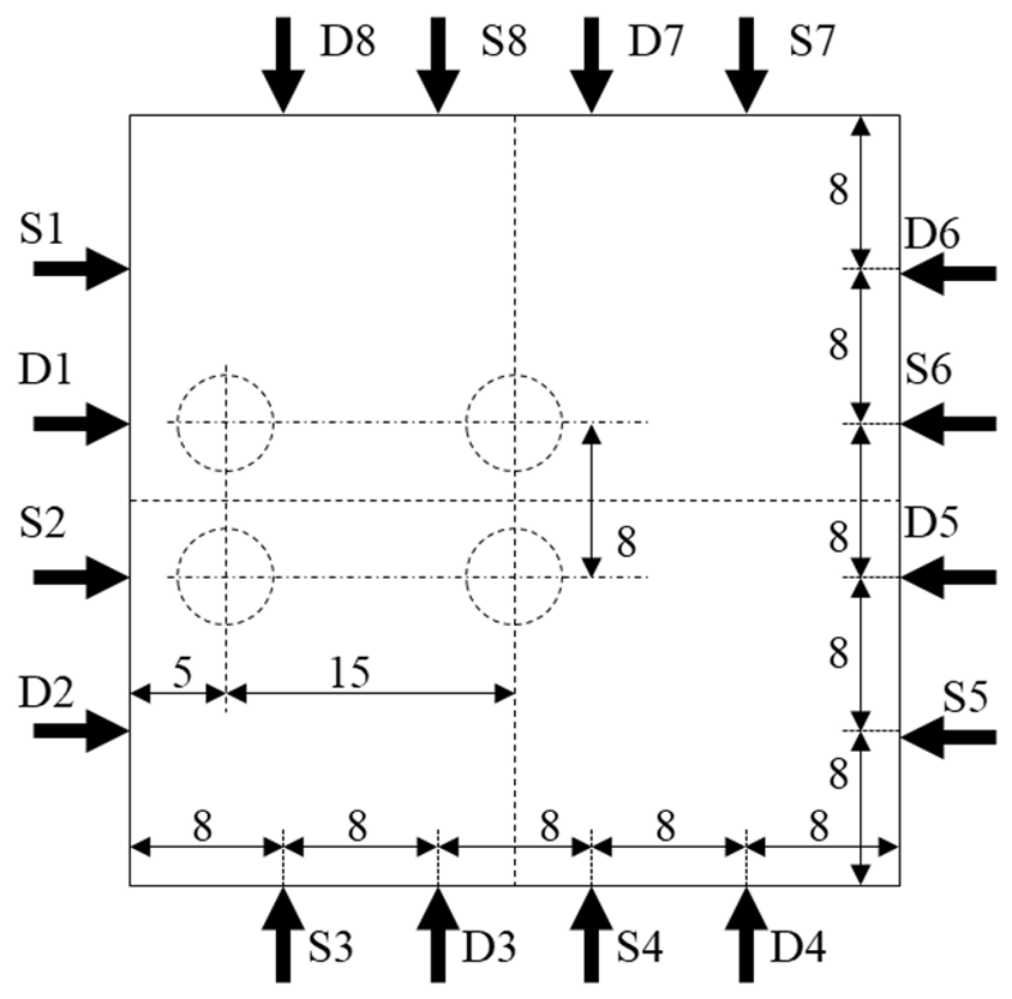
Two polyurethane-based cuboid phantoms (40 × 40 × 70 mm, refractive index 1.511, anisotropy factor 0.62) were prepared (INO, Québec, QC, Canada). The absorption (μa) and scattering coefficients (μs) at 800 nm were adjusted to match those of biological tissue a 0.0209 mm−1, μs 2.245 mm−1) using carbon black (absorbing agent) and titanium dioxide (scattering agent). One phantom was homogeneous, whereas the other was an inhomogeneous phantom with four cylindrical holes (diameter 5 mm) (Figure 1c). Source (S) and detector (D) fibers were attached to the side of the phantom at a height of 35 mm from the bottom. The arrangement of the fibers and the positions of the four holes are shown in Figure 1d and Figure 2.

2.3. Light Propagation Model Based on the Time-Dependent Radiative Transfer Equation (RTE)

Three-dimensional time-dependent radiative transfer calculation code (TRINITY) was employed to simulate light propagation in the phantoms. The details of TRINITY are described in reference [13]. Here, we explain it briefly. The RTE is given by
[ v ( r )   t + Ω · + μ a ( r ) + μ s ( r ) ] I ( r , Ω , t )     = μ s ( r )   4 π P   ( r ,   Ω , Ω ) I ( r , Ω , t ) d Ω + q ( r , Ω , t )   ,
where I ( r , Ω , t ) is the energy radiance (the light intensity) (Wcm−2sr−1) at the spatial position r ( x ,   y , z ) , in the direction Ω ( θ ,   Φ ) with θ being the zenith angle and Φ the azimuthal angle, at time t. μ a ( r ) and μ s ( r ) are absorption and scattering coefficients, and the speed of light at position r, v ( r ) , is given by v = c n , where n is the refractive index and c is the speed of light in vacuum. The source function q ( r , Ω , t ) represents the power injected into a unit volume at r within a solid angle d Ω centered on Ω .   P ( r , Ω , Ω ) is the scattering phase function. Henyey–Greenstein function is commonly employed as a phase function [15]:
P ( r , Ω , Ω ) = 1 4 π 1 g ( r ) 2 [ 1 + g ( r ) 2 2 g ( r )   Ω · Ω ] 3 2     ,
where g ( r ) is the anisotropy factor, ranging from −1 to 1; g = −1, 0, and +1 correspond to complete backscattering, isotropic scattering, and forward scattering, respectively.
The RTE has been widely studied in astrophysics, where various numerical methods have been developed. TRINITY is a computational code originally developed based on such methods to simulate light transport in biological tissues [13]. Unlike the short-characteristic method which has been commonly used in astrophysics [16], TRINITY adopts an approach based on a long ray connecting the boundaries of the computational domain, in which I(r,Ω,t) is evaluated at grid intersection points using upwind information. Because of this scheme, numerical diffusion is significantly reduced. We applied HEALPix for angular discretization originally developed for the analysis of the cosmic microwave background [17] and set the number of angular bins to 3072. In simulation, a light pulse with a duration of 1.3 × 10⁻² ns was used to match the temporal profile of the actual source at the boundary. The length between grids ( x) was 1.25 mm, and the time resolution ( t) was 1 ps.
To reduce the computational cost, the simulation domain was limited to 40 × 40 × 40 mm3, although the physical phantom size was 40 × 40 × 70 mm3. Since both the source and detectors were located on the central plane of the phantom, photons contributing to the major portion of the DTOF were mainly confined around this plane. Based on the photon migration characteristics described by Jacques [18], photons detected at earlier times predominantly sample regions close to the source–detector plane, whereas the influence of distant boundaries becomes appreciable mainly for long-lived photons. Previous studies on time-resolved light propagation have also shown that boundary effects are largely confined to the late portion of the DTOF [18,19,20]. Therefore, the influence of the top and bottom boundaries was considered negligible for most of the DTOF, and a computational domain of 40 × 40 × 40 mm3 was regarded as sufficient while substantially reducing the computational cost. It should be noted, however, that the effect of these boundaries may not be entirely negligible for very late photons (approximately 3.7–4 ns), since photons with longer path lengths are more likely to sample regions closer to the upper and lower surfaces.
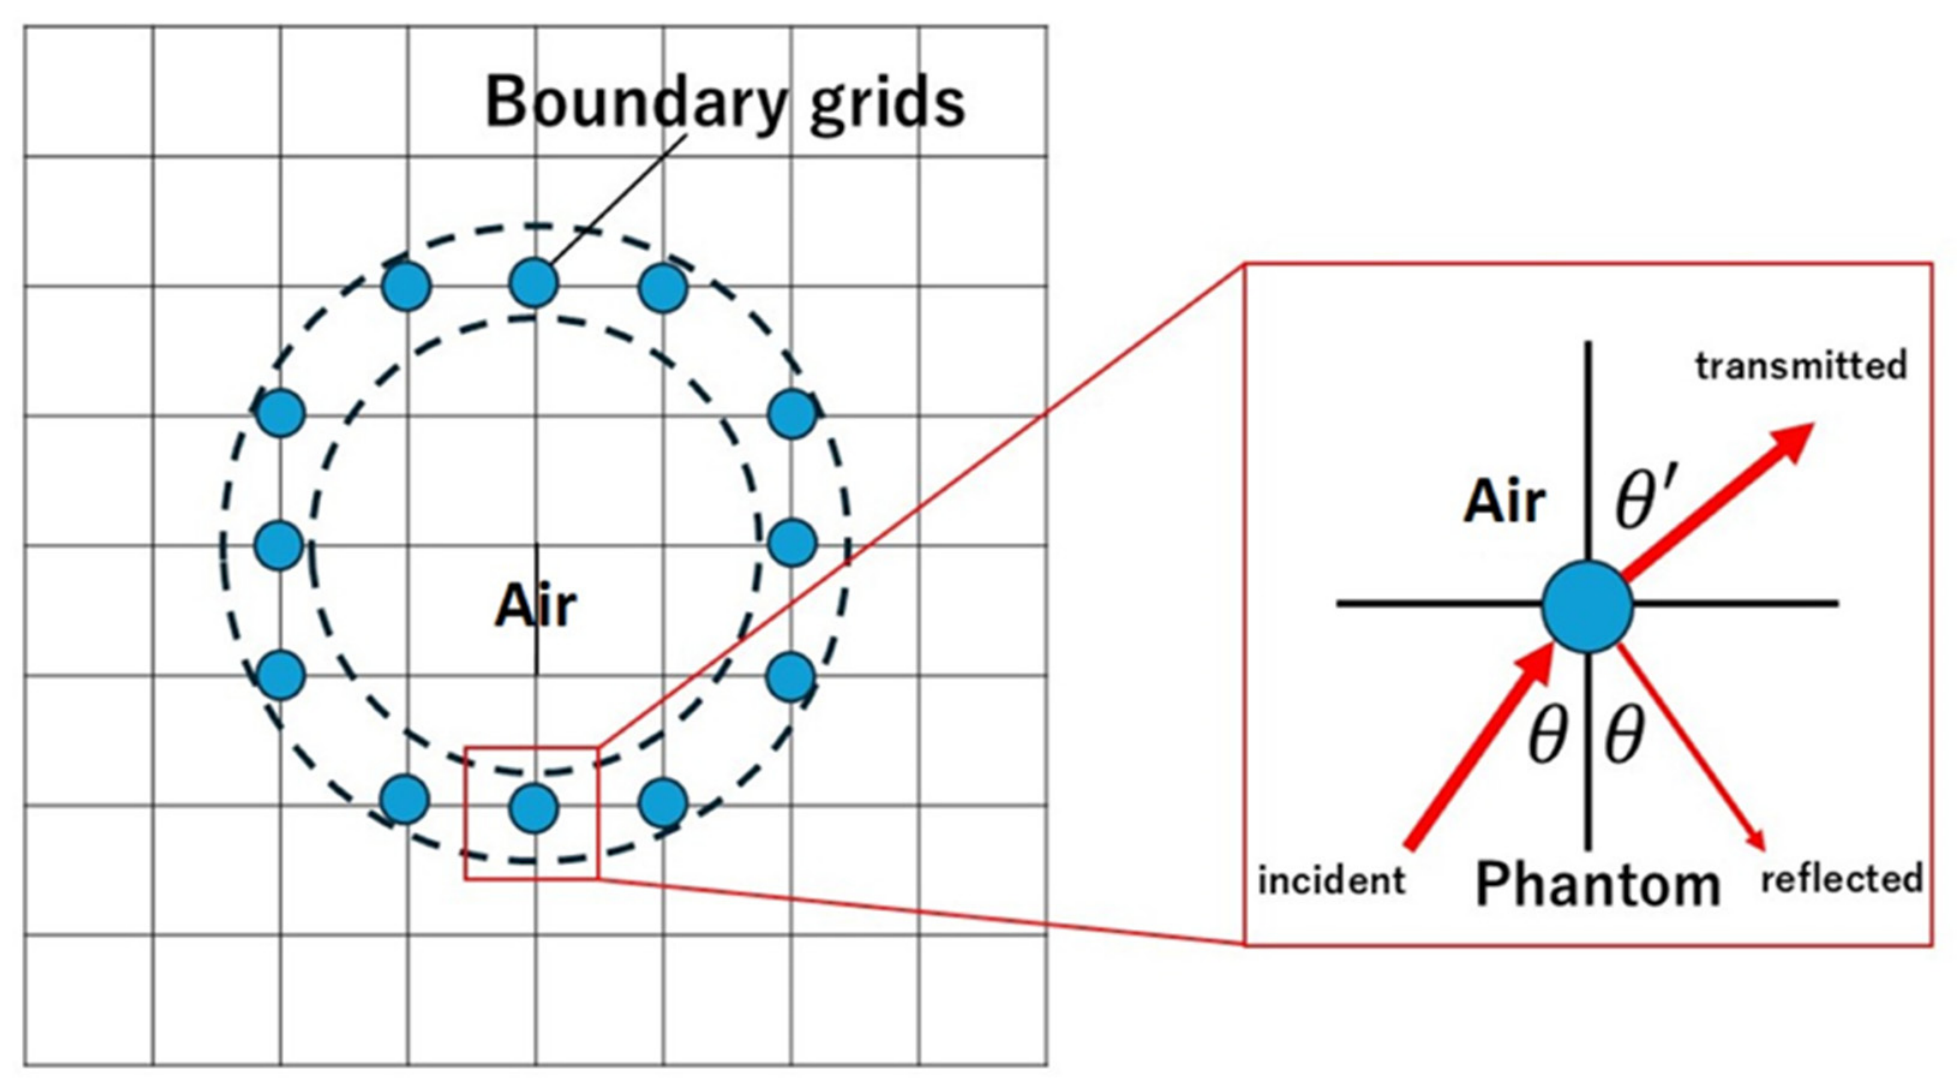
At the boundary between the scattering medium and the cylindrical holes (air), refractive index mismatch must be considered. TRINITY defines a boundary grid as a grid that is within R − 0.5 x and R + 0.5 x, where R is the radius of each hole and x is the cell size (the length between grids) (Figure 3). When light is scattered in a boundary grid, some photons are reflected and others enter the hole (air) with the angle of emergence ( θ ′) different from the angle of incidence ( θ ) based on Snell’s law (Figure 3).

2.4. Light Propagation Simulated by the Time-Dependent Photon Diffusion Equation (PDE)

The time-dependent PDE with a Robin boundary condition was solved using the finite element method (FEM). All computations were performed using TOAST++ (open-source software) [21]. The computational mesh was generated with Gmsh [22], employing tetrahedral elements with a characteristic length of 1 mm. The computational domain had dimensions of 40 × 40 × 40 mm and was discretized into approximately 40 × 40 × 40 elements. Although the domain height was smaller than the physical height of the sample (70 mm), the same computational domain as that used in the RTE simulation was employed. As discussed in Section 2.3, the influence of the top and bottom boundaries on the major portion of the DTOF was considered negligible. Therefore, the reduced computational domain was adopted to decrease the computational cost. Our preliminary investigations also indicated that this simplification had little effect on the simulation results. The refractive index mismatch between the scattering medium was neglected.

2.5. Quantitative Evaluation of Differences in Simulated and Measured DTOFs

Quantitative comparison between measured and simulated DTOFs is often performed using the reduced χ2 value [23]. However, in the present study, the measurement errors are more appropriately described by Poisson statistics rather than by a Gaussian distribution. Furthermore, the errors associated with individual data points cannot be assumed to be statistically independent, and the standard deviations of individual measurements are neither known a priori nor theoretically predictable. Therefore, the reduced χ2 value should not be interpreted in a strict statistical sense; rather, it is used here as an empirical index for comparing the agreement between DTOFs. In our previous study [24], the χ2 value was introduced as a practical indicator of the validity of the diffusion approximation. Following the same approach, we employed the χ2 value to quantitatively evaluate the agreement between measured and simulated DTOFs in the present study.
The χ 2 value is given as
χ 2 = k = a b | F ~ m ( t k ) F ~ s ( t k ) | 2 F ~ s ( t k )     ,  
where F ~ m ( t k ) and F ~ s ( t k ) are normalized measured (m) and simulated (s) DTOFs. t k = k t . The lower and upper limits, t a and t b , were selected so that the light intensity was greater than 10% of the peak value over the time interval from t a to t b .

3. Results


Figure 4a shows the normalized DTOFs at measurement position D1, obtained from TRS-80 measurements and from PDE- and RTE-based simulations for the homogeneous phantom with the source located at S1. The distance between the source (S1) and detector (D1) is 8 mm. Both simulations are in good agreement with the measured DTOF. Although slight deviations are observed at later times (t > 3 ns), where the RTE-based and PDE-based DTOFs are shifted slightly to the left and right, respectively, these deviations are negligible due to the low photon counts.
Figure 4b shows the normalized DTOFs at measurement position D5, obtained from TRS-80 measurements and from PDE- and RTE-based simulations for the homogeneous phantom with the source located at S1. The source-detector distance is 43 mm. Both simulations are in good agreement with the measured DTOF.
Figure 4c shows the normalized DTOFs at measurement position D1, obtained from TRS-80 measurements and from PDE- and RTE-based simulations for the phantom with four cylindrical holes, where the source is located at S1. The RTE-based simulated DTOF is in good agreement with the measured DTOF. In contrast, the PDE-based simulated DTOF is noticeably shifted to the left on the trailing edge.
Figure 4d shows the normalized DTOFs at measurement position D5, obtained from TRS-80 measurements and from PDE- and RTE-based simulations for the phantom with four cylindrical holes, where the source is located at S1. The RTE-based simulated DTOF is in good agreement with the measured DTOF, whereas the PDE-based simulated DTOF exhibits a clear rightward shift on the leading edge.
The χ2 values used to quantitatively evaluate the agreement between the measured and simulated DTOFs are shown in Table 1. For the homogeneous phantom, similar χ2 values were obtained for the PDE- and RTE-based simulations at both D1 and D5. In contrast, for the phantom with four cylindrical holes, the χ2 values obtained from the PDE-based simulations were substantially larger, whereas those obtained from the RTE-based simulations were much smaller, indicating much better agreement with the measurements.

4. Discussion

As shown in Figure 4a–d, the RTE-based simulations are in good agreement with the measured DTOFs for both the homogeneous phantom and the phantom with four cylindrical holes. In contrast, the PDE-based simulations exhibit systematic deviations, including shifts in the leading and trailing edges, depending on the measurement position.
It is widely accepted that the diffusion approximation is invalid in the vicinity of light source [25,26]. However, Figure 4a indicates that the diffusion approximation may still hold in bulk biological tissue at a source-detector distance of 8 mm. This is consistent with our previous study, in which we proposed the χ2 value as an indicator for quantifying the validity of the diffusion approximation, as described in Section 2.5 [24]. In that study, the χ2 values of approximately 10 provided a reasonable criterion for agreement, whereas values around 20 and 5 corresponded to relatively loose and stringent criteria, respectively. In contrast, Figure 4c,d show that the χ2 values obtained from the PDE-based simulations were considerably larger, demonstrating that the diffusion approximation breaks down in the presence of hollow regions, even when the detector is located far from the source.
In general, PDE-based simulations treat a hollow region as having neither absorption nor scattering and do not account for refractive-index mismatch between the medium and air. As a result, complicated phenomena such as refraction, reflection and total internal reflection are not properly modeled. To address these limitations, TRINITY treats light propagation in hollow regions as ballistic photon paths and implements explicit boundary conditions for refractive index mismatch.
These differences between the PDE and RTE results can be explained by the inability of the diffusion approximation to accurately model directional photon transport and refractive-index mismatch at the hole boundaries. For the short source–detector separation (S1–D1), photons propagating alongside one of the holes contribute significantly to the detected signal. In this case, both models reproduce the peak region reasonably well, whereas the PDE model underestimates late-arriving photons because it neglects internal reflections at the hole boundary. For the larger separation (S1–D5), photon paths traversing the central region containing multiple holes contribute significantly to the detected signal. The directional propagation of photons through the air-filled holes leads to earlier photon arrival, which is captured by the RTE model but not by the diffusion approximation. As a result, the PDE model predicts a delayed peak, while the post-peak region is similar in both models because the late photons are dominated by multiple scattering in the surrounding medium.
The present results indicate that RTE-based modeling is essential for accurately describing light propagation in tissues containing air-filled structures such as the trachea. However, the high computational cost of solving the RTE remains a major challenge for practical applications. In this study, the PDE-based simulations were performed on a desktop personal computer and required approximately one hour or less. Most of the RTE-based simulations presented in this study were carried out on a workstation equipped with 512 GB RAM, a 240 GB SSD, and two 2 TB HDDs and required approximately 40 h. Some additional calculations performed using GPU acceleration required approximately one hour or less, whereas simulations performed on a supercomputer required several tens of minutes.
Therefore, considerable efforts have been devoted to reducing the computational burden of RTE-based modeling while maintaining sufficient accuracy. The PDE is derived from the lowest-order spherical harmonics approximation (P1) of the RTE, whereas higher-order approximations, such as P3 or SP3 (simplified spherical harmonics) improve simulation accuracy by retaining angular information of light while reducing computational cost [27,28]. Nevertheless, finite-order spherical harmonics approximations may still introduce inaccuracies due to insufficient angular resolution, as demonstrated in Ref. [29]. Recently, we have proposed a new approach for a fast and accurate RTE calculation, in which the angular resolution is adaptively varied based on local anisotropy of the radiation field using the spherical Haar wavelet basis [29]. Hybrid models combining the PDE and RTE have also been proposed [30,31]. In addition, data-driven approaches have recently attracted attention; for example, neural-network-based methods have been proposed to predict DTOFs while reducing the computational burden of forward modeling in DOT [32].
Even though TRINITY enables accurate simulations of light propagation in biological tissues, inverse problems of DOT are inherently ill-posed and thus regularization is required, which may degrade image quality. In our previous study, we employed Tikhonov regularization, which resulted in low spatial resolution [7]. Feng et al. demonstrated that machine learning-based approaches can mitigate the degradation in image quality caused by regularization [33]. Moreover, machine learning and deep learning approaches have recently been developed to directly address the inverse problem in DOT, beyond conventional regularization-based methods [34,35]. Building on these findings, although this approach requires substantial computational resources, we have been developing a deep-learning-based image reconstruction algorithm by using a long short-term memory network, where training data are generated from RTE-based simulations [36]. By incorporating more accurate forward modeling into the training process, this approach is expected to improve the spatial accuracy and image quality of thyroid DOT.

5. Conclusions

In this study, we investigated the validity of an RTE-based forward model for DOT by comparing DTOFs calculated using the RTE and the conventional PDE with experimentally measured DTOFs in a phantom containing hollow regions. The results demonstrated that the RTE-based model implemented in TRINITY provides a more accurate description of light propagation in the presence of air cavities, such as the trachea, than the conventional diffusion-based model. These findings suggest that the use of an RTE-based forward model can improve the spatial accuracy of thyroid DOT and contribute to the development of more advanced image reconstruction frameworks.

Author Contributions

Conceptualization, Y.H.; methodology, Y.H., Q.S., H.Y., M.A. and S.O.; data analysis, Q.S., H.Y. and M.A.; investigation, Y.H., Q.S., H.Y. and S.O.; writing—original draft preparation, Q.S.; writing—review and editing, Y.H. and Q.S.; funding acquisition, Y.H. and Q.S. All authors have read and agreed to the published version of the manuscript.

Funding

This research was supported by the Grant-in-Aid Program of Hamamatsu University School of Medicine (HUSM).

Institutional Review Board Statement

Not applicable.

Informed Consent Statement

Not applicable.

Data Availability Statement

The original contributions presented in this study are included in the article. Further inquiries can be directed to the corresponding author.

Conflicts of Interest

The authors declare no conflicts of interest.

Abbreviations

The following abbreviations are used in this manuscript:
DOTdiffuse optical tomography
RTEradiative transfer equation
PDEphoton diffusion equation
DTIFsdistributions of photon time-of-flight
TD-NIRStime-domain near-infrared spectroscopy
PTCpapillary thyroid cancer
FTCfollicular thyroid cancer
HIF-1hypoxia-inducible factor 1
CSFcerebrospinal fluid
TRINITYtime-dependent radiative transfer in near-infrared tomography
ARTauthentic radiative transfer
NAnumerical aperture
SNRssignal-to-noise ratios
FEMfinite element method

References

  1. Boucai, L.; Zafereo, M.; Cabanillas, M.E. Thyroid cancer: A review. JAMA 2024, 331, 425–435. [Google Scholar] [PubMed]
  2. Gopalan, V.; Deshpande, S.G.; Zade, A.A.; Tote, D.; Rajendran, R.; Durge, S.; Bhargava, A. Advances in the diagnosis and treatment of follicular thyroid carcinoma: A comprehensive review. Cureus 2024, 16, e66186. [Google Scholar] [CrossRef] [PubMed]
  3. Baloch, Z.W.; LiVolsi, V.A. Follicular-patterned lesions of the thyroid: The bane of the pathologist. Am. J. Clin. Pathol. 2002, 117, 143–150. [Google Scholar] [PubMed]
  4. Cipriani, N.A.; Nagar, S.; Kaplan, S.P.; White, M.G.; Antic, T.; Sadow, P.M.; Aschebrook-Kilfoy, B.; Angelos, P.; Kaplan, E.L.; Grogan, R.H. Follicular thyroid carcinoma: How have histologic diagnoses changed in the last half-century and what are the prognostic implications? Thyroid 2015, 25, 1209–1216. [Google Scholar] [CrossRef] [PubMed]
  5. Burrows, N.; Resch, J.; Cowen, R.L.; Von Wasielewski, R.; Hoang-Vu, C.; West, C.M.; Williams, K.J.; Brabant, G. Expression of hypoxia-inducible factor 1α in thyroid carcinomas. Endocr. Relat. Cancer 2010, 17, 61–72. [Google Scholar] [CrossRef] [PubMed]
  6. Mahkamova, K.; Latar, N.; Aspinall, S.; Meeson, A. Hypoxia increases thyroid cancer stem cell-enriched side population. World J. Surg. 2018, 42, 350–357. [Google Scholar] [PubMed]
  7. Mimura, T.; Okawa, S.; Kawaguchi, H.; Tanikawa, Y.; Hoshi, Y. Imaging the human thyroid using three-dimensional diffuse optical tomography: A preliminary study. Appl. Sci. 2021, 11, 1670. [Google Scholar] [CrossRef]
  8. Dehghani, H.; Arridge, S.R.; Schweiger, M.; Delpy, D.T. Optical tomography in the presence of void regions. J. Opt. Soc. Am. A 2000, 17, 1659–1670. [Google Scholar] [CrossRef]
  9. Arridge, S.R.; Dehghani, H.; Schweiger, M.; Okada, E. The finite element model for the propagation of light in scattering media: A direct method for domains with nonscattering regions. Med. Phys. 2000, 27, 252–264. [Google Scholar] [CrossRef] [PubMed]
  10. Hielscher, A.H.; Alcouffe, R.E.; Barbour, R.L. Comparison of finite-difference transport and diffusion calculations for photon migration in homogeneous and heterogeneous tissues. Phys. Med. Biol. 1998, 43, 1285–1302. [Google Scholar] [CrossRef] [PubMed]
  11. Jha, A.K.; Zhu, Y.; Wong, D.F.; Rahmim, A. A radiative transfer equation-based image-reconstruction method incorporating boundary conditions for diffuse optical imaging. Proc. SPIE Int. Soc. Opt. Eng. 2017, 11, 10137. [Google Scholar]
  12. Lehtikangas, O.; Tarvanien, T.; Kim, A.D.; Arridge, S.R. Finite element approximation of the radiative transport equation in a medium with piece-wise constant refractive index. J. Comput. Phys. 2015, 282, 345–359. [Google Scholar] [CrossRef]
  13. Yajima, H.; Abe, M.; Umemura, M.; Takamizu, Y.; Hoshi, Y. TRINITY: A three-dimensional time-dependent radiative transfer code for in-vivo near-infrared imaging. J. Quant. Spectrosc. Radiat. Transf. 2022, 277, 107948. [Google Scholar]
  14. Nakamoto, T.; Umemura, M.; Susa, H. The effects of radiative transfer on the reionization of an inhomogeneous universe. Mon. Not. R. Astron. Soc. 2001, 321, 593–604. [Google Scholar] [CrossRef][Green Version]
  15. Henyey, L.G.; Greenstein, L.J. Diffuse radiation in the galaxy. Astrophys. J. 1941, 93, 70–83. [Google Scholar] [CrossRef]
  16. Stone, J.M.; Norman, M.L. ZEUS-2D: A radiation magnetohydrodynamics code for astrophysical flows in two space dimensions. I—The hydrodynamic algorithms and tests. Astrophys. J. Suppl. Ser. 1992, 80, 753–790. [Google Scholar]
  17. Górski, K.M.; Hivon, E.; Banday, A.J.; Wandelt, B.D.; Hansen, F.K.; Reinecke, M.; Bartelmann, M. HEALPix: A framework for high-resolution discretization and fast analysis of data distributed on the sphere. Astrophys. J. 2005, 622, 759–771. [Google Scholar]
  18. Jacques, S.L. Time-resolved reflectance spectroscopy in turbid tissues. IEEE Trans. Biomed. Eng. 1989, 36, 1155–1161. [Google Scholar] [CrossRef] [PubMed]
  19. Patterson, M.S.; Chance, B.; Wilson, B.C. Time resolved reflectance and transmittance for the non-invasive measurement of tissue optical properties. Appl. Opt. 1989, 28, 2331–2336. [Google Scholar] [CrossRef] [PubMed]
  20. Hielscher, A.H.; Jacques, L.; Wang, L.; Tittel, F.K. The influence of boundary conditions on the accuracy of diffusion theory in time-resolved reflectance spectroscopy of biological tissues. Phys. Med. Biol. 1995, 40, 1957–1975. [Google Scholar] [CrossRef] [PubMed]
  21. Schweiger, M.; Arridge, S. The Toast++ software suite for forward and inverse modeling in optical tomography. J. Biomed. Opt. 2014, 19, 040801. [Google Scholar] [CrossRef] [PubMed]
  22. Geuzaine, C.; Remacle, J.-F. Gmsh: A 3-D finite element mesh generator with built-in pre- and post-processing facilities. Int. J. Numer. Methods Eng. 2009, 79, 1309–1331. [Google Scholar]
  23. Guyon, L.; da Silva, A.; Planat-Chrétien, A.; Rizo, P.; Dinten, J.-M. χ2 analysis for estimating the accuracy of optical properties derived from time resolved diffuse-reflectance. Opt. Express 2009, 17, 20521–20537. [Google Scholar]
  24. Capart, A.; Ikegaya, S.; Okada, E.; Machida, M.; Hoshi, Y. Experimental tests of indicators for the degree of validness of the diffusion approximation. J. Phys. Commun. 2021, 5, 025012. [Google Scholar] [CrossRef]
  25. Perelman, L.T.; Winn, J.; Wu, J.; Dasari, R.R.; Feld, M.S. Photon migration of near-diffusive photons in turbid media: A Lagrangian-based approach. J. Opt. Soc. Am. A Opt. Image Sci. Vis. 1997, 14, 224–229. [Google Scholar] [PubMed]
  26. Matrí-López, L.; Bouza-Domí, J.; Hebden, J.C. Interpretation of the failure of the time-independent diffusion equation near a point source. Opt. Commun. 2004, 242, 23–43. [Google Scholar] [CrossRef]
  27. Liemert, A.; Kienle, A. Explicit solutions of the radiative transport equation in the P3 approximation. Med. Phys. 2014, 41, 111916. [Google Scholar] [CrossRef] [PubMed]
  28. Kim, H.K.; Montejo, L.D.; Jia, J.; Hielscher, A.H. Frequency-domain optical tomographic image reconstruction algorithm with the simplified spherical harmonics (SP3) light propagation model. Int. J. Therm. Sci. 2017, 116, 265–277. [Google Scholar] [CrossRef] [PubMed]
  29. Abe, M.; Yajima, H.; Umemura, M.; Hoshi, Y. Adaptive angular resolution for time-dependent radiative transfer simulations based on local radiation field anisotropy. J. Quant. Spectrosc. Radiat. Transf. 2026, 352, 109820. [Google Scholar] [CrossRef]
  30. Tarvainen, T.; Kolehmainen, V.; Arridge, S.R.; Kaipio, J.P. Image reconstruction in diffuse optical tomography using the coupled radiative transport–diffusion mode. J. Quant. Spectrosc. Radiat. Transf. 2011, 111, 2600–2608. [Google Scholar] [CrossRef]
  31. Fujii, H.; Okawa, S.; Yamada, Y.; Hoshi, Y. Hybrid model of light propagation in random media based on the time-dependent radiative transfer and diffusion equations. J. Quant. Spectrosc. Radiat. Transf. 2014, 147, 145–154. [Google Scholar] [CrossRef]
  32. Horie, S.; Yajima, H.; Abe, M.; Umemura, M. Development of a neural network predicting signals for time-domain diffuse optical tomography. Biomed. Eng. Lett. 2026, 1–17. [Google Scholar] [CrossRef]
  33. Feng, J.; Sun, Q.; Li, Z.; Sun, Z.; Jia, K. Back-propagation neural network-based reconstruction algorithm for diffuse optical tomography. J. Biomed. Opt. 2019, 24, 051407. [Google Scholar]
  34. Zou, Y.; Zeng, Y.; Li, S.; Zhu, Q. Machine learning model with physical constraints for diffuse optical tomography. Biomed. Opt. Express 2021, 12, 5720–5734. [Google Scholar] [CrossRef] [PubMed]
  35. Balasubramaniam, G.M.; Wiesel, B.; Biton, N.; Kumar, R.; Kupferman, J.; Arnon, S. Tutorial on the use of deep learning in diffuse optical tomography. Electronics 2022, 11, 305. [Google Scholar] [CrossRef]
  36. Takamizu, Y.; Umemura, M.; Yajima, H.; Abe, M.; Hoshi, Y. Deep learning of diffuse optical tomography based on time-domain radiative transfer equation. Appl. Sci. 2022, 12, 12511. [Google Scholar] [CrossRef]
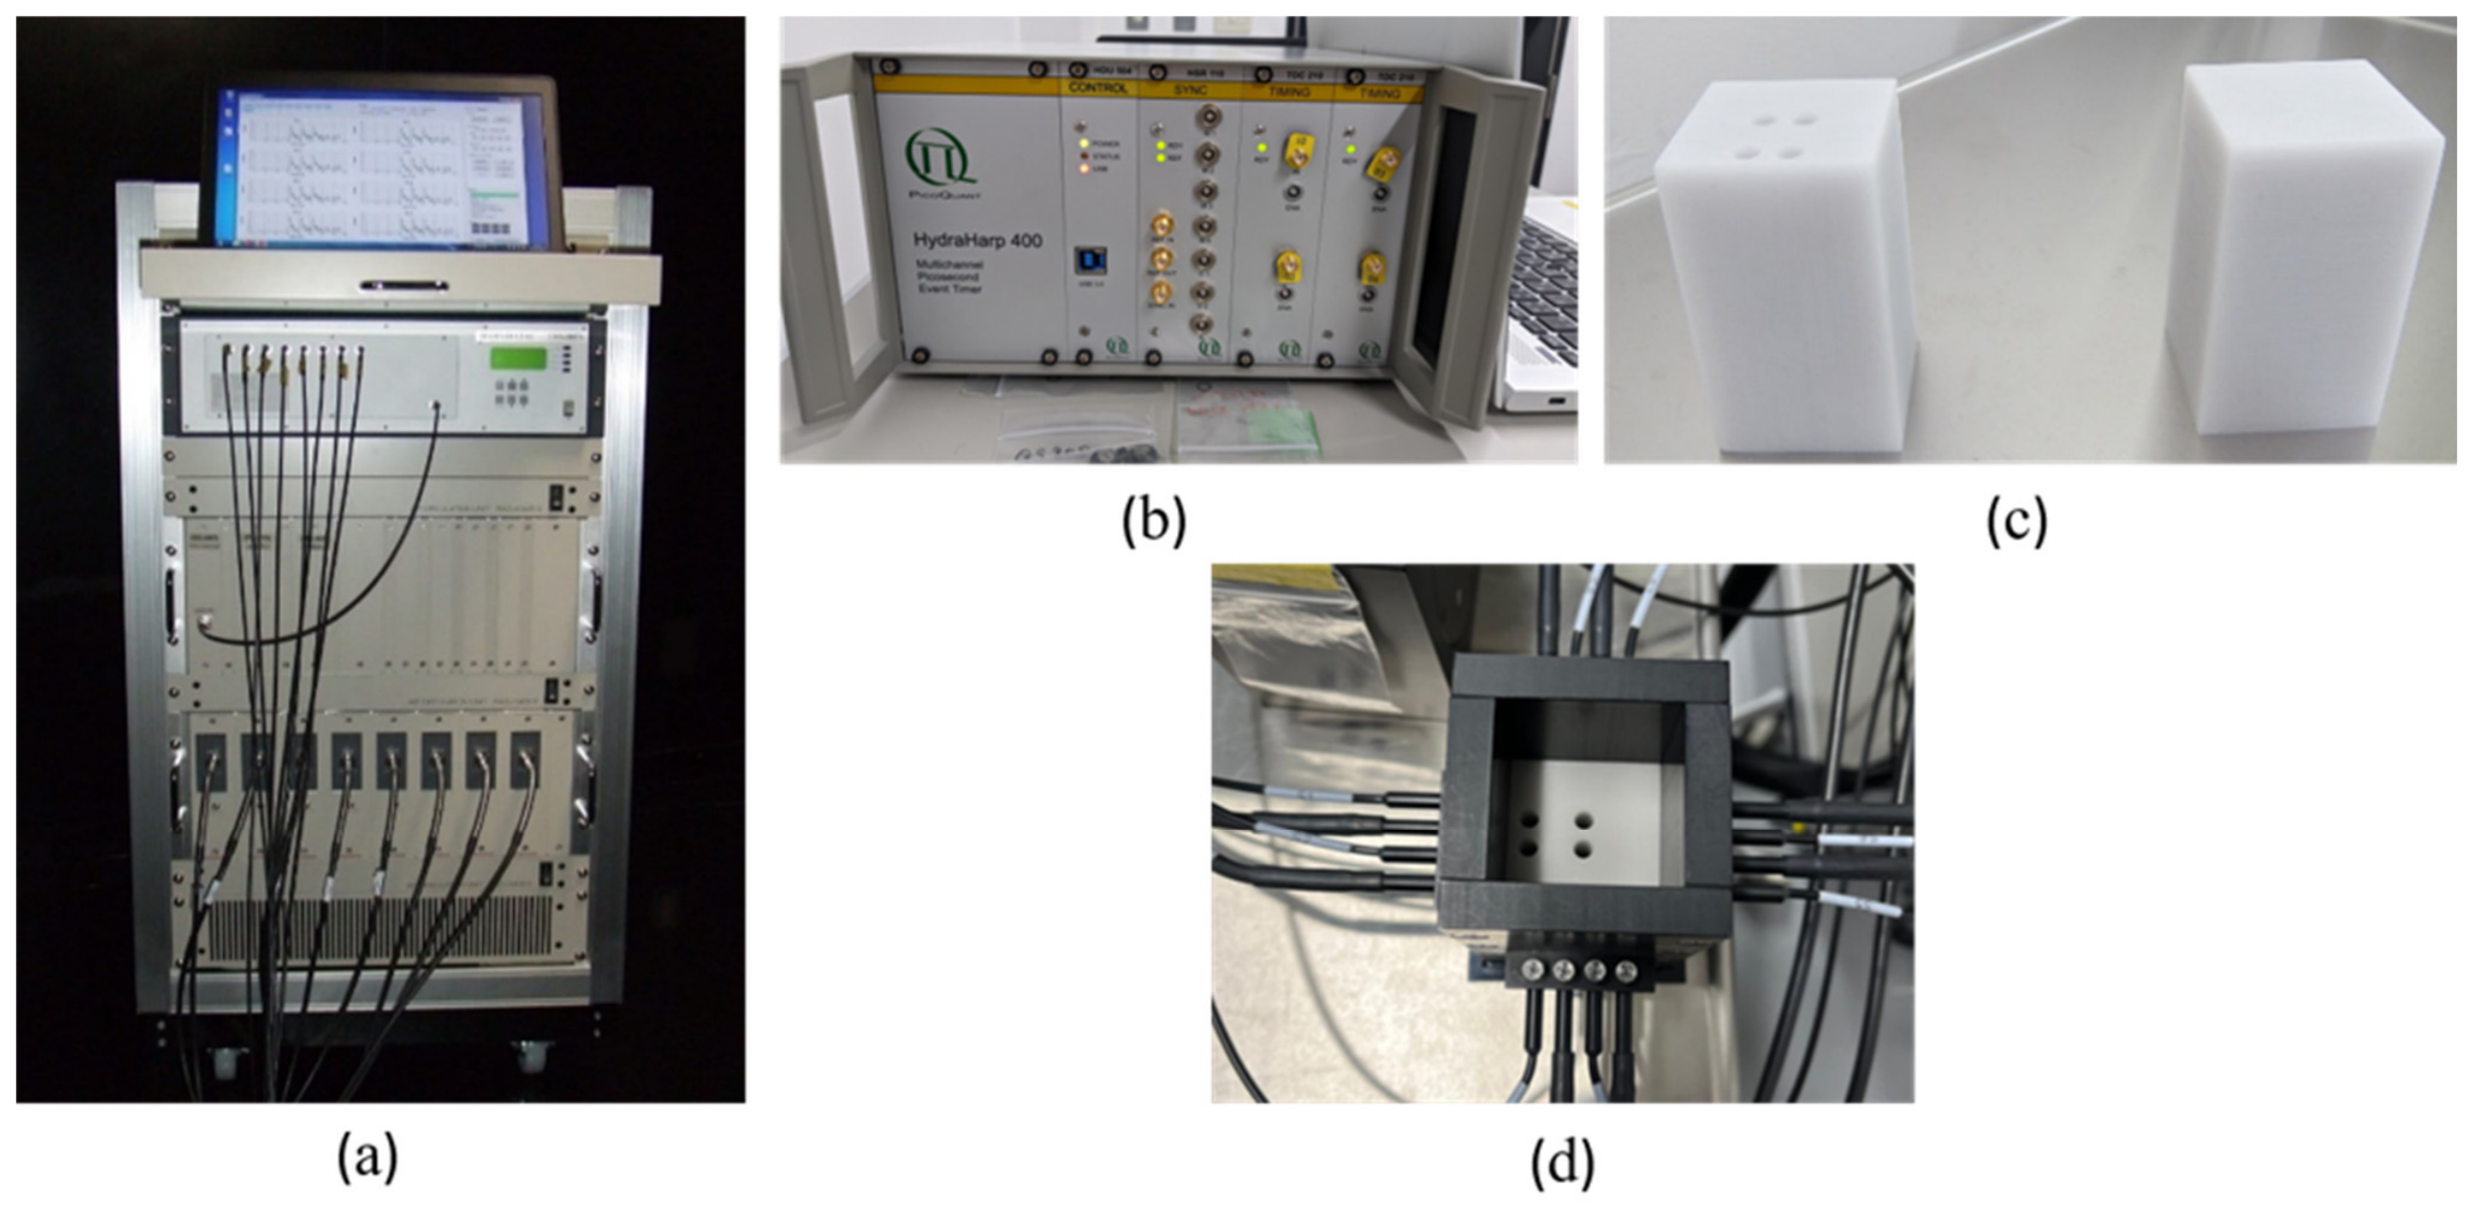
Figure 1. Experimental setup for measuring DTOFs (a) TRS-80; (b) HydraHarp 400; (c) phantoms with and without cylindrical holes; (d) arrangement of optical fibers and positions of the holes.
Applsci 16 06502 g001
Figure 2. Arrangement of optical fibers and positions of the holes. S# and D# denote source and detector fibers, respectively.
Applsci 16 06502 g002
Figure 3. Schematic diagram of TRINITY for modeling refractive index mismatch at the medium-hole interface. Blue dots indicate grid points.
Applsci 16 06502 g003
Figure 4. Comparison of normalized distributions of photon time-of-flight (DTOFs) obtained from TRS-80 measurements and PDE- and RTE-based simulations with the source located at S1. Panels (a,b) show the homogeneous phantom, whereas panels (c,d) show the phantom with four cylindrical holes. Panels (a,c) correspond to detector D1, and panels (b,d) correspond to detector D5.
Applsci 16 06502 g004
Table 1. The χ2 values.
S-DPDERTE
Homogeneous PhantomS1-D12.896.61
S1-D59.299.08
Phantom with four cylindrical holesS1-D111.230.68
S1-D526.971.7
Disclaimer/Publisher’s Note: The statements, opinions and data contained in all publications are solely those of the individual author(s) and contributor(s) and not of MDPI and/or the editor(s). MDPI and/or the editor(s) disclaim responsibility for any injury to people or property resulting from any ideas, methods, instructions or products referred to in the content.