Article

LLM-Integrated Semantic Deep Learning Framework for Automated Floor Plan Analysis, Area Estimation, and Compliance Assessment of Existing Buildings

Faculty of Applied Sciences, Macao Polytechnic University, Macao, China
*
Author to whom correspondence should be addressed.
Appl. Sci. 2026, 16(13), 6290; https://doi.org/10.3390/app16136290
Submission received: 26 May 2026 / Revised: 18 June 2026 / Accepted: 18 June 2026 / Published: 23 June 2026
(This article belongs to the Topic AI Agents: Progress, Architecture, and Applications)

Abstract

The digitization of existing building stock often depends on legacy 2D raster floor plans (scanned drawings, PDF exports, or photographs) because structured building information models are frequently unavailable for older properties. Manual measurement and visual inspection of such documents are time consuming and error prone. This paper presents an integrated deep learning pipeline that extracts semantic information from unstructured two-dimensional floor plan images of existing structures and supports preliminary compliance screening via locally deployed large language models. The pipeline employs YOLOv8 for the localization and classification of 18 architectural symbols and furniture items, and a U-Net with a ResNet34 encoder for the semantic segmentation of walls and interior room spaces. To translate pixel-level predictions into physical metrics, we implement an area calculation module based on user-defined reference scale calibration. An LLM evaluation module, deployed locally via Ollama with a retrieval-augmented generation pipeline, interprets extracted room metrics and flags potential non-compliance against referenced residential design guidelines; it is intended for the assessment of existing layouts rather than generative co-design. We expand a core dataset of 101 manually annotated source floor plans to 303 augmented instances using label-aligned geometric transformations, while reporting generalization in terms of the 101 unique source plans. On the held-out validation split (10 source plans), YOLOv8 achieves 92.3% mAP50 versus 87.2% for a Faster R-CNN reference model on the same data split (detection baselines differ in training epochs and pretraining; see Experiments); U-Net achieves 95.71% mIoU, surpassing DeepLabv3+ (93.2%) under matched segmentation training settings. The system is deployed as an interactive web application for legacy building survey and preliminary regulatory review when only two-dimensional documentation is available.

1. Introduction

In architecture, engineering, construction (AEC), and real estate, the 2D floor plan remains a common medium for communicating spatial layouts. For existing buildings, raster floor plans (JPEG, PNG, and PDF scans) are often the only available documentation: BIM or IFC models [1] may never have been created, or may be outdated relative to as-built conditions. In this setting, pixel-based reconstruction from 2D images is a practical entry point for area estimation, inventory extraction, and preliminary compliance screening, tasks that cannot be delegated to BIM-native workflows when no digital model exists. These diagrams encode geometric and semantic information, including room dimensions, wall layout, and furniture placement. However, automated extraction from unstructured images remains challenging because of variability in drawing styles, scan noise, and densely packed symbols.
Historically, floor plan understanding relied on traditional image processing and rule-based methods. Techniques such as edge detection, Hough transforms, and morphological operations were used to detect lines and infer wall structures [2]. These approaches work reasonably on standardized CAD exports but degrade on hand-drawn sketches or noisy scans.
Convolutional Neural Networks (CNNs) [3] have improved document image analysis substantially. Object detectors such as YOLO [4] localize discrete symbols efficiently, while encoder–decoder networks such as U-Net [5] support pixel-level segmentation. Much prior work treats detection and segmentation separately and does not integrate them into a pipeline that yields calibrated physical metrics (e.g., room areas in square meters) for legacy documentation workflows.
Accordingly, this paper targets the digitization and assessment of existing building stock from raster floor plans. We combine object detection, semantic segmentation, scale-based area calculation, and LLM-based compliance screening [6,7] in a single pipeline accessible through a web interface [8]. The LLM module does not replace BIM-native code checking; it provides interpretive, document-grounded feedback on extracted metrics when only 2D plans are available (e.g., property survey, renovation feasibility review, or preliminary screening before detailed architectural review).
The primary contributions are:
  • A hybrid vision pipeline using YOLOv8 [9] for 18-class symbol detection and a ResNet34-backed U-Net [5,10] for wall and room segmentation.
  • Dual augmentation workflows applied after plan-level splitting: deterministic flip/rotation for detection labels, and Albumentations-based [11] offline image–mask expansion for segmentation, with label-aligned transforms in both cases.
  • A user-interactive scale-calibration module (Streamlit [8] sidebar) that converts segmentation masks into m2 estimates conditional on operator-supplied reference dimensions, not independent blueprint verification.
  • Integration of a local LLM via Ollama [12] with a RAG pipeline [7] to support compliance-oriented assessment of existing layouts from structured vision outputs, with documented knowledge-base sources.
  • Deployment in a Streamlit web application [8] for upload, visualization, reporting, and advisory LLM output.
  • Baseline and cross-dataset evaluation: in-domain comparison with DeepLabv3+ [13] and Faster R-CNN [14] under matched data splits and evaluation protocols, and fine-tuning experiments on CubiCasa5K [15].
The remainder of this paper is organized as follows: Section 2 reviews related work; Section 3 describes methodology; Section 4 reports experiments; Section 5 discusses findings; and Section 6 concludes.

2. Related Work

2.1. Traditional Floor Plan Analysis

Early work focused on vectorization and symbol recognition via low-level processing. Macé et al. used Hough transforms for wall detection and template matching for openings; similar rule-based pipelines remain sensitive to line thickness and drawing conventions [2].

2.2. Deep Learning for Architectural Symbol Detection

Deep learning improved symbol detection robustness. Faster R-CNN [14] achieves high accuracy but slower inference; single-stage detectors such as YOLO [4] are widely used for densely annotated plan symbols with varying aspect ratios.

2.3. Semantic Segmentation of Floor Plans

Room topology extraction requires pixel-level segmentation. DeepLabv3+ [13] captures multi-scale context via ASPP; U-Net [5] is frequently adopted for floor plans because skip connections help preserve thin wall boundaries. Public datasets such as CubiCasa5K [15] and layout-centric corpora such as RPLAN [16] support cross-style evaluation, although this study uses CubiCasa5K for cross-dataset fine-tuning only (Section 4.2) and does not fine-tune on RPLAN.

2.4. Large Language Models in Architectural Workflows

LLMs [6] enable natural-language reasoning in specialized domains, but AEC applications face privacy constraints and weak grounding in local codes. RAG [7] supplies external verified context and can reduce unsupported statements, though it does not eliminate the need for professional review. Few prior systems connect raster floor plan extraction to LLM-based assessment of existing layouts; most BIM-oriented code-checking assumes structured models rather than pixel reconstruction.

3. Methodology

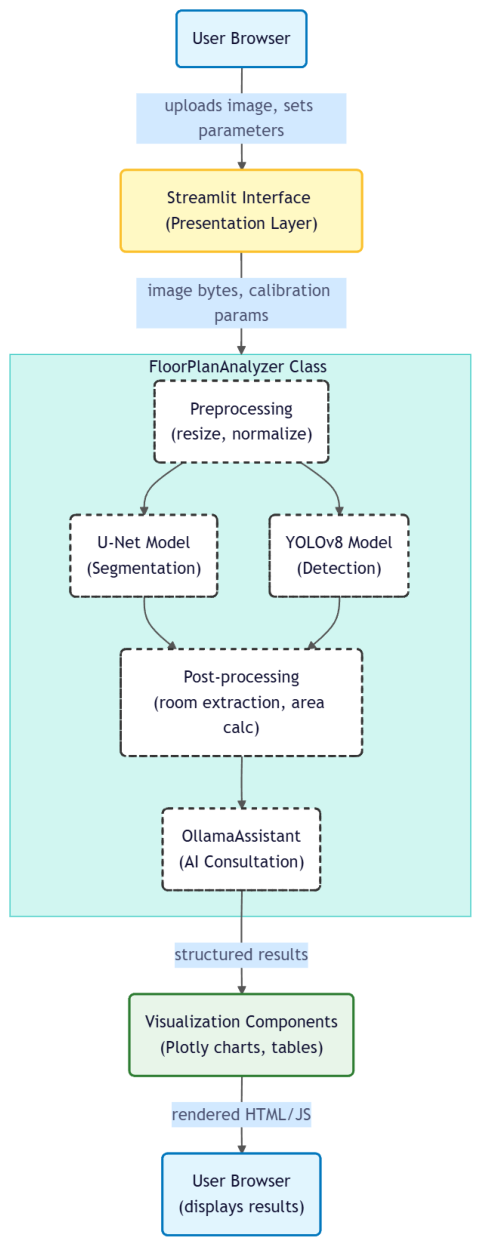
Our system comprises four modules: (1) object detection, (2) semantic segmentation, (3) scale-based area calculation, and (4) LLM-based compliance assessment. Figure 1 summarizes the workflow.

3.1. Dataset Preparation and Augmentation Strategy

We curated 101 unique high-resolution raster floor plan images with dual annotations:
  • Detection labels: LabelImg [17] bounding boxes for 18 classes (e.g., door, window, bed, dining table, sofa, TV, cupboard, toilet, washbasin, washing machine, and air condition), stored in YOLO format [4,9].
  • Segmentation labels: LabelMe [18] polygons for wall and room, converted to categorical masks via a custom script.
Corpus characteristics. The 101 source plans are high-resolution residential-style raster layouts with orthogonal walls and standard furniture symbols (1–10 rooms per plan; image widths roughly 200–2000 px). They reflect common modern apartment/house conventions used in our annotation workflow but are not stratified by country, building era, or drawing author. Hand-drawn sketches, non-orthogonal layouts, and commercial/industrial plans are under-represented. We therefore treat in-domain metrics as strong within this style family only; CubiCasa5K fine-tuning (Section 4.2) partially probes transfer to a public benchmark but does not substitute for broader geographic or typological coverage.
Plan-level splitting. Before augmentation, the 101 source plans are partitioned into training (81 plans, 80%), validation (10 plans, 10%), and test (10 plans, 10%) using random seed 42. All augmented variants of a given source plan inherit its split assignment, so no flipped or rotated copy of a test plan appears in training.
Detection and segmentation follow different augmentation workflows suited to their label formats (bounding boxes vs. pixel masks).

3.1.1. Detection Augmentation (Label-Aligned Geometric Transforms)

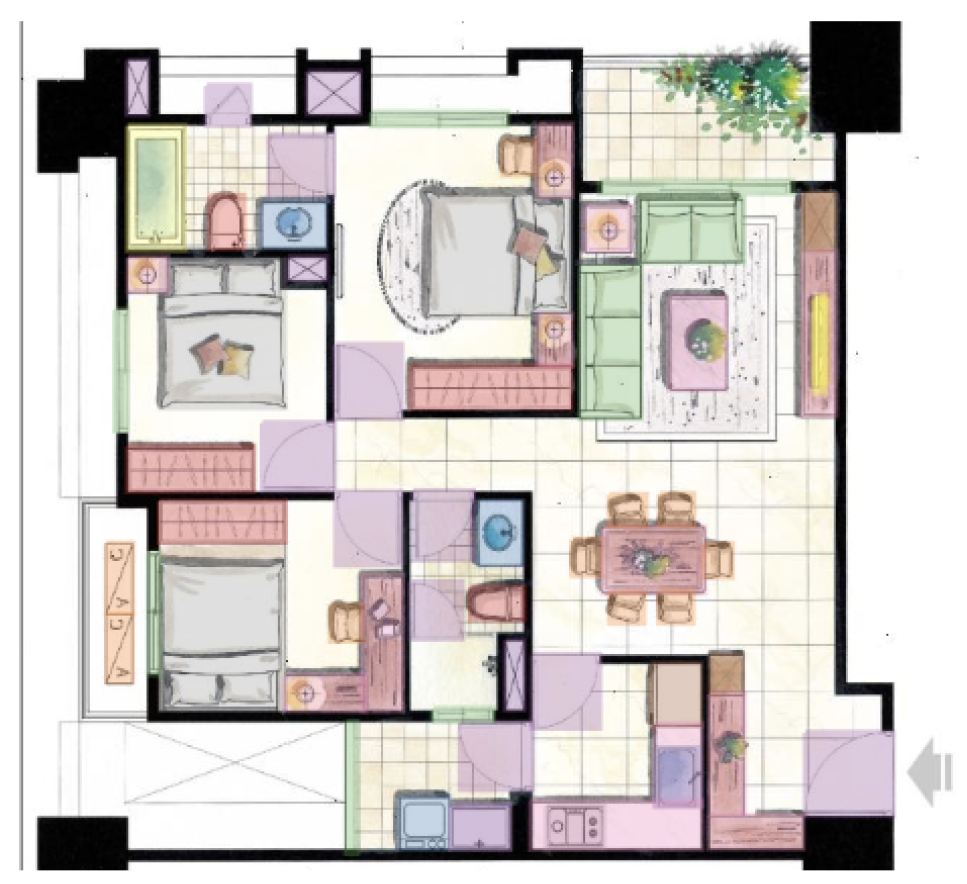
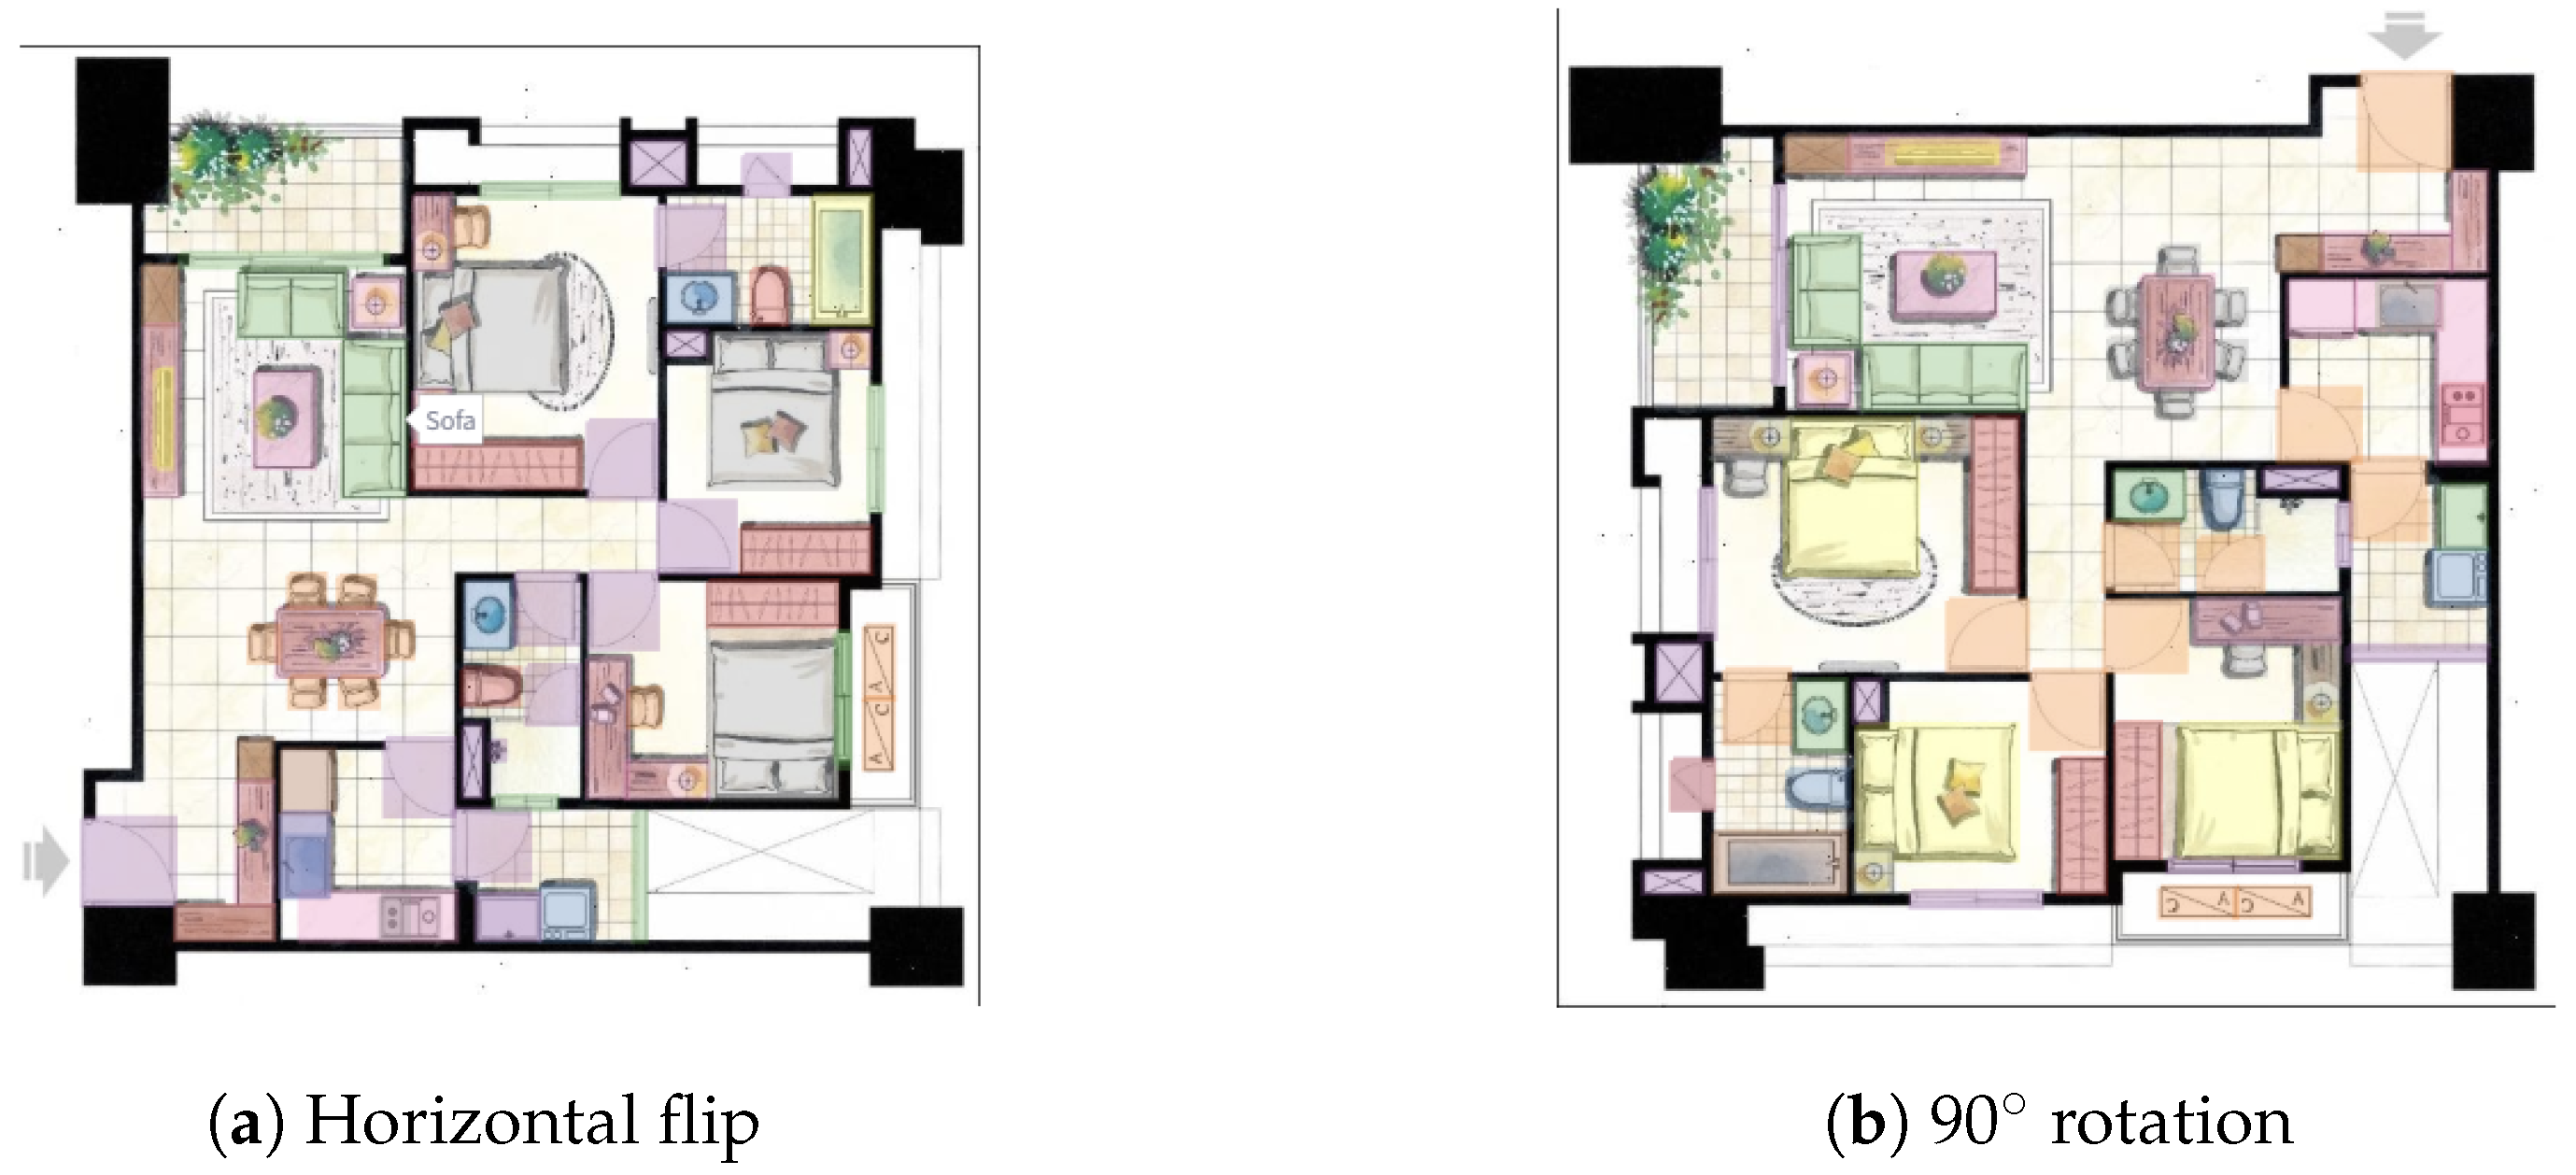
For each source plan within a split, we generated two deterministic variants: horizontal flip and 90° counter-clockwise rotation, with coordinate transforms applied to YOLO bounding boxes (Figure 2 and Figure 3). This yields up to 303 images (3 views × 101 plans), although statistical generalization claims rest on 101 independent source plans; augmented views are correlated training samples, not independent observations.

3.1.2. Segmentation Augmentation (Offline Albumentations Pipeline)

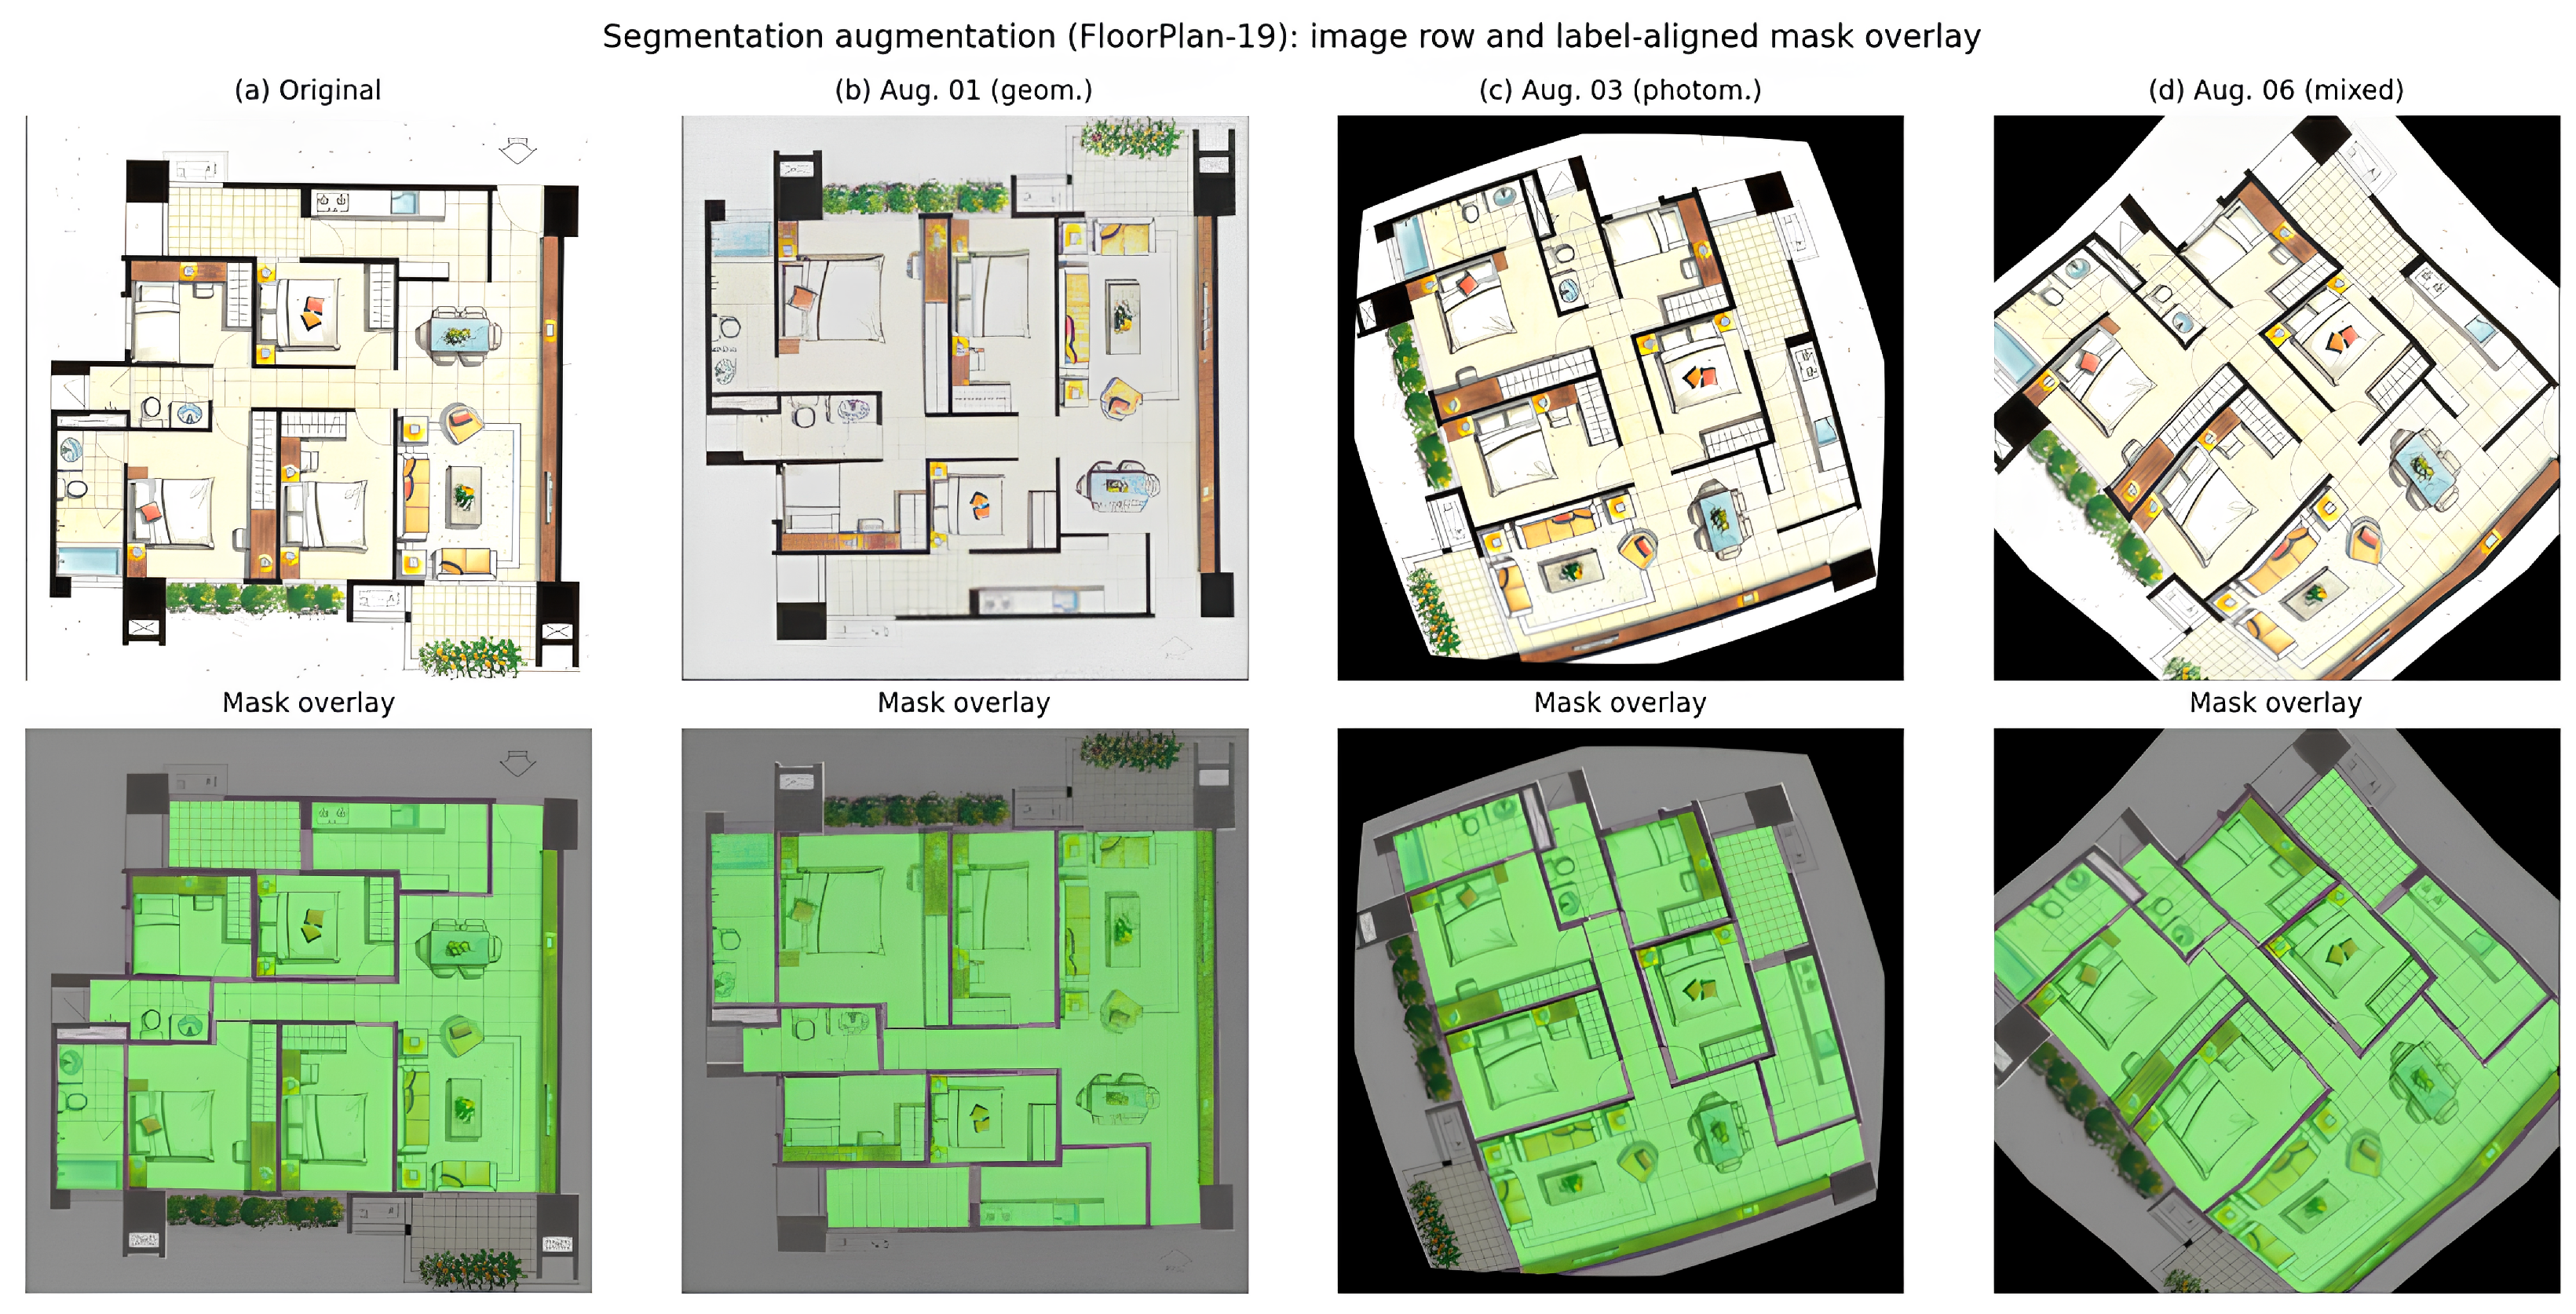
Segmentation requires joint transforms on image and mask so wall/room boundaries remain aligned. We pre-generate augmented pairs offline with an Albumentations pipeline [11] (project script: augment_segmentation_data.py) and store them in the offline segmentation-augmented corpus (segmentation_augmented/, with paired images/ and masks/ subfolders). For each annotated source plan, the script retains the original image–mask pair and synthesizes multiple stochastic variants; outputs append suffixes _aug01_aug10 to the source filename stem.
Each augmentation sample applies a composed pipeline (Table 1, Figure 4): (1) one mandatory geometric transform (horizontal flip, vertical flip, or rotation by 90°/180°/270°); (2) with probability 0.5, one elastic/grid/optical distortion to mimic scan warping; (3) with probability 0.7, photometric adjustment (brightness/contrast, gamma, or CLAHE); and (4) with probability 0.5, noise or blur to simulate low-quality scans. All operators use Albumentations’ dual image/mask interface so polygon-derived labels stay pixel aligned.
During U-Net training, additional online augmentation (resize to 384 × 384, random horizontal flip, ±15° rotation, mild brightness/contrast) is applied on the fly. The offline segmentation-augmented corpus supports segmentation baseline comparison (Section 4.2) where a fixed, reproducible image–mask set is required.

3.2. Furniture and Fixture Detection Module

We use YOLOv8-nano [9] for a practical speed–accuracy trade-off. Training combines distribution focal loss (DFL), complete IoU (CIoU), and binary cross-entropy (BCE) objectives as defined in the Ultralytics YOLOv8 training framework [9].

3.3. Room and Wall Segmentation Module

Wall and room extraction uses U-Net [5] with a ResNet34 encoder [10] pretrained on ImageNet [19]. To address class imbalance, we optimize a combined cross-entropy and Dice loss [20]:
L o s s t o t a l = α L C E + β L D i c e
with fixed weights α = β = 0.5 (equal contribution of pixel classification and region overlap), set empirically at the start of training and kept unchanged; no hyperparameter search over α or β is performed.
Detection vs. segmentation roles for walls. The loadbearing_wall detection class marks symbolically drawn structural wall segments as discrete objects for inventory and downstream LLM context (Section 4.3). Continuous wall topology and room envelopes are derived from the U-Net segmentation mask (classes wall and room), which drives area calculation. The two outputs are complementary: detection supports fixture-level counts; segmentation supports metric extraction. They are not merged into a single geometric representation.

3.4. Real-World Area Calculation Algorithm

Raster floor plans generally lack reliable embedded scale metadata. Absolute areas are therefore not inferred automatically from pixels alone; they depend on operator-controlled scale calibration in the web application (Settings sidebar).
The user sets Reference Length (pixels) and Actual Length (cm), for example by matching a door opening to a nominal 90 cm leaf, or by iteratively adjusting both fields until displayed room totals align with a trusted external figure (lease schedule, manual takeoff, or site measurement). Changing the scale directly changes the reported m2 values; this is intentional workflow behavior, not post hoc correction of a fixed absolute measurement.
With pixel length D p i x e l and physical length D r e a l ,
S f = D r e a l D p i x e l ( meters per pixel )
The predicted room mask is decomposed via connected-component labeling [21]; room i area is
A r e a r e a l , i = N i × ( S f ) 2 ( square meters )
Reported areas are calibrated estimates: they reflect the chosen reference scale together with U-Net segmentation. This study does not validate absolute m2 against independent blueprint drawings; Section 4.5 evaluates internal consistency and calibration sensitivity instead. Relative room proportions and rankings remain meaningful even when absolute scale is uncertain; absolute m2 values require a trustworthy reference dimension or external check. Automated scale-bar or OCR-based calibration is not implemented in the current system (Section 6).

3.5. LLM-Integrated Compliance Assessment and RAG Pipeline

Rather than generative co-design, the LLM module supports the assessment of existing layouts: it consumes JSON-serialized vision outputs (room areas, furniture counts, and adjacency) and produces readable compliance-oriented commentary for surveyors or owners when BIM-based rule engines are unavailable.

3.5.1. Local Deployment via Ollama

Open-source models (e.g., Qwen2.5 [22]) run locally via Ollama [12] so sensitive plan data need not leave the deployment environment.

3.5.2. Retrieval-Augmented Generation (RAG)

A ChromaDB [23] vector store holds embedded excerpts from documented sources (Table 2). At inference, the system retrieves passages relevant to detected conditions (e.g., a room below the GB 50096-2011 double-bedroom usable-area minimum of 9 m2, such as Room 8 at 3.49 m2 in the demonstration plan) and injects them into the prompt following the RAG paradigm [7].
The 9 m2 threshold used in screening refers to the minimum usable area of a double bedroom in GB 50096-2011 (Code for design of residential buildings), Clause 5.2.1(1) [24]. Retrieved excerpts also include the 5 m2 single-bedroom minimum (Clause 5.2.1(2)). Thresholds are applied for preliminary screening only when room use is supplied or inferred; local codes and licensed review take precedence.

4. Experiments and Results

4.1. Experimental Setup

Models were implemented in PyTorch [25]. Split protocol. Detection and segmentation on the custom corpus follow the plan-level split in Section 3.1: 81/10/10 source plans for train/validation/test (243/30/30 augmented images after flip/rotation). Augmented variants never cross partitions; metrics are therefore computed on held-out source plans, not on augmented views of training plans.
Which split is reported. All quantitative tables in Section 4.2 and Section 4.3 report the validation split (10 source plans). The held-out test split (10 source plans) is reserved for qualitative system demonstration in Section 4.8 and is not used for headline mAP or mIoU claims, given the limited number of independent test scenes.
For the segmentation baseline comparison in Section 4.2, image–mask pairs from the offline segmentation-augmented corpus (Section 3.1.2) are split at the source-plan level (85%/15%, seed 42) using compare_segmentation_baselines.py, ensuring that augmented variants of the same plan remain in one split.
YOLOv8 was trained for 100 epochs (SGD, lr = 0.01, batch size 8). U-Net was trained for 100 epochs (AdamW [26], lr = 0.001) with ReduceLROnPlateau (factor 0.5, patience 10) and early stopping.
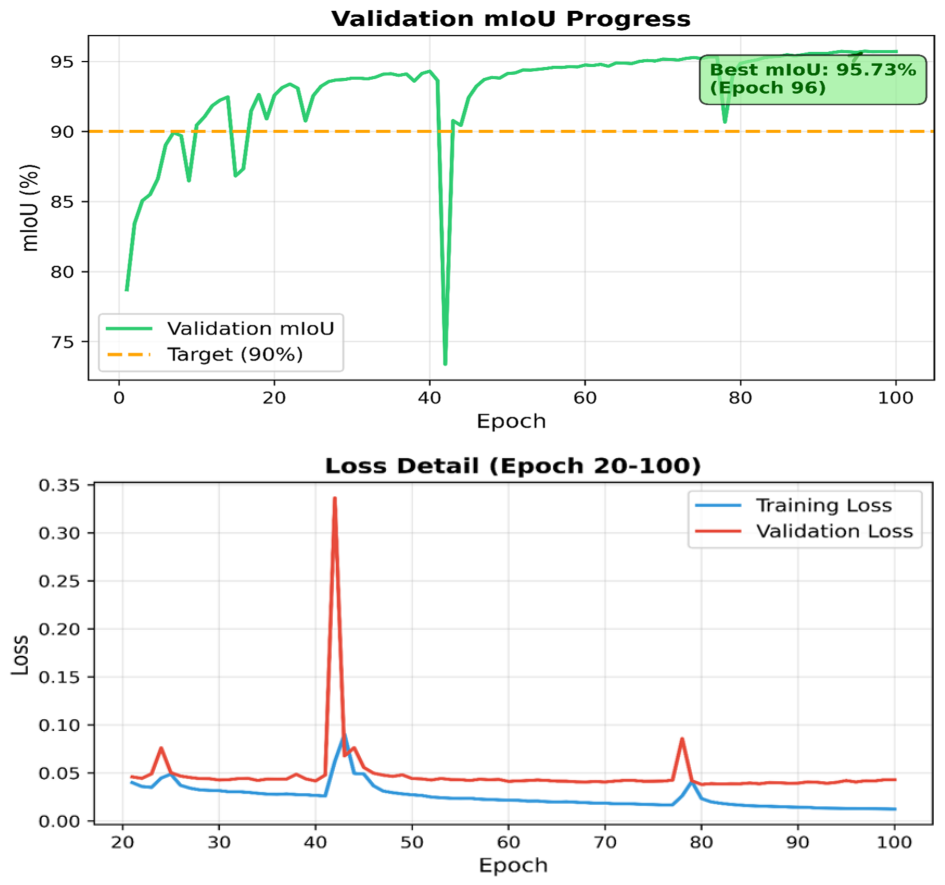
Baseline models were trained on matched data splits, input resolution (640 × 640 detection; 384 × 384 segmentation), and evaluation protocols: mAP50/mAP50-95 for detection [27]; mean IoU for segmentation. Detection baselines intentionally differ in optimization budget and initialization (Table 3, note); segmentation baselines share epoch count and encoder family. The deployed web application loads the U-Net checkpoint from epoch 100 (validation mIoU 95.71%), not the epoch-96 peak (95.73%), to keep training and deployment consistent with the final reported epoch.

4.2. Baseline and Comparative Evaluation

To contextualize performance, we report (1) in-domain architecture comparison on the custom corpus and (2) cross-dataset evaluation on CubiCasa5K [15].

4.2.1. In-Domain Architecture Comparison

We compare against DeepLabv3+ [13] and Faster R-CNN [14] using the same training pipeline (segmentation_models_pytorch [28] with ResNet34 encoder [10]; torchvision Faster R-CNN ResNet50-FPN [10,14]).
Table 3 and Table 4 summarize validation results. YOLOv8-nano reaches 92.3% mAP50 and 73.2% mAP50-95 versus 87.2% and 59.5% for Faster R-CNN. ResNet34 U-Net reaches 95.71% mIoU versus 93.2% for DeepLabv3+; wall IoU is 92.8% vs. 87.4%.

4.2.2. Cross-Dataset Evaluation on CubiCasa5K

U-Net and DeepLabv3+ [13] were fine-tuned on CubiCasa5K [15] with annotations mapped to our five-class schema. Table 5 reports test-split results. In-domain scores (95.71% mIoU, 92.3% mAP50) exceed CubiCasa5K fine-tuned values (82.4% mIoU), reflecting greater drawing-style diversity on the public benchmark.
On CubiCasa5K icon detection, fine-tuned YOLOv8-nano reached 71.3% mAP50 vs. 63.8% for Faster R-CNN, consistent with the in-domain trend [30].

4.3. Object Detection Performance

On the held-out validation split (Table 3), YOLOv8-nano achieved 92.3% mAP50, exceeding Faster R-CNN on the same split although training epochs and pretraining differ (Table 3, note). Per-class results appear in Table 6. Large, distinctive classes (bed, bathtub, and air conditioner) exceed 99% mAP50.
Failure-case analysis. Three classes underperform the overall average. TV shows the lowest recall (36.2%) and mAP50 (57.4%), likely because TV symbols are small, vary in aspect ratio across drawing styles, and sometimes overlap text or furniture. Window (72.1% mAP50) and Door (78.8% mAP50) are affected by partial occlusion at plan borders, inconsistent line weights, and confusion with wall openings. These errors mainly reduce furniture inventory completeness in the LLM context; they do not propagate to room areas, which rely on segmentation rather than symbol detection. Downstream area statistics (Section 4.5) therefore remain dominated by segmentation quality rather than TV/door/window detection gaps.

4.4. Semantic Segmentation Performance

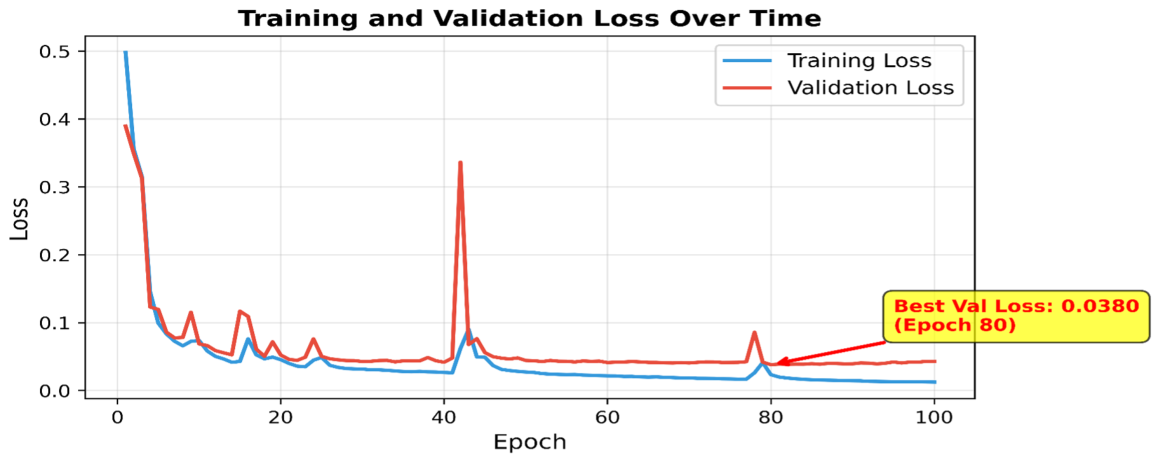
U-Net achieved 95.71% validation mIoU at epoch 100 (Table 4; training curves in Figure 5 and Figure 6), exceeding DeepLabv3+ by 2.5 percentage points. The best validation mIoU during training was 95.73% at epoch 96; the best validation loss was 0.0380 at epoch 80. We report epoch-100 mIoU as the primary result because it matches the deployed checkpoint and differs from the peak by only 0.02 percentage points; loss and mIoU therefore need not peak at the same epoch.
Table 7 reports per-class validation IoU on the same split. Background IoU is high (>98%) because background pixels dominate floor-plan images; wall IoU (92.8%) is the most informative indicator of thin-structure quality, while room IoU (96.2%) reflects enclosed region completeness. Mean mIoU averages all five training classes (including sparse door_area and window_area labels); area calculation in the web app uses the three-class deployment head (background, wall, room).
Training loss decreased from 0.4979 to 0.0124; validation loss decreased from 0.3895 to 0.0430 (best validation loss: 0.0380 at epoch 80).

4.5. Area Calculation and Calibration Behavior

Because no independent blueprint ground truth was available for absolute area benchmarking, evaluation focuses on behavior consistent with the interactive workflow in Section 3.4.
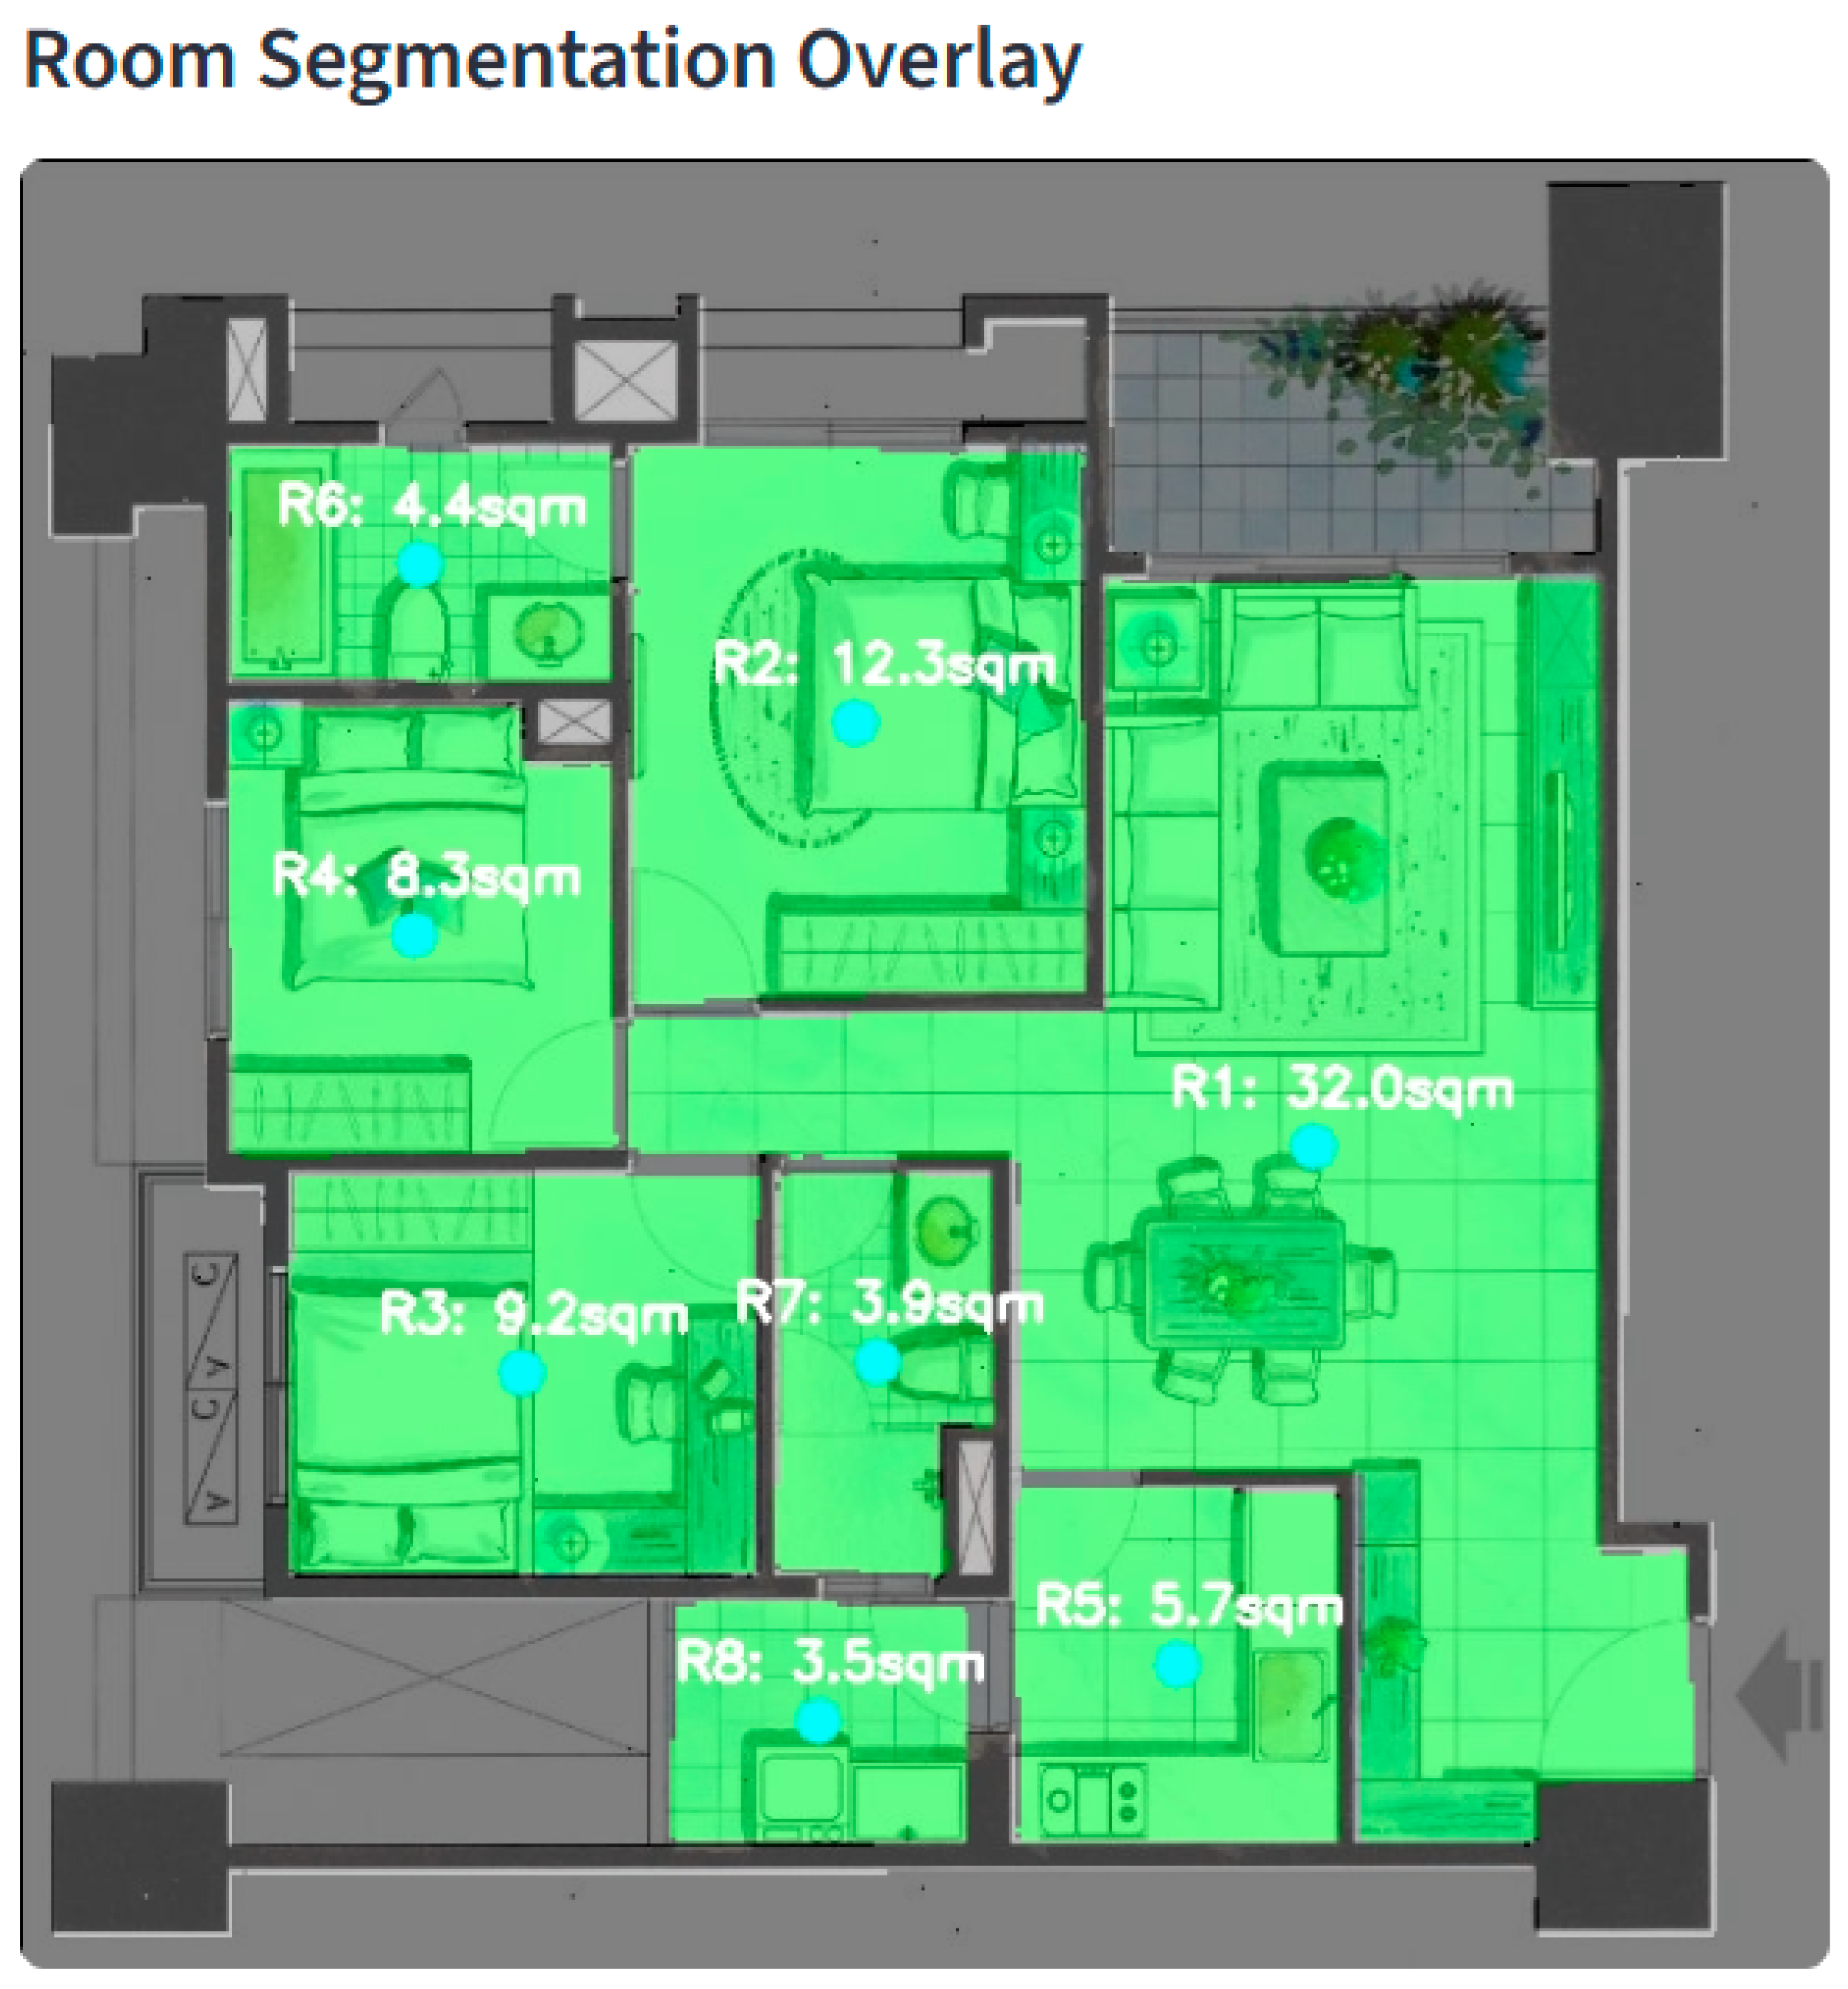
Interactive calibration (qualitative). The demonstration held-out test-split plan (Section 4.8) was analyzed in the Streamlit app [8] after the operator set reference pixels and actual length in the sidebar. The system reports eight segmented rooms with a total usable area of 79.23 m2 (largest room: 32.02 m2, 40.4% of total); per-room values are listed in Table 8 and match the sidebar readout once scale is calibrated. Individual room labels sum consistently with the aggregate total within segmentation tolerance. The integrated interface illustrates the end-user experience rather than agreement with an external as-built drawing.
Internal consistency. On test plans with manual segmentation masks, predicted room totals under a fixed reference (0.9 m door width) deviate from annotation-derived totals by less than 1% on average when batch-checked with our area-validation script (prediction vs. annotated mask under the same scale, not vs. blueprint).
Calibration sensitivity. Perturbing the reference length by ±5% changes total area by approximately ±10%, confirming that operator scale input dominates absolute m2 outputs while relative room proportions remain stable under uniform scale error.
Table 9 summarizes the scope of area evaluation reported in this study.

4.6. Evaluation of LLM Compliance Assessment

LLM assessment was evaluated through (i) a structured with/without-RAG ablation on five held-out test layouts and (ii) independent checklist review by two authors. Structured JSON from the vision pipeline was passed to Qwen2.5 [22] locally via Ollama [12]. Reviewers scored each output for: (a) whether cited area thresholds trace to retrieved documents in Table 2, and (b) whether unsupported regulatory claims appear. Disagreements were resolved by discussion.
Table 10 summarizes the pilot ablation. RAG improved document grounding for code thresholds but did not eliminate all unsupported statements in LLM-only runs. A standardized benchmark for automated code-violation detection (e.g., precision/recall against licensed reviewers) does not yet exist for raster floor plans; future work should report inter-rater agreement, violation-level accuracy, and hallucination rate on a larger held-out set. We therefore do not claim that RAG solves hallucination; it reduces unsupported threshold citations relative to the LLM-only condition in this pilot.
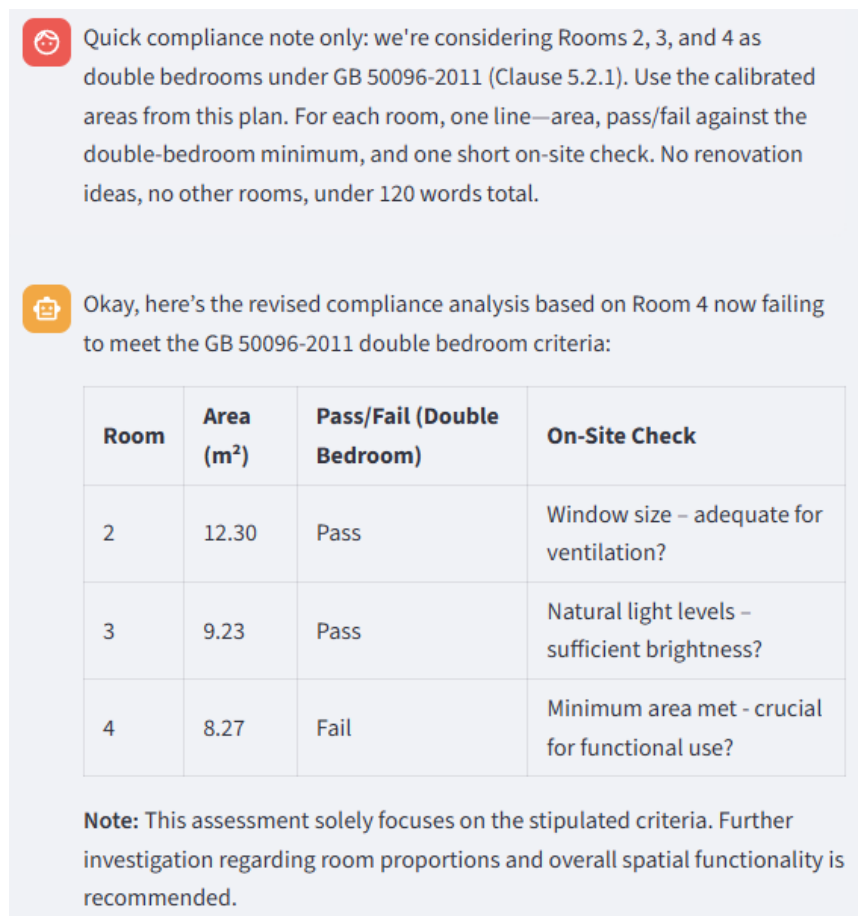
Section 4.8 illustrates compliance screening on the demonstration plan in Table 8. The operator asks whether Rooms 2–4 could serve as double bedrooms under the GB 50096-2011 minimum usable area of 9 m2 (Clause 5.2.1(1) [24]). Room 2 (12.30 m2) and Room 3 (9.23 m2) meet the threshold; Room 4 (8.27 m2) falls below 9 m2 and is flagged non-compliant. Suggestions remain feasibility notes (e.g., verifying room-use classification) rather than generative redesign; all outputs are advisory.

4.7. Computational Requirements and Inference Latency

Table 11 reports mean single-plan runtime on the development workstation (Intel Core i7-12700H, 16 GB RAM; NVIDIA RTX 3070 Ti laptop GPU when CUDA 12.3 is available). Vision inference (YOLOv8-nano + U-Net at 384 × 384) completes in under 2 s on CPU and under 0.5 s on GPU; the LLM module dominates end-to-end latency when enabled. Local Ollama deployment trades cloud convenience for data privacy: plans and extracted JSON never leave the machine, but users without GPU acceleration should expect longer LLM response times (tens of seconds to minutes on CPU for 4B-class models). Quantization, smaller models, or optional cloud APIs are practical optimizations left to deployment configuration.

4.8. System Integration and Qualitative Evaluation

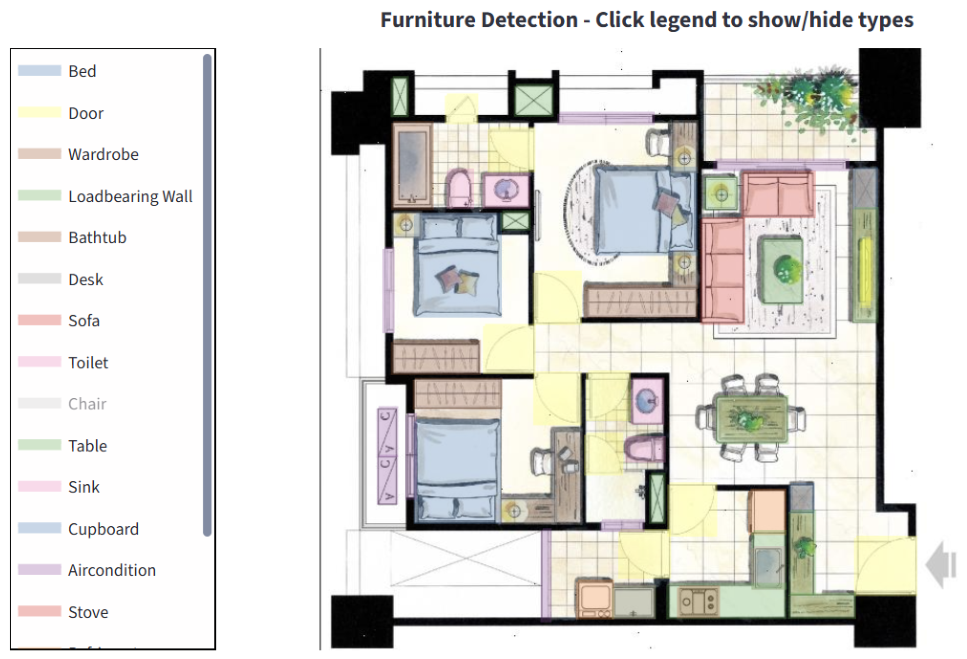
The trained models and LLM interface were integrated into a Streamlit application [8]. Figure 7, Figure 8 and Figure 9 show detection overlays (67 furniture and fixture instances on the demonstration plan), segmentation with consistent area reporting (79.23 m2 across eight rooms; Table 8), and LLM commentary on the same held-out test image.

5. Discussion

5.1. Interpretation of Results

The hybrid design separates discrete symbol inventory from continuous spatial parsing. On the validation split, YOLOv8-nano reached 92.3% mAP50 with sub-second inference (Table 11), supporting furniture counts fed to the LLM module. Failure cases concentrate on small or border-occluded symbols (TV, window, and door; Section 4.3), which affects inventory completeness but not room areas derived from segmentation. U-Net achieved 95.71% mIoU with wall IoU 92.8% (Table 7), indicating that thin wall boundaries—the main risk for area leakage—are captured adequately for calibrated m2 estimation within our drawing style.
Relative to published alternatives on the same validation split, U-Net outperformed DeepLabv3+ under matched segmentation settings (+2.5 points mIoU), while YOLOv8 exceeded Faster R-CNN in mAP50 (+5.1 points) on the same held-out plans. Because Faster R-CNN was trained for fewer epochs and without COCO detection pretraining (Table 3, note), the detection gap should be read as architecture plus training-budget advantage rather than a strictly controlled ablation. CubiCasa5K fine-tuning (82.4% mIoU vs. 95.71% in-domain) confirms that performance drops on more diverse public drawings, which is expected given our smaller, stylistically narrower corpus.
The LLM–RAG layer adds interpretive screening on top of structured vision outputs. The pilot ablation (Table 10) shows improved grounding of area thresholds when retrieval is enabled, but outputs still require human review. For legacy stock workflows, the practical contribution is an integrated path from raster upload to readable metrics and advisory commentary without cloud exposure of plan data.

5.2. Limitations and Scope

Dataset. Generalization rests on 101 residential-style source plans (Section 3.1); hand-drawn, non-orthogonal, or international conventions remain under-tested.
Scale and areas. Absolute m2 values depend on operator calibration (Section 3.4); the pipeline automates parsing and screening, not unsupervised metrology.
LLM assessment. Violation-level precision/recall against licensed reviewers was not measured at pilot scale (Section 4.6).
Compute. Interactive LLM queries benefit from GPU acceleration (Table 11); local deployment prioritizes privacy over minimum latency.
Scope. The system targets existing buildings documented only by 2D rasters; it does not replace BIM-native code checking where structured models exist.

6. Conclusions and Future Work

This study addressed digitization and preliminary compliance screening for existing buildings when only legacy raster floor plans are available. We integrated YOLOv8 symbol detection, ResNet34-U-Net wall/room segmentation, interactive scale calibration, and a locally deployed LLM with RAG into a single Streamlit workflow.
Main results. On the validation split (10 independent source plans), detection reached 92.3% mAP50 and segmentation 95.71% mIoU; U-Net exceeded DeepLabv3+ under matched segmentation training, while YOLOv8 exceeded Faster R-CNN on the same split with differing detection training budgets (Section 4.2). Cross-dataset fine-tuning on CubiCasa5K (82.4% mIoU) indicates reduced transfer to diverse public drawings. Vision inference completes in under 2 s on CPU (Table 11). A qualitative pilot LLM ablation ( n = 5 ; Table 10) showed that RAG improved citation of retrieved area thresholds relative to the LLM-only condition, but does not establish regulatory reliability or remove the need for professional review.
Significance and applicability. For property survey, renovation feasibility checks, and inventory extraction from scanned plans, the pipeline offers a practical alternative when BIM models are absent. It is not intended to replace licensed architectural review, blueprint quantity surveying, or BIM-native rule checking. Applicability is strongest for residential-style orthogonal plans similar to our corpus; broader drawing styles require further data and validation.
Outlook. Future work includes OCR-based scale-bar reading, corpus expansion across regions and styles, architect-in-the-loop violation metrics, RPLAN cross-evaluation [16], LLM quantization for lower latency, and optional export toward BIM—without claiming equivalence to native code-compliance engines.


Author Contributions

Conceptualization, S.-K.T.; Methodology, Y.G.; Software, Y.G.; Validation, Y.G. and X.Z.; Formal analysis, X.Z.; Investigation, X.Z. and S.-K.T.; Resources, Y.G.; Data curation, Y.G.; Writing—original draft, Y.G.; Writing—review and editing, Y.G. and S.-K.T.; Visualization, Y.G.; Supervision, S.-K.T.; Project administration, Y.G. and S.-K.T.; Funding acquisition, X.Z. All authors have read and agreed to the published version of the manuscript.

Funding

This research received no external funding.

Institutional Review Board Statement

Not applicable.

Informed Consent Statement

Not applicable.

Data Availability Statement

The annotated floor-plan dataset and trained model weights supporting this study are available from the corresponding author on reasonable request, subject to annotation licensing constraints. Demo application code is maintained in the project repository.

Acknowledgments

Generative AI tools (ChatGPT, https://chatgpt.com/, OpenAI, San Francisco, CA, USA, accessed 17 June 2025) were used for English language editing and code/documentation assistance; all technical claims, experimental numbers, and interpretations were verified by the authors. AI tools were not used to generate fabricated experimental results.

Conflicts of Interest

The authors declare no conflicts of interest. The funders had no role in the design of the study; in the collection, analyses, or interpretation of data; in the writing of the manuscript; or in the decision to publish the results.

References

  1. buildingSMART International. Industry Foundation Classes (IFC). 2021. Available online: https://www.buildingsmart.org/standards/bsi-standards/industry-foundation-classes/ (accessed on 17 June 2026).
  2. Macé, S. Floor Plan Analysis for Room Detection. In Proceedings of the 13th International Conference on Document Analysis and Recognition (ICDAR 2015), Nancy, France, 23–26 August 2015. [Google Scholar]
  3. LeCun, Y.; Bengio, Y.; Hinton, G. Deep Learning. Nature 2015, 521, 436–444. [Google Scholar] [CrossRef] [PubMed]
  4. Redmon, J.; Divvala, S.; Girshick, R.; Farhadi, A. You Only Look Once: Unified, Real-Time Object Detection. In Proceedings of the IEEE Conference on Computer Vision and Pattern Recognition, Las Vegas, NV, USA, 27–30 June 2016; pp. 779–788. [Google Scholar]
  5. Ronneberger, O.; Fischer, P.; Brox, T. U-Net: Convolutional Networks for Biomedical Image Segmentation. In Proceedings of the Medical Image Computing and Computer-Assisted Intervention, Munich, Germany, 5–9 October 2015; pp. 234–241. [Google Scholar]
  6. Brown, T.; Mann, B.; Ryder, N.; Subbiah, M.; Kaplan, J.D.; Dhariwal, P.; Neelakantan, A.; Shyam, P.; Sastry, G.; Askell, A.; et al. Language Models are Few-Shot Learners. In Proceedings of the Advances in Neural Information Processing Systems, Virtual, 6–12 December 2020; Volume 33, pp. 1877–1901. [Google Scholar]
  7. Lewis, P.; Perez, E.; Piktus, A.; Petroni, F.; Karpukhin, V.; Goyal, N.; Küttler, H.; Lewis, M.; Yih, W.t.; Rocktäschel, T.; et al. Retrieval-Augmented Generation for Knowledge-Intensive NLP Tasks. In Proceedings of the Advances in Neural Information Processing Systems, Virtual, 6–12 December 2020; Volume 33, pp. 9459–9474. [Google Scholar]
  8. Streamlit Inc. Streamlit: The Fastest Way to Build and Share Data Apps. 2019. Available online: https://streamlit.io (accessed on 17 June 2026).
  9. Jocher, G.; Chaurasia, A.; Qiu, J. Ultralytics YOLOv8. 2023. Available online: https://github.com/ultralytics/ultralytics (accessed on 17 June 2026).
  10. He, K.; Zhang, X.; Ren, S.; Sun, J. Deep Residual Learning for Image Recognition. In Proceedings of the IEEE Conference on Computer Vision and Pattern Recognition, Las Vegas, NV, USA, 27–30 June 2016; pp. 770–778. [Google Scholar]
  11. Buslaev, A.; Iglovikov, V.I.; Khvedchenya, E.; Parinov, A.; Durnov, D.; Kalinin, A. Albumentations: Fast and Flexible Image Augmentations. Information 2020, 11, 125. [Google Scholar] [CrossRef]
  12. Ollama. Ollama: Get Up and Running with Large Language Models Locally. 2024. Available online: https://ollama.com (accessed on 17 June 2026).
  13. Chen, L.C.; Zhu, Y.; Papandreou, G.; Schroff, F.; Adam, H. Encoder-Decoder with Atrous Separable Convolution for Semantic Image Segmentation. In Proceedings of the European Conference on Computer Vision (ECCV), Munich, Germany, 8–14 September 2018; pp. 801–818. [Google Scholar]
  14. Ren, S.; He, K.; Girshick, R.; Sun, J. Faster R-CNN: Towards Real-Time Object Detection with Region Proposal Networks. In Proceedings of the Advances in Neural Information Processing Systems, Montreal, QC, Canada, 7–12 December 2015; pp. 91–99. [Google Scholar]
  15. Kalervo, A.; Ylioinas, J.; Häikiö, M.; Karhu, A.; Kannala, J. CubiCasa5K: A Dataset and an Improved Multi-Task Model for Floorplan Image Analysis. arXiv 2019, arXiv:1904.01920. [Google Scholar]
  16. Wu, W.; Zhang, J.; Fu, X.; Arnold, M.; Shen, Z.; Liu, Y.; Zhang, S. Data-driven Interior Plan Generation for Residential Buildings. ACM Trans. Graph. 2019, 38, 234. [Google Scholar] [CrossRef]
  17. Lin, T. LabelImg: Graphical Image Annotation Tool. 2015. Available online: https://github.com/tzutalin/labelImg (accessed on 17 June 2026).
  18. Wada, K. Labelme: Image Polygonal Annotation with Python. 2018. Available online: https://github.com/wkentaro/labelme (accessed on 17 June 2026).
  19. Deng, J.; Dong, W.; Socher, R.; Li, L.J.; Li, K.; Fei-Fei, L. ImageNet: A Large-Scale Hierarchical Image Database. In Proceedings of the IEEE Conference on Computer Vision and Pattern Recognition, Miami, FL, USA, 20–25 June 2009; pp. 248–255. [Google Scholar]
  20. Milletari, F.; Navab, N.; Ahmadi, S.A. V-Net: Fully Convolutional Neural Networks for Volumetric Medical Image Segmentation. In Proceedings of the 2016 Fourth International Conference on 3D Vision (3DV), Stanford, CA, USA, 25–28 October 2016; pp. 565–571. [Google Scholar]
  21. Bradski, G. The OpenCV Library; Dr. Dobb’s Journal of Software Tools: San Francisco, CA, USA, 2000. [Google Scholar]
  22. Yang, A.; Yang, B.; Hui, B.; Zheng, B.; Yu, B.; Zhou, C.; Li, C.; Li, C.; Liu, D.; Huang, F. Qwen2 Technical Report. arXiv 2024, arXiv:2407.10671. [Google Scholar]
  23. Chroma. ChromaDB: The Open-Source Embedding Database. 2024. Available online: https://www.trychroma.com (accessed on 17 June 2026).
  24. GB 50096-2011; Code for Design of Residential Buildings. Ministry of Housing and Urban-Rural Development of the PRC: Beijing, China, 2011; Clause 5.2.1 Minimum Bedroom Usable Areas (Single ≥ 5 m2, Double ≥ 9 m2).
  25. Paszke, A.; Gross, S.; Massa, F.; Lerer, A.; Bradbury, J.; Chanan, G.; Killeen, T.; Lin, Z.; Gimelshein, N.; Antiga, L.; et al. PyTorch: An Imperative Style, High-Performance Deep Learning Library. In Proceedings of the Advances in Neural Information Processing Systems, Vancouver, BC, Canada, 8–14 December 2019; Volume 32. [Google Scholar]
  26. Loshchilov, I.; Hutter, F. Decoupled Weight Decay Regularization. In Proceedings of the International Conference on Learning Representations, New Orleans, LA, USA, 6–9 May 2019. [Google Scholar]
  27. Lin, T.Y.; Maire, M.; Belongie, S.; Hays, J.; Perona, P.; Ramanan, D.; Dollár, P.; Zitnick, C.L. Microsoft COCO: Common Objects in Context. In Proceedings of the European Conference on Computer Vision, Zurich, Switzerland, 6–12 September 2014; pp. 740–755. [Google Scholar]
  28. Yakubovskiy, P. Segmentation Models PyTorch. 2020. Available online: https://github.com/qubvel/segmentation_models.pytorch (accessed on 17 June 2026).
  29. Norrby, H.; Färm, G.; Hernandez-Diaz, K.; Alonso-Fernandez, F. FGSSNet: Feature-Guided Semantic Segmentation of Real World Floorplans. arXiv 2025, arXiv:2507.10343. [Google Scholar]
  30. Wei, C.; Gupta, M.; Czerniawski, T. Interoperability between Deep Neural Networks and 3D Architectural Modeling Software: Affordances of Detection and Segmentation. Buildings 2023, 13, 2336. [Google Scholar] [CrossRef]
Figure 1. System architecture for legacy floor plan analysis. YOLOv8 and U-Net extract symbols and regions; calibration converts masks to physical areas; a local LLM with RAG supports preliminary compliance screening of existing layouts.
Applsci 16 06290 g001
Figure 2. Original annotated floor plan used as the single source for augmentation.
Applsci 16 06290 g002
Figure 3. Label-aligned geometric transforms on bounding boxes.
Applsci 16 06290 g003
Figure 4. Segmentation augmentation (representative plan from the offline corpus): (top) row, augmented images; (bottom) row, label-aligned mask overlays (gray: wall; green: room). Stochastic sampling yields diverse geometric, photometric, and noise variants while preserving mask topology.
Applsci 16 06290 g004
Figure 5. Training and validation loss over 100 epochs (Figure 6 shows mIoU progression).
Applsci 16 06290 g005
Figure 6. Validation mIoU progression (top) and loss detail (bottom); best validation mIoU: 95.73% (epoch 96); final: 95.71% (epoch 100).
Applsci 16 06290 g006
Figure 7. YOLOv8 detection overlays on the demonstration held-out test plan (67 detected instances).
Applsci 16 06290 g007
Figure 8. U-Net segmentation (green: room; gray: wall) with per-room and total area (79.23 m2, eight rooms; Table 8) after user scale calibration in the sidebar. Per-room m2 values depend on the chosen reference scale; they are not independent blueprint measurements.
Applsci 16 06290 g008
Figure 9. LLM compliance screening (Ollama) for the demonstration plan (Table 8): Rooms 2–4 queried as candidate double bedrooms under GB 50096-2011 §5.2.1(1) (9 m2 minimum). Room 2 (12.30 m2) and Room 3 (9.23 m2) meet the threshold; Room 4 (8.27 m2) is below 9 m2 and flagged non-compliant.
Applsci 16 06290 g009
Table 1. Offline segmentation augmentation operators (Albumentations pipeline).
GroupProb.Operators (One Sampled per Group)
Geometric1.0HorizontalFlip, VerticalFlip, Rotate (±90°/180°/270°)
Warp/scan0.5ElasticTransform, GridDistortion, OpticalDistortion
Photometric0.7RandomBrightnessContrast, RandomGamma, CLAHE
Degradation0.5GaussNoise, GaussianBlur, MotionBlur
Table 2. Documented sources in the RAG knowledge base.
TopicSource/Citation
Minimum double-bedroom usable areaGB 50096-2011 [24], Clause 5.2.1(1): usable area ≥ 9 m2
Single-bedroom usable areaGB 50096-2011 [24], Clause 5.2.1(2): usable area ≥ 5 m2
General residential design principlesCurated excerpts from public residential design guidelines
Ergonomic clearances (doors, circulation)Summarized best-practice notes embedded for retrieval
Table 3. In-domain object detection comparison on the validation set (18 classes; matched split and metrics; training details differ—see note).
ModelmAP50 (%)mAP50-95 (%)Precision (%)Recall (%)
Faster R-CNN (ResNet50-FPN)87.259.567.665.7
YOLOv8-nano (Ours)92.373.292.987.5
Δ (Ours − Baseline)+5.1+13.7+25.3+21.8
Note: Both models were evaluated on the same held-out validation split with identical mAP protocol. Faster R-CNN (ResNet50-FPN): 30 epochs, ImageNet backbone weights only (no COCO detection pretraining). YOLOv8-nano: 100 epochs, COCO-pretrained detection weights. The comparison is therefore indicative of architecture choice under our project training budget rather than a strictly controlled ablation; Faster R-CNN mAP via torchmetrics. Bold rows indicate the proposed model.
Table 4. In-domain semantic segmentation comparison on the validation set (5 classes, matched split; 100 epochs; ResNet34 encoder).
ModelmIoU (%)Wall IoU (%)Room IoU (%)Val LossParams (M)
DeepLabv3+ (ResNet34)93.287.496.30.05126.7
U-Net (ResNet34, Ours)95.7192.896.20.04324.4
Δ (Ours − Baseline)+2.5+5.4−0.1
Note: Bold rows indicate the proposed model (Ours).
Table 5. Cross-dataset segmentation comparison on CubiCasa5K test split.
ModelmIoU (%)Source
U-Net (FGSSNet baseline) [29]78.2Published
DeepLabv3+ (ResNet50, fine-tuned)80.1This work
U-Net (ResNet34, fine-tuned, Ours)82.4This work
Multi-task CNN (CubiCasa5K) [15]83.6Published
Note: Bold rows indicate the proposed model (Ours).
Table 6. YOLOv8 object detection performance by class (validation set).
ClassPrecisionRecallmAP50 (%)
Door0.9700.73478.8
Window0.7570.64272.1
Table0.8340.91193.0
Chair0.9820.97498.5
Bed0.9791.00099.4
Sofa0.9150.96694.9
Toilet0.9780.93697.9
Sink0.9170.93294.9
Bathtub0.9881.00099.5
Stove0.9470.91397.0
Refrigerator0.9480.94695.8
Wardrobe0.9400.99998.3
TV0.8870.36257.4
Desk0.8980.93897.1
Washing Machine0.8910.90994.9
Load-bearing Wall0.9400.97097.2
Air Condition0.9751.00099.4
Cupboard0.9100.87094.5
Overall0.9290.87592.3
Table 7. U-Net per-class validation IoU (%, held-out validation split, epoch 100).
ClassIoU (%)Role in Pipeline
Background98.1Dominant class; high IoU expected
Wall92.8Thin structures; drives boundary quality
Room96.2Enclosed regions; drives m2 totals
Mean (5-class mIoU)95.71Includes sparse door/window-area training labels
Table 8. Per-room calibrated areas for the demonstration test plan (Section 4.8).
RoomLabelArea (m2)Share (%)
1Room 132.0240.40
2Room 212.3015.50
3Room 39.2311.60
4Room 48.2710.40
5Room 55.677.20
6Room 64.375.50
7Room 73.874.90
8Room 83.494.40
Total (8 rooms)79.23100.00
Table 9. Area evaluation scope in this study (no blueprint validation).
AspectWhat Is Reported
Absolute m2User-calibrated estimates from Web sidebar (Section 3.4); demo plan: 79.23 m2 (8 rooms, Table 8)
External blueprint MAPENot claimed; no independent drawing ground truth
Segmentation propagationPred. vs. annotated mask totals under identical calibration
Sensitivity±5% reference →  ± 10% total area
Table 10. Pilot LLM assessment ablation ( n = 5 held-out test layouts; qualitative checklist).
CriterionWith RAGWithout RAG
Threshold tied to retrieved source5/52/5
Unsupported regulatory claim observed0/53/5
Actionable room-metric reference5/55/5
Note: Checklist counts reflect dual-author review of five test-split layouts; this is a pilot ablation, not a formal inter-rater reliability study.
Table 11. Mean inference latency per floor plan (development hardware; single run, batch size 1).
ModuleCPU (s)GPU (s)
YOLOv8-nano detection0.310.08
U-Net segmentation0.500.10
Room/area post-processing0.020.02
Vision subtotal0.830.20
RAG retrieval (ChromaDB)0.30.3
LLM generation (Ollama; model-dependent)10–1202–15
Note: LLM times depend on model size (e.g., Qwen2.5, Gemma3) and hardware; values observed during web-app testing. Vision times averaged over 30 validation plans.
Disclaimer/Publisher’s Note: The statements, opinions and data contained in all publications are solely those of the individual author(s) and contributor(s) and not of MDPI and/or the editor(s). MDPI and/or the editor(s) disclaim responsibility for any injury to people or property resulting from any ideas, methods, instructions or products referred to in the content.