1. Introduction
Corrosion under insulation (CUI) is a localized corrosion phenomenon occurring on the external surface of metallic pipelines or equipment covered by insulation materials. It is widely encountered in oil, gas, chemical, and power industries, particularly in underground insulated pipelines. Due to long-term exposure to complex soil environments, insulation layers tend to retain moisture and facilitate the ingress of water, oxygen, and corrosive species once protective barriers degrade. This process leads to hidden and progressive material degradation, including wall thinning, pitting, and cracking.
For oil and gas pipelines operating under harsh conditions such as high pressure, temperature fluctuations, soil corrosion, and mechanical stress, these defects become particularly critical. Pipelines typically enter a high-incidence failure phase 15–20 years after commissioning, during which undetected defects may result in severe structural failure or leakage [
1,
2,
3]. Therefore, the development of reliable and non-destructive CUI monitoring techniques is essential for ensuring the safe operation of underground pipeline systems.
Conventional CUI detection methods, such as ultrasonic testing, radiographic inspection, infrared thermography, and eddy current techniques, can identify subsurface defects to some extent. However, their practical deployment in underground pipelines is often constrained by the need for insulation removal, high operational cost, limited accessibility, and sensitivity to environmental conditions. These limitations highlight the demand for non-contact, low-cost, and easily deployable sensing approaches for early defect identification.
Radio Frequency Identification (RFID) technology has emerged as a promising solution for pipeline inspection due to its non-contact sensing capability, low cost, and adaptability to complex environments. In addition to identification and tracking functions, RFID technology has also been widely explored in sensing and structural health monitoring applications because of its passive operation capability, low deployment cost, and suitability for long-term distributed monitoring [
4,
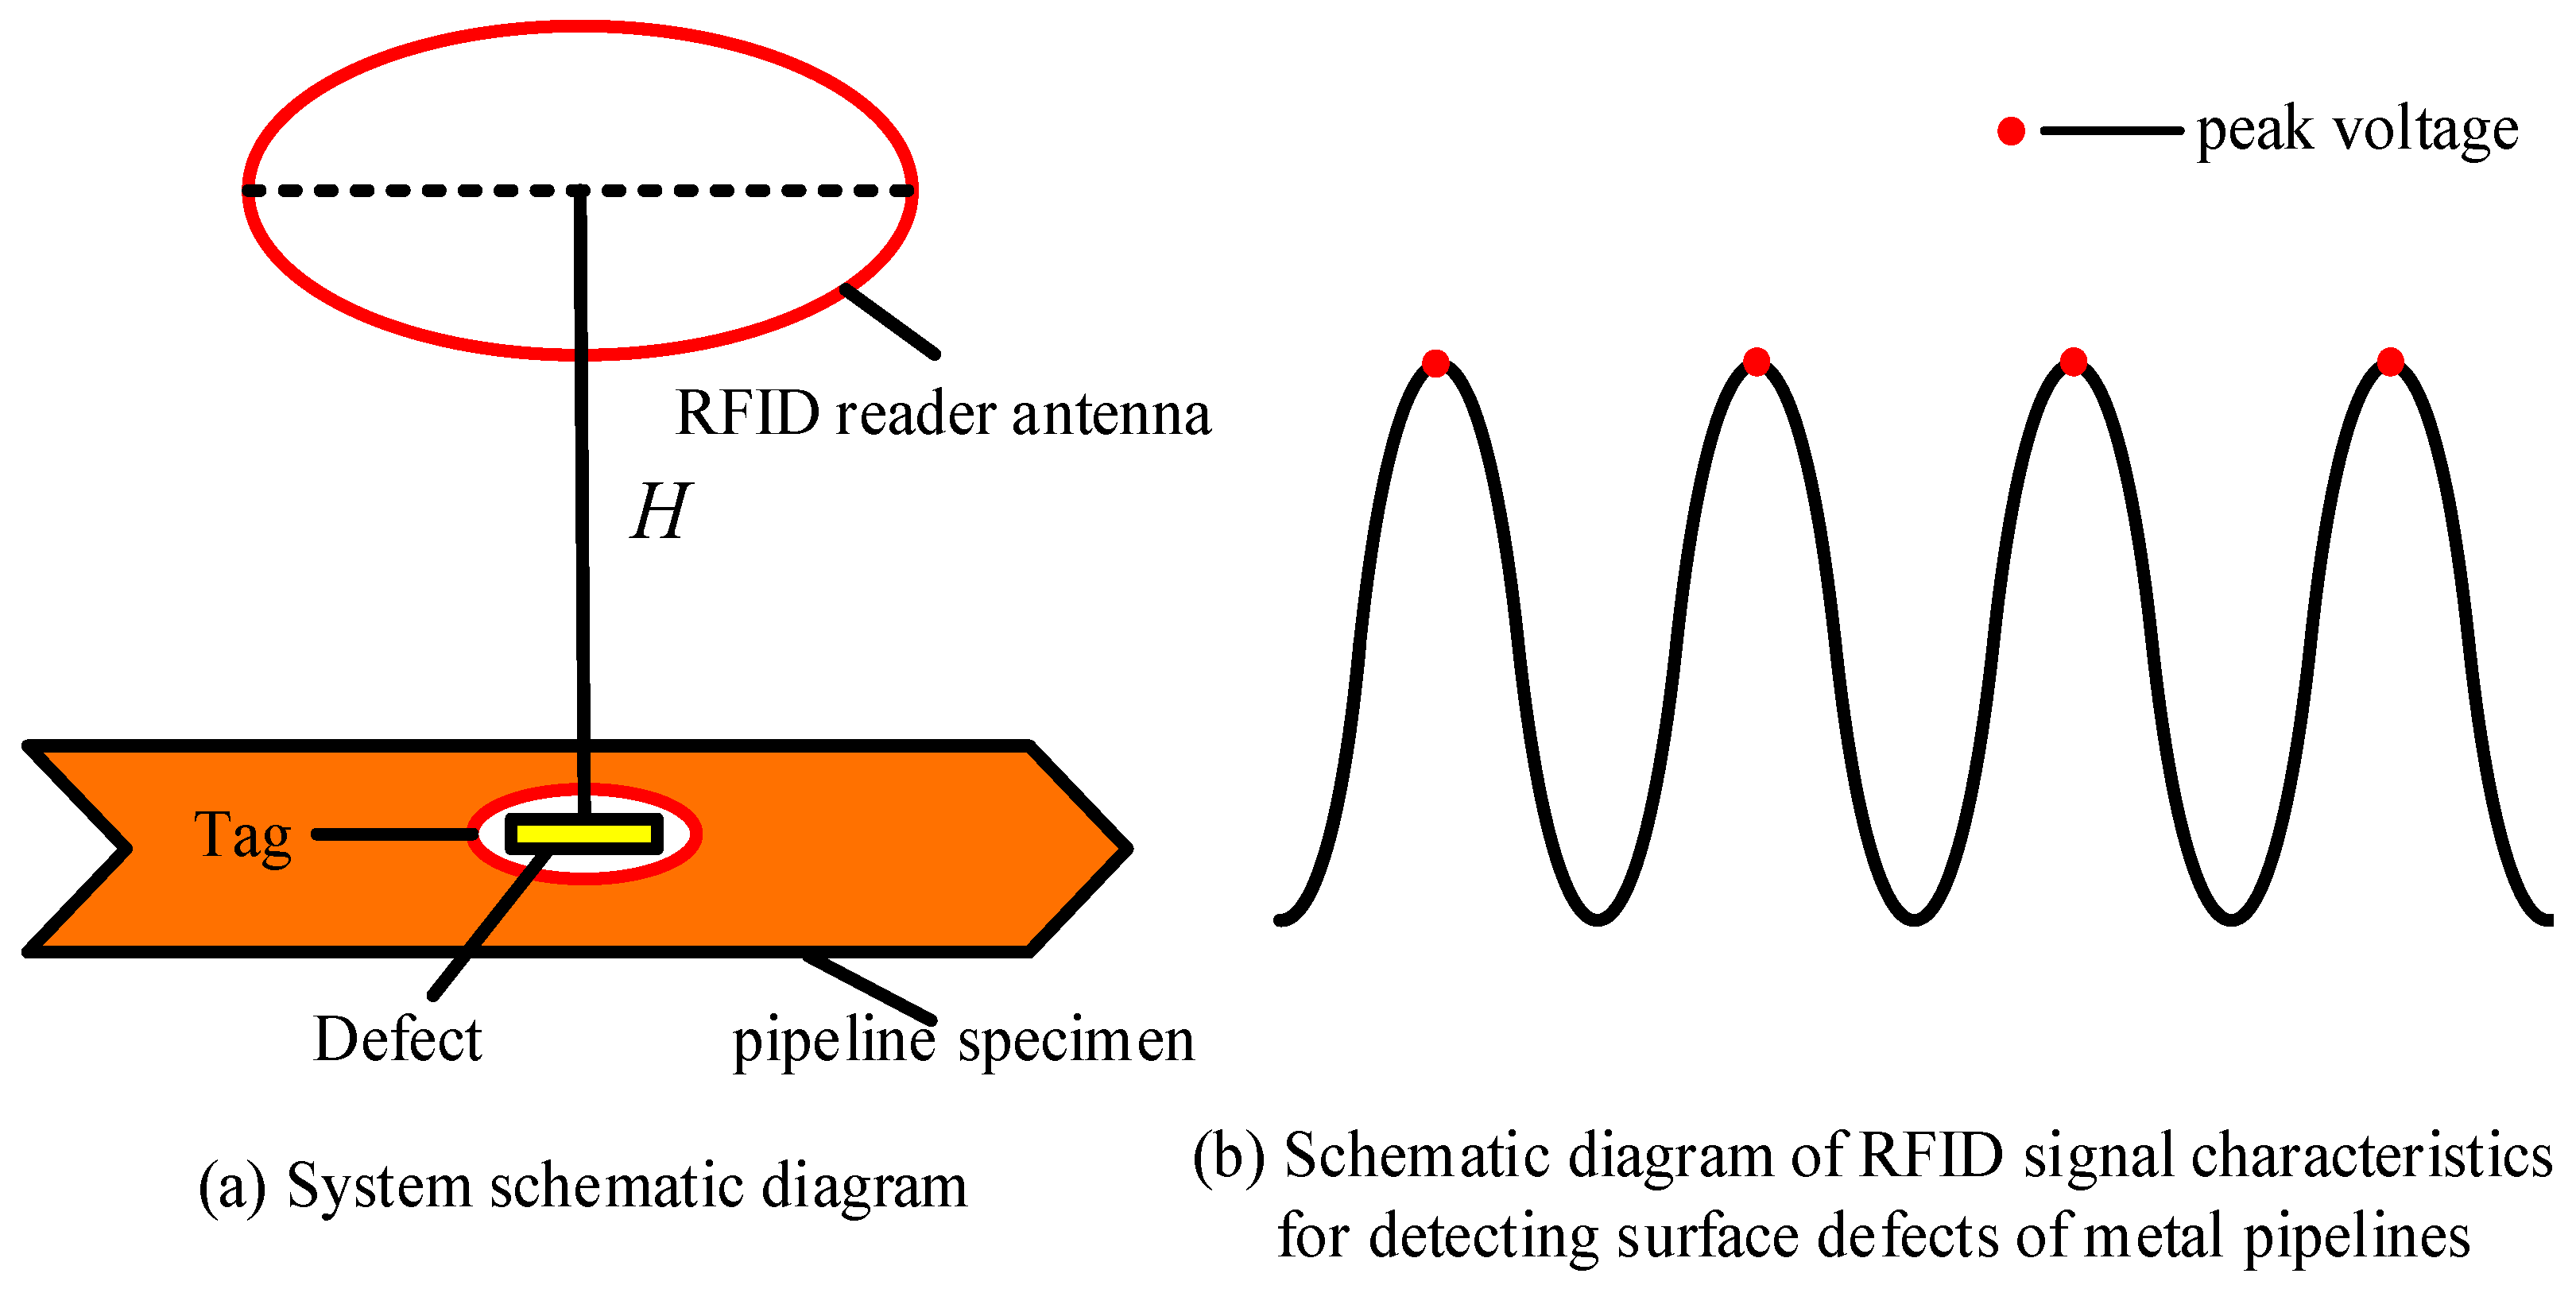
5]. Among various inspection techniques, RFID-based detection systems have gained increasing attention because of these advantages. A typical RFID inspection system consists of tags, readers, and antennas [
6], and its schematic diagram is shown in
Figure 1. When the reader emits an electromagnetic signal, the interaction between the tag coil and the surrounding conductive medium generates eddy currents and magnetic fields. The presence of defects alters the local electromagnetic properties, thereby disturbing the induced current distribution and affecting the backscattered signal received by the reader.
Compared with high-frequency RFID systems, low-frequency electromagnetic waves exhibit stronger penetration capability in lossy media such as soil, rock, and moisture-containing environments and are less sensitive to environmental variability, resulting in more stable propagation characteristics and improved communication reliability under underground conditions. Previous studies have demonstrated the feasibility of passive low-frequency RFID techniques for corrosion monitoring and pipeline integrity assessment under insulated and inaccessible environments [
7,
8,
9]. These characteristics make low-frequency RFID particularly suitable for detecting subsurface or early-stage defects in buried pipeline applications. In practical implementations, the transient response of RFID signals often exhibits quasi-sinusoidal characteristics, and the peak amplitude is closely correlated with defect severity, making it a critical feature for defect characterization and quantitative analysis [
10].
However, accurately extracting peak features from RFID signals in real-world environments remains a challenging task. The acquired signals are often contaminated by various types of noise, including high-frequency spike interference from electronic components, power frequency interference from surrounding equipment, and environmental electromagnetic disturbances. In addition, signal distortion caused by tag variability, installation inconsistency, and pipeline material heterogeneity further complicates the waveform characteristics. Conventional peak detection methods, such as the amplitude threshold method [
11] and the erosion signal method [
12], are typically designed under simplified assumptions of signal stability. The amplitude threshold method performs well under constant amplitude and periodic conditions but becomes highly sensitive to noise and waveform fluctuation, often leading to multiple false detections. In contrast, the erosion signal method suppresses noise-induced false peaks by discarding negative components, but at the expense of losing valid signal information, resulting in significant missed detections. These limitations highlight a fundamental trade-off between noise suppression and feature preservation in traditional time-domain approaches, making them inadequate for complex RFID-based inspection scenarios.
In recent years, significant efforts have been devoted to improving defect detection and signal processing techniques in RFID-based and related non-destructive testing (NDT) systems. Existing approaches can be broadly categorized into time-domain, frequency-domain, and time–frequency domain methods. Traditional time-domain approaches primarily rely on amplitude or statistical features; however, their performance is often degraded in the presence of non-stationary noise and signal distortion. Frequency-domain methods attempt to extract defect characteristics through spectral features, but they are sensitive to frequency resolution and often require strict signal stationarity assumptions.
To address these challenges, recent advances in signal processing have increasingly focused on time–frequency analysis techniques, particularly wavelet transforms. Wavelet transforms have been widely adopted for non-stationary signal analysis because of their capability to provide simultaneous time and frequency localization through multi-resolution representations [
13]. Unlike conventional methods, wavelet transforms can effectively separate noise from useful signal components across different frequency bands while preserving transient features. As a result, wavelet-based approaches have been widely explored in both RFID-related and broader sensing applications. For example, in chipless RFID systems, wavelet-based methods have been used to separate overlapping tag responses and enhance signal decoding accuracy under noisy conditions [
14,
15]. Similarly, in NDT applications such as eddy current inspection, DWT has been employed to decompose signals into multi-scale components, enabling effective isolation of defect-related features from noise [
16]. Recent developments in eddy current probe design and signal processing further demonstrate that combining advanced sensing structures with signal conditioning can significantly improve robustness against interference and lift-off effects [
16]. However, these approaches differ significantly in their applicability to RFID-based peak extraction under noisy underground environments. In addition, magnetic memory-based pipeline inspection methods, widely studied in Russian research, detect defects by exploiting stress-induced magnetic anomalies in ferromagnetic materials without external excitation. While effective for identifying stress concentration zones, their performance depends on stable magnetic field measurements and is sensitive to environmental disturbances and material-specific properties. Therefore, such approaches are not directly aligned with RFID-based sensing mechanisms, which rely on electromagnetic coupling and signal propagation characteristics. Most existing studies primarily focus on signal denoising or feature extraction, while relatively limited attention has been paid to accurate peak localization and weak peak preservation under strong noise interference. Beyond these domains, wavelet-based techniques have also demonstrated strong robustness in industrial fault detection tasks, including power systems and chemical processes, further confirming their effectiveness in handling noise-contaminated and non-stationary signals [
17,
18]. To better position the proposed method, representative approaches are categorized and compared in
Table 1 according to their main characteristics.
The qualitative comparisons presented in
Table 1 are based on representative characteristics reported in the cited literature and general methodological properties rather than a unified experimental benchmark. As summarized in
Table 1, traditional time-domain methods exhibit limited robustness to noise and weak peak preservation capability. Although deep learning-based approaches offer superior feature extraction performance, their high computational cost limits real-time applicability. Wavelet-based methods improve noise suppression through multi-resolution analysis; however, most existing approaches do not explicitly address accurate peak localization under strong noise interference.
Motivated by these considerations, the primary technical challenge addressed in this work is to achieve robust peak extraction from RFID signals under non-stationary noise while preserving weak defect-related features. To address this challenge, this paper proposes a DWT-based peak detection algorithm for RFID-based CUI detection in underground pipelines. The proposed method employs db6/db8 wavelets for signal denoising and reconstruction, followed by precise peak localization using a derivative zero-crossing criterion. This design effectively suppresses noise while preserving critical signal characteristics, thereby improving the reliability of defect-related feature extraction under complex operating conditions. This study focuses on a signal processing approach for RFID-based CUI monitoring in buried pipelines, rather than a complete field-deployable diagnostic system. In addition, terrain variations and different types of external noise (e.g., transient and systematic interference) are not explicitly modeled in the current study and will be investigated in future work. The main contributions of this work are summarized as follows:
- (1)
A DWT-based denoising approach using db6 wavelets is proposed to enhance noise suppression through multi-resolution signal representation.
- (2)
A robust peak extraction scheme integrating wavelet-domain processing with derivative zero-crossing localization is proposed to improve weak peak detection accuracy while reducing false and missed detections.
The remainder of this paper is organized as follows.
Section 2 presents the proposed peak detection framework, including a review of traditional peak detection methods, the formulation of the problem within a hypothesis testing framework, and the introduction of the DWT using Mallat’s pyramid algorithm, followed by the detailed description of the improved peak extraction method.
Section 3 describes the experimental setup and presents the experimental validation results.
Section 4 concludes the paper and discusses future research directions.
2. Improved Peak Detection Algorithm
2.1. Traditional Peak Detection Algorithm
2.1.1. Amplitude Threshold Method
The amplitude threshold method is a classical peak detection approach that identifies peaks based on the amplitude characteristics of the signal. By imposing constraints on both global amplitude range and local extrema, candidate peak points can be effectively determined.
Let the acquired detection signal be denoted as
, where
. A candidate peak position
is required to satisfy:
where the threshold
is defined as:
As indicated by Equation (3), this method determines peak locations based on a combination of a global amplitude constraint and a local maximum criterion. The first condition limits the deviation between the candidate point and the global maximum, while the second ensures that the point is the maximum within a local window. Therefore, peak detection is entirely dependent on the amplitude distribution of the signal.
However, this method exhibits inherent limitations. On the one hand, the threshold , determined by global extrema, lacks adaptability when the signal amplitude varies or contains local fluctuations. On the other hand, since this method does not consider the signal variation trend, it is highly sensitive to noise, which may result in false detections caused by noise spikes or missed detections of true peaks.
2.1.2. Erosion Signal Method
To improve the robustness of amplitude-based peak detection, the erosion signal method introduces a nonlinear preprocessing step to suppress noise and enhance peak features. This method combines amplitude truncation with differential analysis to capture both magnitude and variation information of the signal.
Specifically, a nonlinear truncation operation is first applied to the original signal:
This operation removes negative components of the signal, thereby suppressing negative noise and baseline drift to a certain extent. Subsequently, a first-order difference is applied:
According to Equation (5), the derivative signal
characterizes the local rate of change of the signal. Regions where
exhibits significant variations correspond to points with steep slope transitions by applying a zero-crossing criterion defined as
From a mathematical perspective, this method combines nonlinear amplitude truncation with first-order differential analysis, thereby introducing information about signal variation trends and improving structural feature representation compared to purely amplitude-based methods.
Nevertheless, this method still suffers from several drawbacks. First, the truncation operation may discard useful signal components, leading to the loss of weak peaks. Second, the difference operation inherently acts as a high-pass filter, which amplifies high-frequency noise and may introduce spurious peaks in the derivative signal, thereby degrading the accuracy of zero-crossing-based peak localization.
From the above analysis, it can be observed that the amplitude threshold method primarily relies on amplitude constraints, whereas the erosion signal method introduces amplitude truncation and differential operations to incorporate signal variation information. Although the latter improves detection performance to some extent, both methods fundamentally operate within a single-scale time-domain framework and rely on heuristic criteria, making them highly sensitive to noise. In particular, under non-stationary noise conditions, these approaches fail to effectively distinguish between noise-induced fluctuations and defect-related signal components, leading to false or missed detections. Therefore, while peak detection is fundamentally a local extremum identification task, its performance under noisy conditions can be more effectively analyzed by considering it as a discrimination problem between signal-related peaks and noise-induced fluctuations.
Motivated by this perspective, it is necessary to reformulate the peak detection problem within a more principled framework, so that the detection process can be explicitly characterized and systematically improved.
2.2. Hypothesis Testing Framework
The peak detection problem in RFID-based pipeline inspection can be formulated as a binary hypothesis testing problem. Let the discrete signal
,
, be modeled as
where
is the defect-induced transient (parameterized by defect features
), and
denotes additive, generally non-stationary noise arising from power-line interference, environmental EM disturbances, sensor noise, and tag variability.
The task is to decide between
and
and, under
, estimate peak location
and amplitude
. In classical detection theory, this is achieved by a test statistic
and threshold
:
In this work, is implicitly constructed in the wavelet domain. The Discrete Wavelet Transform (DWT) provides a multi-resolution representation in which transient features are sparsely captured by a few significant coefficients, while noise spreads across scales. Level-dependent thresholding suppresses small-magnitude (noise-dominated) coefficients, thereby improving the signal-to-noise ratio and the separability between and . The reconstructed signal thus approximates the underlying defect component.
Peak localization is then performed using a derivative-based zero-crossing rule:
which identifies local maxima (positive-to-negative slope transitions) while suppressing spurious detections. From a detection viewpoint, the method forms a two-stage detector: (i) wavelet-domain thresholding enhances the detection statistic; (ii) the zero-crossing condition acts as the decision rule for peak localization. This provides a principled basis for robust detection under non-stationary noise.
From this perspective, the effectiveness of peak detection depends critically on the construction of a suitable detection statistic that can enhance the separability between H0 and H1. In practical scenarios where the noise is non-stationary and overlaps with signal components in the time domain, traditional methods fail to provide such a discriminative representation.
Therefore, it is essential to adopt a signal representation that can separate signal and noise components across multiple scales. Time–frequency analysis techniques, particularly the Discrete Wavelet Transform (DWT), provide this capability and are thus well suited for constructing the detection statistic in the proposed framework.
2.3. Mallat’s Pyramid Algorithm
To implement the wavelet-domain representation established in
Section 2.2, the Discrete Wavelet Transform (DWT) is adopted as the core analytical tool. DWT-based denoising can be regarded as a filtering process; however, unlike conventional low-pass filters, it provides multi-resolution analysis capability, enabling the separation of noise and signal components across different frequency bands while preserving intrinsic signal characteristics. By integrating noise suppression with feature extraction, DWT offers superior performance in handling non-stationary and noise-contaminated signals, thereby providing a more robust foundation for accurate peak detection.
The signal is decomposed into lower-order components using Mallat’s pyramid algorithm [
19]. This algorithm employs wavelet filters to iteratively apply low-pass and high-pass filtering to the discrete signal. Each filtering operation yields one low-frequency signal and one high-frequency signal. The low-frequency signal is then subjected to further low-pass and high-pass filtering, thereby obtaining low-frequency and high-frequency signals at greater decomposition levels. Consequently, the result of applying the Discrete Wavelet Transform to a discrete signal comprises the high-frequency components from all decomposition levels and the low-frequency component from the final decomposition level.
High-frequency component:
In the above equations, and denote the approximation and detail coefficients at the -th decomposition level, respectively. The variables and are discrete sample indices with distinct roles in the computation. Specifically, represents the index of the input signal at level , corresponding to the sample position of the original or previously decomposed signal, and serves as the running index in the convolution operation. In contrast, denotes the index of the output coefficients at level after downsampling.
The notation refers to the -th sample of the input signal at level , while and represent the -th approximation and detail coefficients at level , respectively. The term appearing in expressions such as or reflects the dyadic downsampling operation inherent in the Mallat algorithm, indicating that the output is obtained by retaining every second sample after filtering. Accordingly, is associated with the full-resolution input signal, whereas corresponds to the reduced-resolution index after downsampling. Together, they characterize the convolution and subsampling mechanism of the discrete wavelet transform.
In this equation, denotes the reconstructed signal at level , obtained from the approximation and detail coefficients and at level . The filters and are the low-pass and high-pass synthesis filters, respectively, and the term reflects the upsampling operation during reconstruction.
The approximation coefficients capture the overall contour of the signal, while the detail coefficients preserve local variations and sharp features. Their combination enables accurate reconstruction and maintains the essential characteristics of the original signal.
At each scale, the Mallat algorithm decomposes the signal into an approximation component and a detail component. The approximation component represents the high-scale, low-frequency information of the signal, while the detail component corresponds to the low-scale, high-frequency information. For a signal containing noise, the primary energy of the noise component is concentrated within the detail components of the wavelet decomposition. Subsequent threshold quantization is applied to eliminate these high-frequency noises. Reconstruction of the processed signal then effectively preserves the peak characteristics of the RFID signal, thereby establishing a foundation for accurate peak extraction.
2.4. The Improved Algorithm
The proposed DWT-based peak extraction framework consists of five main stages, integrating wavelet-domain denoising with derivative-based peak localization.
First, the RFID-based pipeline surface defect detection signal is decomposed using the Discrete Wavelet Transform (DWT), where an appropriate wavelet basis and decomposition level are selected according to the signal characteristics. This step enables a multi-scale representation of the signal, separating low-frequency trends from high-frequency components.
Then, threshold quantization is applied to the high-frequency (detail) coefficients at each decomposition level. Coefficients with magnitudes below a predefined threshold are attenuated or set to zero, effectively suppressing noise-dominated components while preserving significant features associated with defect-induced peaks.
Next, the signal is reconstructed from the processed wavelet coefficients. The reconstructed signal retains the main structural characteristics of the original waveform, including peak amplitude and shape, while significantly reducing noise interference.
Subsequently, a nonlinear truncation (erosion) operation is applied by removing signal components below zero, followed by a first-order difference operation. This process eliminates baseline drift and enhances regions with rapid amplitude variation, thereby highlighting potential peak locations.
Finally, peak positions are determined using a zero-crossing criterion on the derivative signal. Specifically, points where the derivative changes from positive to negative are identified as candidate peaks, and these locations are mapped back to the reconstructed signal to obtain the final peak positions and corresponding amplitudes.
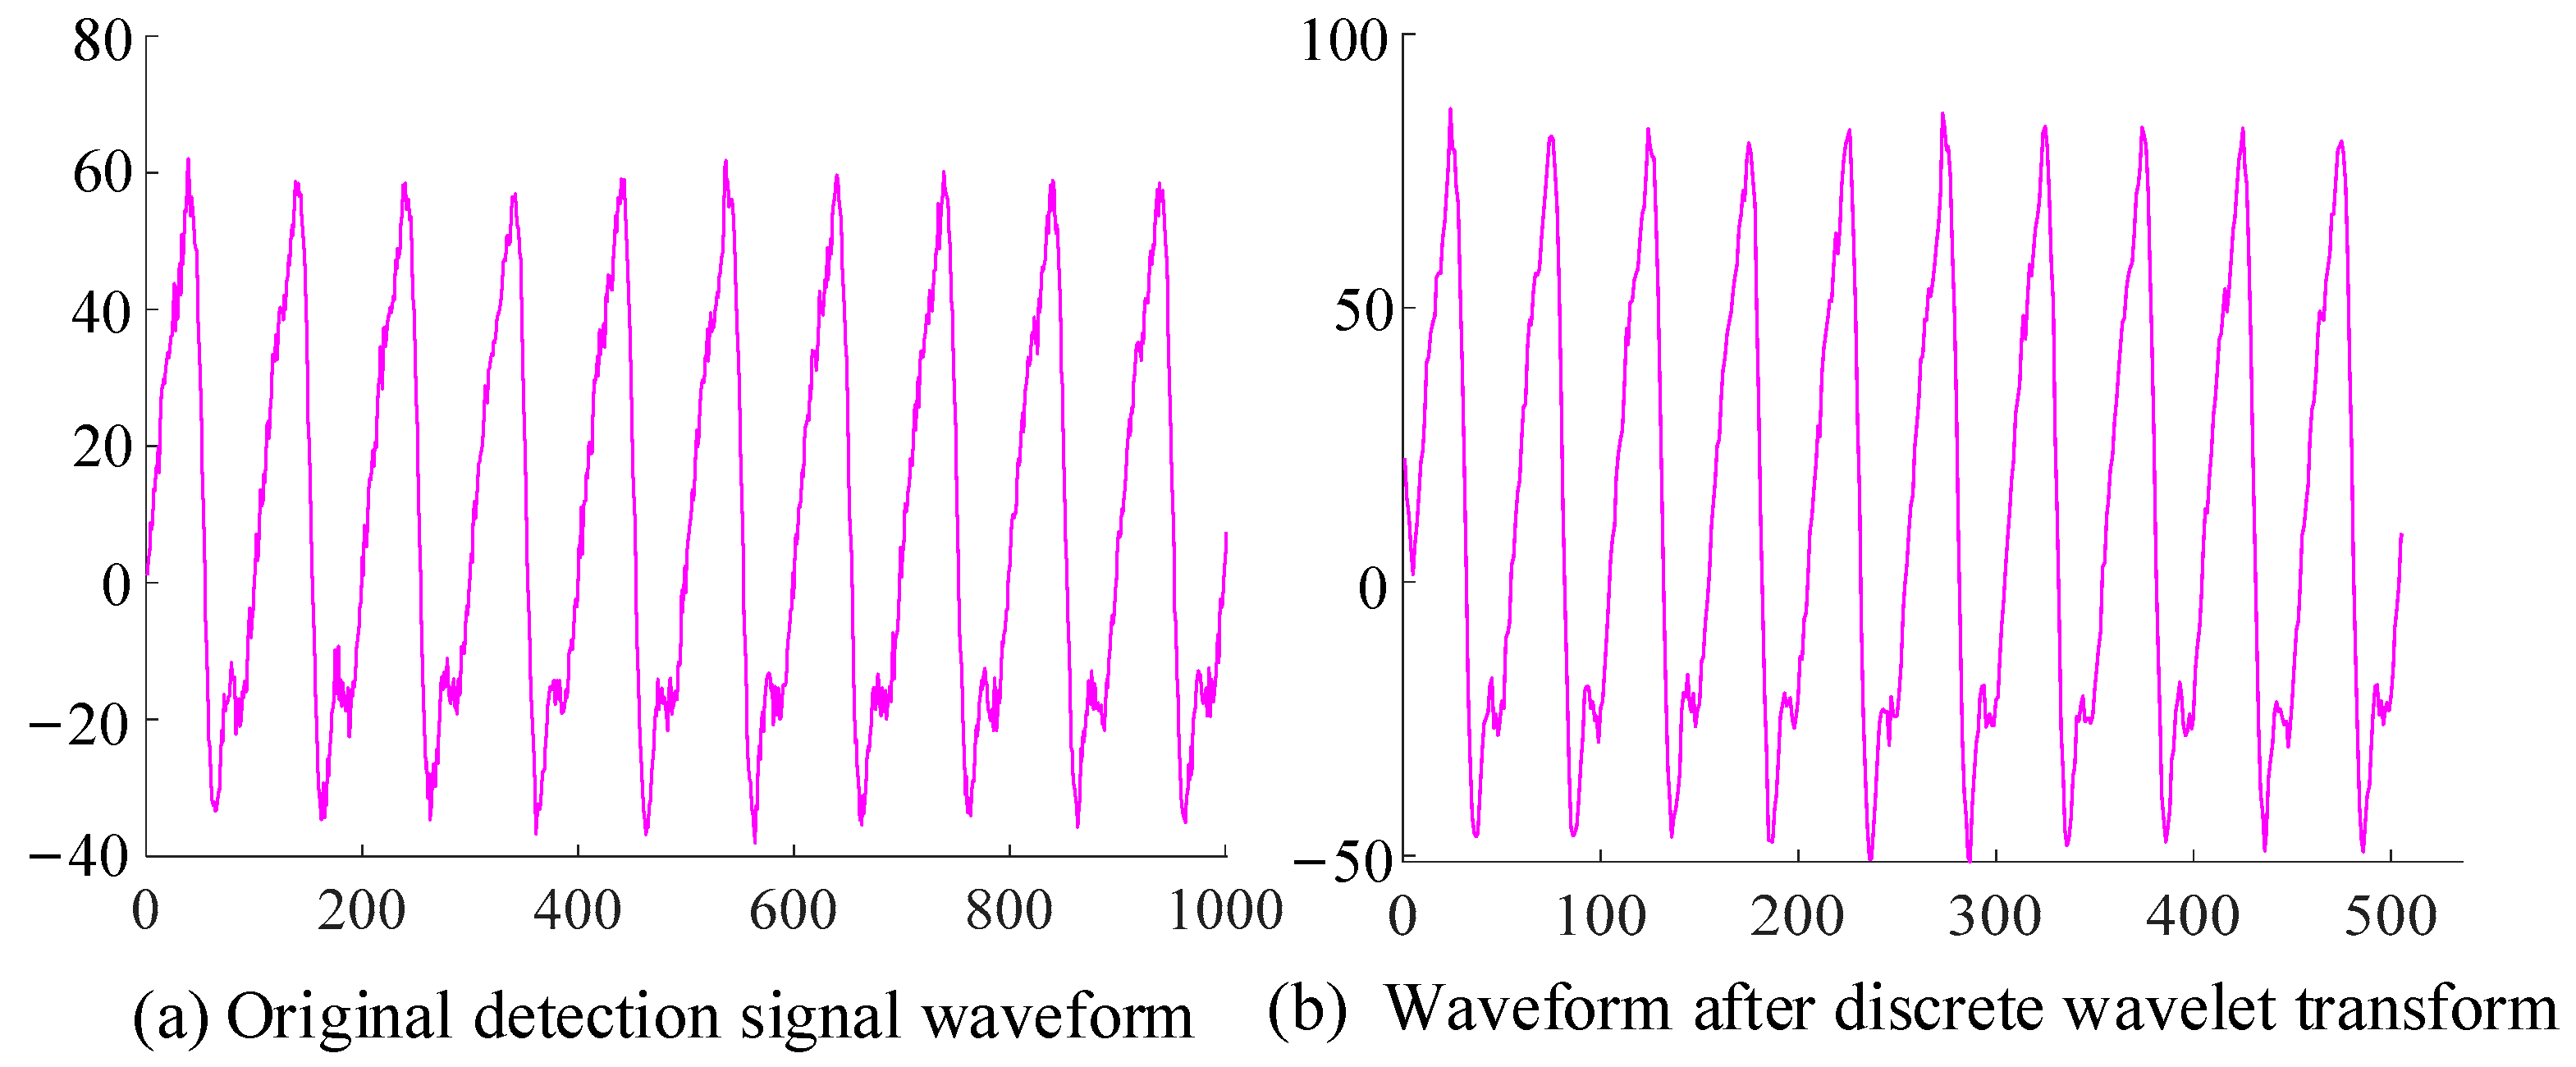
The selection of the wavelet basis and the number of decomposition levels are critical factors influencing the denoising effectiveness. Since the RFID-based pipeline surface defect detection signal is one-dimensional, the Daubechies (db) wavelet basis is adopted. To evaluate the performance of the algorithm, fitting functions are used to generate signals with various peaks, and noise functions are added for comparative analysis. Experimental results demonstrate that the signal waveform processed by DWT is smoother, with a significant amount of noise effectively removed. Due to the use of conventional dyadic wavelet transform, the amount of wavelet coefficients is halved at each decomposition, yet the original data length is restored after reconstruction. This confirms that the DWT-based approach can effectively denoise the RFID pipeline surface defect detection signal. The obtained results are shown in
Figure 2.
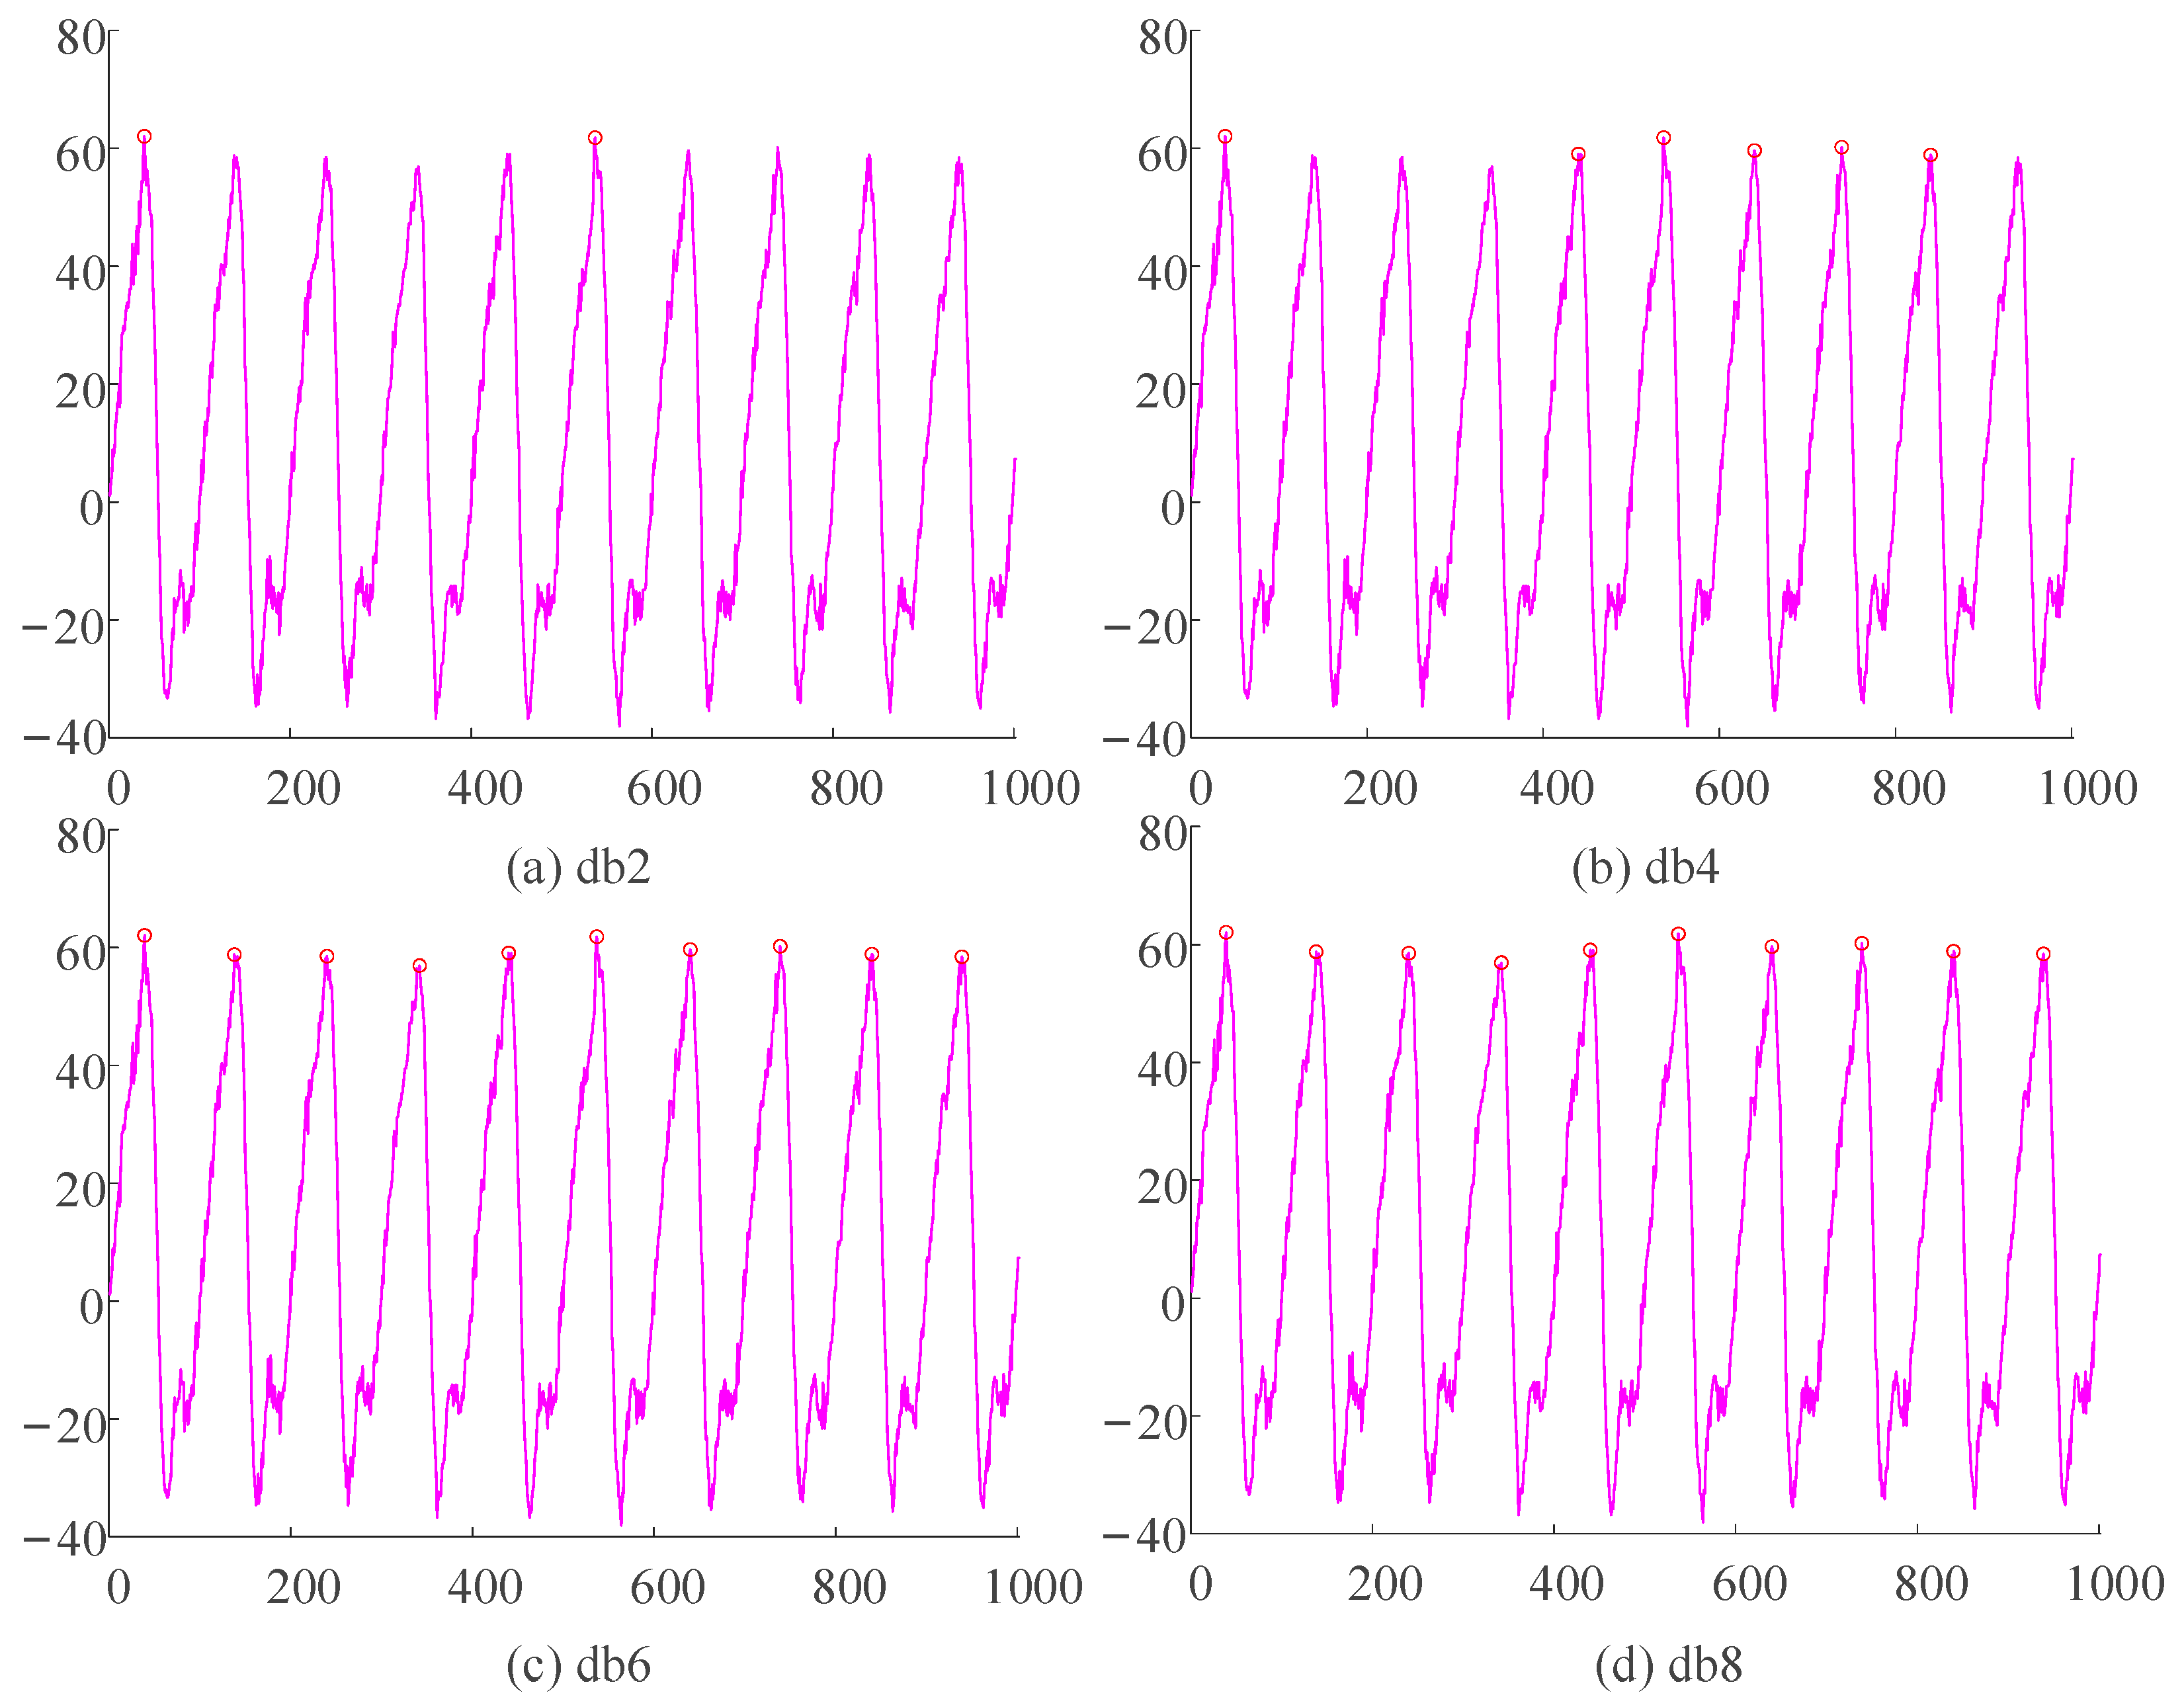
However, the denoising performance of DWT is highly dependent on the choice of wavelet basis and decomposition level. Therefore, to further investigate the influence of different wavelet bases on peak detection performance, several Daubechies wavelets with varying orders are selected for comparative analysis. Specifically, db2, db4, db6, and db8 wavelets were selected to perform wavelet transform and inverse wavelet transform, completing multiple decomposition and reconstruction cycles. The results are shown in
Figure 3. Since Daubechies wavelets of order
N (db
N) possess
N vanishing moments, higher-order wavelets exhibit improved smoothness and frequency resolution, which enhances their capability to represent signal characteristics while suppressing high-frequency noise.
As shown in the figure, when lower-order wavelet bases (e.g., db2 and db4) are used, the significant influence of noise leads to the inability to detect multiple peaks. This is mainly due to their limited smoothness and shorter support length, which make them more sensitive to noise and less effective in capturing the global structure of quasi-sinusoidal RFID signals. In contrast, employing higher-order wavelet bases such as db6 and db8 enables complete detection of all peaks, demonstrating improved noise suppression and feature preservation capability. Furthermore, increasing the decomposition level enhances the separation between noise and useful signal components. However, excessively high decomposition levels may introduce reconstruction distortion due to over-smoothing and accumulated errors, which can adversely affect peak localization accuracy.
To quantitatively evaluate the influence of wavelet basis functions and decomposition levels on peak extraction performance, comparative experiments were conducted using different Daubechies wavelets and decomposition depths. The evaluation metrics included detection accuracy and localization error, which provide an objective measure of the algorithm’s ability to separate useful signal components from noise under varying conditions. The corresponding results are summarized in
Table 2.
As shown in
Table 2, lower-order wavelets such as db2 and db4 generally exhibit larger localization errors and lower detection accuracy due to their insufficient smoothness and weaker noise suppression capability. In contrast, db6 and db8 achieve significantly improved detection performance, indicating superior preservation of transient peak features under noisy conditions. Although db8 provides slightly higher detection accuracy in some cases, its reconstructed signal tends to exhibit increased smoothing, which may reduce the sharpness of local peak characteristics. Comparatively, db6 provides a better compromise between noise suppression and peak feature preservation.
The decomposition level also significantly affects denoising performance and localization accuracy. A low decomposition level fails to adequately separate high-frequency noise from the useful signal, whereas an excessively high level suppresses local transient details and introduces reconstruction distortion, degrading peak localization precision. Experimental results indicate that a decomposition level of 6 achieves the best overall balance between denoising capability and signal fidelity. Therefore, db6 with a decomposition level of 6 is adopted in the proposed algorithm.
The effectiveness of wavelet-based signal separation is inherently related to the temporal scale of analysis. In this study, each signal segment consists of 1000 samples acquired at a sampling frequency of 100 kHz, corresponding to a fixed analysis window of 10 ms. This defines the effective time range within which transient peak features can be reliably detected and localized. Furthermore, the multi-resolution property of the wavelet transform enables adaptive representation of signal characteristics across different time scales, ensuring that the method remains effective even when external conditions vary moderately over time.
To ensure the reproducibility of the proposed method, the principal parameter settings used throughout this study are summarized as follows. The RFID detection signal was sampled at 100 kHz, and each signal segment consisted of 1000 samples. Wavelet denoising was implemented using a soft-thresholding strategy based on the universal threshold rule. The threshold value was determined by
where
denotes the signal length and
is the estimated noise standard deviation. The noise variance was estimated from the first-level detail coefficients using the median absolute deviation (MAD):
where
represents the first-level detail coefficients. After wavelet reconstruction, a local peak search window of
samples was employed for peak refinement. In addition, the minimum inter-peak spacing was constrained to 40 samples to avoid repeated detections caused by noise fluctuations.
2.5. Simulation Experiments
Amplitude threshold method, erosion signal method, and the improved peak detection algorithm were employed to extract signal peaks collected by the RFID-based pipeline surface defect detection system and calculate the corresponding average peak values, as summarized in
Table 3.
As evidenced by
Table 3, the amplitude threshold method can detect a certain number of peaks from the signal waveform. However, its primary limitation is a high false detection rate in the presence of noise, where non-peak data points are incorrectly identified. This leads to a calculated average peak value that is lower than the actual value. The erosion signal method, while effectively mitigating the false detections associated with the amplitude threshold approach, introduces a different problem: missed detections. This omission of genuine peaks results in an average peak value that is skewed higher than the true value. In contrast, the improved peak detection algorithm successfully overcomes the shortcomings of both previous methods. It demonstrates minimal false and missed detections, reliably identifying and extracting all genuine peak points, thereby significantly enhancing the accuracy of the calculated average peak value.
The proposed algorithm achieves superior accuracy in peak detection by effectively balancing false and missed detections. However, for high-speed pipeline inspection, accuracy alone is insufficient. It is equally critical to evaluate the computational efficiency of the algorithm to ensure its practical viability. This section therefore analyzes the computational complexity and real-time performance to assess its suitability for real-world deployment scenarios.
The computational efficiency of the proposed algorithm is primarily anchored by its core operation, the DWT, which is implemented via the efficient Mallat algorithm. This pyramid algorithm decomposes the signal through a series of filter banks and downsampling operations, resulting in a linear computational complexity of O(N), where N is the length of the input signal. While subsequent postprocessing steps—such as adaptive threshold determination, local peak search, and false positive suppression—introduce additional operations, they are deliberately designed to be computationally lightweight. These steps predominantly involve linear traversals of the wavelet coefficients and simple comparative logic within localized windows. Consequently, they do not alter the fundamental linear scaling of the algorithm, and the overall computational complexity remains O(N). This linear characteristic is a significant advantage, as it ensures predictable and manageable computational load as the input signal size scales, a crucial feature for processing the continuous data streams encountered in pipeline inspection.
In our preliminary testing environment, the processing time for a single signal segment is approximately 10 ms. Considering that pipeline inspection is generally performed at a controlled speed, this processing latency falls well within acceptable limits for real-time monitoring requirements, enabling prompt feedback on potential defects. Moreover, the linear complexity of the algorithm ensures predictable processing times as the signal length increases, which is crucial for maintaining system stability and real-time performance during long-term continuous operation.
3. Experimental Testing
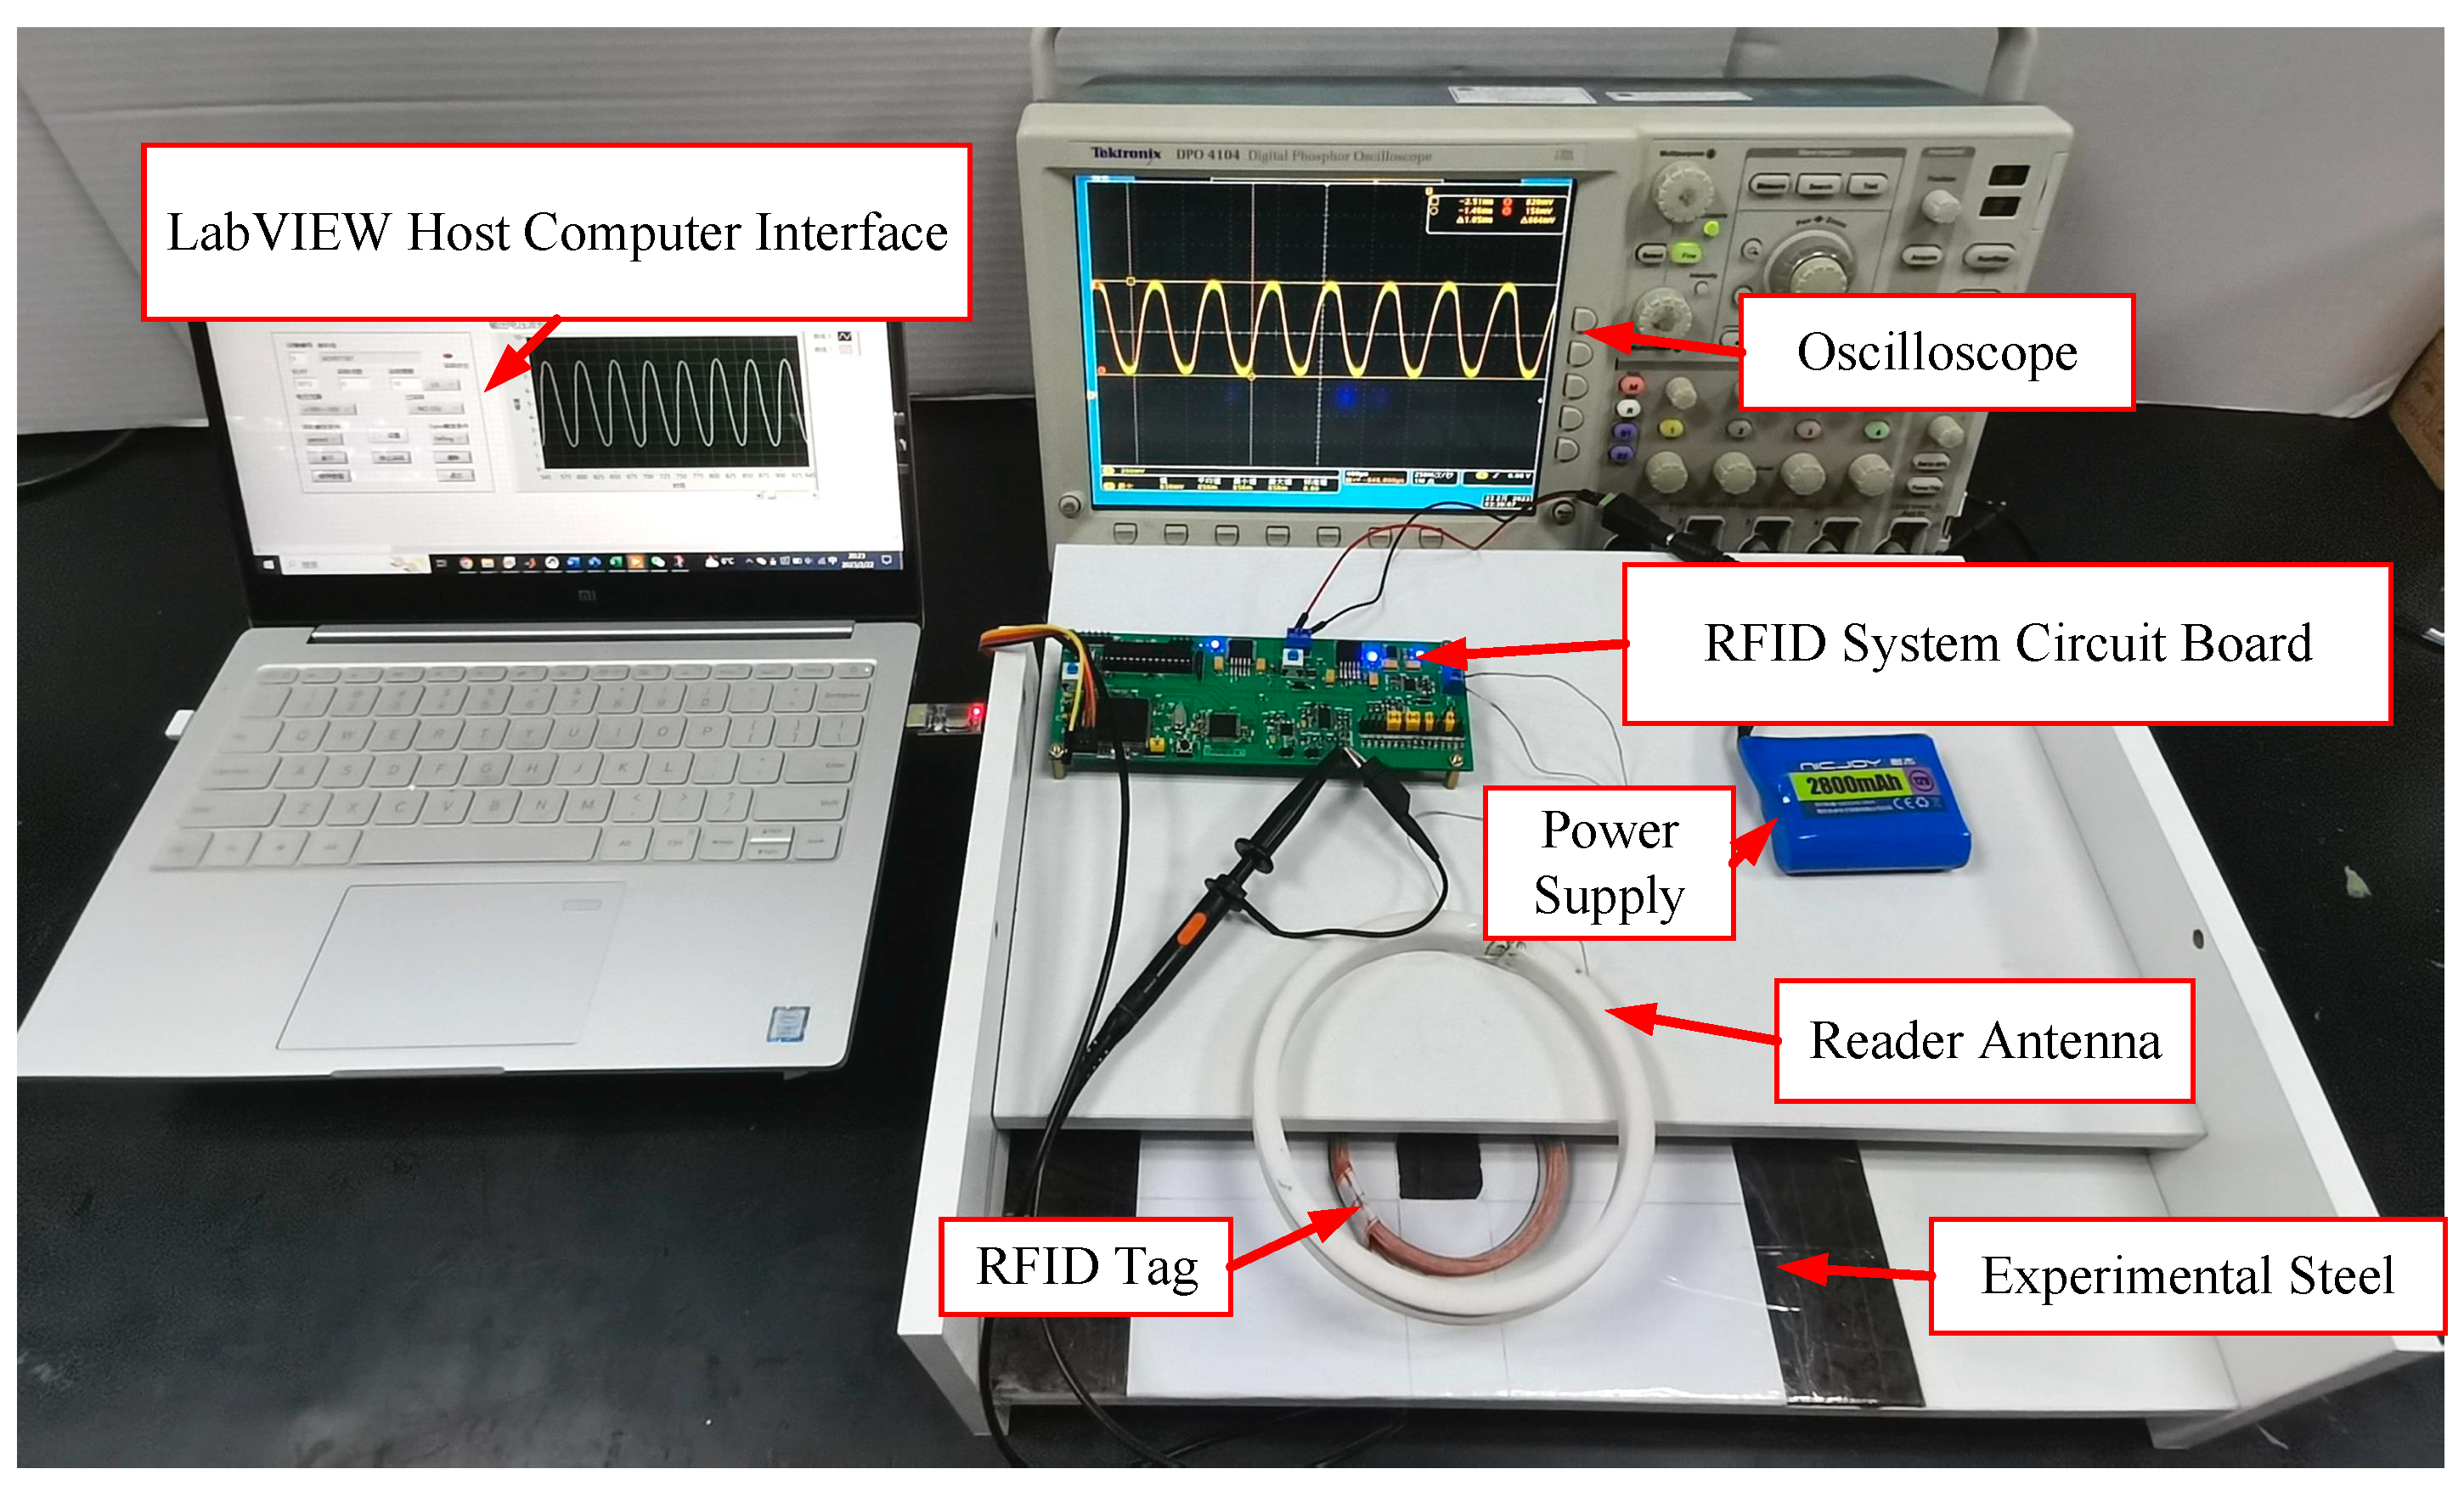
An experimental platform for the RFID-based pipeline surface defect detection system was established, as illustrated in
Figure 4. The system was tested using the TK4100 tag chip (Ji Jia, Taiwan, China), a passive tag that operates without a separate power supply.
Both the reader antenna and the tag antenna were wound with Litz wire and aligned such that their centers were coaxial in the vertical direction. The hardware circuit board of the RFID system was powered by a lithium battery. The output port of the detection signal was connected to a host computer running LabVIEW 2024 (National Instruments, Austin, TX, USA).
In the signal acquisition chain, the received RFID signal is first demodulated using an envelope detection circuit to extract the low-frequency modulation component from the high-frequency carrier (125 kHz ASK). Due to the weak amplitude of the demodulated signal and the presence of high-frequency interference, an analog front-end conditioning stage is employed.
Specifically, a band-pass filter is applied to enhance the effective signal components associated with the demodulated RFID response while suppressing out-of-band noise, thereby improving the selectivity of the sensing system. Based on circuit design and simulation, the band-pass filter is configured with a center frequency of approximately 1.8 kHz, corresponding to the dominant spectral components of the demodulated signal. This stage effectively defines the operational bandwidth and reduces broadband electromagnetic interference.
Subsequently, a low-pass filter with a cutoff frequency of approximately 9.6 kHz is introduced to further attenuate residual high-frequency disturbances and smooth the signal waveform, ensuring improved stability for subsequent processing. As a result, the effective signal bandwidth for defect-related analysis is primarily concentrated in the low-frequency range on the order of several kilohertz.
The conditioned signal is then amplified to improve the signal-to-noise ratio and ensure compatibility with the data acquisition system. Finally, a comparator-based shaping circuit is employed to enhance waveform clarity and enable reliable signal acquisition.
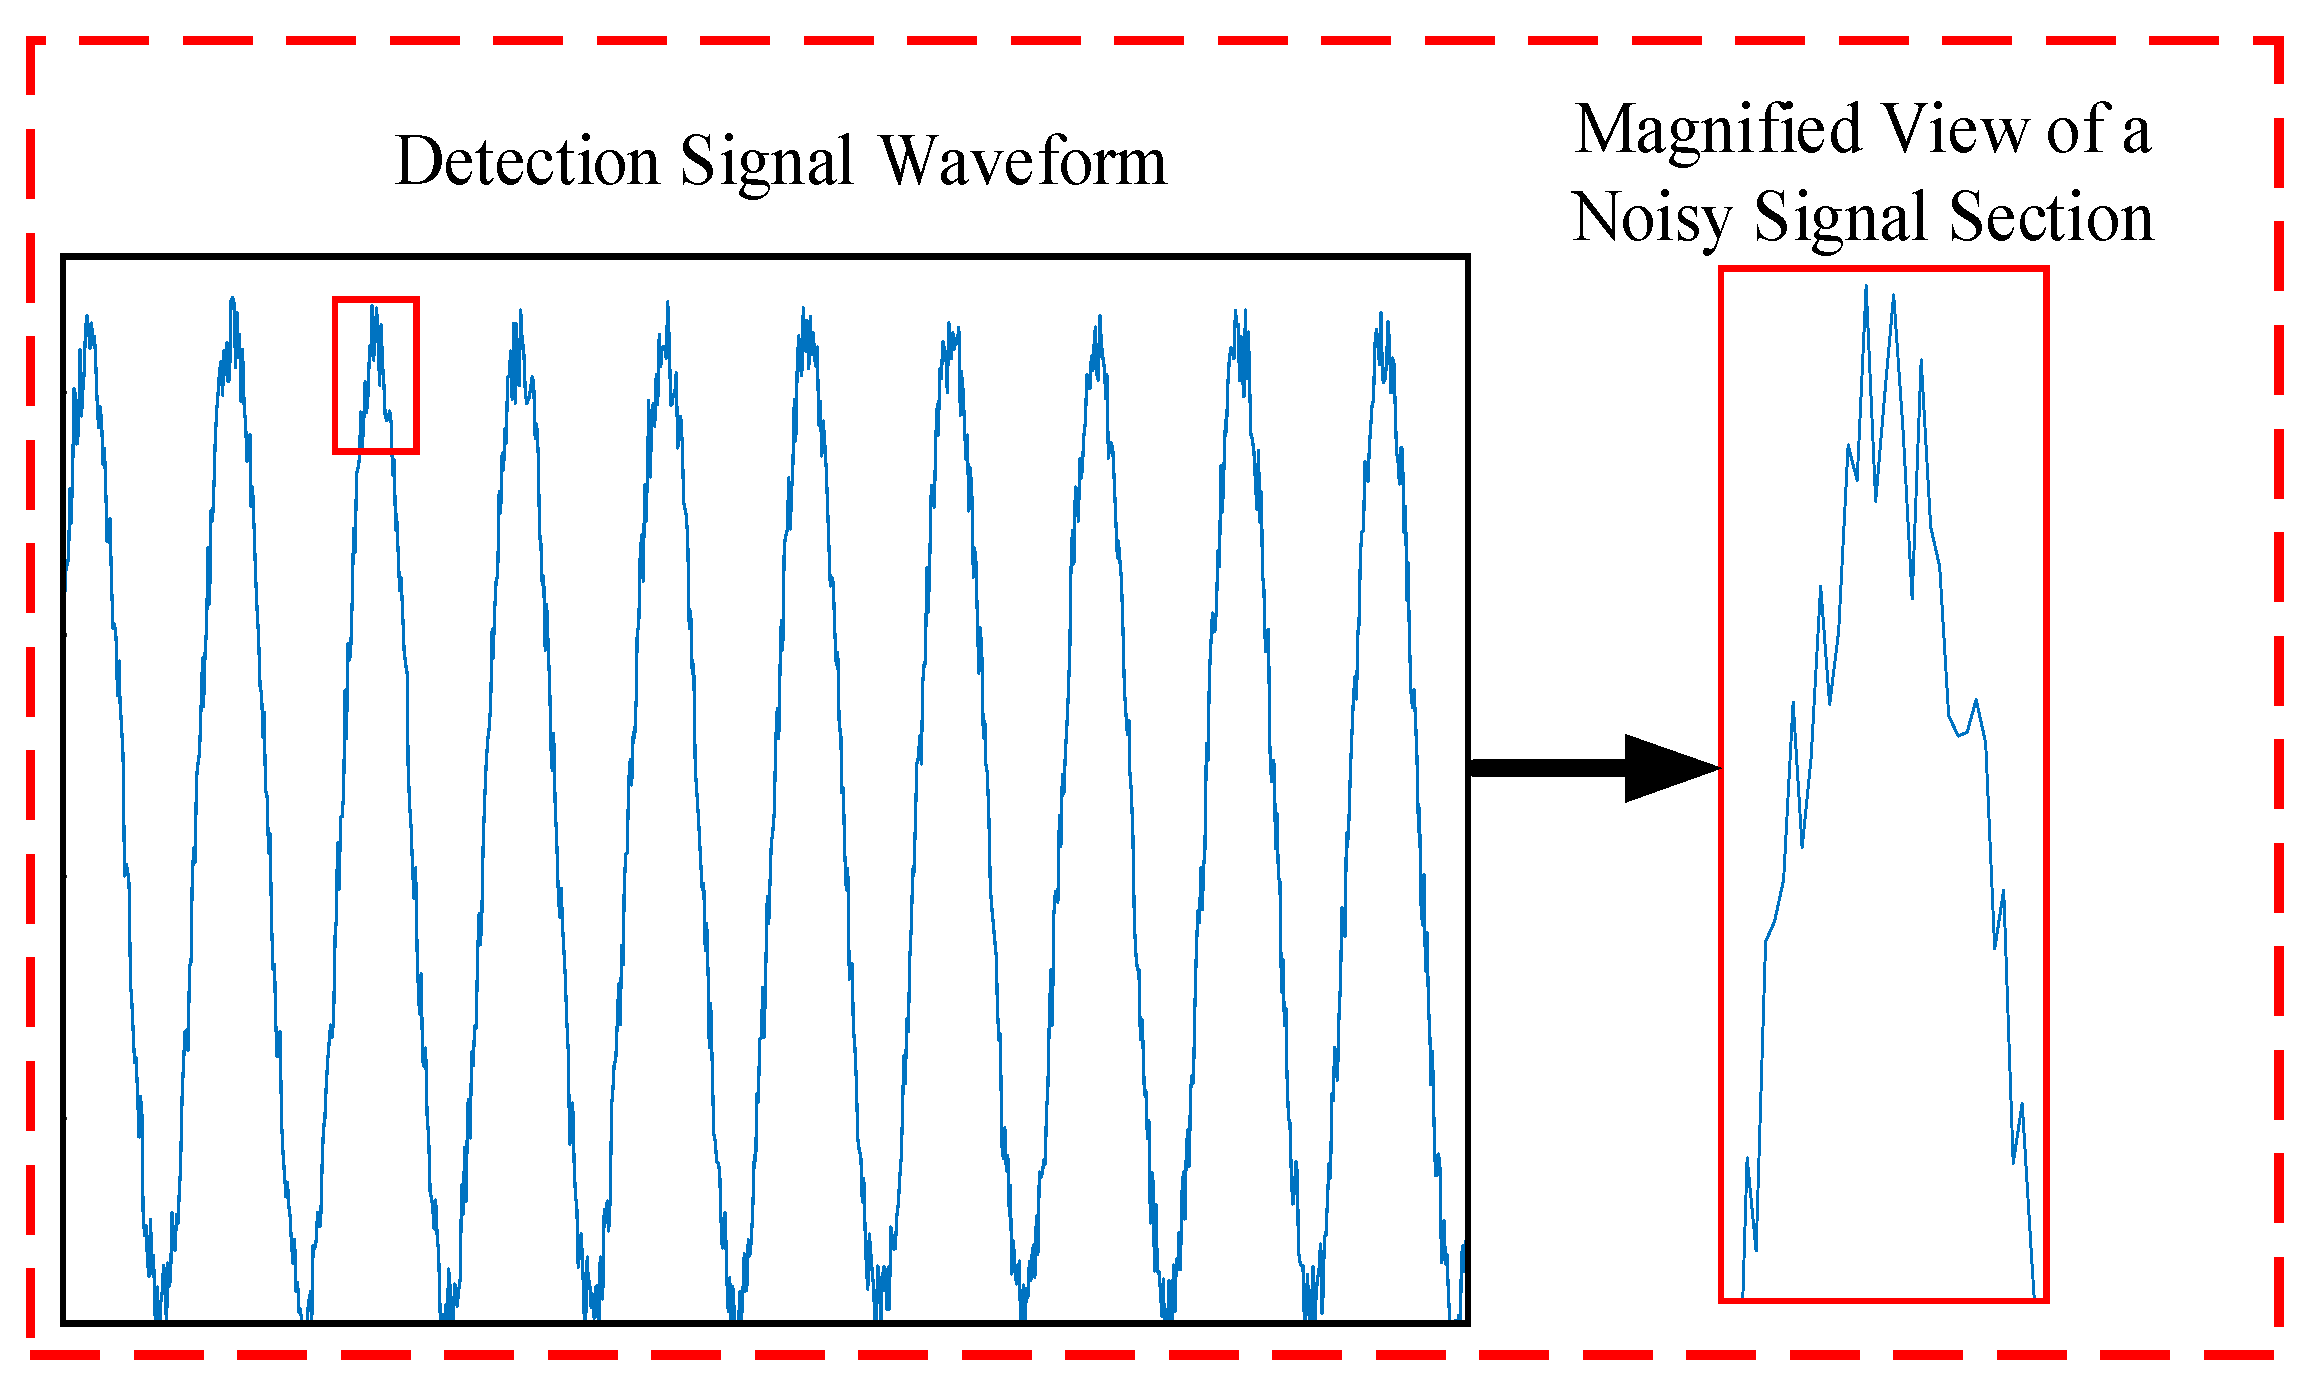
The detection signal output was connected to an Tektronix DPO4104 digital oscilloscope (Tektronix, Beaverton, OR, USA) via a probe, enabling real-time visualization of waveform variations, as shown in
Figure 5. The signal data were simultaneously recorded and exported through the host computer interface, providing both the complete waveform and magnified sections highlighting peak-associated noise.
As can be observed, the detected signal waveform still contains noticeable noise interference even after hardware-level filtering, which may significantly affect peak voltage estimation accuracy. Therefore, additional signal denoising and peak extraction processing are required for reliable analysis of RFID-based defect signals. Accordingly, the performance of the proposed method is evaluated in terms of peak extraction accuracy, including peak voltage estimation and localization, under noise-contaminated conditions.
To provide a reference for peak voltage estimation, the built-in maximum-value detection function of a high-sampling-rate oscilloscope was employed. Owing to its significantly higher sampling frequency compared to the data acquisition system, the oscilloscope can capture instantaneous signal peaks with greater precision and is therefore adopted as a high-precision reference for evaluating peak voltage estimation and peak localization performance. The validation in this study focuses on signal peak extraction performance, rather than defect detection or characterization. Accordingly, the oscilloscope measurement is used solely as a reference baseline, and no explicit ground-truth labels for defect presence, size, or severity are considered in this study. While the extracted signal features can support subsequent defect analysis, the present study does not constitute a complete validation of defect detection or characterization performance.
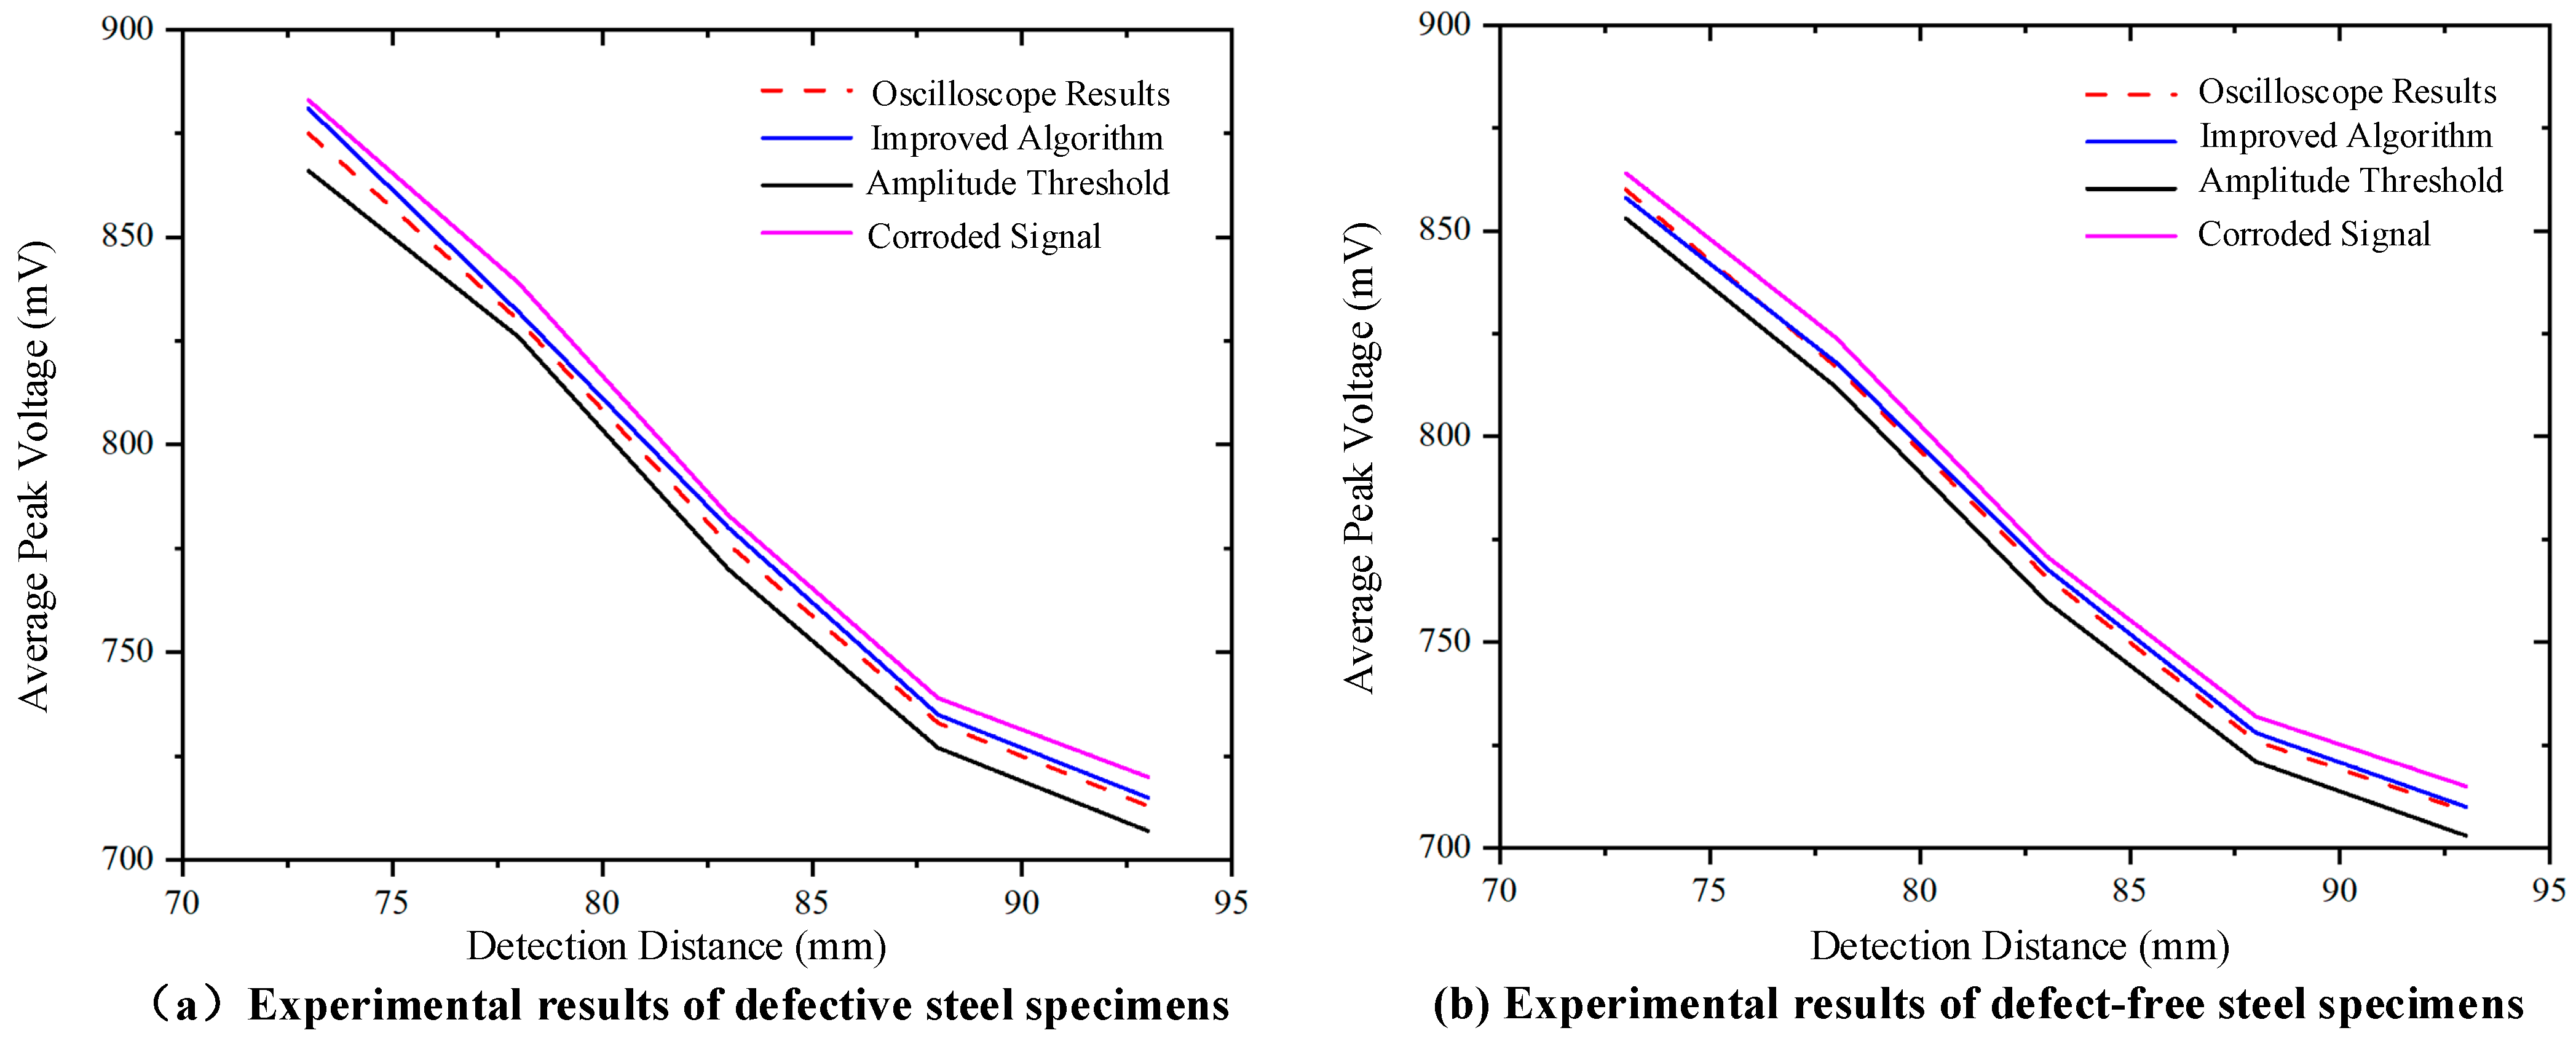
The experiments were conducted on laboratory-scale defective pipeline specimens under controlled conditions. To ensure measurement reliability and reduce experimental variability, repeated measurements were performed under varying detection distances. The amplitude threshold method and the proposed improved peak detection algorithm were then applied under identical conditions to compute the average peak voltages. Statistical averaging was employed to mitigate random fluctuations and enhance result stability. The obtained results were subsequently compared with the oscilloscope reference values, as shown in
Figure 6.
As shown in the figure, the experimental data obtained through the peak detection algorithm exhibit a consistent trend with the measurements from the oscilloscope across different detection distances. The results further confirm that the average peak voltage calculated by the amplitude threshold method is consistently lower than the reference values, while the erosion signal method yields values that are generally higher. In contrast, the improved algorithm provides more accurate average peak voltage results compared to the other two methods. The relative errors of the experimental data calculated by the three methods in comparison to those derived from the oscilloscope’s built-in algorithm at various detection distances are summarized in
Table 4.
As comprehensively demonstrated in
Table 4, under both defect-free and defective pipeline conditions, the amplitude threshold method and the erosion signal method exhibit significantly larger relative errors in calculating the average peak voltage compared to the improved algorithm. Consequently, the enhanced peak detection algorithm developed in this study proves capable of accurately extracting peaks from RFID-based pipeline surface defect detection signals and delivering highly reliable average peak voltage measurements.