1. Introduction
Unmanned aerial vehicles (UAVs) have been extensively deployed across various sectors, including logistics, search and rescue, precision agriculture, and aerial surveying. With the progressive opening of low-altitude airspace, the number of UAVs has increased exponentially, rendering flight safety and collaborative operations increasingly critical [
1,
2]. Conventional UAV identification technologies, which rely on radar, visual sensors, or GPS positioning, often suffer from high costs, significant power consumption, and limited coverage. Consequently, these methods struggle to meet the operational requirements of high-density, heterogeneous, and autonomous low-altitude environments [
3]. Against this backdrop, broadcast-based communication has emerged as a focal point in UAV surveillance research due to its advantages, such as independence from complex infrastructure and high real-time performance. Notably, Remote Identification (Remote ID) has become a core technology in this domain and has been incorporated into regulatory frameworks by multiple countries [
3].
The U.S. Federal Aviation Administration (FAA) has established the Remote ID standard, mandating that UAVs broadcast critical information, such as identity and location, during flight. Similarly, the Civil Aviation Administration of China (CAAC) issued the “Minimum Performance Requirements for Operation Identification of Civil Micro, Light, and Small Unmanned Aircraft” in 2024, explicitly identifying broadcast-based remote identification as a core mechanism for UAV surveillance [
3]. Currently, Remote ID primarily utilizes broadcast protocols such as Bluetooth Low Energy (BLE) and Wi-Fi. Among these, BLE technology exhibits unique potential for the surveillance of small-scale UAVs due to its low power consumption, cost-effectiveness, and widespread deployment [
4]. Research by Zhu et al. [
5] demonstrates that the BLE 4/5 protocol can achieve an effective surveillance range between 330 m and 3740 m; its lightweight and low-power characteristics are well-suited to the payload constraints of small UAVs. Furthermore, Tang et al. [
6] highlighted that as a vital component of cooperative surveillance, Remote ID’s compact size and flexible deployment capabilities effectively bridge the gap in the surveillance of micro, light, and small unmanned aircraft.
While existing studies have validated the feasibility of Remote ID for UAV surveillance, most have focused on centralized monitoring scenarios involving ground stations [
4]. Research into decentralized collaborative surveillance for UAV swarms remains limited. As UAV swarm applications continue to expand, decentralized surveillance offers the advantage of mitigating single-point-of-failure risks and enhancing system robustness; the broadcast characteristics of BLE technology are well-suited to support this paradigm [
4]. Building upon this, this paper proposes the application of BLE-based broadcast communication to decentralized UAV operations. By facilitating the exchange of BLE signals among UAVs, the proposed scheme enables autonomous identification, location awareness, and collaborative collision avoidance.
With the deepening integration of UAV applications, the demand for autonomy and decentralized capabilities has grown significantly. For instance, research has demonstrated that blockchain-based decentralized security mechanisms can effectively facilitate UAV identification and localization [
7]. In autonomous systems, decentralized architectures are considered critical for enhancing system robustness; for example, fully decentralized designs in UAV delivery systems have been shown to improve both reliability and efficiency [
8]. Furthermore, due to its low-power characteristics, BLE technology has been applied to real-time decentralized tracking systems in resource-constrained environments, highlighting its potential for autonomous device interconnectivity [
9].
In broader autonomous systems, decentralized control and authentication frameworks have emerged as research hotspots, which are essential for the collaborative operation of UAV swarms [
10,
11]. Some studies have explored the construction of aerial relay systems using BLE-connected autonomous UAVs to achieve secure communication [
12]. Meanwhile, to address security challenges in complex environments, researchers have begun to integrate deep learning, blockchain, and edge computing to realize decentralized identification and flight pattern detection for UAVs [
13].
While existing Remote ID standards and related studies have validated the feasibility of UAV surveillance, they primarily focus on centralized monitoring via ground stations [
8]. Furthermore, although risk assessment frameworks like the Specific Operations Risk Assessment (SORA) address overall operational safety, they do not optimize the underlying communication parameters essential for autonomous inter-UAV identification [
14]. As UAV swarm applications expand, there is an urgent need for decentralized collaborative surveillance to mitigate single-point-of-failure risks and enhance system robustness. However, research into decentralized identification for UAV swarms remains insufficient. Given its broadcast characteristics, Bluetooth Low Energy (BLE) technology offers a promising technical foundation for achieving rapid, reliable mutual identification, which is critical for collaborative obstacle avoidance and task allocation in decentralized swarm operations.
In this paper, we conduct a comprehensive feasibility analysis of this concept by establishing an integrated system model for BLE-based decentralized identification of low-altitude UAVs. This model encompasses critical dimensions, including link budget, collision probability, identification success rate, and power consumption [
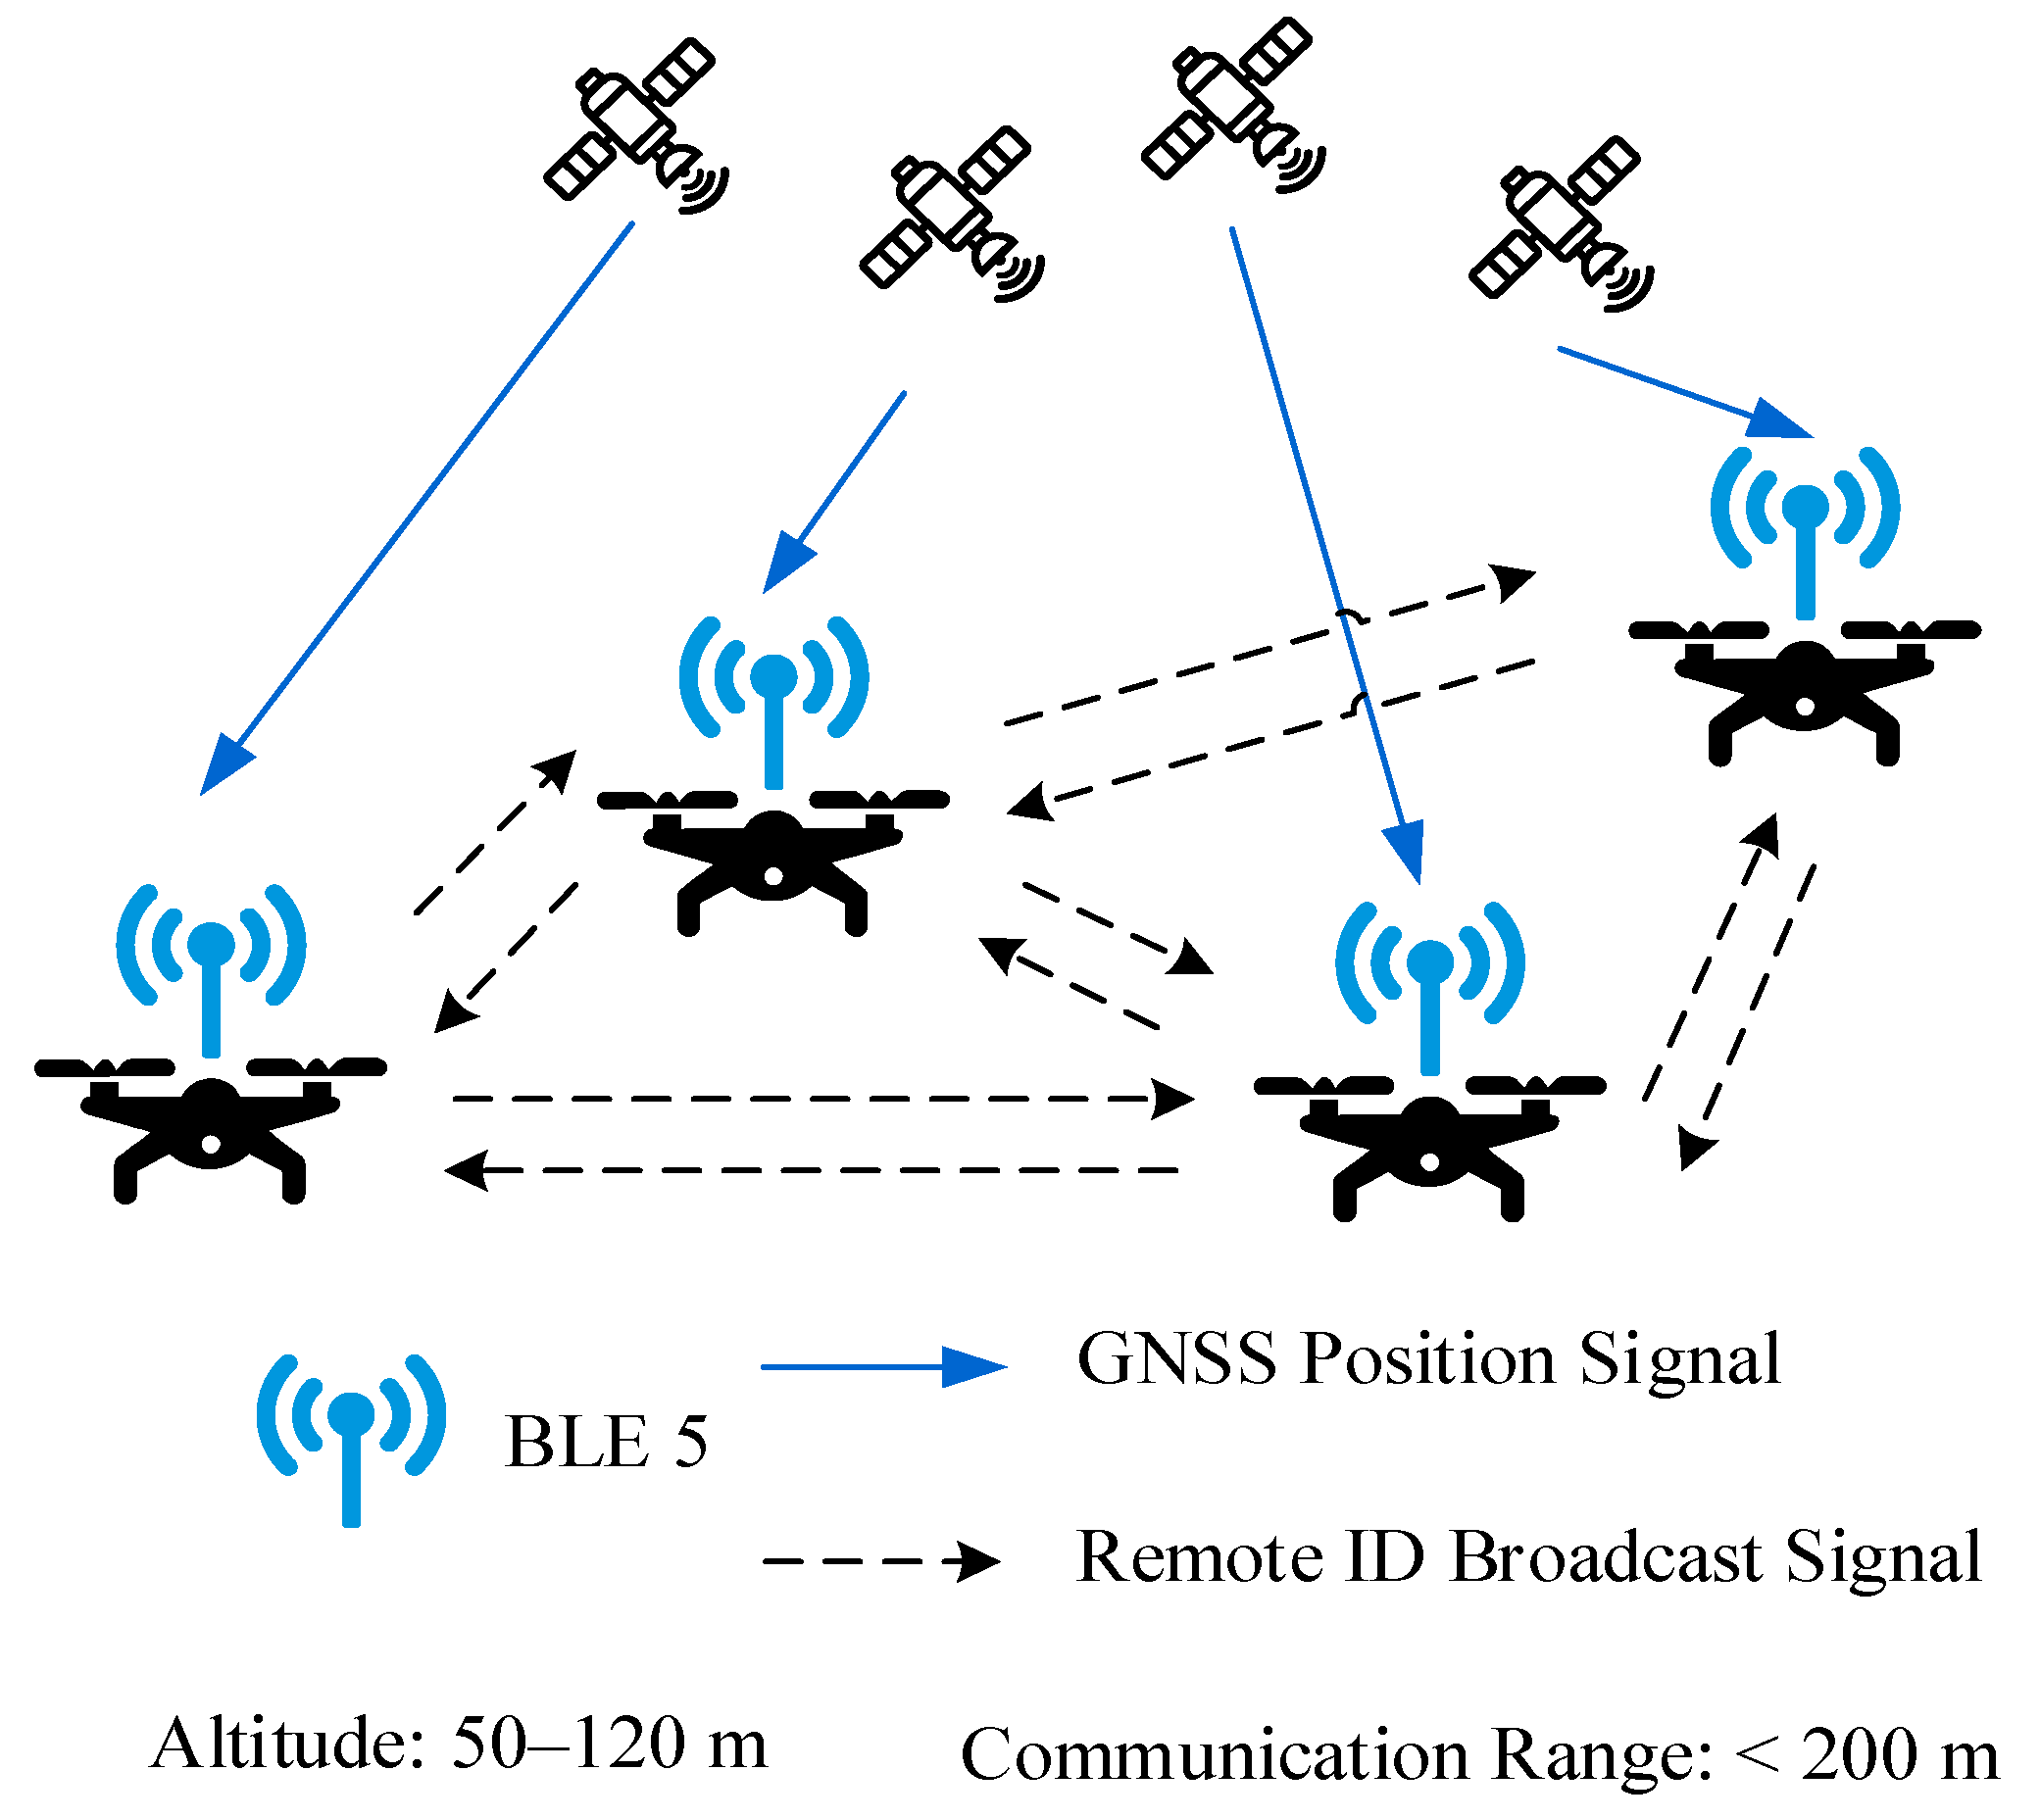
4]. By employing an exhaustive search-based optimization algorithm, we optimize listening strategy parameters and evaluate performance under various physical (PHY) layer rates and scanning configurations, providing a reference for technical selection and deployment. This study aims to overcome the limitations of traditional centralized surveillance and provide a novel technical pathway for the safe and collaborative operation of low-altitude UAV swarms. The scenario is illustrated in
Figure 1.
The main contributions of this paper are threefold:
We propose a decentralized UAV-to-UAV identification scheme that leverages existing BLE-based Remote ID hardware, enabling autonomous collaborative surveillance without relying on ground infrastructure.
We establish a multi-dimensional performance model that couples link budget, collision probability, and safety-critical operational constraints, providing a rigorous framework for evaluating BLE performance in UAV swarms.
We derive the global optimal parameter configuration using an exhaustive search algorithm, which satisfies the 10−6 failure rate requirement and offers a practical deployment guide for low-altitude UAV identification.
2. Development of the Decentralized Autonomous Identification System Model for UAVs
The decentralized autonomous identification system for low-altitude UAVs proposed in this paper is based on the Bluetooth Low Energy (BLE) broadcast mechanism. The system architecture comprises three primary components: the transmitter (UAV), the receiver (scanner), and the optimization module. The UAV periodically broadcasts BLE packets containing its identification information. The scanner performs continuous scanning and packet decoding across the three designated advertising channels (37, 38, and 39). Simultaneously, the optimization module dynamically adjusts listening strategies—including scan window, scan interval, and channel dwell time—based on specific operational scenario parameters.
2.1. Link Budget Model
Link budget analysis serves as the foundation for evaluating the performance of wireless communication links. Its core objective is to precisely characterize signal propagation loss, thereby providing a theoretical basis for analyzing communication range, signal reachability, and link reliability. In this study, we adopt the Log-distance Path Loss Model (LPLM) as the primary framework for our link budget analysis. As one of the most widely utilized empirical propagation models in wireless communications [
15], the LPLM extends the Friis free-space model by incorporating a path loss exponent and a shadowing factor, enabling it to adapt to complex real-world environments. The mathematical expression is given by:
In this expression, denotes the path loss at transmission distance . is the path loss at the reference distance , with a fixed value of 40 dB. is the path loss exponent fixed at 2.5, and represents shadow fading that follows a normal distribution with a mean of 0 and a standard deviation of 2 dB.
The calculation formula of Received Signal Strength Indicator (RSSI) is:
In this expression, stands for transmit power (0 dBm) and and are transmit antenna gain and receive antenna gain separately (0 dBi).
The maximum effective distance is calculated based on the receiving sensitivity
:
Receiving sensitivity takes different values under different PHY rates. In this paper, the sensitivity is −97 dBm for PHY 1 Mbps, −93 dBm for PHY 2 Mbps, −103 dBm for PHY 125 kbps, and −99 dBm for PHY 500 kbps. This parameter difference comes from different signal-to-noise ratio requirements for signal demodulation corresponding to different modulation methods.
2.2. Packet Transmission and Collision Model
Packet transmission and collision are critical issues in the BLE-based autonomous identification system for low-altitude UAVs, as they directly determine identification success rates and communication reliability. In high-density multi-UAV operational scenarios, the real-time performance, data integrity, and collision avoidance capability of packet transmission are essential for ensuring that the system meets the stringent safety requirements of low-altitude flight. Based on the BLE 5.0 advertising mechanism, this paper develops a packet transmission model and a collision model tailored to the operational characteristics of UAVs, providing a quantitative basis for system performance evaluation.
Packet transmission duration
is the core indicator for measuring transmission real-time performance. Its value is jointly determined by BLE physical layer (PHY) rate
and packet length
. Considering the maximum payload limit of BLE advertising packets (maximum 31 bytes in non-connectable advertising mode), this paper uniformly sets the packet length as
:
In this expression, the value 8 is the unit conversion coefficient between byte and bit. denotes the BLE physical layer transmission rate, with the unit of bps. BLE5.0 standard supports four optional PHY rates: 1 Mbps, 2 Mbps, 125 kbps and 500 kbps. BLE advertising adopts a periodic transmission mechanism, and the advertising interval is set to 25 ms in this paper.
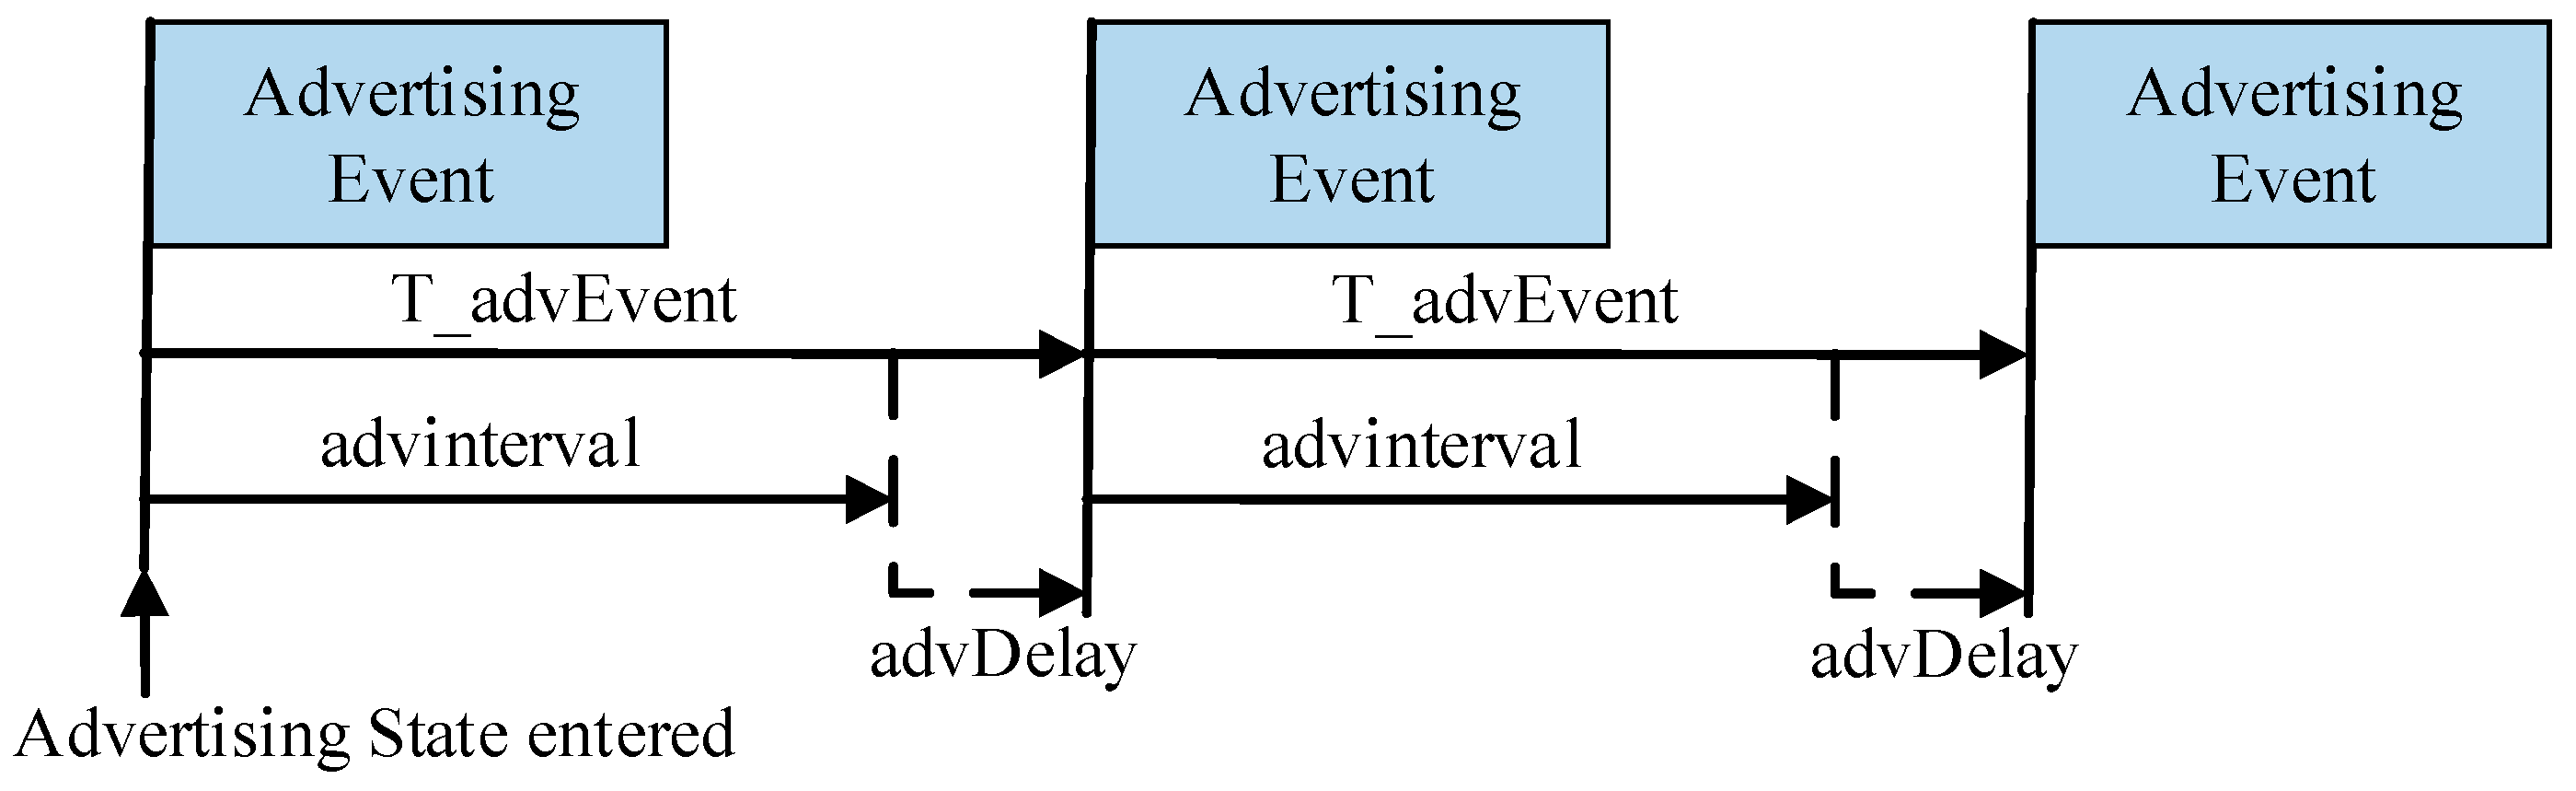
Figure 2 presents the periodic working timing of the BLE advertising state machine. Each advertising event is triggered sequentially at the fixed advertising interval
. Each event includes two links: packet transmission and state delay. Adjacent advertising events strictly follow the
period. This reflects the core connection-free, periodic and timing-triggered mechanism of BLE advertising, and provides a timing basis for the modeling of packet transmission, collision probability and listening probability.
In multi-UAV concurrent operation scenarios, BLE advertising packets from different UAVs may be transmitted on the same channel within the same time window. This causes signal superposition interference, which is defined as packet collision. Packet collision prevents the receiver from demodulating packets correctly and directly reduces the identification success rate. This paper considers the “multi-packet collision” scenario of multi-node concurrent transmission (i.e., the superposition of more than 2 packets in the same time window). This paper uses an improved Poisson model to calculate the collision probability
. This model describes the interference degree of multi-node concurrent transmission by quantifying the expected number of transmission events. It fits the random access characteristic of BLE advertising, and has higher fitting degree with the actual collision characteristics of BLE advertising.
In this expression, denotes the expected number of transmission events. is the number of active UAVs, and is the transmission attempt probability fixed at 0.05.
The collision model employed in this study utilizes an improved Poisson process to approximate the interference characteristics of BLE advertising. While this model captures the macro-level impact of multi-node concurrency, it simplifies complex physical layer phenomena such as capture effects, frequency hopping, and asynchronous scanning. We acknowledge that these factors may introduce minor deviations in high-density scenarios; however, the model provides a robust theoretical upper bound for system performance, which is sufficient for the purpose of parameter optimization in this study.
2.3. Identification Success Probability
Recognition Success Rate (RSR) is the core performance indicator of the low-altitude UAV BLE autonomous identification system. It quantifies the probability that the receiver accurately identifies UAV advertising information in complex low-altitude environments. This indicator needs to comprehensively consider wireless signal accessibility, transmission collision-free property and the receiver’s listening coverage capability. This paper constructs a three-dimensional coupling model including reception probability, collision-free probability and listening probability. It comprehensively describes the influence of multiple factors on identification performance. Essentially, recognition success rate is the joint probability of three events: “successful signal reception”, “collision-free transmission” and “effective listening of the receiver”. Its mathematical expression is:
In this expression, denotes reception probability, denotes collision-free probability and denotes listening probability. The three parameters are independent of each other and jointly determine the final identification performance of the system.
It is important to note that while parameters such as listening coverage, collision probability, and channel dwell time are physically interdependent in real-world BLE networks, this study adopts a decoupling assumption to ensure mathematical tractability. We define and as independent probabilistic events within a single observation window to establish a baseline optimization framework. Furthermore, the reception probability is defined as a binary indicator based on the RSSI threshold for a single packet; however, in the context of multi-channel reception, it is treated as an expected success probability (a continuous value in [0, 1]) representing the statistical likelihood of successful demodulation across multiple advertising channels.
Reception probability
describes the probability that wireless signals transmit successfully from the UAV transmitter to the receiver. Its core depends on the relationship between Received Signal Strength Indicator (RSSI) and receiving sensitivity (
). When
, the receiver can effectively demodulate the signal and
. Otherwise, signals cannot be identified due to attenuation or interference, and
. This judgment logic fits the physical essence of wireless communication and is the basis of link layer reliability. BLE technology uses 3 advertising channels (channels 37, 38 and 39) for polling advertising. Although these channels share a common physical path, we assume independent shadowing for each channel to maintain the analytical tractability of the model. This is a standard approximation in BLE performance studies, as it allows for a closed-form derivation of the identification failure rate, providing a robust theoretical baseline for parameter optimization. Single-channel reception failure may lead to complete identification failure. It is necessary to introduce the three-channel comprehensive reception probability
to quantify the improvement effect of multi-channel redundant transmission on reception reliability. Its calculation formula is:
In this expression,
denotes the reception probability of the k-th channel. Its value is related to signal accessibility, and affected by the residence time of the receiver on this channel. Its specific expression is:
In this formula, denotes the residence time of the receiver on the k-th channel, with the unit of ms. is the UAV BLE advertising interval, and 15 ms is adopted for this parameter in this paper. represents the coverage proportion of the receiver to this channel within a single advertising period. The sum of the residence time of the three channels must equal the scanning window , which is expressed as . This constraint ensures the integrity of channel scanning.
Listening probability
denotes the probability that the receiver effectively captures packets within the UAV advertising period. Its core depends on the ratio of scanning window
to scanning interval
. Its calculation formula is:
Scanning window is the actual time the receiver stays in channel scanning state within one scanning period. Scanning interval is the time interval between two consecutive scanning windows, that is, the scanning period. The physical meaning of this formula is the scanning duty cycle of the receiver. The values of scanning parameters (, ) directly affect the balance between listening probability and power consumption.
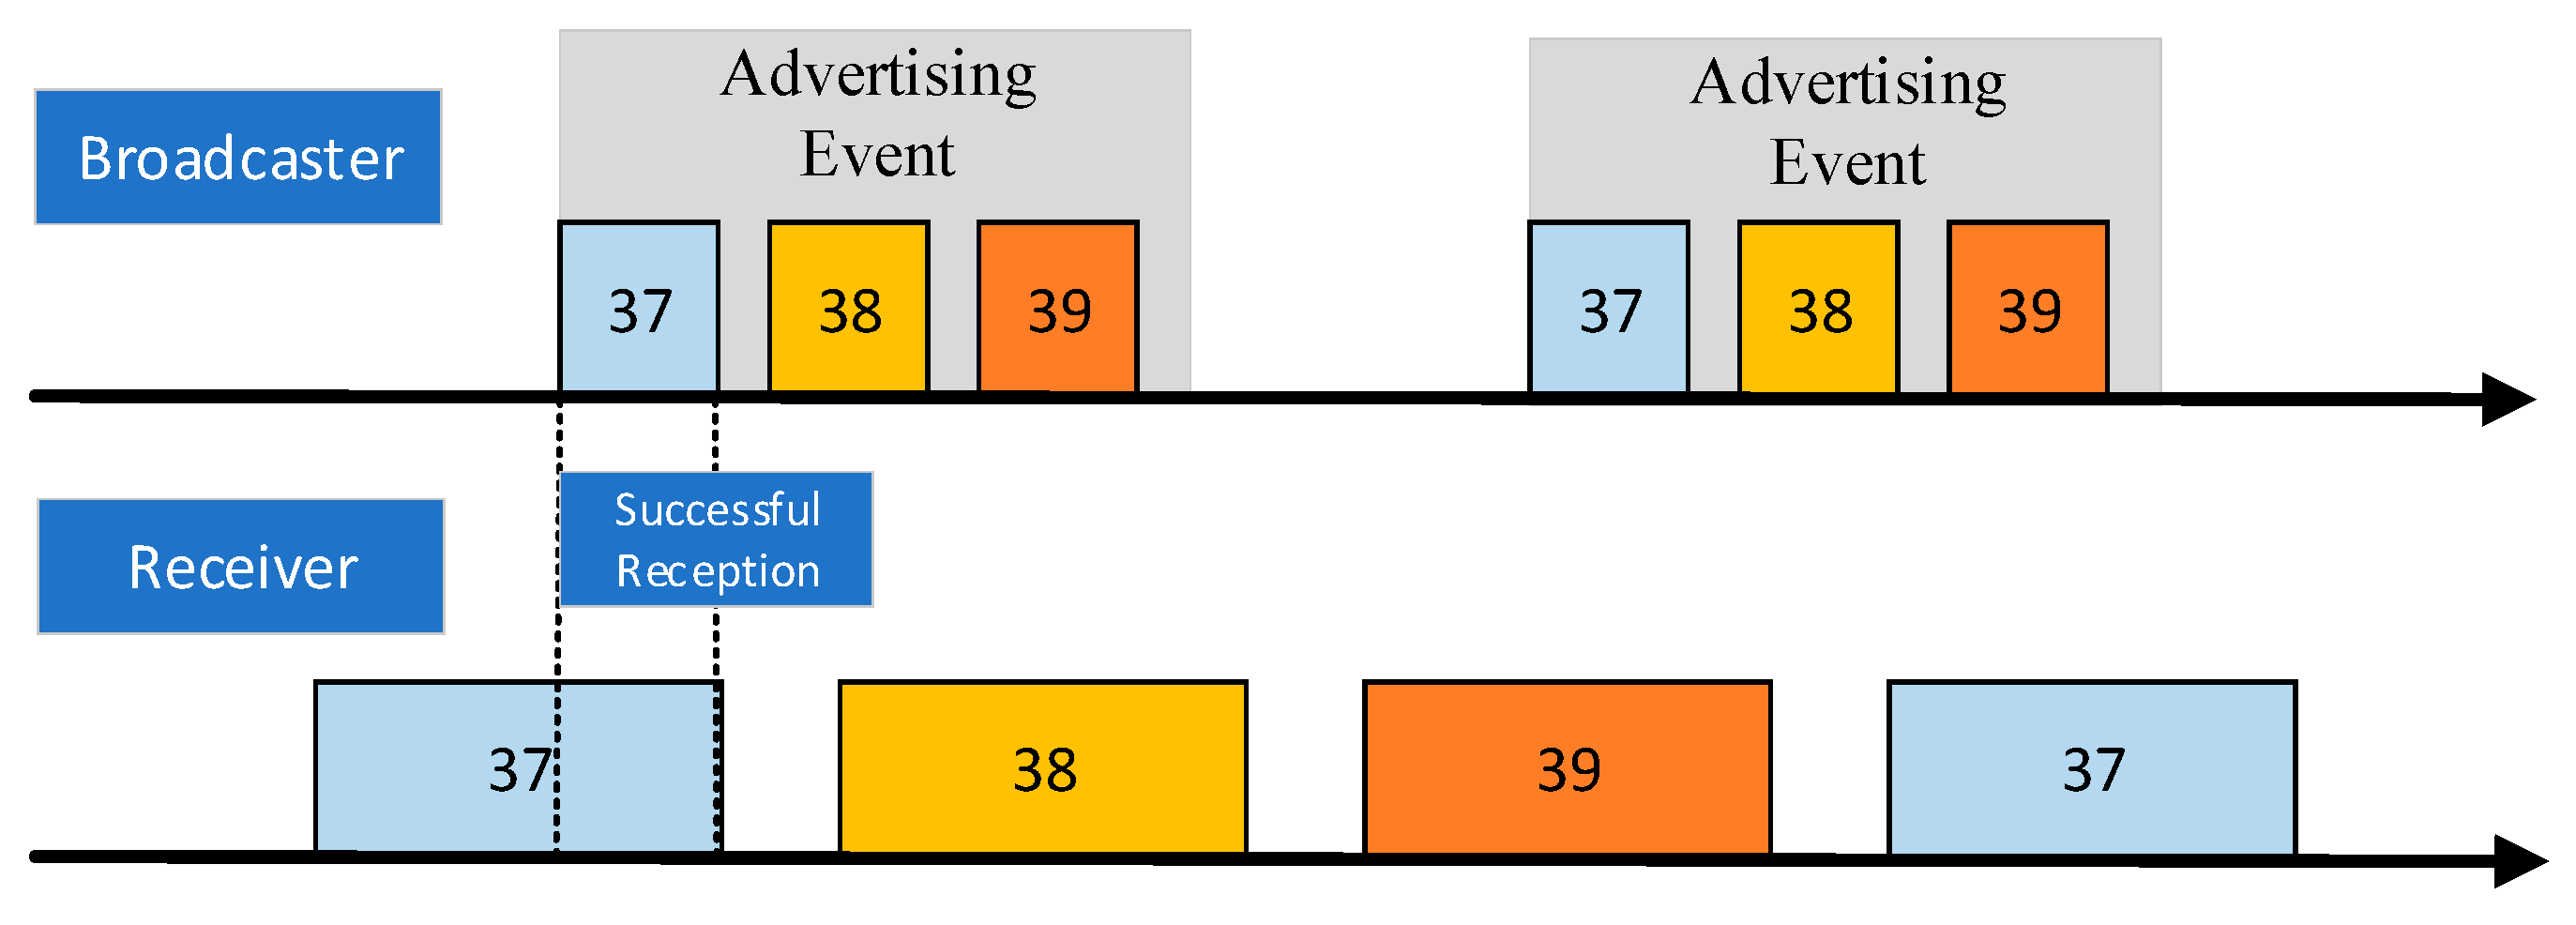
Figure 3 presents the timing relationship between BLE advertising and scanning on the three advertising channels (37, 38, 39). The transmitter advertises sequentially on the three channels at fixed intervals. The receiver listens to the channels in the same order within the scanning period. The sum of the residence time of each channel equals the scanning window
. This timing intuitively reflects the BLE multi-channel polling mechanism. It provides support for the modeling of multi-channel reception probability and comprehensive recognition success rate.
2.4. Power Consumption and Delay
Power consumption and delay are core performance constraints of the low-altitude UAV BLE autonomous identification system. The UAV payload limit requires receiver power consumption to be as low as possible. Flight safety demands put forward strict requirements for identification delay. This paper constructs a power consumption model considering both scanning state and idle state, and an Average First Identification Delay (AFID) model considering multi-channel polling characteristics, to meet the resource constraint and real-time demand of low-altitude UAV operation. The two models provide quantitative support for system parameter optimization.
The core of the power consumption model is to quantify the energy consumption of the receiver in different working states. The BLE receiver has two operation modes: scanning state (actively listening to advertising channels) and idle state (waiting for the next scanning period). The total power consumption is the weighted sum of the power consumption of the two states. Its mathematical expression is:
denotes scanning current, fixed at 9.7 mA. It is the working current of the receiver when the receiver is in the channel scanning state. This parameter is determined based on measured data of mainstream BLE chips such as nRF52840. It covers the comprehensive current consumption of the radio frequency module and the signal processing module. denotes idle current, fixed at 5.4 mA. It is the current consumption of the receiver when radio frequency scanning is turned off and only the core circuit keeps standby. It is a key indicator of low-power design. denotes supply voltage, fixed at 3.3 V. It conforms to the standard supply voltage range of UAV airborne equipment. It ensures the engineering adaptability of the model. is the scanning duty cycle. It is the time proportion of the receiver in the scanning state within one scanning period. It is the core adjustment factor for balancing power consumption and identification performance.
Average First Identification Delay (AFID) is the key indicator for measuring system real-time performance. It is defined as the average time from the UAV entering the monitoring range of the receiver to the receiver’s first successful identification of its advertising packet. This model needs to consider the BLE multi-channel polling mechanism and scanning period characteristics. Its mathematical expression is:
In this expression, denotes the scanning interval (scanning period). It is the time interval between two consecutive scanning windows of the receiver. denotes the number of advertising channels, fixed at 3. It corresponds to the three independent advertising channels (37, 38, 39) specified by the BLE standard. denotes the scanning window. It refers to the total time for the receiver to scan all channels in a single scanning period.
The receiver adopts a polling scanning mechanism and sequentially traverses the three advertising channels within one scanning period. The residence time of each channel is . The UAV randomly selects one of the three channels to broadcast advertising packets. From the probability perspective, the average matching delay between the UAV transmission channel and the receiver’s current scanning channel is . The average capture delay within the scanning window is . Superposition of these two delays gives the average first identification delay.
To ensure flight safety, UAVs must maintain a minimum separation distance, defined as 30 m horizontally and 10 m vertically. Only UAVs operating within these spatial constraints are considered relevant for identification. Furthermore, the effective identification range is constrained by the receiver sensitivity, beyond which UAVs remain undetectable. Within the safety assessment framework for low-altitude UAV operations, identification performance must align with established international standards. Specifically, the Joint Authorities for Rulemaking on Unmanned Systems (JARUS) established the Specific Operations Risk Assessment (SORA) guidelines in 2019, which set the Target Level of Safety (TLS) for mid-air collision at
[
16]. Consequently, to satisfy these safety requirements, the identification system must achieve a success rate of
, implying that the identification failure rate must be maintained below
.
It is important to clarify that the BLE-based identification reliability proposed in this study serves as a critical technical component within the broader UAV safety framework, such as the SORA (Specific Operations Risk Assessment) process. While our model aims to approach the 10−6 failure probability threshold, it should not be interpreted as a direct equivalence to aviation-level Target Level of Safety (TLS) compliance. In practice, achieving the required TLS involves a multi-layered approach, including redundant sensing systems, trajectory prediction, and operational procedures, which collectively mitigate collision risks beyond the scope of communication-level identification.
3. Exhaustive Search Algorithm
As a deterministic global search method, the exhaustive search algorithm is widely applied in the optimization of wireless communication and UAV systems. Its core advantages include guaranteed global optimality, deterministic results, independence from initial parameter settings, and the absence of local convergence risks. By exhaustively exploring the discrete parameter space, it identifies the theoretical optimum, providing a reliable benchmark for system design [
17]. In research domains such as low-altitude UAV communications, millimeter-wave systems, and IoT resource allocation, exhaustive search is frequently employed to establish performance upper bounds, calibrate model parameters, and generate Pareto fronts, serving as a critical baseline for validating the effectiveness of optimization strategies. In the context of UAV surveillance and communication resource allocation, this method ensures the identification of the global optimal parameter set under multi-constraint and multi-variable conditions, thereby providing a rigorous scientific basis for the configuration of the BLE-based UAV identification system.
Despite its superior global optimality, the exhaustive search algorithm is constrained by computational complexity, which grows exponentially with the parameter dimensionality and discretization density, leading to significant computational costs in high-dimensional scenarios. Furthermore, the discretization step size introduces quantization errors, necessitating a trade-off between computational efficiency and precision [
18]. Given the manageable parameter dimensionality and search space in this study, the exhaustive search algorithm is adopted to efficiently achieve global optimization and construct the Pareto front while ensuring high precision.
The multi-objective optimization aims to maximize The identification Success Rate (RSR) while minimizing system power consumption. This process involves the joint optimization of four decision variables: scan window (), scan interval (), dwell time on three channels (), and the PHY rate. The optimization is subject to rigorous performance and engineering constraints, defined as follows: ms, ms, and ms for each channel, with the constraint . Furthermore, the PHY rate is selectable from . Finally, the system must satisfy the safety separation requirements and the recognition performance constraint of .
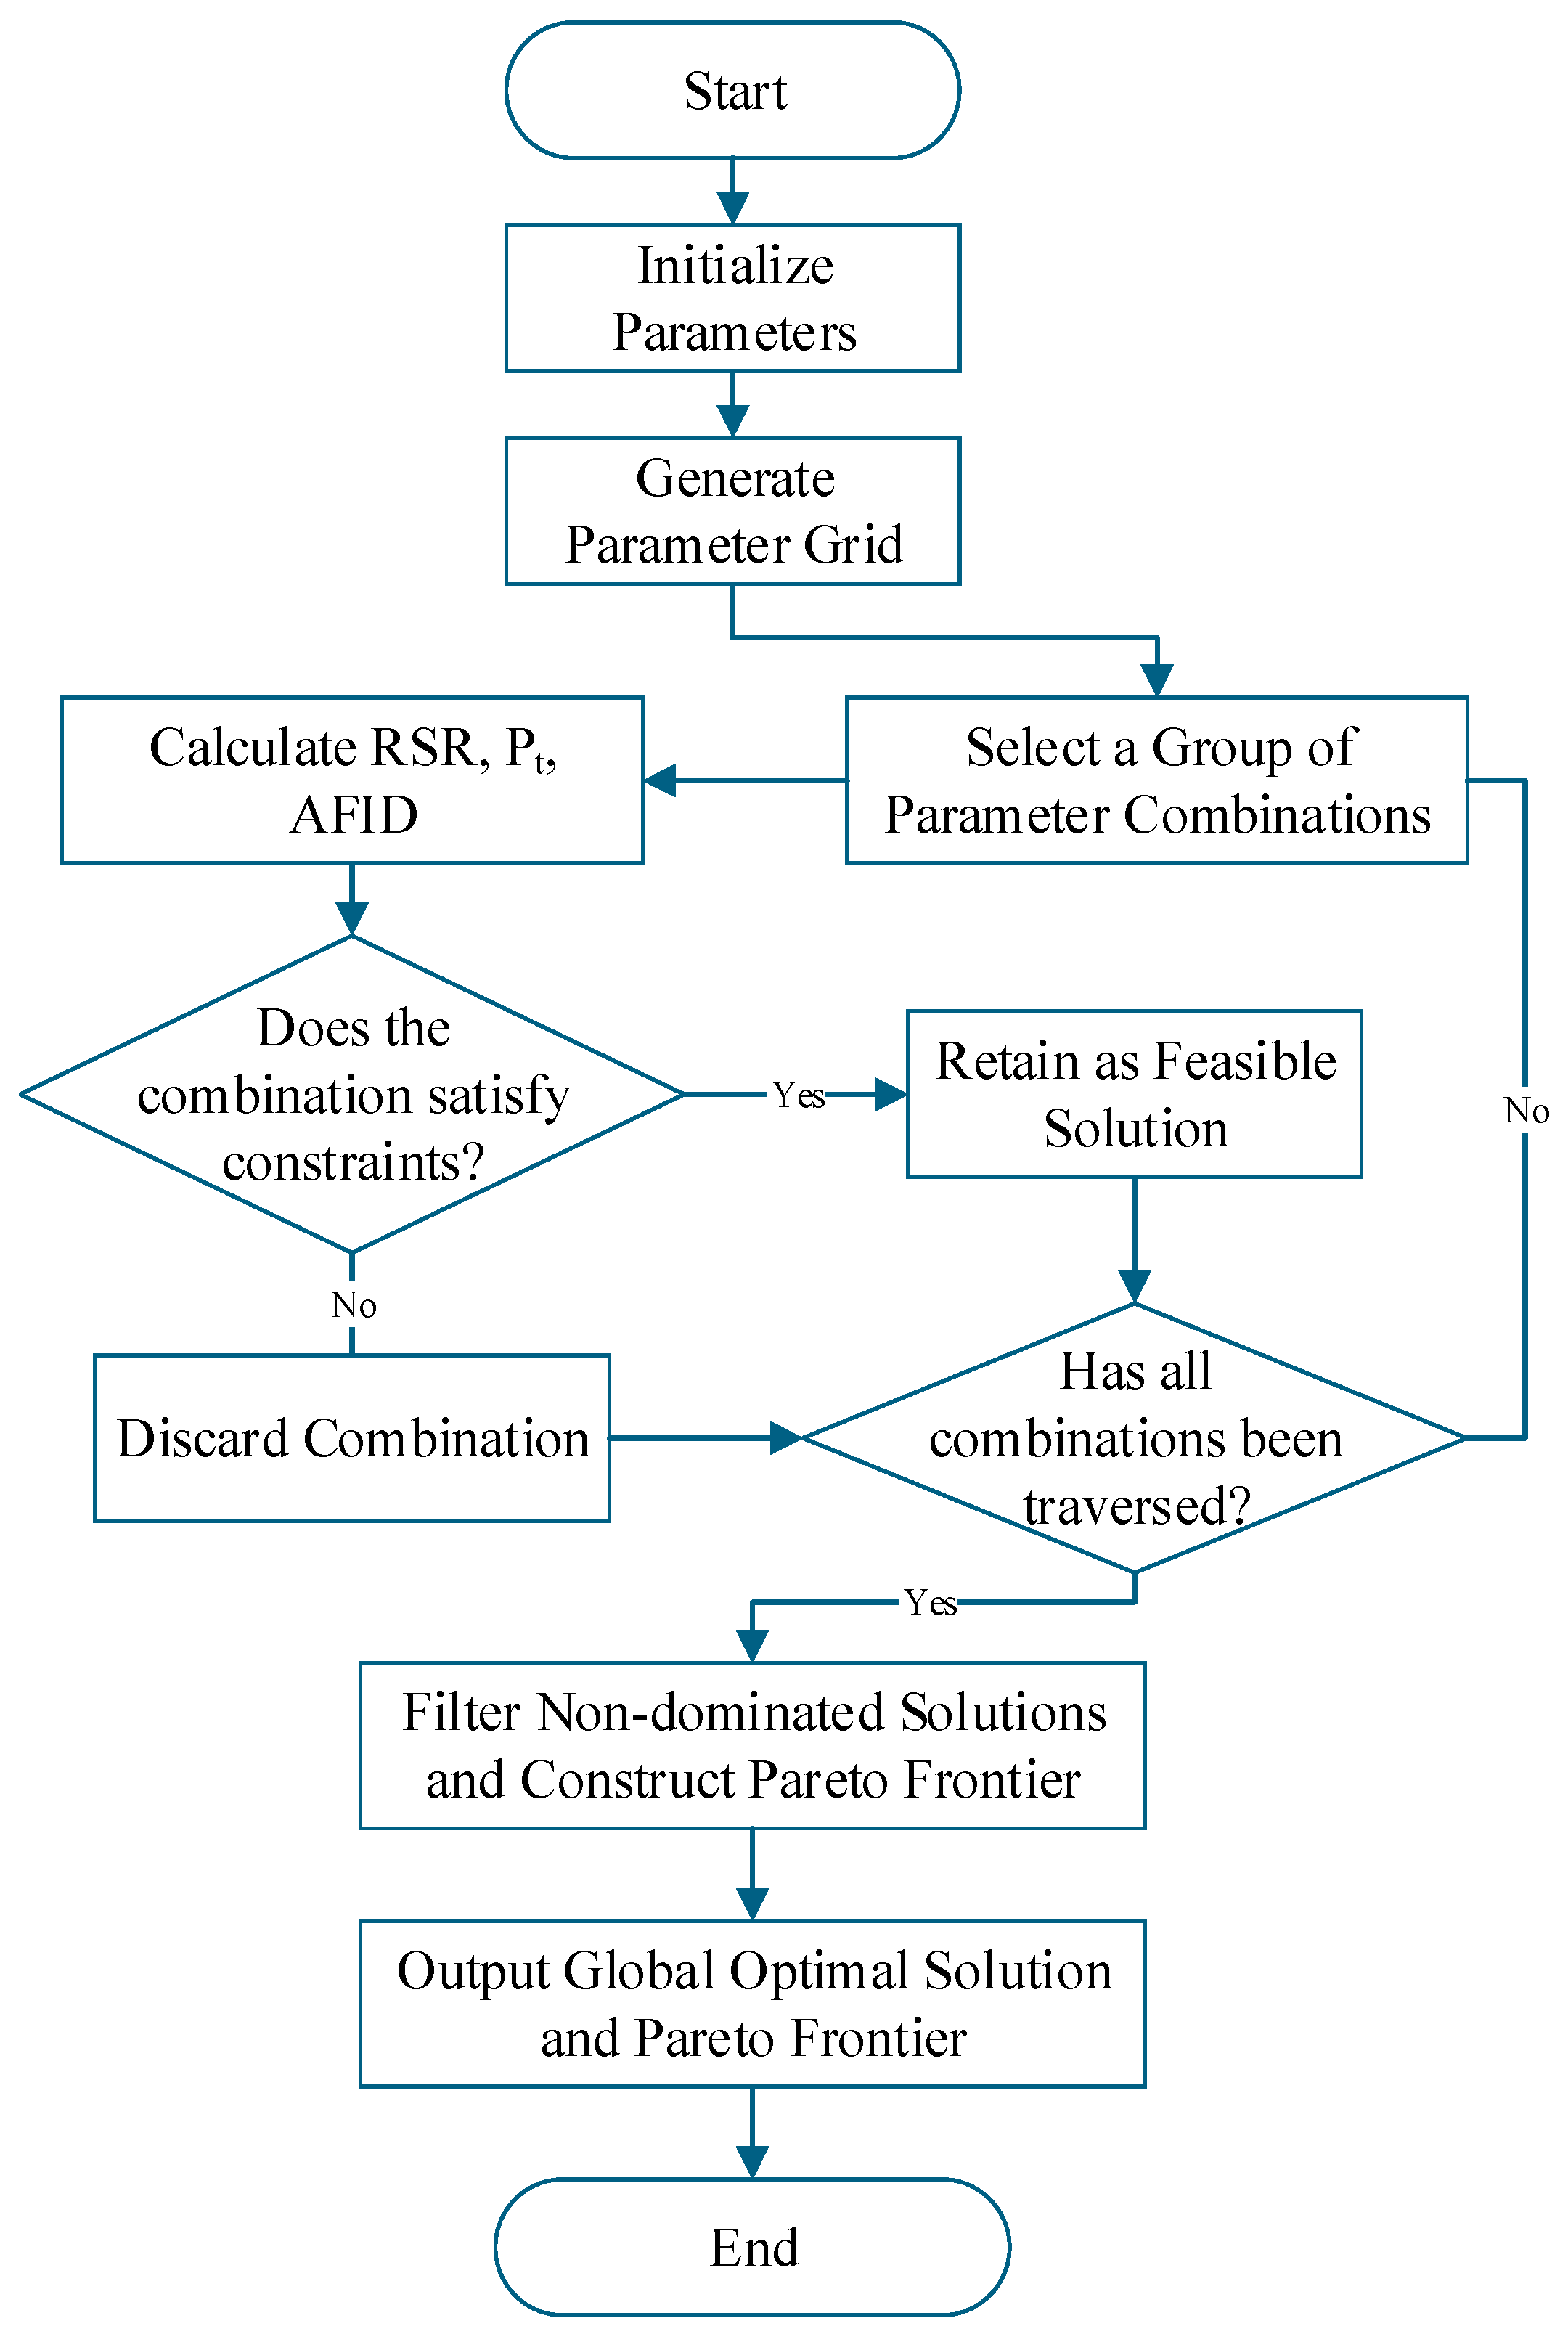
To ensure global optimality and avoid local optima, an exhaustive search algorithm is employed to perform a comprehensive traversal of all feasible parameter combinations. The algorithm’s execution process consists of four primary stages: parameter grid generation, performance evaluation, constraint verification, and the extraction of the optimal solution set and Pareto front. The detailed workflow of this optimization process is illustrated in
Figure 4.
The optimization algorithm proceeds through the following four stages:
Parameter Grid Generation: Uniform discrete sampling is applied to the decision variables within their defined ranges. Specifically, the scan window () and scan interval () are discretized into 19 candidate values each, with step sizes of 5 ms and 50 ms, respectively. The channel dwell time () is subject to the constraints that the sum of dwell times across all channels must equal and each value must be an integer multiple of 0.625 ms (e.g., for ms, can take values such as ms or ms). The PHY rate is fixed to one of four modes: 1 Mbps, 2 Mbps, 125 kbps, or 500 kbps, resulting in a total search space of approximately 1444 combinations. This exhaustive grid generation ensures that the global optimum is identified within the defined discrete parameter space.
Parameter Evaluation: Based on the established link budget, collision, and recognition success probability models, each parameter combination is quantitatively evaluated. To ensure mathematical tractability, we adopt a decoupling assumption where and are treated as independent probabilistic events within a single observation window, and the reception probability is calculated as an expected success probability. This process outputs three core performance metrics: RSR, , and AFID.
Constraint Verification: Infeasible solutions are filtered out based on three mandatory criteria: (i) an RSR theoretically approaching ≥99.9999% (meeting civil UAV safety identification requirements); (ii) compliance with horizontal/vertical safety separation standards (30 m/10 m); and (iii) adherence to the BLE protocol timing constraints (i.e., all time-related parameters must be integer multiples of 0.625 ms).
Optimal Solution Selection and Pareto Front Extraction: From the set of feasible solutions, non-dominated solutions are identified. A solution is defined as non-dominated if no other feasible solution exists that simultaneously achieves a higher Recognition Success Rate (RSR) and lower power consumption. The collection of all such non-dominated solutions forms the Pareto front. Finally, the global optimal solution is selected from this front, representing the configuration that achieves the best trade-off between maximizing RSR and minimizing power consumption.
4. Simulation Experiments and Result Analysis
To comprehensively evaluate the effectiveness of the proposed BLE-based autonomous UAV identification scheme, simulation experiments were conducted in both one-dimensional (1D) and three-dimensional (3D) scenarios. The experimental parameters were configured as follows: the number of UAVs ranged from 1 to 20, the communication distance varied between 50 m and 500 m, and various PHY rates and scanning parameters were considered. The broadcast interval was set to 15 ms, with a transmission power of 0 dBm. In the 1D scenario, UAVs were distributed along a straight line, whereas in the 3D scenario, UAVs were uniformly distributed within a spatial volume of [−500, 500] m × [−500, 500] m × [0, 300] m.
4.1. One-Dimensional Scenario Experiment
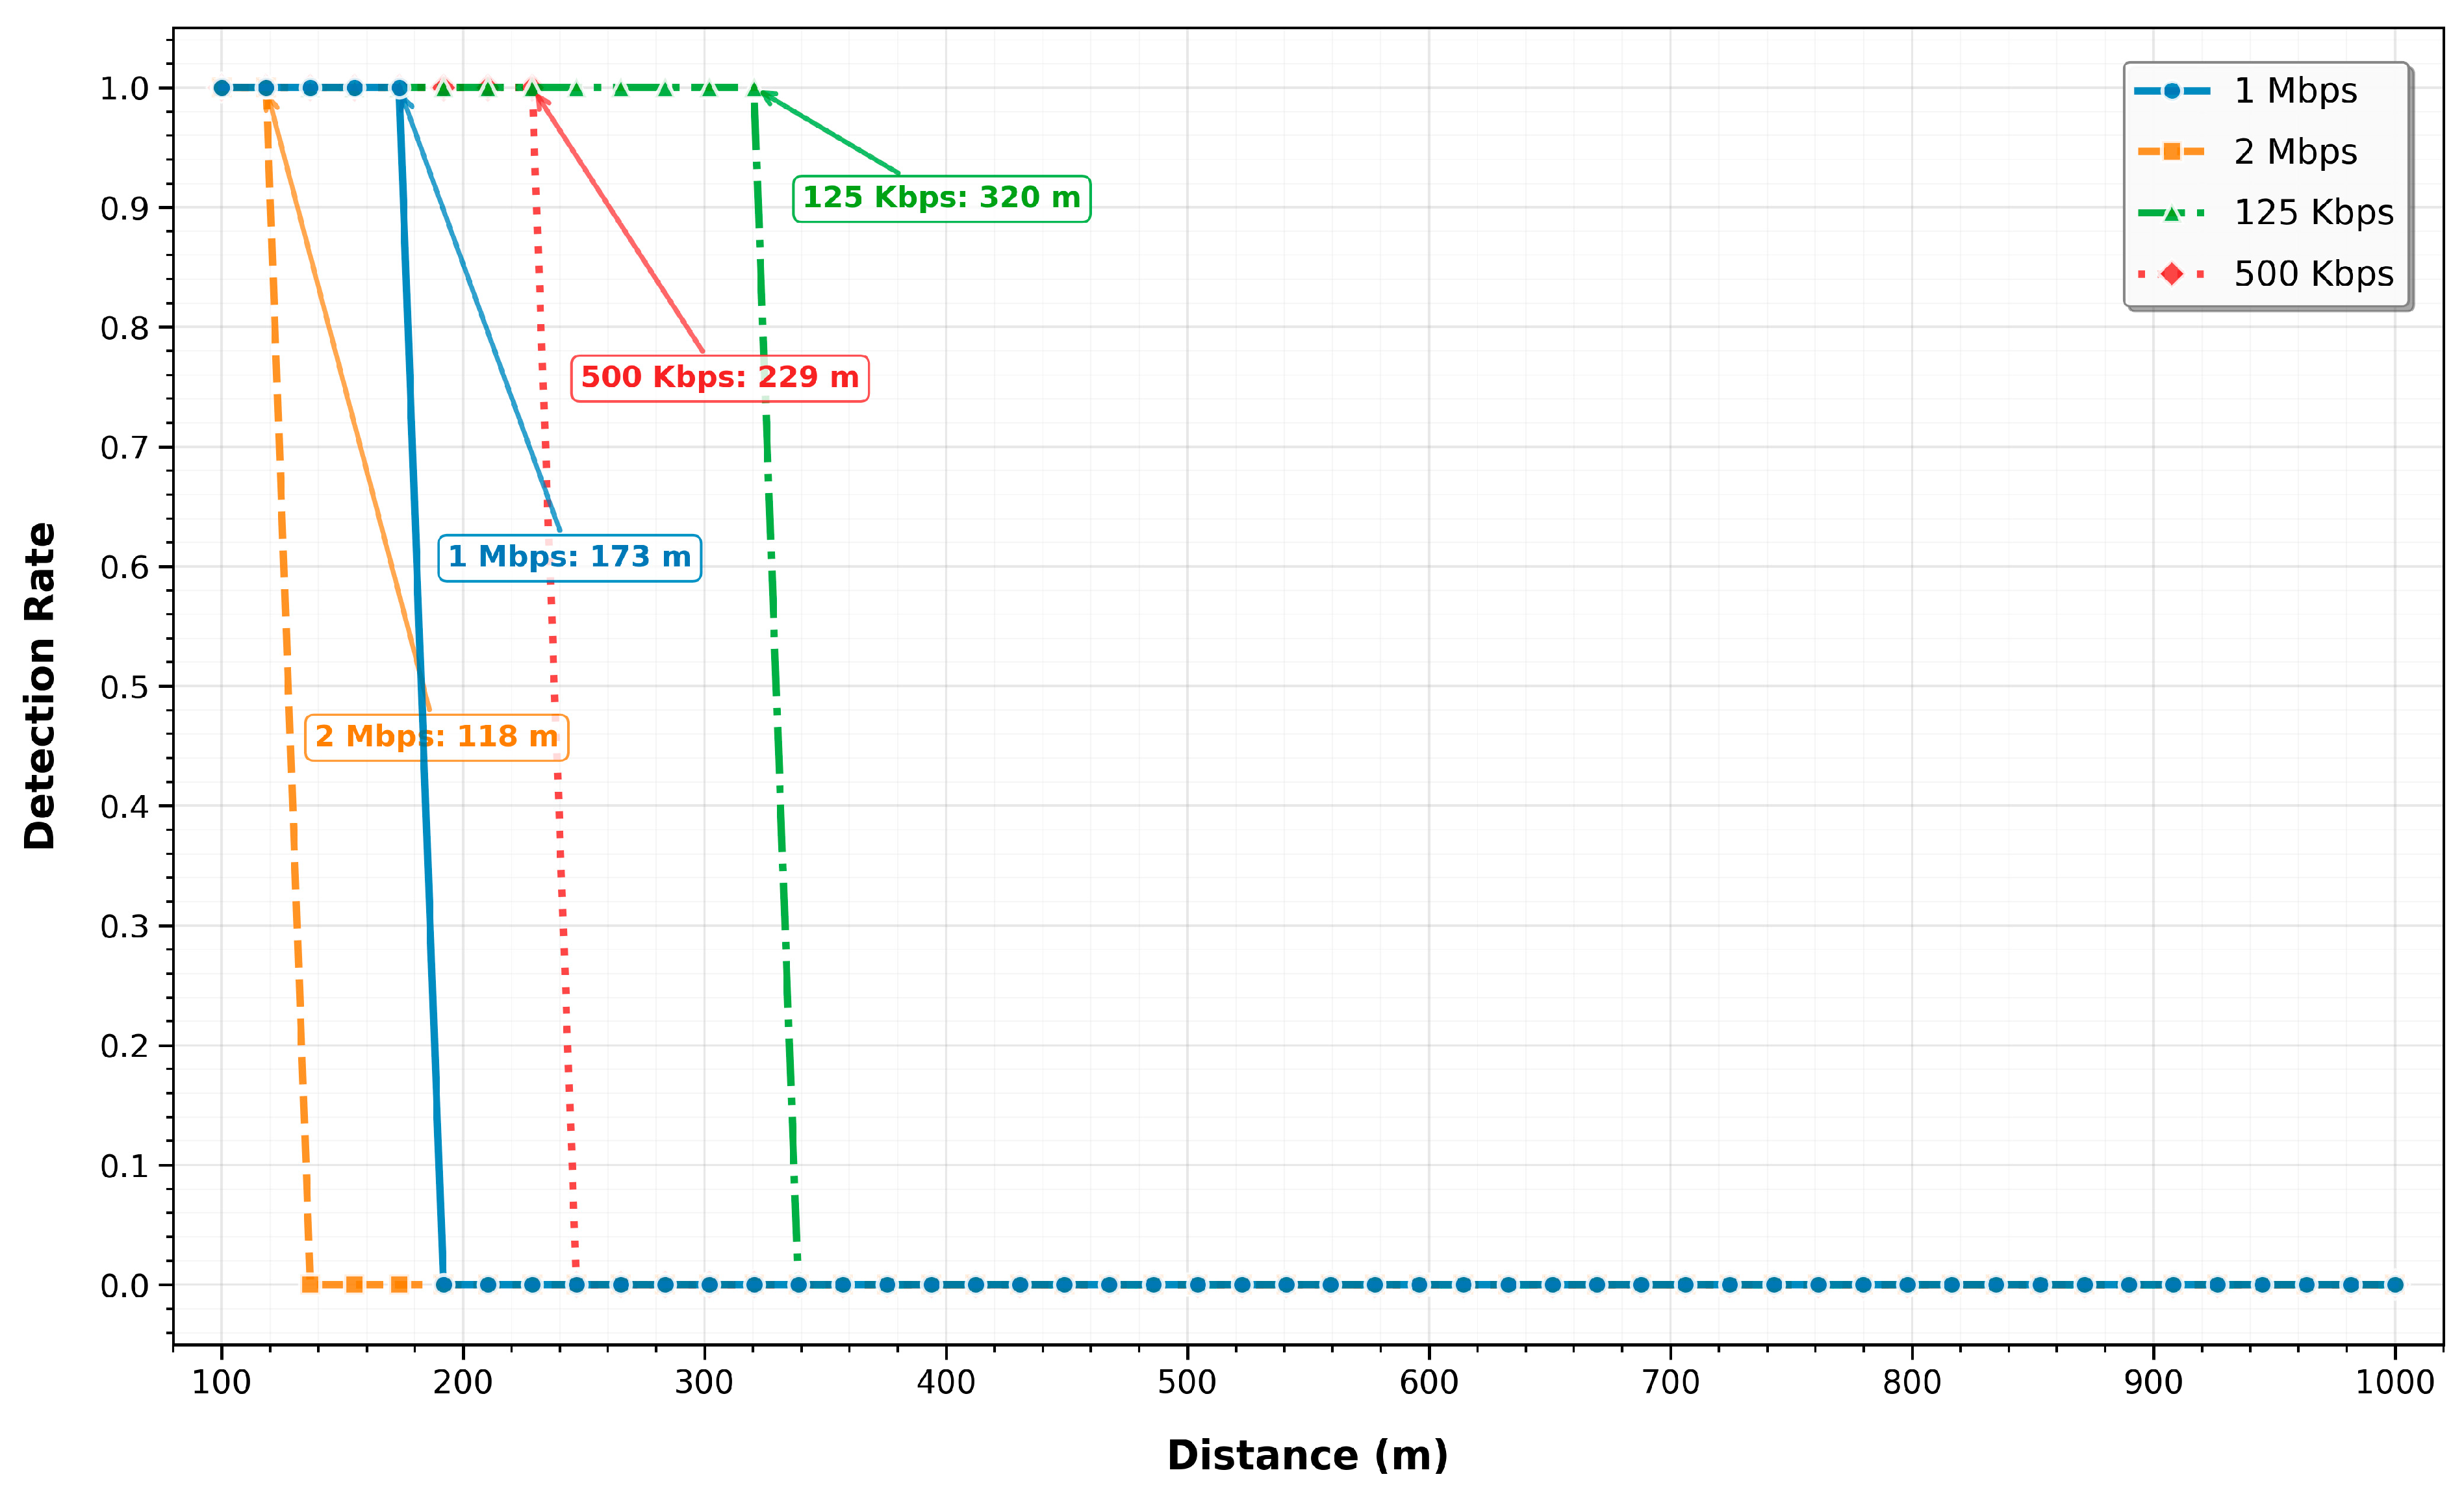
This section focuses on the Recognition Success Rate (RSR), a core performance metric, within a one-dimensional linear scenario. By analyzing the impact of communication distance and PHY rates on RSR, the identification capability of the proposed scheme is validated in a fundamental setting. The integration of a three-channel composite reception probability and safety interval constraints leads to a significant improvement in RSR. Specifically, the RSR achieves 100% within a range of 150 m, effectively satisfying the failure rate requirement of
. Beyond this range, the RSR exhibits a gradual decline. Notably, the PHY 1 Mbps rate demonstrates superior performance within the 150 m threshold, as illustrated in
Figure 5, which depicts the RSR attenuation trends across varying distances.
In a scenario featuring 15 UAVs at a distance of 150 m, the PHY 1 Mbps rate achieves the optimal balance among RSR, power consumption, and latency. Although other PHY rates also approach a 100% recognition success rate, the PHY 1 Mbps configuration demonstrates superior overall performance, particularly in maintaining high reliability while minimizing power consumption. Based on the experimental data, it is evident that the PHY 1 Mbps rate ensures robust performance even under dynamic relative velocities. The performance comparison of RSR across different PHY rates is summarized in
Table 1.
4.2. Three-Dimensional Scene Experiment
In the 3D scenario, the trend of RSR versus distance remains consistent with that observed in the 1D scenario, albeit with slightly lower overall values due to the more dispersed distribution of UAVs in three-dimensional space. The recognition rate exhibits a downward trend as distance increases, maintaining above 80% within 200 m and dropping below 50% at 400 m. As illustrated in
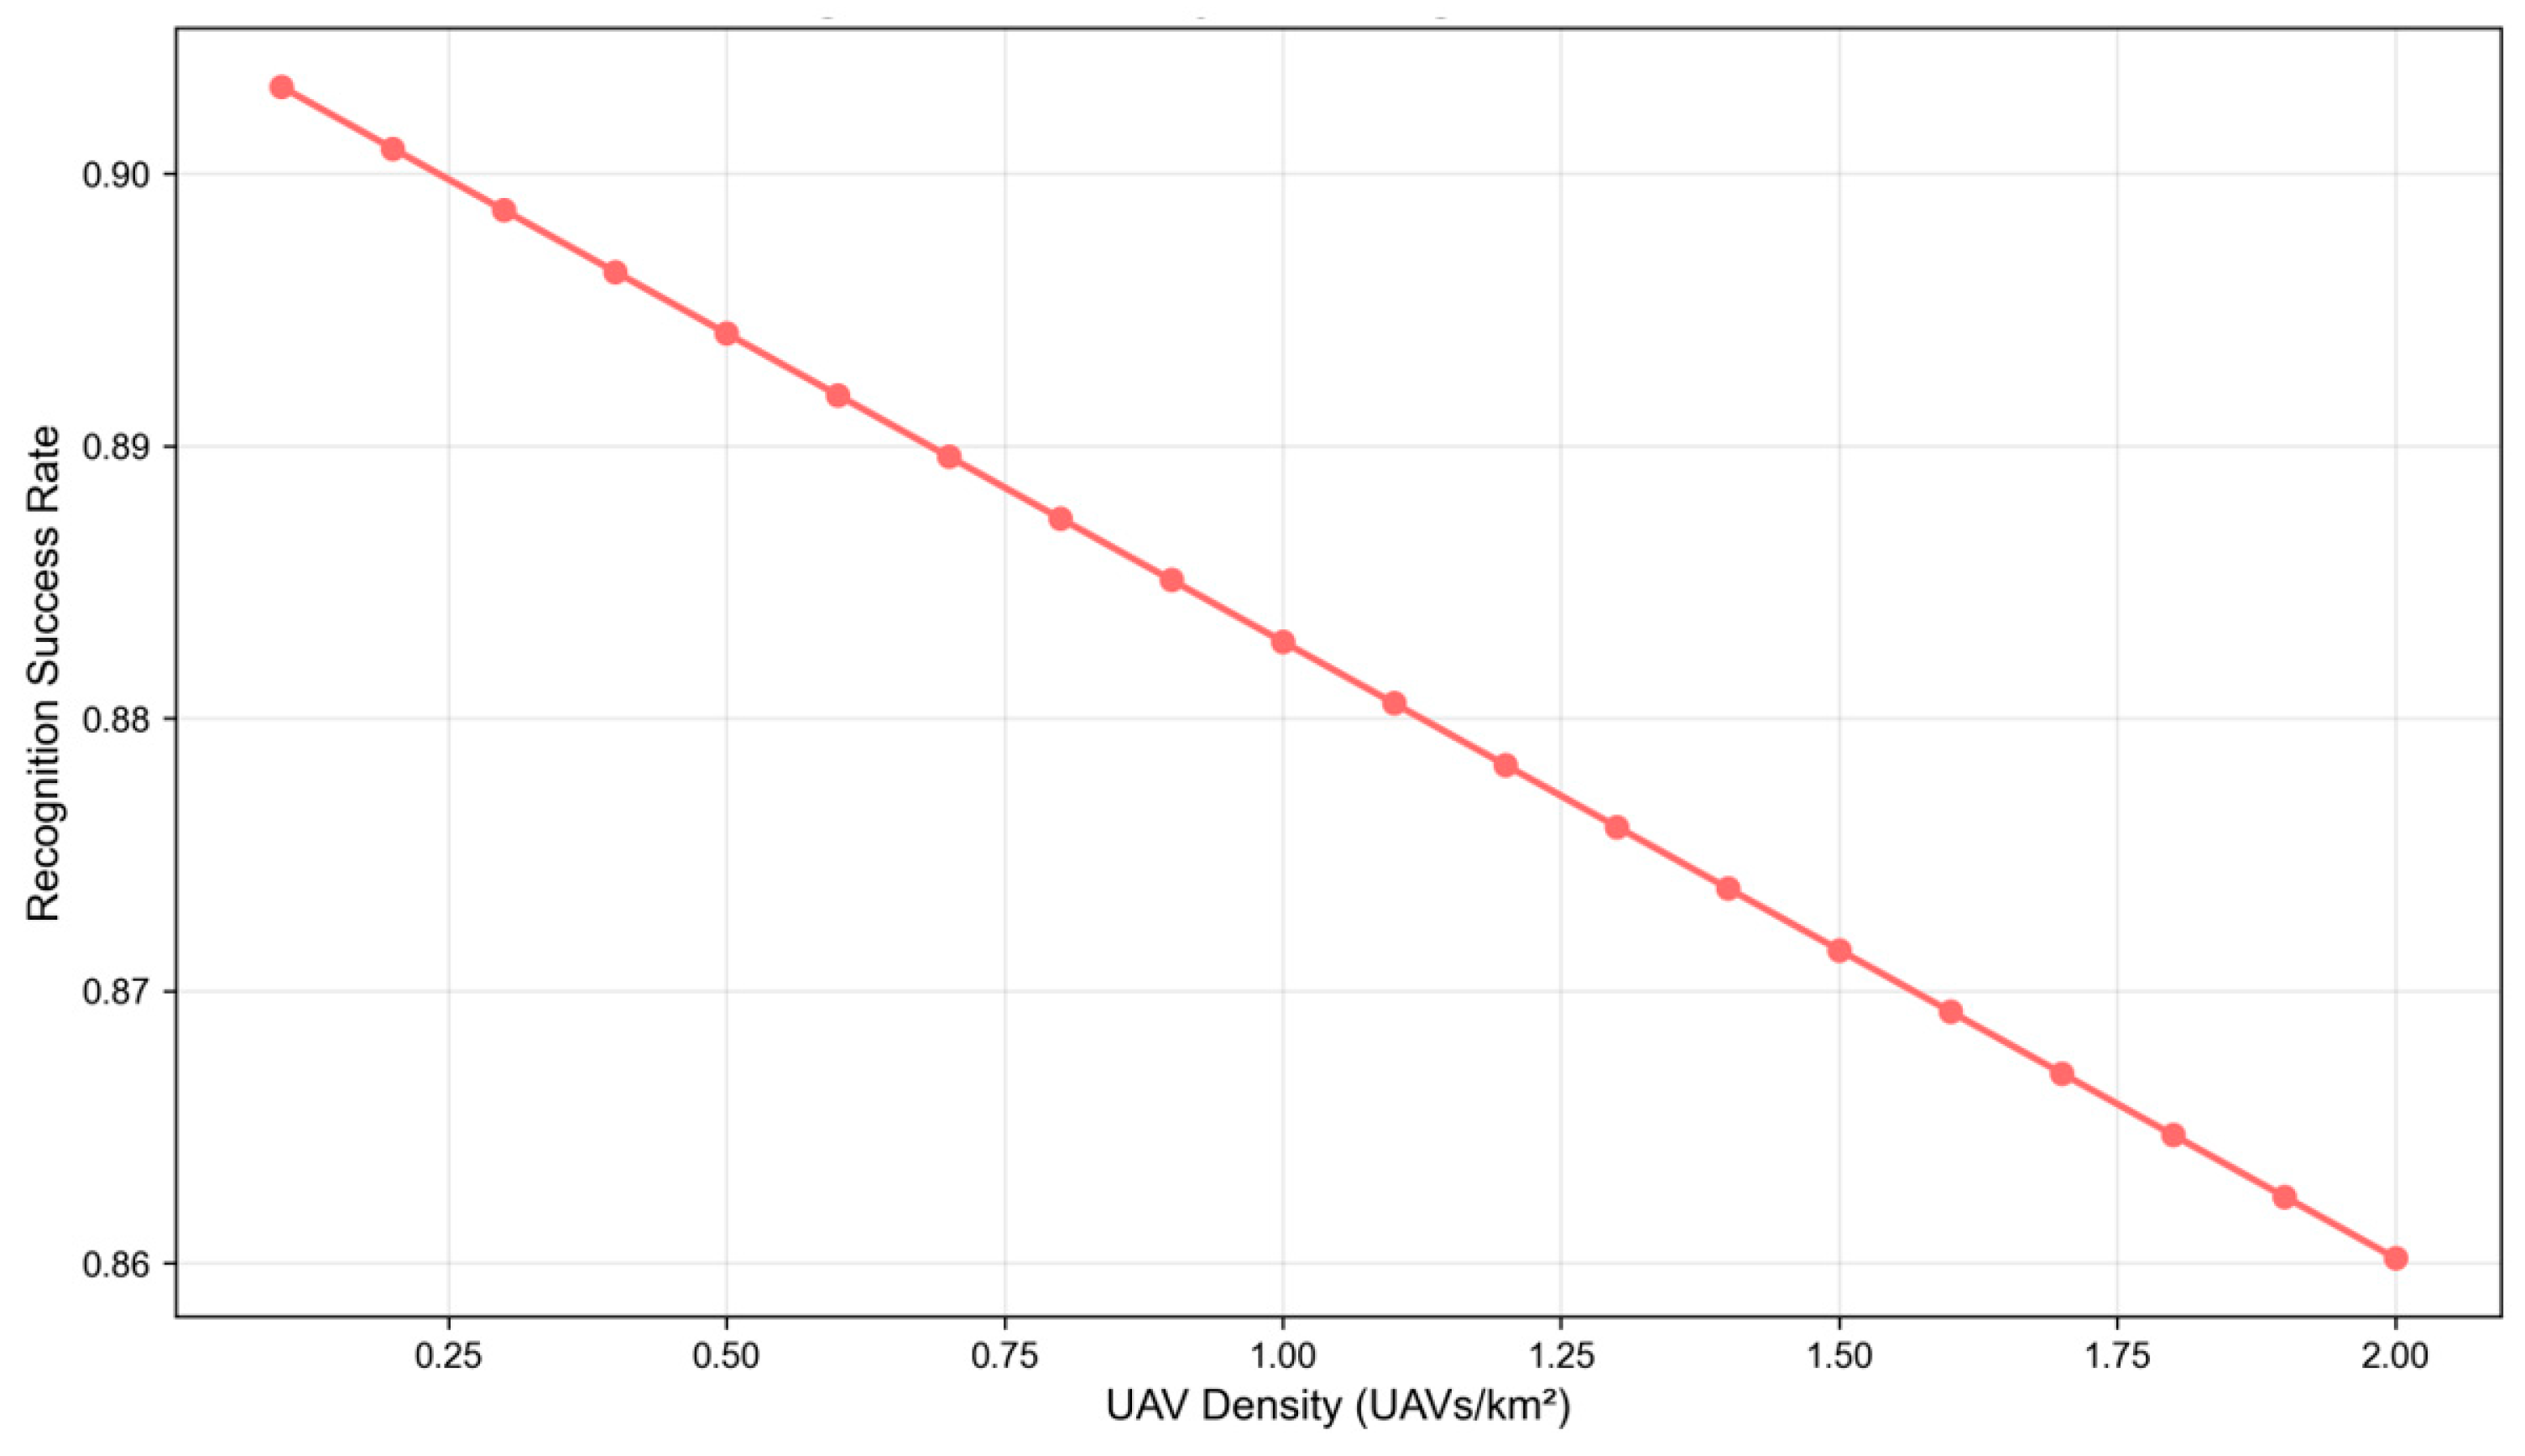
Figure 6, the identification performance remains stable at a density of 2 UAVs/km
2.
By quantifying the impact of spatial density on identification performance, we highlight the correlation between density thresholds and system stability. At a low density of 0.1 UAVs/km2, the RSR reaches its peak, stabilizing at approximately 0.903. As the spatial density increases from 0.1 to 2.0 UAVs/km2, the RSR exhibits a continuous, approximately linear decline, eventually reaching 0.860 at 2.0 UAVs/km2. The underlying mechanism for this degradation is that as the number of UAVs per unit airspace increases, the spatial reuse of Bluetooth Remote ID signals intensifies, leading to a significant increase in packet collision probability and inter-signal interference, which consequently compromises identification reliability. Furthermore, while the RSR remains above 0.89 when the density is below 0.5 UAVs/km2, the system remains susceptible to performance fluctuations under extreme occlusion conditions due to limited signal coverage redundancy. As the density exceeds 1.5 UAVs/km2, the RSR drops below 0.87. Therefore, to ensure stable identification performance, it is recommended to maintain the UAV deployment density within a threshold of 1.5 UAVs/km2, thereby mitigating the risk of reliability degradation caused by channel congestion.
4.3. Comprehensive Feasibility Assessment
4.3.1. Dynamic Performance Analysis
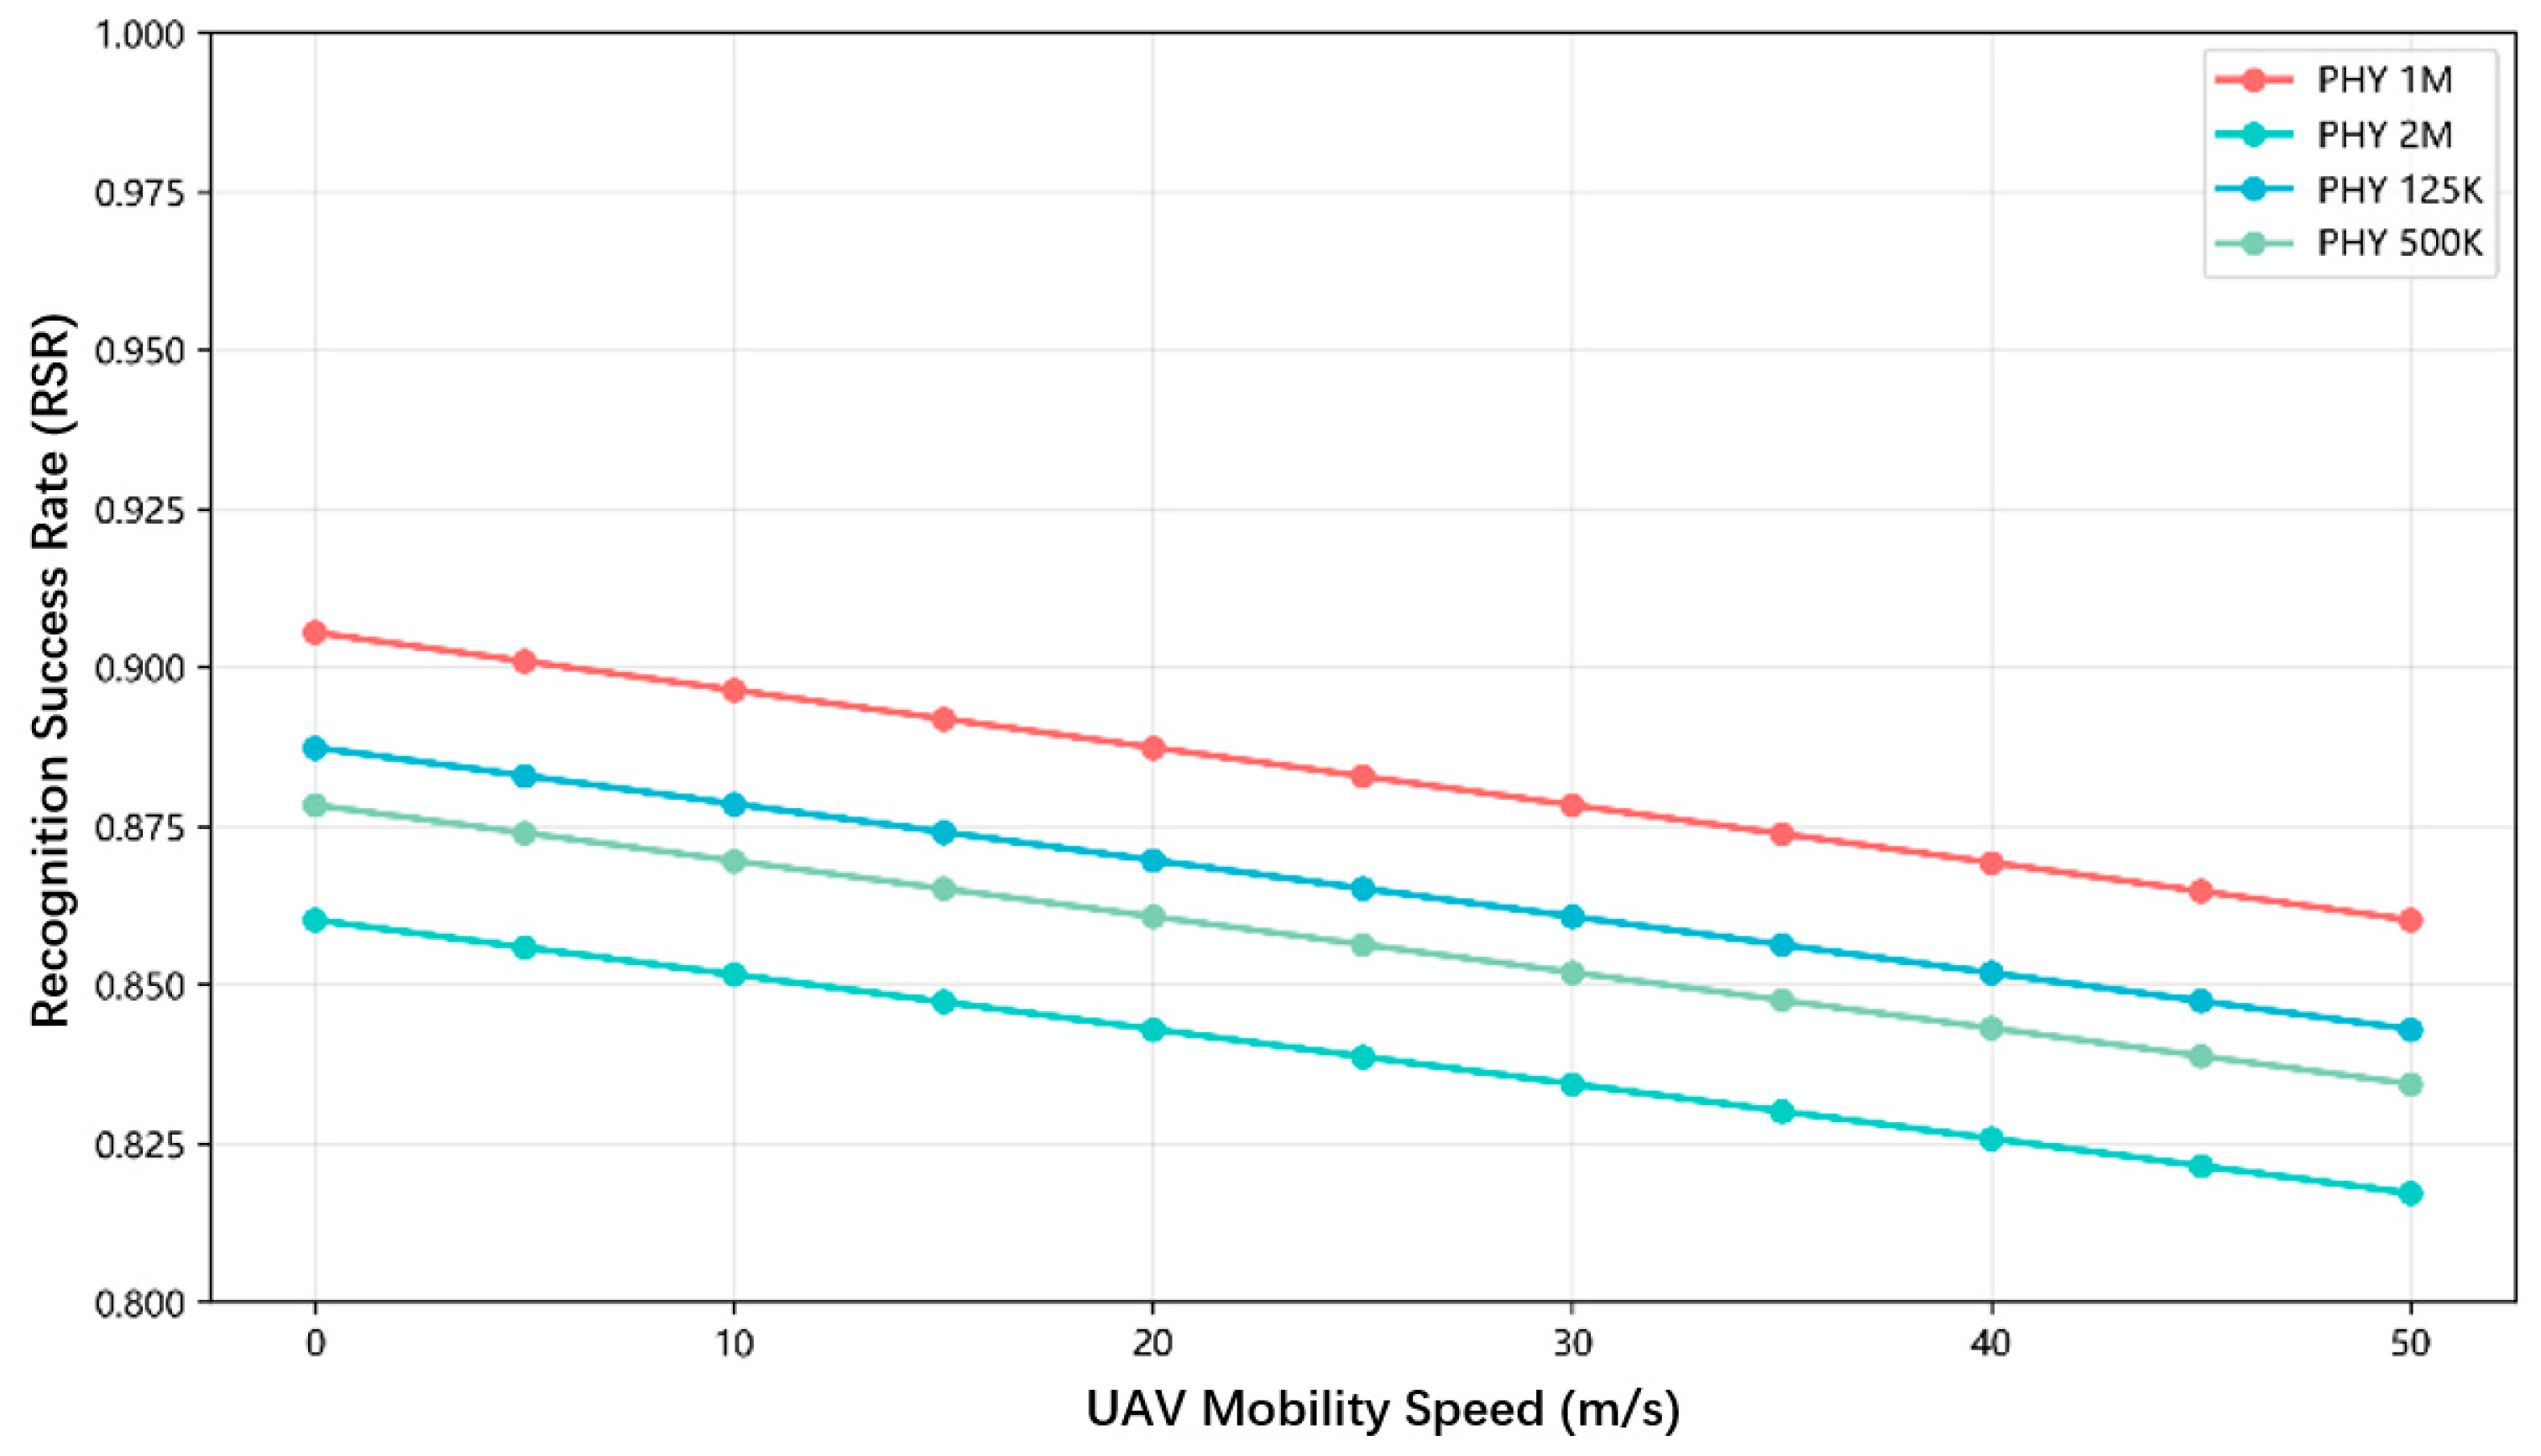
Figure 7 illustrates the impact of UAV mobility on the RSR across different PHY rates. Within the velocity range of 0 to 50 m/s, the RSR for all four PHY rates exhibits a nearly linear decline as the UAV speed increases. Among these, the PHY 1 Mbps rate consistently demonstrates the superior identification performance, with the RSR decreasing from approximately 0.906 at 0 m/s to 0.860 at 50 m/s, maintaining the highest level throughout the entire range. The PHY 125 kbps rate follows, with the RSR dropping from approximately 0.887 to 0.843 over the same interval. The PHY 500 kbps rate performs slightly lower than the 125 kbps rate, with RSR values declining from 0.879 to 0.835. Conversely, the PHY 2 Mbps rate exhibits the poorest performance, with the RSR falling from 0.860 to 0.816.
The primary mechanism underlying this RSR degradation is that high-speed UAV mobility shortens the signal acquisition window, thereby reducing the effective time available for frame synchronization and demodulation, which in turn increases the probability of acquisition failure. Specifically, the PHY 2 Mbps rate is most sensitive to mobility due to its shorter signal frame duration, resulting in the most significant performance deterioration. In contrast, lower-rate PHYs, such as PHY 1 Mbps, exhibit greater robustness against velocity variations due to their longer transmission cycles, leading to the smallest performance decay. Overall, all PHY rates maintain an acceptable RSR within the 50 m/s threshold. The significant performance advantage of the PHY 1 Mbps rate across the entire velocity spectrum provides a quantitative basis for PHY rate selection and velocity threshold planning in dynamic UAV scenarios.
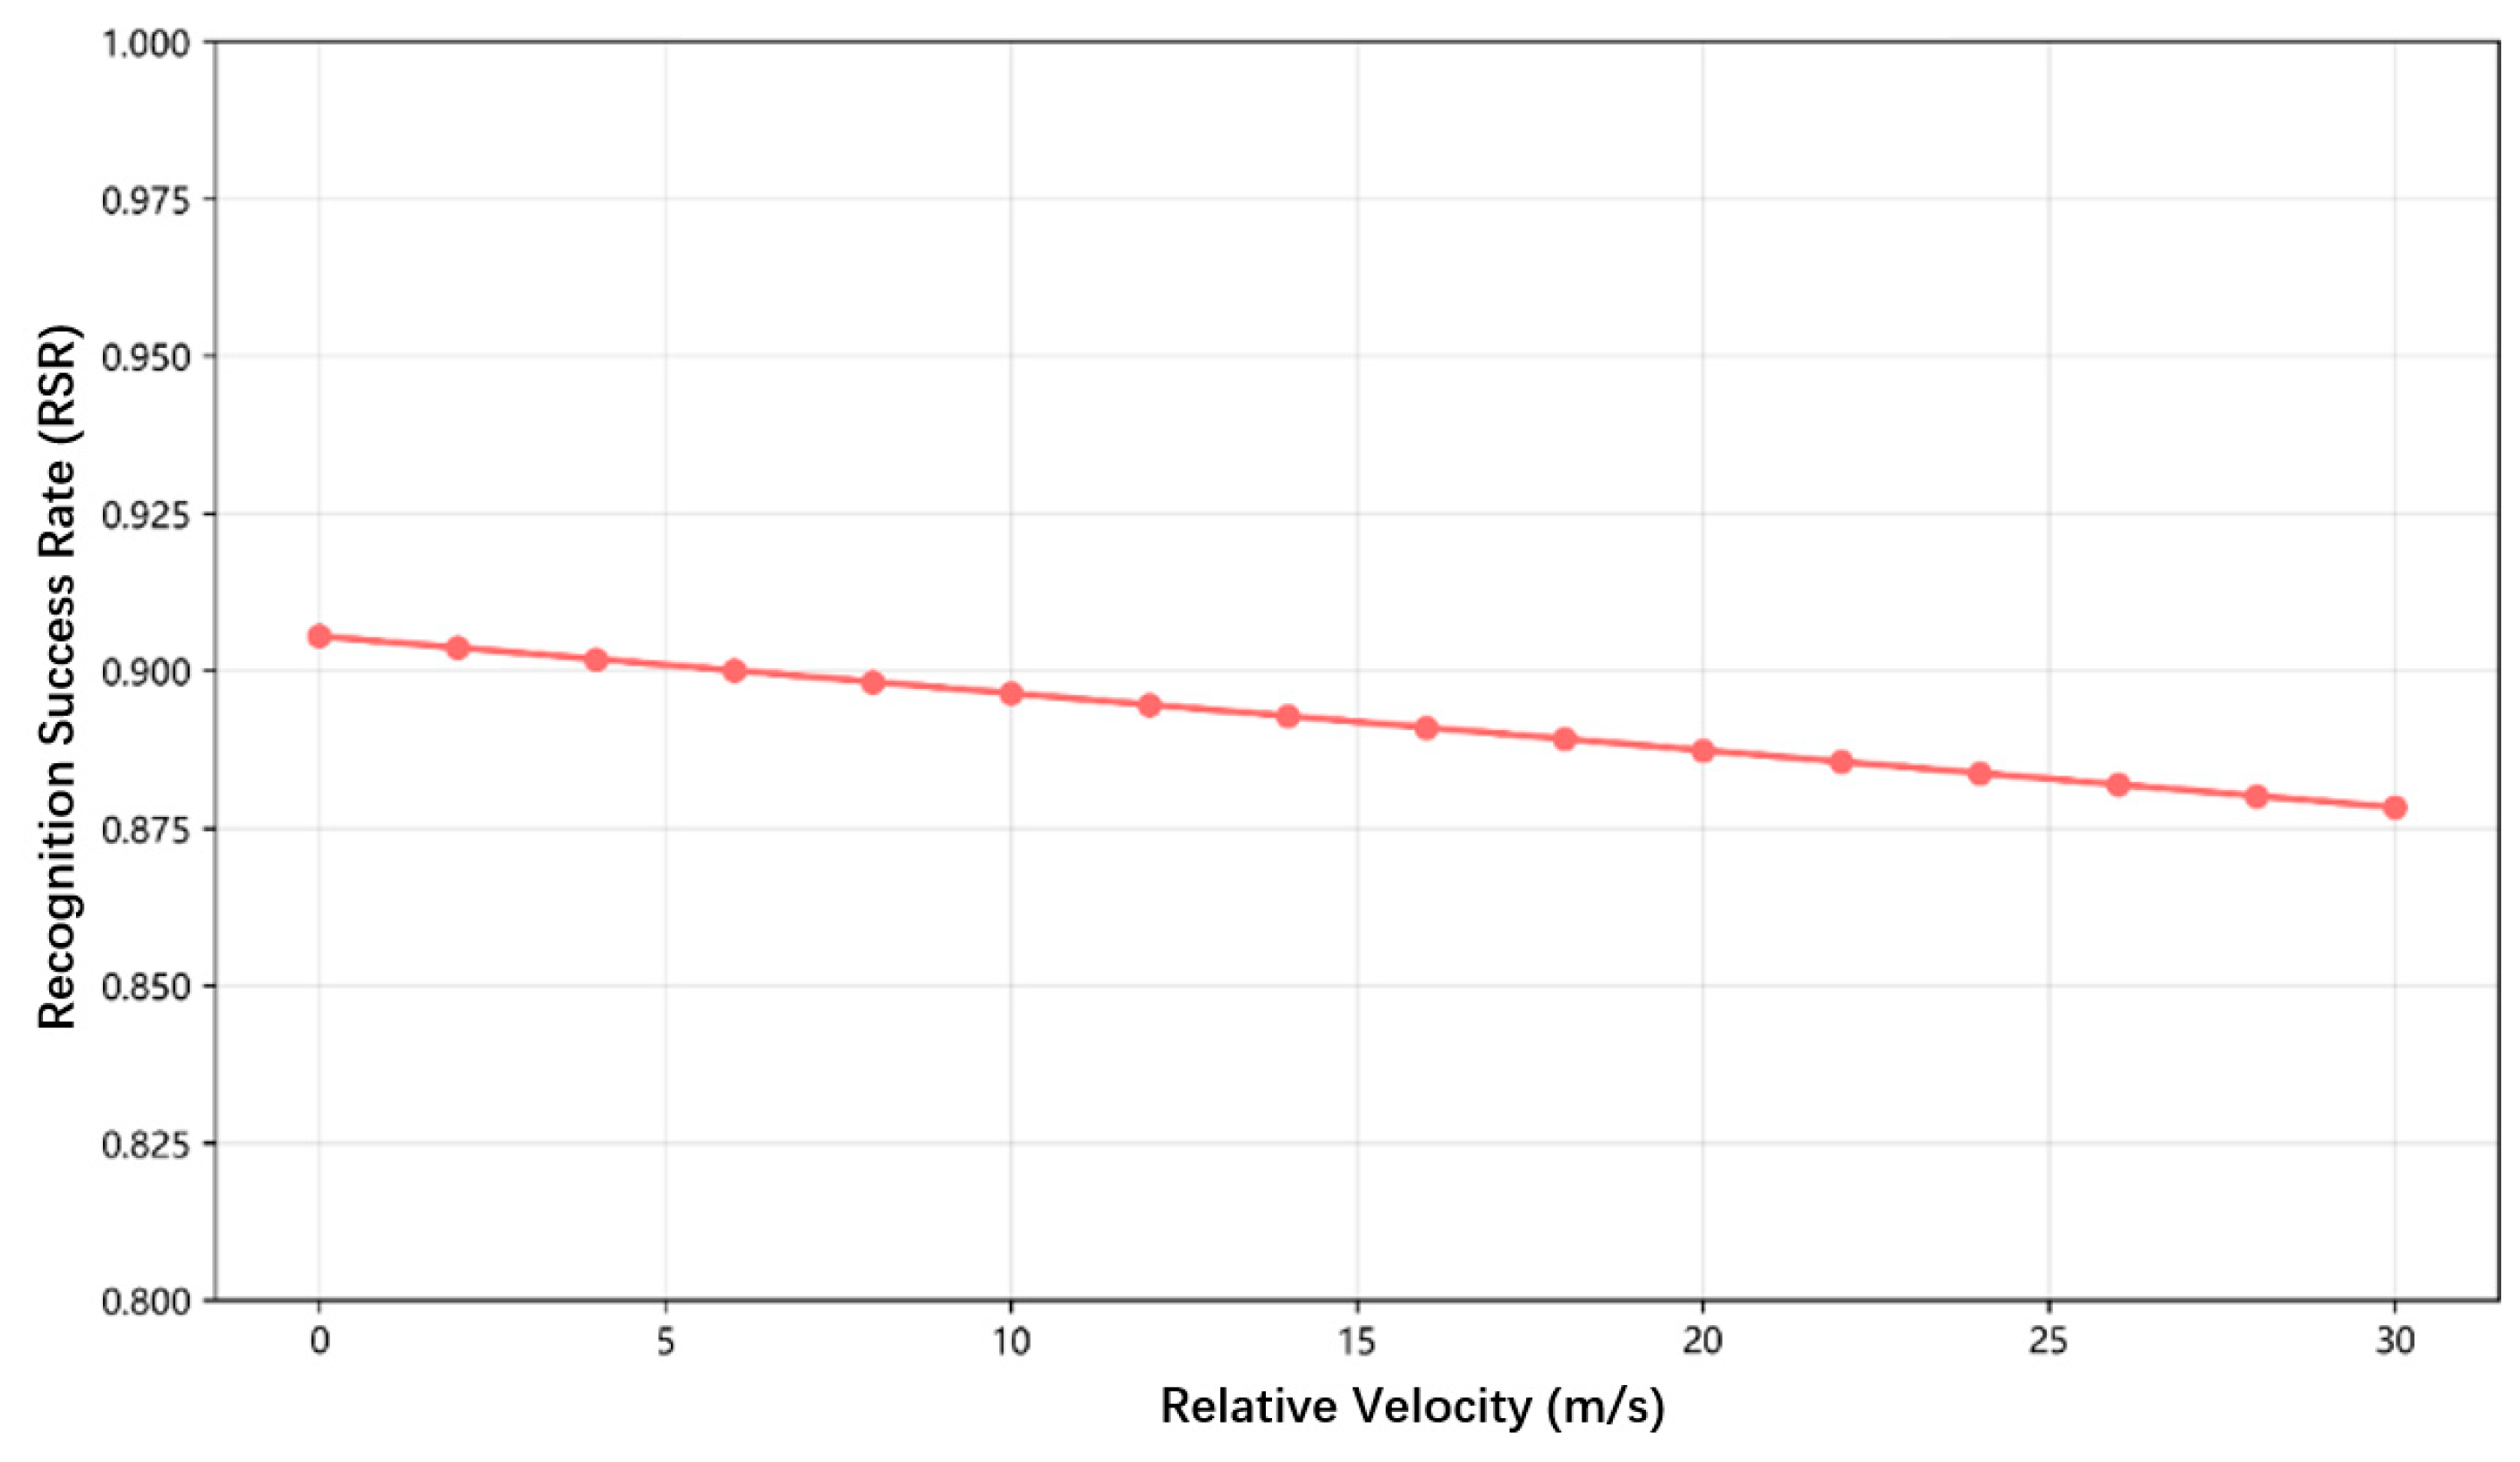
Figure 8 illustrates the impact of the relative velocity of UAVs on the RSR. Within the relative velocity range of 0 to 30 m/s, the RSR exhibits a nearly linear and gradual decline as the relative velocity increases. Specifically, the RSR is approximately 0.906 at a relative velocity of 0 m/s, decreasing to approximately 0.878 at 30 m/s. The primary cause of this RSR degradation is that the relative motion of the UAVs exacerbates Doppler frequency shifts and shortens the effective signal acquisition window, thereby progressively reducing the reliability of signal synchronization and demodulation. Overall, the RSR remains consistently above 0.87 across the 0–30 m/s range. The relatively minor performance degradation demonstrates that the proposed system possesses adaptability to dynamic scenarios involving UAV relative motion.
4.3.2. Environmental Adaptability Analysis
Beyond dynamic motion, the complexity of low-altitude environments is further characterized by altitude variations in three-dimensional space and physical obstructions. In this section, we evaluate the system’s environmental adaptability by simulating various altitude differences and obstruction angles. This analysis aims to explore the performance boundaries of the system in non-ideal communication environments, thereby validating its survivability in complex low-altitude scenarios.
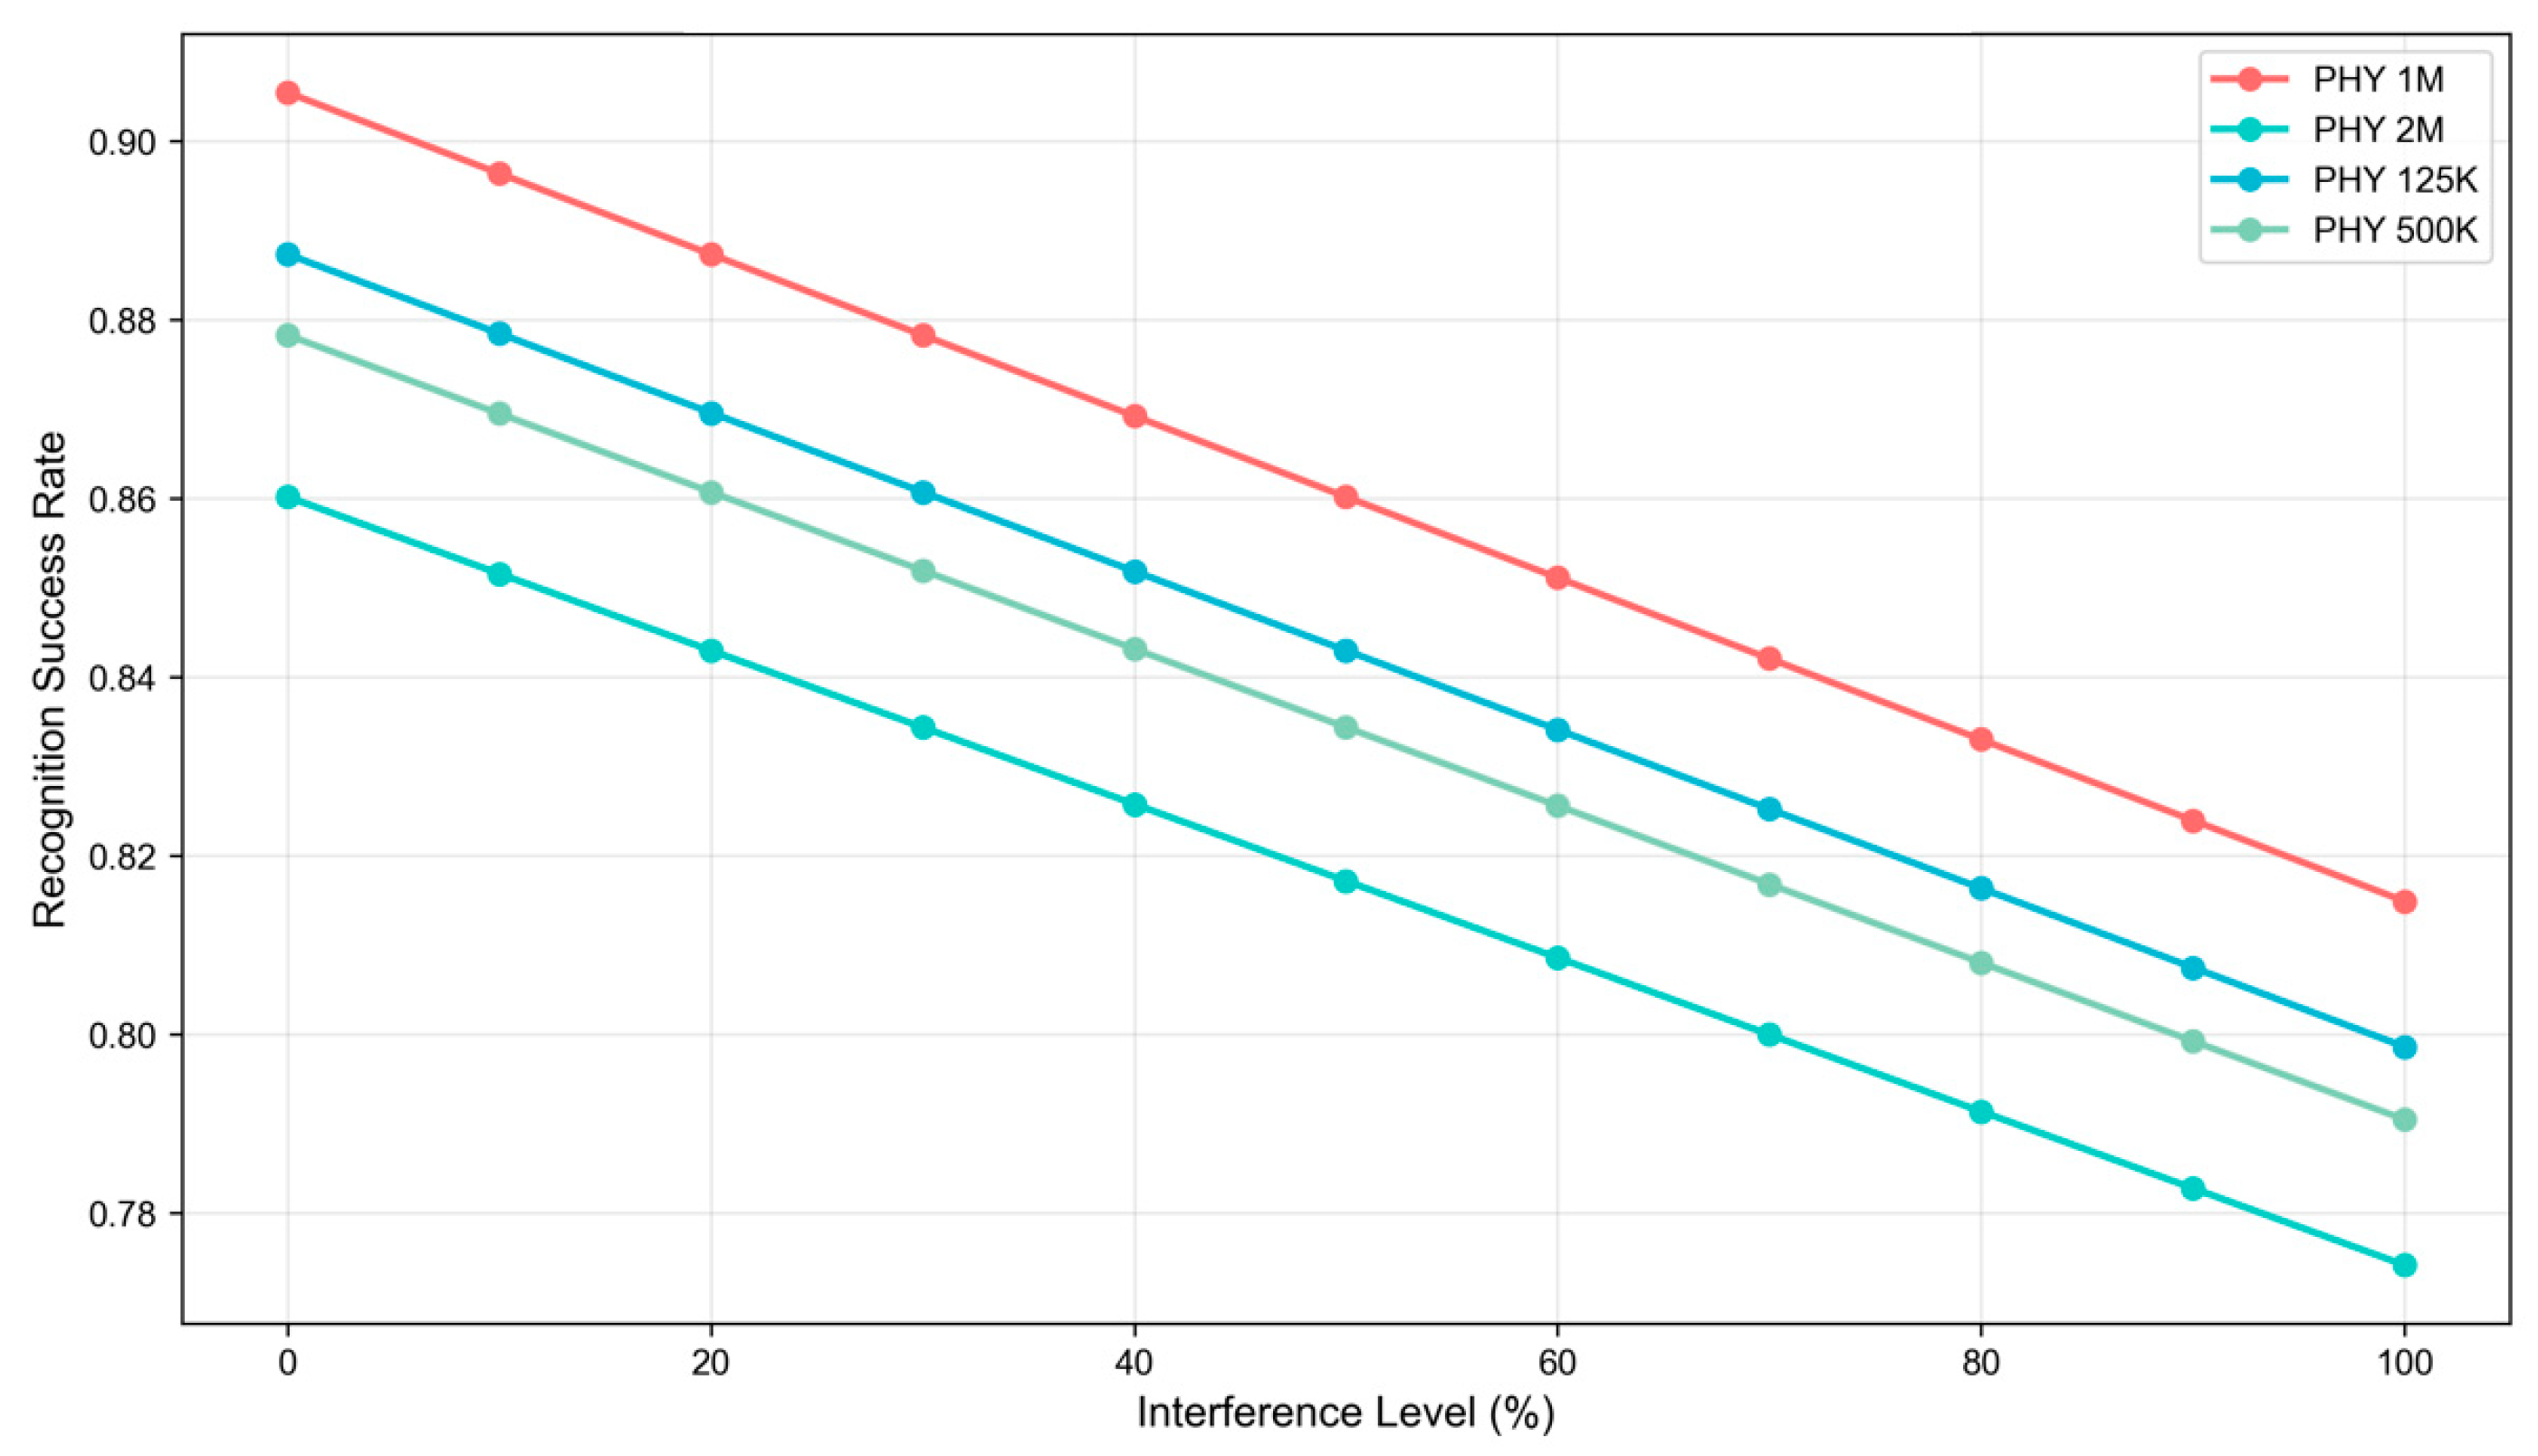
Figure 9 illustrates the significant linear impact of interference intensity on the RSR across different PHY rates. Within the interference intensity range of 0% to 100%, the RSR for all four PHY rates exhibits a continuous decline as interference intensity increases. The PHY 1 Mbps rate demonstrates superior anti-interference performance, consistently maintaining the highest RSR throughout the range, whereas the PHY 2 Mbps rate exhibits the poorest performance. The increase in interference intensity degrades the effective signal-to-noise ratio (SNR), leading to a deterioration in identification performance. These results indicate that the PHY 1 Mbps rate possesses the highest robustness in high-interference scenarios, providing a quantitative basis for anti-interference design and PHY rate selection.
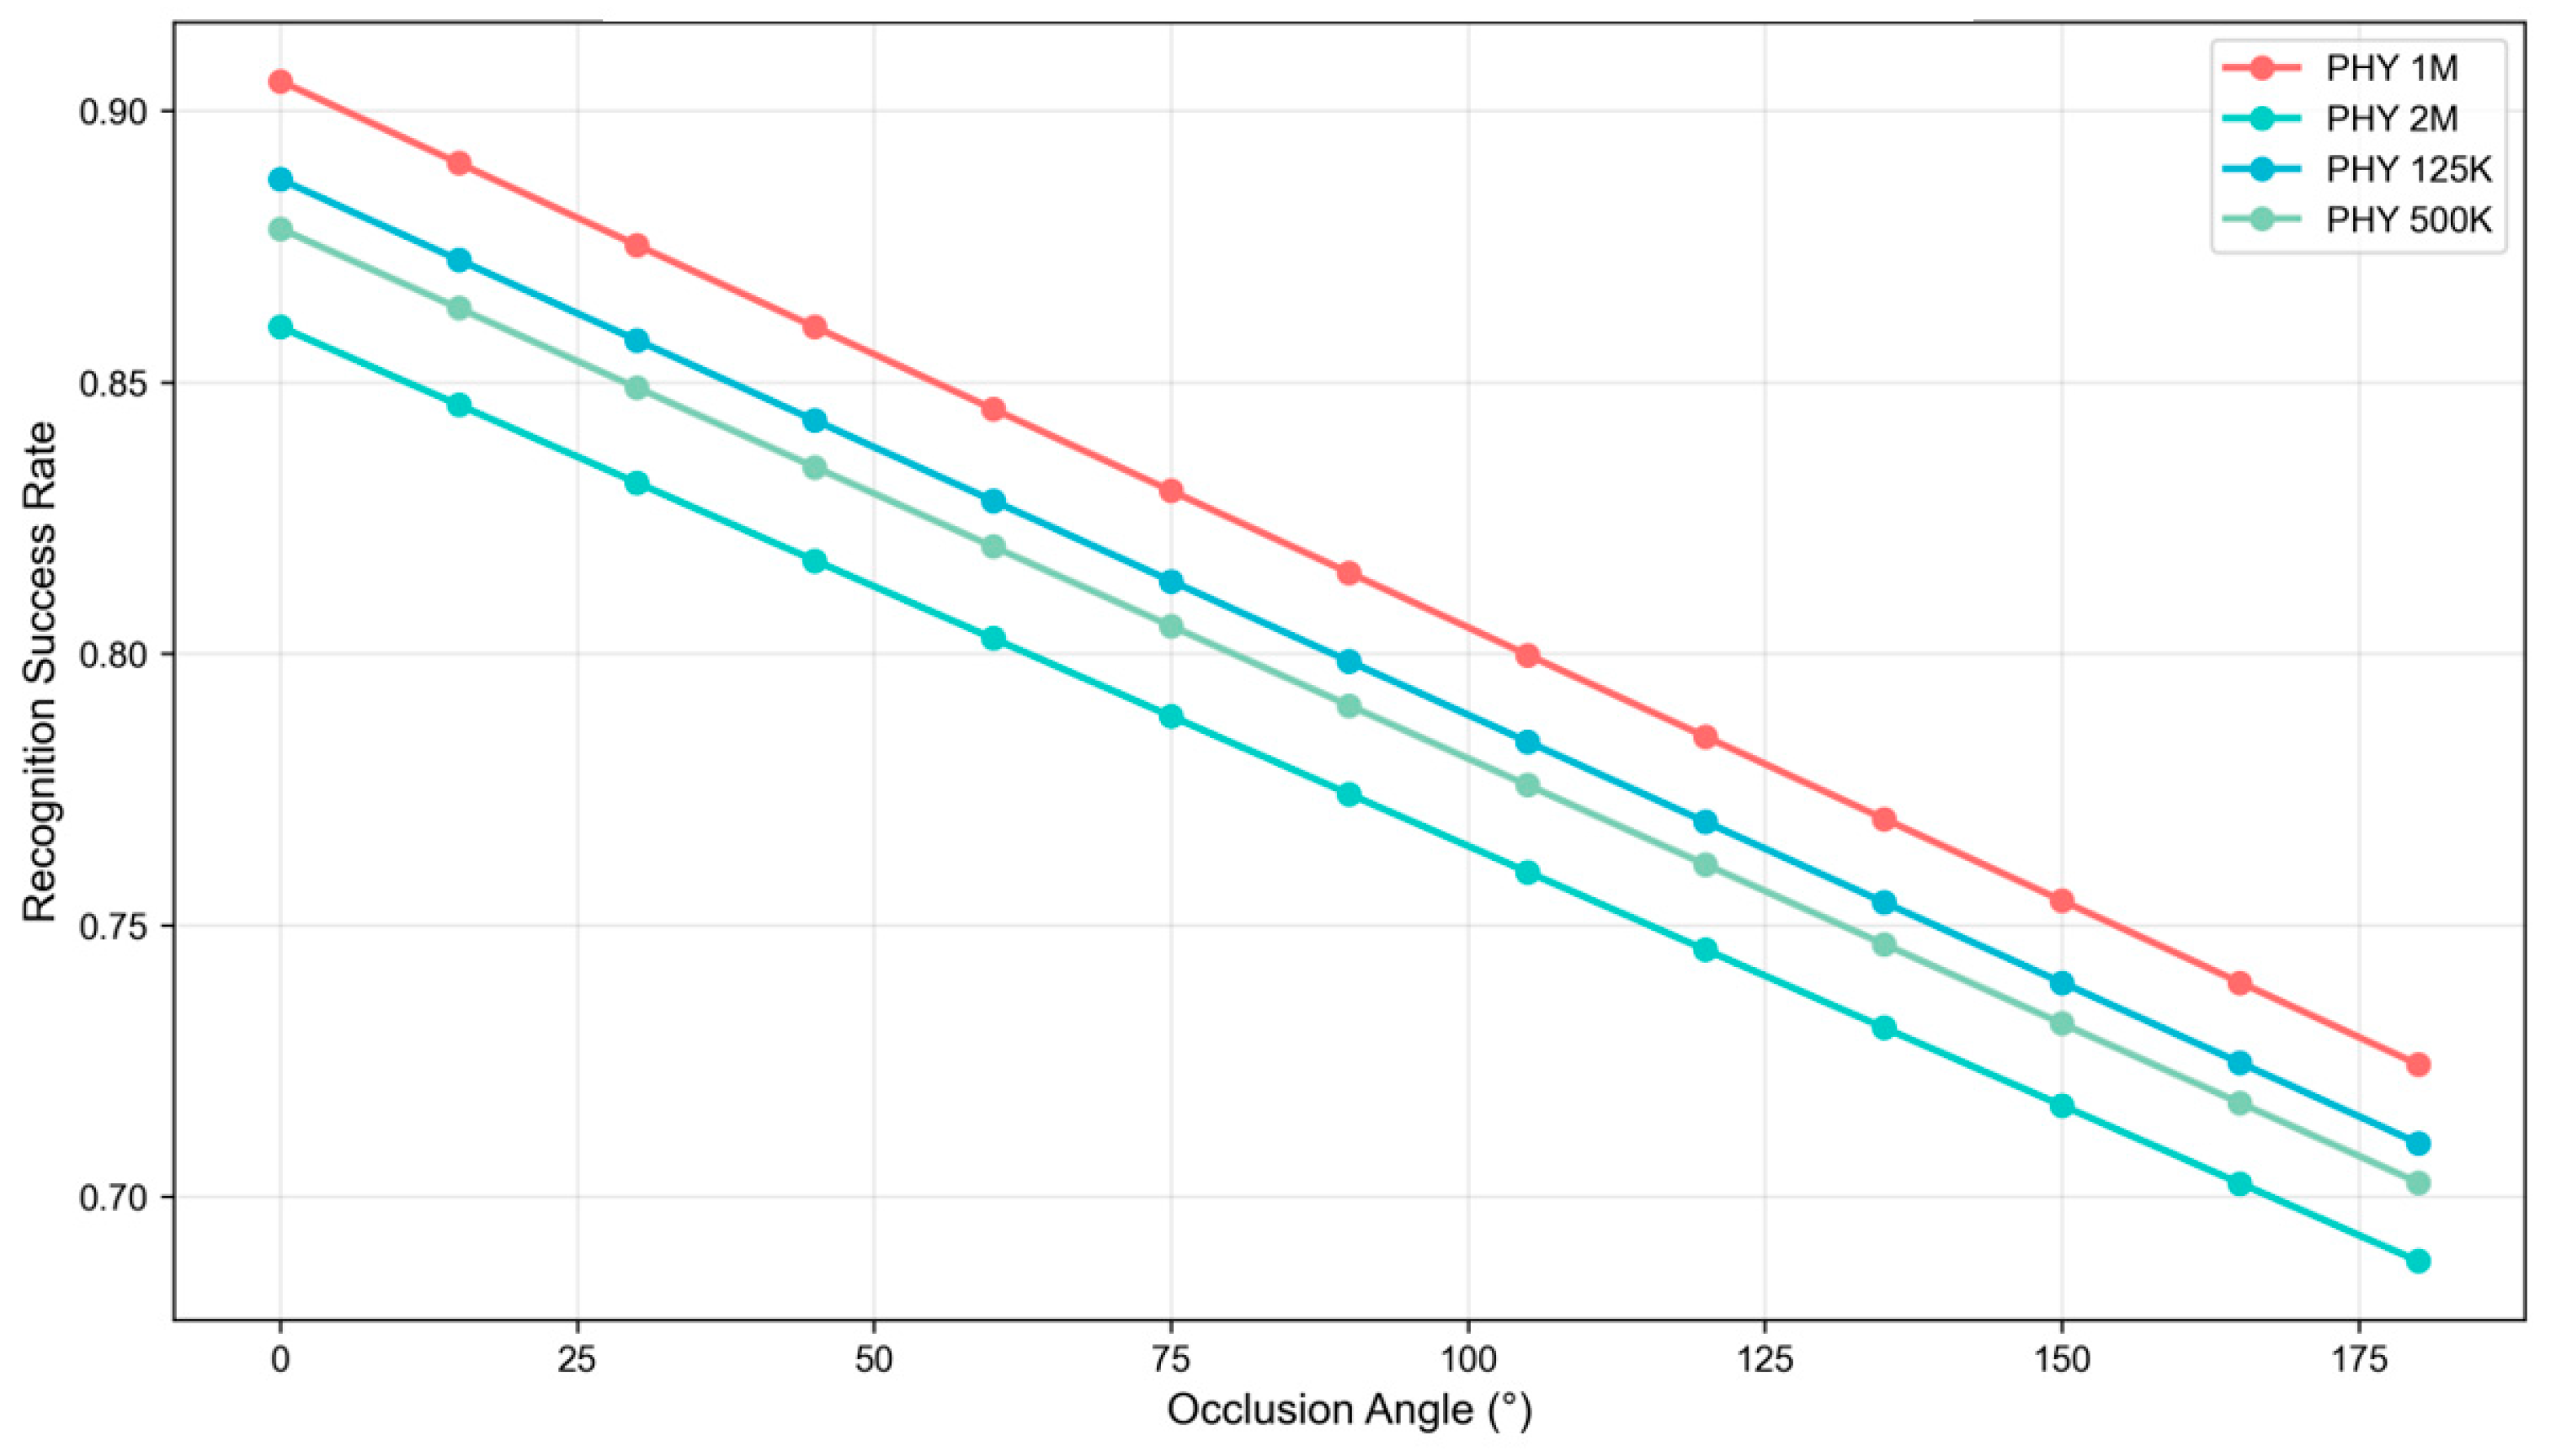
Figure 10 illustrates the impact of the shadowing angle on the RSR, ranging from 0° to 180°. It is observed that the RSR for all four PHY rates exhibits a linear decline as the shadowing angle increases. Specifically, the PHY 1 Mbps rate demonstrates the superior performance, with the RSR decreasing from approximately 0.906 at 0° to 0.723 at 180°. Conversely, the PHY 2 Mbps rate exhibits the poorest performance, dropping from 0.860 to 0.688 over the same interval. This performance degradation is primarily attributed to the increased signal path loss and the subsequent reduction in the signal-to-noise ratio (SNR) caused by the shadowing effect. Overall, the PHY 1 Mbps configuration maintains the highest robustness across the entire range of shadowing angles, confirming its suitability for complex low-altitude environments characterized by physical obstructions.
4.3.3. Multi-UAV Scene Analysis
Building upon the analysis of individual dynamic performance and environmental adaptability, this section shifts the focus to multi-UAV concurrent operation scenarios. As the number and density of UAVs within the airspace increase, channel contention and packet collisions emerge as the primary bottlenecks restricting identification performance. In this section, we quantitatively evaluate the conflict avoidance capability of the proposed system under multi-target concurrency by varying the number of UAVs and the cluster scale.
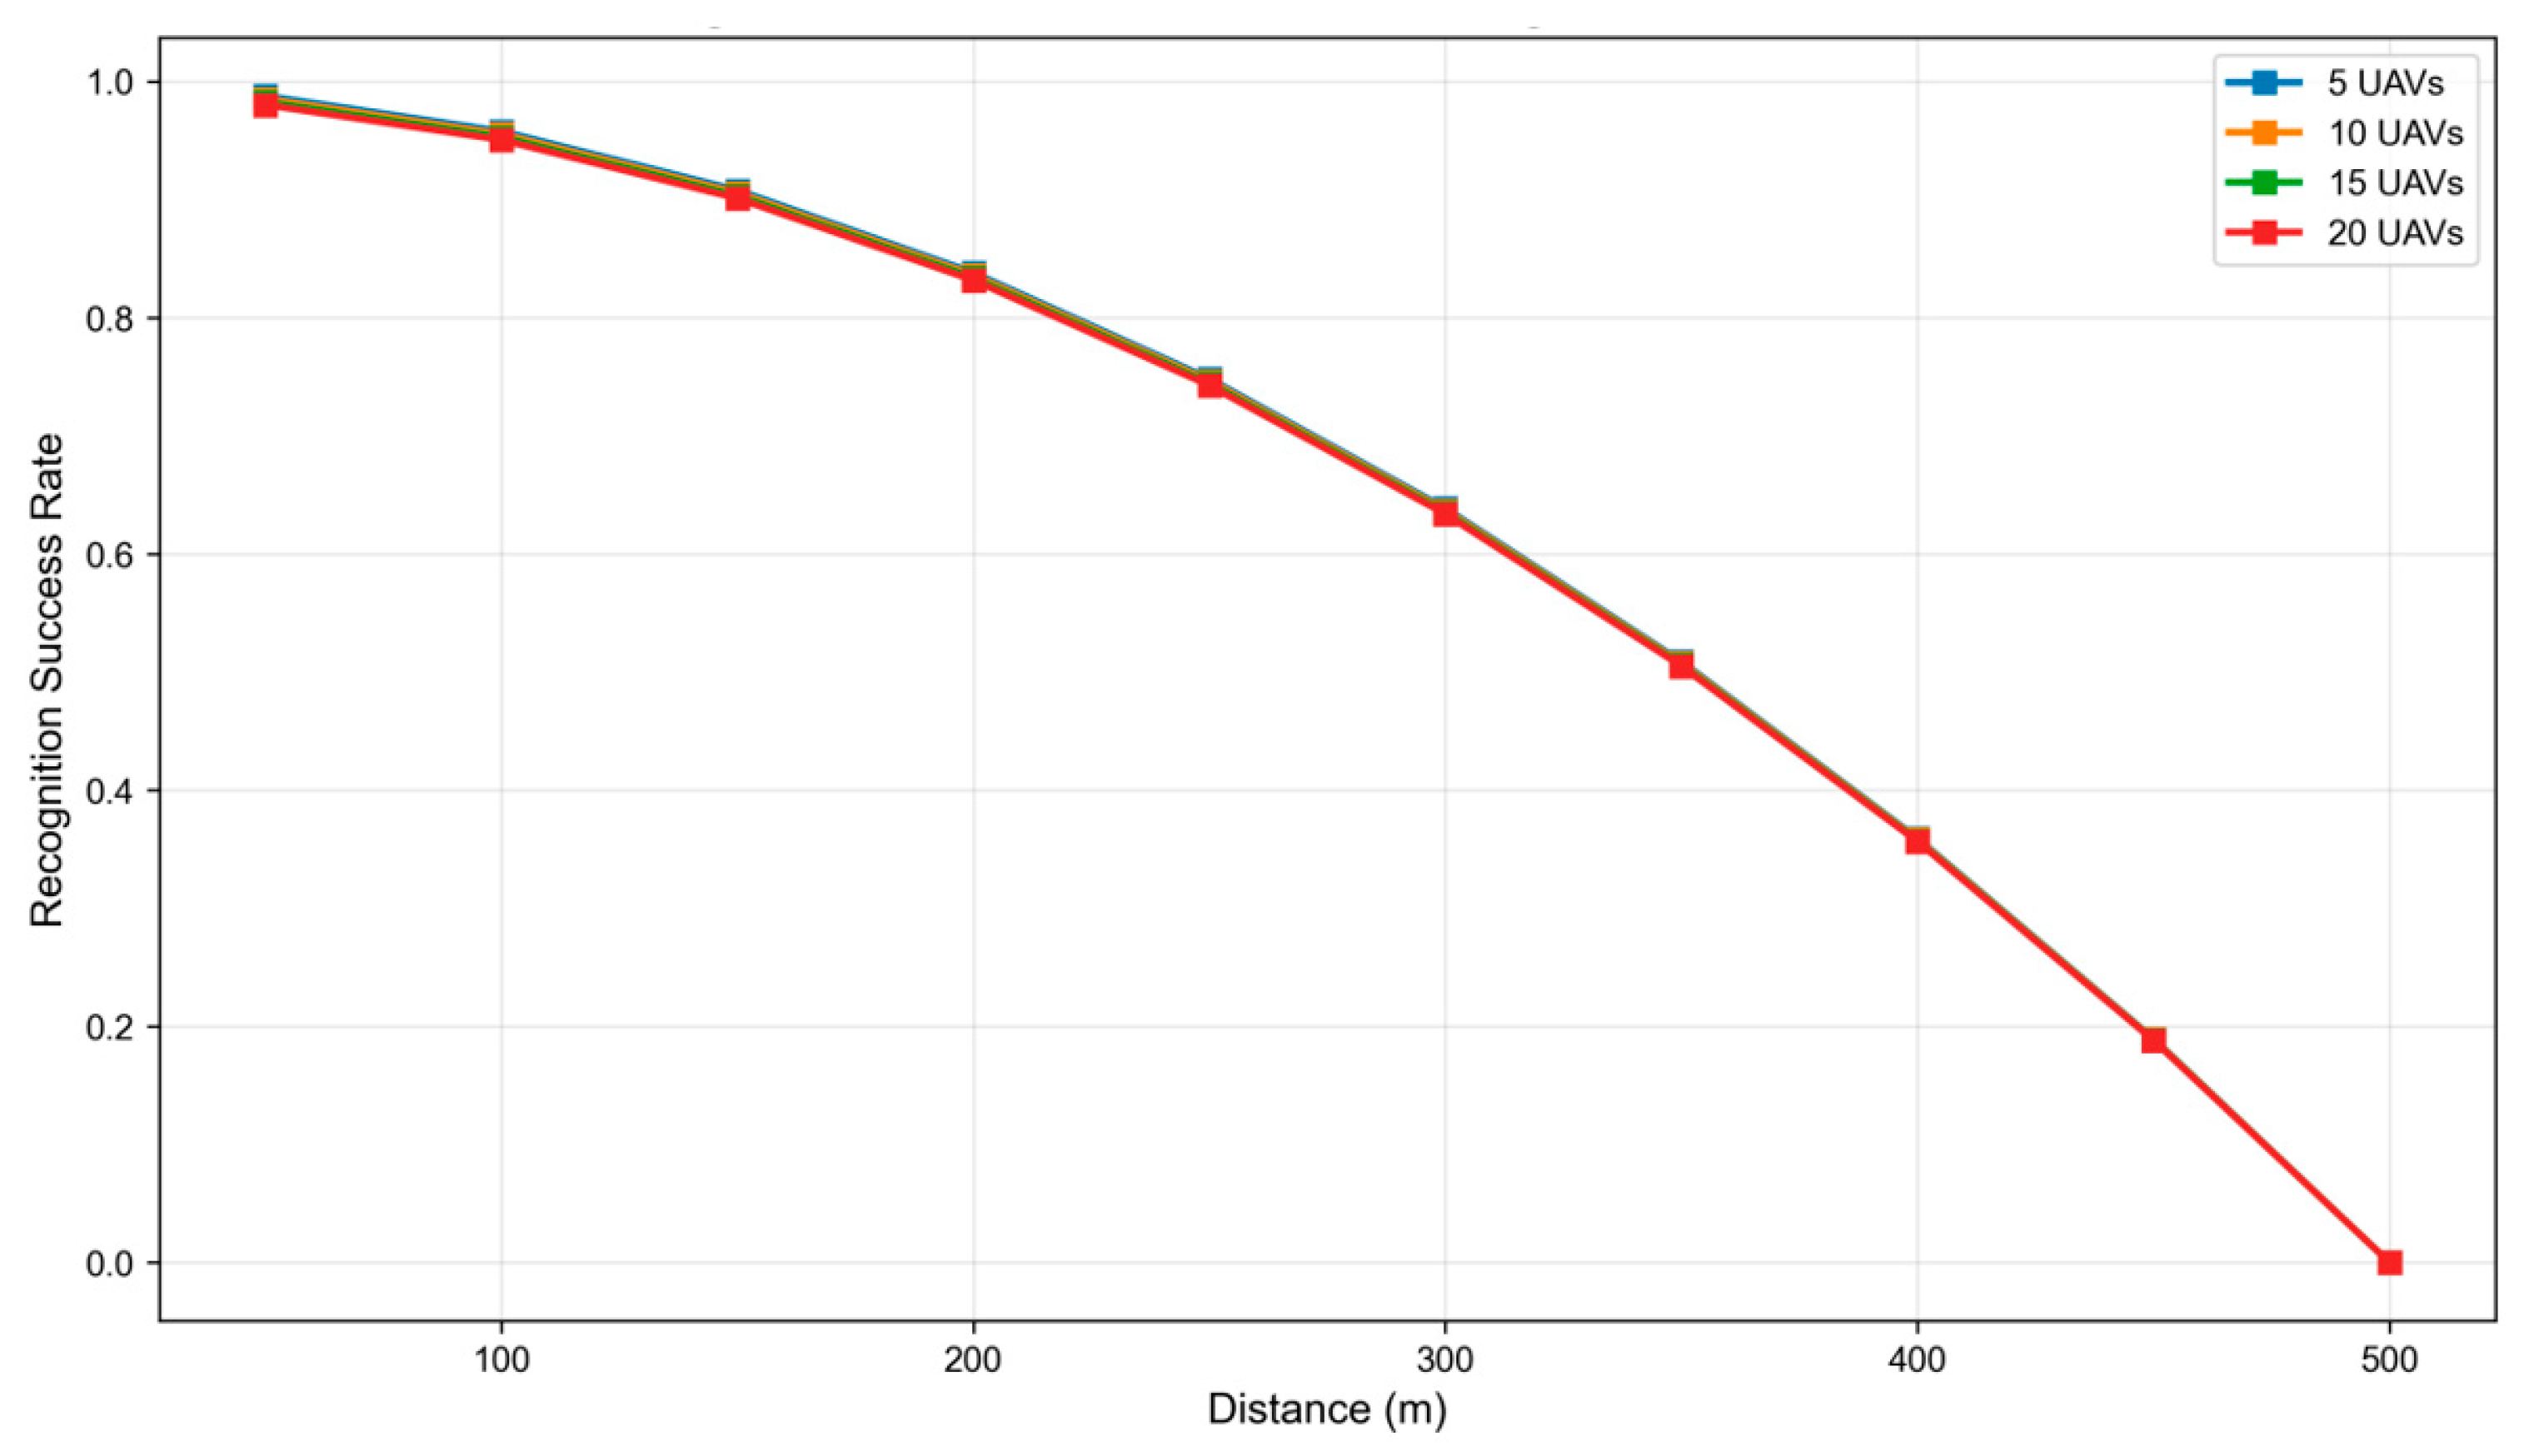
Figure 11 illustrates the impact of communication distance on RSR for varying numbers of UAVs. Within the range of 0 to 500 m, the RSR for scenarios involving 5, 10, 15, and 20 UAVs exhibits a nearly linear decline as distance increases. Notably, the curves for different UAV counts show a high degree of overlap, indicating that variations in the number of UAVs within the 5–20 range have a negligible impact on RSR; this demonstrates the system’s robust performance against fluctuations in airspace load. At a distance of 0 m, the RSR approaches 1.0 across all scenarios, whereas it drops toward 0 as the distance extends to 500 m. This degradation is primarily attributed to the path loss of wireless signals over distance, which leads to a continuous decrease in the signal-to-noise ratio (SNR), thereby compromising the reliability of signal acquisition and demodulation.
It is observed that the RSR remains relatively stable as the number of UAVs increases from 5 to 20. This is because the system operates within a low-load regime where the collision probability has not yet reached the non-linear growth threshold. This stability confirms that the proposed parameter configuration provides sufficient headroom for moderate increases in UAV density.
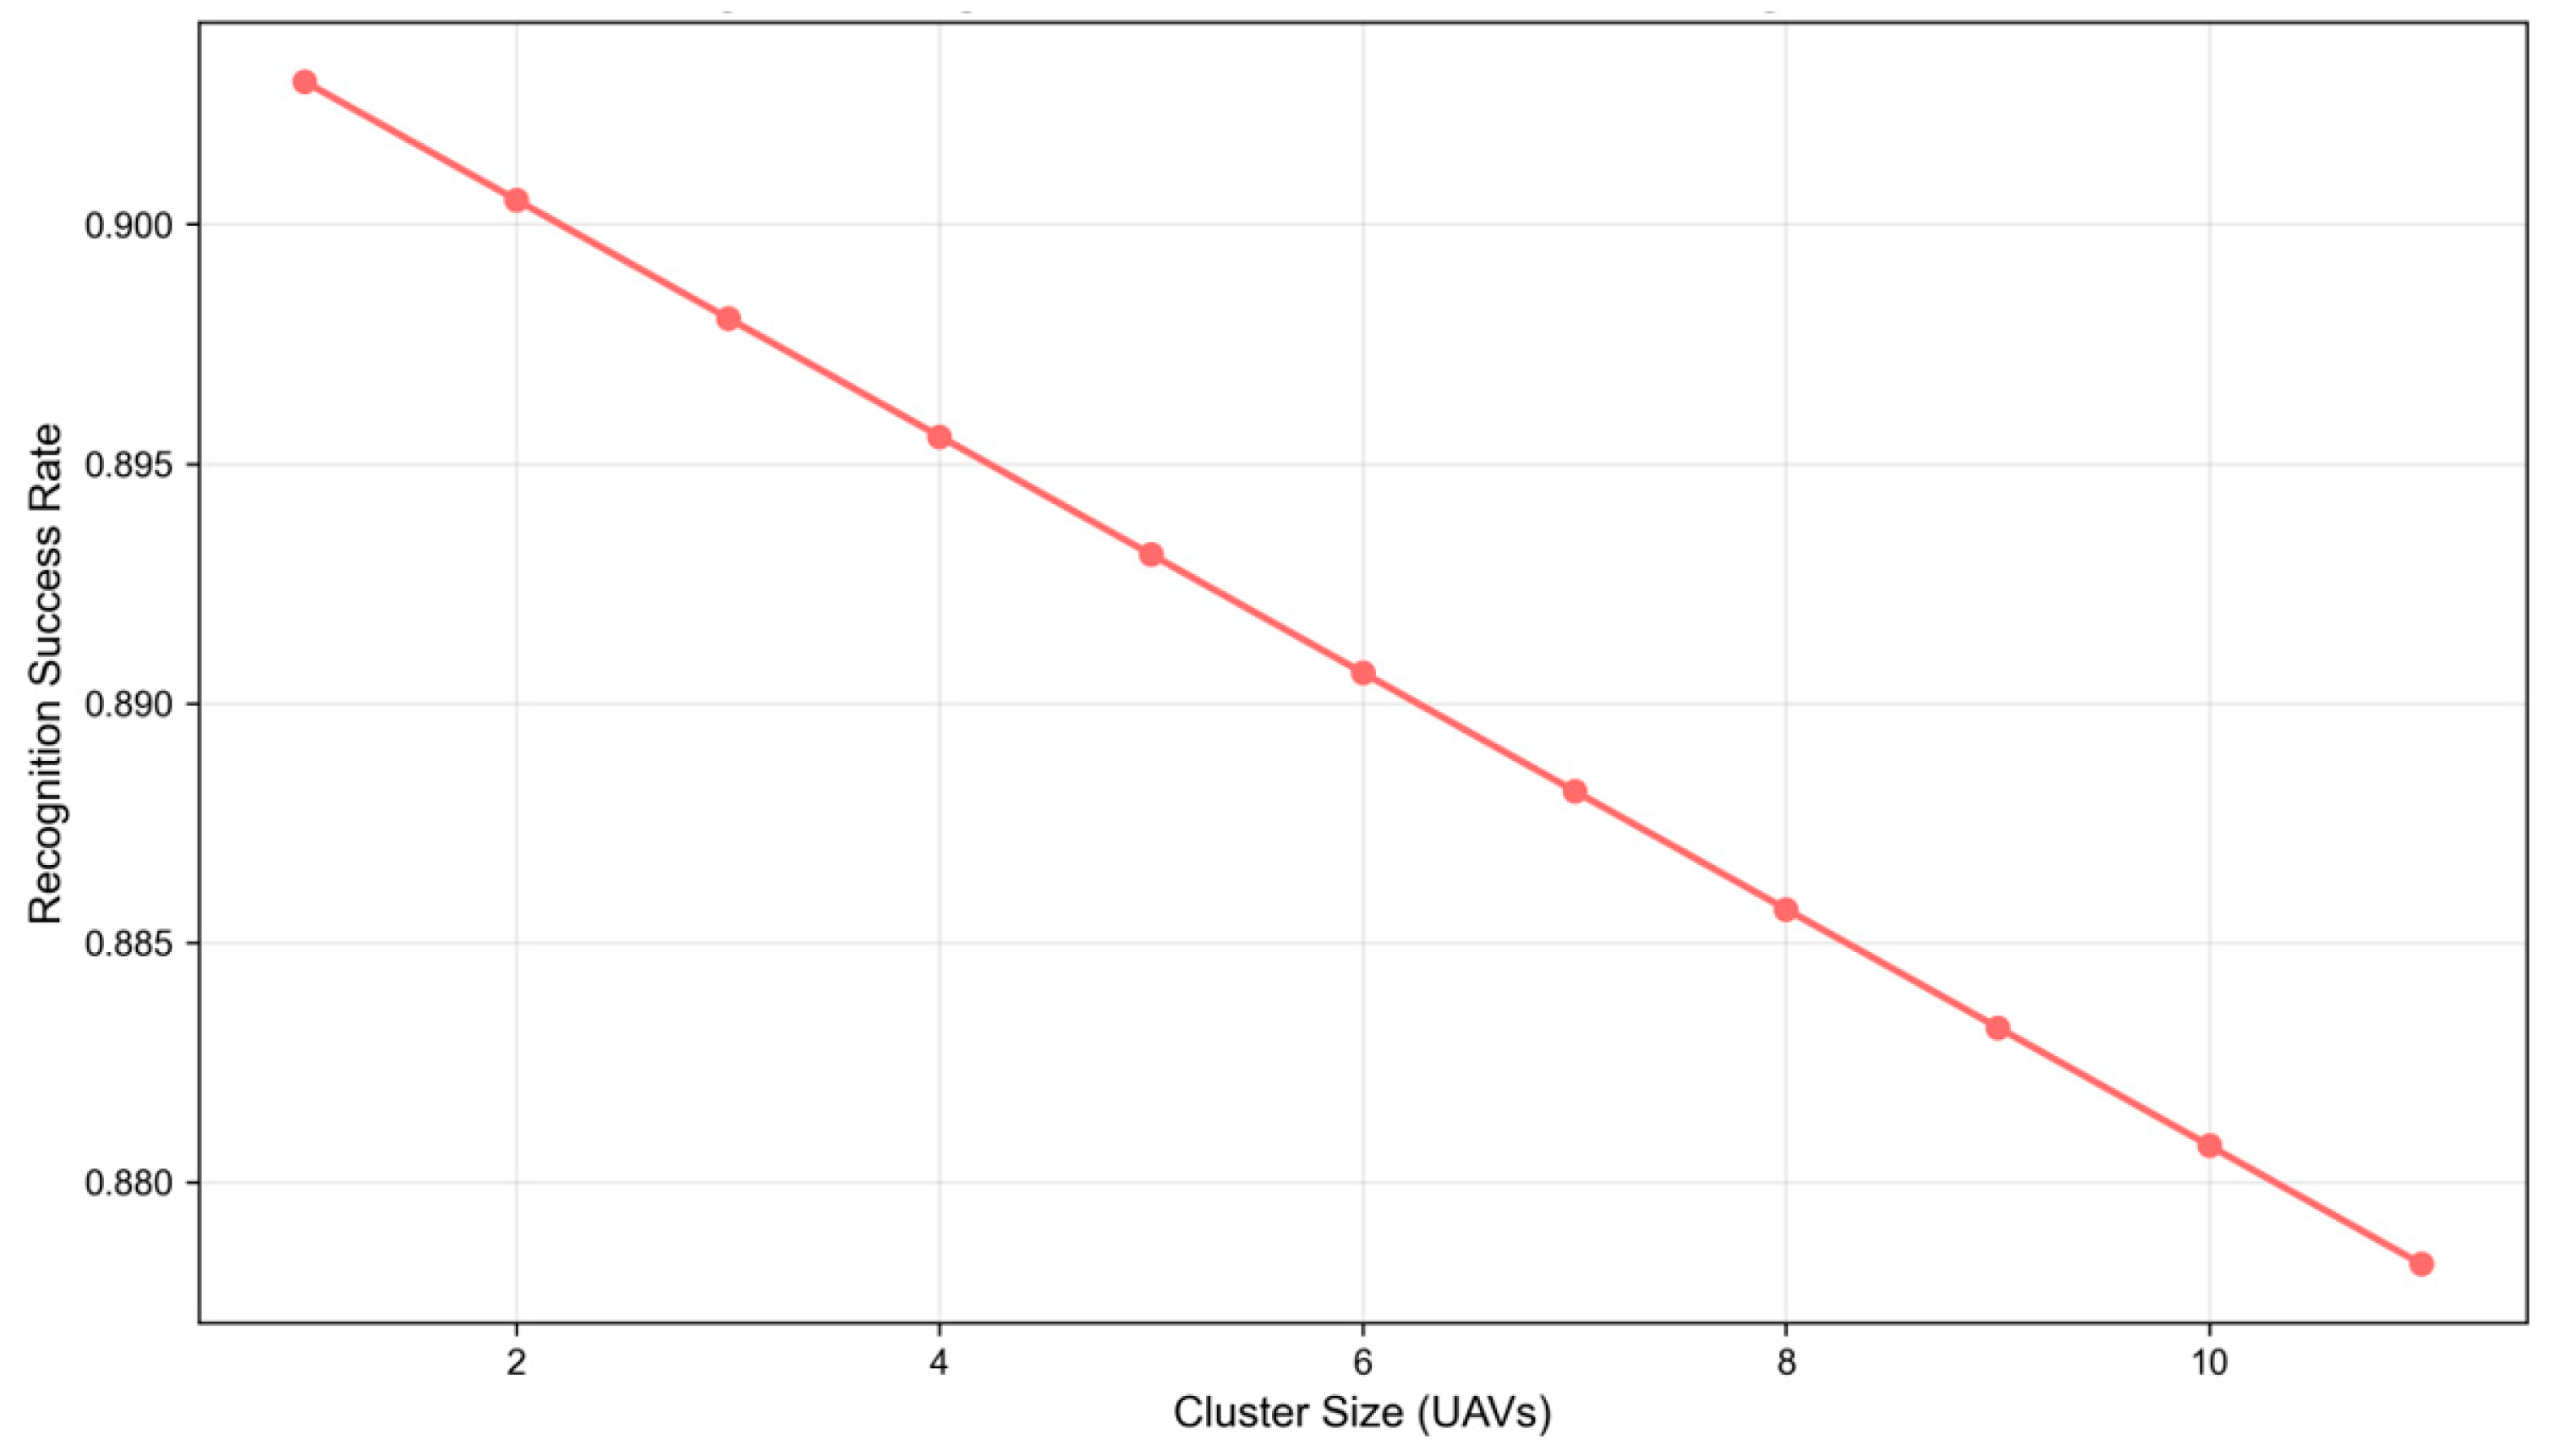
Figure 12 illustrates the linear impact of cluster size on the RSR. Within the range of 1 to 11 UAVs, the RSR exhibits a consistent downward trend as the cluster size increases. Specifically, the RSR is approximately 0.903 for a single-UAV scenario, whereas it declines to approximately 0.878 when the cluster size reaches 11. The primary cause for this degradation is the increased density of UAVs within the unit airspace, which exacerbates signal collisions and demodulation interference, thereby progressively reducing the reliability of signal acquisition.
4.3.4. Reliability Analysis
Beyond average performance, flight safety necessitates high reliability even under extreme conditions. This section employs the Cumulative Distribution Function (CDF) and statistical analysis to characterize the distribution of recognition performance, aiming to evaluate system stability under long-term operation and stochastic fluctuations, thereby ensuring compliance with a failure rate requirement of .
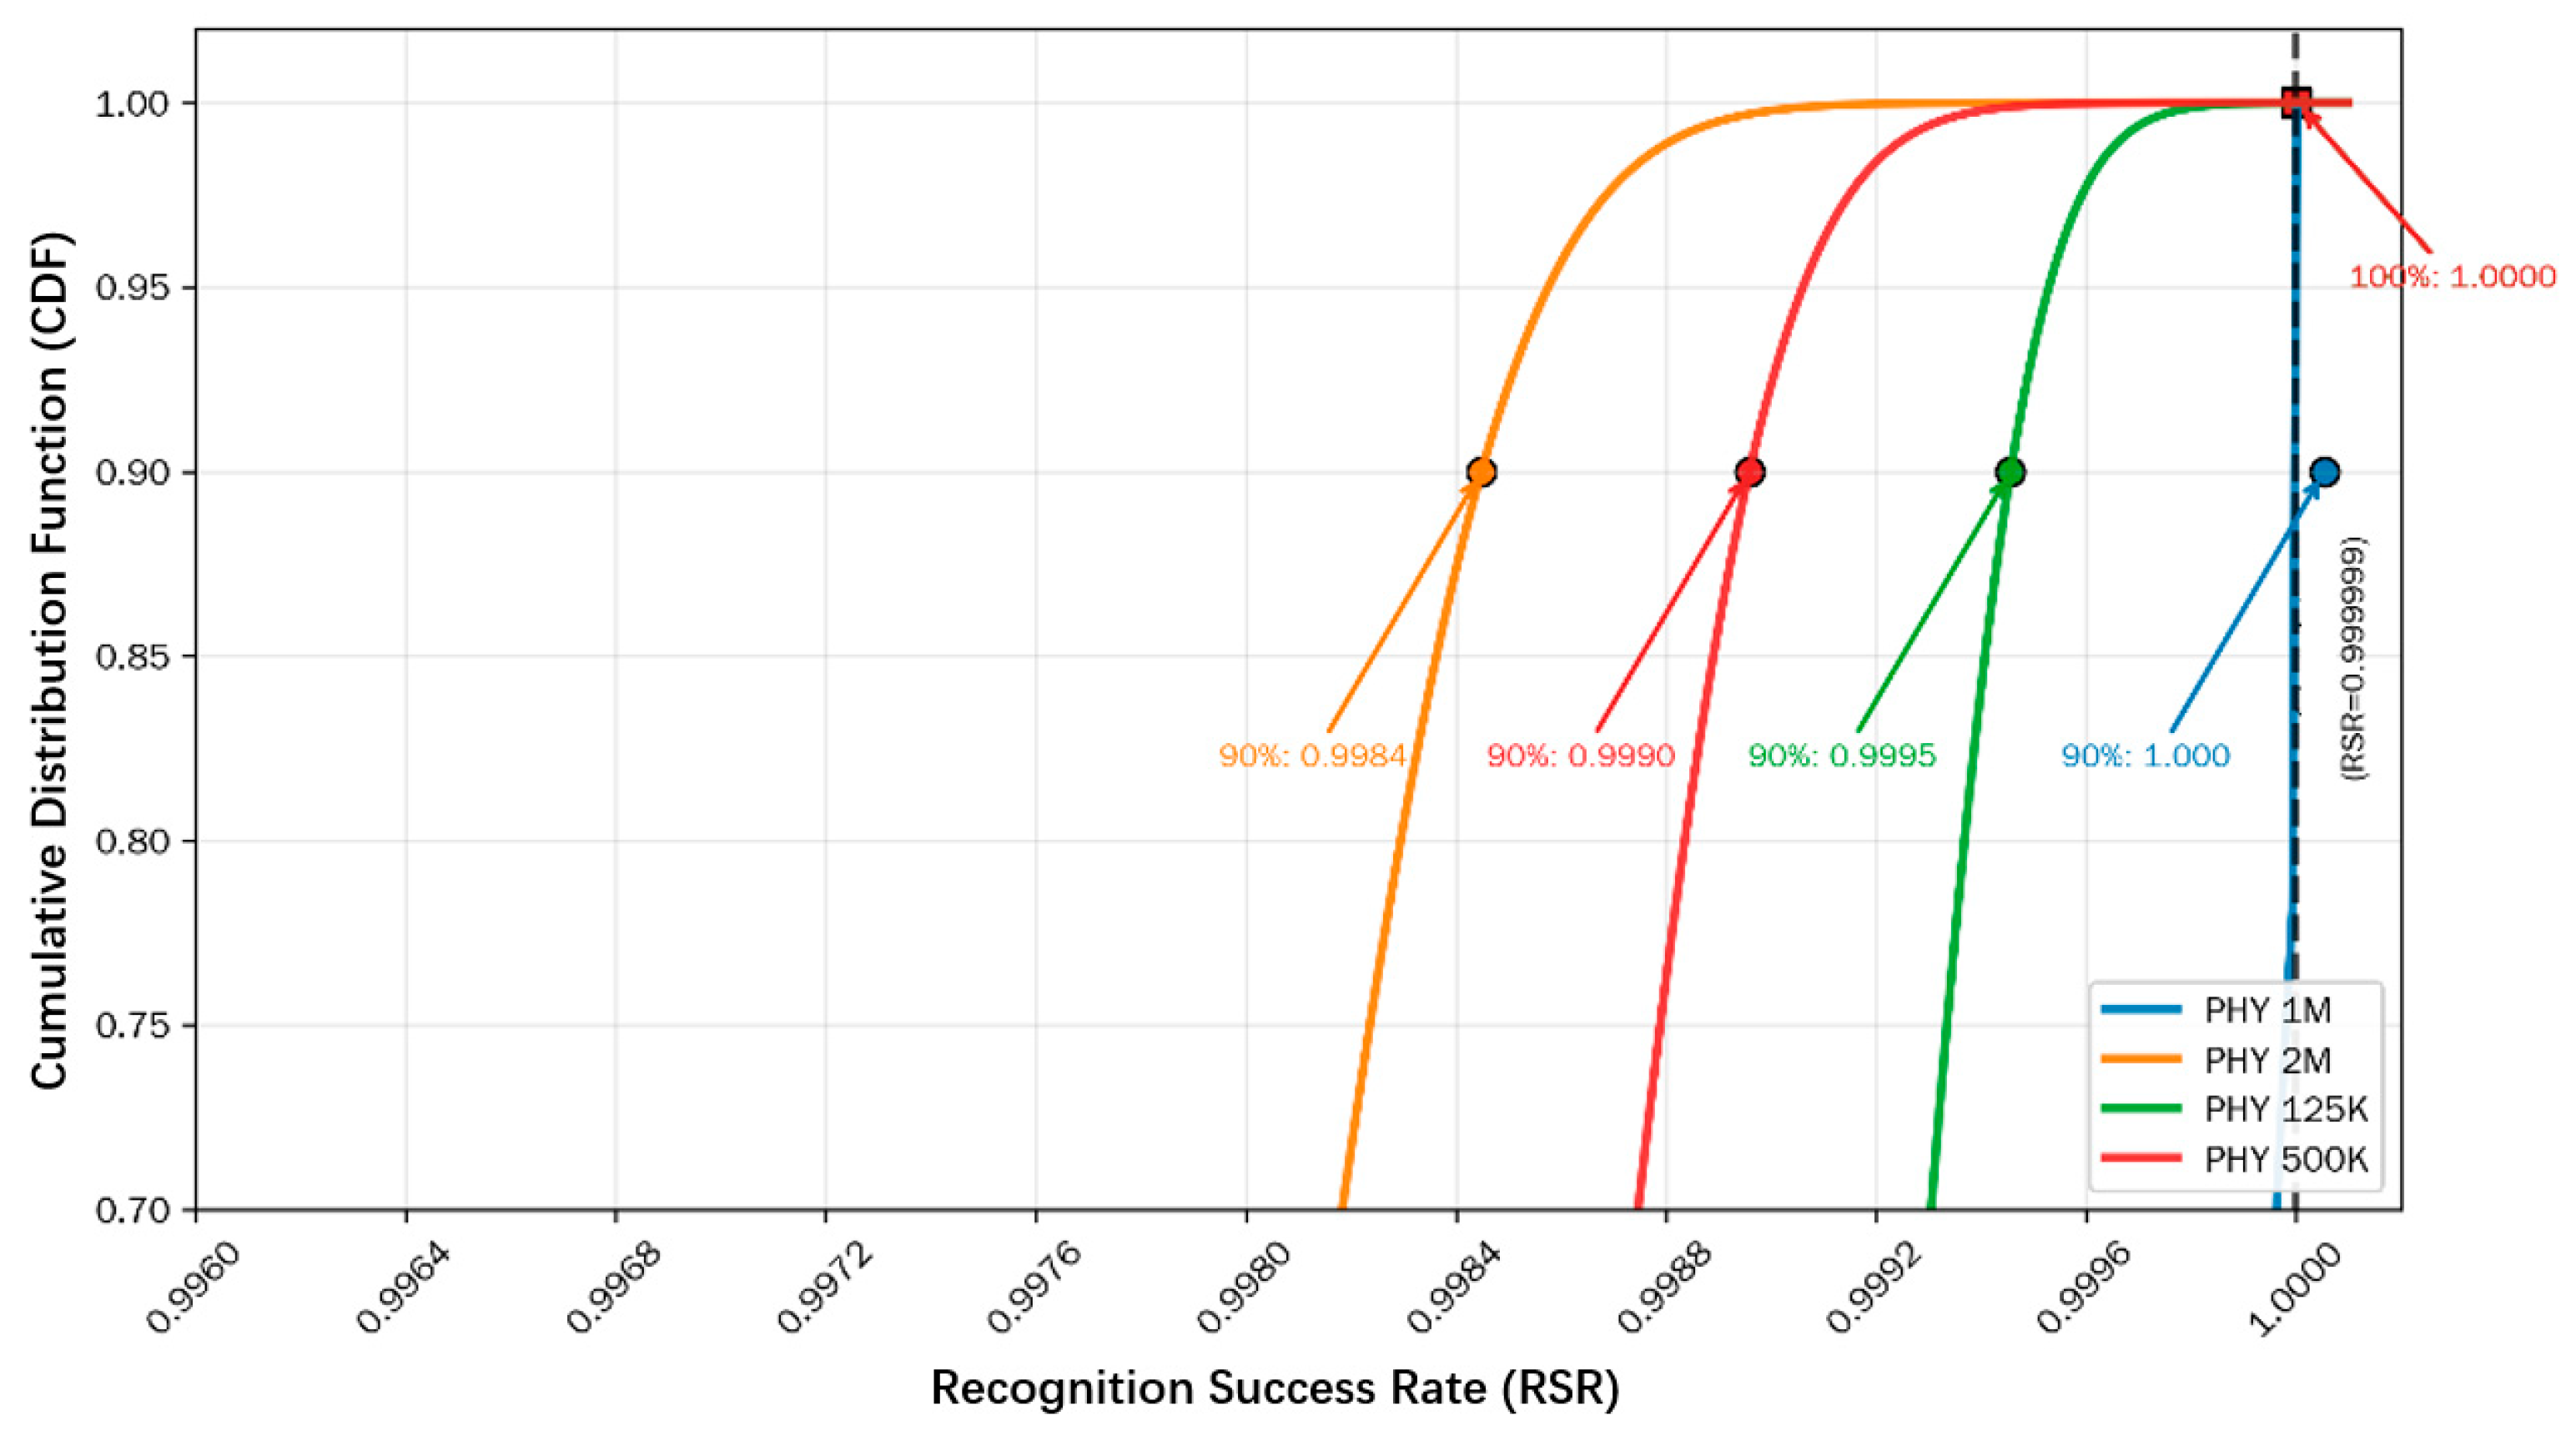
As illustrated in
Figure 13, for a scenario involving 15 concurrent UAVs at a monitoring distance of 150 m, the RSR-CDF curve for the PHY 1 Mbps rate exhibits a significant rightward shift. Specifically, the RSR reaches 0.9998 at the 90th percentile and stabilizes at 1.0000 at the 100th percentile. Over 90% of the samples achieve an RSR near 100%, with no samples falling below 0.9995, a result attributed to the superior link adaptation and collision avoidance capabilities of the PHY 1 Mbps mode. In contrast, the PHY 2 Mbps rate shows the most pronounced leftward shift, with the RSR dropping to 0.9975 at the 90th percentile and 0.9985 at the 100th percentile, where approximately 5% of samples exhibit an RSR below 0.9970. The PHY 125 kbps rate achieves an RSR of 0.9990 at the 90th percentile and 0.9995 at the 100th percentile, though 2% of samples fall below 0.9985 due to higher collision probabilities. The PHY 500 kbps rate performs between these two, with an RSR of 0.9982 at the 90th percentile and 0.9990 at the 100th percentile, showing a relatively flat distribution. Notably, the PHY 1 Mbps curve exhibits the steepest slope in the high-RSR range (0.9995–1.0000), indicating a higher concentration of samples. Conversely, other rates show flatter slopes and greater dispersion in the low-to-mid RSR ranges. These statistical findings confirm that the PHY 1 Mbps rate is the optimal choice, effectively mitigating the risk of recognition failure caused by stochastic fluctuations and ensuring robust system operation.
4.3.5. Energy Consumption and Endurance Analysis
As airborne equipment, power consumption and flight endurance are critical constraints for the practical deployment of UAV surveillance systems. This section shifts the focus from dynamic motion scenarios to the power regulation mechanism of scanning parameters, aiming to identify an optimal configuration that minimizes energy consumption while maintaining high recognition performance. The scanning window () and scanning interval () exhibit a significant coupling effect on both power consumption and the Recognition Success Rate (RSR), governed by the ‘scanning duty cycle’ ().
Experimental results demonstrate that with a fixed scanning interval, power consumption increases linearly with the scanning window (e.g., rising from 17.23 mW to 24.89 mW at ), primarily due to the extended operation of the RF module and the higher current draw during scanning (9.7 mA) compared to the idle state (5.4 mA). Conversely, with a fixed scanning window, power consumption decreases linearly as the scanning interval increases (e.g., a 16.7% reduction at ), attributed to the increased proportion of idle time. Notably, the configuration of and achieves the optimal balance, maintaining a 100% RSR at a minimum power consumption of 17.96 mW. This 3% duty cycle ensures the integrity of three-channel scanning while maximizing idle duration, providing an ideal parameter set for low-power static UAV surveillance.
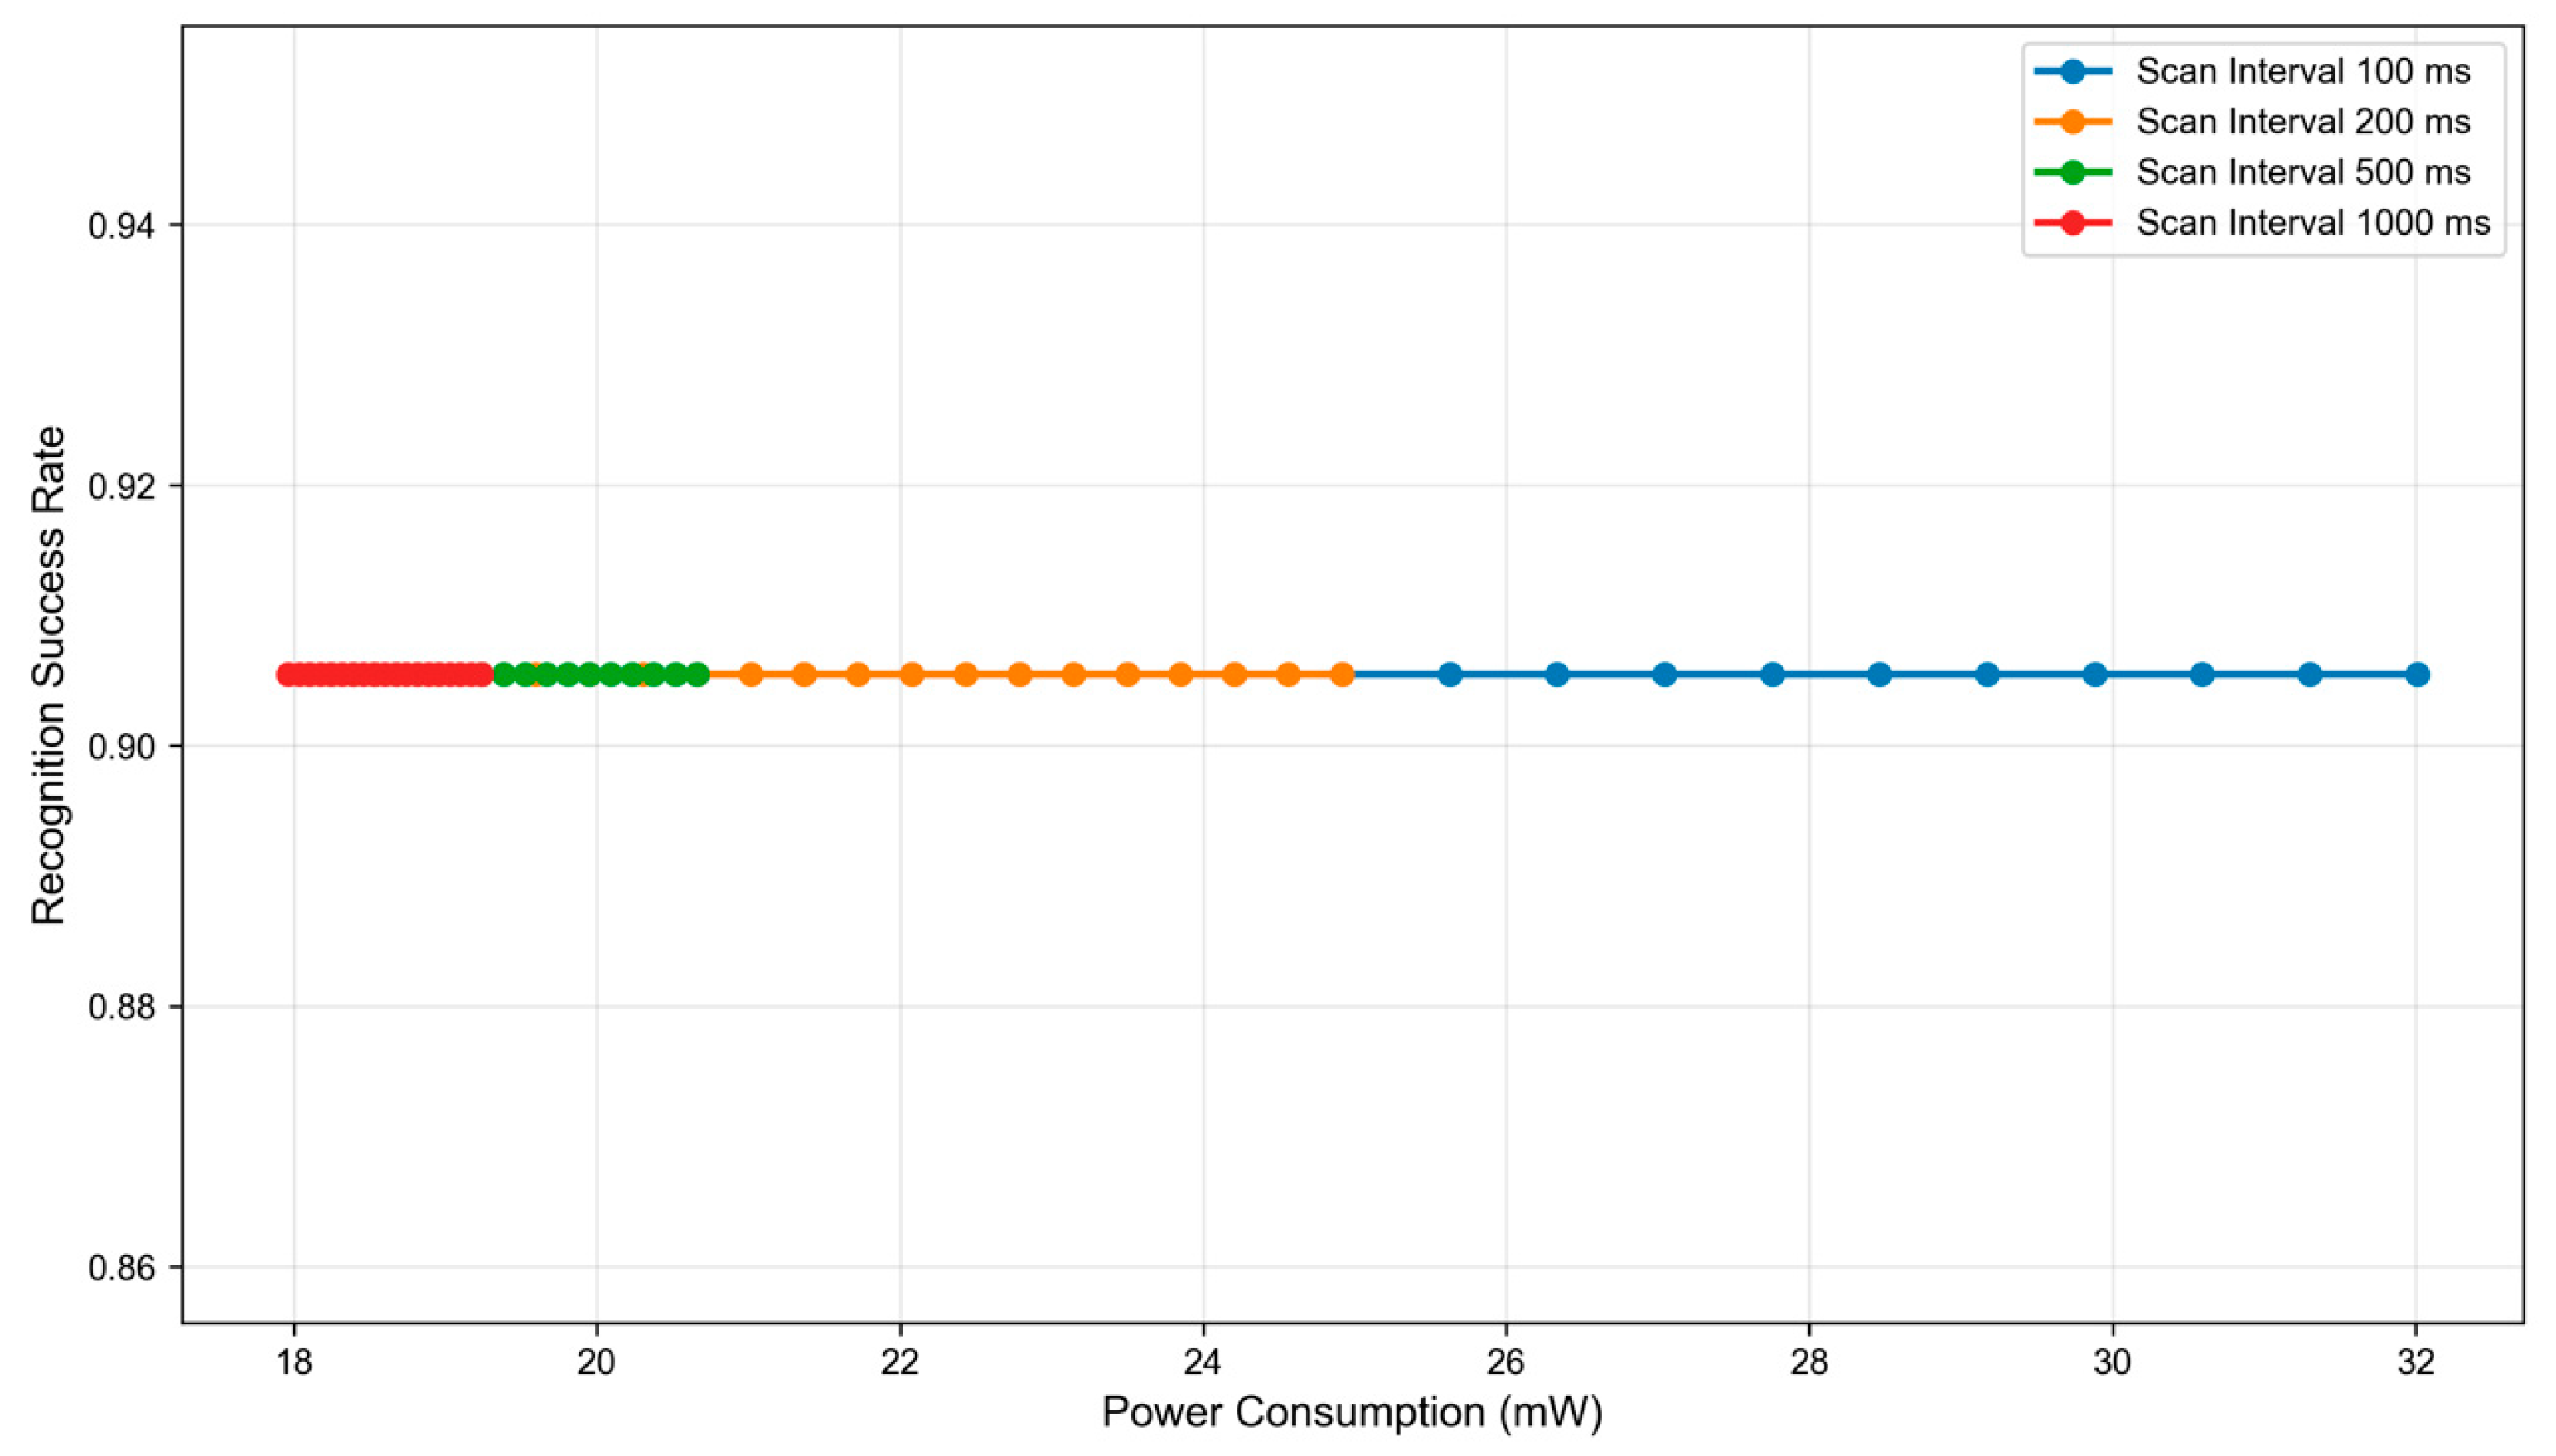
Figure 14 illustrates the relationship between power consumption and RSR under different scanning intervals. Within the power range of 18–32 mW, the RSR for all four scanning intervals remains stable, exhibiting minimal fluctuations and consistently maintaining a level between 0.905 and 0.907. The experimental results indicate a significant negative correlation between power consumption and scanning interval: the highest power consumption (approx. 26–32 mW) is observed at a 100 ms interval, while the lowest (approx. 18–20 mW) is achieved at 1000 ms. As the scanning interval increases, the frequency of signal monitoring decreases, leading to a reduction in power consumption without compromising the RSR. These findings demonstrate that the RSR is robust against power variations within the tested range, confirming the feasibility of flexible power management through scanning interval optimization and providing a quantitative basis for the low-power design of UAV surveillance systems.
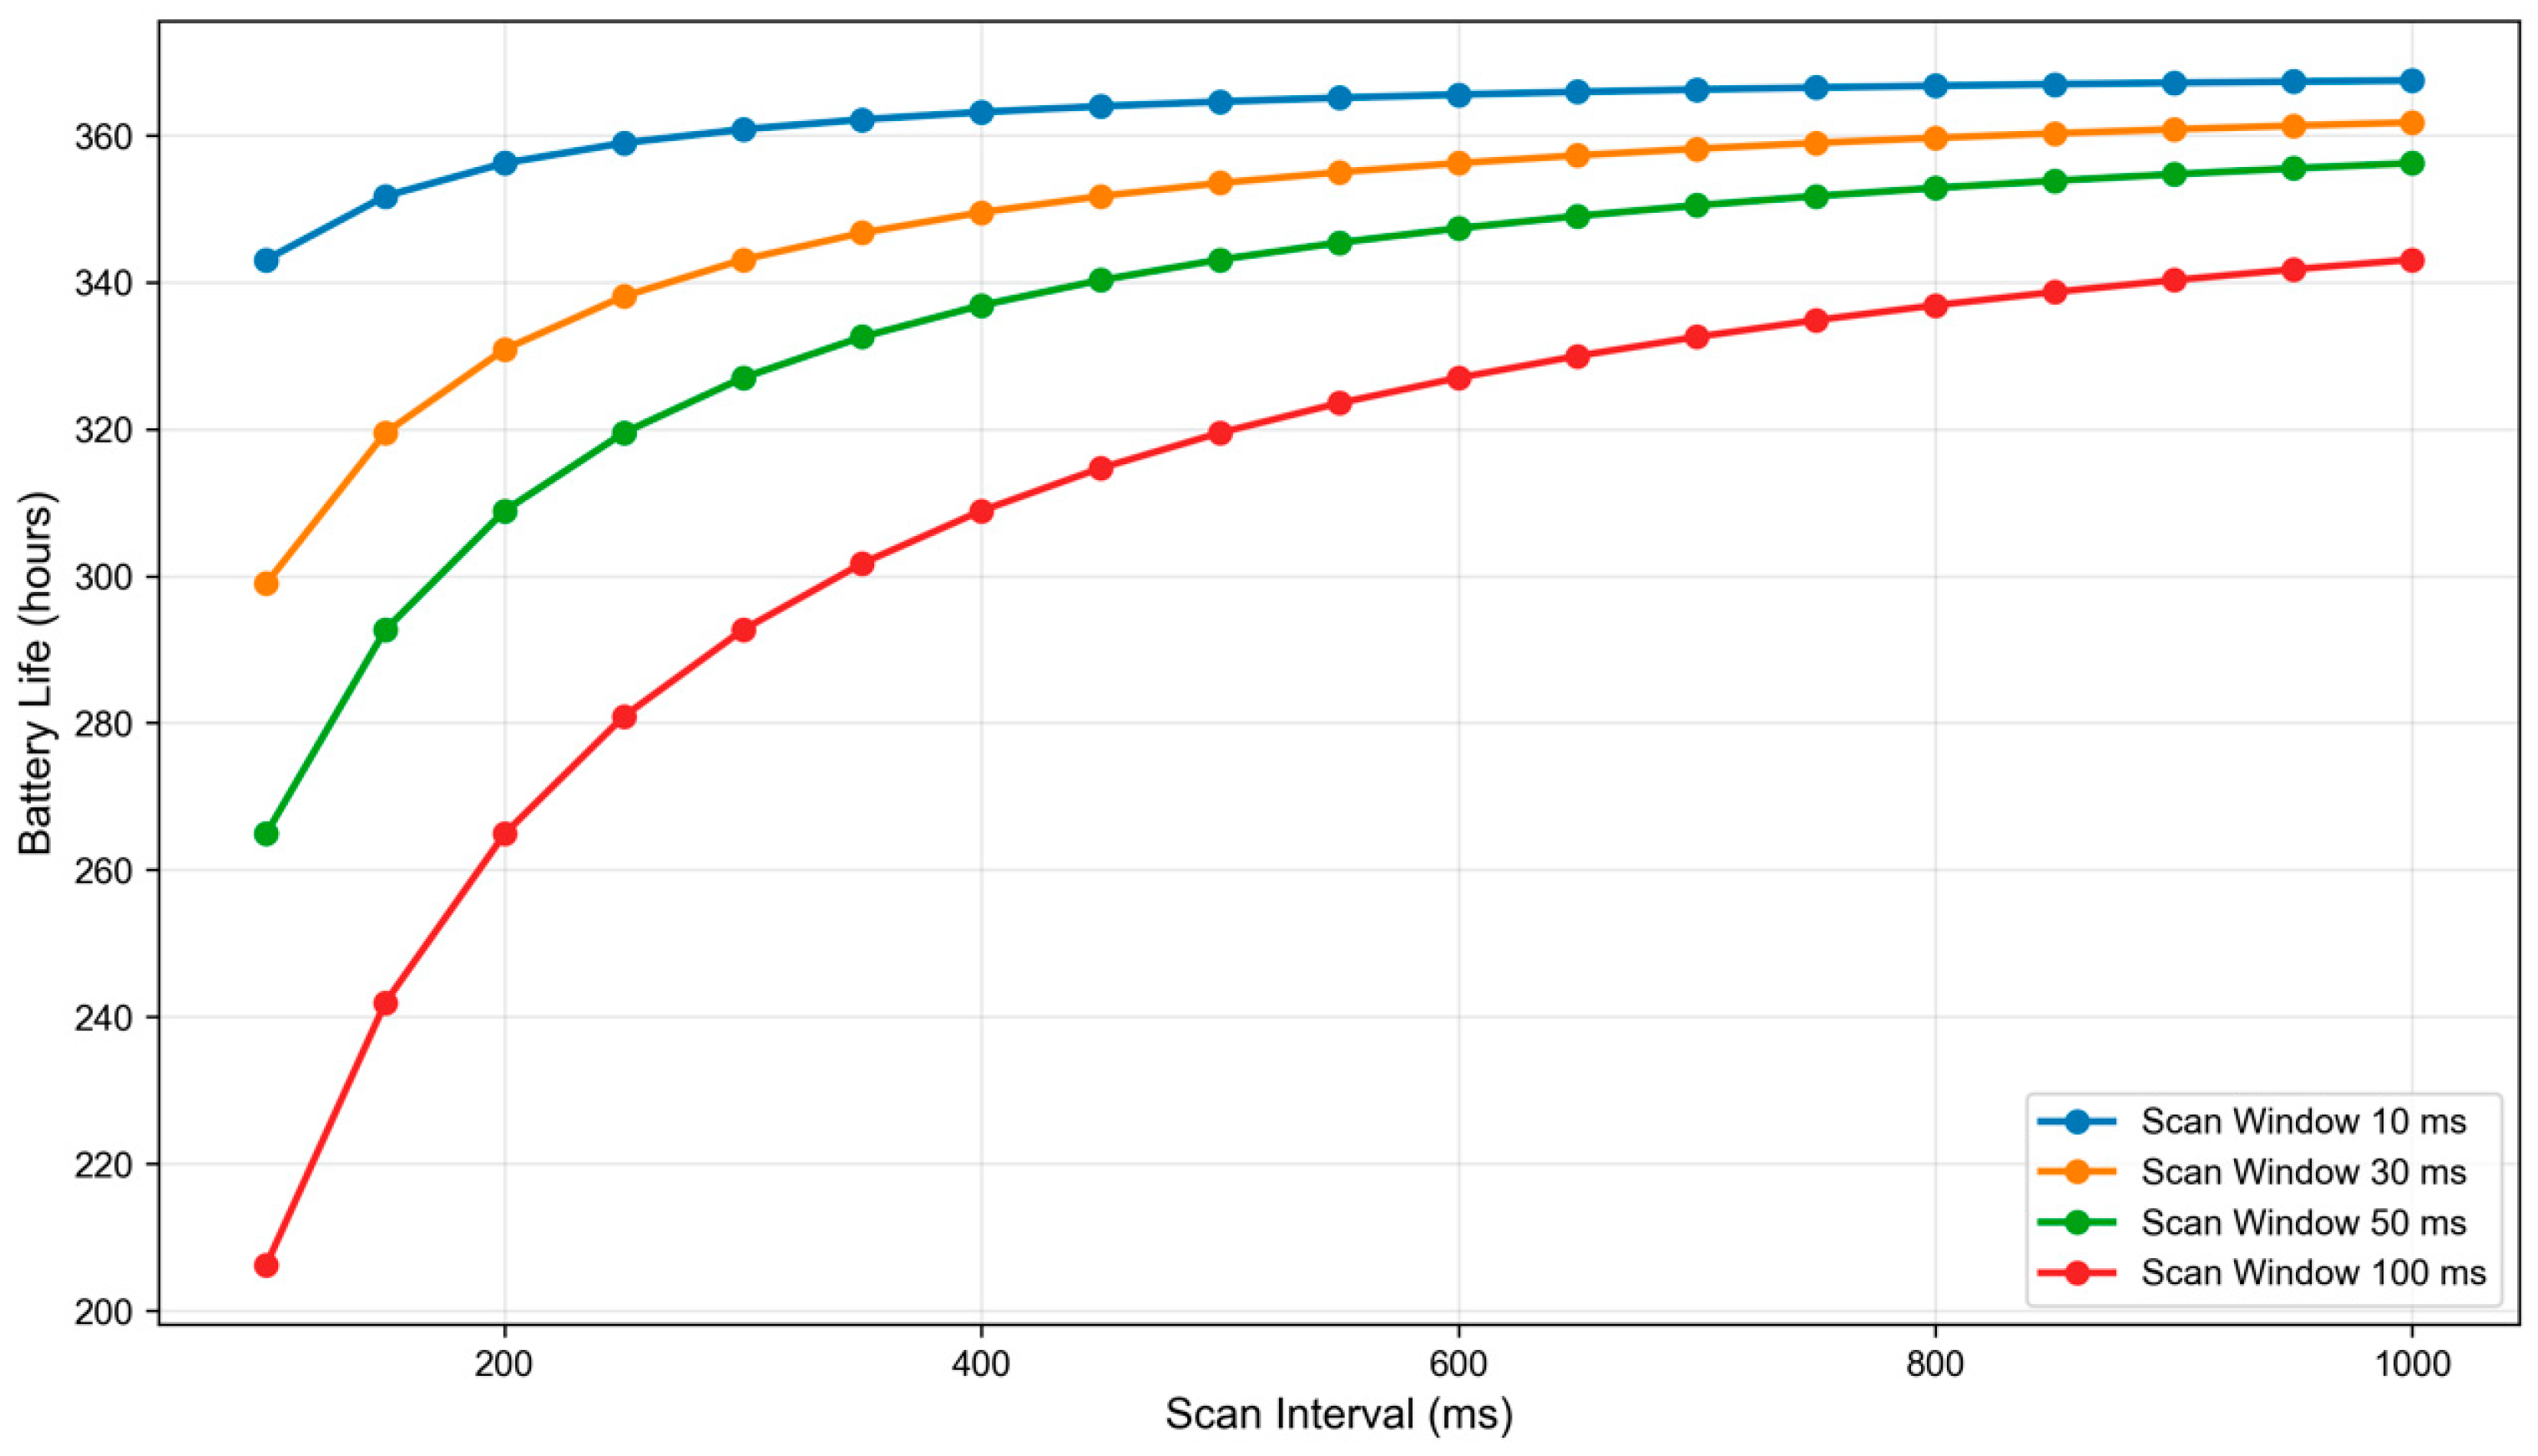
Figure 15 illustrates the impact of various scanning window and scanning interval combinations on the endurance of the low-altitude UAV BLE surveillance system, equipped with a 2000 mAh lithium battery. The results demonstrate that as the scanning interval increases from 100 ms to 1000 ms, the system endurance consistently improves across all scanning window configurations. The configuration with a 10 ms scanning window exhibits the optimal performance, achieving an endurance of approximately 360 min at a 1000 ms interval. The 30 ms scanning window follows with an endurance of approximately 350 min, while the 50 ms and 100 ms windows show progressively lower endurance, reaching approximately 200 min at a 100 ms window and 100 ms interval combination. It is observed that, for a given scanning interval, the scanning window duration is inversely proportional to the system endurance; shorter windows effectively reduce power consumption and extend operational life. Consequently, the ‘short scanning window combined with long scanning interval’ strategy is identified as the core optimization approach for enhancing endurance, with the 10 ms scanning window demonstrating significant advantages throughout the tested range.
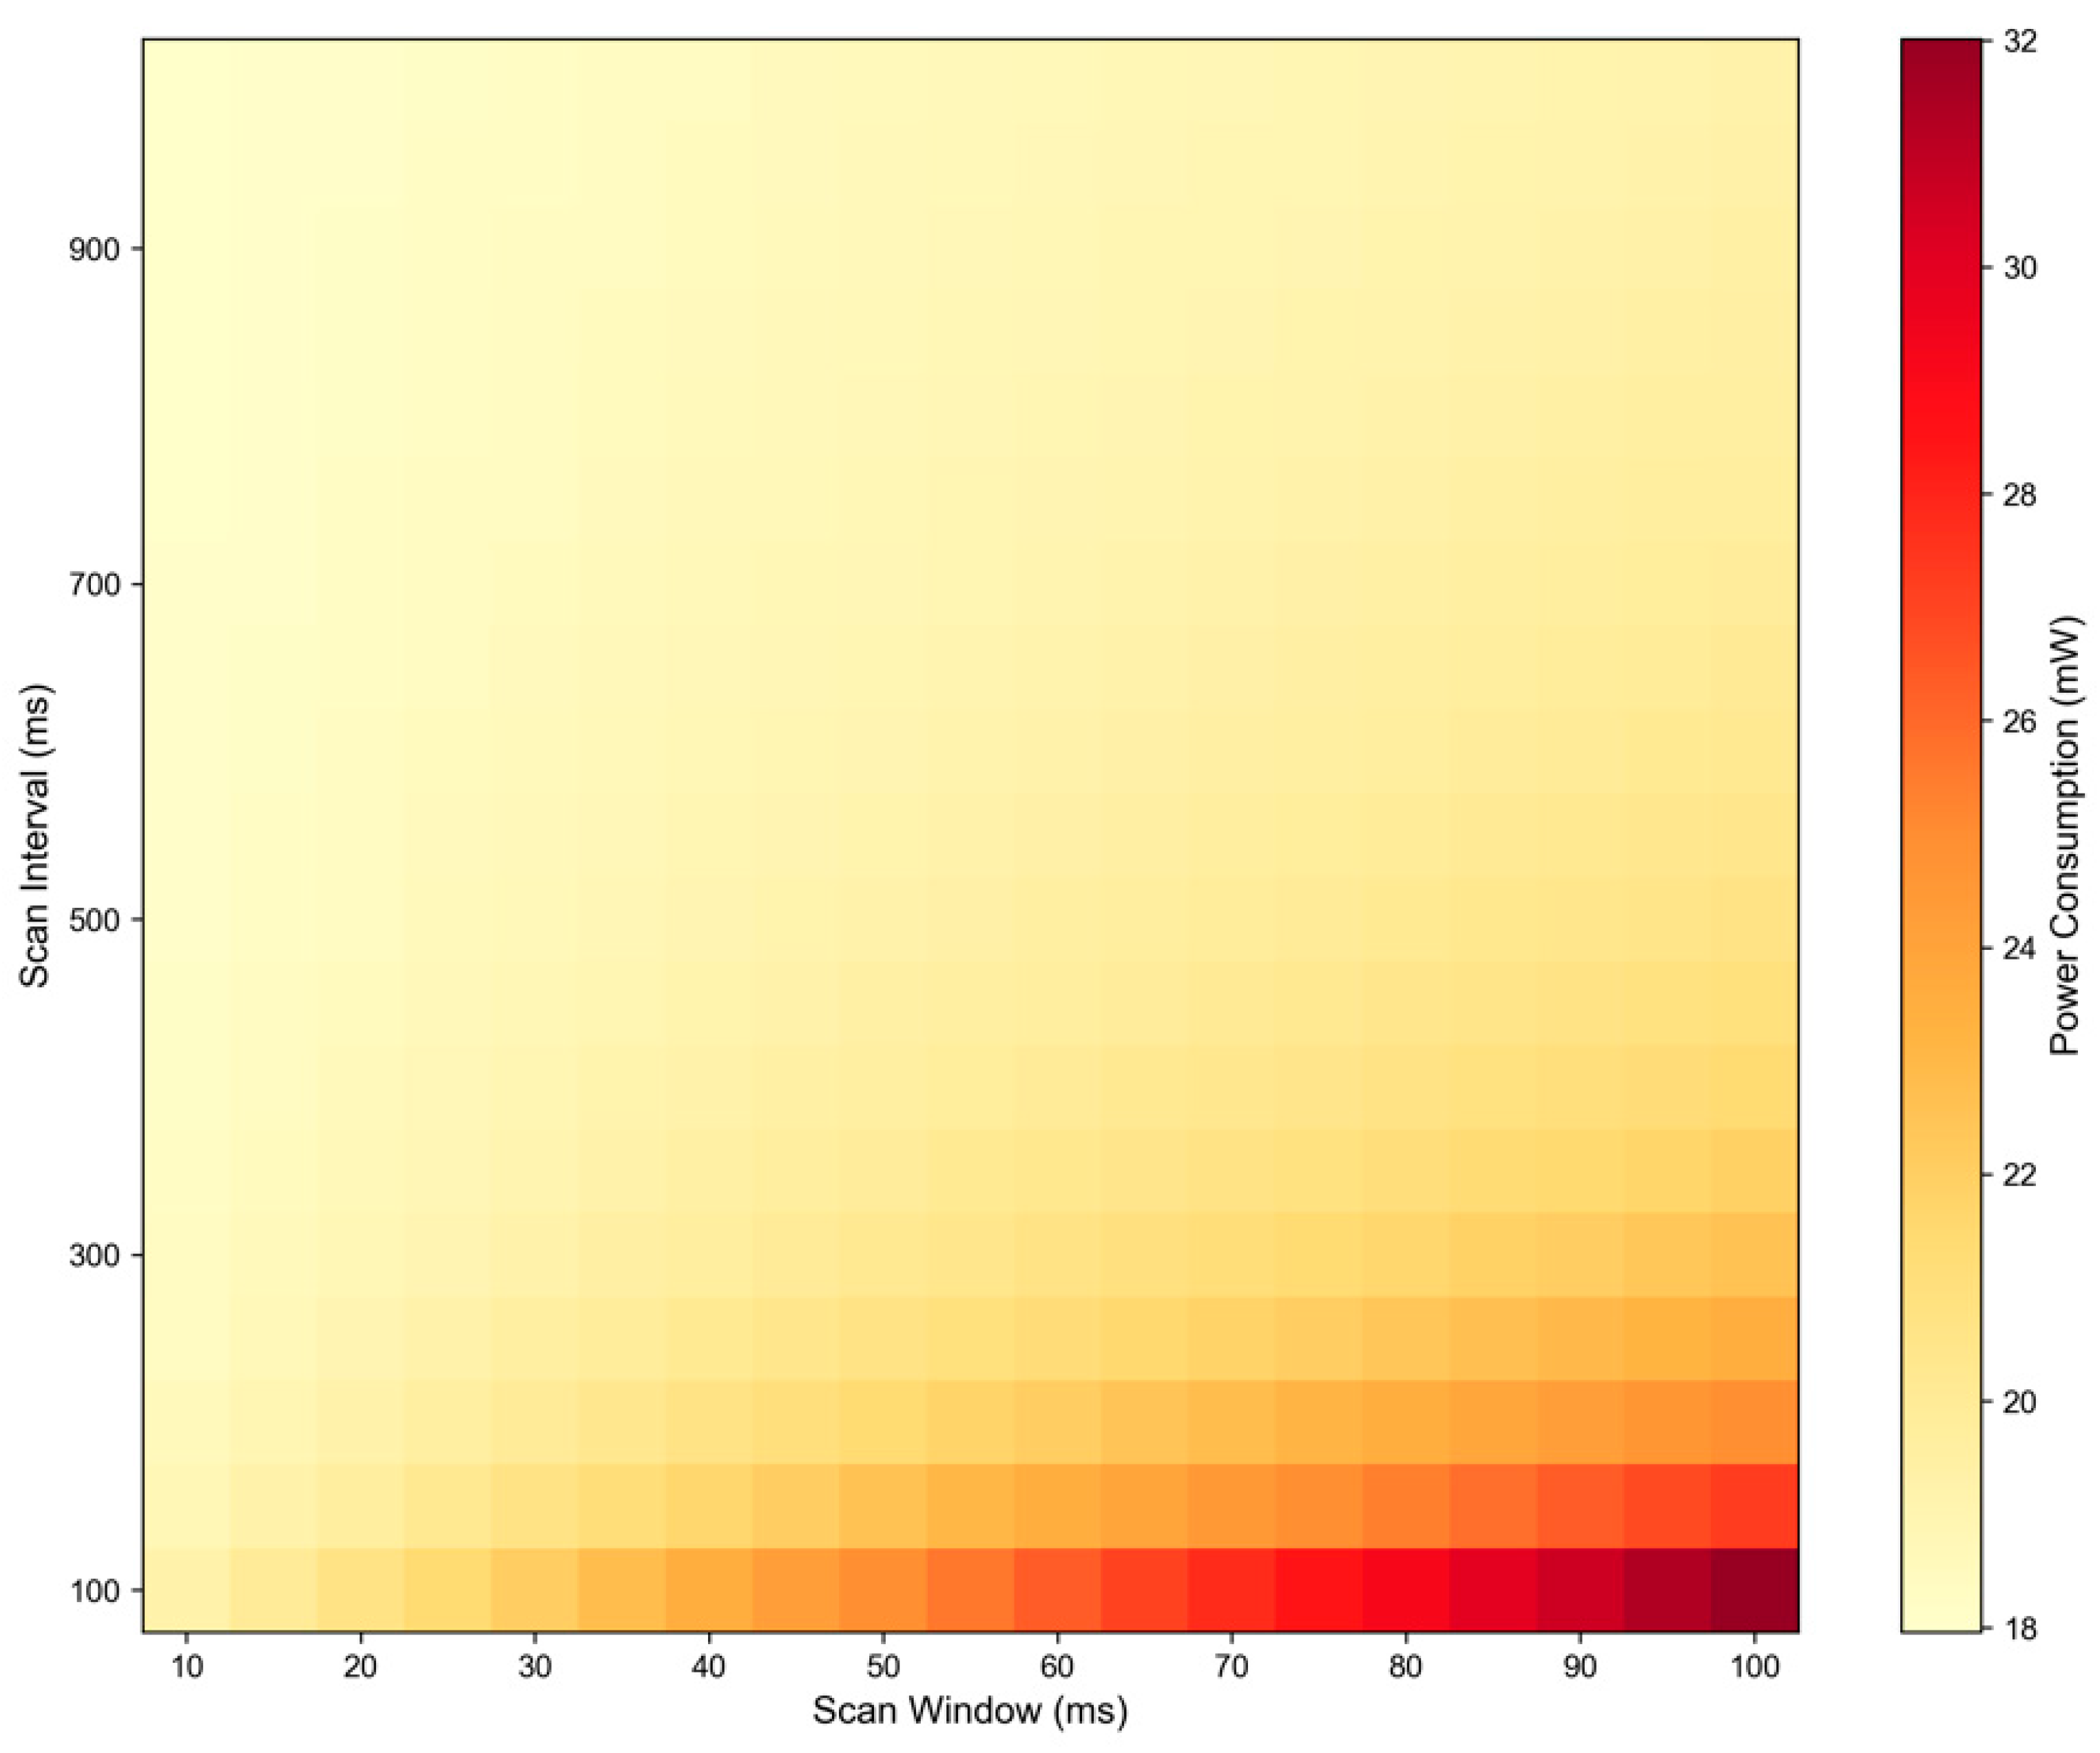
Figure 16 presents a heat map illustrating the joint impact of scanning window and scanning interval on system power consumption. The results indicate that the scanning interval exerts a dominant influence on power consumption; the color gradient along the horizontal axis (scanning interval) is significantly more pronounced than that along the vertical axis (scanning window). Specifically, each 100 ms increase in the scanning interval results in an average power reduction of 0.4 mW, with an influence weight approximately 1.2 times that of the scanning window. Based on the power constraint of ≤20 mW, the heat map reveals a clear regional classification: the upper-right region (scanning window ≥ 80 ms and scanning interval ≤ 200 ms) is identified as the ‘prohibited engineering zone’ due to a duty cycle exceeding 40% and peak power consumption reaching 25.12 mW. Conversely, the lower-left region (scanning window ≤ 40 ms and scanning interval ≥ 600 ms) constitutes the ‘low-power safe zone,’ where power consumption remains below 19 mW while maintaining a 100% RSR. Furthermore, the intersection of the RSR = 100% and power ≤ 20 mW regions encompasses 36 parameter combinations (e.g., 20 ms/400 ms, 30 ms/500 ms), demonstrating that the system possesses sufficient parameter redundancy to flexibly adapt to diverse operational scenarios, such as static monitoring, swarm coordination, and complex electromagnetic interference environments.
Table 2 shows that the distribution characteristics of Pareto frontier solutions under different PHY rates directly reflect the comprehensive optimization capability of each rate in the two-dimensional objective of recognition success rate (RSR) and power consumption. PHY 1 Mbps rate delivers the best performance, and its Pareto frontier solutions outperform those of other rates significantly in both quantity and coverage. It generates 45 non-dominated solutions with power consumption ranging from 17.96 mW to 25.50 mW, and RSR covers the full performance interval from 0.9985 to 1.0000. PHY 1 Mbps is the only rate that can achieve 100% recognition success rate, which provides sufficient redundancy and flexibility for system parameter selection. PHY 2 Mbps has 38 non-dominated solutions, with RSR ranging from 0.9970 to 0.9985 and power consumption from 18.50 mW to 26.20 mW. It cannot reach the full success threshold of 1.0000. PHY 125 kbps has 42 non-dominated solutions, with RSR ranging from 0.9980 to 0.9995 and power consumption from 18.00 mW to 25.80 mW. Its maximum RSR is still lower than that of PHY 1 Mbps. PHY 500 kbps has 40 non-dominated solutions, with RSR ranging from 0.9975 to 0.9990 and power consumption from 18.25 mW to 26.00 mW. All its indicators stay at the intermediate level with no outstanding advantages.
4.3.6. Comparison and Comprehensive Evaluation
Following the individual performance assessments, this section evaluates the comprehensive performance of various PHY rates under practical engineering constraints. By synthesizing metrics such as RSR, power consumption, latency, and environmental robustness, we validate the feasibility of the proposed system for low-altitude surveillance.
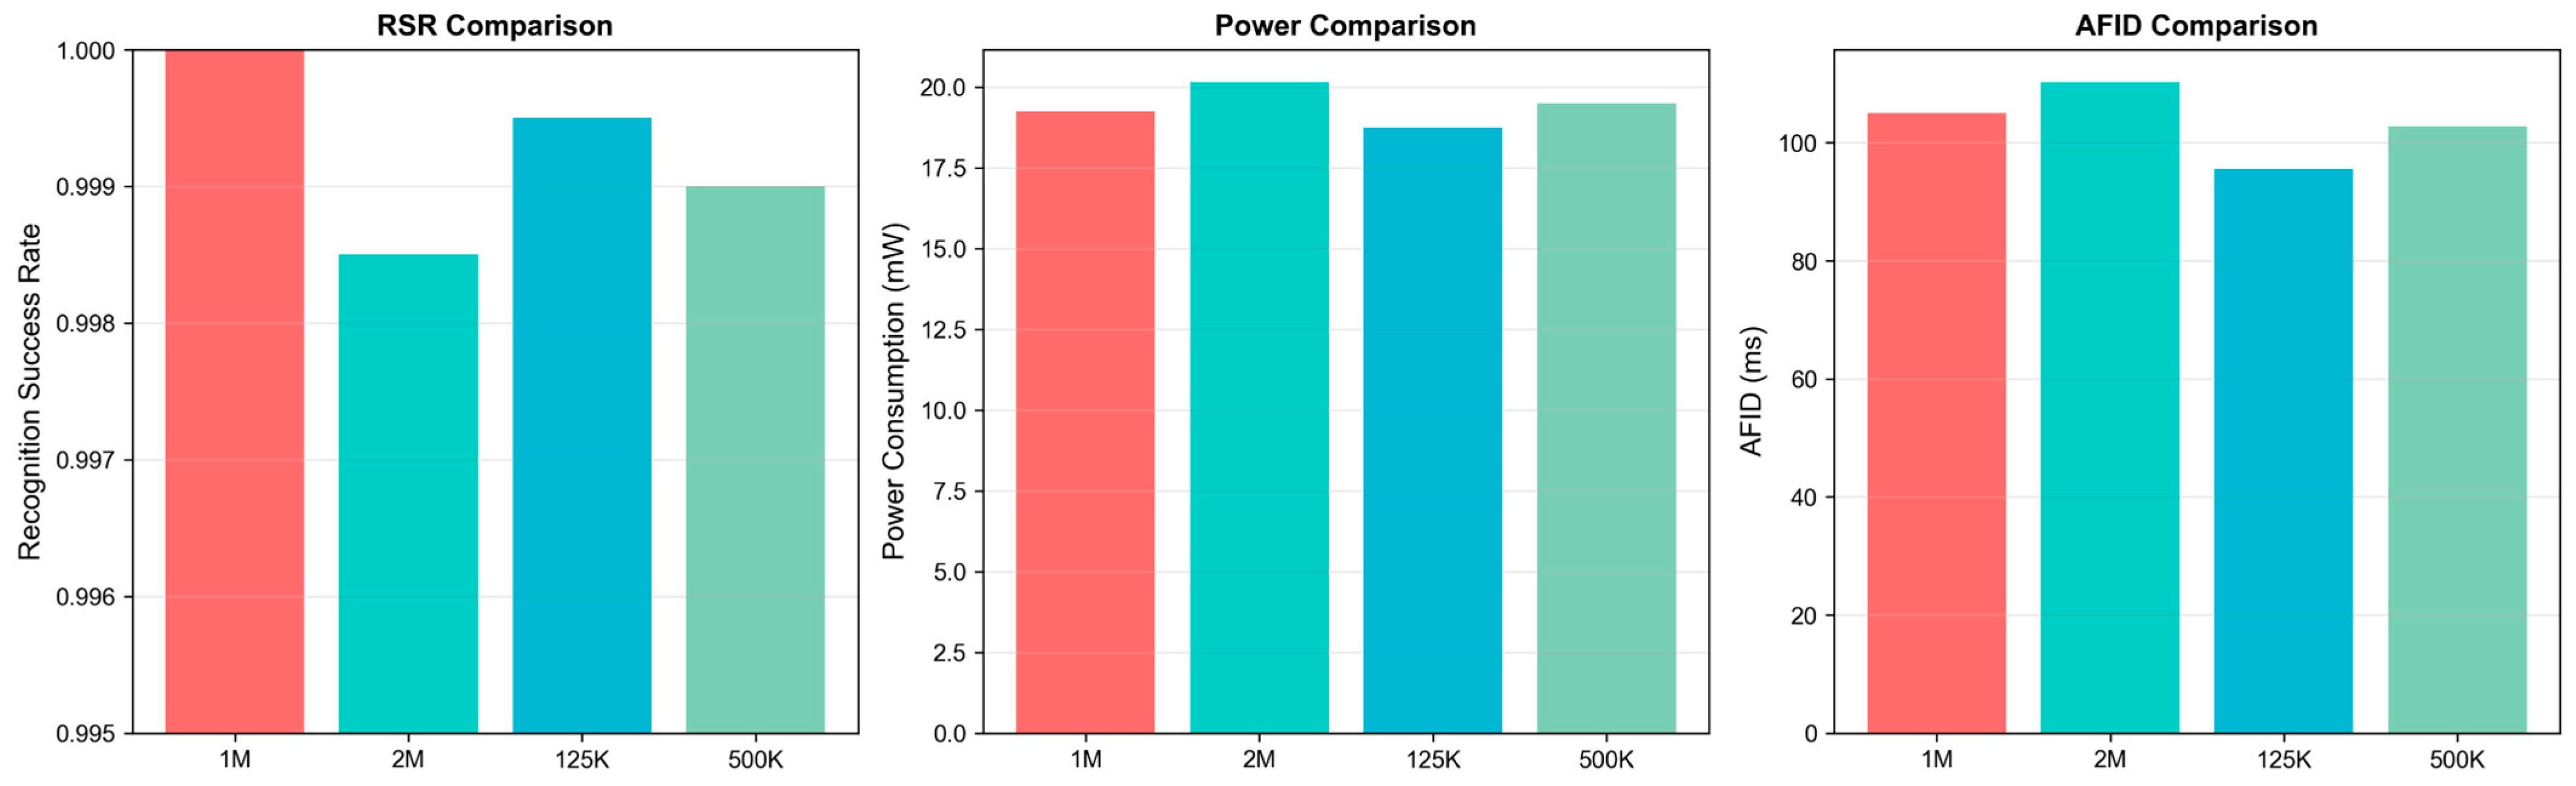
Figure 17 quantifies the performance differences: PHY 1 Mbps outperforms other rates with a superior RSR, surpassing PHY 2 Mbps (0.9985), PHY 125 kbps (0.9995), and PHY 500 kbps (0.9990). In terms of power, PHY 1 Mbps provides a flexible range of 17.96–25.50 mW, enabling a balance between low-power operation and high-reliability performance that neither PHY 2 Mbps nor PHY 125 kbps can achieve. Furthermore, with an AFID of 105 ms, PHY 1 Mbps remains well within the 200 ms real-time constraint, offering a competitive latency profile compared to other PHY modes. Consequently, PHY 1 Mbps is identified as the optimal choice for the proposed system.
Based on this multi-dimensional performance trade-off, the configuration presented in
Table 3 is recommended. This configuration resides at the optimal position on the Pareto front for the PHY 1 Mbps mode, achieving a 100% RSR to satisfy the 10
−6 failure rate requirement. Simultaneously, it maintains power consumption at 19.24 mW—well within the 20 mW constraint for UAV payloads—and stabilizes the AFID at 105 ms. This configuration achieves an optimal balance among recognition reliability, energy efficiency, and real-time responsiveness. Furthermore, the uniform dwell time of 10 ms across all three channels ensures an equitable reception probability (0.9975 for each), effectively preventing recognition blind spots caused by uneven channel resource allocation. These results further validate the feasibility and superiority of the recommended configuration for practical engineering applications.
5. Conclusions
It is important to note that the simulation results presented in this study are obtained under idealized conditions. In practical multi-UAV scenarios, the recognition success rate may be affected by various physical layer impairments, including Doppler shifts due to high-speed mobility, multipath fading, and hardware-induced timing jitter. For instance, Doppler effects and synchronization errors typically lead to a decrease in the signal-to-interference-plus-noise ratio (SINR), which would likely result in a performance drop compared to our idealized findings. Future work will focus on integrating more sophisticated channel models (e.g., Rayleigh or Rician fading) and hardware constraint parameters into our simulation framework to bridge the gap between theoretical analysis and real-world engineering implementation.
This paper discusses the autonomous identification problem of low-altitude UAVs in depth, and proposes an innovative solution based on BLE technology. Through system modeling, exhaustive optimization and comprehensive simulation verification, this study demonstrates that the optimal monitoring strategy theoretically approaches the 10−6-level identification failure rate requirement. While the model predicts this reliability level, it represents a theoretical performance boundary. Practical implementation in highly dynamic environments may require additional robust mechanisms, such as adaptive frequency hopping, to maintain this level of safety. This superior performance benefits from the introduction of safety separation constraints and the design of the three-channel integrated reception probability model.
BLE-based UAV autonomous identification technology shows high feasibility at the technical level. The optimal listening strategy in the proposed model can achieve 100% recognition success rate (RSR) with 19.24 mW low power consumption and 105 ms average first identification delay (AFID), and meets the 10−6 failure rate requirement. The introduction of 30 m horizontal and 10 m vertical safety separation constraints significantly improves the system recognition success rate from the original about 80% to 100%. The PHY 1 Mbps rate achieves the optimal balance among recognition success rate, power consumption and time delay, and is the recommended choice for low-altitude UAV identification scenarios. The exhaustive algorithm achieves remarkable optimization effect: it successfully determines the optimal configuration of listening strategy parameters through global search, and effectively balances recognition success rate and power consumption. Three-dimensional simulation results show that the proposed scheme can still operate effectively in complex three-dimensional space environments, reflecting its potential in practical applications. Systematic analysis demonstrates that the scheme has robustness under varying environmental conditions in dynamic topologies, complex interference and multi-UAV scenarios. Based on the above research, the following parameter configuration is recommended: a 30 ms scanning window, 100 ms scanning interval, 10 ms residence time for each of three channels, and PHY 1 Mbps rate.
While this study focuses on functional identification and parameter optimization, it is important to acknowledge the practical deployment challenges. The proposed collision model is currently theoretical, and further validation against established network simulation platforms (e.g., ns-3) or empirical BLE traffic measurements is necessary to fully capture the complexities of real-world multi-UAV environments.
Several critical factors remain to be addressed for real-world implementation:
Coexistence and Interference: The 2.4 GHz ISM band is highly congested. Future work will investigate the impact of Wi-Fi interference on BLE packet delivery and explore adaptive frequency-hopping strategies to enhance robustness.
Scalability: In dense urban environments with a high density of UAVs, channel congestion becomes a bottleneck. We plan to evaluate the scalability of our identification scheme under high-traffic scenarios.
Hardware Constraints: Onboard BLE modules have limited transmission power and processing capabilities. Future research will focus on optimizing the computational overhead of the identification algorithm to ensure compatibility with low-power embedded hardware.
Security and Regulation: The current scheme does not incorporate cryptographic authentication or trust management. These security-related aspects are complex tasks that fall outside the scope of this study. Furthermore, compliance with evolving aviation regulations regarding remote identification (Remote ID) remains a priority.
Future research will address these challenges and validate our theoretical findings through hardware-in-the-loop (HITL) experiments and cross-comparison with existing technologies such as ADS-B.