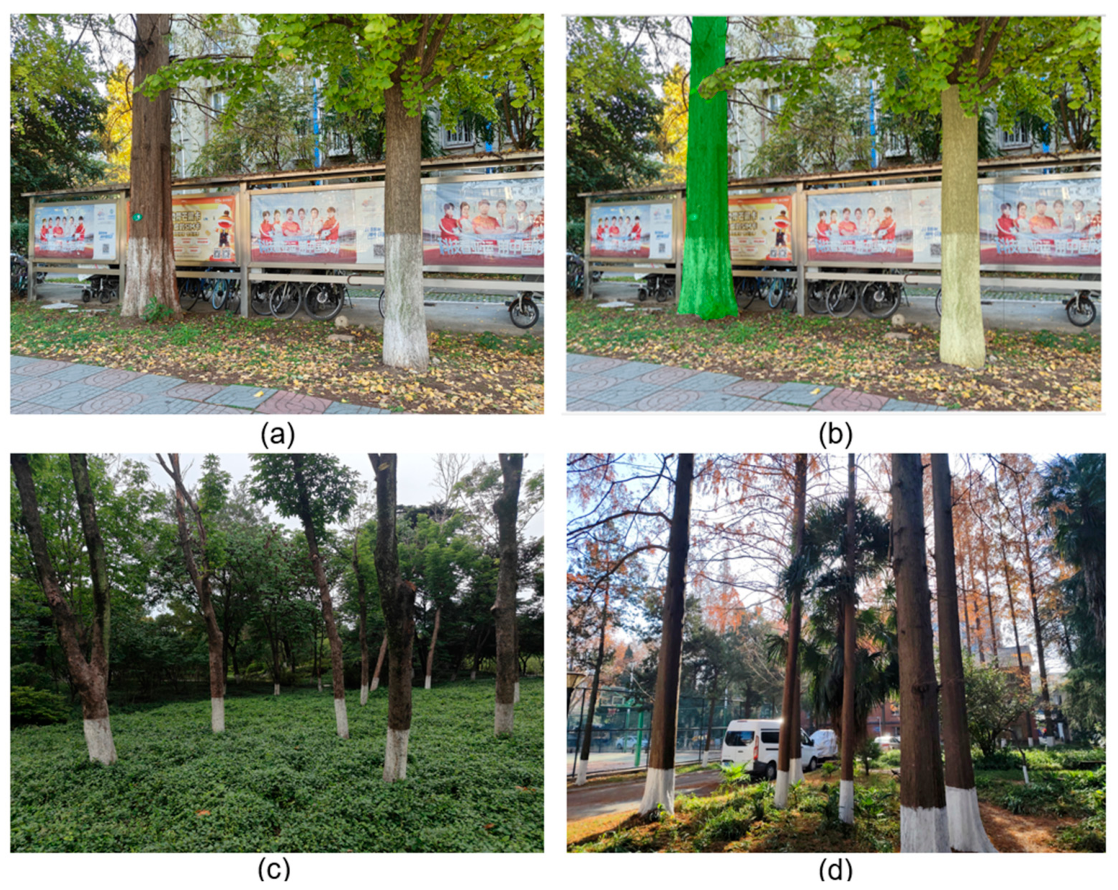
1. Introduction
Tree species detection is an important task in forestry resource investigation, ecological monitoring, and urban green space management. Accurate species information supports forest inventory, biodiversity conservation, and the intelligent management of tree resources [
1]. Existing tree species detection methods mainly rely on external morphological traits, such as leaves, flowers, fruits, and whole-tree structure. These features can be effective under suitable conditions, but their usefulness is often restricted when leaves are absent, the canopy is occluded, or the observation season is unfavorable. In contrast, bark texture provides a relatively stable visual cue, as it is less affected by seasonal change and is relatively easy to acquire in natural environments. Because of these advantages, bark provides a more stable visual feature for tree species detection in complex scenes. With the continued development of computer vision and image analysis, bark texture analysis has gradually become an important direction in intelligent tree species detection research [
2,
3,
4,
5].
In recent years, image-based tree species recognition studies have developed rapidly. Existing studies have mainly focused on leaf images, whole-tree images, and bark images. Leaf-based methods have evolved from traditional pattern recognition to deep convolutional neural networks, and their performance has been further improved through transfer learning and ensemble strategies [
6,
7,
8,
9,
10,
11,
12,
13,
14,
15,
16,
17,
18]. Whole-tree image recognition has also benefited from deep learning, especially in capturing global structural information and improving discrimination in natural scenes [
19,
20,
21,
22,
23,
24,
25,
26]. In the field of bark analysis, early studies mostly relied on handcrafted texture descriptors and statistical classifiers [
27,
28,
29,
30,
31,
32,
33,
34,
35,
36], while later work increasingly introduced convolutional neural networks, transfer learning, attention mechanisms, and public bark datasets such as BarkNet to improve classification accuracy and robustness [
37,
38,
39,
40,
41,
42,
43,
44,
45,
46,
47,
48]. These studies confirm that bark contains discriminative biological information that is useful for tree species detection. However, most existing work still focuses on image classification rather than object detection, and research on tree species detection based on bark texture in complex natural environments remains limited. In particular, dataset support is still insufficient, existing multi-scale fusion strategies are not well adapted to fine-grained bark textures, and attention-based enhancement for bark-texture-based detection has not yet been systematically explored.
Compared with general object categories, tree species detection based on bark texture presents several distinctive challenges. First, the visual differences among closely related tree species are often subtle, and discriminative cues are usually embedded in fine-grained texture patterns such as cracks, grooves, scales, and irregular surface structures [
37,
38,
39]. Second, bark images collected in the field frequently contain shadows, moss, reflections, occlusions, and damaged surfaces, which increase background interference and easily disturb feature learning [
40,
46,
47,
48]. Third, the same species may appear at different spatial scales because of changes in shooting distance, angle, and local cropping, which places higher demands on multi-scale representation. As a result, a detector for bark-texture-based tree species detection must not only preserve high-frequency texture details, but also maintain stable discrimination under noisy and scale-varying conditions.
Object detection differs fundamentally from image classification because it requires both category recognition and accurate target localization. This makes bark-texture-based tree species detection more demanding in terms of feature extraction, multi-scale fusion, and precise localization. Based on the literature reviewed above, three issues remain insufficiently addressed in current bark-texture-based tree species detection. First, dedicated object-detection datasets for bark-based tree species recognition remain limited, especially under realistic forestry conditions with diverse backgrounds and scene complexity [
40,
41,
42,
43,
44,
45,
46,
47,
48]. Second, although class imbalance and multi-scale feature variation have been widely discussed in general object detection [
49,
50], their influence on fine-grained bark-texture detection has not been sufficiently examined [
51]. Third, although attention mechanisms have shown value in suppressing irrelevant background and highlighting key regions [
24], the suitability of different lightweight attention mechanisms for extracting discriminative bark-texture features under complex backgrounds still requires systematic comparison.
Among the current detection frameworks, the YOLO series has achieved a favorable balance between detection accuracy and inference efficiency, making it suitable for practical object-detection applications [
52,
53,
54,
55]. In particular, YOLOv8 adopts an efficient one-stage detection framework and improved multi-scale feature fusion, which provide a strong baseline for detecting bark targets in natural scenes [
55,
56]. YOLOv8s was selected in this study because its lightweight scale is more suitable for practical deployment while retaining the ability to extract and fuse multi-level features. However, directly applying a generic detector to bark imagery still cannot fully resolve the problems caused by subtle inter-class differences, complex backgrounds, and texture scale variation. Therefore, task-oriented adaptation of feature fusion and attention enhancement is necessary for bark-texture-based tree species detection. To address these issues, this study constructs the Tree_bark dataset and develops an improved YOLOv8s-based framework for tree species detection using bark texture in complex natural scenes. On this basis, baseline diagnosis, multi-scale enhancement, attention mechanism optimization, dual-module fusion, and visualization-oriented application validation are carried out.
The main contributions of this study are as follows. First, the Tree_bark dataset is constructed to support multi-category tree species detection based on bark texture under diverse acquisition conditions. Different from many previous bark-recognition studies that mainly focus on image-level classification, this study formulates bark-based tree species recognition as an object-detection task in natural scenes, requiring both bark-region localization and species identification. Second, an improved YOLOv8-based detection framework is developed, in which weighted feature fusion and attention mechanism optimization are introduced to enhance multi-scale texture representation and discriminative feature extraction. Third, experiments under the current fixed dataset split show that the fused D1 model obtains the highest overall performance among the compared settings in terms of mAP@0.5, mAP@0.5:0.95, and Recall, while also showing competitiveness against representative mainstream detectors. These results indicate that targeted optimization around bark texture characteristics is an effective way to improve tree species detection in complex natural environments.
2. Materials and Methods
2.1. Study Area and Image Acquisition
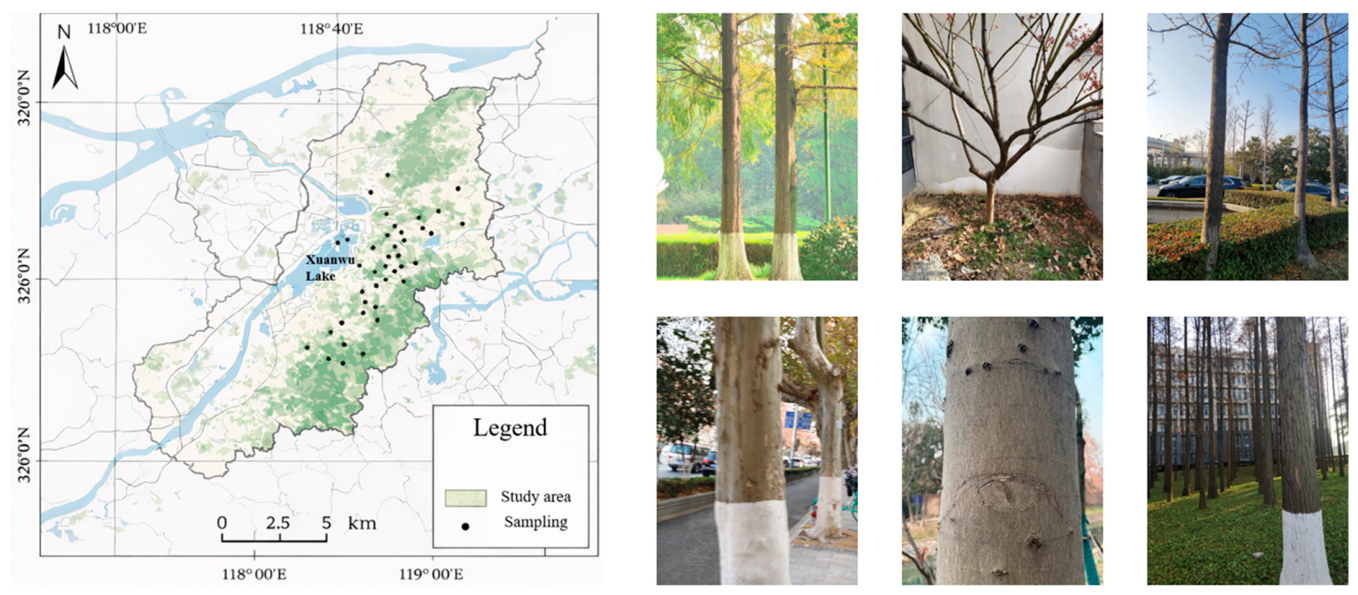
This study was conducted in Nanjing, Jiangsu Province, China. Bark images were collected from representative natural and urban vegetation scenes, mainly including urban forests, green belts, parks, and campus vegetation. The main sampling area was located within Nanjing Forestry University, and supplementary samples were acquired from Xuanwu Lake Park and Zijin Mountain Scenic Area to enrich species coverage and scene diversity. The study area and representative bark image samples are shown in
Figure 1.
The image acquisition followed an opportunistic and representativeness-oriented field sampling strategy rather than a strictly random sampling design. During sampling, trees were selected to cover as many target species, bark texture types, illumination conditions, viewing angles, shooting distances, and background conditions as possible. For each sampled tree, bark images were captured from visible trunk or branch regions under natural field conditions. Variations in illumination, viewing angle, shooting distance, partial occlusion, and background were retained to better reflect the complexity of real application scenarios.
To improve data quality and reduce obvious noise, image screening was performed after acquisition. Images were excluded when the bark region was severely blurred, heavily occluded, extremely overexposed or underexposed, dominated by strong shadow or reflection, too small to support reliable identification, or nearly duplicated with images from the same tree or continuous shooting sequence. This screening procedure was intended to remove unusable samples while retaining natural variation relevant to practical bark-texture-based tree species detection.
2.2. Tree_Bark Dataset Construction
Based on the field survey and image acquisition described above, this study constructed a dedicated dataset, named Tree_bark, for tree species detection based on bark texture. A total of 9157 original bark images were collected from representative tree species in the Nanjing area, and 8216 valid images were retained after quality screening and preprocessing. The final dataset covers 134 tree species. Representative field images and annotation examples are shown in
Figure 2, and the overall dataset statistics are summarized in
Table 1. The per-class distributions of images and annotated instances in the training, validation, and test sets are provided in
Supplementary Table S1 to further show the class composition and imbalance of the dataset.
To improve dataset diversity and representativeness, two principles were followed during data collection and curation. First, species coverage was expanded as much as possible to include both common local species and additional species with more challenging bark patterns. Second, variation in illumination, shooting time, viewing angle, and environmental interference was intentionally retained so that the dataset could better reflect the visual uncertainty of real application scenes.
Image preprocessing mainly involved two steps. First, manual screening was performed to remove images without valid bark targets, with severe blur, excessive shadow, or unsuitable annotation quality. Second, all retained images were resized to 640 × 640 pixels for training consistency in this study, and padding was applied to preserve the original aspect ratio and reduce texture distortion caused by direct stretching. This procedure ensured input consistency while preserving bark texture details as much as possible.
For annotation, ISAT-SAM (ISAT with Segment Anything, version 1.33;
https://github.com/yatengLG/ISAT_with_segment_anything, accessed on 5 June 2026), an interactive semi-automatic annotation tool based on Segment Anything, was used.Bark regions were first roughly indicated through foreground–background interaction, and the generated results were then manually checked and refined. Considering the variability of bark texture, illumination, and occlusion, all valid targets were finally annotated with bounding boxes. Only regions with identifiable species attribution and recognizable bark texture were included, whereas severely occluded, heavily blurred, or unidentifiable regions were excluded. If multiple valid bark targets appeared in the same image, they were annotated separately. The annotation results were first saved in JSON format and were then converted into the TXT labels required for YOLOv8 training.
The dataset was divided into training, validation, and test sets at a ratio of 7:2:1. During the split, highly similar images from the same tree, the same continuous shooting sequence, or the same local scene were avoided across subsets as far as possible to better reflect the model’s generalization ability. To further examine the class distribution of the Tree_bark dataset, we counted the number of images and annotated instances for each of the 134 annotated classes in the training, validation, and test sets. The complete per-class distribution is provided in
Supplementary Table S1. The results show that the dataset has a long-tailed distribution, which may increase the difficulty of detecting rare or under-represented classes.
These dataset characteristics guided the selection and improvement of the detection models in this study. YOLOv8s was selected as the baseline because it provides an efficient one-stage detection framework for practical object detection. WeightedConcat-based multi-scale fusion was then introduced to strengthen the representation of bark targets at different spatial scales, while lightweight attention modules were used to enhance discriminative bark-texture responses and reduce the influence of complex backgrounds. Therefore, the selected models and modules were designed to address the main challenges observed in the Tree_bark dataset, including scale variation, background interference, and fine-grained texture similarity.
2.3. Detection Framework for Tree Species Based on Bark Texture
Although the baseline YOLOv8s model provides a feasible starting point for tree species detection based on bark texture, the baseline results indicate clear limitations in precise localization, background robustness, and discrimination among visually similar species. To address these limitations, the present study improves the baseline framework from two complementary directions: multi-scale feature enhancement and attention-guided feature optimization. The former is intended to strengthen the representation and fusion of bark textures at different spatial scales, whereas the latter aims to improve the selection of discriminative texture responses under complex background interference. On this basis, the preferred multi-scale strategy and the preferred attention module are further combined to construct the final fused D1 model.
2.3.1. Baseline Yolov8s Detector
YOLOv8s was selected as the baseline model because it provides a good balance between detection accuracy and computational efficiency. As a one-stage object detector, YOLOv8 integrates feature extraction, multi-scale feature fusion, and target prediction into a unified framework, which makes it suitable for practical scenarios that require both accuracy and inference efficiency [
52,
53,
54,
55,
56]. For tree species detection based on bark texture, the detector must handle fine-grained texture variation, scale changes, partial occlusion, and background interference in natural scenes. Under this task setting, YOLOv8s provides a strong and efficient baseline for subsequent task-oriented improvement.
2.3.2. Multi-Scale Enhancement Strategies
Because bark images contain both local fine cracks and broader surface structures, the detector needs to capture discriminative information at different spatial scales. To improve multi-scale representation, three strategies were investigated in this study. The first was high-resolution training, which was intended to preserve more high-frequency texture details by increasing the input image size. The second was the introduction of a P2 detection layer, which aimed to strengthen the model’s sensitivity to small-scale local texture regions by using higher-resolution shallow features. The third was the replacement of standard Concat operations in the neck with WeightedConcat, so that the contributions of different feature scales could be adaptively adjusted during fusion.
To improve the adaptiveness of feature fusion in the neck, WeightedConcat was introduced to replace selected ordinary concatenation operations. For an input group consisting of n feature maps,
X1, X2, …, Xn, WeightedConcat assigns a learnable branch-level scalar parameter
αi to each input feature branch. The normalized weight of the
i-th branch is calculated using Equation (1):
where
ε is a small constant used for numerical stability. The output feature is then obtained by concatenating the weighted feature maps along the channel dimension, as shown in Equation (2):
In this study, the weights are branch-level scalar weights rather than per-channel weights. These weights are initialized equally and optimized during model training through back-propagation. Compared with ordinary concatenation, which treats all input feature branches equally, WeightedConcat allows the model to adaptively balance feature contributions from different scales while introducing only a small number of additional parameters.
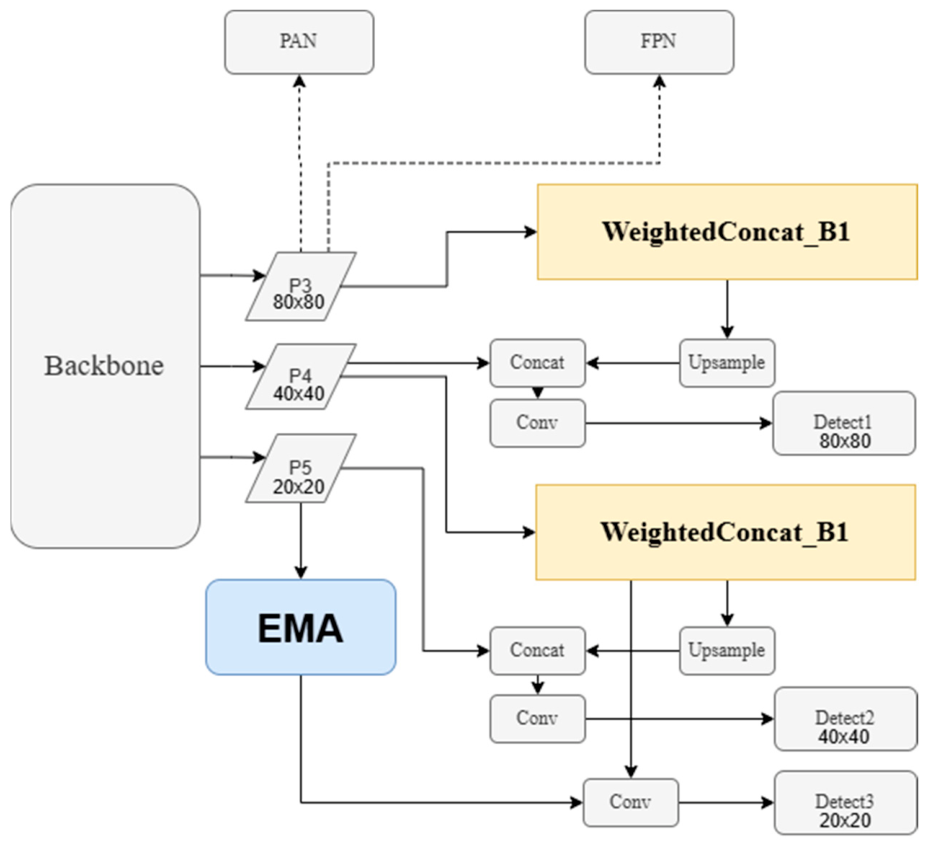
To avoid excessive structural disturbance, the WeightedConcat strategy was implemented in a progressive manner. In the B1 setting, WeightedConcat was introduced at two main feature-fusion nodes in the neck, corresponding to the two ordinary Concat operations marked in
Figure 3. These nodes are responsible for fusing feature maps from different scales before prediction. In the B2 setting, the replacement range was further expanded to additional Concat operations in the neck. This design made it possible to compare whether moderate adaptive fusion or more extensive weighted fusion was more suitable for tree species detection based on bark texture.
2.3.3. Attention Mechanism Integration
In tree species detection based on bark texture, discriminative cues are often concentrated in subtle local texture regions, whereas complex natural backgrounds may introduce redundant responses. To enhance the model’s ability to highlight meaningful bark structures and suppress irrelevant background information, three lightweight attention mechanisms were compared in this study: Squeeze-and-Excitation (SE), Convolutional Block Attention Module (CBAM), and Efficient Multi-Scale Attention (EMA). Specifically, SE focuses on channel recalibration, CBAM performs joint channel–spatial attention modeling, and EMA provides lightweight multi-scale attention enhancement [
24,
57,
58]. By integrating these modules into the same detection framework under consistent training settings, their suitability for bark-texture-based tree species detection could be evaluated in a controlled manner. The three attention modules were selected because they represent different lightweight attention mechanisms. SE emphasizes channel-wise feature recalibration, CBAM combines channel and spatial attention, and EMA introduces efficient multi-scale attention interaction. This design made it possible to compare whether bark-texture-based detection benefits more from channel weighting, spatial localization, or multi-scale attention enhancement. The attention modules were inserted at the same functional position under each corresponding experimental setting to ensure comparability.
2.3.4. Fusion Model Construction
After the single-module experiments, the preferred multi-scale strategy and the preferred attention mechanism were combined to construct the final fused model, denoted as D1 (YOLOv8s_WE). In this model, WeightedConcat_B1 was used to enhance cross-scale feature fusion in the neck, whereas EMA was introduced in the feature-enhancement stage after neck fusion to strengthen discriminative bark-texture responses before final prediction.
Figure 3 illustrates the overall structure of the proposed improved YOLOv8 framework and highlights the positions of the WeightedConcat_B1 and EMA modules.
2.4. Experimental Settings and Evaluation Metrics
All experiments were conducted on the Tree_bark dataset under the same data split and evaluation criteria. The validation set was used for model selection and ablation comparison among the tested variants, whereas the held-out test set was used only for the final evaluation of the baseline model and the final fused D1 model. The training and testing process was performed on a cloud GPU server. The main hardware and software environment is summarized in
Table 2, while the remaining training settings are described below. The experimental environment included Ubuntu 20.04 LTS (Canonical Ltd., London, UK;
https://ubuntu.com, accessed on 1 April 2026), Python 3.9 (Python Software Foundation, Wilmington, DE, USA;
https://www.python.org, accessed on 1 April 2026), the PyTorch deep learning framework (Meta AI, Menlo Park, CA, USA;
https://pytorch.org, accessed on 1 April 2026), and the official Ultralytics implementation of YOLOv8 (Ultralytics, Frederick, MD, USA;
https://github.com/ultralytics/ultralytics, accessed on 1 April 2026). CUDA 11.8 and cuDNN 8.7 (NVIDIA Corporation, Santa Clara, CA, USA;
https://developer.nvidia.com, accessed on 1 April 2026) were used to ensure compatibility. The hardware configuration consisted of one NVIDIA GeForce RTX 3090 GPU (NVIDIA Corporation, Santa Clara, CA, USA) with 24 GB memory, an 8-core CPU, and 24 GB RAM. For the YOLOv8s baseline and its improved variants, the input image size was set to 640 × 640, the initial learning rate was 0.01, the batch size was 8, and the number of training epochs was 100. For comparison with mainstream detectors, all models were trained and evaluated using the same Tree_bark dataset split and the same evaluation metrics. The input size and training epochs were kept as consistent as possible, while detector-specific default optimization settings were retained when necessary because different detector families use different training pipelines and architectural assumptions. Therefore, the cross-model comparison was intended to provide a practical reference under a unified dataset setting rather than a fully hyperparameter-optimized benchmark for each detector family. Except for the structural variables introduced in the improvement experiments, the remaining training settings were kept consistent to ensure fair comparison.
To evaluate model performance comprehensively, this study mainly used Precision, Recall, F1-score, mAP@0.5, and mAP@0.5:0.95. Precision reflects the proportion of correctly detected targets among all positive predictions, while Recall indicates the proportion of ground-truth targets that were successfully detected. F1-score was calculated as the harmonic mean of Precision and Recall and was used to evaluate the balance between false positives and missed detections. mAP@0.5 evaluates detection performance under a relatively loose IoU threshold, whereas mAP@0.5:0.95 provides a stricter assessment across multiple IoU thresholds and is more sensitive to localization quality. In addition, model complexity and efficiency can be further analyzed using indicators such as the number of parameters, GFLOPs, and FPS when necessary. These metrics together provide a more complete view of detection accuracy, localization quality, and practical usability.
To provide additional statistical support for the graphical and quantitative results, class-wise AP values were further analyzed on the held-out test set. Specifically, AP@0.5 and AP@0.5:0.95 values were calculated for the 86 classes that had annotated instances in this test set and were available in both YOLOv8s_Baseline and D1 outputs. The paired class-wise AP distributions of the two models were summarized using mean, standard deviation, median, and interquartile range. Because the same classes were compared between YOLOv8s_Baseline and D1 and the AP distributions may not follow a normal distribution, the paired Wilcoxon signed-rank test was used to examine whether the class-wise performance differences were statistically supported.
3. Results and Analysis
3.1. Baseline Performance and Problem Diagnosis
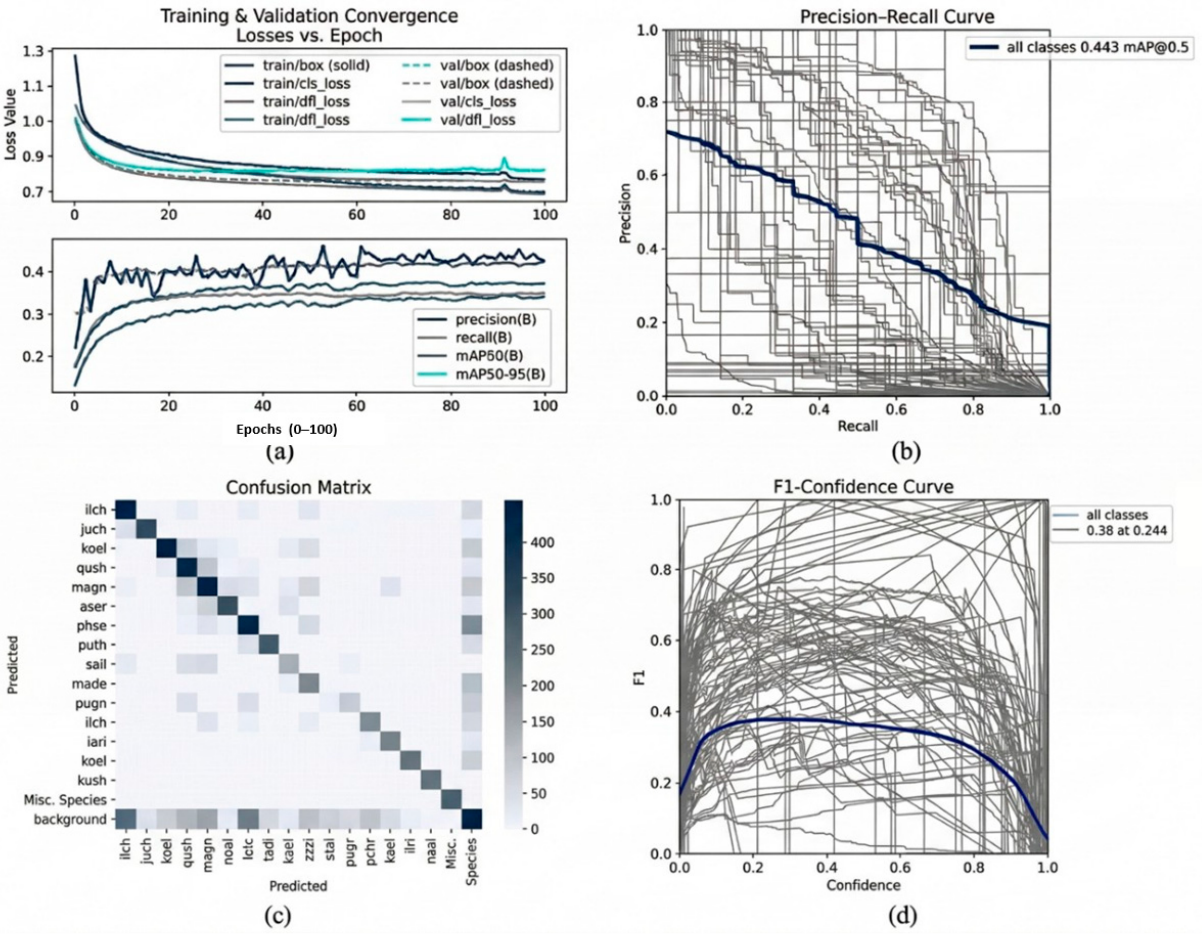
To establish a reliable reference for subsequent improvement, the baseline model was first trained and evaluated on the Tree_bark dataset. The main loss terms decreased rapidly in the early stage and gradually stabilized as training progressed, indicating that the baseline model was able to learn bark-texture features effectively under the current training setting.
In terms of detection performance, the baseline model achieved a mAP@0.5 of 0.443 and a mAP@0.5:0.95 of 0.339, with a Precision of about 0.65 and a Recall of about 0.40 on the validation set. These results indicate that the baseline model already showed preliminary detection performance, but its effectiveness declined when performance was evaluated across IoU thresholds from 0.50 to 0.95. In particular, the gap between mAP@0.5 and mAP@0.5:0.95 suggests that the baseline model remained limited in precise localization and fine-grained discrimination. The corresponding baseline diagnostic results are shown in
Figure 4. Because the Tree_bark dataset contains 134 annotated classes, displaying all class names in the confusion matrix would substantially reduce readability. Therefore,
Figure 4 presents a representative confusion-matrix visualization using the original annotation abbreviations, and the full mapping between class labels and scientific names is provided in
Supplementary Table S2.
Further evidence can be observed from the PR and F1–Confidence trends. The PR curve does not remain close to the upper-right corner, indicating that the baseline model still struggled to maintain both high precision and high recall at the same time. The F1–Confidence curve also suggests that the model reached its best operating state only within a relatively narrow confidence interval, which reflects limited decision robustness under complex texture and background conditions.
The confusion matrix provides a more intuitive view of the remaining difficulties. Most correctly predicted samples are concentrated on the diagonal, indicating that the baseline model was able to recognize a large proportion of bark categories. At the same time, obvious confusion remained among several visually similar species, especially those with highly similar crack patterns or surface structures. In addition, some samples were misclassified as background, suggesting that weak-texture regions and low-contrast targets were still challenging for the baseline model. Taken together, the baseline results still leave clear room for improvement in multi-scale texture representation, localization quality, and the suppression of background interference. Quantitatively, the baseline model showed a clear gap between mAP@0.5 and mAP@0.5:0.95, indicating that many predictions were acceptable under a loose IoU threshold but became less reliable under stricter localization criteria. In addition, the relatively low Recall suggests that missed detections were still common for weak-texture, low-contrast, or partially occluded bark regions. These errors are consistent with the confusion matrix, in which several visually similar or low-sample categories showed stronger misclassification tendencies.
3.2. Results of Multi-Scale Enhancement
To improve the ability of the detector to represent bark textures at different scales, three multi-scale enhancement strategies were compared, namely high-resolution training, P2 detection layer expansion, and WeightedConcat-based adaptive feature fusion. The corresponding results are summarized in
Table 3.
Among the tested strategies, the B1 model showed the most favorable overall performance under the current experimental setting. Compared with the baseline, B1 increased Recall from 0.400 to 0.421, F1-score from 0.495 to 0.517, mAP@0.5 from 0.443 to 0.472, and mAP@0.5:0.95 from 0.339 to 0.345. This improvement indicates that replacing two key fusion nodes with WeightedConcat helped strengthen cross-scale feature interaction for bark-texture-based tree species detection.
By contrast, the gains brought by high-resolution training were limited. Although the high-resolution setting slightly improved mAP@0.5 to 0.447, its mAP@0.5:0.95 and Recall did not improve accordingly. This result indicates that simply increasing input resolution does not necessarily translate into more reliable bark detection. In addition, the P2 detection-layer setting showed a clear performance drop, with mAP@0.5 and mAP@0.5:0.95 decreasing to 0.358 and 0.263, respectively. This suggests that, for tree species detection based on bark texture, directly introducing shallower small-target features may also introduce more irrelevant noise and optimization burden.
A further comparison between B1 and B2 shows that more weighted fusion is not always better. Although B2 still outperformed the baseline in mAP@0.5, its Recall dropped noticeably, and its overall improvement remained smaller than that of B1. This result implies that excessive replacement of fusion nodes may weaken feature transmission stability and increase the influence of shallow noise. Therefore, B1 was selected as the preferred multi-scale enhancement strategy for the following experiments.
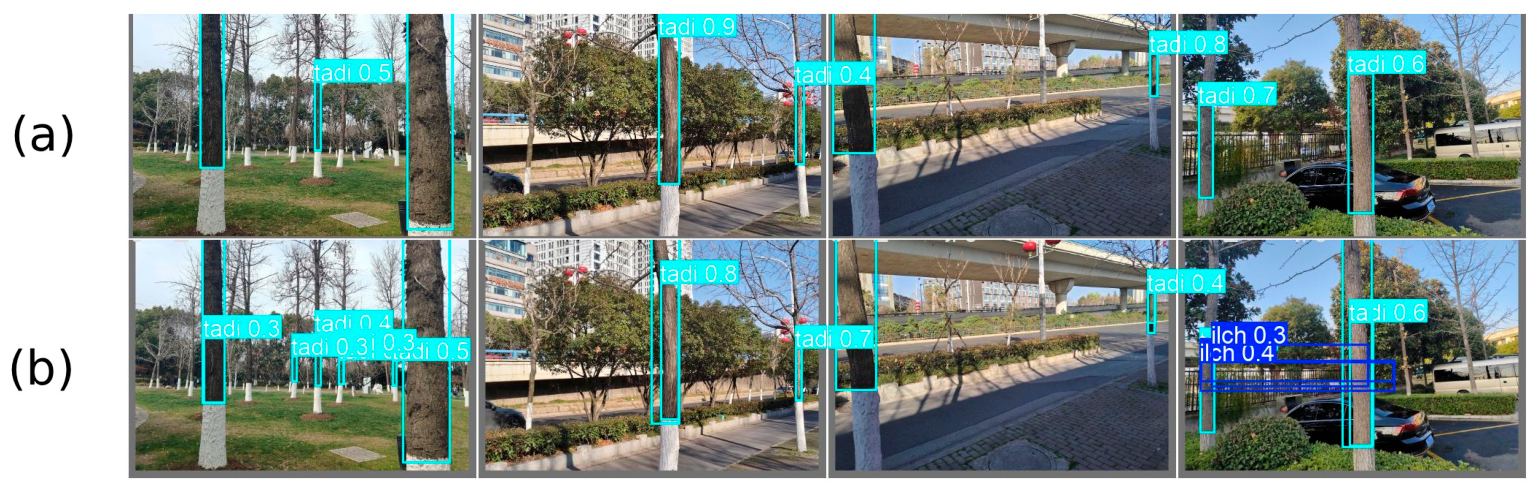
Representative detection comparisons between YOLOv8s_WeightedConcat_B1 and YOLOv8s_Baseline are shown in
Figure 5. The visual comparisons also show that the B1 model produced more reliable predictions and higher confidence on difficult samples, especially when multiple targets or texture interference were present in the same image.
3.3. Results of Attention Mechanism Comparison
To further enhance the discrimination of key bark texture regions and suppress irrelevant background responses, three lightweight attention modules, namely SE, CBAM, and EMA, were introduced and compared under the same training setting. The corresponding results are summarized in
Table 4.
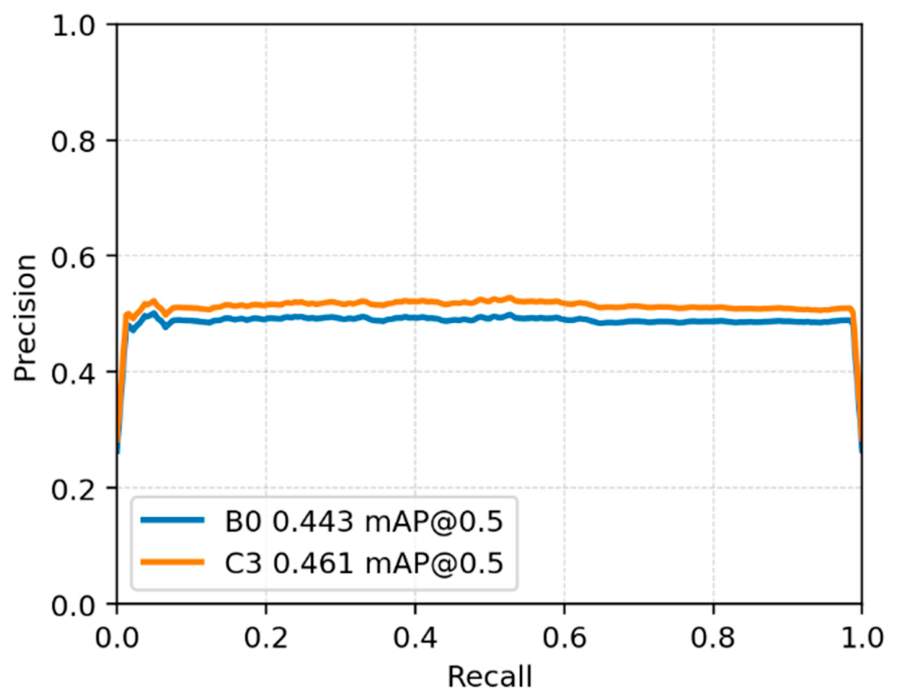
The comparison shows that the three attention modules did not contribute equally to tree species detection based on bark texture. SE produced only limited changes in performance, indicating that channel recalibration alone was not sufficient to substantially improve fine-grained bark-texture detection. CBAM showed relatively more stable gains in mAP@0.5:0.95 and Recall, suggesting that joint channel–spatial modeling helped the model focus more effectively on discriminative bark regions. The all-class averaged PR curve comparison between YOLOv8s_Baseline and the best-performing attention setting, YOLOv8s_EMA, is shown in
Figure 6.
The PR curves in
Figure 6 are all-class averaged curves over the 134 annotated classes. Because the Tree_bark dataset contains many classes with uneven sample sizes and different levels of bark-texture similarity, the averaged PR curves are relatively smooth and do not represent the behavior of a single class. The averaged PR curves and the representative class-wise results on the held-out test set further indicate that detection performance varied substantially among species. Among the three modules, EMA showed the most favorable overall result in terms of Recall, F1-score, mAP@0.5, and mAP@0.5:0.95 under the current experimental setting. The YOLOv8s_EMA model reached a mAP@0.5 of 0.461, a mAP@0.5:0.95 of 0.349, and a Recall of 0.412, all of which were higher than those of the baseline model. Therefore, EMA was selected as the preferred attention module for the subsequent fusion experiment.
3.4. Ablation Study of the Fusion Model
After identifying B1 as the preferred multi-scale enhancement strategy and EMA as the preferred attention module, the two were combined to construct the fused model D1. To clarify the independent contribution of each module and their interaction, an ablation study was conducted, and the results are summarized in
Table 5.
The results show that both modules were effective when introduced separately. Compared with the baseline model, B1 improved mAP@0.5 from 0.443 to 0.472 and Recall from 0.400 to 0.421, whereas C3 (YOLOv8s_EMA) improved mAP@0.5 to 0.461 and mAP@0.5:0.95 to 0.349. These results indicate that both WeightedConcat_B1 and EMA contributed to performance improvement under the same evaluation setting.
When the two modules were combined, D1 achieved the highest overall result among the compared settings under the current experimental setting, with a mAP@0.5 of 0.485, a mAP@0.5:0.95 of 0.365, and a Recall of 0.435. Compared with the baseline model, D1 improved Precision by 0.015, Recall by 0.035, F1-score by 0.031, mAP@0.5 by 0.042, and mAP@0.5:0.95 by 0.026. Compared with the single-module settings, D1 also showed further gains across the reported metrics.
3.5. Held-Out Test Set Evaluation
To further evaluate the final model after model selection, the baseline YOLOv8s model and the final fused D1 model were additionally tested on the held-out test set. The validation set was used for selecting the preferred variants in the multi-scale enhancement, attention-mechanism comparison, and fusion experiments, whereas the test set was kept independent from model selection and used only for final evaluation. The held-out test-set results are summarized in
Table 6.
On the held-out test set, D1 showed slightly higher Precision, Recall, F1-score, mAP@0.5, and mAP@0.5:0.95 than the baseline model. This result indicates that the improvement observed on the validation set was also reflected in the independent test subset, although the performance gains remained modest. To further support this comparison, class-wise AP statistics were calculated for the 86 classes with annotated instances in the held-out test set. As shown in
Supplementary Table S4, the class-wise AP@0.5 increased from 0.496 ± 0.353 for YOLOv8s_Baseline to 0.505 ± 0.356 for D1, and the paired Wilcoxon signed-rank test indicated a statistically supported difference (
p = 0.0193). For AP@0.5:0.95, the class-wise value increased from 0.363 ± 0.317 to 0.371 ± 0.293, with a Wilcoxon signed-rank test
p-value of 0.0084. These results indicate that the improvement of D1 was not only reflected in the overall mAP values, but was also supported by the class-wise AP distribution. Nevertheless, the magnitude of the improvement remained modest and should be interpreted cautiously under the current held-out test-set evaluation setting.
3.6. Comparison with Mainstream Detection Models
To further evaluate the competitiveness of the proposed model, D1 was compared with several representative detection frameworks. YOLOv5s and YOLOv7-tiny were selected as lightweight one-stage detectors, RetinaNet and SSD were included as representative classic one-stage frameworks, and Faster R-CNN was used as a representative two-stage detector. The validation-set comparison results are presented in
Table 7. For consistency, all compared models were trained and evaluated using the same Tree_bark dataset split and the same evaluation metrics. The input size, training epochs, and evaluation protocol were kept as consistent as possible across the compared detectors. However, different detector families have different architectural designs, optimization strategies, anchor or proposal settings, and implementation-specific training pipelines. Therefore, the comparison should be interpreted as a practical reference under a unified dataset and evaluation setting rather than as a fully exhaustive hyperparameter-optimized benchmark for each detector.
Among all compared models, D1 achieved the highest values in the two reported mAP metrics, with a mAP@0.5 of 0.485 and a mAP@0.5:0.95 of 0.365. In addition to accuracy, computational efficiency was quantified for the baseline YOLOv8s model and the final D1 model to evaluate the additional cost introduced by WeightedConcat_B1 and EMA. The baseline model contained 11.18 M parameters and required 28.7 GFLOPs, whereas D1 contained 11.18 M parameters and required 29.0 GFLOPs. The average end-to-end inference time was approximately 8.4 ms per image for the baseline and 8.1 ms per image for D1 on the same GPU environment, corresponding to approximately 119.0 FPS and 123.5 FPS, respectively. These results indicate that the proposed fusion strategy introduced only a small additional computational cost while maintaining real-time inference potential. The small difference in FPS may be affected by runtime fluctuation; therefore, the two models can be considered to have comparable real-time inference efficiency. Compared with YOLOv5s and YOLOv7-tiny, D1 showed clear improvements in both metrics, indicating better overall detection accuracy and localization quality under stricter IoU evaluation.
Compared with representative two-stage and classic one-stage detectors such as Faster R-CNN, RetinaNet, and SSD, D1 also showed a clear overall advantage in mAP-based evaluation. In particular, Faster R-CNN performed relatively poorly on this dataset, suggesting that it may be less suitable for a task dominated by subtle texture differences and dense local variation. Overall, these results suggest that the proposed fusion strategy showed competitive performance under the unified dataset and evaluation setting, but the comparison should be interpreted cautiously because no exhaustive detector-specific hyperparameter search was conducted for each mainstream model.
3.7. Application Validation
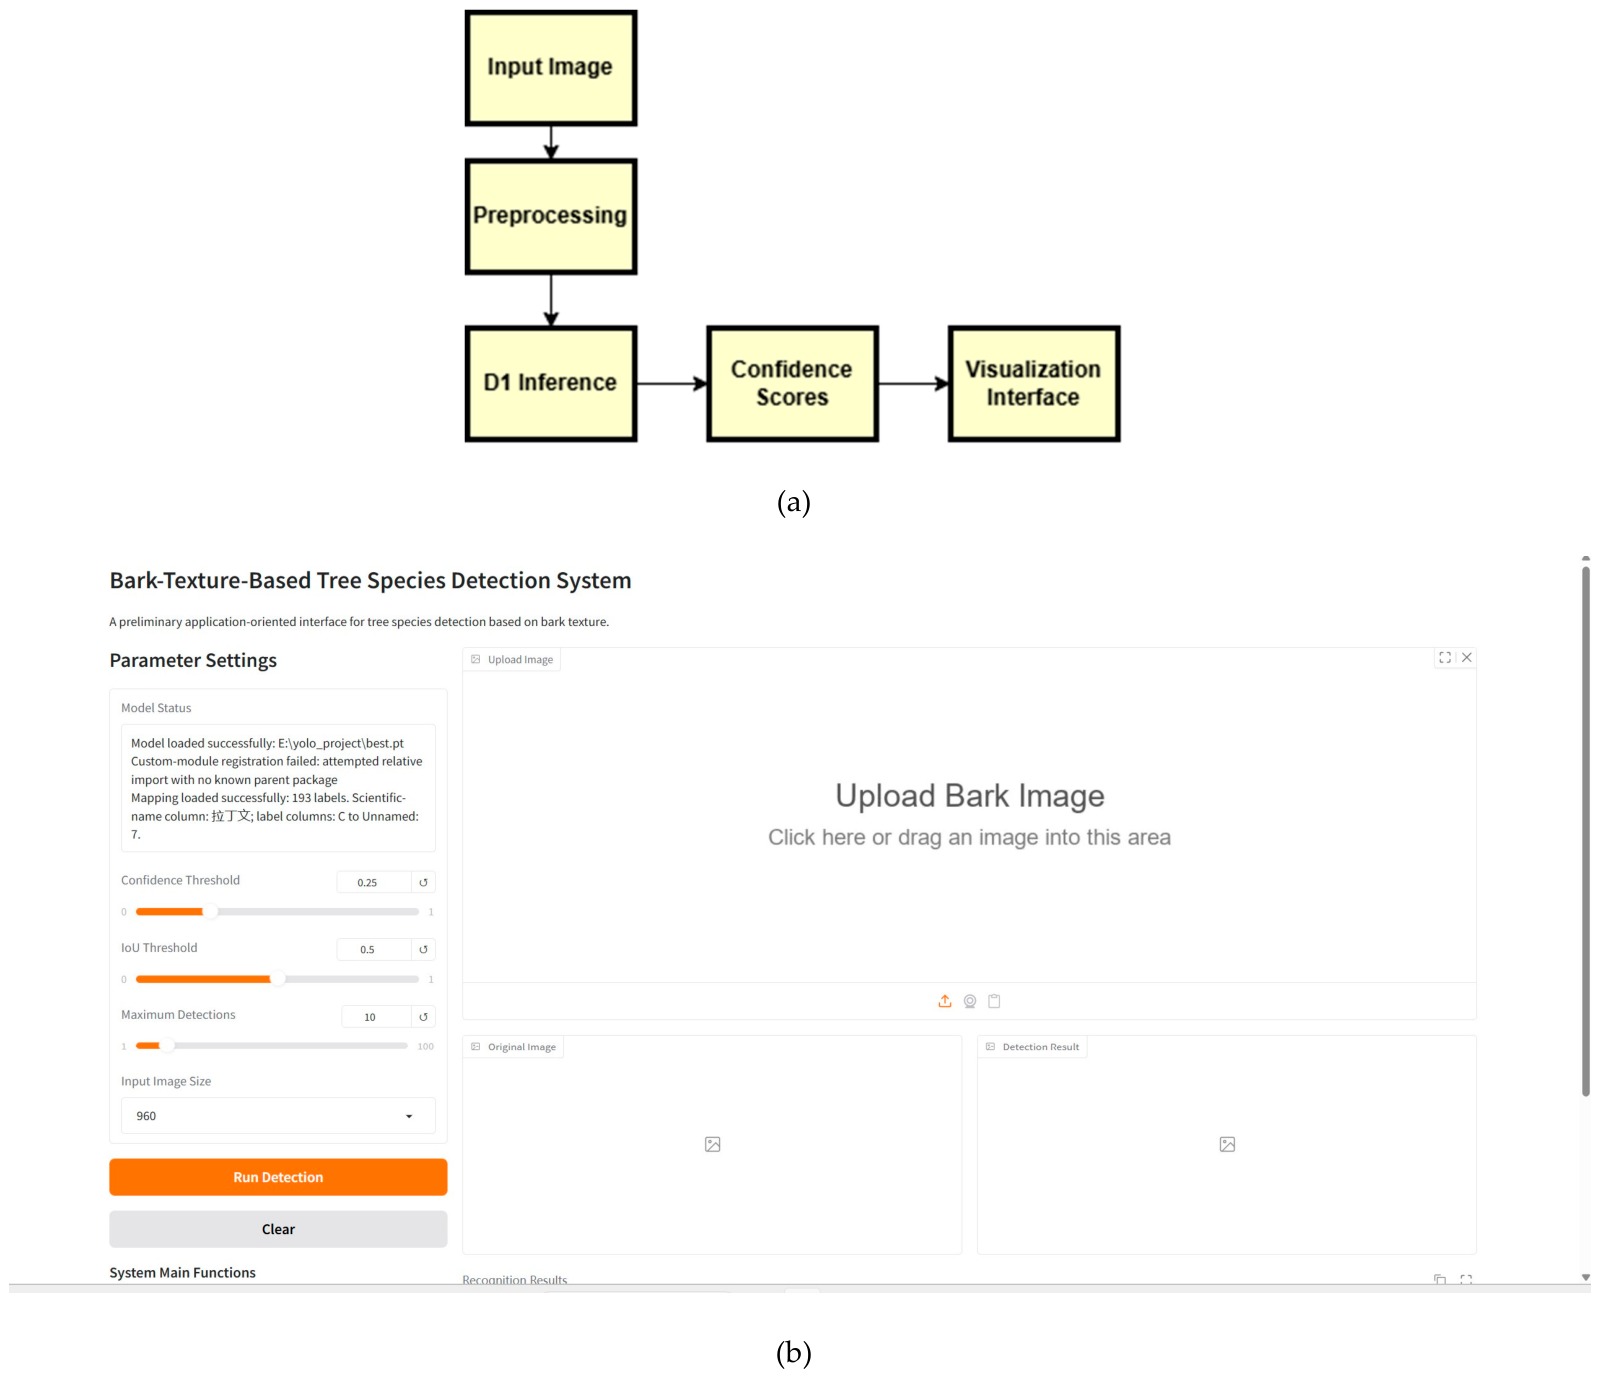
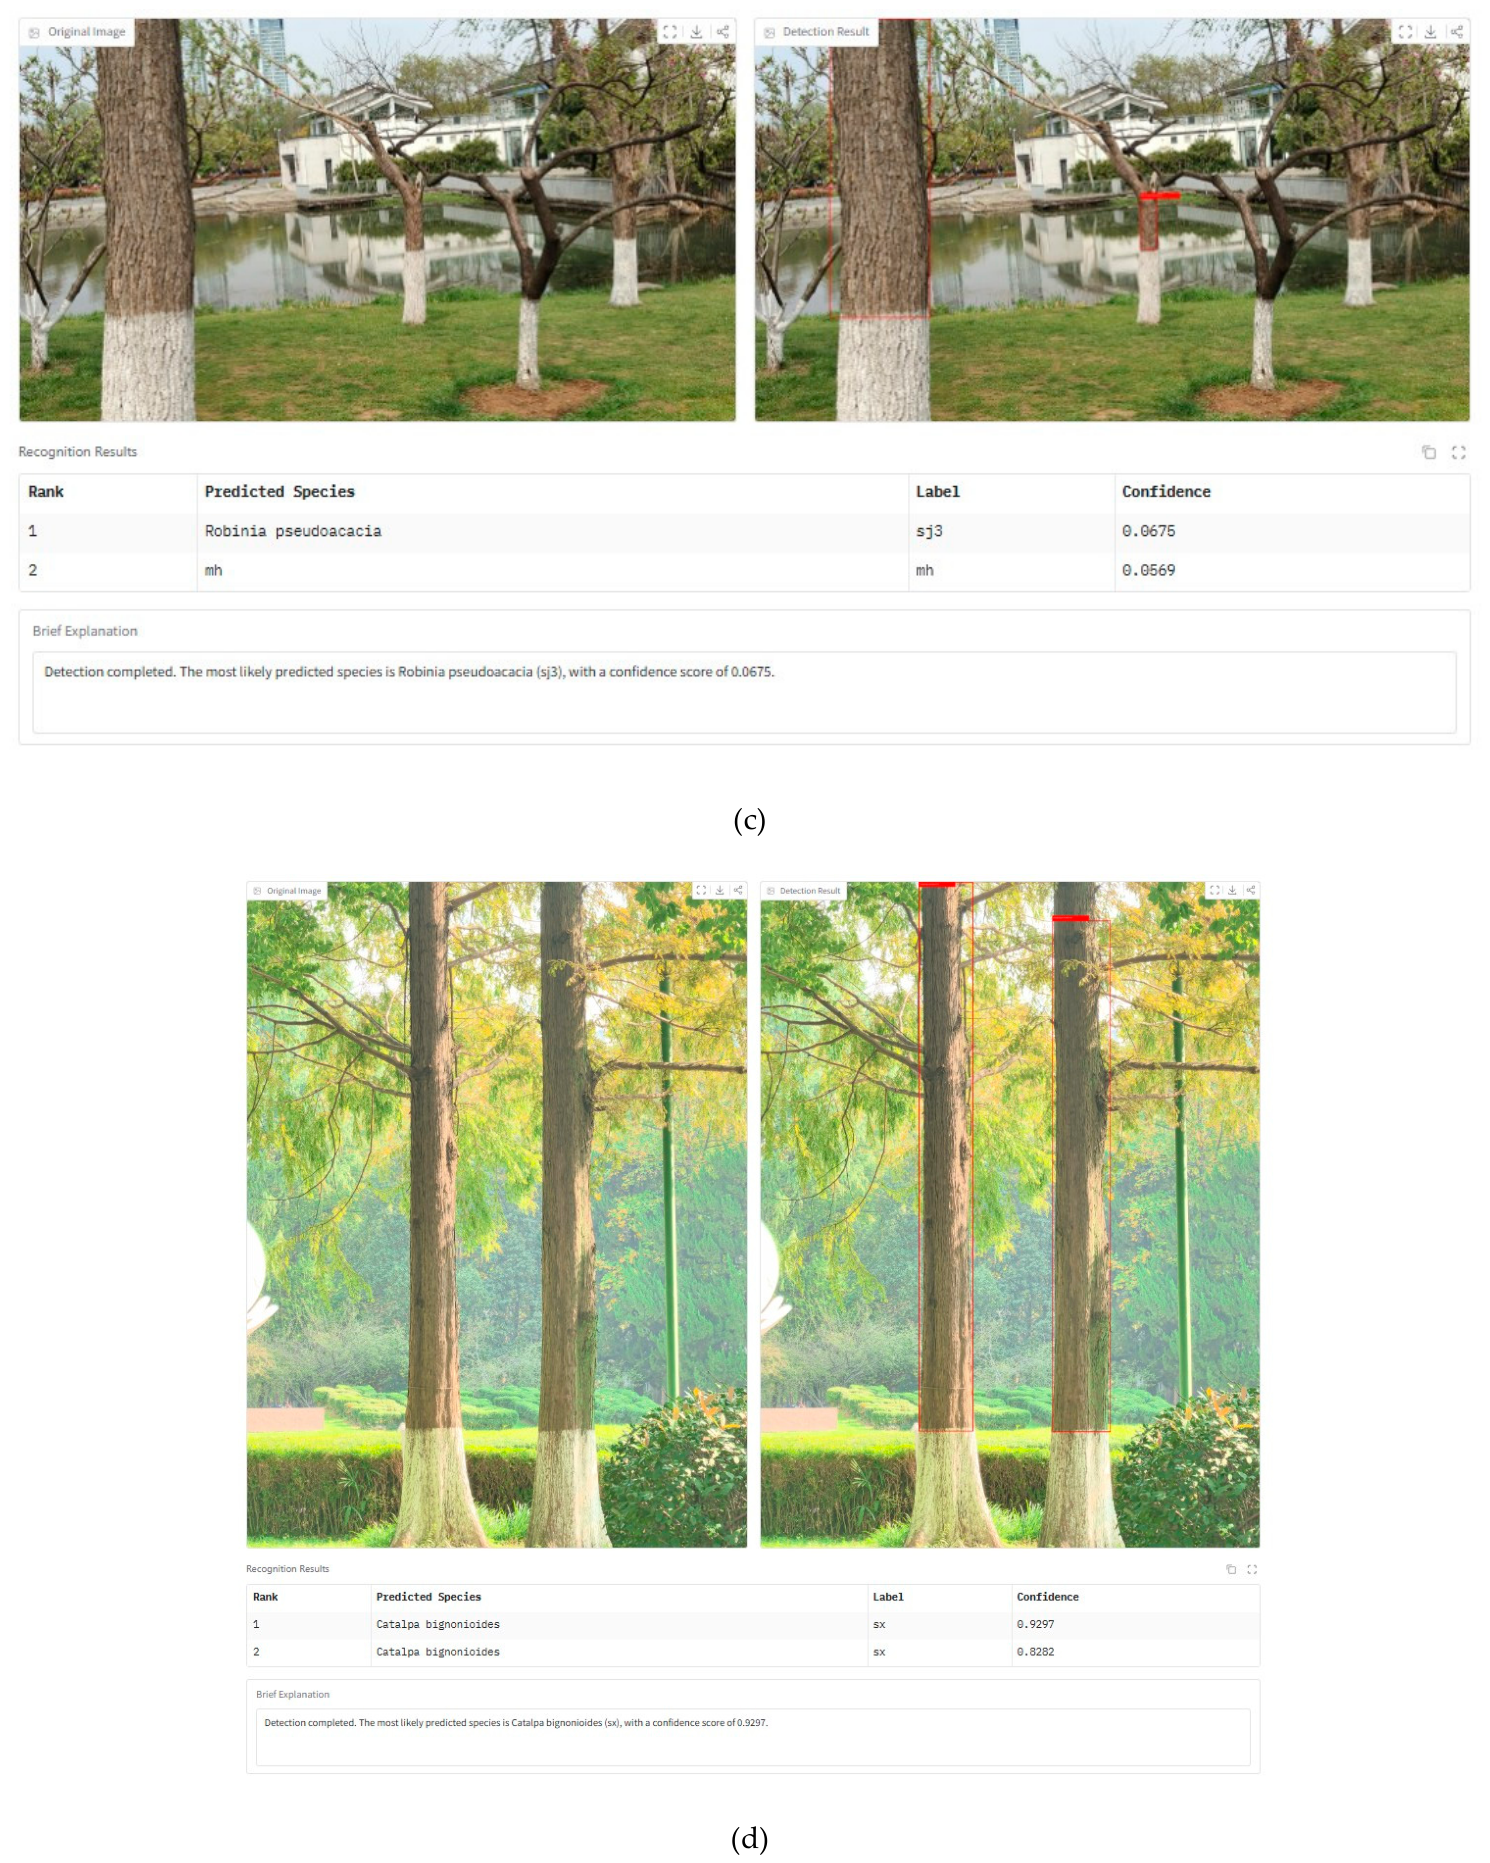
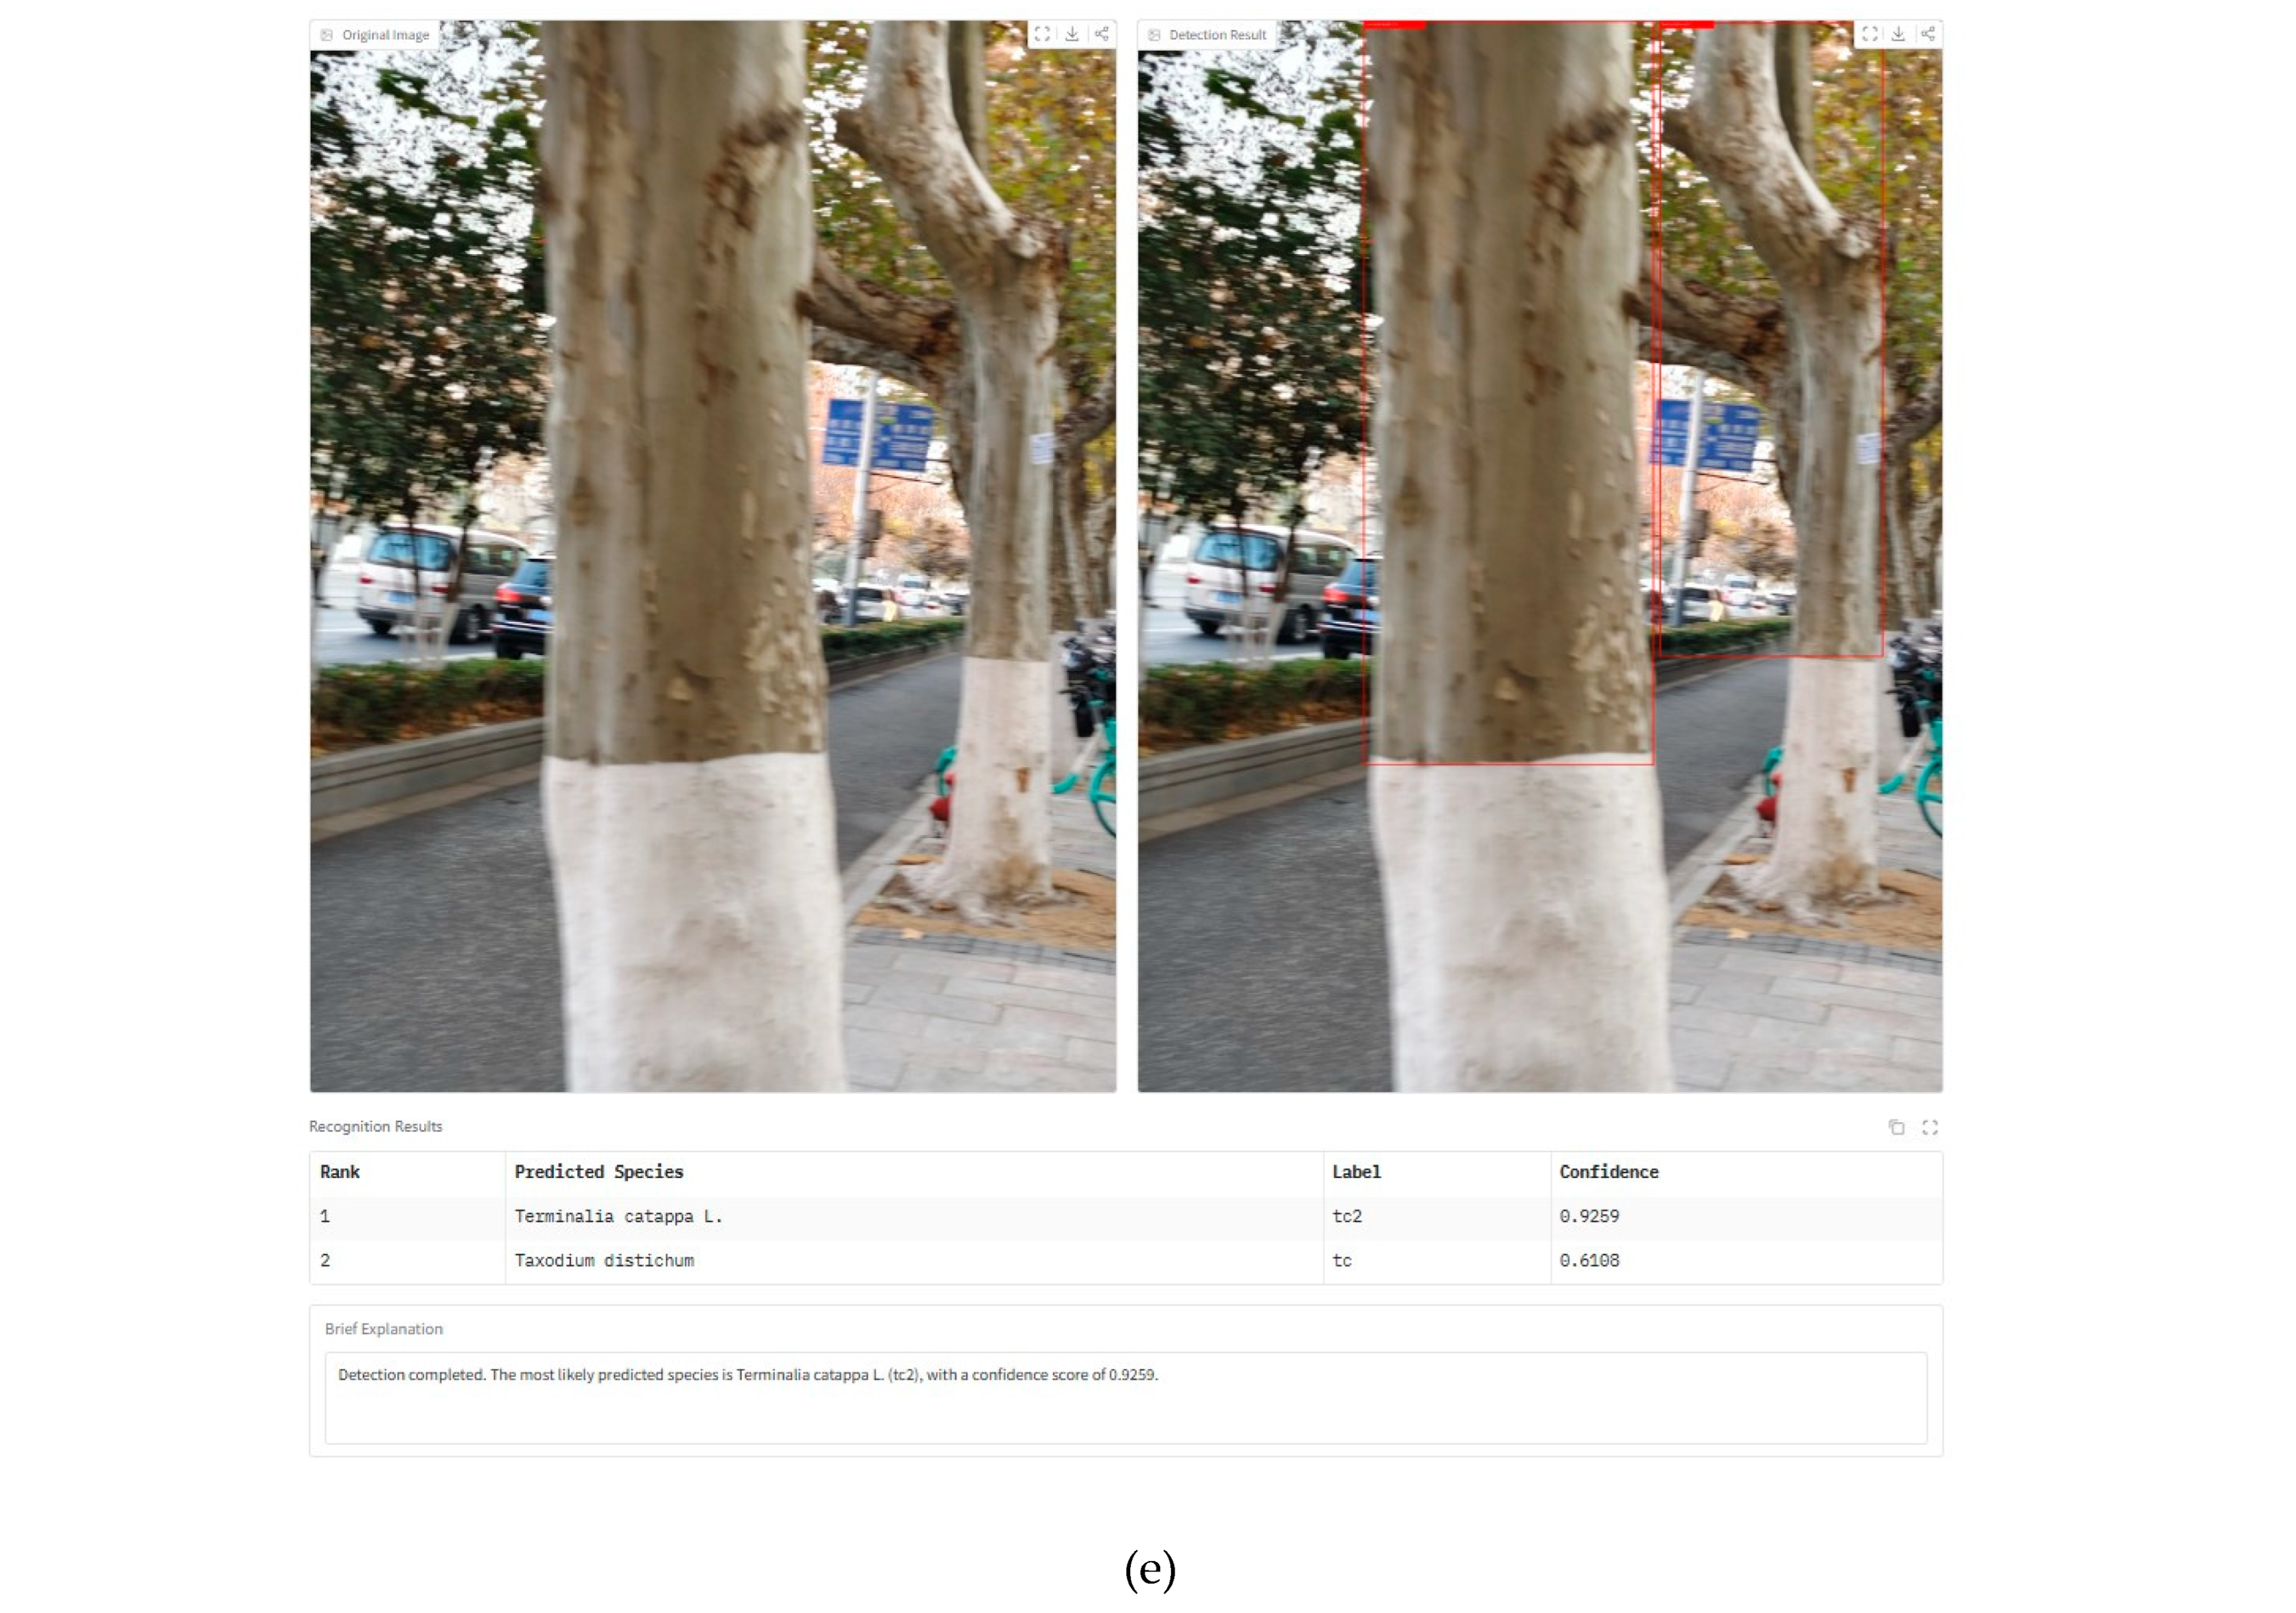
To verify the practical usability of the proposed detection framework, a tree species detection visualization system based on bark texture was developed as a preliminary application-oriented demonstration. The system supports image input, automatic inference, and visual output of detection results, including predicted bounding boxes, class labels, and confidence scores. The workflow of the system and representative application examples are shown in
Figure 7.
Application examples show that the system can complete the full process from image input to result visualization in an intuitive manner. Under relatively clear scene conditions, the system produced visually interpretable detection outputs. Under more challenging conditions, such as complex background, occlusion, low illumination, or close-up views, incomplete detection or slight localization errors could still occur. These observations indicate that the optimized model has practical potential for application-oriented bark-texture-based tree species detection, while further refinement is still needed for more complex field conditions. It should be noted that this application validation was intended as a preliminary demonstration of the workflow rather than a full field-deployment experiment. Therefore, the current evaluation mainly verifies whether the trained model can be integrated into an image-input, automatic-inference, and result-visualization pipeline. More objective field tests with controlled real-world scenarios will be needed in future work.
4. Discussion
The results presented above show that tree species detection based on bark texture in natural scenes is not a straightforward extension of general object detection. Unlike common object categories that rely heavily on contour shape or distinct color regions, bark targets are mainly distinguished by subtle texture differences, such as crack direction, groove depth, scale arrangement, and irregular surface patterns. These characteristics make the task more dependent on fine-grained texture representation and more sensitive to background interference. Therefore, the observed performance differences between the baseline model and the improved models suggest that task-oriented structural adaptation is important for bark-texture-based tree species detection. Compared with previous bark-recognition and tree-species recognition studies [
37,
38,
39,
40,
41,
42,
43,
44,
45,
46,
47,
48], the present work focuses on a more challenging object-detection setting. Previous bark-based studies, such as patch-based bark classification, tree bark re-identification, and Deep BarkID, have demonstrated the discriminative value of bark texture for species recognition [
40,
46,
47]. However, many of these studies mainly perform image-level classification or re-identification under cropped or relatively controlled image conditions. In contrast, the Tree_bark dataset contains 134 annotated classes and requires simultaneous bark-region localization and species recognition in natural scenes. Therefore, the absolute mAP values reported in this study should not be directly compared with classification accuracy reported in previous studies.
The relatively modest mAP improvements can be explained by several factors, including the large number of annotated classes, fine-grained inter-class bark similarity, complex natural backgrounds, variable object scales, occlusion, and class imbalance. Nevertheless, this study provides a relatively large bark-texture detection dataset and evaluates YOLOv8s-based improvements for practical tree species detection. These aspects distinguish the present work from conventional image-level bark classification studies and support its practical value for tree species detection in complex natural environments.
4.1. Effect of Multi-Scale Enhancement
The results suggest that, for tree species detection based on bark texture, conventional multi-scale strategies do not contribute equally. Multi-scale feature representation has been widely used in object detection to improve the recognition of objects with different sizes, as shown in feature pyramid and scalable detection frameworks [
23,
51]. However, the present results indicate that simply increasing input resolution or adding a shallower detection branch does not necessarily improve bark-texture-based detection. This may be because bark textures are not typical small objects with well-defined boundaries. Their discriminative information is often embedded in subtle local texture variation rather than compact object structure, which is consistent with previous bark-recognition studies emphasizing fine-grained crack, groove, and surface-pattern differences [
37,
38,
39,
40,
46,
47,
48]. Therefore, introducing more shallow features may also amplify background noise and make optimization more difficult.
Compared with the other tested strategies, B1 produced the most favorable overall result under the current experimental setting. This result indicates that bark-texture-based tree species detection benefits more from moderate adaptive cross-scale feature fusion than from simply increasing resolution or adding a shallower detection branch. This observation is consistent with previous object-detection studies showing that effective feature fusion is important for scale-varying targets [
23,
51,
52,
53,
54,
55,
56]. The weaker performance of B2 further suggests that replacing too many fusion nodes is not necessarily beneficial. For this task, moderate adaptive fusion appears to be more suitable than a broader replacement of fusion nodes.
4.2. Effect of Attention Mechanism Optimization
The comparison among SE, CBAM, and EMA suggests that lightweight attention design still matters in bark-texture-based tree species detection. Previous attention studies have shown that SE mainly performs channel-wise feature recalibration [
24], whereas CBAM combines channel and spatial attention to improve feature selection in both dimensions [
57]. In the present task, SE brought only limited improvement, which indicates that channel recalibration alone was not sufficient for fine-grained bark-texture detection. Bark discrimination depends not only on emphasizing certain feature channels, but also on identifying where meaningful texture differences occur. Compared with SE, CBAM showed more consistent gains, suggesting that joint channel–spatial modeling helped the detector focus more effectively on discriminative bark regions.
Among the three tested modules, EMA achieved the highest mAP@0.5, mAP@0.5:0.95, and Recall. EMA was originally designed to provide efficient multi-scale attention interaction [
58], and this design is consistent with the need to capture bark texture cues distributed across local cracks, grooves, and irregular surface regions. For bark images collected in natural scenes, where shadows, moss, and surface disturbance are common, this balance between texture enhancement and background suppression appears to be particularly important.
4.3. Complementarity of the Fusion Model
The ablation results suggest that the gains brought by WeightedConcat_B1 and EMA were complementary rather than overlapping. This interpretation is consistent with the different roles of feature-fusion and attention mechanisms reported in previous studies. Multi-scale fusion modules are mainly designed to improve the integration of features from different spatial resolutions [
23,
51], whereas attention mechanisms are usually used to recalibrate features and suppress less informative responses [
24,
57,
58]. In this study, WeightedConcat_B1 mainly improved cross-scale feature fusion, whereas EMA strengthened the response to discriminative bark textures and reduced background interference. When the two modules were combined in D1, the model achieved the most favorable overall result among the tested settings, indicating that the final improvement was not derived from a single design choice.
This complementarity is important for tree species detection based on bark texture because the task requires both scale-sensitive representation and robust discrimination. Closely related species often differ only in limited local regions, while variations in shooting distance and angle may alter the apparent scale of these texture cues. Under such conditions, a detector that can improve both cross-layer fusion and texture-focused feature selection is more likely to perform reliably.
4.4. Comparison with Mainstream Detectors and Practical Implications
The held-out test-set evaluation and the comparison with YOLOv5s, YOLOv7-tiny, Faster R-CNN, RetinaNet, and SSD provide additional reference for evaluating the proposed design under the current experimental setting. The YOLO series has been widely used in real-time object detection because of its balance between detection accuracy and inference efficiency [
52,
53,
54,
55], while RetinaNet introduced focal loss to address foreground–background imbalance in dense detection [
49]. EfficientDet further demonstrated the importance of scalable feature fusion for efficient object detection [
51]. In the present study, D1 showed the highest mAP values among the compared settings, suggesting that the proposed improvements were beneficial not only within the YOLOv8 framework, but also in comparison with representative mainstream detectors under a unified dataset and evaluation protocol. This result indicates that generic detection backbones alone may be insufficient for bark-texture-based tree species detection, and that task-oriented optimization remains necessary for this type of fine-grained visual task.
The relatively weak performance of Faster R-CNN may be related to the characteristics of the Tree_bark dataset and the bark-texture detection task. Unlike common object categories with clear contours and stable object-level structures, bark categories are mainly distinguished by fine-grained texture cues distributed across cracks, grooves, scales, and irregular surface patterns. Previous bark-recognition studies have also shown that bark-based species recognition is strongly affected by subtle texture differences and background variation [
40,
46,
47,
48]. In this setting, region-proposal-based detection may not fully exploit subtle local texture differences, especially when some categories have limited samples or visually similar bark patterns. In addition, two-stage detectors usually require careful tuning of proposal generation, anchor settings, and training schedules for a specific dataset. Therefore, the relatively low Faster R-CNN result may partly reflect limited detector-specific tuning under the unified training setting, and should not be interpreted as a definitive weakness of the Faster R-CNN framework.
4.5. Limitations and Future Work
Although the proposed model showed improved performance over the baseline and the compared detectors under the current experimental setting, several limitations remain. First, although the Tree_bark dataset is relatively diverse, it is still mainly collected from one regional background, and class imbalance remains evident in some categories. Second, difficult samples with severe occlusion, weak texture contrast, or strong environmental interference are still challenging for the current model. Third, the visualization system currently demonstrates usability at the display level, but further work is still needed before practical deployment in mobile or large-scale forestry scenarios.
Future work can therefore proceed in three directions. The first is to expand the dataset across broader regions and acquisition conditions to improve robustness and generalization. The second is to further optimize the detector through lightweight design, model compression, or more refined feature selection strategies. The third is to strengthen application-oriented validation under more complex field conditions. In addition, the present experiments were mainly conducted under a fixed dataset split and single-run setting. Repeated training with different random seeds and statistical significance testing should be considered in future work to further evaluate the robustness of the observed performance differences.
5. Conclusions
This study addressed tree species detection based on bark texture in complex natural scenes by constructing the Tree_bark dataset and developing an improved YOLOv8-based detection framework. The dataset contains 134 annotated tree species and 8216 valid images, providing the data basis for the subsequent model evaluation. On this basis, multi-scale enhancement strategies, lightweight attention mechanisms, module fusion, and preliminary application-oriented validation were systematically investigated.
Among the tested multi-scale strategies, WeightedConcat_B1 showed the most favorable overall performance under the current experimental setting. Among the tested attention modules, EMA produced the most favorable result. When the two were combined, the fused D1 model achieved the highest overall performance among the compared settings in this single-run experiment, with a mAP@0.5 of 0.485, a mAP@0.5:0.95 of 0.365, and a Recall of 0.435 on the validation set. Compared with the baseline YOLOv8s model, these values increased by 0.042, 0.026, and 0.035, respectively, suggesting that improving cross-scale fusion and discriminative texture response can be beneficial for bark-texture-based tree species detection.
Overall, the proposed method improves tree species detection based on bark texture under complex natural conditions. However, the current study is still limited by the regional scope of the dataset and the difficulty of challenging samples under severe interference. Future work should therefore focus on broader dataset construction, more balanced sample collection, lightweight deployment, and more extensive application-oriented validation.