1. Introduction
Masonry retaining walls are extensively employed in slope engineering and transportation infrastructure within mountainous regions. Their widespread adoption can be attributed to practical advantages including the local availability of stone, low material cost, straightforward construction without complex machinery, and excellent long-term durability against weathering, frost action, and corrosion [
1]. However, during their service life, these structures are continuously subjected to combined environmental and operational stressors—erosion, ground settlement, cyclic thermal loads, and dynamic traffic-induced vibrations—which drive progressive and cumulative damage [
2]. Such damage typically initiates as microstructural deterioration and evolves gradually; by the time visible surface defects such as cracking or water seepage become apparent, the structural integrity and service performance may already be substantially compromised [
3]. Conventional condition assessment practices, relying on manual visual inspection and surface deformation monitoring, are inherently subjective and frequently fail to detect hidden, incipient internal damage [
4,
5]. This situation creates an urgent demand for innovative identification technologies capable of real-time damage state determination, precise damage localization, and quantitative severity assessment.
Vibration-based structural health monitoring (SHM) has emerged as a promising global approach for damage identification. The underlying principle is that structural damage—manifesting as localized stiffness reduction—alters the dynamic characteristics of the structure, which can be extracted from measured vibration signals [
6]. To enhance sensitivity to subtle, localized changes, advanced time-frequency signal processing techniques have been introduced. Among these, wavelet packet decomposition (WPD) has demonstrated particular effectiveness because it decomposes both low-frequency and high-frequency signal components into finer sub-bands, providing uniform and high time-frequency resolution [
7].
Recent international studies have further advanced vibration-based damage identification for masonry and retaining wall systems. Meoni et al. [
8] showed that mode shapes of masonry walls are highly sensitive to progressive out-of-plane damage. Ceravolo et al. [
9] applied continuous wavelet transform to detect modal changes in damaged unreinforced masonry shear walls. Mohebian et al. [
10] developed a finite element model-updating method for retaining wall damage detection using displacement residuals. Energy-based features derived from WPD have shown high sensitivity to damage-induced changes in various structures, including those under ambient excitation [
11] and in strong-noise environments [
12]. De Angelis et al. [
13] applied dynamic identification methods and artificial intelligence algorithms for damage detection in masonry infills, while Fei et al. [
14] utilized wavelet packet analysis with the impact-echo method for shotcrete-rock structures. Ding et al. [
15] established a structural damage alarming method based on wavelet packet energy spectrum, and subsequent reviews have systematically summarized the development of wavelet packet-based structural damage identification [
16,
17].
A critical methodological challenge arises from the fact that vibration response signals are jointly dependent on the structural system and the external excitation. Consequently, damage features extracted directly from the response are susceptible to excitation variability, which may lead to false-positive damage indications when excitation conditions change between monitoring campaigns. To resolve this, researchers have proposed working with the impulse response function (IRF), which represents an inherent dynamic property of the structural system and is theoretically independent of the specific excitation characteristics. Zhang and Li [
18] developed an unsupervised learning damage diagnosis method based on virtual impulse response function and time series models, demonstrating effective decoupling of structural properties from excitation effects. Jiang and Zhang [
19] investigated structural damage diagnosis based on wavelet packet frequency band energy detection technology, establishing the theoretical foundation for energy-based damage indices. Zong et al. [
20] combined wavelet packet energy features with support vector machines to achieve improved damage classification accuracy in bridge structures. Sun et al. [
21] proposed a bridge damage identification method based on local sample entropy within wavelet packet frequency bands. For structural damage localization, Zhang et al. [
22] integrated virtual impulse response functions with neural networks, showing promising results for spatial damage identification. Most recently, Li et al. [
23] investigated health state identification of modular reinforced earth retaining walls after seismic events, extending SHM applications to retaining wall structures.
Despite these methodological advances, two practical gaps remain for existing stone masonry retaining walls. First, many published WPD-based indicators are expressed as multi-band vectors or global energy changes, which are difficult to interpret directly in field inspections when operational noise, sensor coupling variability, and non-uniform boundary conditions are present. Second, many retaining-wall studies require either a reliable undamaged baseline model or dense modal information, both of which are rarely available for aging masonry walls already in service. In this study, impact tests were conducted during low-disturbance field periods to reduce operational noise while preserving realistic boundary conditions. The technical contribution is therefore twofold: (i) an ERSD scalarization strategy is proposed to transform the ERD vector of selected WPD bands into a sensor-level scalar damage index; and (ii) the method is field-validated on an existing masonry retaining wall, where the ERSD spatial peak is compared with post-test crack observations. The objectives are to discriminate changes between successive monitoring states, localize the most probable damage zone through sensor-network interpolation, and qualitatively evaluate the short-term progression of the identified local anomaly.
3. Experimental Study
3.1. Test Structure and Instrumentation
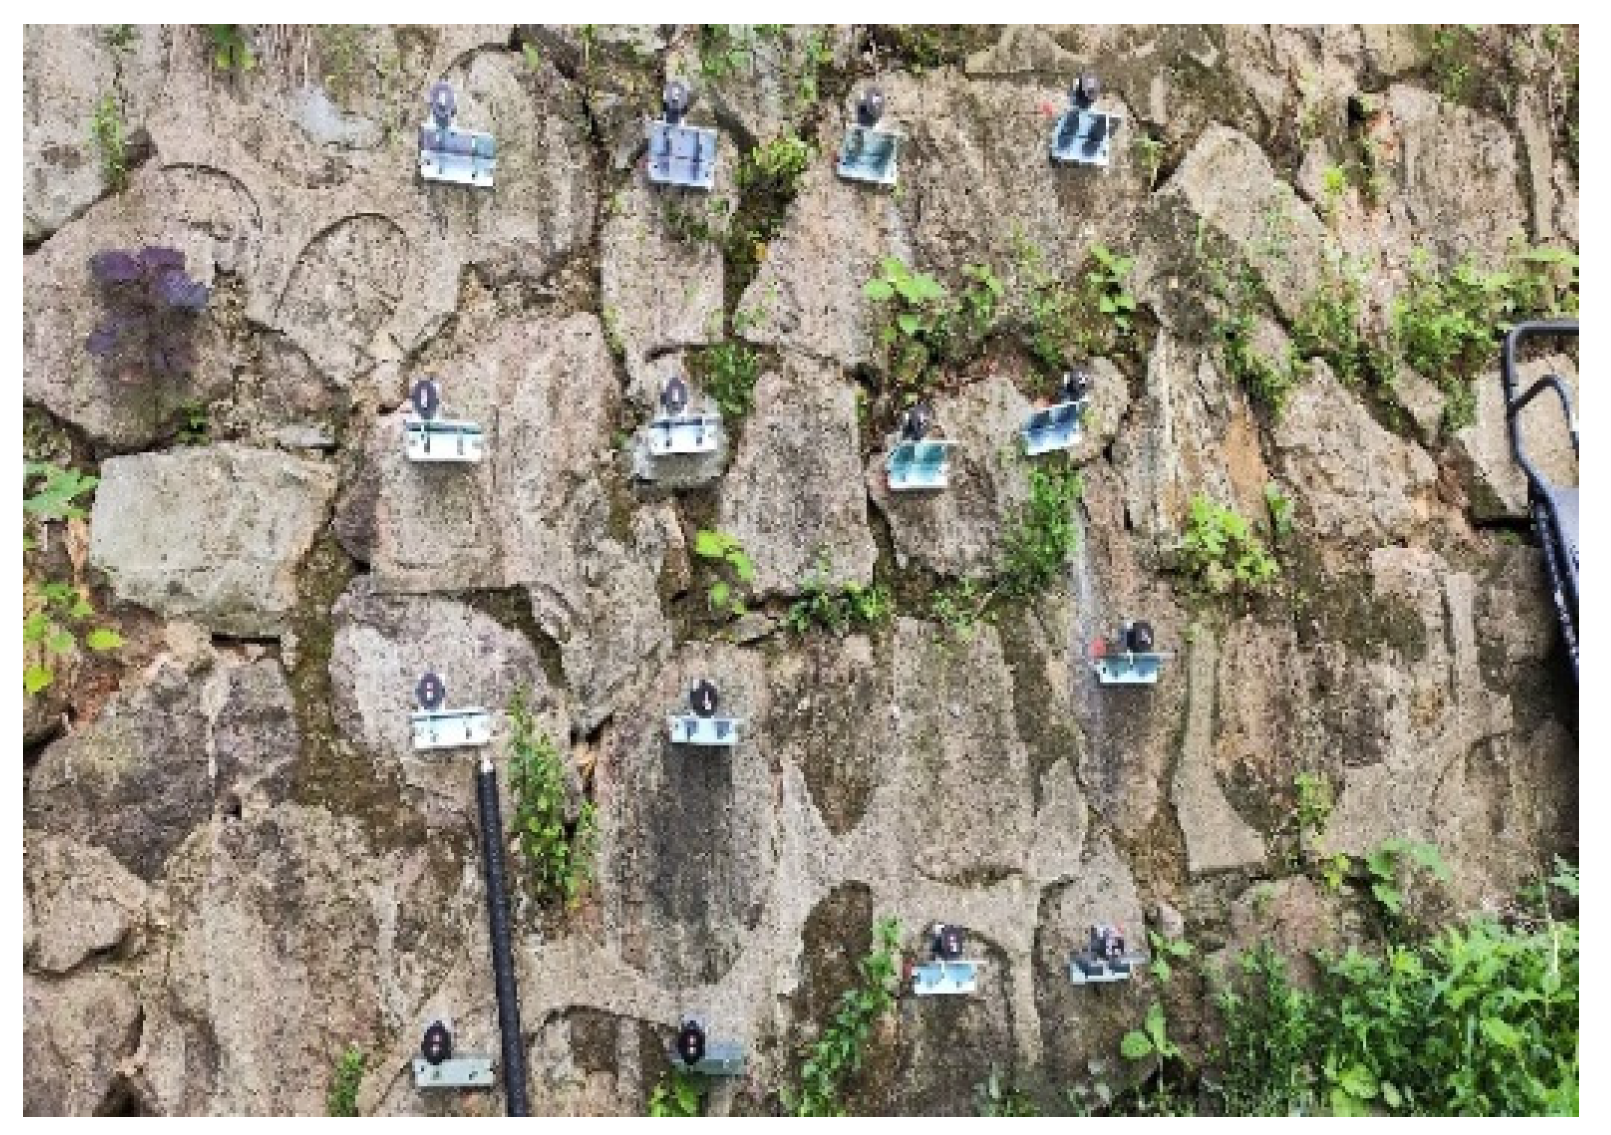
A masonry retaining wall in Zhenjiang was selected for the experiment. The wall is 1.8 m high, 3.0 m long, and 0.2 m thick, as shown in
Figure 1.
The retaining wall was excited using an impact hammer, while electromagnetic velocity sensors were used to record structural vibration responses for impulse response function estimation and wavelet packet analysis (see
Figure 2).
The
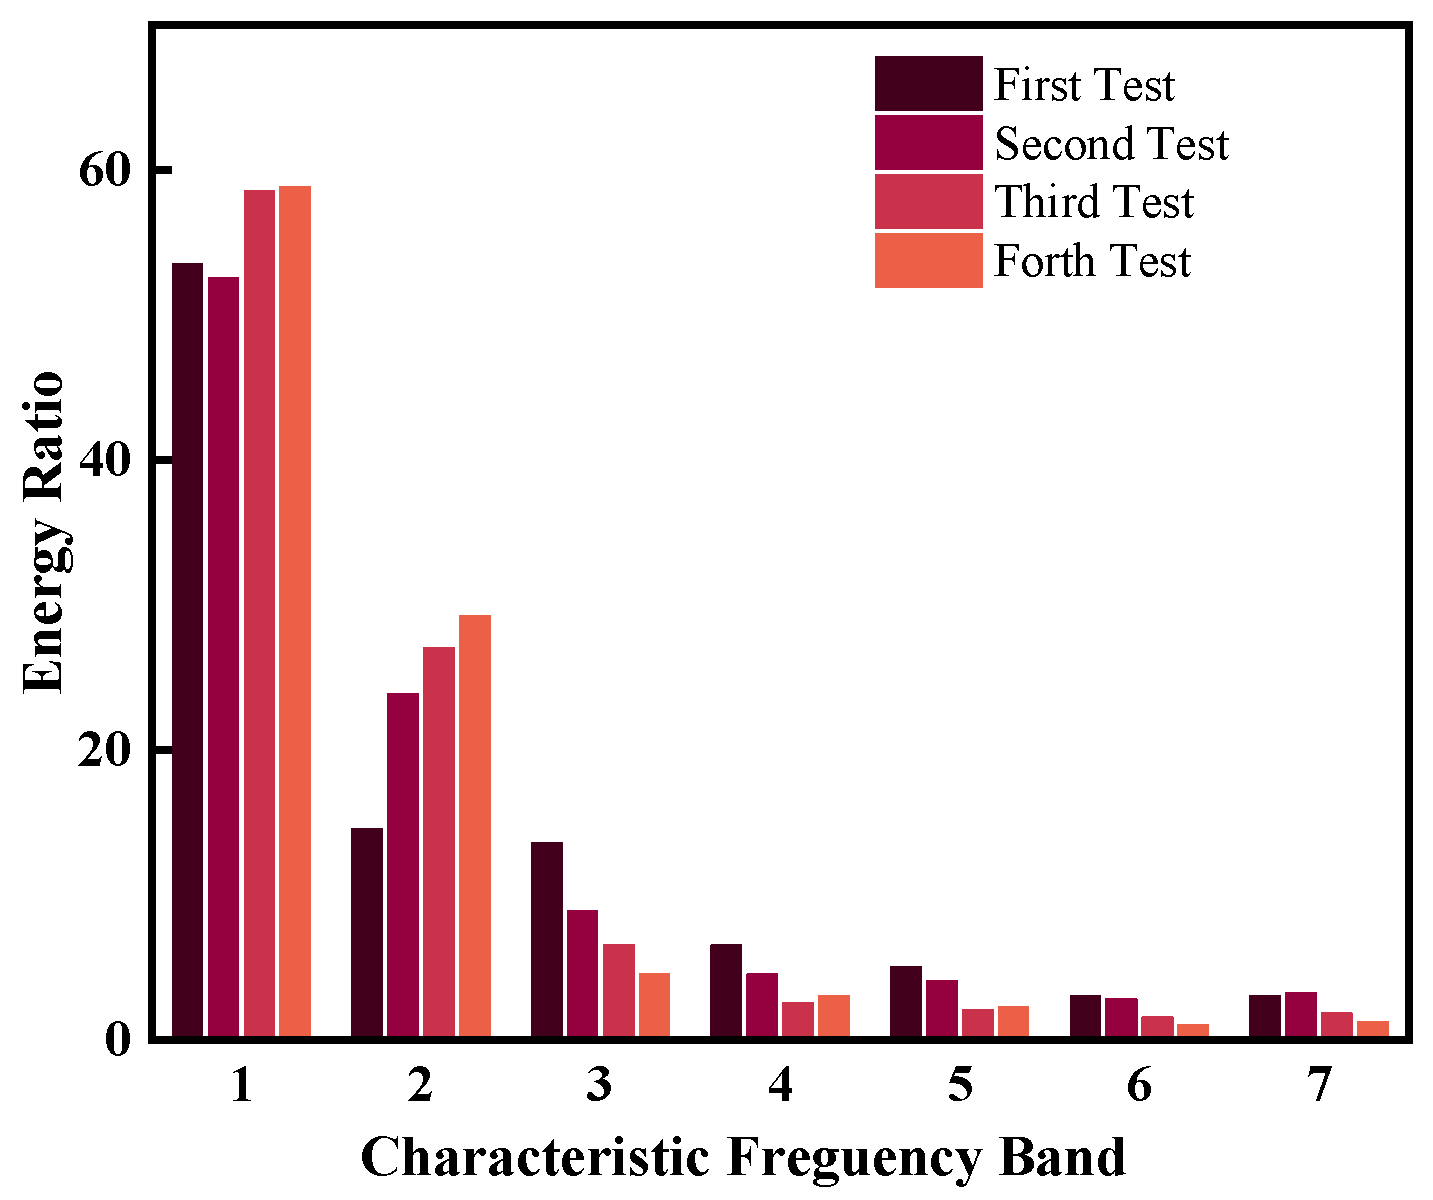
Figure 3 presents the cumulative energy distribution of characteristic frequency bands at measurement point 2 under different test stages. The first six frequency bands account for more than 95% of the total signal energy, indicating that they effectively capture the dominant dynamic characteristics of the structure.
Vibration tests were conducted monthly over four months using an impact hammer (JMF400uu series, Yangzhou Jingming Technology Co., Ltd. (Yangzhou, China), equipped with a built-in piezoelectric force sensor and interchangeable stainless steel/aluminum/nylon/rubber buffer heads, with a force frequency range of 2–3 kHz) as excitation, and fifteen horizontally oriented electromagnetic velocity sensors (V003, Yangzhou Jingming Technology Co., Ltd.; sampling frequency range: 0.17–100 Hz; default first gear) for response measurement. Each sensor was rigidly mounted via L-shaped steel brackets fixed with expansion screws and high-strength AB adhesive. Signals were synchronously acquired at a 500 Hz sampling frequency via a JM3841 dynamic signal acquisition system (16-channel, fully synchronous acquisition with synchronization error <0.1 μs; velocity channels configured in voltage mode with a sensitivity of 300 mV/g and an amplification factor of 11; hammer channel configured in IEPE mode with a sensitivity of 12.254 mV/N and an amplification factor 27.202; built-in lithium battery with 72 h endurance and DC input of 9–36 V), with wireless data transmission to a control laptop via a JM1803 USB wireless gateway operating in conjunction with JMTEST 2.0 dynamic signal testing software. All instruments were manufactured by Yangzhou Jingming Technology Co., Ltd., Yangzhou, China. Each test campaign comprised a timed acquisition duration of 10 min.
Sixteen measurement points were arranged in a grid. Point 11 served as the fixed excitation location, while the remaining 15 points were instrumented with horizontal sensors mounted via L-shaped steel brackets fixed with expansion screws and AB adhesive for rigid coupling. The initial test was designated Test 1, with three subsequent tests (Tests 2–4) conducted at one-month intervals.
3.2. Data Processing and Damage State Discrimination
For each measurement point and test, the impulse response function h(t)h(t) was estimated from the synchronously recorded force input and velocity output time histories using the H1H1 estimator, which minimizes uncorrelated output noise. A three-level wavelet packet decomposition was applied to each h(t)h(t) using the Daubechies 18 (db18) wavelet function, selected for its balance of regularity and compact support. The relative cumulative energy ratio threshold was set to ε0 = 95% to determine the number PP of characteristic frequency bands.
Analysis of the cumulative energy distribution at measurement point 2 across all four tests (
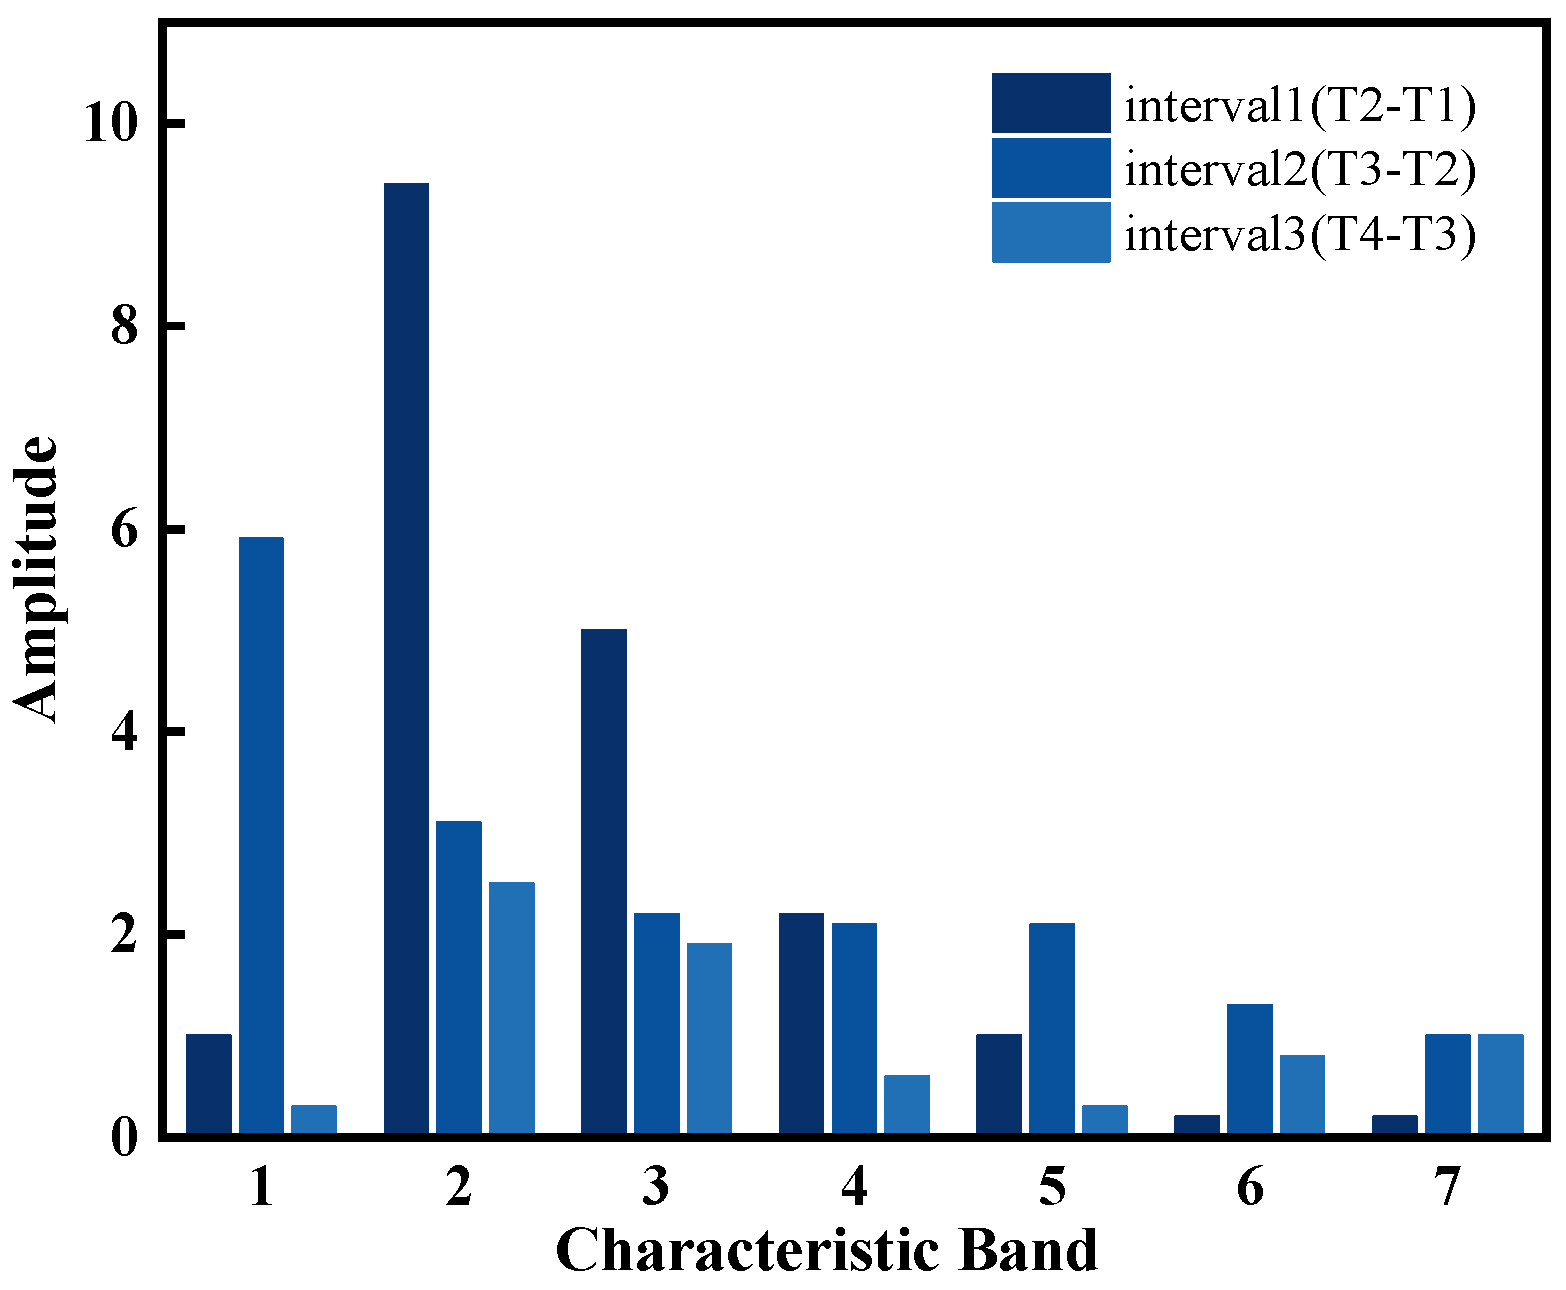
Figure 4) confirmed that the energy was concentrated in the first six characteristic bands, which collectively accounted for over 95% of the total signal energy. The stability of these dominant bands across all test periods indicates that the chosen characteristic bands robustly capture the primary dynamic information. The corresponding wavelet packet characteristic-band vector spectrum and the resulting damage eigenvector spectrum for point 2 are presented in
Figure 4 and
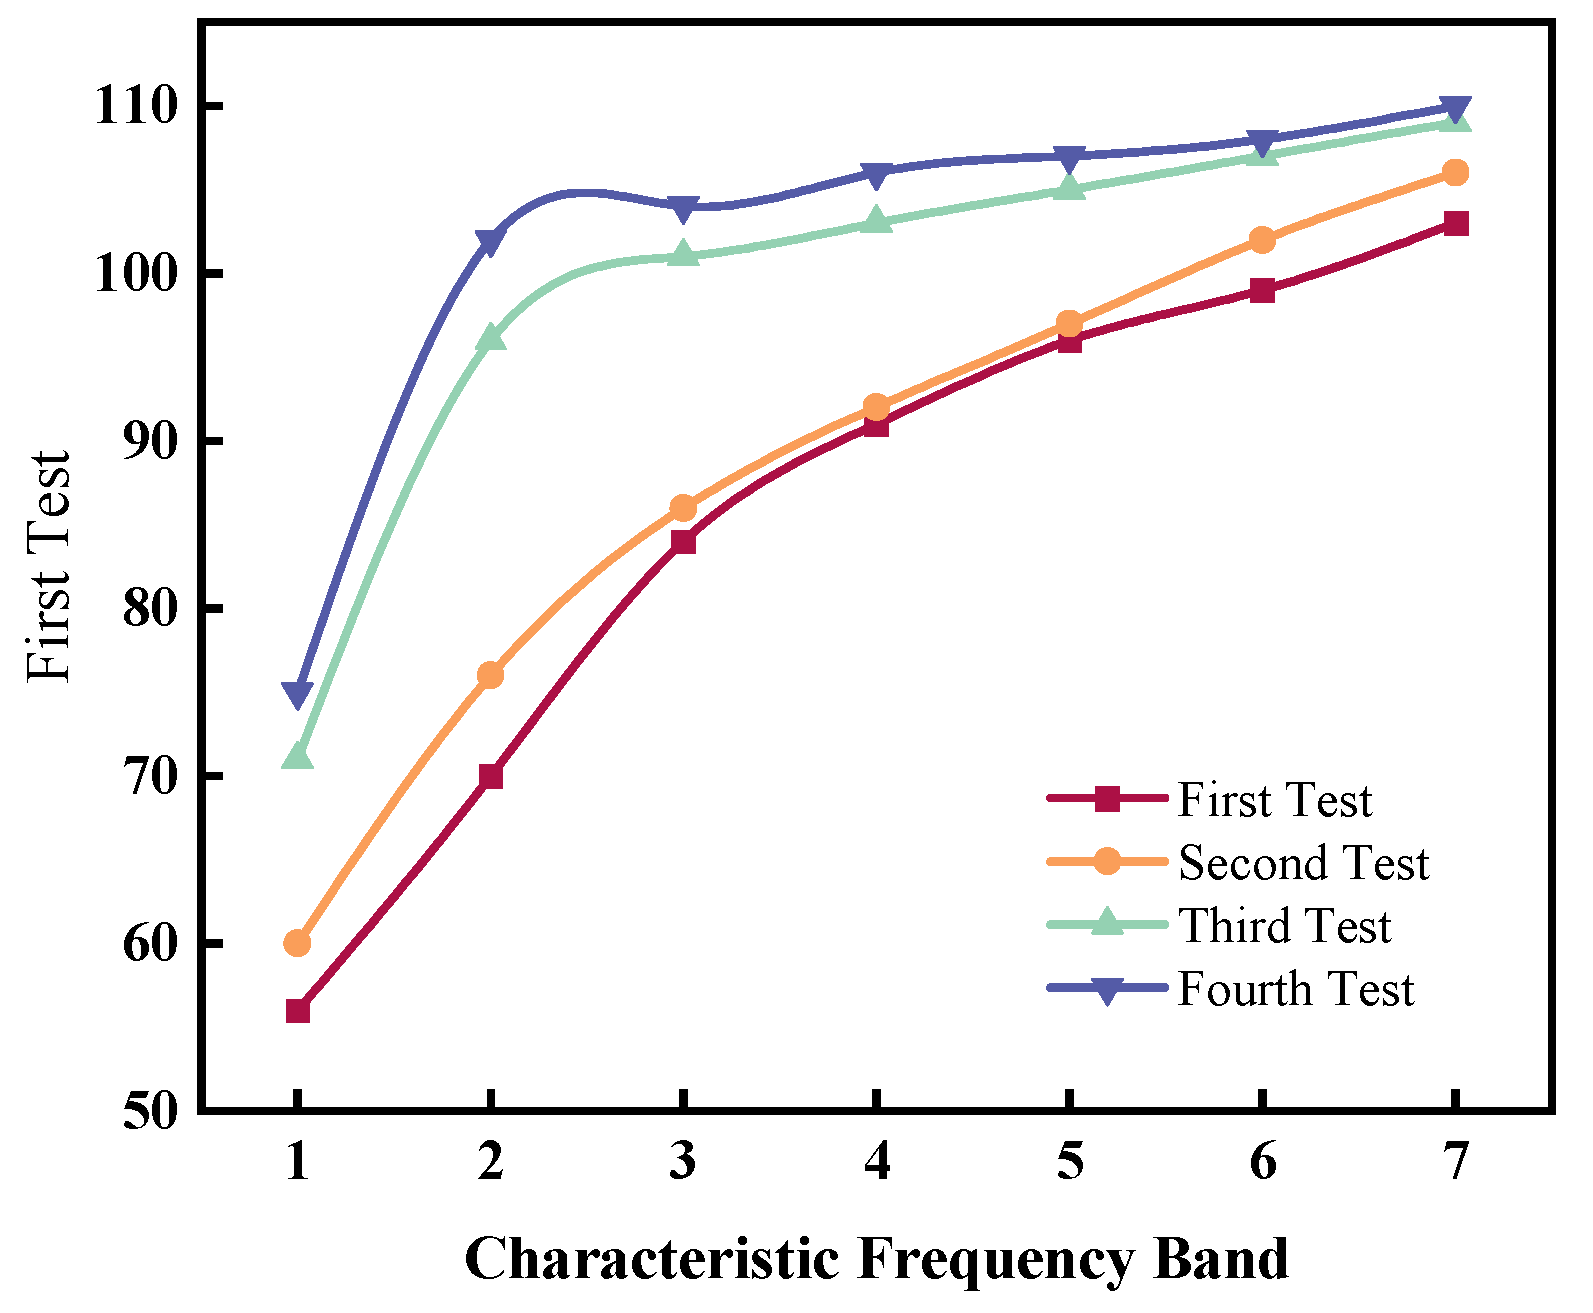
Figure 5, respectively. Taking Test 1 as the reference state, the damage vector spectra for Tests 2–4 are all non-zero, definitively indicating progressive structural changes consistent with accumulating damage. Variations in detection sensitivity among sensor positions were observed and attributed to differences in wave propagation distance and boundary condition effects.
Energy ratio distribution of characteristic frequency bands for the impulse response function at measurement point 2 across all four tests (%). The first six bands consistently account for over 95% of the total signal energy, confirming that the selected bands effectively capture the dominant dynamic information. The relative cumulative energy ratio threshold is therefore appropriate.
Energy ratio deviation (ERD) values of the characteristic frequency bands at measurement point 2 for three consecutive monitoring intervals. Interval 1, Interval 2, and Interval 3 denote Test 2–Test 1, Test 3–Test 2, and Test 4–Test 3, respectively. Non-zero ERD components indicate energy redistribution induced by changes in the structural dynamic response; their magnitude and distribution reflect the sensitivity of each frequency band.
3.3. Damage Localization
The ERSD index was computed for all 15 sensor positions according to Equation (7).
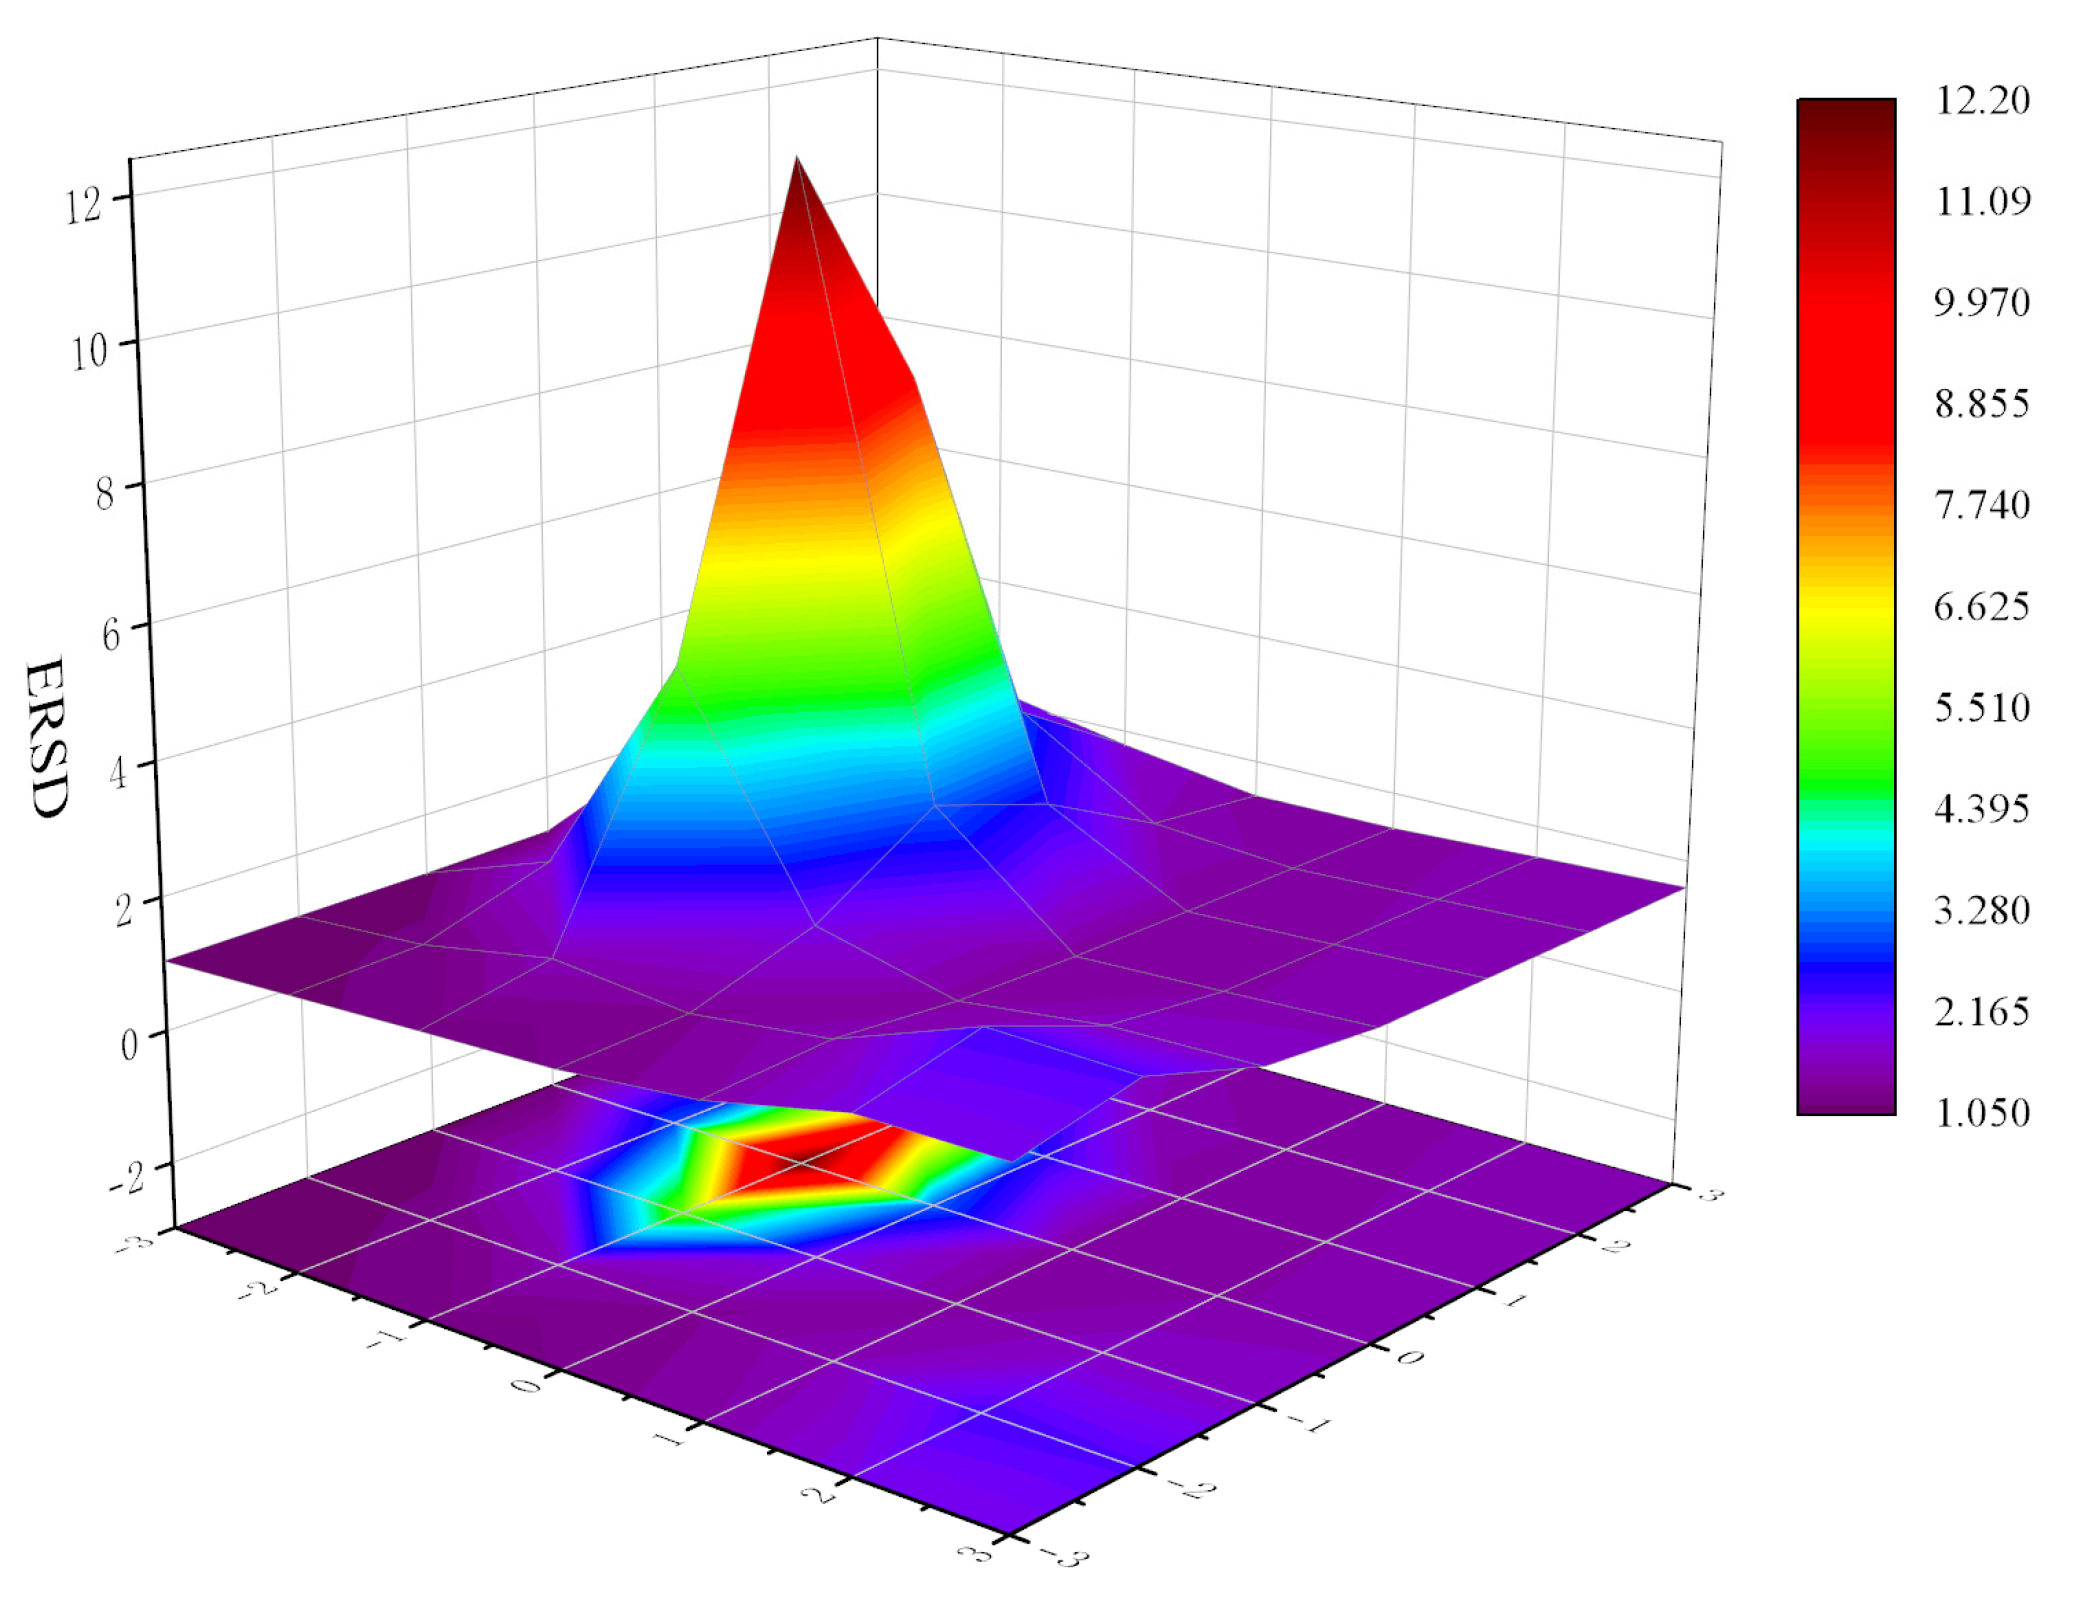
Table 2 presents the ERSD values for the third monitoring interval (Test 4–Test 3). A pronounced increase in ERSD is observed at the coordinates L = 0.6 m and H = 1.4 m, corresponding to measurement point 5, where the value reaches 11.0374. This value is substantially higher than those at the other measurement locations. Because point 11 was the excitation point and had no sensor, it was assigned the minimum observed ERSD value only for spatial interpolation; it was not used to infer damage severity.
Interpolation of the 16-point ERSD dataset onto a regular grid yielded the three-dimensional trend surface shown in
Figure 6. A distinct peak appears near L = 0.6 m and H = 1.4 m, and the ERSD value decreases away from this peak. The peak position was consistent across the monitoring intervals, indicating that the anomaly was spatially stable rather than randomly distributed.
After the final test, a detailed visual inspection was conducted. A crack approximately 0.8–1.2 mm wide, accompanied by localized minor mortar spalling, was found near the position where ERSD reached its maximum (point 5). This observation supports the interpretation that the ERSD anomaly corresponds to actual local damage. Nevertheless, because no direct stiffness-reduction measurement was available, the result should be regarded as field corroboration rather than a complete quantitative calibration of damage severity.
The figure shows the spatial distribution of ERSD values over the measurement grid. The peak region corresponds to the localized damage area of the retaining wall.
3.4. Temporal Evolution and Progression Characterization
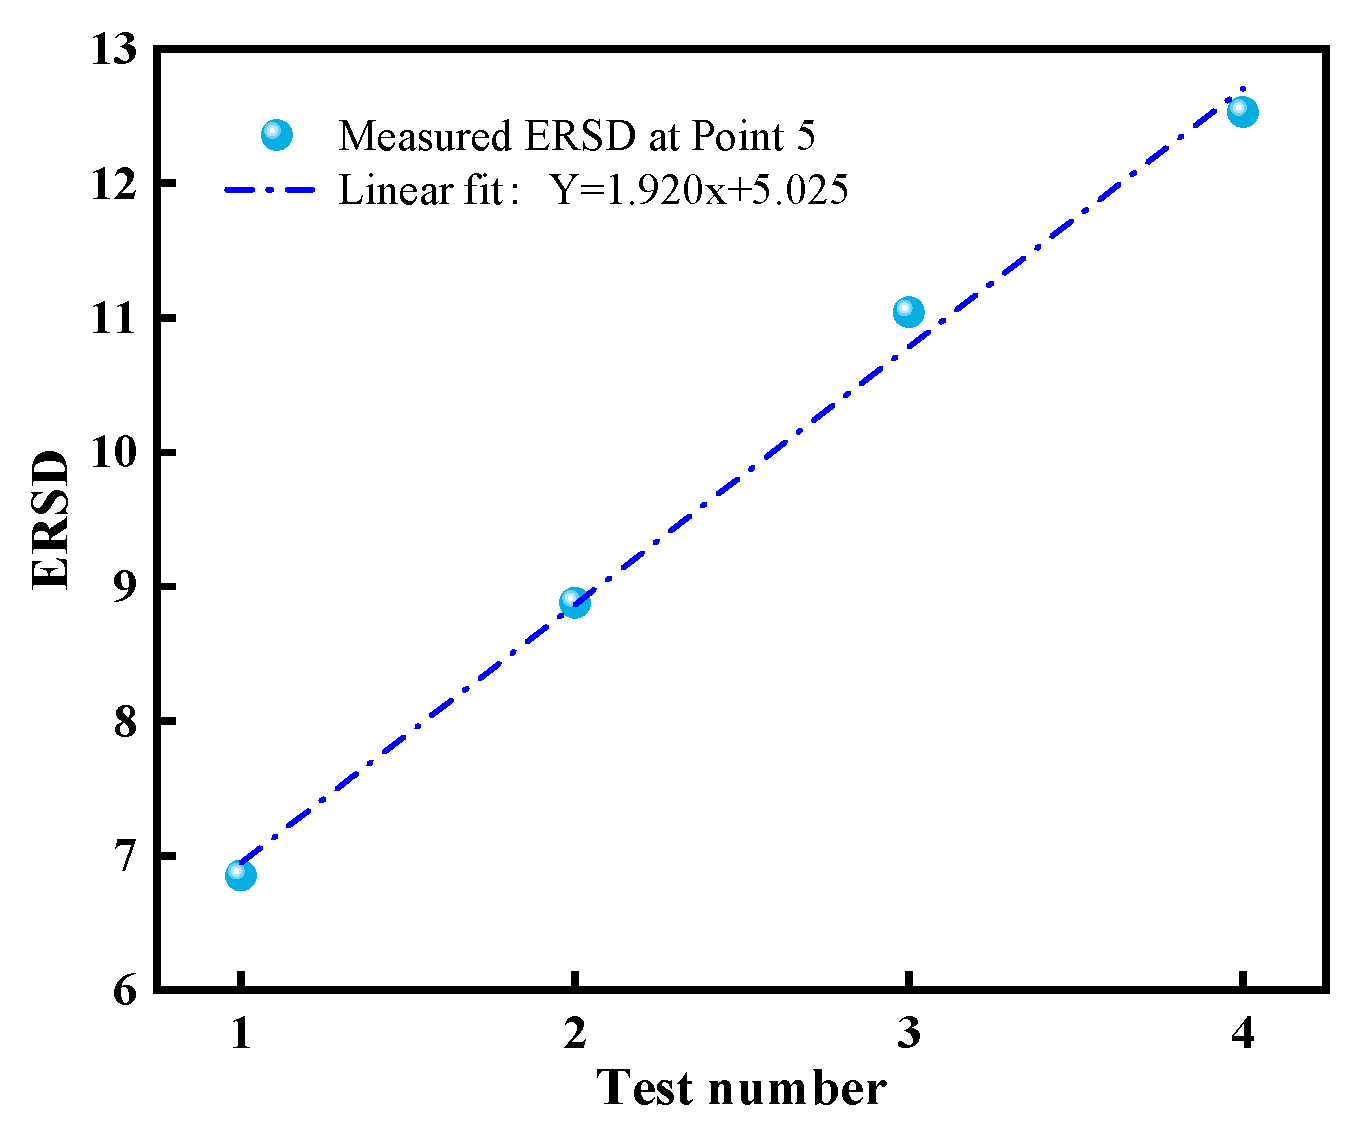
With the damage location confirmed at point 5, the ERSD sequence at this point was analyzed for the four test stages: 6.85, 8.88, 11.04, and 12.53 for Tests 1–4, respectively. These values show a clear increasing trend. Because only four measurements are available, a high-order polynomial fit would be statistically weak and could lead to overfitting. Therefore, a first-order regression was used to describe the short-term trend between ERSD (Y) and test number (x = 1, 2, 3, 4):
The fitted trend is illustrated in
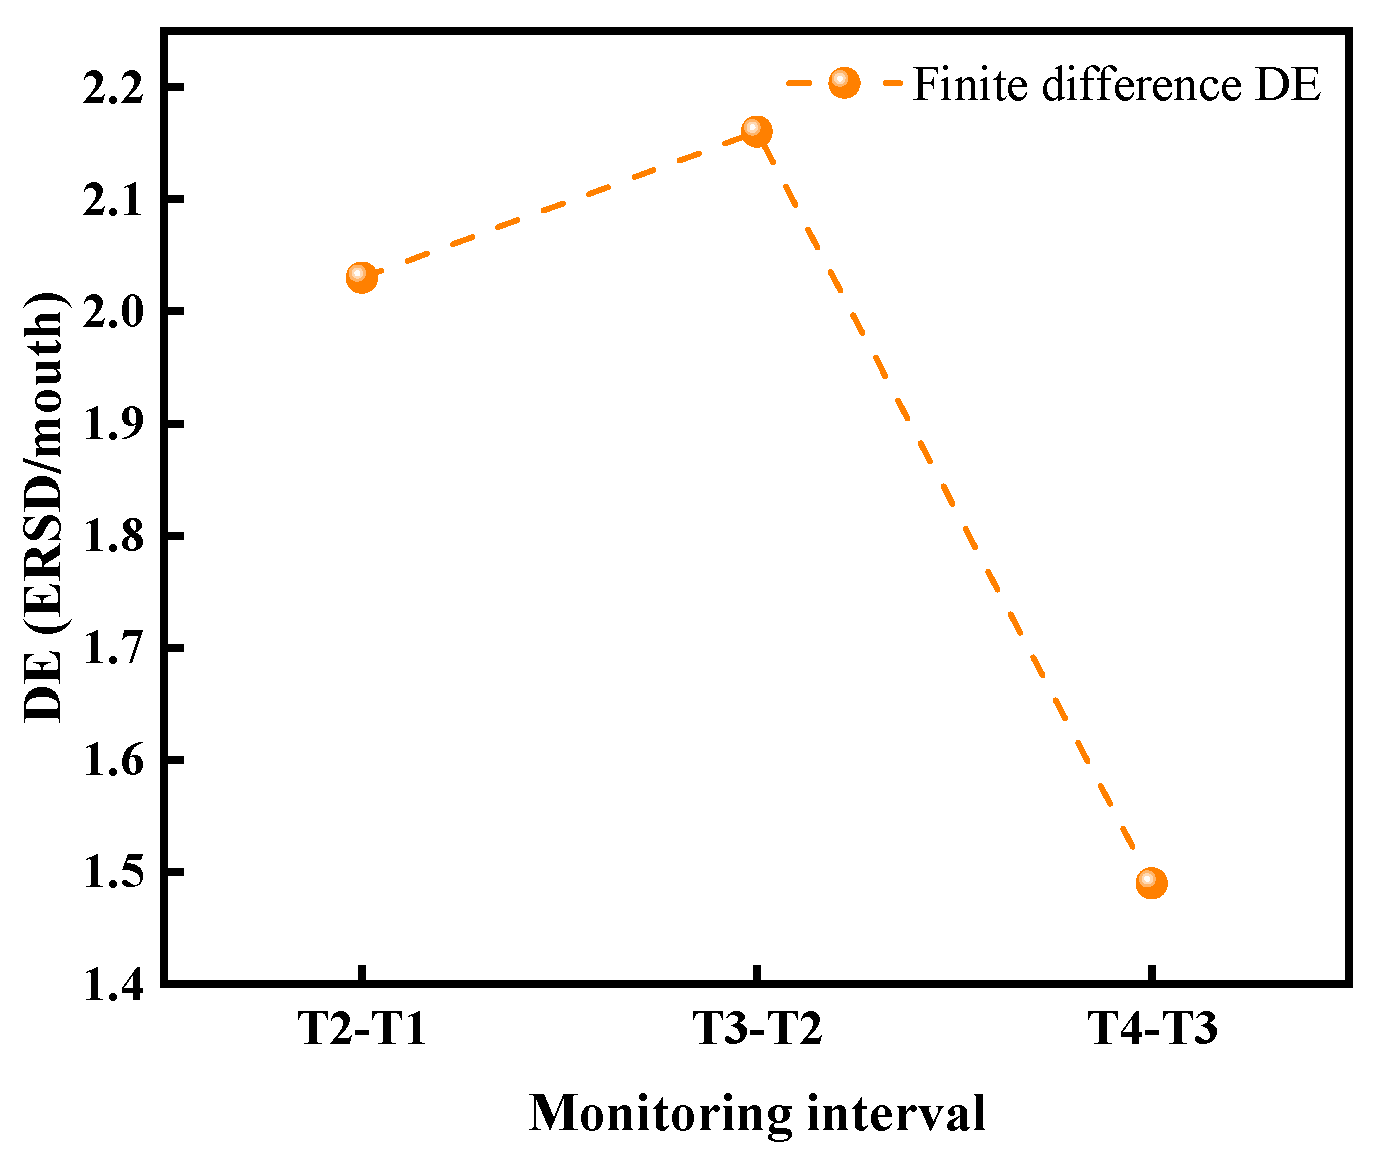
Figure 7. The qualitative damage progression rate DE is evaluated as the slope of the ERSD trend or, for direct interval-wise assessment, as a finite difference:
Here, Delta t is the monitoring interval, equal to one month in this study. The interval-wise DE values were 2.03, 2.16, and 1.49 ERSD/month for Test 2–Test 1, Test 3–Test 2, and Test 4–Test 3, respectively, as shown in
Figure 8. These values provide only a qualitative description of short-term progression under the present monitoring conditions and should not be interpreted as a universal damage severity calibration law.
4. Discussion
4.1. Comparison with Existing Methods
The proposed method was compared conceptually with two commonly used vibration-based approaches: frequency-change-based detection and modal-curvature-based localization. Under the same field data, the first natural frequency changed by less than 2%, indicating low sensitivity to localized damage in this wall. The modal-curvature-based approach requires dense measurement points and reliable modal fitting; under the present sparse sensor layout, it localized the anomaly only within a region of approximately +/−0.4 m. In contrast, the proposed IRF-WPD-ERSD procedure localized the ERSD peak at point 5, close to the visually observed crack. The method does not require modal extraction and is therefore more convenient for rapid field screening. Its key distinction from conventional WPD energy ratio methods is that the ERD vector is retained for band-wise interpretation and then converted into ERSD for spatial mapping. This scalarization improves interpretability and interpolation, although it should be supplemented by the ERD vector when detailed band-wise diagnosis is required.
4.2. Experimental Validation and Environmental Effects
The experimental validation of the proposed ERSD-based method was strengthened by combining the vibration-based diagnosis results with post-test field inspection. The highest ERSD value was consistently concentrated near point 5, and the interpolated ERSD surface showed a localized peak rather than a random spatial distribution. After the final vibration test, detailed visual inspection was conducted around this region, where a local crack with minor mortar spalling was observed. The measured crack width was approximately 0.8–1.2 mm. Since crack width, crack length, and joint offset are commonly used field indicators for evaluating masonry-wall damage, the spatial coincidence between the ERSD anomaly and the observed crack provides supporting evidence that the identified anomaly is associated with actual local structural deterioration.
To reduce obvious testing-related disturbance, the field vibration tests were arranged under relatively stable weather conditions, and tests during rainfall were avoided because rainwater may affect both the electronic instruments and the measured vibration response. In addition, all velocity sensors were installed in the same horizontal direction using L-shaped steel brackets, expansion bolts, and high-strength adhesive to improve sensor-coupling consistency. The excitation and response signals were synchronously acquired using the same acquisition system and sampling frequency throughout the monitoring period. These measures helped reduce, but did not completely eliminate, the influence of sensor coupling and excitation variability.
It should be emphasized, however, that the present validation remains indirect. No controlled artificial damage was introduced, and no direct stiffness-reduction measurement was performed. Moreover, temperature, humidity, rainfall, pore-water pressure, and earth pressure were not quantitatively recorded or compensated for in the present study. From the perspective of soil–structure interaction, cracks in masonry retaining walls may be affected not only by local stiffness degradation of the wall body but also by drainage deterioration, pore-water pressure accumulation, and redistribution of backfill earth pressure. Therefore, although the spatial agreement between the ERSD peak and the observed crack supports the damage interpretation, it does not prove that the ERSD anomaly is uniquely attributable to structural stiffness degradation. The proposed method should therefore be regarded as a field screening and localization approach at this stage. Future work will incorporate controlled damage tests, repeated sensor-installation tests, direct stiffness evaluation, and synchronous monitoring of temperature, humidity, rainfall, pore-water pressure, and earth pressure to establish a more rigorous validation and environmental-compensation framework.
4.3. Geotechnical Aspects
This study focuses on structural self-damage identification and does not directly model earth pressure, groundwater seepage, or drainage conditions. However, the deterioration of stone masonry retaining walls is often coupled with the geotechnical environment: cracking may reduce drainage efficiency, increase local water pressure, and accelerate mortar degradation. The proposed vibration-based method can therefore be integrated with earth pressure cells, pore-water pressure sensors, and drainage monitoring in a long-term health-monitoring system to achieve combined structural and geotechnical diagnosis.
4.4. Limitations
Several limitations remain. First, no controlled artificial damage was introduced, and no direct stiffness-reduction measurement was obtained; the damage interpretation was corroborated mainly by crack width observation and spatial consistency of the ERSD peak. Second, the monitoring period included only four monthly tests, so statistical extrapolation of the ERSD trend is not appropriate. Third, temperature, humidity, rainfall, pore-water pressure, earth pressure, and sensor reinstallation effects were not quantitatively compensated. Fourth, ERSD scalarization improves spatial visualization but may hide band-specific information contained in the ERD vector. Future work will expand the sample size, introduce controlled damage levels in laboratory or semi-field tests, incorporate environmental and geotechnical compensation models, and evaluate repeatability under different sensor-coupling and excitation conditions.
5. Conclusions
(1) The ERD vector, also defined as the damage eigenvector spectrum, effectively describes band-wise WPD energy redistribution between successive monitoring states. A non-zero ERD vector indicates a change in the dynamic response, while the scalar ERSD index summarizes the overall magnitude of that redistribution.
(2) Three-dimensional surface maps based on ERSD values enable intuitive damage localization. The ERSD peak coincided with the visually observed crack near point 5, demonstrating the feasibility of the proposed IRF-WPD-ERSD procedure for rapid field screening of local damage in masonry retaining walls.
(3) For the four monthly tests, ERSD at the identified damage location increased approximately linearly with test number (R2 = 0.994). A linear fit and finite-difference DE values were adopted instead of a cubic polynomial to avoid overfitting and to improve the traceability of the regression analysis.
(4) The method is convenient for field application because it uses measured input-output data, avoids modal extraction, and converts multi-band WPD information into a spatially mappable scalar index. Nevertheless, quantitative damage severity assessment requires additional validation through controlled stiffness-reduction experiments, environmental compensation, and integration with geotechnical monitoring parameters.