Article

Creep-Based Ductile Failure Lifetime Estimation of Polyethylene Pipes Using Critical Strain Criterion

1
College of Civil Engineering, Xiangtan University, Xiangtan 411105, China
2
School of Civil Engineering, Changsha University, Changsha 410022, China
3
School of Mechanical Engineering and Mechanics, Xiangtan University, Xiangtan 411105, China
4
School of Aerospace Engineering, Huazhong University of Science and Technology, Wuhan 430074, China
*
Author to whom correspondence should be addressed.
Appl. Sci. 2026, 16(11), 5414; https://doi.org/10.3390/app16115414
Submission received: 11 April 2026 / Revised: 21 May 2026 / Accepted: 27 May 2026 / Published: 29 May 2026

Abstract

Polyethylene (PE) pipes are widely employed in urban gas and water conveyance systems due to their excellent corrosion resistance, cost efficiency, and long service life. However, creep-induced delayed failure remains a critical threat to long-term operational safety and may lead to leakage accidents. Accurate and efficient prediction of creep rupture life is essential for risk control and structural design. This study investigated the performance of four commercial polyethylene pipes, including two PE80-grade and two PE100-grade pipes. By combining the creep test with the critical strain criterion, an efficient and reliable method for predicting the ductile failure lifetime was developed. Creep tests were carried out on dumbbell specimens cut from PE pipes under multiple temperature and stress levels. The time-hardening model was adopted to characterize the nonlinear viscoelastic creep evolution, and the ductile failure time was determined by introducing the critical strain threshold. The predicted lifetimes were systematically validated against experimental data from long-term hydrostatic tests. Results show that the predicted failure times agree well with the measured values, verifying the accuracy and engineering applicability of the proposed method. This approach provides a high-efficiency alternative to conventional long-term hydrostatic tests, offering valuable support for material selection, safety evaluation, and engineering design of PE pipeline systems.

1. Introduction

Polyethylene (PE) pipes have become indispensable components of water and gas transportation infrastructure due to their superior corrosion resistance, cost-effectiveness, and inherent long service life. In practical applications, these pipes sustain continuous internal pressure, and the combination of initial material defects and complex environmental factors can induce progressive deformation, ultimately resulting in structural failure. Given that gas pipelines often traverse densely populated urban areas, undetected failures may trigger severe safety hazards and substantial economic losses. Consequently, investigating the failure mechanisms and accurately predicting the service life of PE pipes are highly important for ensuring the operational safety and reliability of pipeline systems [1].
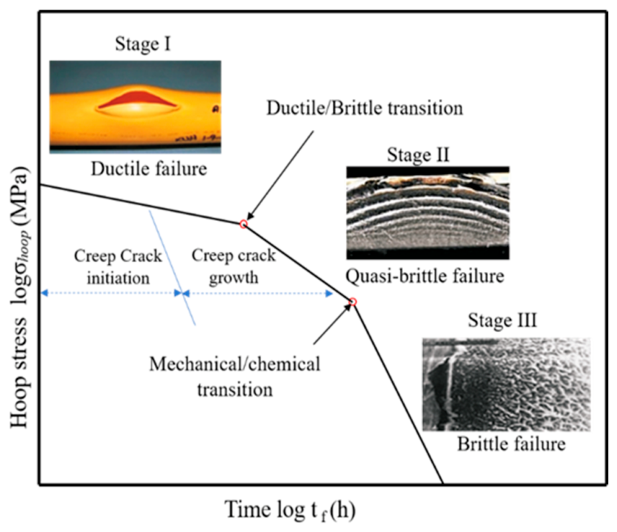
Creep is a time-dependent deformation behavior that significantly influences the long-term performance and durability of polymeric materials [2,3]. Under static loading conditions, creep deformation arises from molecular rearrangement, whose magnitude is dependent on the material properties, applied stress, temperature, and exposure time [4]. Extensive research has categorized the long-term creep rupture behavior of PE pipes into three distinct stages on the basis of stress level: ductile failure (Stage I), quasi-brittle failure (Stage II), and brittle failure (Stage III) [5,6,7], as schematically illustrated in Figure 1 [8,9]. At high hoop stresses, internally pressurized pipes primarily undergo ductile failure, characterized by localized stress concentration in thinner wall sections, leading to yielding, bulging, and eventual ductile rupture [10]. As the hoop stress decreases to moderate levels, the failure mode transitions to quasi-brittle failure, which involves two key phases: crack initiation and slow crack growth (SCG). At low stress levels, the service life of PE pipes becomes largely independent of the stress magnitude and is predominantly governed by the molecular weight of the material [11]. Under long-term service conditions, factors such as internal fluid corrosion, antioxidant depletion, and mechanical property degradation contribute to brittle failure, with environmental stress cracking (ESC) emerging as the dominant failure mechanism in Stage III [12]. With advancements in material technology, the occurrence of quasi-brittle and brittle failures has been minimized, prompting this study to focus primarily on the ductile failure stage.
The long-term hydrostatic (LTH) test is the conventional method for evaluating the performance and predicting the lifetime of PE pipes [13]. This approach involves the collection of failure time data under specific temperature and hoop stress conditions, followed by the application of the time-temperature superposition (TTS) principle to extrapolate short-term data for long-term predictions by constructing a master curve. While LTH tests yield reliable results, they are prohibitively time-consuming and costly, often requiring thousands to tens of thousands of hours to complete in accordance with international standards. This inefficiency of the approach poses challenges in meeting the urgent demands of material development and engineering selection. Thus, there is a pressing need to develop a rapid, material-efficient lifetime prediction method that maintains high accuracy [14].
The establishment of an appropriate creep constitutive model is a prerequisite for reliable lifetime prediction [3]. Over the past decades, numerous researchers have proposed various creep models to describe the time-dependent deformation behavior of PE materials. Vakili-Tahami et al. [15] investigated the creep behavior of high-density polyethylene (HDPE) under different temperatures and stress conditions and derived creep constitutive model parameters, enabling accurate prediction of the creep behavior of HDPE pipe structures. Amjadi and Fatemi [4] employed the Findley power law combined with the time–stress superposition principle to characterize the nonlinear viscoelastic creep curves of HDPE, and validated the model against long-term creep tests at room temperature. Drozdov et al. [16] conducted a series of uniaxial tensile, relaxation, and creep tests on HDPE at room temperature, and developed a constitutive equation to describe the viscoelastic–plastic response of semicrystalline polymers. Mao et al. [17] adopted the time–hardening model to fit the time-strain creep curves, demonstrating its efficacy in describing the initial and stable creep stages, as well as predicting the long-term deformation of HDPE materials.
Although the above models have advanced the description of PE creep behavior, each has limitations that make them less suitable for rapid lifetime screening. The Findley power law is simple and convenient for curve fitting, but it does not explicitly decouple the combined effects of stress and temperature, limiting its predictive capability across different service conditions. The Norton power, on the other hand, is well-established for describing steady-state (secondary) creep, but it cannot capture the full creep response including the transient stage. In contrast, the time-hardening model adopted in this study offers a unified stress–time–temperature formulation that naturally incorporates the effects of both environmental and loading conditions. It provides a good description of the primary and secondary creep behavior of PE and can be directly combined with the critical strain criterion to predict ductile failure life.
As a semicrystalline polymer, the mechanical behavior and failure of PE are predominantly governed by crystalline regions and their interactions with polymer chains, particularly through tie molecules and amorphous segments [18,19]. It should be noted, however, that accelerated testing conditions (e.g., elevated temperature or high stress) may alter the dominant failure mechanisms, potentially leading to deviations in extrapolated predictions and thus over- or under-estimation of the actual service life. For this reason, the accuracy of the proposed lifetime prediction model must be validated against benchmark LTH test data.
The objective of this study is to establish an effective method for predicting the Stage I ductile failure time of PE pressure pipes. The influences of temperature and stress level on the creep behavior and long-term hydrostatic strength (LTHS) of PE pipe materials were systematically investigated. A lifetime prediction approach was developed based on the time-hardening creep model combined with the critical strain criterion, and its reliability was validated by comparing the predicted results with the failure data from LTH tests. The proposed methodology offers a rapid and reliable alternative to conventional LTH tests, facilitating efficient material evaluation and engineering design.

2. Experiment

2.1. Materials

Two commercial grades of PE pipe materials, namely PE80 and PE100, were selected for this study. Their key material properties, including the density (ρ), number-average molecular weight (Mn), weight-average molecular weight (Mw), polydispersity index (PDI = Mw/Mn), short-chain branching (SCB) content, σ LPL , which is the stress level at a given time that ensure no failure in 97.5% of test samples at a 50-year service life, and crystallinity (χc), are summarized in Table 1. All materials were sourced from industrial production batches to ensure their direct relevance to practical applications. The density, molecular-weight parameters, and SCB content listed in Table 1 were obtained from the manufacturers’ material certificates and from our previous characterization work on the same grade pipe materials [20], which included density testing, gel permeation chromatography (GPC), and SCB analysis. The crystallinity values were determined by differential scanning calorimetry (DSC), while the lower confidence limit of predicted hydrostatic strength ( σ L PL ) values were taken from the manufacturer’s pipe grade classification data, which are consistent with the standard specifications for PE80 and PE100 pipe materials.

2.2. Creep Tests

2.2.1. Creep Test Specimen

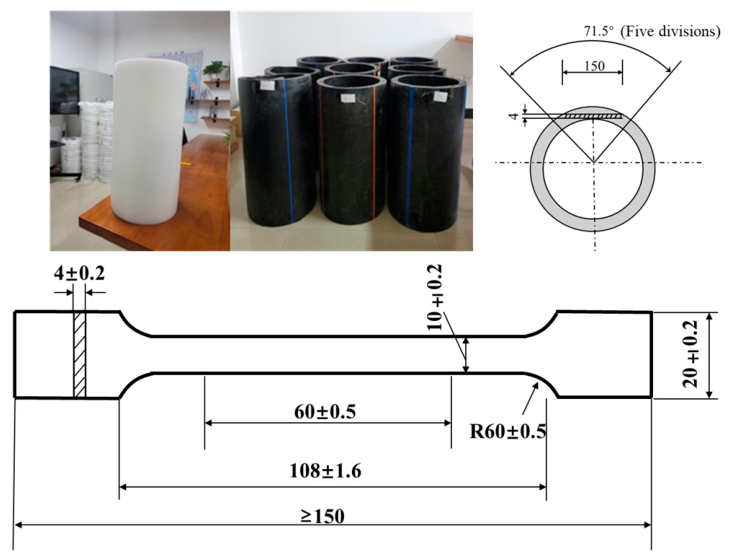
Given that the microstructure and mechanical properties of finished pipes differ considerably from those of raw materials, specimens for creep testing were machined directly from DN315 (SDR11) pipe segments to closely replicate actual service conditions [21]. As shown in Figure 2, the pipe segments were sectioned in specified orientations and milled into 4 mm-thick plates using computer numerical control equipment. Type 1B standard tensile specimens were fabricated from these plates in accordance with ISO 527-2:2019 [22].

2.2.2. Creep Testing Procedure

Creep tests were conducted using a 1598 IPT tensile creep testing machine (ITP, Augsburg, Germany) equipped with precise temperature control (±0.5 °C). Tests were performed at 0 °C, 23 °C, 40 °C, 60 °C, and 80 °C under constant stress levels of 2.4, 4.8, and 7.2 MPa. These temperatures cover the typical service range of PE pipes (0–60 °C), with an additional elevated temperature of 80 °C to accelerate creep deformation and improve experimental efficiency. The selected stress levels correspond to approximately 15–45% of the yield stress at room temperature, ensuring that all tests remained within the viscoelastic regime without inducing immediate plastic yielding. Prior to testing, each specimen was equilibrated at the target temperature for 1 h to ensure a uniform thermal distribution. During testing, the creep strain was continuously recorded as a function of time. Three parallel specimens were tested for short-term creep under each temperature–stress combination to ensure statistical reliability.

2.3. Long-Term Hydrostatic Tests

2.3.1. LTH Test Specimen

To ensure consistent material performance and reliable test results, all the specimens were sourced from pipes extruded in a single production batch, with strict selection criteria requiring flat and defect-free surfaces. For LTH tests, pipes with a standard dimension ratio (SDR) of 11 and a nominal diameter (DN) of 32 mm were used, with an effective length not less than 250 mm.

2.3.2. LTH Testing Procedure

The LTH tests were conducted in accordance with ISO 9080 [23] at various temperatures and stress levels. Prior to testing, the dimensions of each pipe specimen were accurately measured using a digital caliper. The specimens were then conditioned in a temperature-controlled water bath for at least 24 h to relieve processing-induced residual stress and achieve thermal equilibrium. The specimens were subsequently connected using hydraulic self-tightening seals and fully immersed in a constant-temperature water bath maintained at the specified temperature.
The applied pressure was calculated from the hoop stress for the thin-walled cylinders as follows:
P = 2 σ H × t D N t
where P is the applied internal pressure (MPa), σ H is the hoop stress (MPa), D N is the mean outside diameter of the pipe (mm), and t is the minimum measured wall thickness of the pipe (mm).
The test conditions, including the temperature, hoop stress range, and maximum testing duration, are summarized in Table 2. Notably, compared with the other materials, PE80-1, a polyethylene with a high-temperature resistance (PE-RT) designed for heating and ventilation pipes, was tested under slightly different temperature conditions (up to 95 °C). The maximum test duration did not exceed 14,000 h. During testing, key parameters such as the hoop stress ( σ H ), time to failure ( t f ), and failure mode (ductile, brittle) were recorded.

3. Results

3.1. Creep Test Results and Time-Hardening Model Fitting

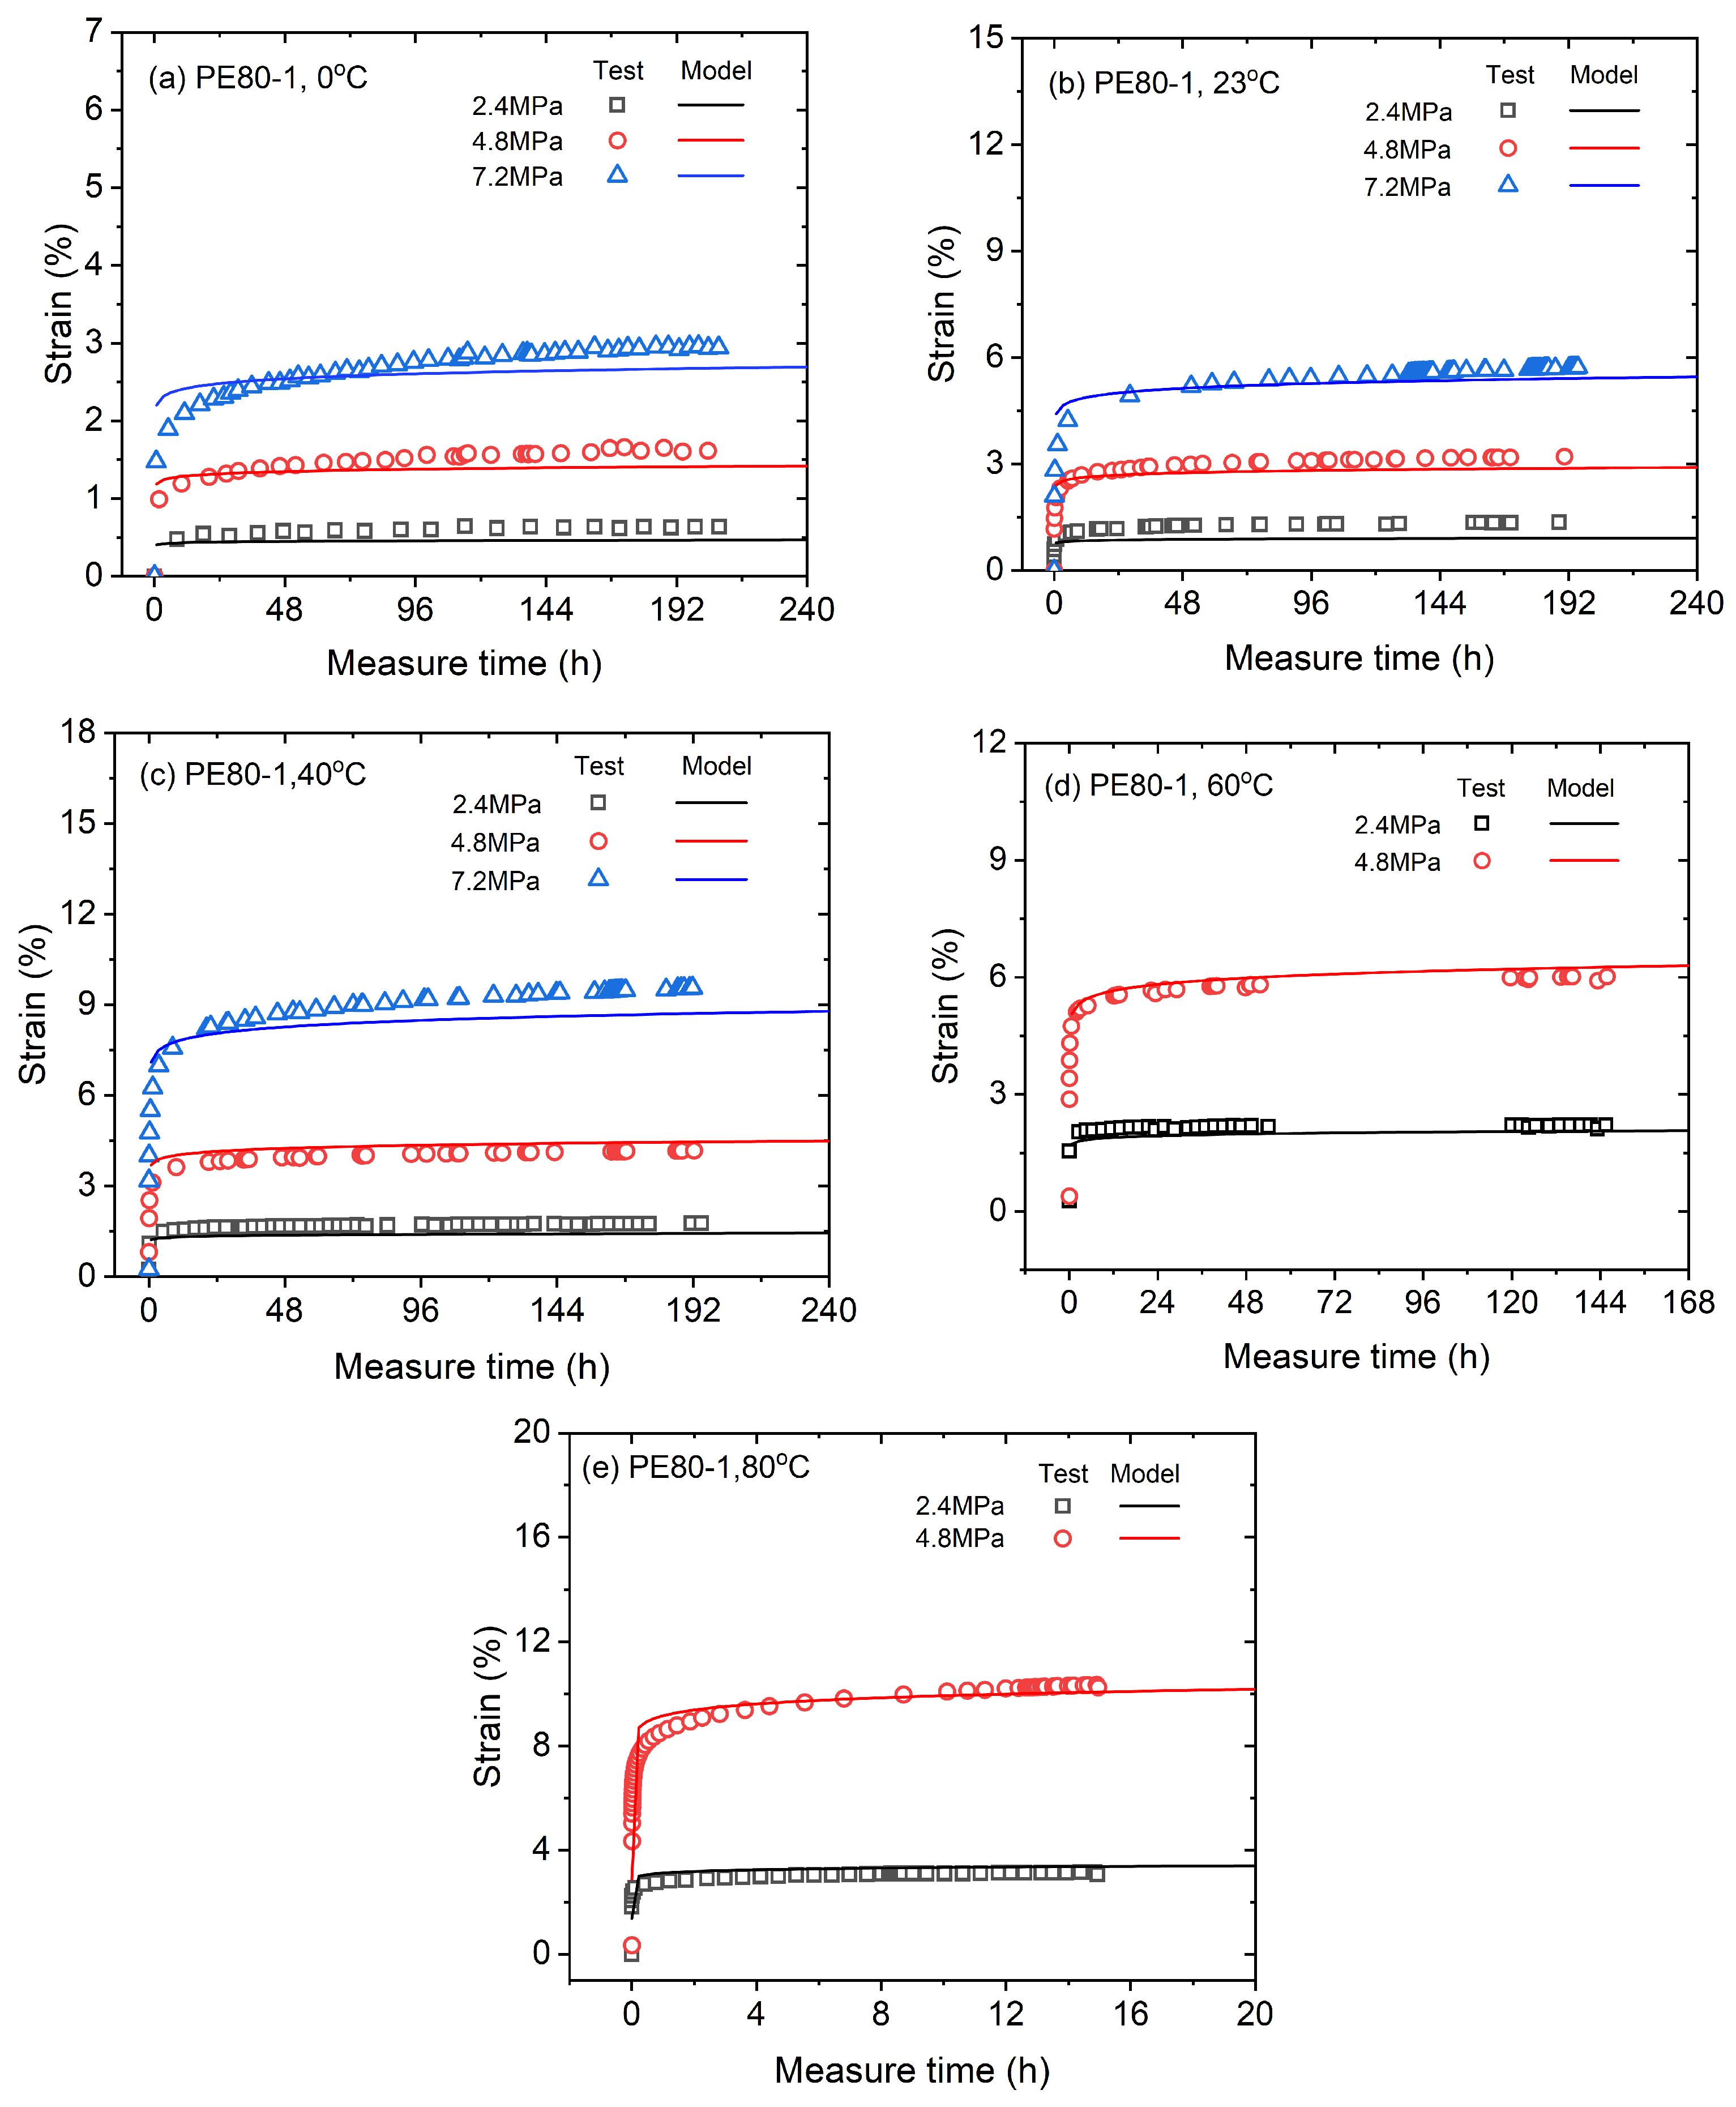
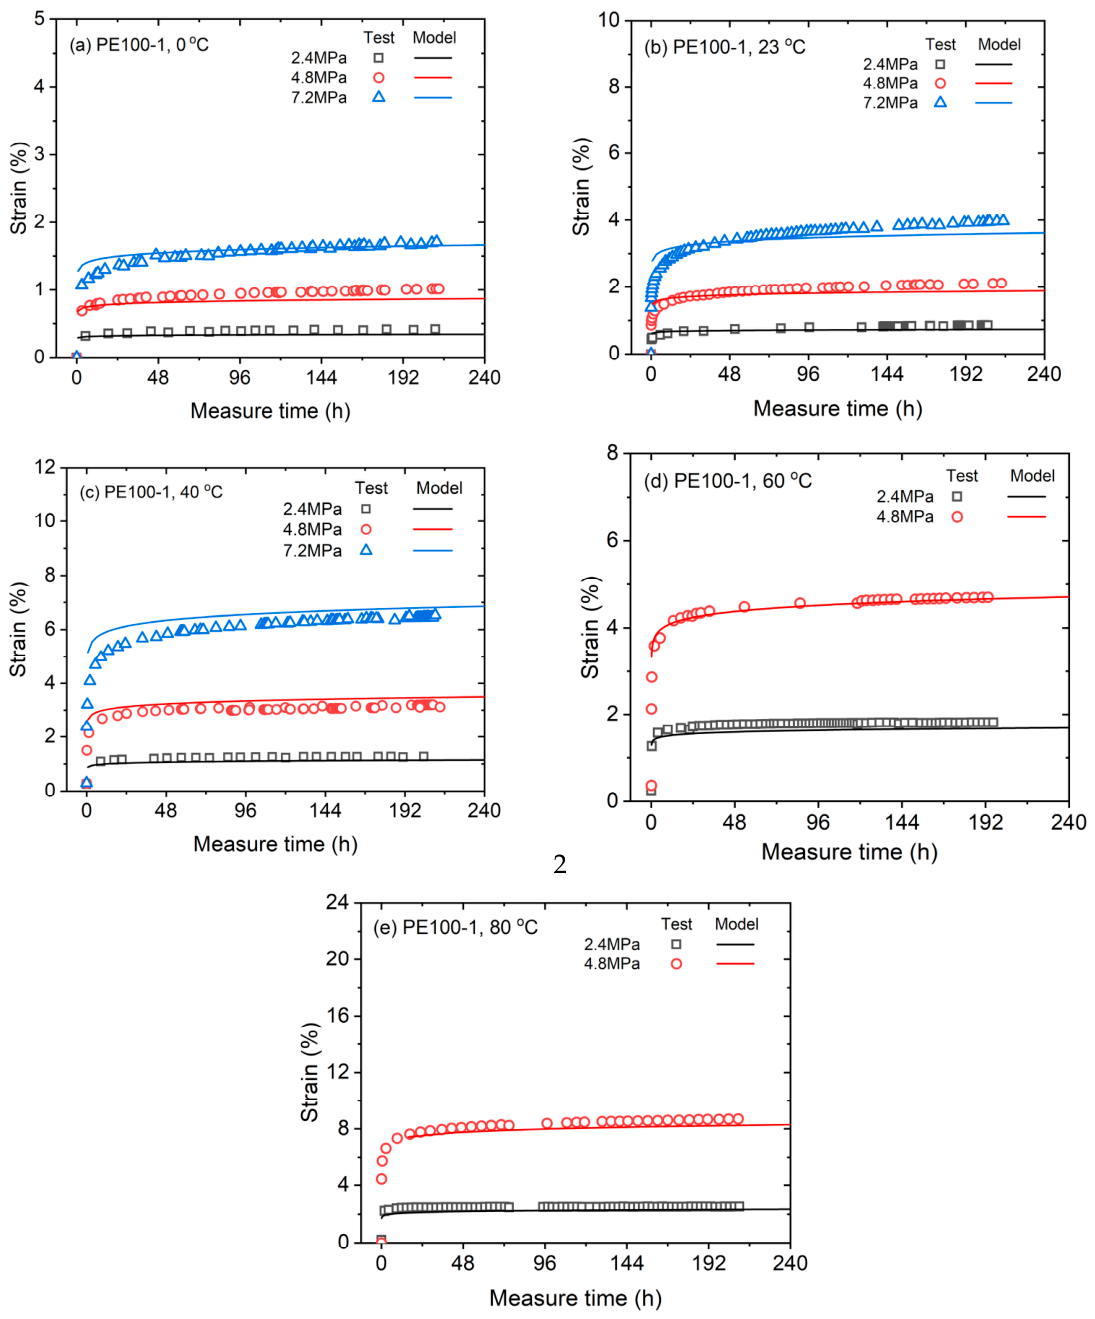
During creep testing, the specimens were subjected to constant-rate tensile loading until the preset load level was reached, with the target stress typically achieved within 3–6 s. The applied load was then maintained for the remainder of the test duration [24]. The creep behavior is a key indicator for evaluating the long-term performance of polymeric pipe materials. The creep curves for the PE80 and PE100 pipe materials under different temperature and stress conditions are shown in Figure 3 and Figure 4. All the PE materials tested here exhibit a nonlinear creep behavior, which is consistent with the findings reported by Behjat [25].
Polyethylene creep typically proceeds through three distinct stages: transient (primary) creep, steady-state (secondary) creep, and accelerated (tertiary) creep. Transient creep deformation includes not only instantaneous elastic deformation and time-dependent delayed elastic deformation, but also reversible local segmental slipping and conformational rearrangement within the amorphous regions [4], as well as minor recoverable interlamellar separation and lamellar rotation in the crystalline phase [16]. The creep strain increases rapidly with time, while the creep strain rate progressively decreases.
Following transient creep, the material enters the steady-state creep stage, where deformation is governed by stable intermolecular slipping, gradual disentanglement of molecular chains, and steady void nucleation at a nearly constant rate [4,17]. The creep strain increases linearly with time, and the strain rate remains approximately constant, representing a balance between chain mobility and structural resistance.
The creep process eventually proceeds to the accelerated creep stage, where the strain rate rises sharply once the creep strain exceeds a critical threshold. This stage is characterized by accelerated void growth, coalescence of microvoids, severe localized deformation, and instability of the molecular network, which ultimately lead to strain localization and macroscopic ductile failure [14,26]. Once the maximum void nucleation rate is reached, rapid failure initiates, and the void size expands nonlinearly at a drastic rate.
Notably, the tertiary creep stage is not observed in this study due to the relatively low stress levels applied and limited test duration. Since the accelerated creep stage occupies only a small fraction of the overall creep life, its duration is neglected in the present creep lifetime prediction.
As shown in Figure 3 and Figure 4, both temperature and stress are critical factors influencing the creep behavior of PE materials. Since the creep trends of the four materials are roughly the same, PE80-1 and PE100-1 are taken as examples. An increase in either parameter leads to greater steady-state creep strain and a higher steady-state creep rate. Elevated temperatures expedite the transition from primary to steady-state creep, whereas higher stress levels tend to retard this process. A notable phenomenon is the coupling effect between the temperature and stress. Experimental data indicate that comparable creep strains can be observed under either low-temperature/high-stress or high-temperature/low-stress conditions, although the underlying mechanisms differ fundamentally. At temperatures significantly above the glass transition temperature (Tg) and creep strains below the material’s yield point, the creep behavior is predominantly governed by amorphous phase deformation. Elevated temperatures provide additional thermal energy, which enhances the thermal motion of molecular chains, reduces internal friction between them, and facilitates slip within crystalline regions and between molecular chains [27]. In contrast, creep under high-stress conditions is governed by crystalline phase deformation, where increased stress acts as an external driving force to promote the molecular chain orientation and slip, thereby accelerating molecular chain disentanglement and crystalline structure reorganization. This coupling effect underscores the necessity of considering the combined influence of temperature and stress when developing creep models to avoid predictive deviations.
To characterize the creep behavior of the tested PE materials and extrapolate short-term data for long-term deformation prediction, numerous researchers have developed various creep constitutive models that describe the creep behavior of polymeric materials [28,29,30,31,32]. In this study, the time-hardening model [33] was adopted to analyze the creep behavior of PE materials. This model integrates the combined effect of temperature and stress on the creep strain, as expressed in Equation (2):
ε T , σ , t = ε 0 + A ( T ) σ m t n
where ε is the creep strain, A ( T ) is a temperature-dependent function, σ is the applied stress, t is time, ε 0 is the initial instantaneous elastic strain, and m and n are material constants. The function A ( T ) is described using an exponential Arrhenius-type expression to account for the temperature dependence of creep deformation as follows:
A ( T ) = A 0 exp E a R T
where A 0 is the pre-exponential factor, E a is the activation energy, R is the gas constant, and T is the absolute temperature.
The model fitting curves are shown as solid lines in Figure 3 and Figure 4. The determination coefficients R2 of all nonlinear curve fittings exceed 0.90. A comparison of the experimental data and fitting curves reveals that the time-hardening model adequately describes the creep curve trends during steady-state creep stages. The results show that the activation energy of the PE100 pipe materials is consistently greater than that of the PE80 pipe materials. A higher activation energy implies that more energy is required for molecular chains to overcome intermolecular resistance and undergo slip or disentanglement, reflecting stronger intermolecular interactions within the material. Compared with PE80, PE100 has a more complex molecular structure, and its bimodally distributed high-molecular-weight components form a more highly developed entanglement network, which imposes greater constraints on molecular chain mobility. Therefore, under identical temperature and stress conditions, PE100 has a lower creep rate, which is consistent with its generally superior long-term creep performance in engineering applications.
The fitted values of parameter n were all close to 0.05, suggesting consistent time-dependent characteristics of secondary creep within the tested time range. Even so, the overall creep kinetic laws differ distinctly among these pipe materials. The creep kinetic law describes the quantitative evolution rule of creep strain and creep rate varying with time, stress and temperature, which can be evidently distinguished by analyzing the respective influences of stress and temperature on the creep deformation. The stress exponent m characterizes the sensitivity of creep deformation to applied stress. A lower value of m indicates a diminished influence of stress on the creep behavior. As shown in Table 3, the m values for the PE80 pipe materials are consistently higher than those for the PE100 pipe materials. This finding indicates that compared with PE100, PE80 undergoes a more significant change in the creep strain in response to the same variation in the applied stress; this trend is also evident in the creep curves.

3.2. Long-Term Hydrostatic Test Results

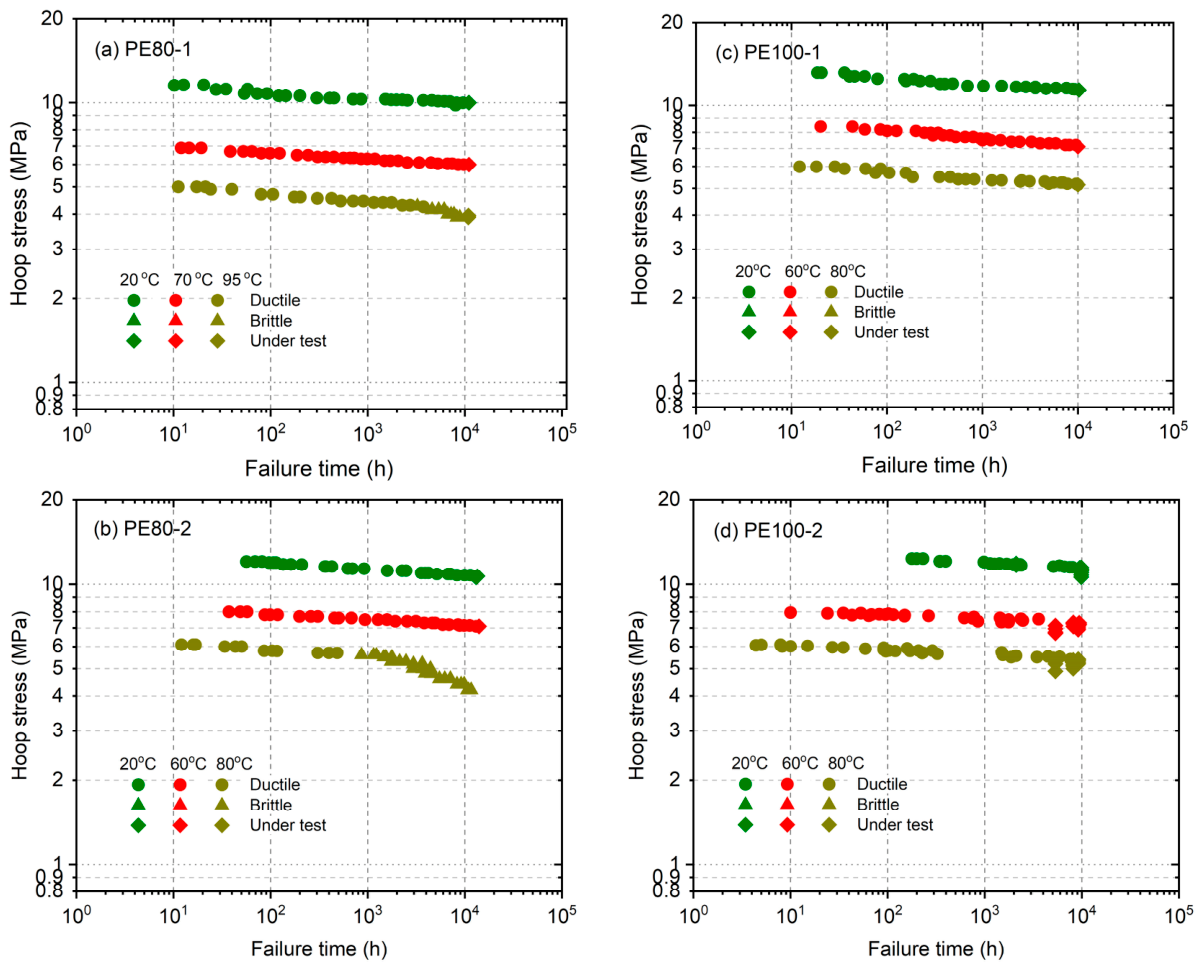
The long-term hydrostatic strength (LTHS) is defined as the hoop stress that determines the design lifetime of thermoplastic pipes for a specified service period (typically 50 years). To estimate the LTHS of the tested PE pipes, creep rupture data were collected over a period of approximately one year at multiple temperatures. The LTH test data of the four PE pipes at 20 °C, 60 °C, and 80 °C are plotted on a double logarithmic coordinate system (log σ H vs. log t f ) in Figure 5, which includes complete replicate data for every temperature–hoop stress condition. For each combination of temperature and hoop stress, three parallel pipe specimens were tested to ensure statistical reliability.
For all materials and temperatures, the time to failure ( t f ) increases almost linearly with decreasing hoop stress in the double logarithmic coordinate system. Concurrently, elevated temperatures accelerate the fracture process, as a higher thermal energy promotes molecular mobility and material degradation. A key observation is the variation in the ductile-to-brittle transition behavior among different materials, as indicated by the presence of “knee” points in the LTH curves in Figure 5. These knee points mark the transition from ductile failure to quasi-brittle failure, where the dominant failure mechanism shifts from plastic yielding to slow crack growth (SCG).
Quantitative analysis of the transition behavior reveals that at 95 °C, PE80-1 has knee points at 4.23 MPa (4341 h). PE80-2 shows a single knee point at 5.52 MPa (11,653 h) at 80 °C, with no observable transition at 20 °C or 60 °C within the test range. Notably, PE100-1 and PE100-2 do not exhibit any knee points within the tested stress and time ranges, indicating that no ductile-to-quasi-brittle transition occurs under the experimental conditions.
The appearance of a knee point indicates a critical transition in the predominant failure mechanism. Ductile failure is usually characterized by extensive plastic deformation due to the stretching of tie molecules beyond their load-bearing capacity and subsequent lamellar crystal fragmentation [34], whereas quasi-brittle failure is dominated by SCG. In the quasi-brittle failure stage, tie molecules gradually relax over time, leading to the pull-out of some tie molecules from crystalline regions. This process increases the stress concentration in the remaining tie molecules, promoting further molecular disentanglement and driving crack propagation [35,36,37]. The absence of knee points in the PE100 series is attributed to their higher crystallinity and more complex molecular structure, which provides enhanced resistance to SCG.

4. Discussion

4.1. Ductile Failure Lifetime Prediction and Model Validation

Macroscopic ductile failure in PE pipes is manifested by significant plastic yielding in the vicinity of the damage zone, which typically occurs under elevated stress levels. Ductile failure is inherently related to the viscoelastic properties of the PE materials [38]. The present study employed the critical strain criterion, which states that ductile failure occurs under constant stress conditions when the creep strain reaches a material-specific critical value ε c [14,39].
Based on time-hardening creep model and the critical strain criterion, the creep lifetime t f for the ductile failure of PE pipes can be derived by setting ε c equal to the critical strain as follows [40,41]:
t f = ε c ( T ) A T σ m 1 n = ε c ( T ) 1 / n A 0 exp E a R T 1 / n σ m / n
where ε c is the critical strain for ductile failure and it was reported to be constant [42].
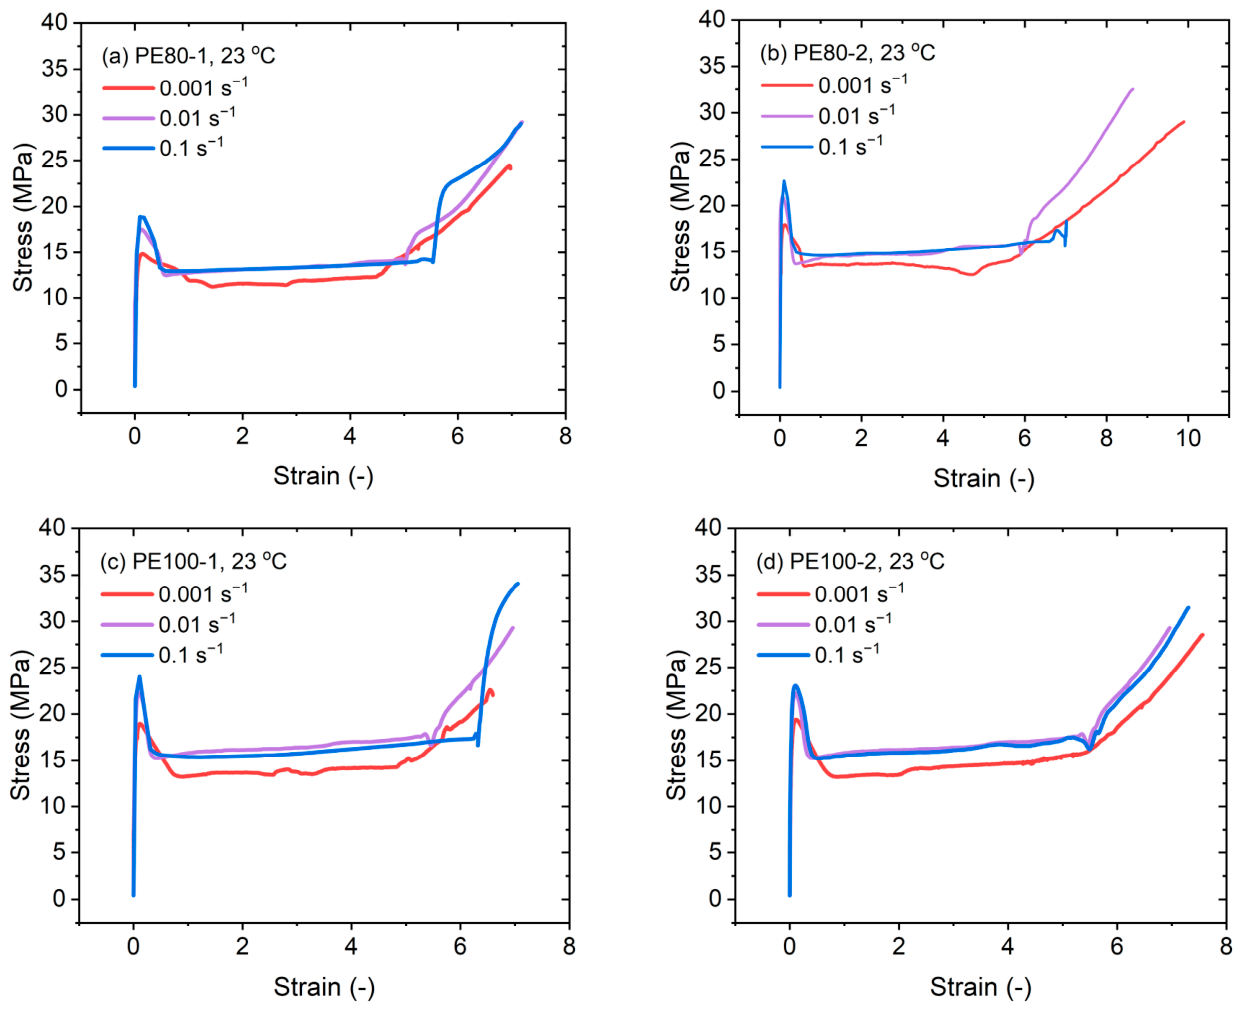
Ductile failure initiates when the creep strain reaches the yield strain of the material. Therefore, the yield strain is taken as the critical strain for the model. To determine the critical strain for the tested PE pipes, uniaxial tensile tests were conducted at various strain rates and temperatures, with their typical stress-strain curves presented in Figure 6. It is clear that the material’s yield strain remains almost constant as the strain rate changes.
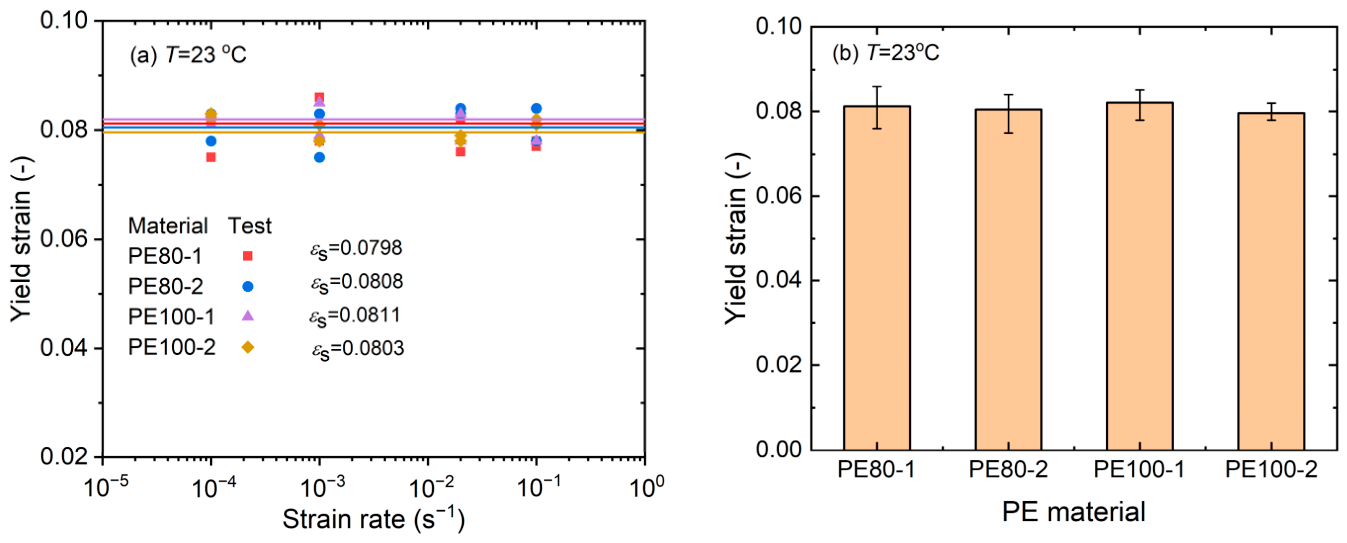
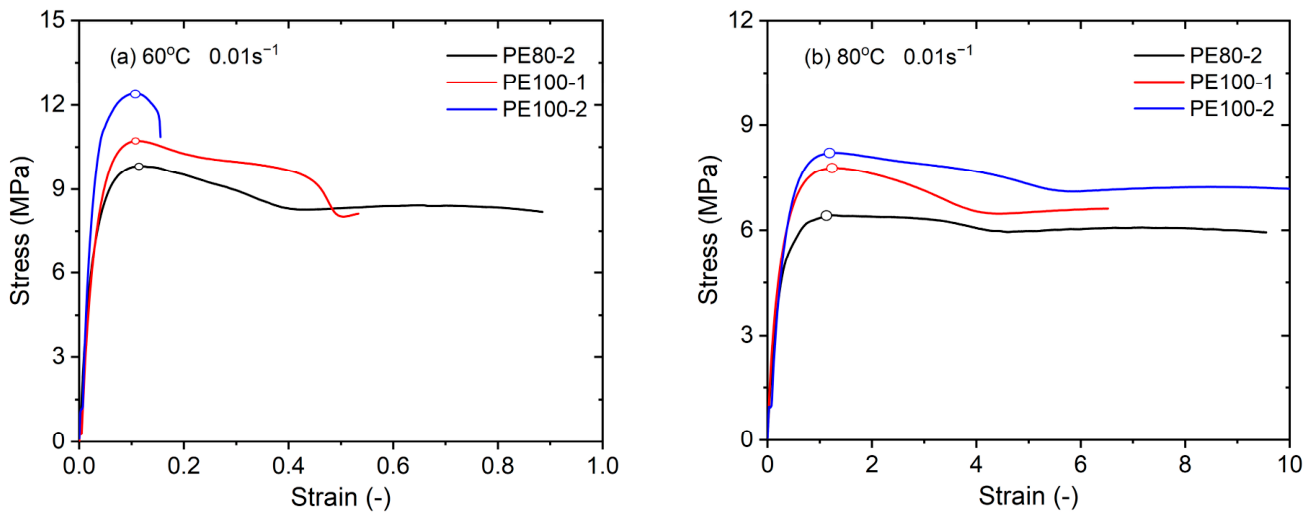
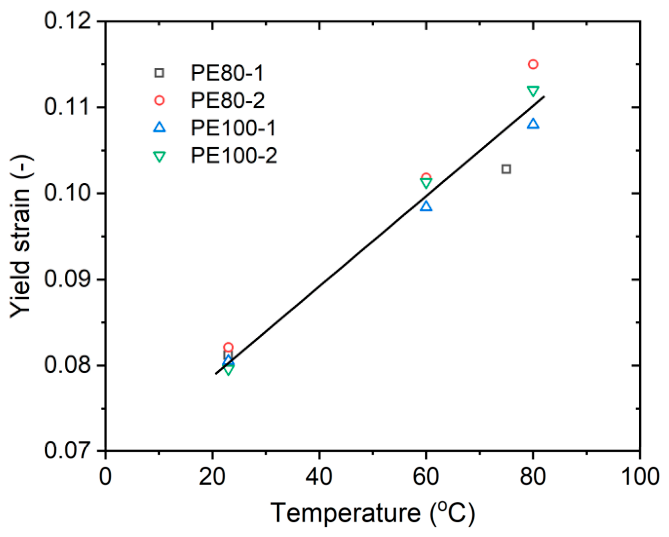
As shown in Figure 7a, the yield strain of all four PE materials remains nearly invariant over a wide range of strain rates at 23 °C. The average yield strain across repeated tests was adopted as the material-specific critical strain (εc). Notably, the yield strains of the four materials are very similar, all close to 8% at 23 °C. Figure 7b presents the mean values, as well as the upper and lower deviations, of the yield strain for each material within the tested strain rate range. At other temperatures (60 °C, 80 °C), similar experiments were conducted with a constant strain rate selected. When the curve crosses the yield point, the tests can be stopped after two minutes, as shown in Figure 8. Since the test temperature of the PE80-1 material is different from the other three, its results are not shown in the figure.
The relationships between the yield strain and temperature for the four PE pipe materials are presented in Figure 9. For all materials, the yield strain increases gradually with increasing temperature; it ranges from approximately 8% at 23 °C to 11% at 80 °C. It is well established that many semicrystalline polymers, including polyethylene, exhibit yield strains typically on the order of 10% under common testing conditions [43].
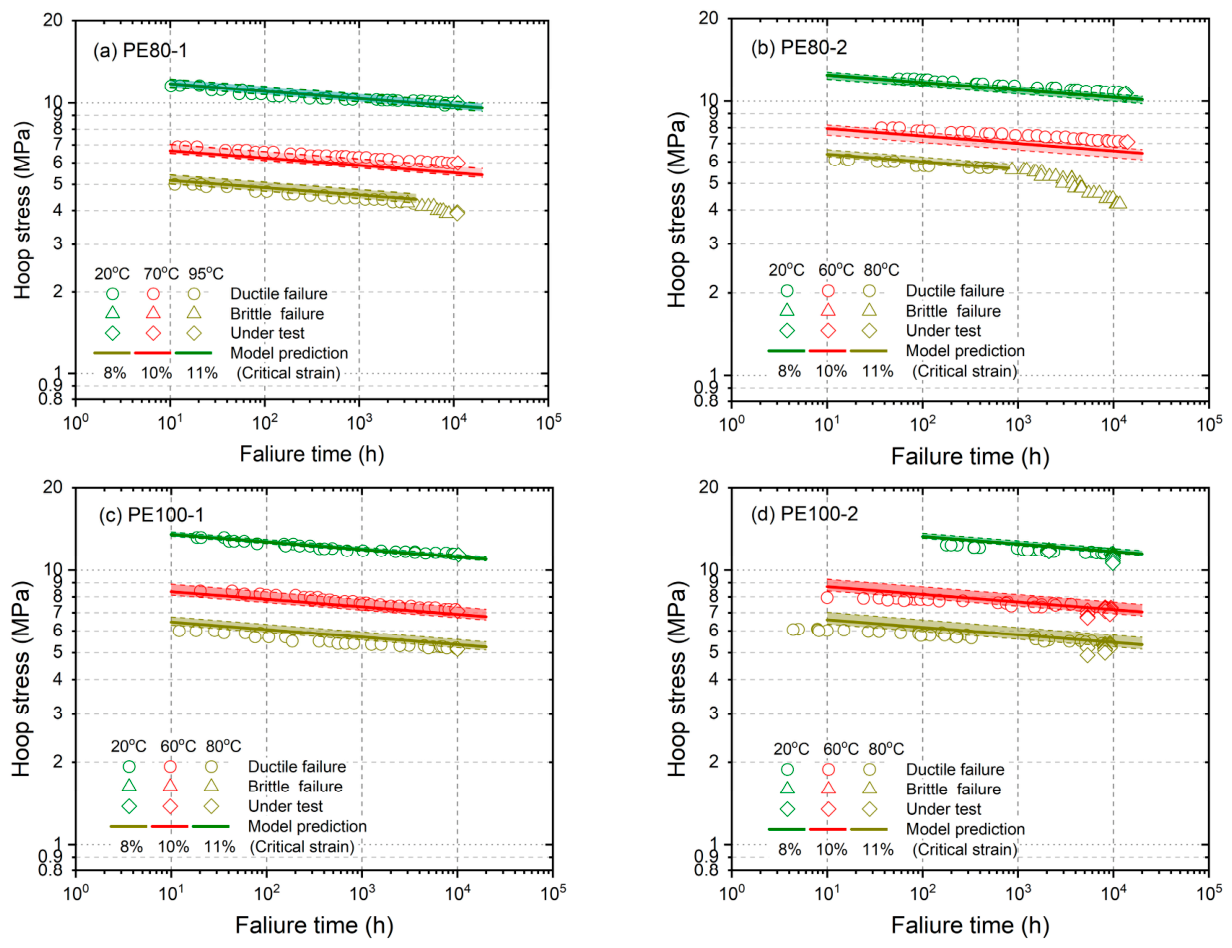
The creep lifetime prediction model presented in Equation (4) enables the calculation of the ductile failure time of PE pipes under various temperatures and hoop stress conditions. To evaluate the accuracy robustness of the proposed model, the predicted failure times were compared with the experimental failure data from the LTH tests conducted in accordance with ISO 9080, as illustrated in Figure 10. This comparative analysis covers a broad temperature range from 20 °C to 95 °C for the four tested PE pipe materials, thereby ensuring comprehensive validation of the model. The results demonstrate that the model predictions are generally consistent with the LTH test results across the entire tested temperature range for the ductile failure stage. The uncertainty bands in Figure 10 were derived by propagating the standard errors of fitted model parameters, combined with the scatter in experimentally determined ε c values.
Moreover, a comparison of the prediction results for different material grades indicates that the model exhibits a higher accuracy for PE100 than for PE80 material. This difference in the prediction accuracy can be attributed to two key factors: (1) The PE 100 pipe material possesses a more stable microstructure and more uniform creep deformation behavior, which aligns with the basic assumption of the critical strain criterion, and (2) Under the tested conditions, the PE100 pipes do not experience ductile-to-brittle transition, and all LTH test data correspond to pure ductile failure, which is consistent with model’s foundational assumption of predicting only ductile failure. In contrast, the PE80 pipe materials exhibited a ductile-to-brittle transition at elevated temperatures, with some LTH test data reflecting SCG-dominated quasi-brittle failure. This deviation from model’s assumptions likely contributes to the larger prediction errors observed for the PE80 pipe materials.

4.2. Model Limitations and Applicability

Despite the good agreement between predicted and experimental results, the proposed lifetime prediction approach has certain limitations that should be acknowledged in order to properly apply it. In the present study, uniaxial tensile creep data and the critical strain criterion are employed to predict the ductile failure lifetime of pressurized pipelines. However, the pipe wall under internal pressure exhibits a typical multiaxial stress state, where the hoop stress serves as the maximum principal stress. Based on the von Mises yield criterion and the reference stress method [15], the real equivalent creep stress in the pipe wall is approximately 3 /2 times the hoop stress. By directly using the hoop stress as the input for uniaxial creep calculation, the predicted creep deformation is slightly larger and the predicted lifetime is shorter than the actual response of the pipeline under the same hoop stress. Therefore, the current approach provides a conservative engineering approximation rather than a rigorous multiaxial failure analysis.
In addition, the present work only considers the temperature and stress dependence of creep behavior, without incorporating the long-term environmental effects that occur in practical service. Actual PE pressure pipelines are usually in service for several decades, during which, natural material aging and chemical corrosion by the transported gas or fluid can gradually deteriorate the microstructure and mechanical properties of the material. Such degradation will accelerate creep deformation and promote SCG, further reducing the service life of the pipelines.

5. Conclusions

On the basis of systematic experimental investigations and theoretical modeling of the creep behavior and ductile failure of PE80 and PE100 pipe materials, the following conclusions are drawn:
(1)
All the tested PE pipe materials exhibit nonlinear viscoelastic creep behavior, with no tertiary creep stage being observed during the test. The steady-state creep strain and creep rate significantly increase with increasing temperature and stress, and this trend is more pronounced in PE80 pipe materials than in PE100 pipe materials because of their lower crystallinity and weaker intermolecular interactions.
(2)
The time-hardening model effectively describes the primary and steady-state creep behaviors of PE pipe materials under different temperature and stress conditions and accurately correlates the failure time, applied stress, and temperature. The activation energy for creep deformation is greater for PE100 than for PE80, and compared with PE100, PE80 is more sensitive to stress. Deviations between the model predictions and experimental data are observed under high-temperature and high-stress conditions because of localized plastic yielding.
(3)
An efficient ductile failure lifetime prediction methodology for PE pipes was developed by integrating the time-hardening creep model with the critical strain criterion. The predicted failure times are in good agreement with the experimental LTH test data for the ductile failure stage, with a higher prediction accuracy being observed for PE100 than for PE80. This methodology is a rapid and reliable alternative to conventional LTH tests, but it is only applicable to ductile failure cases and cannot predict quasi-brittle or brittle failure.

Author Contributions

Conceptualization, W.L. and F.X.; methodology, W.L. and Y.T.; software, Y.T., J.L. and J.Y.; validation, Y.T., J.L. and J.Y.; formal analysis, J.L.; investigation, Y.T.; resources, W.L.; data curation, J.Y. and Y.T.; writing—original draft preparation, Y.T. and J.L.; writing—review and editing, W.L.; visualization, Y.T. and J.L.; funding acquisition, W.L. All authors have read and agreed to the published version of the manuscript.

Funding

This work was supported by the National Natural Science Foundation of China (Nos. 12472073, 12072308) and the Science and Technology Innovation Program of Hunan Province (No. 2024JK2041).

Institutional Review Board Statement

Not applicable.

Informed Consent Statement

Not applicable.

Data Availability Statement

The original data presented in the study are openly available from the cited sources.

Conflicts of Interest

The authors declare no conflicts of interest.

References

  1. Zha, S.; Lan, H.; Huang, H. Review on lifetime predictions of polyethylene pipes: Limitations and trends. Int. J. Press. Vessel. Pip. 2022, 198, 104663. [Google Scholar] [CrossRef]
  2. Pan, Y.; Gao, X.; Lei, J.; Li, Z.; Shen, K. Effect of different morphologies on the creep behavior of high-density polyethylene. RSC Adv. 2016, 6, 3470–3479. [Google Scholar] [CrossRef]
  3. Khelif, R.; Chateauneuf, A.; Chaoui, K. Reliability-based assessment of polyethylene pipe creep lifetime. Int. J. Press. Vessel. Pip. 2007, 84, 697–707. [Google Scholar] [CrossRef]
  4. Amjadi, M.; Fatemi, A. Creep behavior and modeling of high-density polyethylene (HDPE). Polym. Test. 2021, 94, 107031. [Google Scholar] [CrossRef]
  5. Nezbedova, E.; Zahradnickova, A.; Salajka, Z. Brittle failure versus structure of HDPE pipe resins. J. Macromol. Sci. Part B 2001, 40, 507–515. [Google Scholar] [CrossRef]
  6. Byrne, N.; De Silva, R.; Hilditch, T. Linking antioxidant depletion with material properties for polyethylene pipes resins. Polym. Eng. Sci. 2020, 60, 323–329. [Google Scholar] [CrossRef]
  7. Zhang, Y.; Xiang, A.; Lu, X.; Zhou, H.; Yin, D.; Tian, H. Research on slow crack growth resistance of polyethylene pipe based on strain hardening modulus. J. Vinyl Addit. Technol. 2022, 28, 226–234. [Google Scholar] [CrossRef]
  8. Luo, W.B.; Liu, Y.P.; Yin, B.Y.; Li, Y.; Liu, X. Creep lifetime assessment of pressure-tight PE100 pipes based on a slow fatigue crack growth. Strength Mater. 2018, 50, 781–787. [Google Scholar] [CrossRef]
  9. Frank, A.; Pinter, G.; Lang, R.W. Prediction of the remaining lifetime of polyethylene pipes after up to 30 years in use. Polym. Test. 2009, 28, 737–745. [Google Scholar] [CrossRef]
  10. Erdogan, F. Ductile fracture theories for pressurized pipes and containers. Int. J. Press. Vessel. Pip. 1976, 4, 253–283. [Google Scholar] [CrossRef]
  11. Munier, C.; Gaillard-Devaux, E.; Tcharkhtchi, A.; Verdu, J. Durability of cross-linked polyethylene pipes under pressure. J. Mater. Sci. 2002, 37, 4159–4163. [Google Scholar] [CrossRef]
  12. Hsuan, Y.G.; Koerner, R.M. Antioxidant depletion lifetime in high density polyethylene geomembranes. J. Geotech. Geoenvironmental Eng. 1998, 124, 532–541. [Google Scholar] [CrossRef]
  13. Jar, P.B. Revisiting creep test on polyethylene pipe—Data analysis and deformation mechanisms. Polym. Eng. Sci. 2021, 61, 586–599. [Google Scholar] [CrossRef]
  14. Kanters, M.J.W.; Remerie, K.; Govaert, L.E. A new protocol for accelerated screening of long-term plasticity-controlled failure of polyethylene pipe grades. Polym. Eng. Sci. 2016, 56, 676–688. [Google Scholar] [CrossRef]
  15. Vakili-Tahami, F.; Adibeig, M.R. Using developed creep constitutive model for optimum de sign of HDPE pipes. Polym. Test. 2017, 63, 392–397. [Google Scholar] [CrossRef]
  16. Drozdov, A.D.; Jermiin, R.H.; De Claville Christiansen, J. Lifetime predictions for high-density polyethylene under creep: Experiments and modeling. Polymers 2023, 15, 334. [Google Scholar] [CrossRef]
  17. Mao, Q.; Su, B.; Ma, R.; Li, Z. Investigation of tensile creep behavior for high-density polyethylene (HDPE) via experiments and mathematical model. Materials 2021, 14, 6188. [Google Scholar] [CrossRef] [PubMed]
  18. Wood-Adams, P.M.; Dealy, J.M.; deGroot, A.W.; Redwine, O.D. Effect of molecular structure on the linear viscoelastic behavior of polyethylene. Macromolecules 2000, 33, 7489–7499. [Google Scholar] [CrossRef]
  19. Drozdov, A.D.; deClaville Christiansen, J. Model for the viscoelastic and viscoplastic responses of semicrystalline polymers. J. Appl. Polym. Sci. 2003, 88, 1438–1450. [Google Scholar] [CrossRef]
  20. Liu, J.; Luo, W.; Yang, C.; Tang, Y.; Yan, J. An investigation on slow crack growth resistance of polyethylene based on strain hardening test. J. Vinyl Addit. Technol. 2026, 70087. [Google Scholar] [CrossRef]
  21. Yan, J.; Liu, J.; Yang, C.; Tang, Y.; Luo, W. Modeling the temperature-dependent nonlinear stress relaxation of buried polyethylene pipe materials. Constr. Build. Mater. 2025, 482, 141736. [Google Scholar] [CrossRef]
  22. ISO 527-2; Plastics—Determination of Tensile Properties—Part 2: Test Conditions for Moulding and Extrusion Plastics. International Organization for Standardization (ISO): Geneva, Switzerland, 2025.
  23. ISO 9080:2012; Plastics Piping and Ducting Systems-Determination of the Long-term Hydro static Strength of Thermoplastics Materials in Pipe Form by Extrapolation. ISO: Geneva, Switzerland, 2012.
  24. Das, S.; Dhar, A.S. Nonlinear time-dependent mechanical behavior of medium-density poly ethylene pipe material. J. Mater. Civ. Eng. 2021, 33, 04021068. [Google Scholar] [CrossRef]
  25. Behjat, Y. Relationship Between Short-Term and Long-Term Creep, and the Molecular Structure of Polyethylene. Master’s Thesis, University of Waterloo, Waterloo, ON, Canada, 2009. [Google Scholar]
  26. Bowman, A.L.; Mun, S.; Nouranian, S.; Huddleston, B.D.; Gwaltney, S.R.; Baskes, M.I. Free volume and internal structural evolution during creep in model amorphous polyethylene by molecular dynamics simulations. Polymer 2019, 170, 85–100. [Google Scholar] [CrossRef]
  27. Zhou, H.; Wilkes, G.L. Creep behavior of high-density polyethylene films having well-defined morphologies of stacked lamellae with and without an observable row-nucleated fibril structure. Polymer 1998, 39, 3597–3609. [Google Scholar] [CrossRef]
  28. Lai, J.; Bakker, A. Analysis of the non-linear creep of high-density polyethylene. Polymer 1995, 36, 93–99. [Google Scholar] [CrossRef]
  29. Tan, N.; Ben Jar, P.Y. Reanalysis of the creep test data and failure behavior of polyethylene and its copolymers. J. Mater. Eng. Perform. 2022, 31, 2182–2219. [Google Scholar] [CrossRef]
  30. Findley, W.N.; Khosla, G. Application of the superposition principle and theories of mechanical equation of state, strain, and time hardening to creep of plastics under changing loads. J. Appl. Phys. 1955, 26, 821–832. [Google Scholar] [CrossRef]
  31. Plaseied, A.; Fatemi, A. Tensile creep and deformation modeling of vinyl ester polymer and its nanocomposite. J. Reinf. Plast. Compos. 2009, 28, 1775–1788. [Google Scholar] [CrossRef]
  32. Kouadri-Boudjelthia, A.; Imad, A.; Bouabdallah, A.; Elmeguenni, M. Analysis of the effect of temperature on the creep parameters of composite material. Mater. Des. 2009, 30, 1569–1574. [Google Scholar] [CrossRef]
  33. Brown, N.; Donofrio, J.; Lu, X. The transition between ductile and slow-crack-growth failure in polyethylene. Polymer 1987, 28, 1326–1330. [Google Scholar] [CrossRef]
  34. Lustiger, A.; Markham, R.L. Importance of tie molecules in preventing polyethylene fracture under long-term loading conditions. Polymer 1983, 24, 1647–1654. [Google Scholar] [CrossRef]
  35. Tränkner, T.; Hedenqvist, M.; Gedde, U.W. Structure and crack growth in gas pipes of medium-density and high-density polyethylene. Polym. Eng. Sci. 1996, 36, 2069–2076. [Google Scholar] [CrossRef]
  36. Contino, M.; Andena, L.; Rink, M. Environmental stress cracking of high-density polyethylene under plane stress conditions. Eng. Fract. Mech. 2021, 241, 107422. [Google Scholar] [CrossRef]
  37. Schilling, M.; Niebergall, U.; Böhning, M. Full notch creep test (FNCT) of PE-HD—Characterization and differentiation of brittle and ductile fracture behavior during environmental stress cracking (ESC). Polym. Test. 2017, 64, 156–166. [Google Scholar] [CrossRef]
  38. Nasiri, S.; Khosravani, M.R. Failure and fracture in polyethylene pipes: Overview, prediction methods, and challenges. Eng. Fail. Anal. 2023, 152, 107496. [Google Scholar] [CrossRef]
  39. Crissman, J.M.; McKenna, G.B. Relating creep and creep rupture in PMMA using a reduced variable approach. J. Polym. Sci. Part B Polym. Phys. 1987, 25, 1667–1677. [Google Scholar] [CrossRef]
  40. Crissman, J.M.; Zapas, L.J. Creep failure and fracture of polyethylene in uniaxial extension. Polym. Eng. Sci. 1979, 19, 99–103. [Google Scholar] [CrossRef]
  41. Cooney, J.L. Effect of morphology on biaxial stress rupture of polyethylene. J. Appl. Polym. Sci. 1964, 8, 1889–1901. [Google Scholar] [CrossRef]
  42. Taherzadehboroujeni, M.; Kalhor, R.; Fahs, G.B.; Moore, R.B.; Case, S.W. Accelerated testing method to estimate the long-term hydrostatic strength of semi-crystalline plastic pipes. Polym. Eng. Sci. 2020, 60, 879–888. [Google Scholar] [CrossRef]
  43. Hin, T.S.; Cherry, B.W. Creep rupture of a linear polyethylene: 1. Rupture and pre-rupture phenomena. Polymer 1984, 25, 727–734. [Google Scholar] [CrossRef]
Figure 1. Schematic illustration of the creep rupture failure behavior of polyethylene (PE) pipes across different stress levels. Stage I: ductile failure; Stage II: quasi-brittle failure; Stage III: brittle failure.
Applsci 16 05414 g001
Figure 2. Polyethylene pipe segments for specimen preparation and type 1B specimens.
Applsci 16 05414 g002
Figure 3. Creep curves of PE80 pipe materials under various temperature and stress conditions.
Applsci 16 05414 g003
Figure 4. Creep curves of PE100 pipe materials under various temperature and stress conditions.
Applsci 16 05414 g004
Figure 5. LTH test data of four PE pipes.
Applsci 16 05414 g005
Figure 6. Tensile stress-strain curves of the PE pipe materials at different strain rates (23 °C).
Applsci 16 05414 g006
Figure 7. (a) Variation of yield strain with strain rate; (b) Yield strains of the four PE pipe materials at 23 °C.
Applsci 16 05414 g007
Figure 8. Tensile stress-strain curves of the PE pipe materials at 60 °C and 80 °C.
Applsci 16 05414 g008
Figure 9. Relationships between the yield strain and temperature for the tested PE pipe materials.
Applsci 16 05414 g009
Figure 10. Comparison between the creep lifetime model predictions and LTH test results for the tested PE pipe materials.
Applsci 16 05414 g010
Table 1. Essential properties of the PE pipe materials used in this study.
Materialρ
(kg·m−3)
Mn
(kg·mol−1)
Mw
(kg·mol−1)
PDISCB (/1000 C)χc σ L P L
(MPa)
PE80-193714.5333.923.15.50.4299.02
PE80-294311.5262.222.72.30.4939.96
PE100-19607.9261.533.23.00.50910.36
PE100-29607.9284.135.82.50.51410.83
Table 2. Experimental program for hydrostatic testing of the four polyethylene (PE) pipe materials.
MaterialTemperature (°C)Hoop Stress Range (MPa)Maximum Testing Duration (h)
PE80-120, 70, 952.5–7.010,796
PE80-220, 60, 804.0–12.013,167
PE100-120, 60, 805.0–12.510,025
PE100-220, 60, 805.0–13.09864
Table 3. Creep model parameters for the PE pipe materials.
MaterialA0Ea (kJ·mol−1)mn
PE80-16.2 ± 0.31622.0 ± 1.2451.85 ± 0.0140.05 ± 0.0062
PE80-26.1 ± 0.28422.1 ± 1.1831.83 ± 0.0160.05 ± 0.0058
PE100-16.0 ± 0.35222.3 ± 1.3171.81 ± 0.0110.05 ± 0.0071
PE100-25.9 ± 0.26922.4 ± 1.0961.80 ± 0.0180.05 ± 0.0049
Disclaimer/Publisher’s Note: The statements, opinions and data contained in all publications are solely those of the individual author(s) and contributor(s) and not of MDPI and/or the editor(s). MDPI and/or the editor(s) disclaim responsibility for any injury to people or property resulting from any ideas, methods, instructions or products referred to in the content.