1. Introduction
The ongoing transition toward low-carbon and highly electrified energy systems is reshaping the architecture and operation of distribution networks. The rapid growth of distributed photovoltaic (PV) generation, battery energy storage systems (BESS), electric mobility, and electronically interfaced end-use devices is progressively challenging the adequacy of conventional AC-only distribution infrastructures, particularly in terms of conversion efficiency, operational flexibility, and coordinated control under variable operating conditions. In this context, hybrid AC/DC distribution systems have emerged as a promising paradigm because they can simultaneously accommodate AC-native and DC-native resources and loads while reducing unnecessary power conversion stages and enabling more direct integration of converter-dominated assets [
1,
2,
3,
4].
Compared with conventional AC-only distribution architectures, hybrid AC/DC systems offer several recognized advantages. These include improved integration of distributed renewable energy resources, more efficient interfacing of battery storage and electric vehicle charging infrastructure, reduced conversion losses for DC-native loads, and enhanced flexibility in multi-bus power management. These advantages become especially relevant in modern low-voltage and medium-voltage distribution contexts, where the proliferation of power electronic converters is simultaneously increasing controllability and introducing new coupling mechanisms between electrical subsystems [
1,
5,
6,
7].
However, the same features that make hybrid AC/DC distribution systems attractive also make them significantly more complex to analyze and operate. The coexistence of AC and DC buses, bidirectional interlinking converters, converter-interfaced distributed generation, storage systems, and heterogeneous load compositions creates a highly coupled multi-timescale environment in which local disturbances can propagate across subsystem boundaries. Renewable intermittency, abrupt load changes, converter operating-point shifts, and variations in the renewable penetration level can simultaneously affect DC-bus voltage regulation, AC-side voltage-quality-related behavior, power-sharing behavior, and converter loading. As a result, stability-oriented behavior and voltage-quality-related performance can no longer be treated as loosely connected secondary concerns; rather, they become closely coupled performance dimensions in the planning and operation of future hybrid distribution networks [
1,
2,
8,
9]. In the present work, the term voltage-quality-related performance is used in a reduced-order comparative sense, referring primarily to voltage deviation, overshoot, violation duration, and transient fluctuation indicators, rather than to a complete harmonic, flicker, unbalance, or standards-based power-quality assessment.
A substantial body of literature has addressed the topology, control, energy management, and protection of hybrid AC/DC microgrids and hybrid distribution systems. Recent review articles have synthesized advances in coordinated control, hierarchical management, interlinking converter strategies, and protection schemes, confirming the maturity of the field and its growing practical relevance [
1,
2,
3,
4]. At the same time, a number of application-oriented studies have proposed coordinated control strategies, optimal power-flow formulations, power-quality improvement methods, and energy-management frameworks for specific operating contexts such as islanded microgrids, building-integrated systems, EV charging environments, and multi-energy architectures [
10,
11,
12,
13].
Despite these advances, two important limitations remain visible in the recent literature. First, many studies emphasize either control/energy management performance or stability-related behavior, but do not explicitly integrate voltage-quality-related indicators into the comparative assessment in a unified and systematic manner. Second, although hybrid AC/DC architectures are inherently coupled through interlinking converters, many analyses still focus predominantly on one side of the system (e.g., DC-bus regulation, AC frequency/voltage support, or scheduling cost) rather than explicitly examining how disturbances and control actions propagate across the AC/DC interface under different renewable penetration levels and operating stresses. This gap becomes increasingly relevant in converter-dominated distribution systems, where inter-subsystem coupling can amplify or redistribute disturbances, including voltage deviations, transient fluctuations, ripple-related effects, and converter stress [
2,
3,
8,
9,
14]. Although detailed harmonic-domain and electromagnetic-transient analyses are essential for final design and compliance verification, reduced-order voltage-dynamics studies remain useful for early-stage comparative screening, operating-region identification, and control-strategy ranking.
In particular, recent work has highlighted that the interlinking converter is not merely a power-transfer element but a critical dynamic mediator between the AC and DC subsystems. Its control policy directly influences voltage support, power sharing, and disturbance propagation. Consequently, a strategy that improves DC-side regulation may not necessarily preserve AC-side voltage-quality-related behavior to the same extent, and vice versa. This motivates the need for comparative assessment frameworks that go beyond nominal-condition performance and explicitly characterize trade-offs between stability-oriented and voltage-quality-related objectives under multiple operating scenarios [
8,
9,
15,
16].
Against this background, this paper proposes a reduced-order comparative screening framework for hybrid AC/DC distribution systems with high renewable penetration under variable operating conditions, using stability- and voltage-quality-related indicators. The study considers a representative hybrid AC/DC architecture integrating distributed PV generation, battery energy storage, and mixed AC/DC loads. A set of structured operating scenarios is then examined, including renewable generation reduction events, AC-side load disturbances, DC-side load disturbances, and combined-stress conditions. The analysis compares multiple converter coordination strategies and evaluates system behavior using both steady-state and transient indicators, including bus voltage deviations, overshoot-related measures, fluctuation metrics, converter utilization/stress, and voltage-violation durations. The proposed framework is therefore intended as a reproducible system-level screening tool, not as a replacement for feeder-specific power-flow studies, switching-level converter models, electromagnetic-transient simulations, or standards-oriented power-quality certification.
The main contribution of this work is not the proposal of a highly specialized converter controller per se, but rather the development of a unified comparative methodology capable of revealing how renewable penetration level and converter coordination policy jointly shape system behavior across both the AC and DC domains. In this sense, the paper aims to provide practical insights for distribution-level design and operation by identifying (i) which operating scenarios are most critical, (ii) which coordination strategies offer the best overall compromise, and (iii) whether improved DC-side robustness is obtained at the expense of AC-side voltage-quality-related performance. This positioning is intentionally focused on comparative operating trends and control-dependent trade-offs within a representative reduced-order benchmark, while higher-fidelity validation is identified as a necessary direction for subsequent work.
To guide the analysis, the study is structured around the following research questions:
RQ1: How does increasing renewable penetration affect the stability and voltage-quality-related behavior of a representative hybrid AC/DC distribution system under variable operating conditions?
RQ2: How do different converter coordination strategies compare in terms of DC-side voltage regulation, AC-side voltage-quality-related performance, and converter stress under renewable intermittency and load disturbances?
RQ3: Do critical operating regions emerge in which improved DC-side stability is accompanied by measurable degradation in AC-side voltage-quality-related indicators?
Accordingly, the principal contributions of the paper can be summarized as follows:
A representative hybrid AC/DC assessment architecture integrating distributed PV generation, battery storage, and mixed AC/DC loads under variable operating conditions;
A structured scenario-based evaluation framework covering renewable intermittency, AC-side and DC-side load disturbances, and combined-stress conditions across multiple renewable penetration levels;
A unified set of stability- and voltage-quality-related performance indicators, including voltage deviation, overshoot, fluctuation, violation-duration, and converter stress metrics, interpreted as reduced-order voltage-dynamics proxies rather than complete power-quality compliance indices;
A comparative analysis of converter coordination strategies, highlighting performance trade-offs between DC-side robustness and AC-side voltage-quality-related behavior;
Practical operating insights for the planning and operation of future hybrid AC/DC distribution systems with high penetration of converter-interfaced renewable resources, together with a clear identification of the modeling limits that should be addressed through higher-fidelity future studies.
The remainder of this paper is organized as follows.
Section 2 reviews the relevant literature and clarifies the research gap addressed in this study.
Section 3 presents the considered hybrid AC/DC distribution architecture and the modeling assumptions.
Section 4 defines the scenario-based assessment framework and the adopted performance indicators.
Section 5 describes the compared converter coordination strategies and simulation settings.
Section 6 presents and discusses the results. Finally,
Section 7 concludes the paper and outlines directions for future work.
2. Related Work and Research Gap
2.1. Hybrid AC/DC Distribution Systems and Microgrids: From Topology to Coordinated Operation
Hybrid AC/DC electrical architectures have progressively evolved from a specialized microgrid concept into a broader and increasingly relevant paradigm for modern distribution-level systems. Their growing importance is strongly linked to the rapid expansion of converter-interfaced renewable generation, battery energy storage, electric vehicle charging infrastructure, and DC-native end-use devices, which together challenge the efficiency and operational adequacy of purely AC-based networks. In response, hybrid AC/DC systems have been widely recognized as an effective means of reducing unnecessary conversion stages, increasing architectural flexibility, and enabling more direct integration of heterogeneous distributed energy resources and loads [
2,
3,
8,
17].
The literature on hybrid AC/DC systems has matured considerably over the past decade. Foundational review works established the main topological classifications and control paradigms, distinguishing radial, interconnected, and hierarchical configurations, as well as centralized, decentralized, and distributed coordination approaches. In particular, the two-part review by Unamuno and Barrena remains a key reference for the classification of hybrid AC/DC microgrid topologies and control strategies, while earlier work such as Ding et al. highlighted the central role of coordinated converter control in islanded hybrid operation [
7,
17].
More recent review papers have substantially expanded this perspective. Recent syntheses have examined interlinking converter control, hierarchical coordination, stability issues, protection, and planning challenges, confirming that hybrid AC/DC systems are now treated not only as isolated microgrids but increasingly as representative building blocks of future distribution networks. In particular, recent reviews in Electric Power Systems Research, Renewable Energy Focus, International Journal of Electrical Power & Energy Systems, and IEEE Access show that coordinated operation of the interlinking converter remains one of the most intensively studied and practically consequential topics in the field [
2,
3,
8].
From the perspective of this study, one implication of this body of work is especially relevant: the interlinking converter is not a neutral power-transfer element, but rather a dynamic coupling interface that directly influences the interaction between AC-side and DC-side states. This point is crucial because it implies that disturbance propagation, voltage support, and power-sharing behavior must be analyzed across both subsystems rather than in isolation.
2.2. Converter Coordination, Interlinking Control, and System-Level Performance
A large share of the literature has focused on the control of the interlinking converter and on coordination schemes that regulate power exchange between AC and DC subsystems. Existing approaches include fixed-reference power exchange, droop-based schemes, decentralized control, distributed secondary control, and more advanced coordinated or adaptive strategies. These methods have been studied under both grid-connected and islanded conditions, often with the objective of improving power sharing, maintaining DC-bus voltage, supporting AC frequency or voltage, and enhancing overall operational resilience [
2,
3,
8,
17].
Recent review work has made it clear that the choice of interlinking converter control has strong implications for the behavior of the entire hybrid system. The 2022 review in International Journal of Electrical Power & Energy Systems specifically emphasizes that bidirectional interlink power converter control is central to the practical realization of hybrid AC/DC microgrids and that different control strategies satisfy different and sometimes conflicting objectives [
8]. Likewise, the 2024 systematic review in Renewable Energy Focus explicitly compares coordinated control strategies under multiple objectives and discusses the need for robust control schemes that remain effective under variable operating conditions [
3].
This is particularly relevant in converter-dominated systems with high renewable penetration. Under such conditions, the operating point of the interlinking converter can shift rapidly due to renewable intermittency, load changes, storage dispatch, or supervisory coordination decisions. As a result, the converter is simultaneously asked to satisfy local regulation goals and system-level balancing objectives. This creates the possibility of control-induced trade-offs, especially when improving support on one side of the hybrid architecture (e.g., DC-bus regulation) leads to more intrusive behavior on the other side (e.g., AC-side voltage-quality-related disturbance).
Several application-oriented studies reinforce this point. Recent works have addressed coordinated control of PV–wind–battery hybrid microgrids under variable generation and load conditions, improved power-quality strategies using parallel-operated interlinking converters, modified interlinking converter topologies for storage-aware power management, and frequency-security-aware energy management in hybrid AC/DC systems. These studies confirm the importance of converter coordination, but they also tend to focus on specific operational objectives or particular architectures, rather than providing a unified scenario-based comparison of multiple coordination policies across a broad set of stress conditions.
2.3. Stability-Oriented Studies and the Need for Coupled AC/DC Assessment
Stability has long been a central topic in microgrid research, but the way it is treated in hybrid AC/DC systems is often fragmented. Classical and influential works on DC microgrids, such as the review by Dragicevic et al., established the importance of coordinated control and stabilization techniques for converter-dominated systems, especially under tightly coupled and low-inertia conditions. Although this literature is highly relevant, it mainly addresses DC-side control and stabilization principles rather than explicitly examining hybrid AC/DC interaction effects [
18].
In the hybrid AC/DC literature itself, recent review work has explicitly highlighted stability as a major concern. For example, the 2023 Electric Power Systems Research review identifies voltage and frequency stability, mode transitions, coordinated control between multiple interlinking converters, and energy storage interactions as recurring challenges across hybrid microgrid architectures. This is a strong indication that stability can no longer be viewed as a purely local control issue; instead, it emerges from the coordinated behavior of multiple converters and subsystems under changing operating conditions [
2].
At the same time, many studies still assess stability primarily through one dominant lens:
While all of these are valuable, they often do not explicitly examine how disturbances propagate across the AC/DC interface under different renewable penetration levels and multiple disturbance types. In practical distribution-level hybrid systems, however, this coupling is fundamental. A DC-side renewable drop can trigger altered interlinking converter dispatch and thereby affect AC-side voltage support; conversely, an AC-side load disturbance can change interlinking converter power transfer and degrade DC-bus regulation. This bidirectional coupling is precisely what motivates a scenario-based, cross-domain assessment framework rather than a single-domain performance evaluation.
A recent example aligned with this need is the Energies paper on voltage stability assessment of AC/DC hybrid microgrids, which reinforces the importance of voltage-oriented analysis in hybrid configurations and supports the view that hybrid systems require dedicated assessment methods rather than direct extrapolation from AC-only or DC-only frameworks [
19].
2.4. Power Quality, Voltage-Quality-Related Indicators, and Underexplored Trade-Offs
Compared with topology, control, and energy management, power quality remains comparatively underrepresented in many hybrid AC/DC assessment studies—especially when treated jointly with stability-oriented metrics. This is somewhat surprising, because hybrid AC/DC systems are inherently converter-rich and therefore particularly sensitive to voltage deviations, transient fluctuations, ripple-related effects, converter-induced interactions, and nontrivial disturbance propagation between buses. Even when detailed harmonic analysis is outside the scope of a given study, voltage-quality-related behavior remains an essential performance dimension in converter-dominated distribution systems.
Some recent works do address this gap, particularly those focused on power-quality improvement through interlinking converter strategies or on converter-rich hybrid architectures in buildings and advanced distribution contexts. These studies support the view that power quality should not be treated as a secondary or purely downstream concern, but rather as a co-equal design and operational objective alongside stability and power sharing. Nevertheless, much of the literature still evaluates power quality either in a narrow task-specific way (e.g., for one converter topology or one islanded operating mode) or without integrating it into a broader multi-scenario comparative framework [
9,
20].
What remains relatively underexplored, and is particularly relevant to this paper, is the explicit characterization of trade-offs between:
improved DC-side voltage regulation and disturbance rejection;
preserved AC-side voltage-quality-related behavior;
and the resulting converter utilization or stress.
In other words, the literature contains many examples of strategies that improve one part of the hybrid system, but fewer studies that systematically show whether these gains are accompanied by costs elsewhere in the architecture. This is precisely the type of system-level trade-off that becomes operationally relevant in distribution settings with high renewable penetration and strongly variable conditions.
2.5. Research Gap and Positioning of the Present Study
Based on the above discussion, the current literature clearly demonstrates that hybrid AC/DC systems are a mature and important research area, and that coordinated converter control—especially interlinking converter control—is central to their practical operation. However, the literature also reveals a persistent gap at the intersection of stability, power quality, and scenario-based cross-domain comparison:
More specifically, the following limitations remain visible: Fragmented performance evaluation: many studies prioritize either control effectiveness, energy management, or stability in a relatively narrow sense, without systematically integrating voltage-quality-related indicators into the same comparative framework.
Limited cross-domain disturbance analysis: despite the inherently coupled nature of hybrid AC/DC architectures, many analyses still emphasize either the AC side or the DC side rather than explicitly assessing bidirectional disturbance propagation across the interlinking interface.
Insufficient operating-region awareness: relatively few studies compare multiple renewable penetration levels and multiple stress scenarios in a structured way to identify critical operating regions.
Underexplored trade-offs: the literature provides fewer unified comparisons showing whether stronger DC-side regulation may come at the expense of AC-side voltage-quality-related performance or increased converter stress.
The present study is positioned precisely in this gap. Rather than proposing a highly specialized converter controller for one narrow application, it develops a stability- and power-quality-oriented comparative assessment framework for a representative hybrid AC/DC distribution system with high renewable penetration. The emphasis is on structured scenario analysis, cross-domain performance indicators, and explicit comparison of converter coordination strategies under variable operating conditions. In this way, the study complements existing control- and energy-management-oriented literature by shifting the focus toward operational robustness, critical operating regions, and AC/DC performance trade-offs.
3. System Architecture and Modeling Assumptions
3.1. Representative Hybrid AC/DC Distribution Architecture
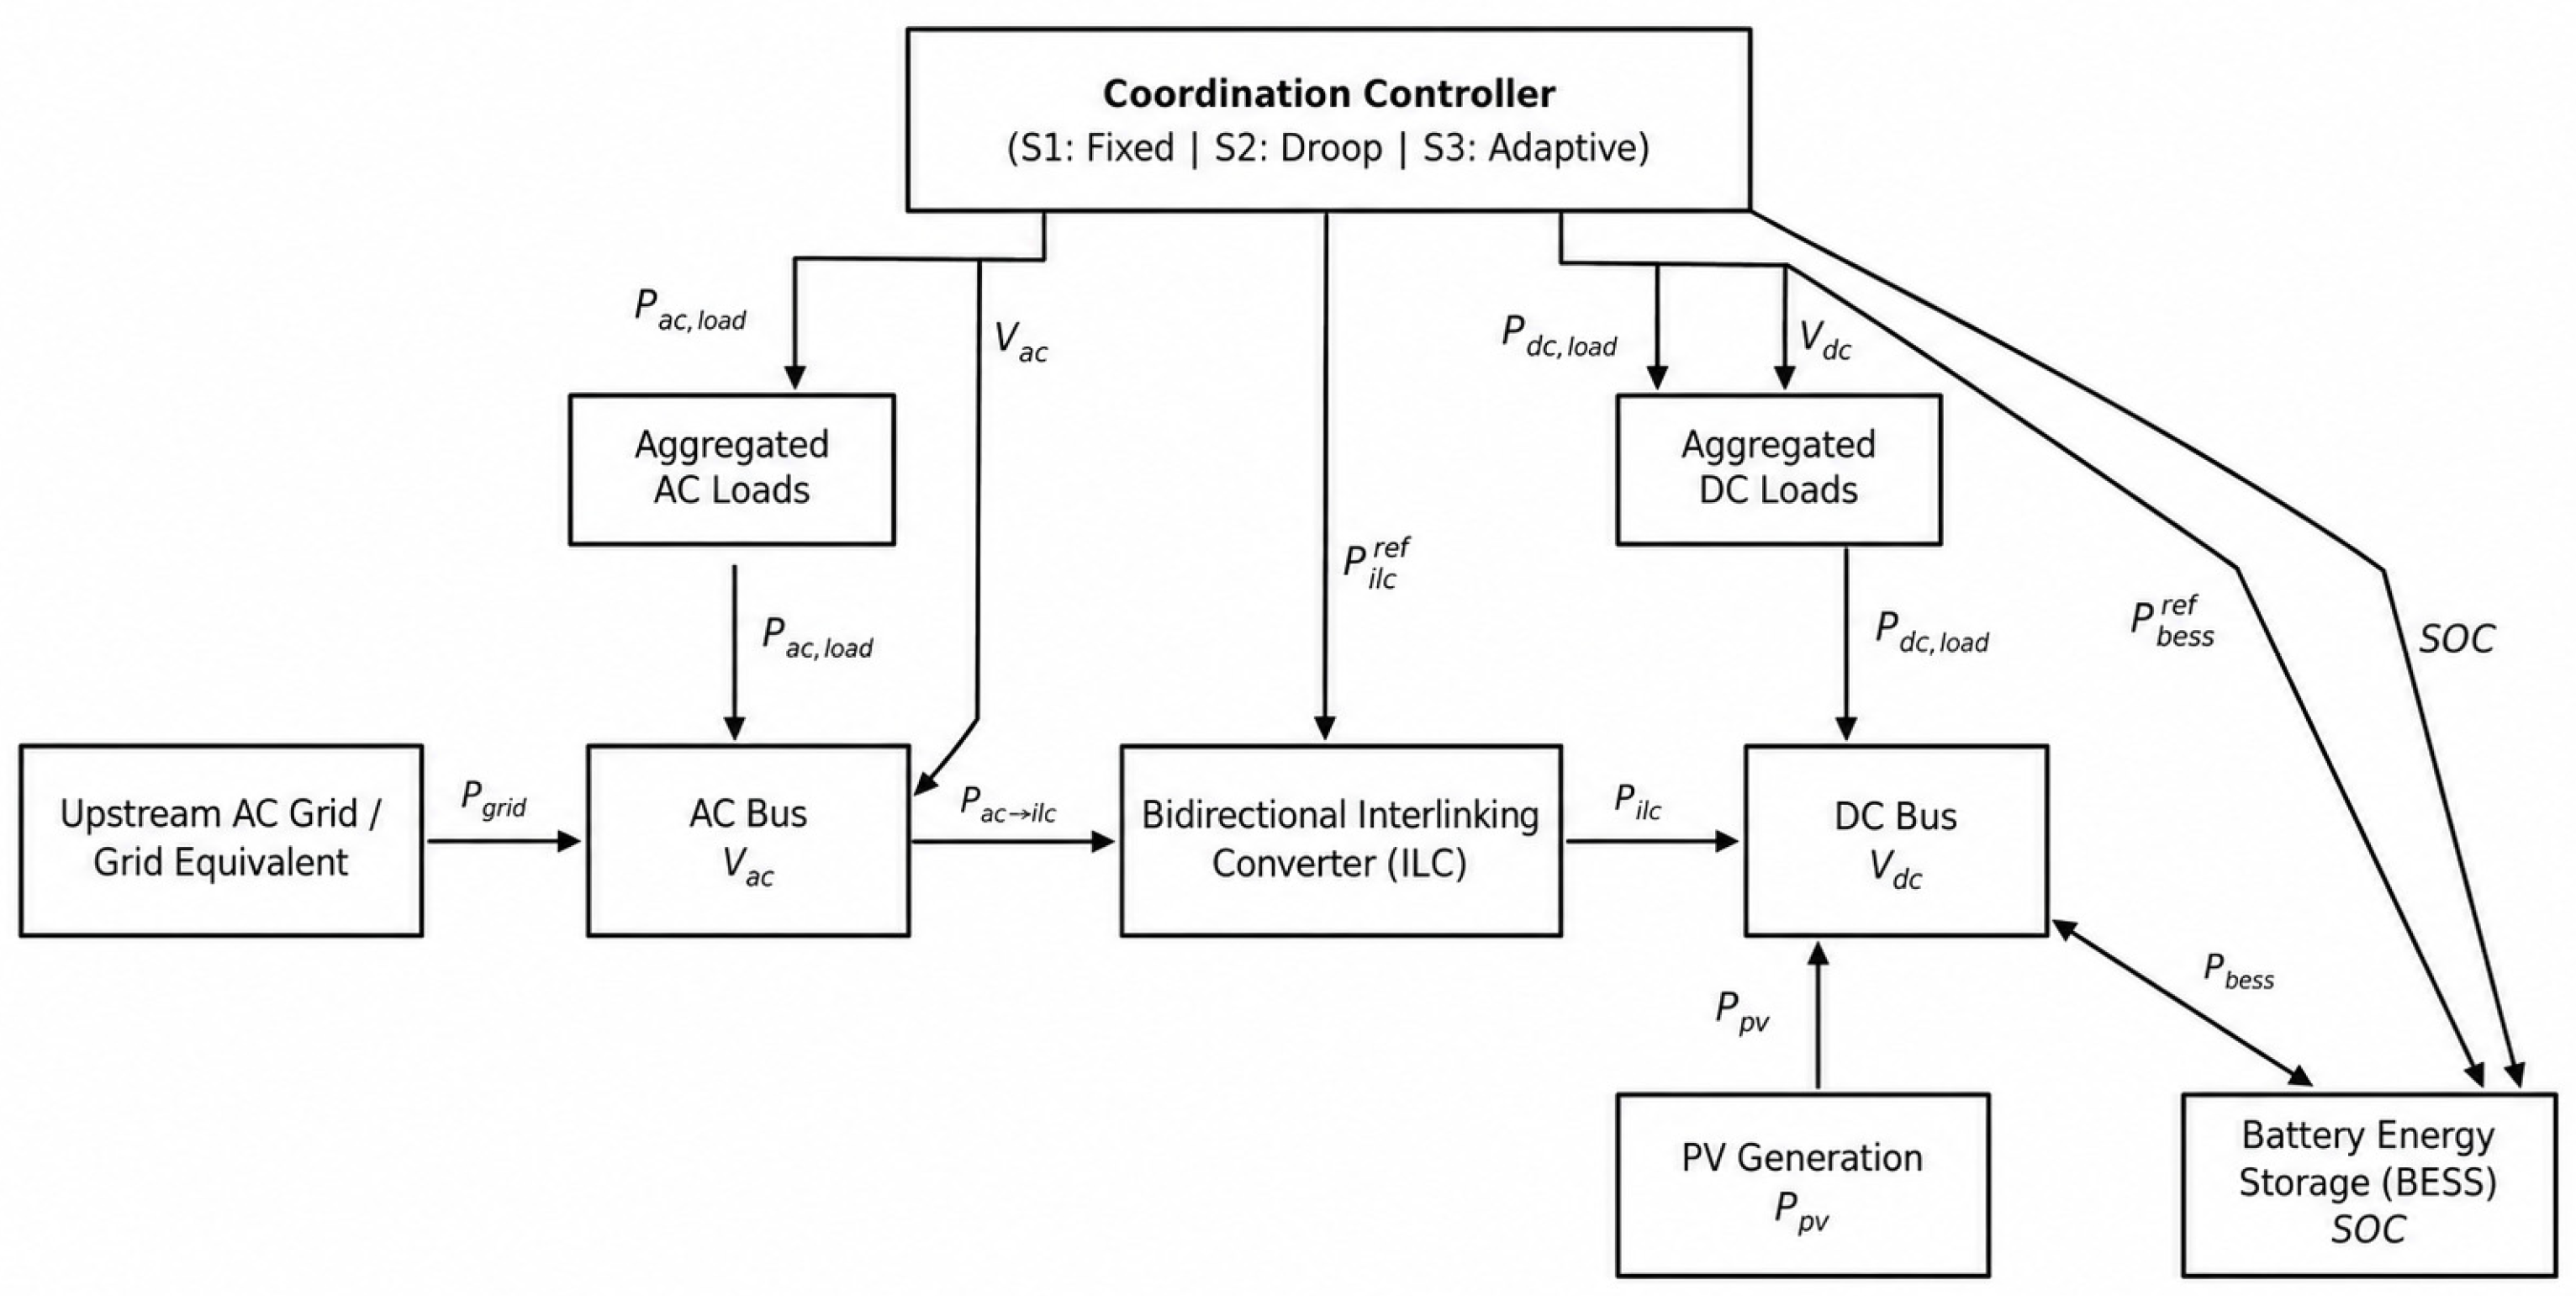
This study considers a representative hybrid AC/DC distribution architecture designed to capture the dominant interactions among converter-interfaced renewable generation, battery storage, mixed AC/DC loads, and bidirectional power exchange across an AC/DC coupling interface. The considered architecture follows the widely adopted hybrid AC/DC paradigm reported in the literature, in which an AC subnetwork and a DC subnetwork are interconnected through a bidirectional interlinking converter (ILC), while distributed generation and storage units are connected according to their native or most convenient electrical domain. This type of arrangement is consistent with the topological classifications summarized in the foundational reviews by Unamuno and Barrena and with later review work emphasizing the central role of interlinking converters in hybrid AC/DC operation [
1,
6,
8,
17].
The AC side of the system represents a simplified distribution feeder supplying aggregated AC demand and interacting with an upstream grid equivalent. The DC side represents a local DC distribution segment hosting distributed photovoltaic (PV) generation, a battery energy storage system (BESS), and aggregated DC demand. The AC and DC domains are coupled through a bidirectional interlinking converter, which enables controlled power exchange between the two subsystems and acts as the main mediator of cross-domain disturbance propagation. This modeling choice is consistent with the literature, where the ILC is repeatedly identified as a critical control and power-balancing element in hybrid AC/DC networks [
8,
17].
The architecture adopted in this paper is intentionally compact rather than highly network-detailed. The goal is not to reproduce a specific utility feeder with full electromagnetic or protection-level detail, but to provide a representative and computationally efficient benchmark that preserves the key coupled mechanisms required for comparative analysis. In particular, the selected configuration is intended to capture:
- (i)
DC-bus sensitivity to renewable intermittency and load imbalance;
- (ii)
AC-side voltage sensitivity to active-power transfer and AC-load variation;
- (iii)
converter-mediated coupling between AC and DC domains;
- (iv)
the effect of coordination policy on system-wide operating behavior.
Figure 1 presents a global perspective of the complete architecture of the framework considered here.
3.2. Main Components and Electrical Domains
The considered architecture includes the following functional components:
AC subnetwork: an aggregated AC-side feeder connected to an upstream grid equivalent and supplying aggregated AC load demand.
DC subnetwork: an aggregated DC-side bus supplying DC demand and hosting local DC-connected resources.
Photovoltaic generation unit: represented as a variable distributed renewable source connected to the DC side through an equivalent converter interface.
Battery energy storage system: represented as a bidirectional storage unit connected to the DC side and capable of charging/discharging support under coordination constraints.
Bidirectional interlinking converter: connecting the AC and DC subnetworks and regulating power exchange according to the adopted control policy.
This structure reflects the general design logic of hybrid AC/DC systems described in the literature, where PV and batteries are frequently interfaced on the DC side, conventional and legacy loads remain on the AC side, and the ILC is used to maintain cross-domain power balance and voltage support. Such an arrangement is also compatible with the broader system-level motivations for hybrid AC/DC networks, namely reduced conversion stages, improved flexibility in integrating DC-native resources, and enhanced operational coordination across heterogeneous energy assets [
1,
17,
18].
3.3. Reduced-Order Dynamic Modeling Approach
The purpose of the present study is a comparative stability- and power-quality-oriented assessment across multiple operating scenarios and renewable penetration levels. Accordingly, a reduced-order dynamic model was adopted rather than a switching-level electromagnetic transient model. This modeling choice enables efficient scenario screening while retaining the dominant system-level interactions needed for comparative evaluation.
More specifically, the adopted model combines:
an aggregated DC-side energy-balance representation for the DC bus;
first-order dynamic representations for the interlinking converter and battery power response;
a reduced-order AC-side voltage-sensitivity model with first-order dynamics;
and scenario-dependent exogenous profiles for PV generation, AC demand, and DC demand.
This level of abstraction is appropriate for the objectives of the present study because the emphasis is on relative comparative behavior at the system level, rather than on detailed converter switching phenomena, standards-oriented power-quality compliance assessment, or hardware-specific controller realization. It is also consistent with the broader literature on hybrid AC/DC systems, where the appropriate level of model detail depends strongly on the assessment objective, and where system-level control and operating-region studies often rely on averaged or reduced-order representations [
1,
8,
18].
3.3.1. DC-Side Model
The DC subnetwork is represented through an equivalent bus-capacitance formulation that captures the dominant relationship between net DC-side power imbalance and DC-bus voltage dynamics. Let
denote the DC-bus voltage. The DC-side dynamics are modeled as
where
is the available PV power,
is the battery power contribution,
is the power injected into the DC side by the interlinking converter,
is the DC load demand, and
is an equivalent DC-side energy-storage parameter.
This equation reflects the fact that DC-bus voltage is directly affected by the mismatch between local renewable generation, storage support, interlinking-converter transfer, and DC demand. The form of this representation is particularly suitable for scenario-based assessment of voltage regulation and disturbance recovery.
3.3.2. Interlinking Converter Dynamics
The interlinking converter is modeled as a controlled first-order power-transfer element:
subject to power saturation limits
This model reflects the finite response speed and limited transfer capability of the ILC while avoiding unnecessary low-level converter detail. Given the central role of the ILC highlighted in recent reviews and control-oriented studies, representing its response explicitly is essential even in a reduced-order framework [
1,
8,
17].
3.3.3. Battery Dynamics and State of Charge
The BESS is represented through a first-order active-power response model:
with power and state-of-charge constraints. The state of charge
evolves as
where
denotes the equivalent stored energy capacity. Positive
corresponds to battery discharge into the system, while negative
corresponds to charging operation.
This representation is sufficient for assessing the contribution of storage to voltage support, transient mitigation, and inter-scenario robustness, which are among the main goals of the paper.
3.3.4. AC-Side Reduced-Order Model
The AC side is represented through a reduced-order voltage-sensitivity formulation. Instead of solving a full network power flow at every time step, the AC bus voltage is modeled as a first-order response toward a scenario- and loading-dependent reference voltage:
The reference voltage
depends on the AC load demand, the AC-side burden induced by the interlinking converter, and a small load-ramp sensitivity term:
where
is the nominal AC voltage,
is the AC-side demand,
denotes the AC-side effective transfer burden associated with positive DC support,
is a simplified upstream support reference, and
and
are sensitivity parameters.
This modeling choice provides a computationally efficient way to capture the main effect of AC-side loading and AC/DC coupling on voltage-quality-related behavior, while remaining fully compatible with the comparative goals of the paper.
3.4. Converter Coordination Strategies
Three converter coordination strategies are compared in this work in order to assess how different levels of control sophistication affect system behavior.
3.4.1. Strategy S1: Fixed-Reference Baseline
Strategy S1 represents a baseline coordination philosophy with limited adaptivity. The ILC reference is primarily driven by a coarse DC-side power-mismatch compensation term, while the battery is activated only when the DC-bus voltage departs beyond predefined thresholds. This strategy is intentionally simple and serves as a reference point for comparison with more responsive coordination schemes.
3.4.2. Strategy S2: Droop-Based Decentralized Coordination
Strategy S2 introduces decentralized droop-based support. In this case, the battery reference power depends on the deviation of the DC-bus voltage from its nominal value, and the ILC reference depends on both the DC-bus voltage deviation and AC-side voltage deviation, in addition to a net DC-side mismatch term. This strategy reflects the well-established importance of local droop behavior and decentralized coordination in converter-dominated microgrids and hybrid AC/DC systems [
8,
17,
18].
3.4.3. Strategy S3: Adaptive Coordinated Support
Strategy S3 extends the droop-based concept through adaptive gain adjustment. The effective control gains are increased when the system experiences stronger DC-voltage deviation, AC-voltage deviation, or abrupt renewable variation. As a result, S3 provides more aggressive support under stressed conditions, especially during renewable drops and combined disturbances.
The intent of S3 is not to claim a hardware-ready advanced controller design, but to represent a more responsive coordination philosophy that can be meaningfully compared with S1 and S2. This allows the study to examine whether stronger converter coordination improves robustness and, if so, whether such gains are accompanied by side effects elsewhere in the architecture.
3.5. Operating Scenarios and Renewable Penetration Levels
To evaluate system behavior under variable operating conditions, the model is exercised under a set of structured operating scenarios designed to represent the main disturbance classes relevant to hybrid AC/DC distribution operation:
SC0—Nominal operation: baseline operating condition without major disturbances;
SC1—PV drop: abrupt renewable generation reduction;
SC3—AC load step: disturbance introduced on the AC side through a load increase;
SC4—DC load step: disturbance introduced on the DC side through a load increase;
SC5—Combined stress: simultaneous renewable reduction and DC-load increase.
These scenarios were selected because they reflect the most relevant stress mechanisms for the objectives of this study: renewable intermittency, AC-side demand variation, DC-side demand variation, and compounded disturbance conditions. In addition, the scenarios are evaluated under multiple renewable penetration levels, allowing the paper to investigate whether the same coordination strategy remains effective as the local renewable contribution increases.
The study therefore adopts a structured screening logic in which the same architecture and control strategies are evaluated under repeated combinations of scenario and renewable penetration level. This makes it possible to identify not only which strategy performs better on average, but also which operating conditions are most critical and where cross-domain trade-offs become more evident.
3.6. Modeling Assumptions and Intended Scope
The following modeling assumptions define the scope of the present framework:
The system is represented at an aggregated dynamic level, not at switching level;
Converter switching harmonics and detailed electromagnetic effects are not explicitly modeled;
The AC side is represented through a reduced-order sensitivity-based voltage model, rather than a full nodal power-flow solver;
The emphasis is on comparative operating behavior, not on hardware validation of a specific converter implementation;
The adopted power-quality-related indicators should therefore be interpreted as voltage-quality- and fluctuation-oriented proxies, rather than full compliance-grade harmonic certification metrics.
These assumptions are deliberate and appropriate for the intended contribution of the paper. The objective is to build a scenario-based and reproducible assessment framework capable of revealing stability-oriented and power-quality-oriented trends, AC/DC coupling effects, and coordination-dependent trade-offs under high renewable penetration. In this sense, the model should be understood as a comparative system-study platform rather than a device-level design tool.
Based on the architecture and modeling assumptions described above, the next section defines the performance indicators used in the comparative assessment. These indicators are designed to jointly quantify DC-side voltage regulation, AC-side voltage-quality-related behavior, transient disturbance response, converter utilization, and operating robustness across scenarios and coordination strategies.
4. Assessment Framework and Performance Indicators
4.1. Overview of the Assessment Philosophy
The objective of the present work is to evaluate how a representative hybrid AC/DC distribution system behaves under variable operating conditions when subjected to different levels of renewable penetration and different converter coordination strategies. To this end, a scenario-based comparative assessment framework is adopted, in which the same system architecture is repeatedly exposed to structured disturbances while a consistent set of stability- and power-quality-oriented indicators is computed for each case.
This assessment philosophy is motivated by the fact that hybrid AC/DC systems are inherently multi-domain and converter-coupled. Their performance cannot be fully characterized by nominal-condition analysis alone, nor by a single-domain metric such as DC-bus voltage deviation or AC-side voltage support taken in isolation. Instead, the combined effect of renewable intermittency, load disturbances, interlinking converter action, and storage response must be examined across multiple operating regimes in order to identify critical operating regions and control-dependent trade-offs. This motivation is consistent with recent review work emphasizing the need for coordinated and robustness-oriented analysis of hybrid AC/DC systems under diverse operating conditions [
2].
Accordingly, the framework developed in this paper is built around three complementary dimensions:
Scenario diversity, to expose the system to different classes of disturbances;
Penetration-level variation, to assess the effect of increasing renewable contribution;
Control-strategy comparison, to quantify how different coordination philosophies influence both AC-side and DC-side behavior.
The resulting methodology is intended not merely to rank strategies under a single operating point, but to reveal whether a strategy remains robust across conditions and whether improvements in one subsystem are accompanied by degradation in another.
4.2. Scenario-Based Evaluation Design
The assessment is organized around a repeated simulation campaign in which the hybrid AC/DC system is evaluated under multiple combinations of:
The considered operating scenarios are:
SC0—Nominal operation, representing a baseline condition with no major disturbance;
SC1—PV drop, representing a renewable intermittency event through a reduction in PV availability;
SC3—AC load step, representing a disturbance introduced on the AC side through an increase in AC demand;
SC4—DC load step, representing a disturbance introduced on the DC side through an increase in DC demand;
SC5—Combined stress, representing a simultaneous PV reduction and DC-load increase.
These scenarios were chosen to reflect disturbance classes that are both practically relevant and sufficiently distinct to test the robustness of the coordination strategies. In particular:
SC1 isolates the effect of renewable intermittency;
SC3 reveals AC-to-DC coupling through the interlinking converter;
SC4 directly tests DC-side support capability;
SC5 represents a more severe multi-stressor condition and is therefore used as a critical operating benchmark.
To complement the scenario dimension, each case is evaluated under several renewable penetration levels, representing increasing contributions of local PV generation to the DC-side operating balance. This allows the study to assess whether a strategy that performs well at moderate penetration remains effective under more converter-dominated and renewable-rich conditions.
Finally, each scenario–penetration combination is simulated under the three coordination strategies:
S1: fixed-reference baseline support;
S2: droop-based decentralized coordination;
S3: adaptive coordinated support.
This repeated-factor structure ensures that the resulting performance differences can be interpreted comparatively and not as artifacts of isolated operating points.
4.3. Time-Domain Simulation Protocol
Each case is evaluated through a time-domain simulation over a fixed observation horizon. Within this horizon, the system evolves from an initial operating point toward a scenario-dependent disturbance event introduced at a predefined time instant, after which the system response is tracked until the end of the simulation. This structure enables the extraction of both:
steady-state-oriented indicators, reflecting average or maximum deviation over the full trajectory;
transient-oriented indicators, reflecting disturbance response, overshoot, fluctuation, and recovery behavior.
The simulation protocol therefore supports the simultaneous observation of:
pre-disturbance nominal operation;
disturbance onset;
short-term transient behavior;
post-disturbance settling or quasi-steady operation.
This is particularly important in hybrid AC/DC systems because converter-mediated interactions can produce distinct transient and post-disturbance signatures even when the final operating point remains acceptable.
4.4. Performance Indicators
To ensure that the assessment captures both stability-oriented and power-quality-oriented behavior, the study adopts a unified set of performance indicators derived from the simulated time trajectories. These indicators are grouped into four categories:
DC-side regulation indicators
AC-side voltage-quality-related indicators
Transient fluctuation and recovery indicators
Converter utilization and stress indicators
The selected metrics are intentionally defined at a system-comparative level. They are not intended to replace detailed harmonic or compliance-grade power-quality analysis, but rather to provide consistent and interpretable proxies for comparative screening across scenarios and strategies.
4.4.1. DC-Side Regulation Indicators
The first group of indicators quantifies the quality of DC-bus regulation.
The average absolute deviation of the DC-bus voltage from its nominal value over the simulation horizon:
In discrete-time implementation, this metric is evaluated from the sampled trajectory and is used as the main indicator of overall DC-side voltage regulation quality.
- 2.
Maximum DC voltage deviation
The maximum absolute deviation of the DC-bus voltage from nominal:
This metric captures worst-case excursion severity.
- 3.
DC-side overshoot
A post-disturbance maximum excursion metric, computed after the disturbance instant:
where
denotes the disturbance application time.
- 4.
DC voltage violation duration
The cumulative duration during which the DC-bus voltage departs beyond a predefined admissible band:
where
is the DC-side admissible deviation threshold. In the present implementation, a conservative 5% band is used.
These metrics jointly characterize not only how far the DC bus deviates, but also how persistently it remains outside acceptable bounds.
4.4.2. AC-Side Voltage-Quality-Related Indicators
Because the AC side is represented through a reduced-order voltage model rather than a full harmonic-domain model, the AC-side indicators should be interpreted as voltage-quality-related proxies rather than complete harmonic power-quality certification metrics. Their purpose is to quantify how the chosen coordination strategy affects AC-side voltage behavior under hybrid operation.
The average absolute deviation of the AC bus voltage from its nominal value:
This is the primary AC-side voltage-quality-related indicator in the present framework.
- 2.
Maximum AC voltage deviation
The maximum absolute AC-side deviation over the simulation horizon:
- 3.
AC-side overshoot
The maximum post-disturbance excursion:
- 4.
AC voltage violation duration
The cumulative duration for which the AC-side voltage exceeds a predefined admissible deviation band:
In the present implementation, a conservative 3% band is adopted. This threshold is intentionally strict in order to enhance sensitivity in the comparative analysis.
Taken together, these metrics quantify how the control strategy influences AC-side voltage preservation under varying AC/DC coupling conditions.
4.4.3. Transient Fluctuation Indicators
To better capture short-term disturbance effects and support the power-quality-oriented perspective of the study, transient fluctuation metrics are also computed.
The standard deviation of the DC-bus voltage over a post-disturbance transient window:
where
denotes the end of the selected transient analysis window.
- 2.
AC transient fluctuation standard deviation
Similarly, the AC-side transient fluctuation metric is defined as
These indicators do not directly represent harmonic distortion indices such as THD, but they do provide a useful measure of short-term voltage fluctuation intensity and transient variability under scenario-induced stress. For a reduced-order system study, this is a meaningful and computationally efficient proxy for comparing disturbance sensitivity.
- 3.
Steady fluctuation indicators
In addition to transient fluctuation, the framework optionally evaluates fluctuation levels over a later post-disturbance window, providing a measure of residual oscillatory or quasi-steady variability after the dominant transient has decayed.
4.4.4. Recovery-Oriented Indicators
A recovery-oriented view is important because two strategies may show similar maximum deviations but differ substantially in how quickly they return to acceptable operating conditions.
The DC settling time is defined as the elapsed time from disturbance application until the DC-bus voltage enters and remains within a predefined tolerance band around nominal:
where
denotes the DC-side settling tolerance.
- 2.
AC settling time
Similarly, the AC-side settling time is defined with respect to a prescribed AC-side tolerance band.
In practice, settling-time values may be unavailable (or not meaningful) in cases where the response does not fully re-enter the specified tolerance band within the simulation horizon. In such cases, the metric is treated as non-converged or not reached. This is an important practical feature, as it helps distinguish truly robust responses from merely bounded but persistently displaced behavior.
4.4.5. Converter Utilization and Stress Indicators
Since the present study explicitly compares coordination strategies, it is not sufficient to evaluate only voltage outcomes; the effort required to obtain those outcomes must also be quantified.
The average normalized utilization of the ILC:
- 2.
Mean battery utilization
The average normalized utilization of the BESS:
- 3.
Converter stress index
To obtain a compact measure of control effort, the study defines a converter stress index (CSI) as a weighted combination of normalized ILC and BESS utilization:
where
and
are nonnegative weights satisfying
. In the present implementation, equal weights are used.
This metric is useful because a strategy that produces superior voltage regulation by persistently driving the ILC or BESS harder may not be the most desirable from a practical operational perspective.
4.5. Composite Performance Indices
To facilitate higher-level comparison across scenarios and strategies, the framework also introduces composite indices that aggregate multiple normalized indicators into interpretable system-level scores.
4.5.1. Stability Performance Index (SPI)
The Stability Performance Index (SPI) is a DC-oriented composite score combining normalized DC-side regulation and transient response metrics. It aggregates indicators such as:
mean DC voltage deviation;
DC overshoot;
DC voltage violation duration;
DC transient fluctuation intensity.
In normalized form,
where
denotes the normalized value of the i-th DC-oriented metric and
are nonnegative weights satisfying
. Lower values indicate better DC-side robustness.
4.5.2. Power Quality Index (PQI)
The Power Quality Index (PQI) is an AC-side-oriented composite score that combines:
mean AC voltage deviation;
AC overshoot;
AC voltage violation duration;
AC transient fluctuation;
optionally, a modest contribution from converter stress.
In normalized form,
where
denotes the normalized value of the
j-th AC-side or voltage-quality-related metric and
are nonnegative weights satisfying
. Lower values indicate better AC-side voltage-quality-related performance.
4.5.3. Overall Operating Robustness Index (ORI)
To support overall ranking, the Overall Operating Robustness Index (ORI) combines the SPI and PQI:
where
defines the relative emphasis on DC-side stability versus AC-side voltage-quality-related behavior. In the present implementation, equal weighting is used:
This choice reflects the central premise of the paper: stability and power-quality-related behavior should be treated as co-primary comparative dimensions.
4.6. Interpretation of the Framework
The proposed framework is designed to support comparative interpretation, not merely numerical ranking. More specifically, it enables the following questions to be addressed:
Which scenarios are intrinsically more critical? This is assessed through the severity of deviations, overshoot, fluctuation, and violation durations across the scenario set.
Which control strategy is most robust overall? This is assessed through the combination of individual metrics and composite indices.
Does stronger DC-side regulation induce side effects on the AC side? This is assessed by jointly comparing DC-oriented and AC-oriented indicators and by analyzing trade-off relationships between them.
Does increasing renewable penetration systematically improve or degrade robustness? This is assessed by observing performance trends across penetration levels, particularly under the most stressed scenario(s).
This interpretive structure is essential because the purpose of the paper is not only to compare strategies numerically, but to reveal operating-region-dependent trade-offs and cross-domain coupling effects that are highly relevant for hybrid AC/DC distribution planning and operation.
4.7. Scope and Limitations of the Indicators
It is important to emphasize that the proposed indicators are intentionally adapted to the reduced-order dynamic nature of the present model. In particular:
the AC-side metrics are voltage-quality-related proxies, not full harmonic power-quality certification metrics;
the transient fluctuation measures are intended as comparative screening indicators, not as substitutes for detailed spectral analysis;
the composite indices are decision-support tools, not universal standards.
These limitations do not weaken the framework; rather, they clarify its intended use. The proposed assessment is best understood as a system-level comparative methodology that can guide strategy selection, identify critical operating conditions, and motivate more detailed future studies (e.g., EMT or harmonic-domain analysis) in the most relevant cases.
Having defined the scenario-based assessment logic and the adopted performance indicators, the next step is to specify the numerical implementation details and simulation settings used in the screening campaign. This includes the selected parameter values, renewable penetration levels, disturbance timing, and the computational workflow used to generate the comparative results presented in
Section 6.
5. Simulation Settings and Computational Workflow
5.1. General Simulation Philosophy
The proposed study adopts a reduced-order, scenario-based computational workflow implemented in Python (version 3.14.0) to enable efficient and reproducible comparative assessment of a representative hybrid AC/DC distribution system under multiple operating conditions. The simulation framework is intentionally designed to support a broad screening campaign rather than high-fidelity electromagnetic transient analysis. Accordingly, the computational setup prioritizes:
repeatability across scenarios and renewable penetration levels;
consistent extraction of stability- and power-quality-oriented indicators;
transparent comparison of converter coordination strategies.
This design choice is aligned with the main objective of the paper, namely, to identify comparative trends, critical operating regions, and control-dependent trade-offs in hybrid AC/DC systems with high renewable penetration. As such, the adopted workflow should be interpreted as a system-level numerical assessment platform, rather than as a hardware-specific converter validation environment.
5.2. Numerical Implementation Environment
All simulations and post-processing routines were implemented in Python, using standard scientific-computing libraries for numerical integration, data handling, and figure generation. The computational workflow includes:
time-domain simulation routines for scenario execution;
parameterized scenario generation for renewable and load disturbances;
batch execution scripts for repeated simulation across the full scenario matrix;
automatic post-processing for metric extraction;
CSV-based structured result export;
automated generation of publication-ready figures and summary tables.
This implementation strategy provides a practical and reproducible research workflow, especially for comparative studies in which the number of cases is relatively large and repeated post-processing is required.
A key practical advantage of this approach is that the same code base can be progressively extended in future work toward:
more detailed converter models;
richer AC-side network representations;
Monte Carlo variability analysis;
sensitivity studies;
hardware-informed parameterization.
5.3. Time-Domain Simulation Setup
Each case is evaluated through a fixed-duration time-domain simulation. The simulation horizon is divided into:
an initial pre-disturbance interval, during which the system remains near its nominal operating condition;
a disturbance application instant, at which the scenario-specific event is introduced;
a post-disturbance interval, during which the system response is observed and the relevant metrics are extracted.
In the present implementation, the simulation horizon is configured as follows:
Total simulation time:
Time step/evaluation grid: fixed-step numerical evaluation over the full interval
Disturbance application time:
This choice is sufficient to:
capture the nominal pre-disturbance baseline;
resolve the dominant short-term transient;
and observe whether the system settles, remains displaced, or exhibits persistent fluctuation after the disturbance.
The adopted horizon is appropriate for the reduced-order first-order dynamics considered in this study. For more detailed converter or harmonic analyses, a finer time resolution and/or longer observation windows would be required, but such extensions are beyond the present scope.
5.4. Base System Parameterization
The hybrid AC/DC system is parameterized using a normalized and representative set of values intended to preserve interpretability while avoiding unnecessary dependence on any single utility-specific configuration. The model therefore uses per-unit-style or normalized system-level parameters, with nominal values chosen to ensure physically plausible dynamic behavior and clear comparative trends.
The baseline values were selected according to four criteria. First, the AC load, DC load, and PV generation levels were chosen to be of the same order of magnitude, so that neither the AC side nor the DC side dominates the operating behavior by construction. Second, the ILC and BESS power ratings were selected to be sufficiently large to provide meaningful corrective action under the imposed disturbances, but not so large as to eliminate voltage deviations or mask the differences between coordination strategies. Third, the converter and storage time constants were chosen to be much larger than the numerical time step and much smaller than the total simulation horizon, allowing the reduced-order model to resolve the dominant transient response without representing switching-level dynamics. Fourth, the voltage-sensitivity coefficients and droop/adaptive gains were tuned to produce bounded responses with voltage deviations in an interpretable range under all tested scenarios, while still allowing control-dependent differences to emerge.
The key parameter groups are:
Nominal electrical variables
nominal AC bus voltage
nominal DC bus voltage
Equivalent dynamic parameters
equivalent DC-side energy storage/capacitance parameter
AC-side voltage response time constant
ILC response time constant
BESS response time constant
Power limits
maximum ILC power transfer capability
maximum BESS charge/discharge capability
effective BESS energy capacity
Sensitivity and control gains
Initial operating-point quantities
In the present work, the selected parameter values are not claimed as universal standards. Instead, they are chosen to support internally consistent comparative analysis. This is a common and acceptable practice in system-level hybrid AC/DC studies where the main goal is to evaluate control- and scenario-dependent trends rather than utility-specific deployment values.
More specifically, should be interpreted as an aggregated DC-side dynamic parameter rather than as the physical capacitance of a specific DC link. It was selected to yield DC-voltage variations in a few percent under tens-of-kilowatts load-generation imbalance, which is appropriate for comparative voltage-dynamics screening. The AC-side coefficient was selected so that active-power transfer through the ILC produces AC-voltage deviations in the same order of magnitude as the scenario-induced variations observed in the results. The ILC and BESS time constants define averaged active-power response dynamics, whereas the gains , and define the relative aggressiveness of storage support, interlinking-converter support, and adaptive coordination. These values are therefore part of the representative benchmark definition, not calibrated parameters for a specific feeder.
5.5. Parameter Table
The baseline parameterization adopted in the reduced-order hybrid AC/DC system model is summarized in
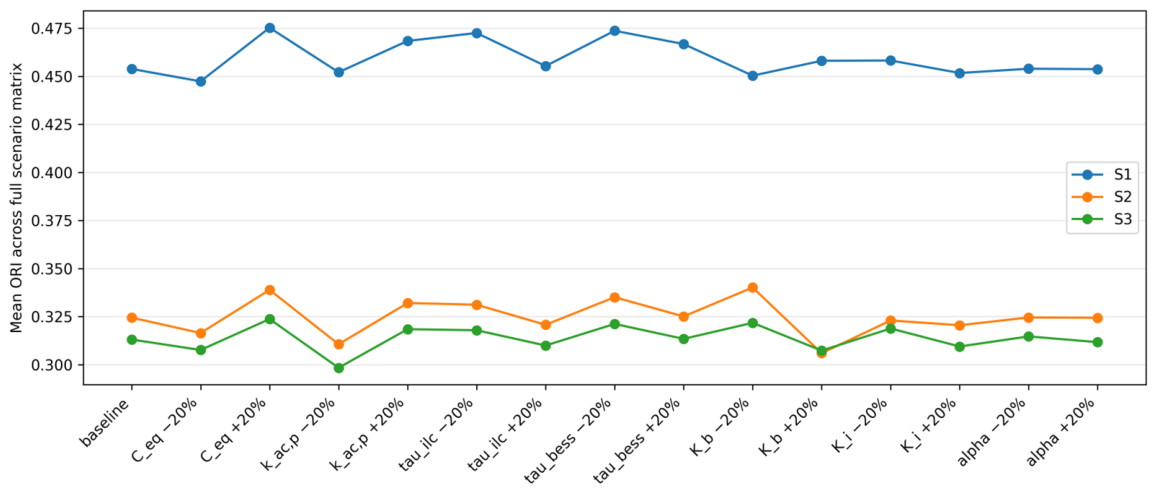
Table 1. The selected values are intended to provide a physically plausible and internally consistent operating regime for comparative scenario-based assessment, rather than to reproduce a specific utility feeder. Accordingly, the table should be read as the numerical definition of the reduced-order benchmark used in this paper. The robustness of the main conclusions with respect to variations in selected entries of this table is examined in
Section 6.10.
5.6. Renewable Penetration Levels
To evaluate the influence of distributed renewable contribution, the system is tested under multiple renewable penetration levels. In the present implementation, five penetration levels are considered:
These levels represent progressively stronger PV participation in the DC-side operating balance. The penetration parameter is implemented by scaling the effective PV contribution relative to the baseline demand and operating-point configuration.
This choice provides a sufficiently broad range to reveal whether the system behavior evolves monotonically with increasing renewable participation or whether certain thresholds exist beyond which converter stress, voltage excursions, or cross-domain coupling become more pronounced.
The selected penetration sweep is also computationally efficient and well suited for structured comparative visualization (e.g., penetration-versus-metric line plots, grouped bar charts, and scenario ranking tables).
5.7. Operating Scenarios and Disturbance Profiles
The simulation campaign includes the following operating scenarios:
SC0—Nominal operation. Baseline case with no major disturbance beyond nominal operation.
SC1—PV drop. A step reduction in PV availability applied at , representing renewable intermittency or irradiance loss.
SC3—AC load step. A positive step in AC-side load demand applied at , representing a sudden increase in AC demand.
SC4—DC load step. A positive step in DC-side load demand applied at , representing a sudden increase in DC demand.
SC5—Combined stress. A simultaneous PV reduction and DC-side load increase applied at , representing a compounded operating stress.
The disturbance amplitudes are chosen to be sufficiently strong to reveal control-dependent differences while remaining within the intended operating envelope of the reduced-order system. This is an important methodological point: the goal is not to force collapse-like behavior, but rather to compare relative robustness under credible stress.
5.8. Control Strategy Implementation and Mathematical Formulation
The three coordination strategies were implemented using the same reduced-order hybrid AC/DC system model and differ only in the way the reference commands for the interlinking converter (ILC) and the battery energy storage system (BESS) are generated. In all cases, the sign convention adopted in this work is as follows: positive denotes battery discharge into the DC bus, negative denotes battery charging, and positive denotes active-power injection from the AC side into the DC side through the interlinking converter. Therefore, positive supports the DC subsystem but increases the effective loading burden seen from the AC side.
Let
and
denote the instantaneous DC-bus and AC-bus voltages, respectively, and let
and
denote their nominal values. The voltage deviations used by the controllers are defined as
A positive
therefore indicates a DC-bus undervoltage condition requiring support, whereas a positive
indicates an AC-side voltage reduction. The instantaneous DC-side power mismatch is defined as
Thus, larger positive values of
indicate that the DC-side load exceeds the available local PV generation and that support from the BESS and/or ILC may be required. The final reference commands applied to the dynamic first-order BESS and ILC models are always obtained after saturation:
where
The BESS power limits are made dependent on the state of charge (SOC) in order to prevent operation outside the admissible energy range. Specifically,
This means that battery discharge is blocked when the lower SOC bound is reached, while battery charging is blocked when the upper SOC bound is reached.
Strategy S1: fixed-reference baseline support
Strategy S1 represents a low-complexity baseline with limited adaptivity. In this strategy, the ILC command is obtained from a weighted combination of the instantaneous DC-side power mismatch and a simplified AC-side support term, while the BESS is activated only when the DC-bus voltage exceeds predefined upper or lower thresholds. The ILC command is given by
where
is the DC-side power mismatch and
denotes the simplified AC-side support contribution used in the baseline reference-generation logic.
The BESS command in S1 follows a threshold-based rule:
Thus, S1 only activates the BESS when the DC voltage leaves a threshold band. This makes S1 intentionally less responsive than the droop-based and adaptive strategies, and therefore suitable as a fixed-reference baseline.
Strategy S2: droop-based decentralized support
Strategy S2 introduces continuous droop-based support from both the BESS and the ILC. The BESS responds proportionally to the DC-bus voltage deviation according to
The ILC command combines DC-voltage support, AC-voltage-related support, and DC-side power-mismatch compensation:
The term increases ILC support when the DC-bus voltage falls below its nominal value. The term introduces an AC-side voltage-dependent contribution to the ILC reference, while accounts for the instantaneous DC-side power imbalance. Compared with S1, this strategy provides a more continuous and decentralized response to voltage deviations and load-generation mismatch.
Strategy S3: adaptive coordinated support
Strategy S3 extends S2 by introducing adaptive gain scaling. Instead of using fixed droop gains, S3 computes effective gains that increase when the system experiences stronger voltage deviations or rapid PV-power variations. The adaptive scaling factor is defined as
To avoid excessive gain amplification, the scaling factor is bounded as
The effective adaptive gains are then computed as
The resulting BESS and ILC commands are
Thus, S3 increases the effective BESS, ILC-DC, and ILC-AC support gains under stressed operating conditions. This produces a more aggressive corrective response than S2, especially during DC-voltage deviations, AC-voltage deviations, and rapid PV-power changes. However, the stronger ILC action can also increase the AC-side voltage-quality-related burden, which is consistent with the trade-off observed in the results.
5.9. Full Simulation Matrix
The complete simulation campaign is structured as a Cartesian product of:
Thus, the total number of evaluated cases is
This full-factor design ensures balanced coverage and supports direct cross-comparison across all three dimensions of interest.
5.10. Computational Workflow and Reproducibility
The numerical workflow is organized in two main stages:
Stage 1: Screening simulation
A batch simulation script executes all cases in the scenario–strategy–penetration matrix and exports a structured summary file (e.g., screening_summary.csv) containing the key performance metrics for each case.
Stage 2: Automated post-processing
A dedicated post-processing script reads the summary results and automatically generates:
This two-stage workflow is highly advantageous from a research reproducibility perspective because it cleanly separates the following:
It also makes it easy to:
re-run only the simulations after model changes;
regenerate all figures consistently;
maintain a traceable pipeline from code to manuscript assets.
5.11. Post-Processing Outputs Used in the Manuscript
The post-processing stage generates a set of figures and tables that support the narrative of
Section 6 (Results and Discussion). These outputs typically include:
penetration-versus-performance curves for each strategy under selected scenarios;
grouped bar charts comparing strategies for key metrics;
heatmap-style or ranking summaries highlighting best and worst cases;
summary tables identifying:
best-performing strategy per scenario;
worst-case operating points;
and overall ranking under composite indices.
This output structure is particularly appropriate for a paper centered on comparative operating behavior, as it allows
Section 6 to be organized around:
5.12. Practical Interpretation of the Computational Setup
A crucial methodological point is that the present computational setup is deliberately positioned between two extremes:
It is more informative than a purely conceptual discussion, because it produces repeatable scenario-based numerical evidence;
but it is less detailed than a full EMT or hardware-in-the-loop study, because it uses reduced-order averaged dynamics.
This middle ground is scientifically useful for the purpose of the present paper. It allows the study to:
compare multiple strategies under many conditions;
identify critical trends efficiently;
and produce clear planning- and operation-oriented insights.
From an editorial perspective, this is also a good fit for Applied Sciences, where methodological clarity, reproducibility, and comparative engineering insight are highly valued, even when the model is intentionally reduced-order.
Based on the simulation setup described above, the following section presents the comparative results obtained from the full 75-case screening campaign. The analysis first examines global trends across renewable penetration levels and scenarios, then focuses on the most critical operating conditions to identify the dominant trade-offs between DC-side stability, AC-side voltage-quality-related behavior, and converter stress.
6. Results and Discussion
6.1. Overview of the Comparative Screening Campaign
The full simulation campaign comprised 75 cases, corresponding to the Cartesian product of:
5 operating scenarios (SC0, SC1, SC3, SC4, SC5);
3 converter coordination strategies (S1, S2, S3);
and 5 renewable penetration levels (20%, 40%, 60%, 80%, 100%).
The resulting dataset enables a structured comparative interpretation of how hybrid AC/DC system performance evolves with increasing renewable contribution and how different converter coordination philosophies influence both DC-side regulation and AC-side voltage-quality-related behavior. Because the adopted model is reduced-order, the results should be interpreted as comparative voltage-dynamics evidence rather than as feeder-specific validation or complete power-quality certification.
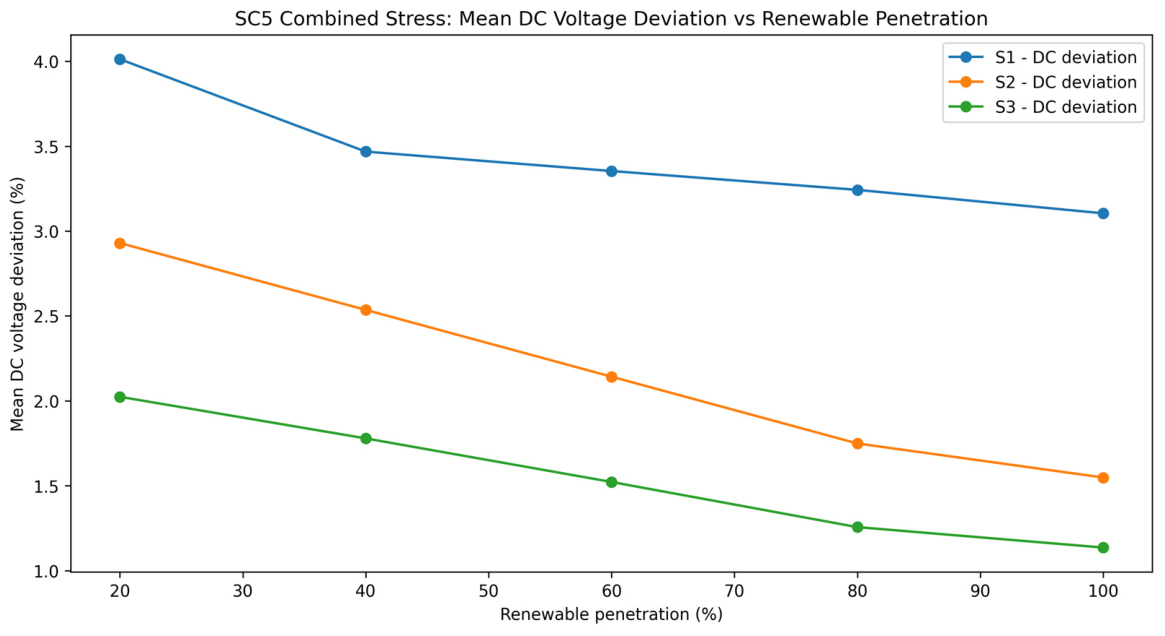
Across the full screening campaign, three robust patterns emerge. First, the adaptive coordinated strategy (S3) systematically provides the strongest DC-side support, particularly under stressed operating conditions. Second, the droop-based strategy (S2) generally offers an intermediate compromise between robustness and control effort. Third, the fixed-reference baseline (S1) becomes increasingly vulnerable when renewable intermittency and load disturbances are combined. These trends are especially visible in the most demanding operating scenario, SC5 (combined stress).
Across the full screening campaign, three consistent patterns emerge. First, the adaptive coordinated strategy (S3) systematically provides the strongest DC-side support, particularly under stressed operating conditions. Second, the droop-based strategy (S2) generally offers an intermediate compromise between robustness and control effort. Third, the fixed-reference baseline (S1) becomes increasingly vulnerable when renewable intermittency and load disturbances are combined. These trends are especially visible in the most demanding operating scenario, SC5 (combined stress). At the same time, the comparison also shows that improved DC-side regulation is not necessarily accompanied by improved AC-side voltage-quality-related behavior, which motivates the trade-off analysis developed later in this section.
To support this interpretation, the results are first examined from a global comparative perspective, then analyzed scenario by scenario, and finally synthesized through trade-off and ranking views.
6.2. Global Strategy Comparison Across All Scenarios
The first level of analysis considers the overall behavior of the three coordination strategies across the entire simulation matrix.
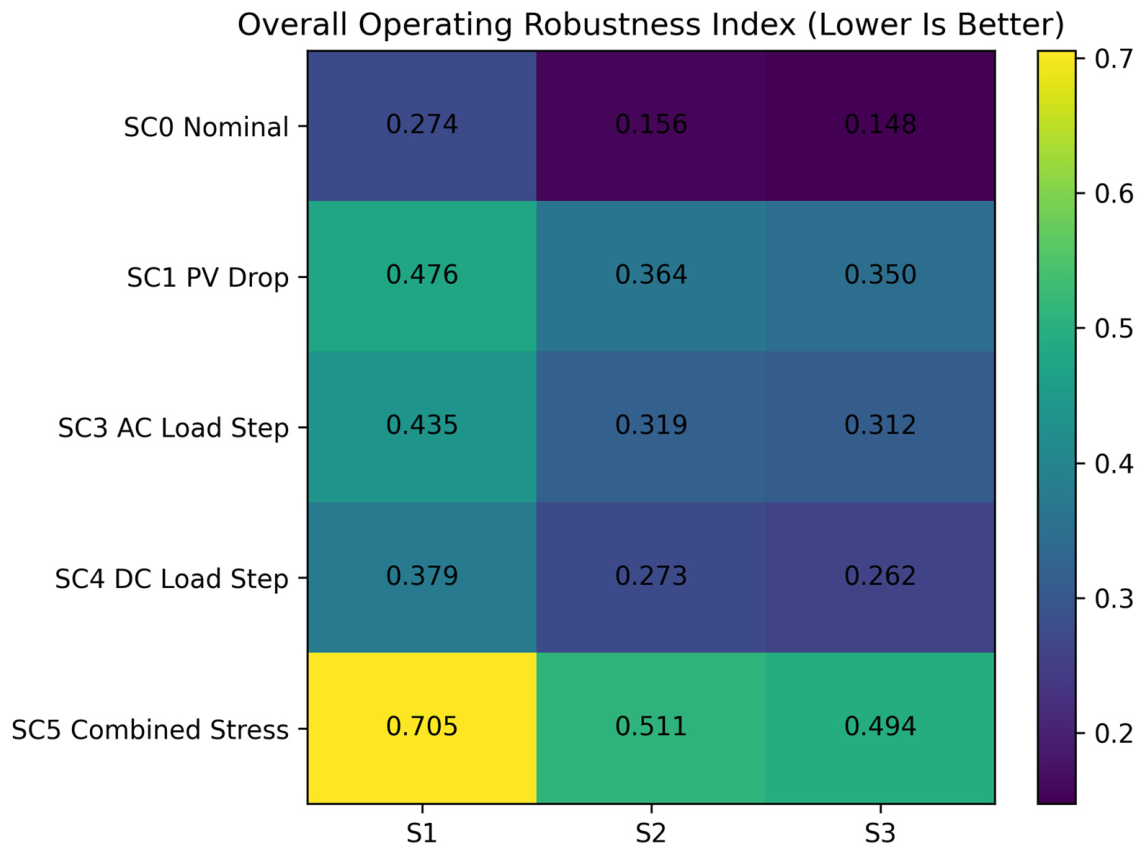
Table 2 summarizes the aggregate performance of the three coordination strategies across the full 75-case screening campaign, using both individual average metrics and the composite Overall Operating Robustness Index (ORI).
As shown in
Table 2, the adaptive coordinated strategy (S3) achieves the lowest aggregate ORI when the full scenario matrix is considered. However, the difference between S3 and S2 is relatively small in terms of the composite ORI, which indicates that S3 should not be interpreted as uniformly superior under all individual metrics. The overall ranking is primarily driven by S3′s consistently lower DC-side voltage deviations, lower overshoot-related severity, and stronger resilience under stressed conditions. By contrast, S2 provides an intermediate level of robustness, while S1 ranks last in the overall comparison.
A particularly important observation from the global comparison is that the ranking is not purely one-dimensional. While S3 delivers the strongest DC-side regulation, its AC-side voltage-quality-related indicators are not always the best. In fact, the global averages indicate that S1 can exhibit smaller AC-side mean voltage deviations in some operating regimes, whereas S3 tends to accept a somewhat larger AC-side deviation in exchange for stronger DC-side support. This explains why the ORI values of S2 and S3 are close: S3 gains mainly on the DC-side stability component, whereas S2 remains more balanced from an AC/DC compromise perspective. This already suggests the presence of a non-trivial AC/DC control trade-off, which is examined more explicitly later in this section.
6.3. DC-Side Regulation Performance by Scenario and Strategy
The central objective of the paper is to evaluate how converter coordination affects stability-oriented DC-side behavior in hybrid AC/DC systems with high renewable penetration. For this reason, the next step is to compare the DC-side voltage regulation indicators across scenarios and strategies.
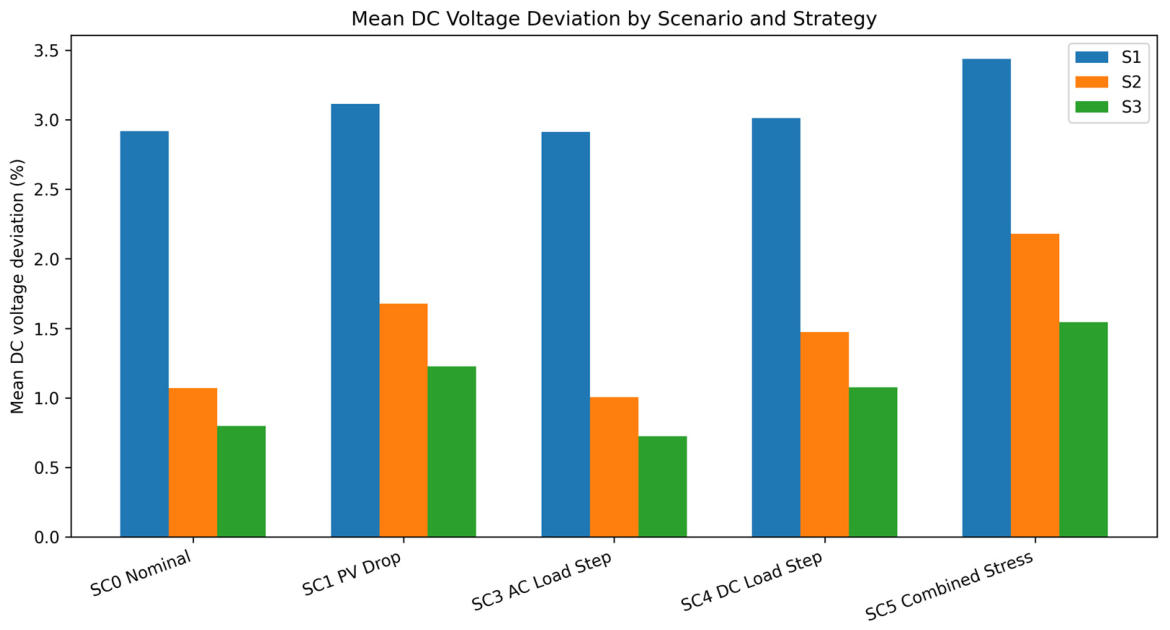
Figure 2 compares the average DC-bus voltage deviation across all operating scenarios for the three coordination strategies, providing a compact view of the DC-side regulation hierarchy.
Figure 2 shows that S3 is the most effective strategy from a DC-side regulation perspective within the adopted reduced-order benchmark. Across nearly all scenarios, the adaptive coordinated controller produces the lowest mean DC-bus voltage deviation, followed by the droop-based strategy S2, while the fixed-reference baseline S1 shows the largest deviations.
This ordering is particularly pronounced in the disturbed scenarios, especially SC4 (DC load step) and SC5 (combined stress). Under these conditions, the DC bus is directly or indirectly subjected to an imbalance that requires coordinated action from both the interlinking converter and the battery. The results show that a fixed-reference support logic is insufficiently responsive, whereas droop-based and adaptive strategies are substantially more effective.
The difference between S2 and S3 is especially informative. Although both strategies improve DC-side regulation relative to S1, S3 consistently provides an additional reduction in average DC deviation, indicating that the adaptive gain mechanism remains beneficial when the operating condition becomes more severe or when renewable availability changes rapidly. This advantage is particularly relevant for DC-bus support, but it should be interpreted together with the AC-side indicators discussed next.
6.4. AC-Side Voltage-Quality-Related Behavior and Cross-Domain Coupling
Because the proposed framework is explicitly based on stability- and voltage-quality-related indicators, it is essential to verify whether the strategies that improve DC-side regulation also preserve acceptable AC-side voltage behavior.
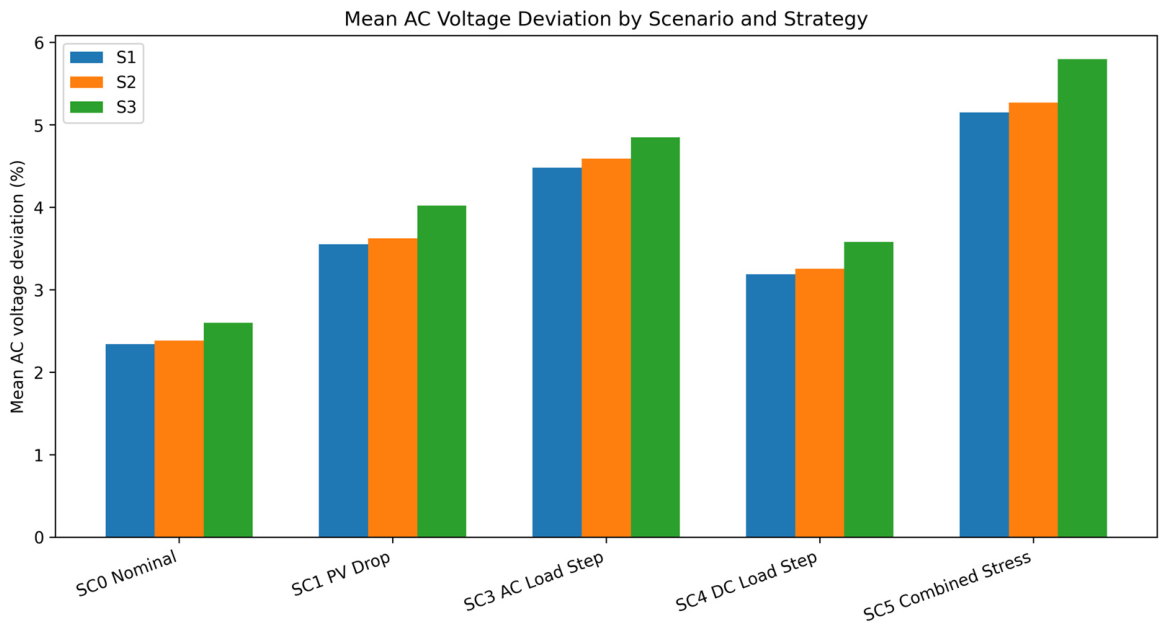
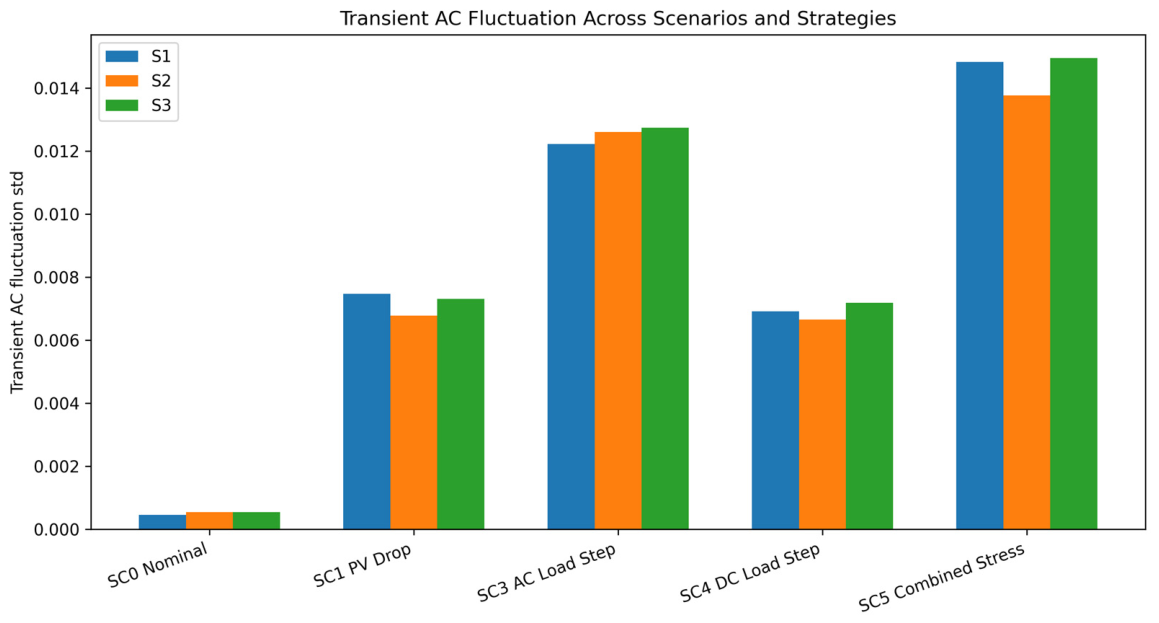
Figure 3 presents the AC-side counterpart of the previous comparison, highlighting how the three strategies affect voltage-quality-related behavior on the AC bus.
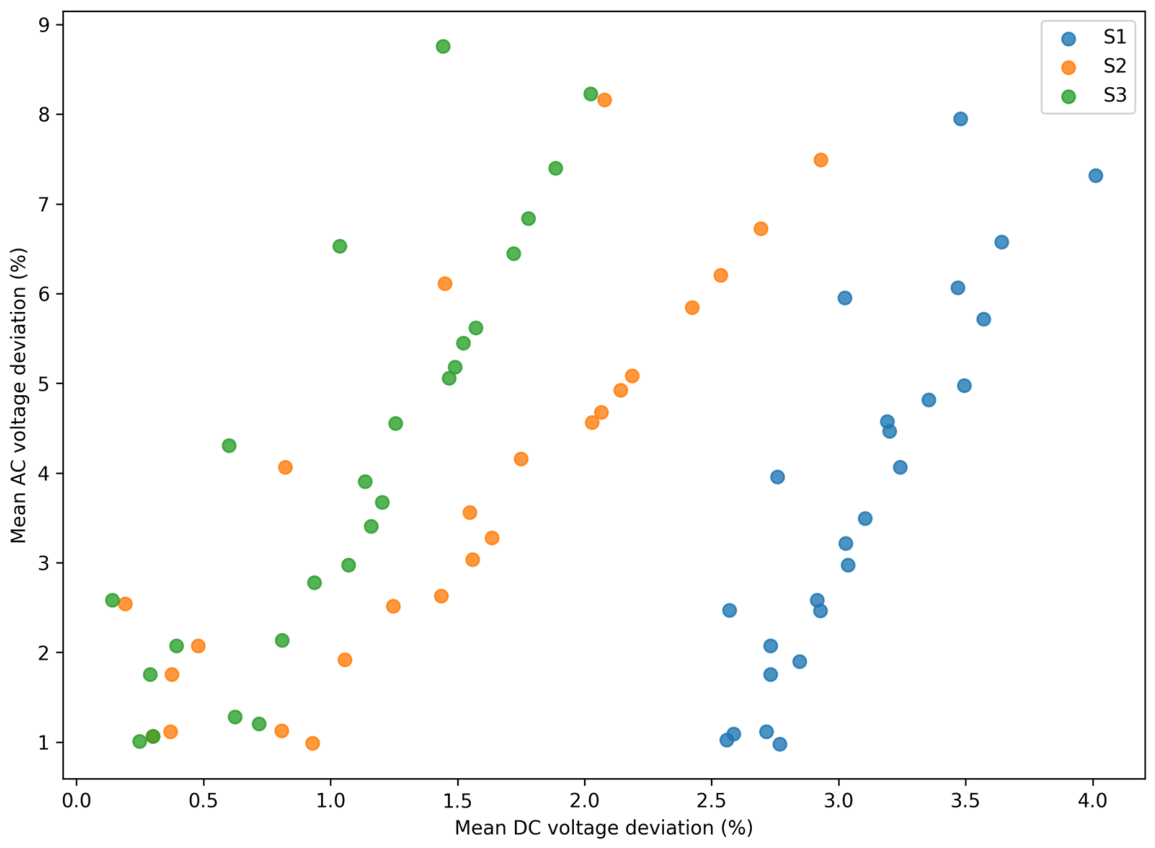
The AC-side results reveal an important and practically meaningful contrast with the DC-side behavior. While S3 remains the strongest DC-support strategy, it does not necessarily minimize AC-side voltage deviations. In several scenarios, S1 exhibits the smallest mean AC-side deviation, with S2 again occupying an intermediate position.
This finding is central to the contribution of the paper. It shows that stronger DC-side support is not free: more aggressive or adaptive converter coordination can increase the extent to which the AC side is mobilized to sustain DC-side regulation. In practical terms, this means that a strategy optimized purely for DC-bus stiffness may introduce a measurable penalty in AC-side voltage-quality-related indicators. This penalty should not be interpreted as a complete power-quality degradation in the standards-based sense, but rather as a voltage-dynamics effect captured by the reduced-order AC-side proxy metrics used in this study.
This effect is especially relevant in hybrid systems because the interlinking converter couples the two subsystems dynamically. The control action required to preserve the DC bus during renewable drops or DC-load increases can translate into modified active-power exchange with the AC side, thereby affecting the AC-side voltage trajectory. Consequently, strategy selection should account for both the desired level of DC-bus stiffness and the acceptable level of AC-side voltage deviation.
6.5. Evidence of AC-to-DC Coupling Under AC-Side Disturbances
A particularly useful test of the model is whether an AC-side disturbance can propagate into DC-side behavior through the interlinking converter. This is precisely what the SC3 (AC load step) scenario was designed to probe.
Table 3 provides a focused view of the AC-load-step scenario (SC3), which is particularly relevant for assessing cross-domain coupling through the interlinking converter.
The SC3 results indicate that AC-side disturbances are not confined to the AC subsystem. A sudden increase in AC load modifies the operating point of the interlinking converter and, depending on the coordination strategy, can induce a measurable effect on the DC bus. This behavior is consistent with the intended reduced-order model structure and reinforces the methodological justification for evaluating AC-side and DC-side indicators jointly.
From a comparative standpoint, S3 still preserves the strongest DC-side response, but the AC-side burden associated with that response is more visible in this scenario. For example, S3 reduces the mean DC voltage deviation relative to S2, but it also produces a higher mean AC voltage deviation and a higher AC overshoot. This reinforces the interpretation that converter coordination in hybrid AC/DC systems should be assessed as a coupled multi-domain problem, not as two independent control problems. It also supports the Reviewer-relevant interpretation that S3′s advantage is mainly associated with DC-side robustness, whereas S2 may remain attractive when a more balanced AC/DC compromise is preferred.
6.6. Critical Operating Region: Combined Renewable and Load Stress (SC5)
Among all evaluated scenarios, SC5 (combined stress) consistently emerges as the most demanding operating condition. This scenario combines a reduction in PV generation with a simultaneous increase in DC-side load, thereby creating a strong and immediate imbalance on the DC side while also testing the ability of the AC side to support the system through the interlinking converter.
Figure 4 focuses on the most critical scenario, SC5, and shows how the DC-side regulation performance evolves with increasing renewable penetration for each strategy.
Figure 4 highlights two important effects. First, the separation between strategies becomes much more pronounced in the combined-stress condition than in the milder scenarios. This confirms that SC5 is an appropriate benchmark for identifying critical operating regions and for distinguishing truly robust strategies from merely adequate nominal-condition controllers.
Second, the influence of renewable penetration is physically interpretable within the adopted scenario definition. In the simulated SC5 cases, higher renewable penetration increases the pre-disturbance local PV contribution on the DC side. Although the same type of disturbance is imposed, the larger local renewable contribution improves the average post-disturbance DC-side power balance and reduces the amount of support that must be supplied by the interlinking converter and BESS. This explains the observed reduction in mean DC voltage deviation with increasing renewable penetration. However, this conclusion should not be generalized as “more PV is always better.” In more detailed models, very high renewable penetration could also introduce additional variability, converter interactions, or protection-related constraints. Therefore, the trend observed here should be interpreted as specific to the structured penetration sweep and reduced-order disturbance profiles considered in this study.
Across all penetration levels, S3 remains the most robust strategy from a DC-side regulation perspective, S2 remains intermediate, and S1 degrades most visibly under the compounded stress. This supports the practical recommendation that adaptive coordination is especially valuable when hybrid AC/DC systems are expected to operate near stressed renewable–load boundaries. Nevertheless, as shown by the AC-side indicators, this DC-side benefit should be weighed against the associated AC-side voltage-quality-related cost.
6.7. Explicit Trade-Off Between DC Regulation and AC-Side Voltage Quality
The most conceptually important result of the study is not merely that one strategy ranks first overall, but that the best DC-side strategy is not necessarily the best AC-side strategy. This motivates a direct trade-off view.
Figure 5 directly visualizes the central trade-off explored in this paper by comparing AC-side and DC-side average performance in a joint metric space.
Figure 5 provides a compact representation of the main contribution of the paper. The plotted operating points show that the strategies occupy distinct regions of the AC/DC performance space:
S1 tends to preserve the AC side better but offers weaker DC support;
S2 occupies an intermediate compromise region;
S3 shifts the operating point toward superior DC regulation, but generally with a higher AC-side deviation cost.
This trade-off is highly relevant for planning and operation. In practice, a system operator may not always prefer the strategy that minimizes only one metric. Instead, the preferred strategy depends on how the operator values:
For this reason, the proposed Overall Operating Robustness Index (ORI) is useful as a comparative synthesis tool, but the individual AC and DC metrics remain essential for engineering interpretation. This is particularly important because the composite ORI assigns equal weight to DC-side and AC-side normalized indicators; different operator preferences or planning priorities could lead to different rankings, especially between S2 and S3.
6.8. Overall Operating Robustness Ranking and Heatmap Synthesis
To complement the metric-by-metric interpretation, a compact global ranking view is useful for identifying where the most critical operating points lie and whether the same strategy remains dominant across the full matrix.
Figure 6 synthesizes the full scenario matrix through a heatmap representation of the composite robustness index, enabling rapid identification of the most favorable and most critical operating regions.
To further clarify the operating envelope of the proposed framework,
Table 4 reports representative best- and worst-case operating points identified across the full screening campaign.
The most favorable operating points are concentrated in nominal conditions under S2 or S3, whereas the least robust cases are consistently associated with the combined-stress scenario (SC5), especially when paired with the fixed-reference strategy S1.
The ORI heatmap confirms the conclusions drawn from the individual metrics. The most favorable regions are generally associated with:
nominal or lightly disturbed conditions (especially SC0);
higher renewable penetration levels in non-compounded cases;
and strategies S2 and S3, with S3 most often yielding the best values.
Conversely, the most critical regions are concentrated in:
In particular, S1 under SC5 consistently appears among the least robust operating points. This is an important practical result because it indicates that simple fixed-reference support may be inadequate when renewable intermittency and load growth occur simultaneously. However, the proximity between S2 and S3 in several ORI entries confirms that the preferred strategy cannot be selected from the composite index alone. Instead, the underlying DC-side and AC-side indicators should be inspected to determine whether the priority is stronger DC regulation, lower AC-side voltage deviation, or a balanced compromise.
6.9. Transient Voltage-Fluctuation Indicators
To complement the average and worst-case metrics,
Figure 7 illustrates a representative transient-oriented indicator related to short-term AC-side fluctuation under disturbed operation.
Although the present model is not intended for detailed harmonic-domain power-quality certification, the transient fluctuation indicators remain useful as comparative screening metrics. The results suggest that strategies that more aggressively support the DC bus can also intensify short-term AC-side fluctuation in certain disturbed cases. This further supports the interpretation that hybrid AC/DC control should be assessed through multi-domain trade-offs, rather than through a single-domain optimization perspective. The transient fluctuation metric should therefore be interpreted as a reduced-order voltage-variability proxy, not as a substitute for harmonic distortion, flicker, or standards-based power-quality indices.
6.10. Parameter-Sensitivity Analysis
To further verify that the comparative conclusions are not artifacts of a single parameter set, an additional one-at-a-time parameter-sensitivity analysis was conducted. The objective of this analysis was not to replace higher-fidelity electromagnetic-transient or feeder-specific validation, but rather to test whether the main ranking trends remain stable when representative model and control parameters are perturbed.
Seven parameters were selected because of their direct influence on DC-side dynamics, AC-side voltage response, converter response speed, and controller aggressiveness: the equivalent DC-side dynamic parameter , the AC-side voltage sensitivity coefficient the ILC time constant , the BESS time constant , the BESS droop gain , the ILC droop gain , and the adaptive gain coefficient . Each parameter was varied independently by around its baseline value, while all other parameters were kept unchanged. For each perturbed configuration, the complete scenario–strategy–penetration matrix was re-evaluated and the SPI, PQI, and ORI values were recomputed using the same normalization and weighting procedure adopted in the baseline analysis.
Figure 8 provides a visual summary of the sensitivity-analysis results by showing the global ORI obtained for each coordination strategy under the baseline configuration and under each one-at-a-time parameter perturbation. This representation makes it possible to assess whether the relative ranking of S1, S2, and S3 remains stable when key model and control parameters are varied.
Table 5 summarizes the resulting global ORI ranges and ranking frequencies for the three coordination strategies. Across the 15 evaluated configurations, including the baseline case and the 14 perturbed cases, S1 remained the weakest strategy in all cases. S3 achieved the best global ORI in 14 out of 15 configurations, while S2 ranked second in 14 out of 15 configurations. The only ranking reversal between S2 and S3 occurred when the BESS droop gain
was increased by 20%, in which case the strengthened droop-based BESS support made S2 marginally preferable in terms of the aggregate ORI.
These results indicate that the main comparative conclusion is robust with respect to moderate parameter perturbations: adaptive coordination generally provides the strongest overall operating robustness, droop-based coordination remains a close and balanced alternative, and fixed-reference coordination remains the least robust option under the tested conditions. At the same time, the sensitivity analysis also reinforces the trade-off interpretation discussed previously. Since S2 can become competitive when the BESS droop gain is increased, the preferred strategy depends not only on the coordination philosophy but also on the relative tuning of storage support, interlinking-converter support, and AC-side voltage preservation.
Therefore, the sensitivity analysis strengthens the validity of the reduced-order comparative results by showing that the observed S3/S2/S1 hierarchy is not solely a consequence of the baseline parameterization. Nevertheless, this analysis remains a screening-level robustness check. Higher-fidelity validation using detailed AC power-flow models, EMT-level converter simulations, harmonic-domain analysis, or hardware-in-the-loop experiments remains necessary before deriving deployment-specific design recommendations.
6.11. Engineering Interpretation and Practical Implications
From an engineering perspective, the results support four main conclusions.
Adaptive coordination is most advantageous for DC-side support under stressed operation. When the system is subjected to renewable intermittency, DC-load increases, or combined disturbances, S3 consistently provides the strongest DC-side robustness. This suggests that adaptive coordination is especially suitable for hybrid AC/DC systems expected to operate near disturbance-prone or renewable-intensive regimes. However, this advantage is accompanied by somewhat higher AC-side voltage-quality-related deviations in several cases.
Droop-based control remains a strong compromise. Although S2 does not match the DC-side performance of S3 in the most demanding cases, it repeatedly provides a balanced compromise between DC support and AC-side preservation. This makes it attractive where implementation simplicity, control transparency, or balanced AC/DC behavior is prioritized. This point is particularly relevant because the ORI difference between S2 and S3 is small in the aggregate comparison.
Fixed-reference control is insufficient in critical operating regions. The results consistently show that S1 is the weakest strategy under severe operating conditions, particularly in SC5. This implies that fixed-reference coordination may be acceptable only in lightly disturbed or conservative operating envelopes.
Strategy selection should be operating-region aware. The preferred coordination strategy depends on whether the operator values:
stronger DC-side voltage support;
lower AC-side disturbance transfer;
lower converter effort;
or global robustness under rare but severe events.
This is precisely why the proposed framework is useful: it does not merely rank strategies, but helps reveal where and why one strategy becomes preferable. In this sense, the framework closes the identified research gap by jointly comparing stability-oriented and voltage-quality-related behavior across scenarios, renewable penetration levels, and converter coordination policies within a unified reduced-order benchmark.
6.12. Limitations of the Present Results
While the results are internally consistent and sufficiently rich for comparative analysis, they should be interpreted within the scope of the adopted reduced-order model.
In particular:
the AC-side indicators are voltage-quality-related proxies, not detailed harmonic metrics;
the converter dynamics are represented at an aggregated averaged level, not by switching-level or EMT models;
the penetration sweep and disturbance amplitudes are structured and informative, but not exhaustive.
These limitations do not invalidate the conclusions. Rather, they define the intended contribution of the paper: a comparative, control-oriented operating assessment framework that identifies critical trends and motivates more detailed future studies. Accordingly, the results should not be interpreted as universal performance guarantees for all hybrid AC/DC distribution systems. They should instead be understood as screening-level evidence showing how different coordination philosophies behave under a consistent set of reduced-order operating assumptions.
Overall, the results demonstrate that hybrid AC/DC distribution systems with high renewable penetration exhibit clear control-dependent trade-offs between DC-side stability and AC-side voltage-quality-related performance. The adaptive coordinated strategy emerges as the most robust solution under severe operating conditions from a DC-side regulation perspective, but the broader findings also show that control selection should be based on the expected operating envelope and not solely on nominal-condition performance.
Accordingly, the present results should be interpreted as comparative system-level evidence intended to identify robust operating trends and critical regions, rather than as a substitute for feeder-specific EMT validation or standards-oriented power-quality certification. Future higher-fidelity validation, including detailed AC power-flow models, EMT-level converter simulations, harmonic-domain analysis, or hardware-in-the-loop testing, is therefore necessary before translating the present screening-level conclusions into deployment-specific design recommendations.
7. Conclusions
This paper presented a reduced-order comparative screening framework for hybrid AC/DC distribution systems with high renewable penetration under variable operating conditions, using stability- and voltage-quality-related indicators. The proposed methodology combined a representative reduced-order hybrid AC/DC system model, a structured scenario-based simulation campaign, and a unified set of DC-side, AC-side, transient, and composite performance indicators to evaluate how different converter coordination strategies influence system behavior across multiple operating regimes. In this study, the term “voltage-quality-related” is used in a reduced-order comparative sense, primarily referring to voltage-deviation-, overshoot-, violation-duration-, and fluctuation-related behavior rather than to detailed harmonic, flicker, unbalance, or standards-compliance power-quality assessment.
The adopted framework was intentionally designed as a comparative and reproducible screening platform, rather than as a converter-switching-level, EMT-level, or utility-specific feeder model. Within this scope, the results demonstrated that the behavior of the considered hybrid AC/DC benchmark is strongly control-dependent and that performance should not be judged solely from nominal conditions or from a single-domain metric. In this way, the proposed framework addresses the identified research gap by jointly comparing DC-side stability-oriented behavior, AC-side voltage-quality-related behavior, converter stress, renewable penetration level, and disturbance severity within a unified scenario-based methodology.
Several main conclusions can be drawn from the present study.
First, the results showed that the adaptive coordinated strategy (S3) provides the strongest DC-side robustness across the full simulation matrix. In particular, S3 systematically achieved the lowest average DC-bus voltage deviations and the best DC-side regulation performance under the most demanding operating conditions. This indicates that adaptive coordination becomes especially valuable when hybrid AC/DC systems operate under renewable intermittency, abrupt load changes, or compounded stress conditions. This conclusion, however, should be interpreted specifically in relation to DC-side voltage regulation and within the reduced-order benchmark adopted in this work.
Second, the droop-based strategy (S2) emerged as a balanced intermediate solution. Although it did not fully match the DC-side performance of S3 in the most severe cases, it repeatedly delivered a favorable compromise between DC-side regulation, AC-side preservation, and implementation simplicity. This makes S2 particularly relevant in situations where robust behavior is desired without the full complexity of adaptive gain scheduling. The relatively close ORI values obtained for S2 and S3 further indicate that S2 remains an attractive option when balanced AC/DC performance is preferred over maximum DC-side stiffness.
Third, the fixed-reference baseline strategy (S1) consistently showed the weakest performance under stressed conditions, especially in the combined-stress scenario (SC5). While S1 remained acceptable in nominal or lightly disturbed operating regions, its performance degraded significantly when renewable generation reduction and load increase occurred simultaneously. This suggests that non-adaptive converter coordination may be insufficient for future hybrid AC/DC distribution architectures expected to operate under higher renewable variability and tighter operating margins.
Fourth, and most importantly, the study revealed a clear trade-off between DC-side stability and AC-side voltage-quality-related behavior. The strategy that best preserved the DC bus was not always the one that minimized AC-side voltage deviation. More specifically, S3 generally improved DC-side regulation at the cost of somewhat larger AC-side voltage-quality-related deviations, while S1 often preserved the AC side better but offered weaker DC support. This finding is central because it shows that control design in hybrid AC/DC systems should be understood as a multi-domain coordination problem, rather than as an isolated DC-bus regulation task. Therefore, adaptive coordination should not be interpreted as universally superior in all respects, but rather as the most effective option when DC-side robustness under stressed operation is the primary design objective.
In addition, the AC-load-step scenario (SC3) confirmed that AC-side disturbances can propagate to the DC subsystem through the interlinking converter, reinforcing the need for joint AC/DC assessment. Similarly, the combined-stress scenario (SC5) consistently emerged as the most critical operating condition in the full screening campaign, making it a particularly informative benchmark for future control evaluation and operating-region analysis. The observed decrease in mean DC voltage deviation with increasing renewable penetration in SC5 was associated with the improved post-disturbance DC-side power balance within the adopted scenario definition; nevertheless, this trend should not be generalized without considering stochastic renewable variability, converter interactions, and detailed network constraints.
From a methodological perspective, the proposed Overall Operating Robustness Index (ORI) proved useful as a compact synthesis tool for ranking strategies and identifying favorable and critical operating regions. However, the results also showed that such composite indices should be interpreted together with the underlying AC-side and DC-side metrics, since aggregate scores alone may hide relevant engineering trade-offs. This is particularly important when strategies have similar ORI values but differ in the way performance is distributed between DC-side robustness and AC-side voltage-quality-related behavior.
The present work should be interpreted within the scope of its modeling assumptions. The AC-side indicators are voltage-quality-related proxies rather than detailed harmonic or standards-compliance metrics, and the converter dynamics are represented through an aggregated reduced-order model rather than detailed EMT-level switching behavior. Furthermore, the AC side is modeled through a voltage-sensitivity representation rather than a full nodal power-flow solver, and the disturbance profiles are structured for comparative screening rather than exhaustive uncertainty characterization. These limitations do not diminish the value of the framework; rather, they define its intended role as a system-level comparative assessment methodology capable of identifying critical trends and guiding more detailed future studies.
Accordingly, several future research directions naturally follow from this work. First, the framework should be extended toward higher-fidelity converter and network models, including more detailed AC feeder representations and explicit harmonic-domain or EMT-based voltage and power-quality analysis. Second, the proposed strategy comparison could be expanded to include predictive, optimization-based, or hierarchical energy management approaches. Third, the scenario set could be enriched with stochastic renewable profiles, uncertainty-aware sensitivity studies, and Monte Carlo analysis, enabling more realistic robustness characterization under uncertain operating conditions. Finally, the framework could be validated against hardware-in-the-loop or experimental microgrid platforms, thereby bridging the gap between comparative system-level screening and deployment-oriented validation.
Within this intended scope, the proposed framework offers a practical and reproducible basis for comparing converter coordination strategies in renewable-rich hybrid AC/DC systems and for guiding higher-fidelity future studies. Overall, the findings of this study indicate that hybrid AC/DC distribution systems with high renewable penetration require operating-region-aware and control-aware assessment. They also show that adaptive converter coordination offers a clear DC-side robustness advantage under variable and stressed conditions, but that this advantage may be accompanied by measurable AC-side voltage-quality-related consequences. This reinforces the need for joint stability- and voltage-quality-related design criteria in future hybrid AC/DC distribution planning and operation.
In summary, the main value of the proposed framework lies in its ability to reveal control-dependent AC/DC trade-offs, identify critical operating regions, and support the preliminary screening of converter coordination strategies before more detailed feeder-specific, EMT-level, harmonic-domain, or experimentally grounded validation is undertaken.