Article

Risk Analysis Based on Multi-Source Data and Artificial Intelligence: A Case Study of Pre-Made Dishes

School of Economics and Management, China University of Petroleum, Beijing 102249, China
*
Author to whom correspondence should be addressed.
Appl. Sci. 2026, 16(10), 5117; https://doi.org/10.3390/app16105117
Submission received: 8 April 2026 / Revised: 16 May 2026 / Accepted: 18 May 2026 / Published: 20 May 2026
(This article belongs to the Section Food Science and Technology)

Abstract

Pre-made dishes have drawn growing attention because of their convenience and rapid market expansion. Their food safety risks, however, are shaped not only by products themselves, but also by the gap between public perception, reported incidents, and inspection records. This study develops a three-stage analytical approach by combining Weibo public opinion data, news media reports, and food inspection records from Gansu Province. First, ERNIE and BERTopic are used to identify public sentiment and discussion topics. The results show that negative sentiment slightly exceeds positive sentiment, with school meals, additives, and food safety as the main concerns. Second, 11,110 pre-made dish-related food safety reports from Food Partner Network are clustered and assessed for incident severity. The results point to drug residues in aquatic products, microbial contamination in egg products, authenticity disputes over meat ingredients, and quality issues in frozen composite foods. Third, based on the 2024 official definition, 12,121 inspection records are screened, and 2783 definition-constrained pre-made dish-associated products are retained. Six imbalanced classification models are then constructed. The Weight + RF model performs relatively well for starch and starch products, with a Precision of 0.7857, an AUC-ROC of 0.7778, and an MCC of 0.4429. The study provides a reference for risk identification and inspection resource optimization under limited pre-made dish inspection data.

1. Introduction

Due to changes in factors such as pace of life, household size, and economic conditions, ready-to-cook meals (pre-made dishes/ultra processed foods) have also gained increasing attention and popularity for their convenience, time-saving benefits, and diverse options [1]. In the United States, consumers focus on the healthiness of the ingredients in pre-made dishes. According to statistical reports from SPINS, the retail sales of plant-based foods in the U.S. reached 7.4 billion U.S. dollars and 8 billion U.S. dollars in 2021 and 2022 respectively. In Japan, consumers pay more attention to the functionality of food, such as pre-made dishes that help with weight loss, reduce high blood pressure, high blood sugar, and high blood lipids, enhance immunity, and promote beauty.
In 2023, the No. 1 Central Document explicitly proposed for the first time the cultivation and development of the pre-made dishes industry [2]. As a representative industry integrating primary, secondary, and tertiary sectors, pre-made dishes closely connect production areas, enterprises, and markets through processing and distribution chains, and promote industrial clustering and cross-sector integration via industrialized approaches. It has made the industry a key driver for agricultural development and rural revitalization in China. Evidently, pre-made dishes have emerged as a significant research focus within the field of agricultural product processing and the food industry, attracting growing attention both domestically and potentially of interest to the international community in terms of its innovative model for industry integration and rural economic development.
However, the pre-made dishes industry currently lacks comprehensive national-level standards, and certain deficiencies exist in quality supervision, posing obstacles to its standardized and regulated development. With the rapid growth of industry, public concerns regarding nutritional value, taste, and food safety have increasingly emerged. Controversial topics such as “pre-made dishes entering campuses” and “restaurants using pre-made dishes without proactively informing consumers” have sparked widespread debate. These concerns not only affect consumer acceptance of pre-made dishes but also present challenges to the long-term healthy development of the industry. Therefore, establishing and improving relevant standards, as well as enhancing product quality, are crucial for the sustainable development of the pre-made dishes industry.
The consumption boom of pre-made dishes in the Chinese market began in 2021. Given the relatively short time span, research on pre-made dishes in China remains limited. Studies examining consumer attitudes and purchase intentions toward pre-made dishes have primarily relied on traditional methods such as surveys and targeted consumer interviews [3,4]. These approaches face limitations in sample size and selection bias, which may prevent the findings from accurately reflecting reality [5]. In the era of big data, consumer attitudes toward emerging products have become a critical basis for product optimization and market decision-making. Traditional food inspection is constrained by labor and cost, making it difficult to cover wide regions and often resulting in delayed information. Social media platforms, which aggregate large volumes of user feedback, provide a novel approach for high-frequency and wide-coverage risk analysis. Following common industry practice, this study classifies the pre-made dishes discussed on social media into three types: ready-to-eat, ready-to-heat, and ready-to-cook. The subsequent public opinion analysis covers all three types.
Sentiment analysis enables the rapid identification of negative emotions related to pre-made dishes, allowing early detection of cognitive risk signals. At the same time, analyzing sentiment distribution across dimensions such as region and topic helps identify areas with high public attention and sensitive groups, facilitating targeted interventions. Regulatory authorities can respond promptly and carry out focused inspections in these regions. However, due to limited regulatory resources and imbalanced sample data, it is challenging to conduct comprehensive inspections across all regions and categories of pre-made dishes. Large-scale, high-frequency inspections would face substantial constraints in both manpower and financial resources. Therefore, from the perspective of resource allocation efficiency, it is crucial to develop an inspection optimization model based on a “high-risk–high-attention” framework, to design scientific and efficient inspection strategies.
Machine learning and deep learning models have been widely applied in sentiment analysis of social media data, yet these methods have not been extensively explored in the context of the pre-made dishes market. This study applied advanced machine learning and deep learning techniques to identify risks associated with pre-made dishes from multiple dimensions, including public opinion and sampling inspection data. By analyzing Weibo posts, the study captures a large-scale and comprehensive picture of public concerns, negative sentiments, and hotspot regions. Compared with previous studies, this paper does not aim to improve a single model in isolation. Instead, it places three types of risk signals within a sequential analytical path. Weibo data are used to identify perceived risk among the public. News reports are used to capture documented food safety incidents. Inspection records are then used to build a predictive model for regulatory resource allocation. Since the three data sources differ in spatial coverage and data-generation mechanisms, this study does not treat them as a fully fused model. Rather, it develops a sequential risk analysis approach that links public perception, documented incidents, and inspection optimization under the current data conditions.
The rest of this paper is organized as follows. Section 2 provides a literature review. Section 3 analyzes public opinion risks of pre-made dishes based on Weibo data. Section 4 identifies pre-made dish-related food safety incidents based on news media reports. Section 5 constructs imbalanced classification models using definition-constrained inspection data. Section 6 concludes the study and discusses future research directions.

2. Literature Review

2.1. Emerging Social Media Data

As an emerging information resource, social media data has become an important window for academia and enterprises to study consumer attitudes [6,7]. Social media data not only reveals individual interests and preferences [8,9], but also captures subtle shifts in social trends and public sentiment [10]. In many fields, such as marketing and political analysis, social media data has become a powerful complement to traditional data sources [11,12]. Compared with traditional surveys, social media data offers advantages such as real-time availability, wide coverage, and relatively low cost [13]. These characteristics enable social media data to accomplish tasks that traditional survey data cannot, such as rapidly capturing public reactions to emergent events or conducting in-depth analysis of public opinions on specific industries [14,15]. Consequently, the analysis and application of social media data are gradually becoming an important branch within modern data science. Allen et al. [16] proposed a k-means latent Dirichlet allocation (KLDA) algorithm to efficiently generate the observations required for Bayesian updates. It demonstrates that modeling social media can significantly improve the timeliness and accuracy of decision analysis.
In the food sector, techniques such as natural language processing have demonstrated great potential for multidimensional analysis of social media data [17,18]. Singh et al. [19] collected data from Twitter and applied Support Vector Machines (SVM) combined with resampled hierarchical clustering to identify supply chain management issues in the food industry. Ramandita et al. [20] obtained Twitter data and used K-means clustering along with the Simple Additive Weighting (SAW) algorithm to extract food sales trends, comparing the results with local restaurant data and achieving an accuracy of 72.75%. Trivedi and Singh [21] conducted sentiment analysis of three food delivery companies using dictionary-based classification and text mining on Twitter data. Xia et al. [22] collected trending events under the food safety topic on Zhihu and applied natural language processing and social network analysis to study public opinions. Yuan et al. [23] gathered Weibo data and used named entity recognition to extract food safety-related entities, constructing a regulatory knowledge graph for the food safety domain. Compared with traditional survey methods, social media data can provide larger-scale, real-time, diverse, and more comprehensive insights into public opinions and behaviors [24]. However, limited studies to date have explored consumer attitudes toward pre-made dishes by collecting social media data.

2.2. Sentiment Analysis

Sentiment analysis, as a key research direction in the field of natural language processing, has long attracted significant attention from the academic community. However, the emergence of massive data volumes has also posed challenges for sentiment analysis. In recent years, pre-trained models based on the Transformer architecture (e.g., BERT, GPT) have demonstrated excellent performance and strong transfer capabilities by learning general language representations from large-scale text corpora and then being fine-tuned for specific sentiment analysis tasks [25,26].
The use of BERT-based models for sentiment analysis has become a mainstream trend in academia [27,28]. Talaat [29] combined BERT with BiLSTM and BiGRU models to capture both local and global sentiment features, demonstrating that hybrid models perform better on multilingual datasets and emoji-rich short texts, especially in social media contexts. Wen et al. [30] explored the application of BERT and ERNIE models in sentiment analysis of online hotel reviews in China. It found that ERNIE outperformed BERT in classification accuracy and stability, particularly when handling Chinese text. Aziz et al. [31] proposed a unified model combining BERT with multi-layer Graph Convolutional Networks (GCN), effectively capturing sentiment tendencies across different aspects of text and improving fine-grained accuracy. Li et al. [32] compared the performance of BERT, RoBERTa, DistilBERT, and ALBERT on sentiment analysis of airline customer reviews, showing that RoBERTa achieved higher accuracy and F1 scores, particularly in processing informal language and abbreviations. Zhao et al. [33] enhanced aspect-based sentiment recognition by integrating BERT-generated text with a filtering algorithm, achieving superior results across multiple benchmark datasets. Darraz et al. [34] integrated BERT-based sentiment analysis into hybrid recommendation systems to provide recommendations more aligned with user preferences. Teplova and Fayzulin [35] examined how social media sentiment affects Russian stock returns and trading volume. The sentiment indicators significantly explain returns, with heterogeneous investor behavior.
Overall, the application of large pre-trained models in sentiment analysis has been matured, and various derived models focus on different strengths, including contextual understanding, computational efficiency, and multilingual adaptability.

2.3. Food Safety Risks

In recent years, a substantial body of literature has employed platforms such as Weibo, Twitter, and review sites to investigate consumer trust, safety concerns, and risk communication in food systems. Researchers have explored multiple approaches to enhance food safety analysis and risk prediction. Marvin and Kleter [36] studied various passive and active food safety alert systems, including the European Food Safety Authority’s “European Media Monitoring System” and “Emerging Risk Detection Support System,” which are specifically designed to extract potential risk signals from news reports and effectively assist in identifying and managing food safety risks. Yu [37] collected internet user information related to physical discomfort and safety concerns, demonstrating that platforms could issue a “yellow warning” three months in advance, highlighting the practical utility of online news in predicting food safety risks. Lu and Jun [38] proposed constructing an early warning system integrating dynamic online data, emphasizing that such models should be open, flexible, and real-time. Compared with media information, sampling inspection data is more systematic and commonly used to develop institutionalized risk prediction mechanisms.
Regarding risk identification models, Geng et al. [39] combined the Analytic Hierarchy Process (AHP) with a deep radial basis function neural network (DRBF) to integrate and classify provincial sampling inspection data, significantly enhancing the model’s generalization ability under high-dimensional sparse data. Yin et al. [40] integrated multivariate linear models for factor identification and catastrophe progression method for risk modeling provides methodological innovation. Zuo et al. [41] proposed an unsupervised autoencoder (AE) model that automatically detects anomalous samples in inspection data and generates warning reports through expert review.
Beyond algorithmic models, research has also focused on embedding sampling-based early warning systems into specific industry contexts to facilitate early intervention and decision support. Wang and Yue [42] developed a dairy product risk early warning system integrating the Internet of Things (IoT), association rule analysis, and expert decision mechanisms, demonstrating accurate risk identification and decision support. Liu et al. [43] constructed a fully automated food warning system using unsupervised anomaly detection and Bayesian networks, successfully predicting dairy safety risks in six European countries with early warnings issued up to 12 months in advance. Focker et al. [44] compared several monitoring strategies with the aim to determine the optimal control points for dioxin monitoring and identified feed mills and fat melting facilities as optimal dual-monitoring points to minimize costs.
Overall, integrating social media with sampling inspection data to construct multi-source, dynamically updated, and intelligence-driven food safety risk warning systems can improve the comprehensiveness of risk identification, timeliness of response, and scientific basis of decision-making. This study combines Weibo-based public opinion analysis with sampling data feature analysis to identify latent risks in the circulation stage of pre-made dishes, providing decision support for regulatory authorities to develop scientifically sound inspection strategies.
In the existing literature, multi-source data fusion studies on food safety early warning have mostly focused on traditional categories such as dairy and meat products. Work targeting the emerging pre-made dish industry is very limited. The risk profile of pre-made dishes has its own specificities. Ready-to-cook and ready-to-heat products are susceptible to microbial proliferation or packaging damage caused by temperature fluctuations during cold chain storage and transport. Ready-to-eat products face problems such as cross-contamination in central kitchens, flavor deterioration, and nutrient loss after reheating. Improper thawing and storage at the consumer end further increase terminal risk. These hazards span different product forms and have not yet been adequately represented in existing early-warning models. Building an analytical framework that can simultaneously capture social media cognitive signals and inspection anomaly signals is key to filling this gap.

3. Public Opinion Risk Analysis of Pre-Made Dishes Based on Weibo Data

3.1. Data Collection and Preprocessing

Based on topic popularity, this study collected all posts and comments under the top 200 most popular topics related to pre-made dishes from 27 October 2022 to 27 October 2023 (12 months). This window covers key policy milestones such as the first inclusion of pre-made dishes in China’s No. 1 Central Document (February 2023) as well as routine daily discussions. No major nationwide pre-made dish food safety incident occurred during this period, so the window can be regarded as a public opinion cycle that includes a policy shock but approximates a steady state, offering a reasonable reflection of general public risk perception. It includes 27,778 posts and 57,967 comments, linked through identical ID encoding to facilitate subsequent data processing and sentiment analysis within corresponding topics. Each data entry contains publisher ID, post or comment content, publication time, location, user gender, number of likes, number of comments, number of reposts, and link. To ensure data quality and relevance, entries containing only topic tags, entries consisting solely of emojis, and entries with a character length less than or equal to six are deleted. Manual review is conducted to remove posts irrelevant to the topic of pre-made dishes along with their associated comments linked via ID, resulting in a total of 72,694 valid entries.
Sentiment labels were generated through a combination of manual annotation and rule-based enhancement. A random sample of 8000 valid entries was independently annotated by three trained annotators as positive, neutral, or negative, with the final label determined by majority voting. The inter-annotator agreement measured by Fleiss’ Kappa was 0.81. The remaining data were first auto-labeled using a preliminary ERNIE model trained on the annotated set and then corrected through manual spot-checking to ensure overall label quality. The final labeled dataset contained 30,512 positive, 18,452 neutral, and 23,730 negative entries. While this distribution is imbalanced, it reflects the naturally occurring sentiment mix in public discussions of pre-made dishes.

3.2. Model Tuning

Table 1 and Table 2 present the hyper-parameter search space settings and search results with Bayesian hyper-parameter adjustments. It should be noted that the number of hidden layers in the original model is kept unchanged. The reason is that the adjustment of the number of hidden layers will invalidate all the operators obtained by the original model through a large number of training, thus losing the properties of the pre-trained model, and unable to retain the original pre-trained knowledge and optimization results. Therefore, to fully leverage the advantages of the pre-trained model, this study keeps the number of hidden layers fixed and only tunes other hyper-parameters.
During fine-tuning, the labeled data were randomly split into training, validation, and test sets at a ratio of 60%/20%/20%, preserving the original class distribution. Training epochs were set to 5, with early stopping enabled (patience = 1) monitoring validation loss to control overfitting.

3.3. Selection of Benchmark Models and Performance Evaluation

3.3.1. Selection of Benchmark Models and Evaluation Metrics

ERNIE (Enhance Representation through Knowledge IntEgration), as a knowledge-enhanced pre-trained model launched by Baidu, demonstrates outstanding performance in the field of natural language processing through multi-granularity knowledge modelling and knowledge distillation techniques. Its pre-trained corpus spans multiple domains, including news, forums, and social media texts. Built on the Transformer framework, ERNIE leverages knowledge enhancement to achieve superior performance, enabling shorter convergence times and reduced fine-tuning costs under the same computational budget. The dataset used consists of Weibo posts and comments, which are short, informal, and non-standardized texts. Therefore, ERNIE is chosen as the primary model for sentiment analysis and is compared with benchmark models including Bi-LSTM, LSTM, CNN, CNN-LSTM, SVM, and Sentence-BERT.
Common evaluation metrics for text classification include Accuracy, Precision, Recall, and F1 score, with the F1 score providing a balanced measure of both precision and recall. In order to avoid the imbalance of the model’s prediction of a few categories, the Macro F1 Score is used to evaluate. This metric assigns equal weight to each class, better reflecting the model’s overall balanced performance.

3.3.2. Model Performance Comparisons

Due to the limitation of computing power, this study evaluates seven models: Sentence-BERT, ERNIE, LSTM, Bi-LSTM, CNN, CNN-LSTM, and SVM. Table 3 shows the comparison results of these models, where the large language models perform best, with ERNIE achieving an accuracy of 0.8803, surpassing Sentence-BERT’s 0.8285. Although Sentence-BERT excels at generating high-quality sentence embeddings, it is somewhat less effective when processing highly non-standard everyday language. Sentence-BERT mainly captures semantic similarity through sentence embeddings, but for short Weibo comments, semantic similarity models perform worse in fine-grained sentiment classification compared to ERNIE.
Deep learning models such as LSTM and CNN-LSTM perform moderately, with LSTM achieving an accuracy of 0.7370 and CNN-LSTM 0.7492, benefiting from their ability to model temporal and spatial features, but their shallow feature representations limit further performance improvements. Traditional machine learning models like SVM perform relatively poorly, with an accuracy of 0.6294 and an F1 score of 0.6186, due to their inability to fully utilize contextual information and weak feature representation, placing them at a natural disadvantage compared to deep learning and pre-trained models. Therefore, ERNIE demonstrates a clear advantage in handling complex language tasks.

3.4. Analysis of Experimental Results

3.4.1. Region Analysis

This study adopts the following criteria for defining “high risk.” At the risk perception level, a topic or region is designated as a “high-risk concern zone” if its proportion of negative sentiment exceeds 50% and its comment volume ranks in the top 30%. At the inspection prediction level, the non-compliance probability threshold is provisionally set at the proportion of unqualified samples in the training set and can be dynamically adjusted according to regulatory tolerance.
This study first conducts sentiment analysis on Weibo comments, categorizing posts into positive, neutral, and negative sentiments, and then calculated the proportion of each sentiment category by region. Regions with relatively small data volumes are merged into an “Other” category. Table 4 shows that the relatively high proportion of negative sentiment in Tibet (60.00%) and Shanghai (56.27%) may be related to local food culture and consumer wariness toward industrialized food products. However, this inference is based on descriptive data and cannot exclude the influence of factors such as sample composition or media coverage bias. Consumers in Tibet tend to pay relatively high attention to food safety, while those in Shanghai, given the city’s higher level of economic development, tend to have stricter demands for food quality. Both factors may contribute to the elevated negative sentiment proportions, though these associations currently only manifest as statistical distribution patterns and require verification through dedicated consumer behavior surveys. The concentration of negative sentiment may also reflect, to some extent, consumer skepticism toward industrialized and standardized production processes, particularly regarding additives, preservation methods, and taste. However, this interpretation should be treated with caution. Positive sentiment proportions are generally low across provinces, with Ningxia being the highest (26.44%) and Tibet the lowest (14.55%), indicating a relatively low overall acceptance of pre-made dishes among consumers in most regions.
As a modern convenience food, pre-made dishes offer high convenience, especially in first-tier cities, yet face certain consumer skepticism regarding quality, health, and taste. This phenomenon is reflected in the present data, but its underlying causes require further investigation. With increasing health awareness, some consumers may weigh convenience against healthiness, leading to lower acceptance. The proportion of neutral sentiment is relatively balanced, likely because pre-made dishes are a relatively new industry and most people maintain a cautious or wait-and-see attitude, particularly concerning food safety and health. Among regions, Taiwan has the highest proportion of neutral comments (45.09%), while Macau has the lowest (23.86%). The relatively high proportion of neutral sentiment in Taiwan may suggest a gradually increasing recognition of pre-made dishes, while consumers remain cautious about potential health risks. The presence of positive sentiment may also indicate that certain high-quality, health-compliant pre-made dish brands are gradually gaining acceptance in the local market. In Macau, given the relatively open market environment and high consumer diversity, attitudes toward pre-made dishes appear more polarized. These observations are drawn from the available data and have not yet been substantiated through in-depth consumer interviews or questionnaire verification.

3.4.2. Topic Analysis

BERTopic is a topic modeling method based on the Transformer architecture. Its core logic combines semantic embeddings generated by language models such as BERT with an improved TF-IDF weighting mechanism (c-TF-IDF), using clustering algorithms to automatically identify latent topics. This model can capture contextual semantic relationships between words while retaining keywords in the topic output, providing strong interpretability and stability, making it particularly suitable for large-scale processing of unstructured text. Considering that Weibo comments are in Chinese and contain many non-standard expressions and sentiment words, this study uses the “paraphrase-multilingual-mpnet-base-v2” model from the sentence-transformers library, which supports multilingual semantic modeling, during the embedding phase. In the embedding phase, the “paraphrase-multilingual-mpnet-base-v2” model from the sentence-transformers library was used. For dimensionality reduction, UMAP was configured with n_neighbors = 15 and n_components = 5. For clustering, HDBSCAN was set with min_cluster_size = 150 and metric = ‘euclidean’. The number of topics was automatically determined by HDBSCAN. Topic coherence scores (C_v) were then computed; topics with scores above 0.45 were retained, and semantically overlapping topics were manually merged.
To more clearly reflect the core content and key characteristics of the data, two researchers independently grouped the automatically generated topics based on keyword overlap and semantic coherence. Discrepancies were resolved through discussion. Topics with fewer than 100 associated comments were merged into semantically adjacent clusters. This process resulted in eight main research directions: everyday consumption scenarios, live-stream sales trends, application in campus and children’s diets, the impact of the Japanese nuclear wastewater incident, regulatory and standardization issues, negative perceptions and fertility-related controversies, transparency in the catering industry, and industry development and market trends. Table 5 provides detailed information on the number of topics, the number of related comments, and their respective proportions for each research direction.
Overall, public discussions under various topics show relatively distinct sentiment differentiation. However, this differentiation cannot be simply attributed to any single factor. In terms of discussion volume, the topic “Application in Campus and Children’s Diets” accounts for the largest share at 34.87%, reflecting strong societal concern for campus food quality and children’s healthy eating. Sentiment analysis results show that consumer acceptance of pre-made dishes varies across scenarios. Topics such as “Industrial Growth and Market Trends” and “Everyday Consumption Scenarios” are dominated by positive and neutral comments, suggesting that the public holds relatively positive expectations toward the future development and daily use of pre-made dishes. In contrast, in contexts involving additives, the introduction of pre-made dishes into campuses, and the nuclear wastewater incident, negative comments are more prominent, preliminarily indicating heightened public concern about food safety and health risks. It should be noted, however, that these conclusions are based on descriptive data and do not yet carry causal explanatory power regarding consumer behavior. Overall, the above explanations of regional and topical sentiment differences are based on descriptive statistics and do not yet carry causal attribution validity. Future research incorporating questionnaire surveys or in-depth interviews would be valuable for further verification.

4. Clustering and Risk Assessment of Pre-Made Dish-Related Food Safety Events Based on News Reports

4.1. Data Source and Preprocessing

Section 3 mainly reflects the public’s perceived risk of pre-made dishes. To complement this perspective, this section introduces news media reports to identify food safety incidents that have been publicly documented. Compared with social media posts, news reports usually contain more complete information on event background, product names, locations, and regulatory responses. They therefore provide a useful supplement to the Weibo-based analysis.
The data are collected from the news section of Food Partner Network, which regularly reports food safety-related incidents. Pre-made dishes and related products are used as search targets. After cleaning and deduplication, 11,110 valid records are obtained. Each record contains the news title, main text, publication time, and a brief summary. According to the source of the event, the reports are grouped into four types: domestic and international inspection notifications, official discoveries, media undercover investigations, and consumer complaints.

4.2. Method

TextRank is first used to extract keywords from news titles and main texts. Named entity recognition is then applied to identify food names and geographic locations. Since a news event is usually represented by its title, body text, and entity information, a comprehensive similarity measure is constructed. It combines title similarity, body text similarity, and entity similarity:
s i m T 1 , T 2 = α s i m V S M T i t l e T 1 , T 2 + β s i m V S M B o d y T 1 , T 2 + γ s i m N E R T 1 , T 2
Title and body text similarities are calculated using a vector space model. Entity similarity is calculated using the Jaccard similarity of food names and locations. Following previous studies, the weights are set as α = 0.48, β = 0.21, and γ = 0.31. The Single-Pass clustering algorithm is then used for topic discovery, and incident severity is measured using document frequency and mutual information.

4.3. Results

The clustering results show that high-severity incidents are mainly related to aquatic products, egg products, meat ingredients, fried foods, and frozen composite foods. The top five event categories are shown in Table 6.
These topics correspond to drug residues in aquatic raw materials, microbial contamination in egg products, authenticity disputes over meat ingredients, processing risks in fried foods, and quality issues in frozen composite foods. Compared with Weibo data, news reports provide more direct evidence of documented food safety incidents. The two sources overlap in some cases but diverge in others. For example, Guangdong shows a high share of negative sentiment in the Weibo data and also appears in high-severity news topics. Tibet and Shanghai show high negative sentiment but do not appear among the high-severity news clusters. It suggests a gap between perceived risk and documented event risk.

5. Optimization of Sampling Schemes Based on Imbalanced Data

Section 3 identified perceived risk in public discussions of pre-made dishes. Section 4 further captured documented food safety incidents from news reports. Together, the two sources suggest that pre-made dish risk involves both public concern and concrete product-related incidents. Guangdong shows elevated risk in both sources, while Tibet and Shanghai mainly show higher negative sentiment but do not appear among the high-severity news clusters. Based on this difference, this section uses inspection data to build a risk prediction model and provide quantitative support for regulatory resource allocation.
It should be noted that the Weibo data cover nationwide discussions, and the news reports also have cross-regional coverage, while the inspection data used in this section come from Gansu Province. To partly address this spatial mismatch, Weibo comments from Gansu users are extracted for comparison. Among Gansu users, positive, neutral, and negative sentiment accounted for 26.04%, 31.25%, and 42.71%, respectively. The negative share is lower than that in high-attention regions such as Guangdong, Tibet, and Shanghai, but the overall pattern still shows a notable proportion of negative sentiment. Therefore, the Gansu inspection data provides a provincial-level case for model validation, but the findings should not be interpreted as nationally representative.

5.1. Data Collection and Preprocessing

5.1.1. Selection of Research Subjects and Definition-Constrained Screening

Pre-made dishes did not receive a clear national regulatory definition until 21 March 2024. According to the joint notice issued by the State Administration for Market Regulation and other departments, pre-made dishes are pre-packaged dishes made from one or more edible agricultural products and their processed products. They are produced through industrial pre-processing, contain no preservatives, and are intended to be consumed after heating or cooking. The notice also excludes fresh-cut vegetables, staple foods, dishes prepared by central kitchens, and unpackaged bulk foods.
Since public inspection databases still lack a sufficiently large dedicated dataset for pre-made dishes, this study no longer uses broad food categories as the research object. Instead, the original inspection records are screened according to the official definition. The screening follows two principles. First, products clearly excluded by the official definition or weakly related to the pre-made dish supply chain are removed. These include flour, rice, dried noodles, instant noodles, steamed bread, pastries, bread, edible oils, condiments, beverages, fresh vegetables, and fresh fruits. Second, products closely related to industrial pre-processing, reheating or cooking, and the pre-made dish supply chain are retained. These include starch noodles, vermicelli, wide noodles, hotpot starch noodles, pickled vegetables, sauerkraut, canned foods, dried vegetables, edible fungi products, preserved fruit products, and dried aquatic products.
The retained records are not described as dedicated inspection data for strictly defined pre-made dishes. Instead, they are defined as “definition-constrained pre-made dish-associated products.” This wording better reflects the current data conditions and avoids equating broad traditional food categories with pre-made dishes. After screening, 2783 records are retained from 12,121 original records, including 1063 high-relevance products and 1720 general-relevance products. Among them, 185 are non-compliant, with a non-compliance rate of 6.65%.

5.1.2. Data Collection and Descriptions

According to the Gansu Province Food Safety Supervision and Sampling Inspection Work Plan, the obtained inspection data indicators include product name, judgment result, specification/model, production date, manufacturer address, notification date, and inspection level (national, provincial, or municipal). The sampling inspection scheme is dynamically adjusted based on food safety risks, flexibly allocating inspection efforts according to different seasons, regions, and food categories. During high-risk seasons, the inspection frequency for key food items is increased, inspection intensity is strengthened in regions with frequent issues, and the coverage of different food categories is optimized by combining historical data and risk assessments to ensure precise and efficient supervision.
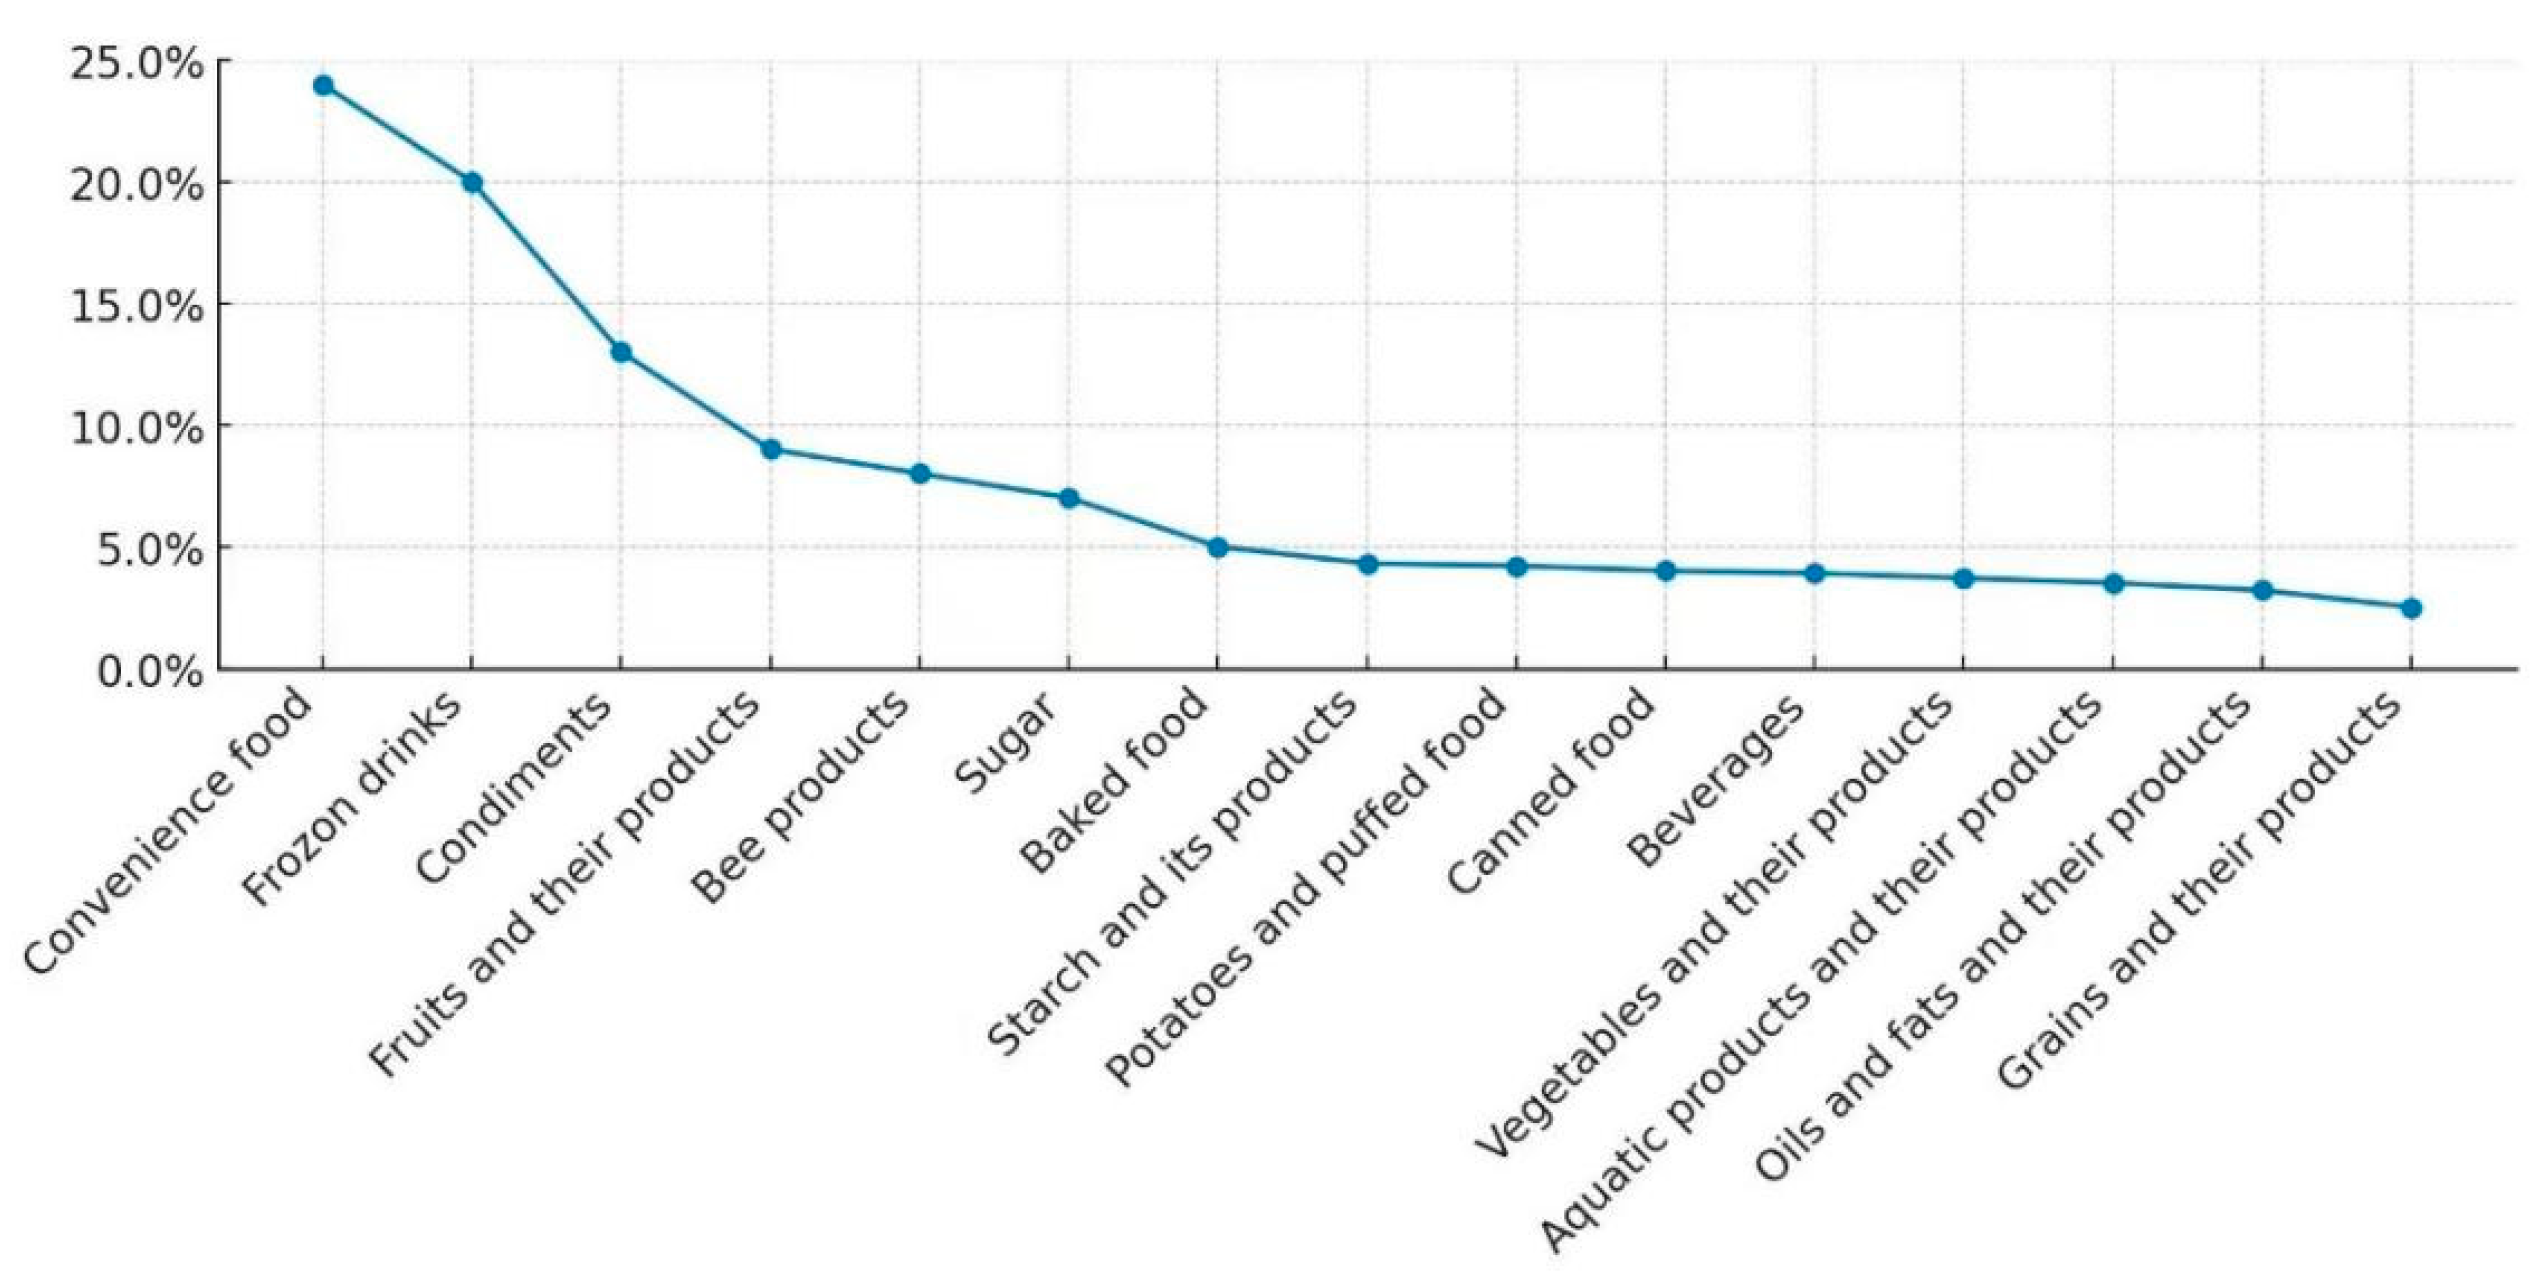
A total of 12,121 food inspection records are obtained, including 668 non-compliant samples, with a non-compliance rate of 5.51%. After definition-constrained screening, 2783 pre-made dish-associated product records are retained. Among them, 185 are non-compliant, with a non-compliance rate of 6.65%. The retained samples are mainly concentrated in starch and starch products, fruit products, vegetable products, aquatic products, canned foods, and a small number of grain products. To further analyze the specific distribution characteristics of food safety risks, this study conducts a cross-sectional comparison of unqualified rates across different food categories. Figure 1 and Figure 2 provide the general risk background of the full inspection records. The subsequent modeling analysis uses only the definition-constrained pre-made dish-associated product records. From the perspective of food production license classification, Figure 1 shows a horizontal comparison of the overall unqualified of top 15 food categories by the number of inspection batches from 2022 to 2024.
From a cross-sectional perspective, the unqualified rate ranges from zero to a maximum of 23.75%, reflecting uneven safety risks across different food categories and considerable risk fluctuations. Therefore, a uniform inspection standard and fixed inspection frequency cannot effectively cover all potential risk points, nor can they precisely target high-risk categories for prioritized inspections. Optimizing the sampling inspection scheme based on this uneven data allows regulatory authorities to focus on high-risk categories first, enhancing the precision of inspections under limited resources and budgets.
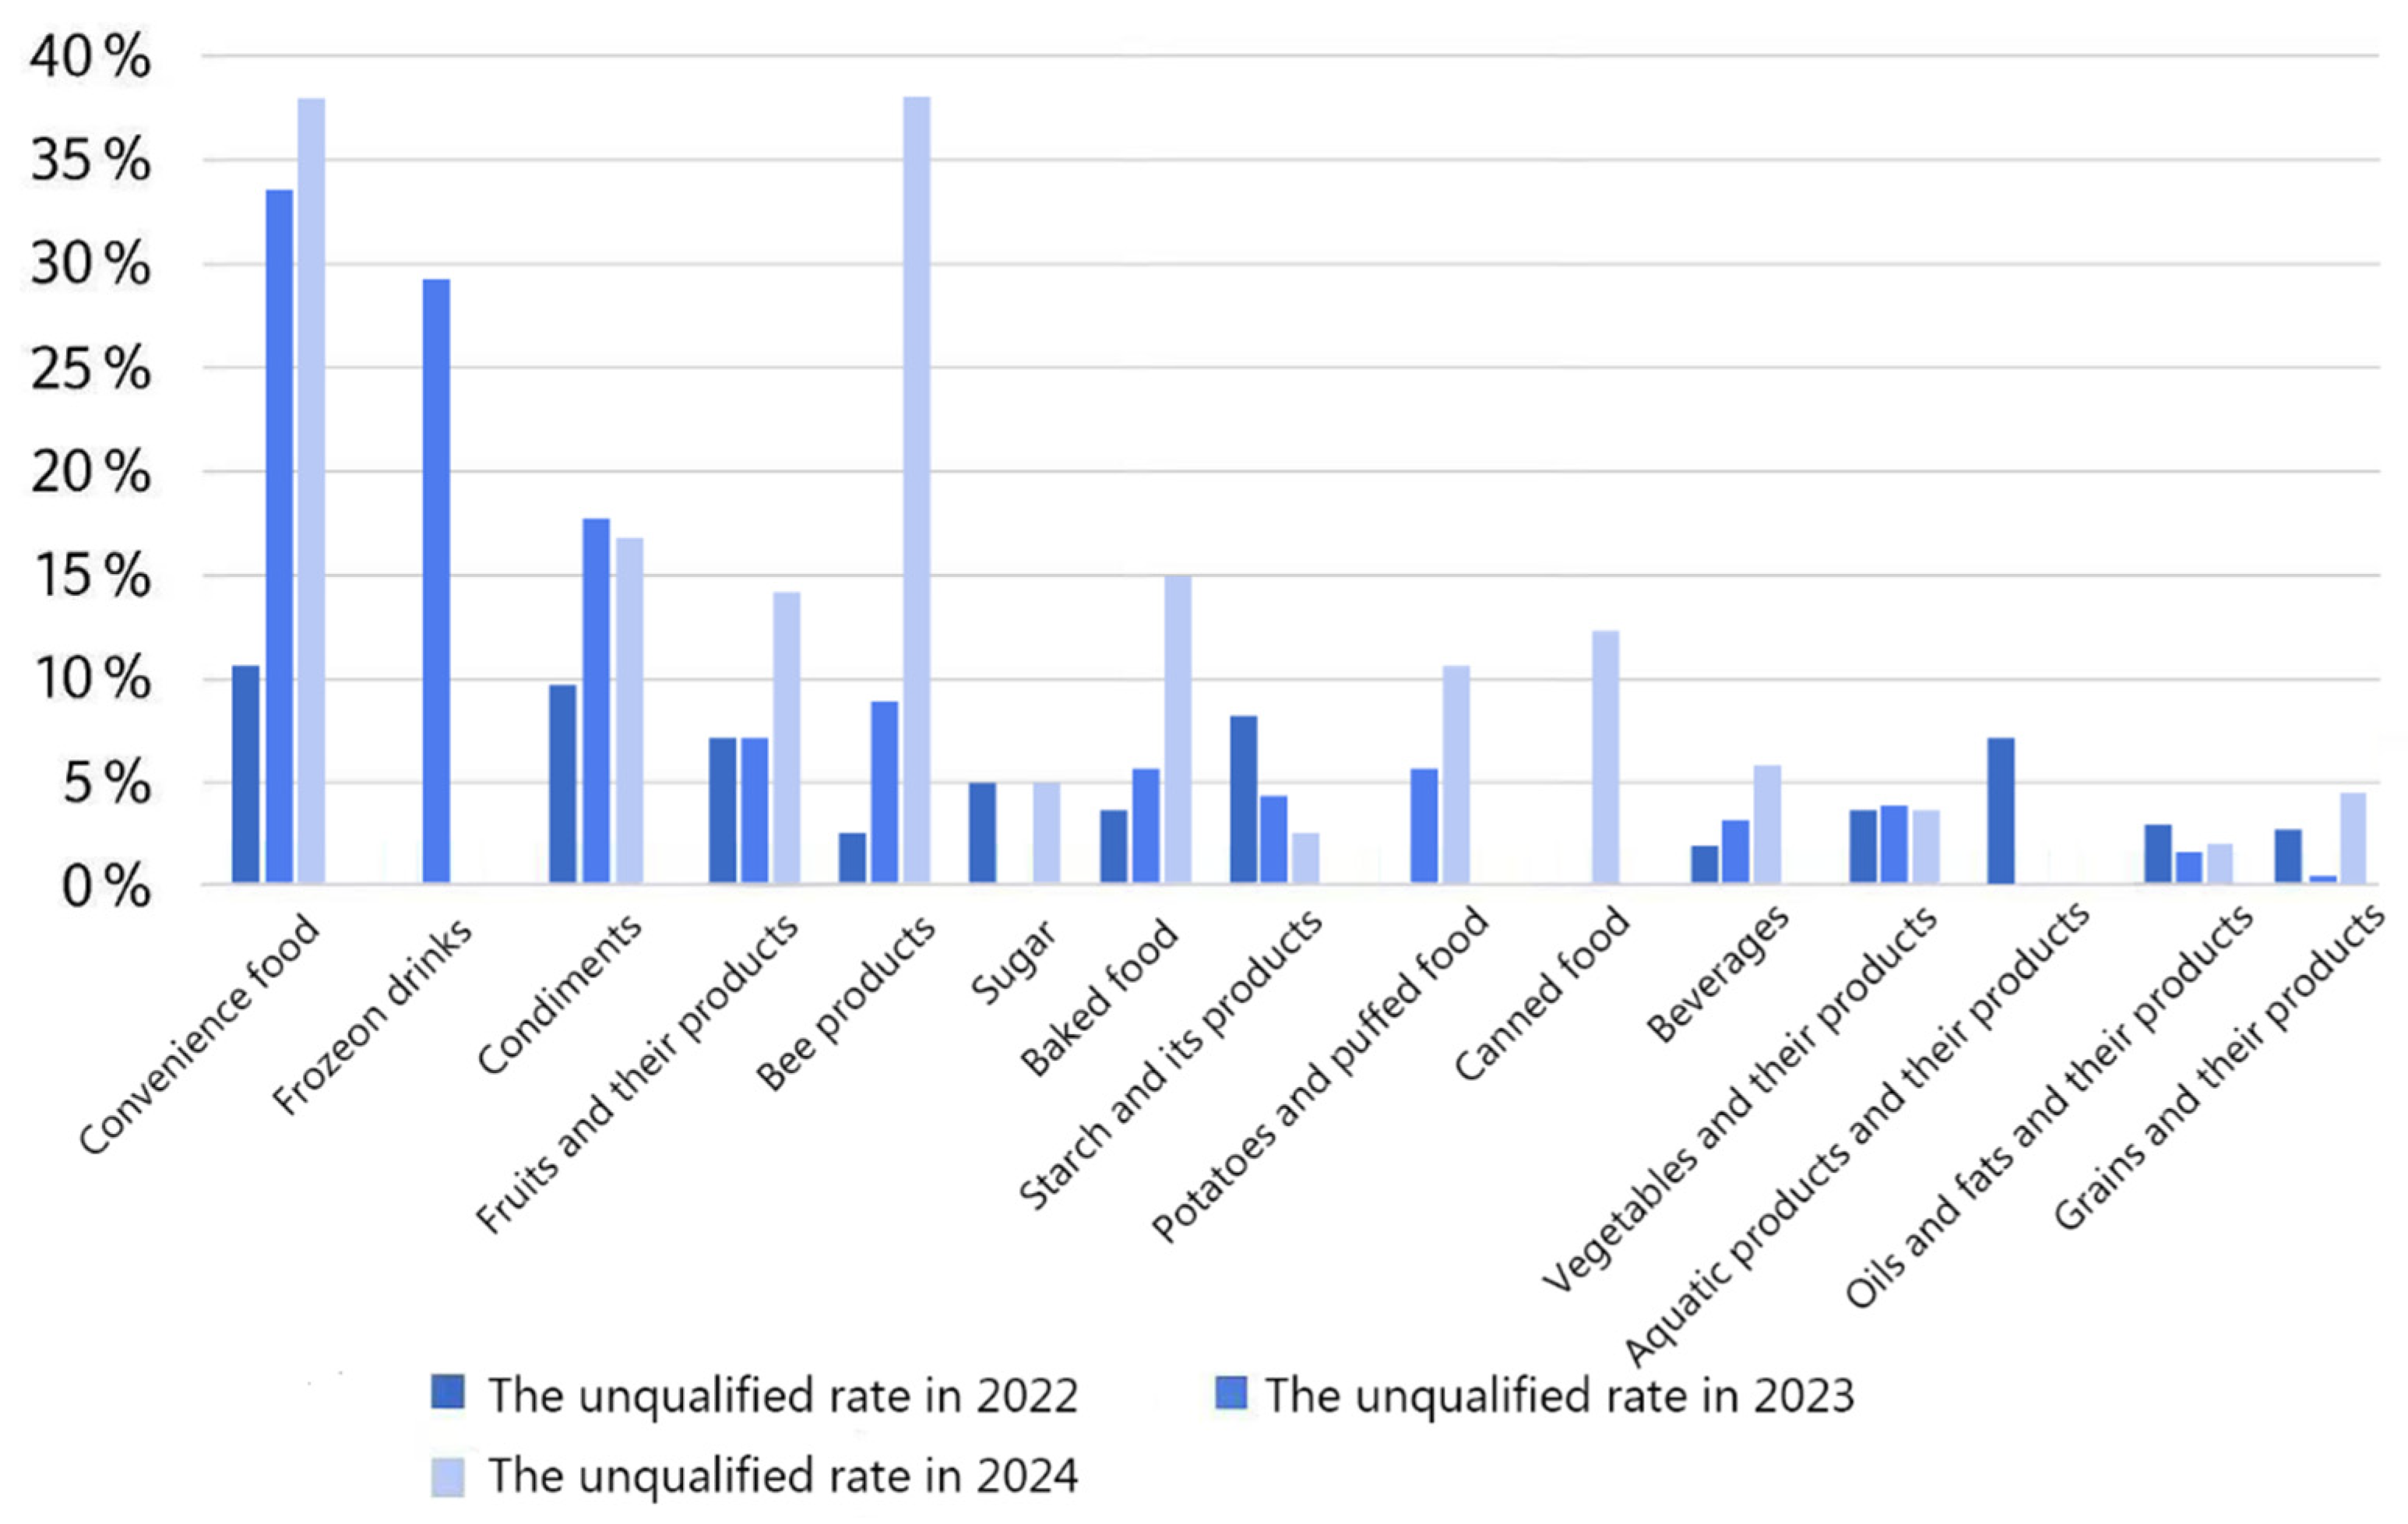
Moreover, to reveal the temporal trends of sampling qualification of major food categories in different years, Figure 2 shows longitudinal analysis of the unqualified of 15 food categories from 2022 to 2024.
From a longitudinal perspective, the unqualified rates of different food categories vary from year to year. In 2022, sugar starch and its products exhibited higher unqualified rates. In 2023, issues were more prominent in frozen beverages and condiments. In 2024, problems were concentrated in convenience foods, fruit products, bee products, baked goods, puffed foods, canned foods, and beverages. High unqualified categories differ significantly across years. These annual differences are related to the focus of the inspection schemes in each year and may result from factors such as consumption trends, production technologies, or policy adjustments, which cause certain food categories to have more pronounced quality issues in specific years. This highlights the dynamic nature of food safety issues, requiring regulatory authorities to flexibly adjust inspection strategies to address food safety risks in different years. In this context, risk prediction based on food characteristics to optimize inspection schemes can improve inspection efficiency and the ability to detect risks.

5.1.3. Data Feature Attributes

There are significant differences in safety risk performance among food categories, and these risks are influenced by multiple factors. Table 7 selects time, spatial, and stage-related variables closely associated with food production, circulation, and inspection processes, in order to more comprehensively represent the risk attributes of the food sampling data. The production region reflects the geographic distribution of food sources, which helps identify regional risks. The sampling stage distinguishes different phases such as production, circulation, and catering, capturing stage-specific risk attributes; in terms of packaging, pre-packed and bulk foods typically differ in hygiene conditions and risk levels; and by encoding production/purchase and sampling times into seasonal intervals, the effects of temperature and humidity on food quality are taken into account.

5.1.4. Data Preprocessing

Feature selection is based on the practical application needs of food safety inspection data. For example, regarding the production region, foods from different areas may experience variations in production environments, regulatory enforcement, and food processing standards. Concerning the sampling stage, foods face different safety risks at the production, circulation, and catering phases. As for the packaging type, bulk foods are generally more susceptible to external contamination. Finally, considering the production or purchase season and the sampling season, foods are more prone to spoilage during high-temperature periods, while cold seasons may affect storage conditions. Table 8 shows the sample features, feature attributes and their assigned values of the inspection data samples.

5.2. Model Construction and Results Analysis

The modeling process is conducted around three main modules: data preprocessing, feature construction, and multi-model training and evaluation, with the specific workflow as follows:
(1) Data Preprocessing: Core fields including “Product Category,” “Sampling Unit Name,” “Inspection Result,” and “Manufacturer Address” are selected, and redundant information is removed. Categorical features are re-encoded, and the “Sampling Unit Name” is classified into three categories: Production, Distribution, and Catering, based on keyword matching. Keywords for the production category include factory, processing, workshop, and so on. For the distribution category, keywords include wholesaler, retailer, supermarket, warehouse, and so on. For the catering category, keywords include canteen, guesthouse, restaurant, as well as various types of small eateries. This process is supplemented with manual secondary review. Administrative region information is extracted from the “Manufacturer Address” field and mapped to region category codes. The “Inspection Level” and “Specification/Model” fields are standardized and mapped to discrete integer codes. “Production Date” and “Report Date” are converted into seasonal categories based on months. The “Inspection Result” field is mapped to 0 (qualified) and 1 (unqualified), with unidentifiable labels removed.
(2) Feature Construction: Six processed variables are selected as input features, including production area, inspection level, packaging status, production season, sampling season, and sampling stage. The “Inspection Result” (qualified status) is used as the supervised learning label. The classification of qualified versus unqualified directly corresponds to the official report’s “Inspection Result” column, without any subjective human judgment.
The selected features are all core items considered by food safety regulators when formulating inspection plans and correspond directly to risk points in the pre-made dish supply chain. Production region reflects differences in regulatory intensity and industrial concentration. Inspection stage corresponds to risk changes across production, distribution, and catering phases. Packaging type relates to the potential for secondary contamination of bulk foods. Production/purchase season and sampling season capture seasonal deterioration patterns driven by temperature and humidity.
(3) Model Training and Evaluation: For each category, six models are constructed, including two sampling approaches that over-sampling SMOTE (Synthetic Minority Over-sampling Technique) and under-sampling Random, and one cost-sensitive approach Weight and two classification algorithms that SVM and Random Forest. Grid search is implemented to tune the key hyperparameters of each model. For overfitting control, all models were evaluated through ten-fold stratified cross-validation to assess generalization performance. For weighted random forest, max_features was set to ‘sqrt’ and the maximum tree depth was limited. For class weights, the minority class weight in weighted SVM was set to the majority-to-minority sample ratio; for weighted random forest, it was empirically set to 2 or 3 and jointly tuned with other hyperparameters during grid search. Ten-fold stratified cross-validation is employed, where the original dataset is randomly split into 10 roughly equal subsets, with training and evaluation performed on different splits. For the weight settings, in weighted SVM, the minority class weight is set to the majority-to-minority sample ratio; in weighted Random Forest, the minority class weight is set to 2 or 3 based on relevant studies. The main evaluation metrics include Precision, Recall, and F1-score. To further evaluate model performance under class imbalance, this study also reports AUC-ROC, AUPRC, MCC, and Balanced Accuracy for the Weight + RF model.
Table 9 reports the classification performance of the six combined algorithms across the retained product categories. For starch and starch products, Weight + RF achieved the best overall result, with a Precision of 0.7857 and an F1 Score of 0.3929. For fruit products, Weight + RF obtained a relatively high Precision of 0.6071, but its Recall remained limited. For vegetable products, prediction is less stable because the number of non-compliant samples is small.
To provide a more complete evaluation under class imbalance, additional metrics are calculated for the Weight + RF mode in Table 10. Starch and starch products achieves an AUC-ROC of 0.7778 and an MCC of 0.4429, indicating useful discriminative ability. Vegetable products recorded weak threshold-based classification results, but the AUC-ROC of 0.7265 suggests that the model still retained some ranking ability. These results indicate that model performance should be interpreted together with sample size and category imbalance.


6. Conclusions and Future Research Directions

6.1. Conclusions

In recent years, with the rise of public health awareness and the frequent occurrence of food safety incidents, the safety of pre-made dishes has increasingly attracted widespread attention. This study focuses on risk identification across various stages of pre-made dish production and circulation, exploring a multi-source data approach to food safety risk research. By combining Weibo public opinion, news media reports, and food inspection records, this study develops a sequential and multi-perspective approach to pre-made dish risk analysis.
Based on Weibo data, a sentiment analysis framework is constructed using the deep learning ERNIE model, combined with BERTopic for topic modeling. This approach systematically explores public sentiment toward pre-made dishes and its influencing factors from both sentiment classification and topic analysis perspectives. The ERNIE model, pre-trained with knowledge graphs, significantly enhanced semantic understanding of non-standard Chinese text. Compared with other pre-trained models Sentence-BERT, traditional machine learning models such as SVM, and deep learning models such as Bi-LSTM and CNN-LSTM, it demonstrates superior accuracy in short-text sentiment classification tasks. Meanwhile, BERTopic enables fine-grained topic identification and sentiment association analysis, providing technical support for revealing public discussion points and sentiment patterns across multiple dimensions.
This study develops a three-stage analytical approach that links social media risk perception, news media incident evidence, and inspection resource optimization. The empirical results show that public sentiment distribution is highly correlated with region and topic. Under conditions of severe class imbalance, the inspection model can still effectively identify high-risk samples. The substantive significance of this framework lies in offering a possible paradigm shift for food safety regulation: from passive complaint response to proactive risk reconnaissance. By identifying high-risk concern zones through social media signals, verifying documented incident risks through news reports, and guiding inspection resource allocation with a predictive model, the detection efficiency of non-compliant products can be improved under budget constraints.
For public health policy, this cognition–inspection approach provides a proof of concept. With spatially aligned data and further validation, it may help capture foodborne risk signals earlier and support the development of region-specific inspection strategies within the studied province.
The modeling results show that, under class imbalance, Weight + RF performs relatively well for starch and starch products. For this category, Precision reached 0.7857, AUC-ROC reached 0.7778, and MCC reached 0.4429. These results provide an initial reference for pre-made dish risk identification and inspection optimization under limited data conditions.

6.2. Future Research Directions

Regarding the application of pre-made dish data, this study uses definition-constrained pre-made dish-associated products rather than a dedicated inspection dataset of strictly defined pre-made dishes. It may still affect the specificity of the findings. In the future, as regulatory data become more standardized, dedicated pre-made dish inspection records can be used to further validate the proposed framework.
A further limitation concerns the spatial scope of the three data sources. Weibo data and news reports have national or cross-regional coverage, whereas the inspection records are limited to Gansu Province. Although Gansu users’ Weibo comments are extracted for supplementary comparison, it cannot fully remove the spatial mismatch. Future work should validate the model with inspection data from multiple provinces.
Although this study adds AUC-ROC, AUPRC, MCC, and Balanced Accuracy to evaluate the inspection-risk model under class imbalance, the number of non-compliant samples in some retained categories remains limited. It may affect the stability of threshold-based classification results. Future work could use longer time spans, repeated cross-validation, and threshold optimization to further improve model robustness.
In terms of public opinion analysis, this study does not comprehensively evaluate the performance differences among multiple large language models. It could incorporate a wider range of large language models, such as ChatGLM and LLaMA, to enable a more complete comparison of their effectiveness in sentiment and public opinion analysis.
With the continuous enrichment of data resources and the ongoing development of analytical methods, future research on food safety risks is expected to deepen in terms of data precision and algorithmic diversity, thereby providing more intelligent and scientific support for the governance of pre-made dish food safety.

Author Contributions

Conceptualization, C.S.; Methodology, C.S.; Software, J.G.; Formal Analysis, J.G.; Data Curation, J.G.; Writing—Original Draft Preparation, J.G. and C.S.; Writing—Review and Editing, G.L.; Supervision, C.S.; Funding Acquisition, G.L. All authors have read and agreed to the published version of the manuscript.

Funding

This research was funded by [National Natural Science Foundation of China] grant number [71901218].

Institutional Review Board Statement

Not applicable.

Data Availability Statement

The datasets used and/or analyzed during the current study are available from the corresponding author on reasonable request.

Conflicts of Interest

The authors declare that they have no competing interests.

References

  1. Liu, X.A.; Chen, A.J.; Biao, P.U. Market Status and Prospects of Chilled and Frozen Prepared Foods. Food Sci. 2011, 32, 323–328. [Google Scholar]
  2. China National Radio Network. Prefabricated Dishes First Appeared in No. 1 Central Document: Integration of Three Industries Promotes Rural Revitalization. 2023. Available online: https://hn.cnr.cn/hnpdgb/food/20230217/t20230217_526156562.html (accessed on 23 August 2025). (In Chinese)
  3. Kathuria, L.M.; Kalia, B. Drivers of ready-to-eat meals consumption: Empirical evidence from an emerging country. Int. J. Bus. Compet. Growth 2014, 3, 292–308. [Google Scholar] [CrossRef]
  4. Imtiyaz, H.; Soni, P.; Yukongdi, V. Role of sensory appeal, nutritional quality, safety, and health determinants on convenience food choice in an academic environment. Foods 2021, 10, 345. [Google Scholar] [CrossRef] [PubMed]
  5. Andrade, C. The limitations of online surveys. Indian J. Psychol. Med. 2020, 42, 575–576. [Google Scholar] [CrossRef]
  6. Moe, W.W.; Schweidel, D.A. Opportunities for innovation in social media analytics. J. Prod. Innov. Manag. 2017, 34, 697–702. [Google Scholar] [CrossRef]
  7. Ozkisi, H.; Topaloglu, M. Application for sentiment and demographic analysis processes on social media. Glob. J. Comput. Sci. Theory Res. 2018, 8, 143–148. [Google Scholar]
  8. Yin, H.; Cui, B.; Chen, L.; Hu, Z.; Zhou, X. Dynamic user modeling in social media systems. ACM Trans. Inf. Syst. 2015, 33, 10. [Google Scholar] [CrossRef]
  9. Arrigo, E.; Liberati, C.; Mariani, P. Social media data and users’ preferences: A statistical analysis to support marketing communication. Big Data Res. 2021, 24, 100189. [Google Scholar] [CrossRef]
  10. Chakraborty, K.; Bhattacharyya, S.; Bag, R. A survey of sentiment analysis from social media data. IEEE Trans. Comput. Soc. Syst. 2020, 7, 450–464. [Google Scholar] [CrossRef]
  11. Karpurapu, B.S.H.; Jololian, L. A framework for social network sentiment analysis using big data analytics. In Big Data and Visual Analytics; Springer International Publishing: Cham, Switzerland, 2017; pp. 203–217. [Google Scholar]
  12. Lin, M.S.; Liang, Y.; Xue, J.X.; Pan, B.; Schroeder, A. Destination image through social media analytics and survey method. Int. J. Contemp. Hosp. Manag. 2021, 33, 2219–2238. [Google Scholar] [CrossRef]
  13. Paul, M.J.; Dredze, M. Social Monitoring for Public Health; Morgan & Claypool Publishers: San Rafael, CA, USA, 2017; Volume 9, pp. 1–183. [Google Scholar]
  14. Yigitcanlar, T.; Kankanamge, N.; Preston, A.; Gill, P.S.; Rezayee, M.; Ostadnia, M.; Xia, B.; Ioppolo, G. How can social media analytics assist authorities in pandemic-related policy decisions? Insights from Australian states and territories. Health Inf. Sci. Syst. 2020, 8, 37. [Google Scholar] [CrossRef]
  15. Alam, M.R.; Sadri, A.M.; Jin, X. Identifying public perceptions toward emerging transportation trends through social media-based interactions. Future Transp. 2021, 1, 794–813. [Google Scholar]
  16. Allen, T.T.; Sui, Z.; Parker, N.L. Timely decision analysis enabled by efficient social media modeling. Decis. Anal. 2017, 14, 250–260. [Google Scholar] [CrossRef]
  17. Misra, N.N.; Dixit, Y.; Al, M.A.; Bhullar, M.S.; Upadhyay, R.; Martynenko, A. IoT, big data, and artificial intelligence in agriculture and food industry. IEEE Internet Things J. 2020, 9, 6305–6324. [Google Scholar] [CrossRef]
  18. Stirling, E.; Willcox, J.; Ong, K.-L.; Forsyth, A. Social media analytics in nutrition research: A rapid review of current usage in investigation of dietary behaviours. Public Health Nutr. 2021, 24, 1193–1209. [Google Scholar] [CrossRef] [PubMed]
  19. Singh, A.; Shukla, N.; Mishra, N. Social media data analytics to improve supply chain management in food industries. Transp. Res. Part E Logist. Transp. Rev. 2018, 114, 398–415. [Google Scholar] [CrossRef]
  20. Ramandita, H.D.; Setyanto, A.; Sumafta, I.B. Food trend based on social media for big data analysis using K-mean clustering and SAW: A case study on Yogyakarta culinary industry. In Proceedings of the 2018 International Conference on Information and Communications Technology (ICOIACT); IEEE: Piscataway, NJ, USA, 2018; pp. 549–554. [Google Scholar]
  21. Trivedi, S.K.; Singh, A. Twitter sentiment analysis of app based online food delivery companies. Glob. Knowl. Mem. Commun. 2021, 70, 891–910. [Google Scholar] [CrossRef]
  22. Xia, L.; Chen, B.; Hunt, K.; Zhuang, J.; Song, C. Food Safety Awareness and Opinions in China: A Social Network Analysis Approach. Foods 2022, 11, 2909. [Google Scholar] [CrossRef] [PubMed]
  23. Yuan, T.; Qin, X.; Wei, C. A Chinese named entity recognition method based on ERNIE-BiLSTM-CRF for food safety domain. Appl. Sci. 2023, 13, 2849. [Google Scholar] [CrossRef]
  24. Dong, X.; Lian, Y. A review of social media-based public opinion analyses: Challenges and recommendations. Technol. Soc. 2021, 67, 101724. [Google Scholar] [CrossRef]
  25. Rahman, W.; Hasan, K.; Lee, S.; Zadeh, A.B.; Mao, C.; Morency, L.-P.; Hoque, E. Integrating multimodal information in large pretrained transformers. In Proceedings of the 58th Annual Meeting of the Association for Computational Linguistics; Association for Computational Linguistics: Kerrville, TX, USA, 2020; p. 2359. [Google Scholar]
  26. Nugumanova, A.; Baiburin, Y.; Alimzhanov, Y. Sentiment analysis of reviews in Kazakh with transfer learning techniques. In Proceedings of the 2022 International Conference on Smart Information Systems and Technologies (SIST); IEEE: Piscataway, NJ, USA, 2022; pp. 1–6. [Google Scholar]
  27. Chen, Y.; Zhang, Z. Exploring public perceptions on alternative meat in China from social media data using transfer learning method. Food Qual. Prefer. 2022, 98, 104530. [Google Scholar] [CrossRef]
  28. Boukabous, M.; Azizi, M. Crime prediction using a hybrid sentiment analysis approach based on the bidirectional encoder representations from transformers. Indones. J. Electr. Eng. Comput. Sci. 2022, 25, 1131–1139. [Google Scholar] [CrossRef]
  29. Talaat, A.S. Sentiment analysis classification system using hybrid BERT models. J. Big Data 2023, 10, 110. [Google Scholar] [CrossRef]
  30. Wen, Y.; Liang, Y.; Zhu, X. Sentiment analysis of hotel online reviews using the BERT model and ERNIE model—Data from China. PLoS ONE 2023, 18, e0275382. [Google Scholar]
  31. Aziz, K.; Ji, D.; Chakrabarti, P.; Chakrabarti, T.; Iqbal, M.S.; Abbasi, R. Unifying aspect-based sentiment analysis BERT and multi-layered graph convolutional networks for comprehensive sentiment dissection. Sci. Rep. 2024, 14, 14646. [Google Scholar] [CrossRef]
  32. Li, Z.; Yang, C.; Huang, C. A Comparative Sentiment Analysis of Airline Customer Reviews Using Bidirectional Encoder Representations from Transformers and Its Variants. Mathematics 2023, 12, 53. [Google Scholar] [CrossRef]
  33. Zhao, C.; Feng, R.; Sun, X.; Shen, L.; Gao, J.; Wang, Y. Enhancing aspect-based sentiment analysis with BERT-driven context generation and quality filtering. Nat. Lang. Process. J. 2024, 7, 100077. [Google Scholar]
  34. Darraz, N.; Karabila, I.; El-Ansari, A.; Alami, N.; El Mallahi, M. Integrated sentiment analysis with BERT for enhanced hybrid recommendation systems. Expert Syst. Appl. 2025, 261, 125533. [Google Scholar] [CrossRef]
  35. Teplova, T.; Fayzulin, M. Decoding Russian stock market trends through ensemble methods and sentiment analysis of social media. Ann. Oper. Res. 2025, 353, 1123–1172. [Google Scholar] [CrossRef]
  36. Marvin, H.J.P.; Kleter, G.A. Public Health Measures: Alerts and Early Warning Systems. Encycl. Food Saf. 2014, 4, 50–54. [Google Scholar]
  37. Yu, H. An Empirical Study on Food Safety Early-warning Based on Internet Information. In Proceedings of the 5th International Asia Conference on Industrial Engineering and Management Innovation; Atlantis Press: Dordrecht, The Netherlands, 2015; pp. 199–202. [Google Scholar]
  38. Lu, K.; Junxia, M. The Model of Early Warning of Food Safety Information Based on the Network. Adv. J. Food Sci. Technol. 2015, 8, 371–374. [Google Scholar] [CrossRef]
  39. Geng, Z.; Shang, D.; Han, Y.; Zhong, Y. Early warning modeling and analysis based on a deep radial basis function neural network integrating an analytic hierarchy process: A case study for food safety. Food Control 2019, 96, 329–342. [Google Scholar] [CrossRef]
  40. Yin, Z.; Li, B.; Gu, D.; Huang, J.; Zhang, L. Modeling of farmers’ vegetable safety production based on identification of key risk factors from beijing, China. Risk Anal. 2021, 42, 2089–2106. [Google Scholar] [CrossRef]
  41. Zuo, E.; Du, X.; Aysa, A.; Lv, X.; Muhammat, M.; Zhao, Y.; Ubul, K. Anomaly score-based risk early warning system for rapidly controlling food safety risk. Foods 2022, 11, 2076. [Google Scholar] [CrossRef]
  42. Wang, J.; Yue, H. Food safety pre-warning system based on data mining for a sustainable food supply chain. Food Control 2017, 73, 223–229. [Google Scholar] [CrossRef]
  43. Liu, N.; Bouzembrak, Y.; Van den Bulk, L.M.; Gavai, A.; Heuvel, L.J.D.; Marvin, H.J. Automated food safety early warning system in the dairy supply chain using machine learning. Food Control 2022, 136, 108872. [Google Scholar] [CrossRef]
  44. Focker, M.; Wagenberg, C.V.; Asselt, E.V.; Fels-Klerx, H.J.V.D. The resilience of the pork supply chain to a food safety outbreak: The case of dioxins. Risk Anal. 2024, 44, 785–801. [Google Scholar] [CrossRef]
Figure 1. Distribution of non-compliance rates among major food categories in the 2022–2024 inspection records.
Applsci 16 05117 g001
Figure 2. Changes in non-compliance rates across food categories in the 2022–2024 inspection records.
Applsci 16 05117 g002
Table 1. Hyper-parameter search space settings.
ParameterSearch Space
Number of hidden units[256, 512, 768, 1024]
Dropout[0.1, 0.2, 0.3, 0.4]
Learning rate[1 × 10⁻⁵, 2 × 10⁻⁵, 3 × 10⁻⁵, 5 × 10⁻⁵, 1 × 10⁻⁴]
Batch size[16, 32, 64, 128]
Table 2. Hyper-parameter search results.
Hidden LayersHidden UnitsDropoutLearning RateBatch Size
2410240.12 × 10−532
Table 3. The performance comparison results of models.
ModelsAccuracyF1-Score
Sentence-Bert0.82850.8276
Sentence-BERT + Bi-LSTM0.81320.8154
LSTM0.73700.7231
Bi-LSTM0.73090.7248
CNN0.70340.6950
CNN-LSTM0.74920.7426
SVM0.62940.6186
Ernie0.88030.8665
Table 4. The proportion of sentiment categories by region.
RegionPositiveNeutralNegativeRegionPositiveNeutralNegative
Others19.02%28.57%52.41%Jiangsu15.45%29.90%54.65%
Overseas18.61%30.30%51.09%Shandong23.86%30.71%45.42%
Guangxi18.02%30.68%51.30%Hunan19.45%28.73%51.82%
Hainan20.00%31.63%48.37%Hubei18.29%28.43%53.28%
Macao20.45%23.86%55.69%Henan25.96%29.42%44.62%
HongKong19.48%27.92%52.60%Xinjiang20.00%34.25%45.66%
Guangdong16.19%28.55%55.26%Ningxia26.44%32.18%41.38%
Xizang14.55%25.45%60.00%Qinghai20.37%33.33%46.30%
Yunnan19.32%29.77%50.91%Gansu26.04%31.25%42.71%
Sichuan18.71%33.67%47.62%Shanxi20.68%31.15%48.17%
Guizhou2.00%32.55%47.45%Neimengu19.29%33.20%47.29%
Chongqing15.98%31.60%52.42%Shanxi20.93%29.30%49.78%
Taiwan25.43%45.09%29.48%Hebei21.09%27.30%51.61%
Fujian17.94%27.87%54.19%Tianjin20.47%34.61%44.93%
Jiangxi24.26%28.99%46.75%Beijing18.40%28.55%52.99%
Zhejiang17.33%30.77%51.90%Liaoning21.25%30.43%48.32%
Shanghai15.89%27.84%56.27%Jilin20.96%26.63%52.41%
Anhui18.00%30.26%51.74%Heilongjiang23.76%30.45%45.79%
Table 5. Number of topics and documents in each research direction.
TopicsNo. of CommentProportionPositive and NeutralNegative
Daily Consumption Contexts977031.60%58.3%41.7%
Live-Stream Sales Trends313210.13%53.6%46.4%
Campus and Children’s Diets1078134.87%41.7%58.3%
Japan’s Nuclear Wastewater15905.14%42.8%57.2%
Regulatory and Standardization Issues18916.12%47.0%53.0%
Negative Perceptions and Fertility Controversies11473.71%39.8%60.2%
Transparency in the Catering Industry10673.45%52.1%47.9%
Industrial Growth and Market Trends15424.99%69.5%30.5%
Table 6. Top five high-severity pre-made dish-related food safety incidents.
Cluster IDSeverityKey Terms
112.94Guizhou, fish, enrofloxacin, excessive residue
211.78Guangdong, Jiangsu, egg products, bacteria, antibiotics
37.54Dongguan, Banu, mutton, fake
44.51Tieling, fried dough twist, rice crust, non-compliant
54.19Guangdong, pickled fish, shrimp dumplings, odor
Table 7. Attributes of food inspection data.
NumberData FeaturesDescriptionsData Attributes
1Production RegionCovering 14 prefecture-level cities in Gansu ProvinceString
2Inspection LevelNational, provincial, and municipal inspectionsString
3Packaging StatusPre-packed and bulk typesString
4Production/Purchase DateProduction or Purchase DateDate
5Sampling DateSampling DateDate
6Sampling StageProduction, circulation, and catering stagesString
7Test ResultPass or FailCategorical
Table 8. The attributes and assigned values of food Inspection data samples.
NumberSample
Features
Feature AttributesAssigned Value
1Food Production RegionLanzhou, Jiayuguan, and other regions1
Jinchang, Baiyin, and other regions2
Tianshui, Wuwei, and other regions3
Zhangye, Pingliang, and other regions4
Jiuquan, Qingyang, Gannan Tibetan Autonomous Prefecture, and other regions5
Dingxi, Longnan, Linxia Hui Autonomous Prefecture, and other regions6
Other Few Out-of-Province Regions7
2Inspection LevelNational Inspection1
Provincial Inspection2
Municipal Inspection3
3PackagingPre-packaged1
Loose Weighed Products2
4Production/Purchase SeasonMar–May1
Jun–Aug2
Sep–Nov3
Dec–Feb4
5Sampling SeasonMar–May1
Jun–Aug2
Sep–Nov3
Dec–Feb4
6Sampling StageProduction Stage1
Distribution Stage2
Catering Stage3
Table 9. Classification performance comparisons of combined algorithms.
CategoryData Processing MethodClassifierPrecisionRecallF1 Score
Fruit productsRandomSVM0.15370.55370.2406
Fruit productsSMOTESVM0.16620.52890.2530
Fruit productsWeightSVM0.17020.53720.2584
Fruit productsRandomRandom Forest0.13530.44630.2077
Fruit productsSMOTERandom Forest0.18700.38020.2507
Fruit productsWeightRandom Forest0.60710.14050.2282
Starch and starch productsRandomSVM0.08980.69050.1589
Starch and starch productsSMOTESVM0.08370.45240.1413
Starch and starch productsWeightSVM0.09680.57140.1655
Starch and starch productsRandom Random Forest 0.07650.66670.1373
Starch and starch productsSMOTE Random Forest 0.19640.26190.2245
Starch and starch productsWeight Random Forest 0.78570.26190.3929
Vegetable productsRandom SVM 0.04970.61540.0920
Vegetable productsSMOTE SVM 0.07840.61540.1391
Vegetable productsWeight SVM 0.07210.61540.1290
Vegetable productsRandom Random Forest 0.05060.69230.0942
Vegetable productsSMOTE Random Forest 0.04440.15380.0690
Vegetable productsWeight Random Forest 0.00000.00000.0000
Table 10. Extended evaluation metrics for Weight + RF.
CategoryAUC-ROCAUPRCMCCBalanced Accuracy
Fruit products0.65750.28070.25560.5644
Starch and starch products0.77780.31110.44290.6295
Vegetable products0.72650.08820.00000.5000
Disclaimer/Publisher’s Note: The statements, opinions and data contained in all publications are solely those of the individual author(s) and contributor(s) and not of MDPI and/or the editor(s). MDPI and/or the editor(s) disclaim responsibility for any injury to people or property resulting from any ideas, methods, instructions or products referred to in the content.