Article

Application of Response Surface Methodology to Obtain an Extract of the Herb Trifolium pratense L. with High Antioxidant Activity and Total Polyphenol Content


1
Department of Cosmetic and Pharmaceutical Chemistry, Pomeranian Medical University in Szczecin, 72 Powstancow Wlkp. Ave., 70-111 Szczecin, Poland
2
Department of Organic Chemical Technology and Polymer Materials, West Pomeranian University of Technology, 10 Pulaski Str., 70-322 Szczecin, Poland
*
Author to whom correspondence should be addressed.
Appl. Sci. 2026, 16(10), 4979; https://doi.org/10.3390/app16104979
Submission received: 26 March 2026 / Revised: 30 April 2026 / Accepted: 12 May 2026 / Published: 16 May 2026
(This article belongs to the Special Issue Bioactive Natural Compounds: From Discovery to Applications)

Abstract

Mathematical modelling, including the use of response surface methodology (RSM), facilitates the analysis of complex relationships between various extraction process parameters and the bioactive properties of plant extracts. The aim of this study was to optimise selected parameters of the ultrasound-assisted extraction (UAE) process of the herb Trifolium pratense L. to yield extracts with high antioxidant activity (AA-DPPH) and total polyphenol content (TPC). The following parameters were investigated: solvent selection (methanol, ethanol, isopropanol, and n-propanol), the alcohol concentration used as the solvent (from 20% v/v to concentrated), and extraction time (2–15 min). The optimal extraction conditions, depending on the solvent used, comprised alcohol concentrations of 49–61% v/v and extraction times of 3–13 min. Under these optimal conditions, the extracts exhibited high antioxidant activity (methanol 4.21 ± 0.02, ethanol 3.92 ± 0.02, n-propanol 3.84 ± 0.02, and isopropanol 3.72 ± 0.02 mmol Trolox/L) and high total polyphenol content (n-propanol 0.84 ± 0.01, ethanol 0.81 ± 0.01, isopropanol 0.76 ± 0.01, and methanol 0.72 ± 0.01 g GA/L). The log p value of the optimised extracts was below zero (except for the isopropanol extract), indicating their hydrophilic nature, which is attributed to the presence of polar phenolic compounds. The extracts obtained via optimised UAE were characterised by a high content of bioactive compounds with antioxidant potential, suggesting their potential application in the pharmaceutical and cosmetic industries.

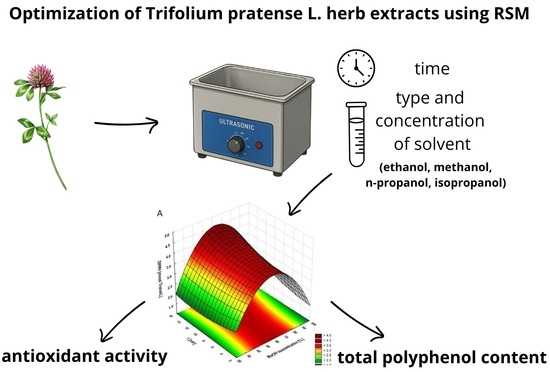
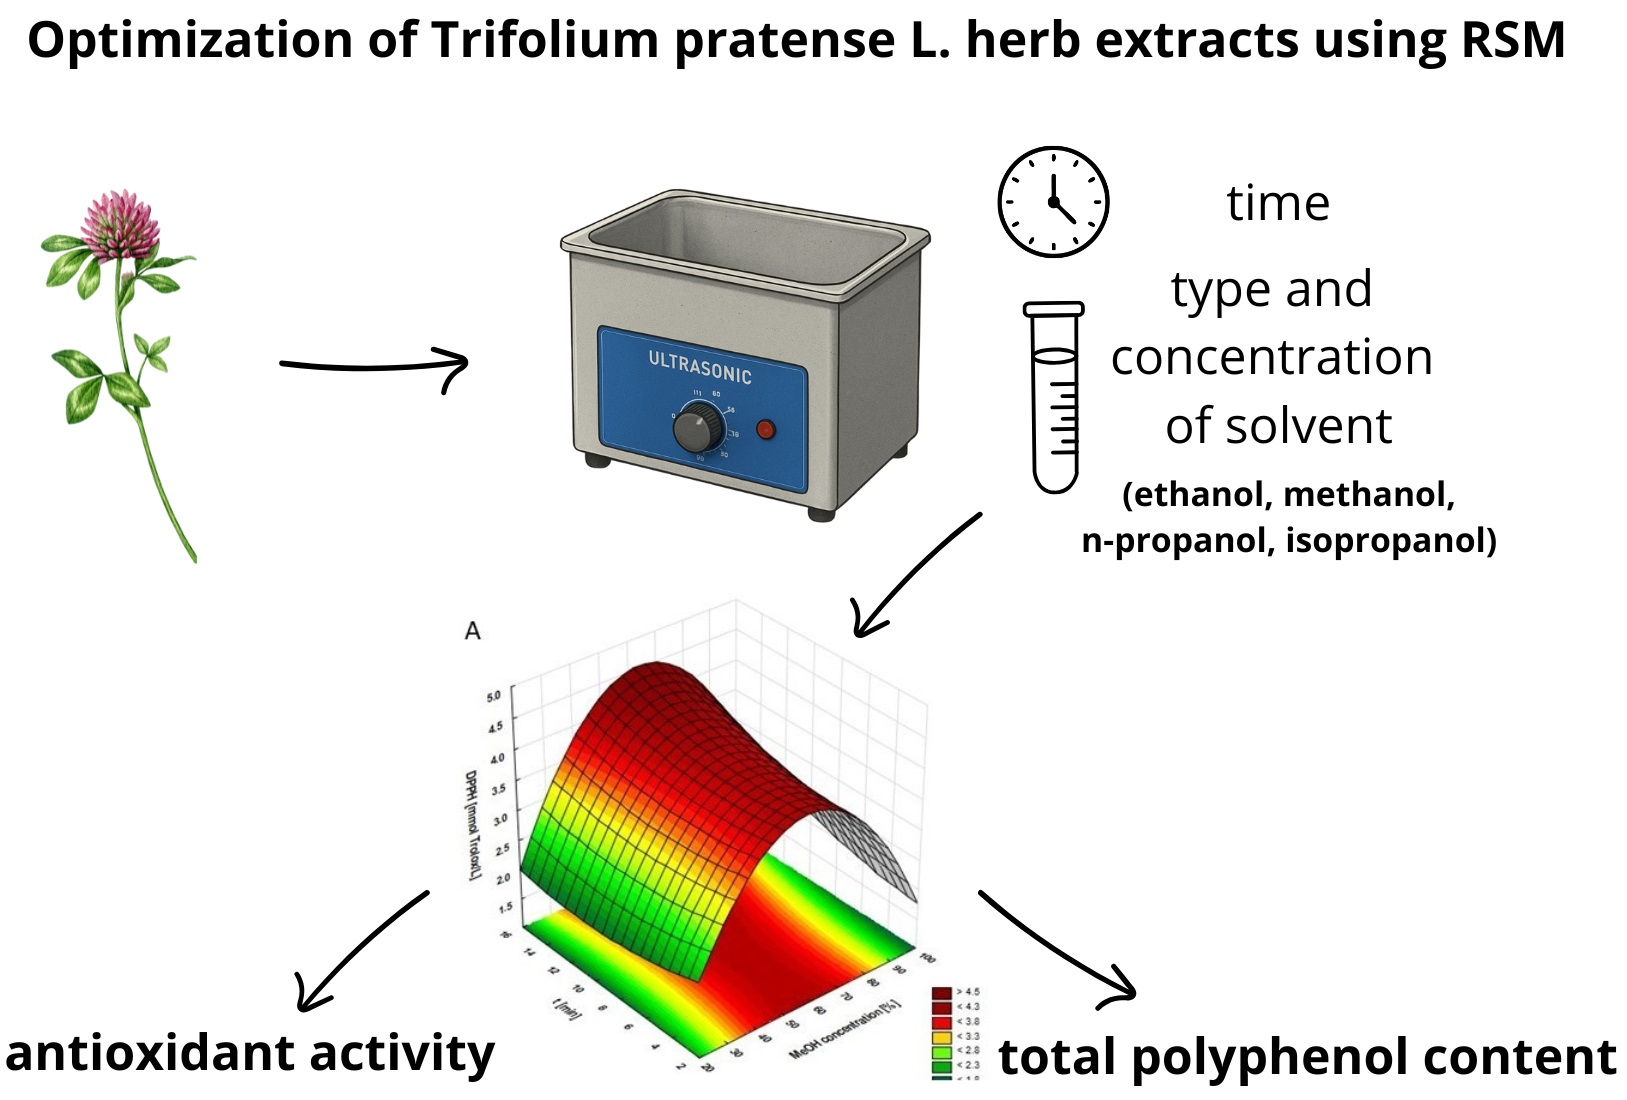
Graphical Abstract

1. Introduction

In recent years, there has been growing interest in incorporating plant-derived ingredients into cosmetic formulations [1,2]. This stems from the presence of valuable secondary metabolites, notably phenolic compounds. Due to their antioxidant potential, they are used in anti-ageing formulations [1,3,4]. Beyond their antioxidant activity, plant-derived active compounds exhibit antibacterial, anti-inflammatory, and antifungal effects, rendering plant raw materials particularly valuable ingredients in cosmetics [5]. Trifolium pratense L., commonly known as red clover, is prominent among the plants used in the cosmetic industry, largely due to its high concentration of antioxidant compounds. The main active compounds of this plant include isoflavones, such as genistein, daidzein, biochanin A, and formononetin. These compounds exhibit oestrogen-like activity due to their structural similarity to oestradiol. Furthermore, red clover is a source of flavonoids (e.g., kaempferol and quercetin), phenolic acids (including gallic, caffeic, and chlorogenic acids), coumarin derivatives, saponins, and essential oils [6,7,8]. Currently, cosmetic preparations use, among others, extracts of red clover flowers, leaves, and seeds. They are declared to have conditioning, nourishing, perfuming, astringent, softening, and caring properties. Antioxidant activity has also been reported for extracts derived from the leaves and seeds of T. pratense [9].
One of the methods for isolating active compounds from plant materials is ultrasound-assisted extraction (UAE). This technique is characterised by low costs, the possibility of reducing extraction time, limiting energy and solvent usage, and increased process efficiency compared to conventional extraction techniques. Additionally, it can be used with solvents of varying polarity and over a wide range of temperatures [10,11]. Optimising extraction parameters using mathematical modelling allows for a reduction in energy and raw material consumption, a decrease in labour inputs, and an increase in process efficiency [11]. One of the popular methods for optimising the extraction of plant raw materials is the response surface methodology (RSM). This is a set of statistical and mathematical techniques that allow describing the relationships between dependent and independent variables. Therefore, one can plan a series of experiments that alter the values of selected parameters (e.g., concentration, temperature, and time). The development of a mathematical model based on quantitative data allows for the analysis of the impact of multiple factors simultaneously and their mutual interactions. This, in turn, allows for the determination of optimal parameters for the extraction of plant materials [12,13,14].
The limited availability of research on the optimisation of extraction parameters for red clover herb motivated the presented research. Moreover, the authors most often compare the effect of ethanol concentration. Very few studies focus on other solvents, such as methanol, n-propanol, or isopropanol. Verhulst et al. [15] optimised the extraction parameters (time, temperature, and ethanol concentration) of T. pratense for high total polyphenol content (TPC). Using conventional extraction and RSM, they determined the optimal parameters for the TPC, DPPH, and FRAP methods to be 45 min, 40 °C, and an ethanol concentration of 80% [15]. Similarly, Luo et al. [16] optimised UAE extraction for the analysis of isoflavones in ethanol extract from red clover. Using a water bath and ultrasonic bath, they described the influence of six parameters on extraction efficiency. The optimal conditions they presented are 10 min ultrasonic time, 2 h water bath time, 85% ethanol concentration, 40-mesh particle size, 1:25 solid-to-liquid ratio, and a temperature of 40 °C. It is worth noting that the authors described in their study the effect of reducing the particle size of the plant raw material on the increase in the extraction efficiency of isoflavones [16].
The aim of this study was to evaluate the impact and optimise the technological parameters of the ultrasound-assisted extraction process (i.e., extraction time, type of solvent, and its concentration (water content in the alcohol–water mixture)). The obtained extracts were analysed for antioxidant activity assessed by the DPPH assay (AA-DPPH) and total polyphenol content (TPC). Additionally, the log p of the extracts obtained by applying optimal parameters was checked to determine their lipophilicity. This study is one of the few studies that compare the effect of the polarity degree of the alcoholic solvent on the antioxidant properties of red clover extracts. The obtained results constitute an introduction to further research aimed at utilising optimised extracts from red clover herb as active ingredients in cosmetic preparations with antioxidant properties.

2. Materials and Methods

2.1. Reagents and Equipment

Trolox ((±)-6-Hydroxy-2,5,7,8-tetramethylchromane-2-carboxylic acid), DPPH (2,2-Diphenyl-1-picrylhydrazyl), and Folin–Ciocalteu’s phenol reagent were purchased from Sigma-Aldrich Merck Group (St. Louis, MO, USA). Methanol, ethanol, isopropanol, n-propanol, n-octanol, and sodium carbonate were provided by Chempur (Piekary Śląskie, Poland). All reagents were of analytical grade.
Antioxidant activity (AA-DPPH) and total polyphenol content were tested using a Hitachi U-5100 spectrophotometer (Hitachi High-Tech Science Corporation, Tokyo, Japan). A Thermo Scientific GENESYS 50 apparatus (Thermo Fisher Scientific, Norristown, PA, USA) was used for lipophilicity determinations.

2.2. Plant Material and Extraction Process

Dried and comminuted Trifolium pratense L. herb was sourced from a commercial supplier (EkoHerba, Hajnówka, Poland). The plant material was collected in Poland (52°42′ N 23°58′ E). A voucher specimen (No. TP/2025-06/01) was deposited in the storage facility of the department affiliated with the corresponding author. The herb was then ground in a laboratory grinder and sieved through fractional sieves (MULTISERW-Morek, Brzeźnica, Poland) to obtain a fraction with a particle size below 0.25 mm. Samples of 0.5 g were weighed into 15 mL Falcon tubes using an analytical balance (RADWAG AS220.R2 PLUS, Radom, Poland), followed by the addition of 10 mL of solvent (ethanol, methanol, isopropanol, or n-propanol) at various concentrations (20%, 40%, 70% v/v, and concentrated). The samples were first vigorously mixed by shaking and subsequently extracted in an ultrasonic bath (40 kHz, FSF-031S, Chemland, Stargard, Poland) at a thermostatically controlled temperature of 40 ± 1 °C. At designated intervals (2, 8, 10, and 15 min), 0.5 mL samples were withdrawn and stored at +6 °C.

2.3. Experimental Design and Modelling of the T. pratense Herb Extraction Process

This study was conducted according to a 42 full factorial design, involving two independent variables, each tested at four levels, resulting in a total of 16 experimental runs. The investigated factors were alcohol concentration (20%, 40%, 70%, and concentrated alcohol; 99% or 96% in the case of ethanol) and extraction time (2, 8, 10, and 15 min). Each experimental condition corresponded to a single extraction run (n = 16). While extractions were performed once per factorial point, analytical determinations of antioxidant activity (AA-DPPH) and total polyphenol content (TPC) were conducted in triplicate to ensure analytical reproducibility. The mean standard deviations resulting from replicate measurements were 0.02 for DPPH and 0.01 for TPC. A detailed experimental matrix is provided in Table S1 (Supplementary Materials). The antioxidant activity of the solvents was also assessed, and the reported results for the extracts were corrected accordingly.
The main properties describing the red clover herb extraction process were antioxidant activity assessed by the DPPH assay and total polyphenol content assessed by the Folin–Ciocalteu method. The choice of these two methods, i.e., DPPH and TPC, results from their key importance for assessing the extract quality, especially in the context of antioxidant properties, which are largely due to polyphenols naturally occurring in the tested plant material [17,18].
The obtained values for DPPH and TPC for each experimental run are summarised in Tables S2 and S3. The optimisation strategy combined a full factorial experimental design (42) with RSM, using a second-order polynomial regression model to describe linear, quadratic, and interaction effects between extraction parameters. To determine the optimal points, RSM based on a second-order polynomial model was employed (1).
Y i = a 0 + a 1 · X i + a 2 · X i 2 + a 3 · X j + a 4 · X j 2 + a 5 · X i · X j
where:
Xi—concentration of the appropriate solvent (methanol, ethanol, n-propanol, isopropanol) [% vol];
Xj—extraction time [min];
a0, a1, a2, a3, a4, a5—regression coefficients;
Yi—appropriate dependent variable, i.e., antioxidant activity (AA-DPPH) and total polyphenol content (TPC).
Furthermore, the regression coefficients (a0–a5) describing the response surface for antioxidant activity (AA-DPPH) and total polyphenol content (TPC) were calculated for each solvent. The coefficients of determination (R2) and the adjusted coefficients of determination (AdjR2) were determined to assess the model’s goodness-of-fit.
Since the full factorial design lacked replicated points, a formal lack-of-fit test could not be performed. Therefore, model adequacy was evaluated based on the coefficients of determination (R2 and AdjR2) and the agreement between experimental and model-predicted values, as demonstrated by the scatter plots presented in the Supplementary Materials (Figures S1–S4). The statistical evaluation focused on overall model significance (ANOVA), coefficients of determination, and comparison of experimental and predicted values rather than individual coefficient standard errors and formal lack-of-fit testing.

2.4. Antioxidant Activity (AA-DPPH) and Total Polyphenol Content (TPC) Evaluation

Antioxidant activity studies using the DPPH assay and total polyphenol content using the Folin–Ciocalteu technique were performed based on the methodologies described by Nowak et al. [19], with minor modifications. During the DPPH analysis, 132 µL of extract was added to 2500 µL of ethanolic DPPH solution. For the determination of total polyphenol content, 138.9 µL of the tested extract and 138.9 µL of Folin–Ciocalteu reagent were added to 2500 µL of aqueous Na2CO3 solution. The results are presented as the arithmetic mean of three independent measurements ± standard deviation (SD). The results of antioxidant activity (AA-DPPH) were expressed in mmol of Trolox/L, while TPC was expressed as gallic acid equivalents—g GA/L of extract.

2.5. Methodology for Lipophilicity Assessment

The lipophilicity of the optimised plant extracts was determined experimentally using a spectrophotometric n-octanol/water partitioning method, as previously described [17]. This approach evaluates the distribution of the extract between two immiscible phases: n-octanol and water. For determination of log p, 10 mL of water-saturated n-octanol was mixed with 10 mL of octanol-saturated water containing 50 µL of the analysed extract (1:1 v/v). The mixture was shaken using an orbital shaker at 25 °C to reach phase equilibrium. After phase separation, the total concentration of solutes in each phase was measured spectrophotometrically in the wavelength range of 195–455 nm. Blank samples prepared without plant material were analysed under identical conditions. The partition coefficient (P) was calculated based on mass balance, assuming the validity of the Beer–Lambert law within the analysed spectral range, according to Equation (2) [17].
P = C 0 C w = C 0 C w C w = S 0 S S = 1 2 A 0 d Λ 1 2 A d Λ 1 2 A d Λ
where:
C—concentration of total compounds in the n-octanol layer and in the water layer;
S—area occupied by the compound in the UV–vis spectrum;
A—absorbance;
0—concentration of total compounds in the n-octanol layer and the aqueous layer/the initial area occupied by the compound in the UV–vis spectrum/initial absorbance;
Λ—wavelength.

2.6. Statistical Analysis

Statistical analyses, model optimisations, and data visualisations were performed using STATISTICA software (v. 13.3 PL, StatSoft, Krakow, Poland). The statistical significance of the second-order polynomial models was evaluated using an analysis of variance (ANOVA), with the significance level set at α < 0.05. Experimental variability was assessed based on analytical replicates, and detailed summary statistics and ANOVA results for antioxidant activity (AA-DPPH) and total polyphenol content (TPC) are provided in the Supplementary Materials (Tables S3–S6). To identify statistically significant differences in AA-DPPH and TPC among extracts obtained under optimal conditions for each solvent, a one-way ANOVA followed by Tukey’s post-hoc test was employed.

3. Results

3.1. Response Surface Method for Extraction Process Optimisation

The analysis of variance (ANOVA) confirmed that the second-order polynomial models for both antioxidant activity (AA-DPPH) and total polyphenol content (TPC) were statistically significant (p < 0.05). Detailed ANOVA results are provided in the Supplementary Materials (Tables S4 and S6). Table 1 and Table 2 present the response surface for antioxidant activity (AA-DPPH) and total polyphenol content (TPC), depending on the type of solvent tested and the multivariate (R2) and adjusted (AdjR2) correlation coefficients. Based on the results of our research, it can be concluded that the developed second-degree regression models describe very well the relationships between the independent variables and the responses in the form of AA-DPPH and TPC. The high values of the correlation coefficients and their adjusted equivalents (AdjR2) confirm the good fit of the models to the experimental data. The values of the regression coefficients (a0–a5) differ depending on the type of solvent used in the red clover herb extraction process. Regarding antioxidant activity assessed using the DPPH assay (Table 1), the highest values of the correlation coefficient and its adjusted equivalent were obtained for extraction using n-propanol as a solvent (R2 = 0.974, AdjR2 = 0.949), which indicates very good agreement between the model and the actual results. Similarly, the high values of these coefficients were obtained for extractions carried out using isopropanol (R2 = 0.968, AdjR2 = 0.937) and methanol (R2 = 0.965, AdjR2 = 0.931). For TPC (Table 2), the best model fit was obtained for isopropanol (R2 = 0.988, AdjR2 = 0.976), indicating its very high precision. Ethanol and propanol also showed good fit (R2 = 0.962 and 0.863; AdjR2 = 0.925 and 0.745, respectively). Model adequacy was further confirmed by statistically significant ANOVA results, residual analysis, and good agreement between experimental and model-predicted values, as demonstrated by the predicted versus actual plots presented in the Supplementary Materials.
Figure 1 shows the response surfaces for AA-DPPH (A) and TPC (B) as a function of extraction time and methanol concentration. AA-DPPH was significantly influenced by both variables. RSM indicated that the highest antioxidant activity (>4.5 mmol Trolox/L) occurred within a methanol concentration range of 50–70% and extraction times of 13–16 min. The maximum AA-DPPH value was achieved only when both factors (time and methanol concentration) were at a sufficiently high level, but not at the highest. When extraction was carried out using alcohol above 80% (regardless of extraction time), a decrease in antioxidant activity was observed, which may be related to the reduced solubility of hydrophilic polyphenols, responsible for antioxidant activity. Higher water content in the solvent plays an important role in breaking hydrogen bonds, thereby releasing these active compounds from the plant matrix [20]. The optimal polarity favouring the extraction of polyphenols responsible for antioxidant activity was observed in the methanol concentration range of 50–70% at longer extraction times (i.e., 10–16 min). Methanol, as a highly polar solvent, effectively extracts phenolic compounds, and its longer contact time with plant material allowed for increased polyphenol release to levels above 0.75 g GA/L. Increasing the methanol concentration while reducing the water content resulted in a decrease in extraction efficiency. The water content in the solvent promotes swelling of plant tissues, thus facilitating the penetration of the solvent into cells [21]. Figure S1 presents a scatter plot of the observed and approximate values during the interaction of the studied process parameters, i.e., time and methanol concentration. These plots show the observed and predicted effects of extraction time and methanol concentration on AA-DPPH and TPC, demonstrating good agreement between the model and the experimental data. Any deviations from the lines may represent values that slightly distort the model fit.
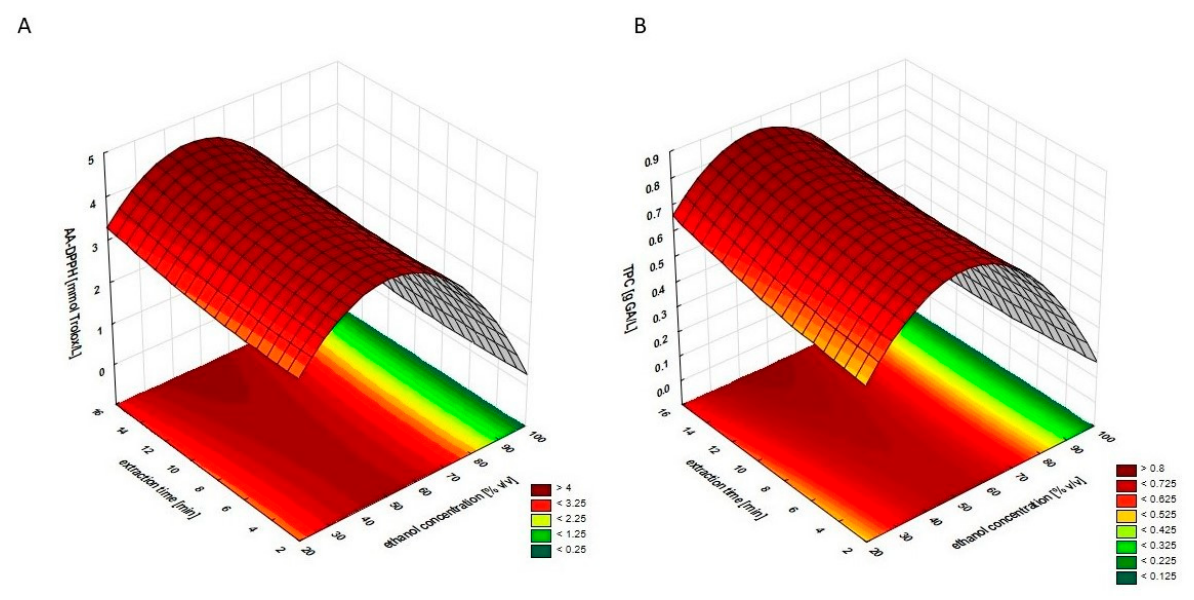
Figure 2 shows the response surfaces for AA-DPPH (A) and TPC (B) as a function of extraction time and ethanol concentration. AA-DPPH results depended on both extraction time and ethanol concentration. The maximum AA-DPPH value was achieved only when both factors (time and ethanol concentration) were at appropriate levels. In the case of red clover herb extraction, with increasing ethanol content in the solvent (i.e., from 40% to approx. 55%), an increase in the antioxidant activity of the extracts was observed up to a value of 4.5 mmol Trolox/L (Figure 2A). These results indicate that the optimal extraction conditions for red clover herbs to obtain the maximum value of the studied function are not associated with the highest possible ethanol concentration but with its moderate content at a longer extraction time (12–16 min). Only the simultaneous fulfilment of these conditions allowed the obtaining of extracts with the highest tested activity. A similar relationship between extraction time and ethanol concentration was observed in the case of polyphenol extraction—a longer extraction time (14–16 min) and a moderate ethanol content (ca. 40–55%) in the solvent allowed TPC values of 0.85 g GA/L to be obtained (Figure 2B). However, in the case of methanol, similar TPC values (above 0.75 g GA/L) were observed only in the concentration range of 50–70%. Compared to methanol, aqueous ethanol solutions exhibit higher bioavailability and better solubility of polyphenols [22]. Lower ethanol concentrations (higher water content) likely facilitate better penetration into cellular matrices, promoting the release of bound active compounds [23].
Figure S2 presents a scatter plot of the observed and approximate values during the interaction of the studied process parameters, i.e., time and ethanol concentration. These plots demonstrate very good agreement between the regression model and the experimental data. There are slight deviations between the actual and predicted values for both functions (without significant deviations), which suggests that the models accurately describe the relationship between antioxidant activity, total polyphenol content, extraction time, and ethanol concentration across the entire range studied.
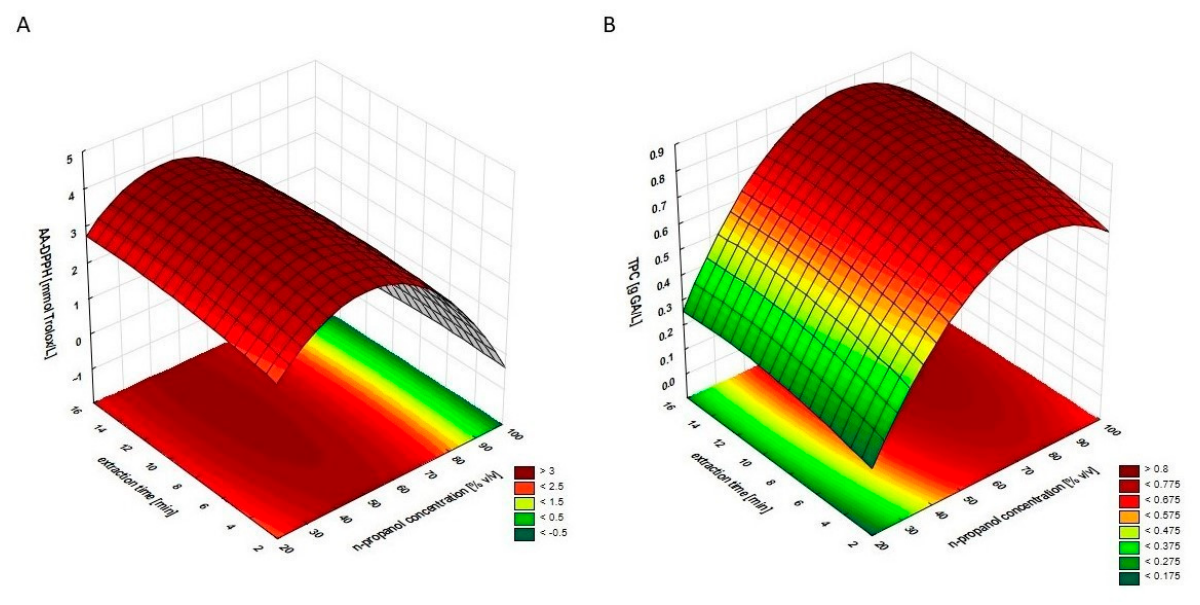
Figure 3 shows the response surfaces for AA-DPPH (A) and TPC (B) as a function of extraction time and n-propanol concentration. The effect of extraction time and n-propanol concentration on antioxidant activity shows that during the extraction of red clover herb using n-propanol concentrations ranging from 40 to 55% and extraction times from 6 to 16 min, the highest AA-DPPH values (above 3 mmol Trolox/L) are observed. When using higher concentrations of n-propanol (regardless of extraction time), a decrease in the tested function was observed (Figure 3A). Higher n-propanol concentrations in the extraction mixture make it more “nonpolar”, making it less effective in extracting compounds from the plant matrix [24]. An aqueous solution of n-propanol with a moderate concentration creates an environment with a more balanced polarity, which favours the extraction of both hydrophilic and moderately lipophilic compounds. At higher n-propanol concentrations, this balance is disturbed [25]. Conversely, the highest TPC concentration (above 0.8 g GA/L) was observed when using n-propanol at a concentration above 60%, regardless of the extraction time. Lower concentrations of n-propanol, especially below 40%, resulted in a significant decrease in polyphenol extraction efficiency. The graphs in Figure S3 show the scatter plots of observed and predicted values during the interaction of the analysed process parameters, i.e., time and n-propanol concentration. The graphs indicate good agreement of the regression model with the experimental data, because most points are distributed close to the regression line. However, there are also small deviations from the regression line that do not significantly affect the overall quality of fit, as confirmed by the high values of R2 and AdjR2 obtained in the statistical analysis (Table 1 and Table 2).
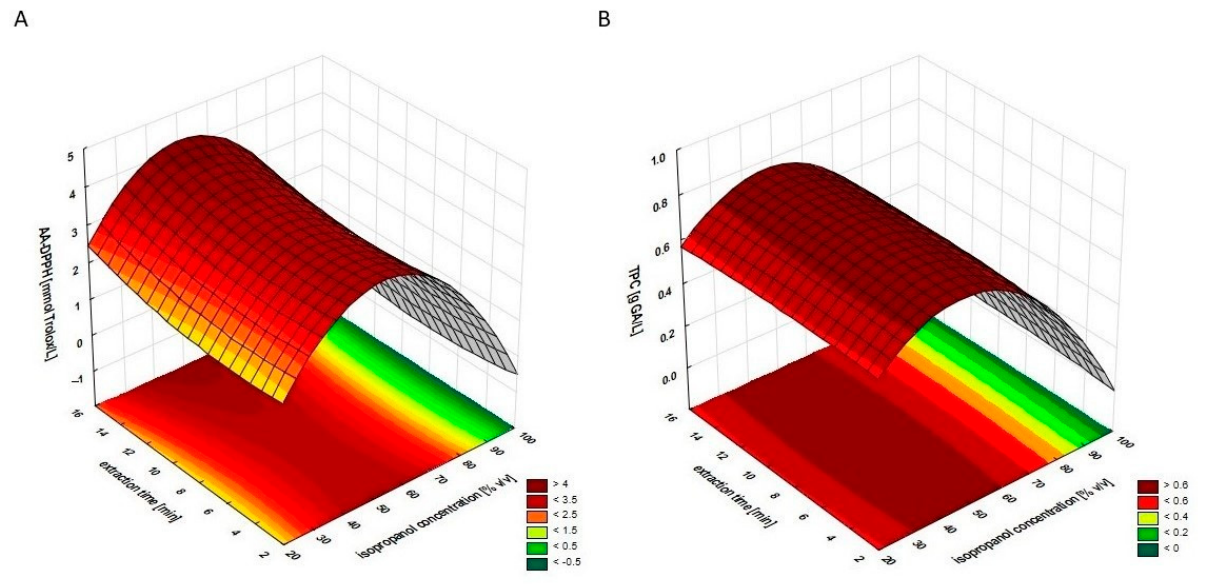
Figure 4 shows the response surfaces for AA-DPPH (A) and TPC (B) as a function of extraction time and isopropanol concentration. Response surface analysis shows that isopropanol as a solvent is most effective in extracting compounds with antioxidant potential from red clover herb at moderate concentrations (40–60%) and maximum extraction time (14–16 min). Under these conditions, the highest values of AA-DPPH were obtained, exceeding 4 mmol Trolox/L. With a gradual decrease in the isopropanol concentration below 20% and a shortening of the extraction time below 14 min, a significant decrease in antioxidant activity was observed, reaching values below the level of quantification. A similar trend was observed when the isopropanol concentration increased above 60%, which may be related to the limited ability to dissolve hydrophilic phenolic compounds in a low-water environment [26]. A similar trend was observed for total polyphenol content. Optimal TPC values (above 0.6 g GA/L) were obtained with isopropanol concentrations ranging from 30 to 60% and extraction times ranging from 14 to 16 min. Too high isopropanol concentrations led to a decrease in TPC below the limit of quantification, confirming that the extraction of the active substances tested does not occur efficiently outside the optimal conditions. Importantly, extracts obtained with lower isopropanol concentrations showed the highest AA-DPPH values, which is consistent with the observations for n-propanol (Figure 3), where moderate solvent concentrations also favoured the extraction of compounds with high antioxidant activity. The scatter plots in Figure S4, showing the relationship between observed and predicted values, indicate that the approximate model fits the actual data well. There are small deviations of points from the regression line (especially at higher observed values), but these are not significant and do not significantly affect the overall quality of fit, as confirmed by the high R2 (AA-DPPH = 0.968 and TPC = 0.988) and AdjR2 (DPPH = 0.937 and TPC = 0.976) values obtained in the statistical analysis (Table 1 and Table 2).
Table 3 presents the optimal parameters for the extraction of T. pratense herb using methanol, ethanol, n-propanol, and isopropanol as solvents, along with the corresponding values of the main process functions predicted by the RSM model at the estimated optimum (model-predicted extreme values). The highest TPC was obtained for the extract using n-propanol (0.82 g GA/L), which may indicate its greater ability to dissolve phenolic compounds present in red clover herb. It should be noted that the values reported in Table 3 are model-predicted optima obtained from the fitted RSM equations and do not represent experimentally averaged measurements. In turn, the highest antioxidant activity values (4.1 mmol Trolox/L) were obtained for both methanol and ethanol, indicating their effectiveness in extracting compounds with antioxidant properties. Extraction using ethanol required the shortest extraction time (3 min), while the optimal extraction time for n-propanol was as long as 13 min. The obtained results clearly indicate that the extraction efficiency of red clover herb depends on the type of solvent, its concentration, and the UAE time. The reliability of RSM for the red clover herb extraction process using methanol, ethanol, n-propanol, and isopropanol as solvents was experimentally confirmed. The values obtained for the main extraction process functions according to RSM analysis are presented in Table 4. All extracts prepared using optimal parameters exhibited higher antioxidant activity, ranging from 3.72 to 4.21 mmol Trolox/L. The efficiency of antioxidant extraction followed the order: methanol > ethanol > n-propanol > isopropanol. Meanwhile, the TPC values remained relatively consistent (0.72–0.84 g GA/L) and decreased in the order: n-propanol > ethanol > isopropanol > methanol. One-way ANOVA was employed to evaluate whether statistically significant differences existed between the experimentally obtained values (Table 4) and the RSM model-predicted values at the optimal extraction conditions (Table 3). The results of the analysis, summarised in Supplementary Tables S7 and S8, indicated no statistically significant differences (p > 0.05), confirming good agreement between experimental data and model predictions. Tukey’s post-hoc test was performed to assess the statistical significance of differences between antioxidant activity of extracts but also the total polyphenol content in extracts prepared in different solvents according to the optimal parameters (Table 3). Differences in antioxidant activity were statistically significant between extracts prepared in different solvents. No statistically significant differences were found between TPC in extracts prepared in ethanol and n-propanol nor between the content of these compounds in methanol and isopropanol extracts (Table 4). The obtained results (Table 4) confirm that the applied mathematical model was effective in determining the optimal extraction parameters of red clover herb in terms of total polyphenol content and antioxidant activity. These results also suggest a strong influence of solvent polarity on the efficiency of the extraction process. In the case of the DPPH assay, it was observed that the higher polarity of methanol influenced a more efficient extraction of compounds with strong antioxidant properties. In the case of TPC, it is suggested that solvents with medium polarity are more effective in extracting phenolic compounds [27].

3.2. Lipophilicity Assessment

An assessment of the lipophilicity of T. pratense extracts obtained under optimal conditions revealed that the log p values for methanol and n-propanol extracts were −0.4 and −0.6, respectively, while the ethanol extract also exhibited a negative value. This result indicates their hydrophilic character. A log p < 0 indicates a high content of hydrophilic compounds in the extract, characterised by the presence of numerous hydroxyl groups in the structure [28]. These groups enable the formation of hydrogen bonds with water molecules, significantly increasing the solubility of these substances in an aqueous environment. Phenolic compounds are known for their high polarity and ability to interact with water, making them ideal candidates for the production of cosmetics with antioxidant properties [27]. The log p value for the extract prepared using isopropanol was 0.2, indicating the different nature of this extract. The slightly higher affinity of this extract for the lipid phase may be due to the properties of isopropanol itself, which, as a solvent of moderate polarity, effectively extracts amphiphilic compounds [29]. Representative UV–Vis spectra of the analysed extracts are presented in Figure S5.

4. Discussion

Methanol, ethanol, n-propanol, and isopropanol were employed as polar solvents to extract polyphenols from T. pratense herb during the optimisation process. In the available literature, authors most often focused on studying the effect of ethanol and water on the process of extracting bioactive compounds from red clover herb. Kazlauskaite et al. [30] evaluated the total flavonoid and phenolic content in aqueous and ethanolic extracts from red clover flowers. They observed higher extraction efficiency of these compounds as a result of using 50% v/v ethanol as the solvent—the content of phenolics, including flavonoids, ranged from 32.31 to 44.78 and from 34.38 to 54.12 mg GA/g dry weight, respectively, for the aqueous and ethanolic extracts. Additionally, the authors observed a correlation between the total phenolics and flavonoids in the studied extracts [30]. A high content of polyphenols (at the level of 855 mg/100 g) in extracts from fresh red clover flowers was demonstrated also by Zawiślak et al. [31]. Similarly to the studies by Kazlauskaite et al. [30], in the studies by Zawiślak et al., ethanol extracts also exhibited a higher polyphenol content than aqueous extracts [31]. Moreover, Erenler et al., in extracts from red clover flowers, determined the total phenolic content at 82.44 mg GA/g of plant extract and additionally identified compounds such as coumarin, catechin, and isoquercitrin, which exhibit well-documented antioxidant potential [32].
Solvent selection is a critical parameter in extraction processes, as emphasised in previous studies [30,31,33,34]. In the present study, four alcohols in various concentrations with different polarities were used as solvents. Wakeel et al. [33] confirmed during the extraction of Isatis tinctoria plants that the polarity of the solvent affects the final result of total polyphenol and flavonoid content. The authors compared seven solvents with different polarities (water, ethanol, methanol, ethyl acetate, acetone, n-hexane, and chloroform) and their 1:1 v/v combinations. They observed that with the increase in solvent polarity, the total polyphenol content also increased. Extracts prepared in n-hexane, chloroform, and the n-hexane-ethyl acetate mixture showed the lowest TPC. In the case of total flavonoid content, no dependence on the solvent’s polarity was observed, but the least effective solvents turned out to be water and the water–methanol mixture. The authors emphasise that due to the different phytochemical compositions of various plant parts, it is important to individually select the solvent [33]. Khaddour et al. [34] evaluated the impact of ethanol at concentrations of 75% and 97% on the extraction of terpenoids from Ammi visnaga L. fruits. In their study, 97% ethanol was more effective in isolating terpenoids than 75% ethanol, but they observed the opposite relationship when extracting phenolic compounds. A solvent with lower polarity (97% ethanol) was more effective in extracting low-polarity compounds (terpenoids), while a more polar solvent (75% ethanol) was more effective in extracting polar polyphenols [34]. Our findings align with these observations, demonstrating a clear relationship between solvent polarity and the extraction of antioxidant compounds, including polyphenols. The highest TPC content was observed in extracts prepared in medium-polarity solvents—ethanol and n-propanol. The antioxidant activity of the optimised extracts decreased with decreasing solvent polarity. Moreover, the studies by Le et al. [35] show an increase in TPC content in ethanol extracts of Glycine max L. at concentrations of 60% (3.4 mg GE/g d.m.), 80% (7.1 mg/g d.m.) and 90% (9.0 mg/g d.m.) and a decrease in TPC extraction efficiency after using ethanol at concentrations above 90%. Tripathi et al. [36] also demonstrated that solvents with lower polarity than water, such as methanol and ethanol, are often more effective for polyphenol recovery [36]. This is consistent with our results, in which we recorded lower levels of compounds with antioxidant potential when using concentrated solvents. Literature data indicate that the lipophilicity of plant extracts, expressed as the log p partition coefficient (i.e., the logarithmic ratio of compound concentrations in n-octanol and aqueous phases), can be determined spectrophotometrically by analysing the total concentration of extracted compounds within appropriate wavelength ranges [37]. A similar hydrophilic profile was reported for an optimised ethanolic extract of Sanguisorba officinalis L. (log p = −0.307), which was attributed to the presence of phenolic acids, including gallic, chlorogenic, and caffeic acids [17]. In the present study, the application of log p serves as a physicochemical indicator to assess the relationship between solvent polarity and extraction efficiency. Although log p is a parameter fundamentally defined for pure compounds, it is used here as an approximate descriptor of the hydrophobic–hydrophilic balance of the dominant extracted fraction rather than as an absolute property of the complex plant extract. It should be emphasised that the measured log p values cannot be directly attributed to individual constituents of the extracts nor used for pharmacokinetic interpretation. However, the extracts with higher lipophilicity are often desirable in oil-based products [38]. Extracts with low log p values, indicating a predominance of hydrophilic compounds, may be favoured in hydroalcoholic cosmetics.
Despite the confirmed antioxidant potential of red clover herb extracts, there have been few studies so far on optimising extraction process parameters. Most of the available publications in this field focus on optimising extraction using ethanol. In the studies by Verhulst et al. [15], where RSM was applied to extract the total polyphenol content from red clover extracts, the following parameters were compared: temperature (40–80 °C), ethanol concentration (60–80%), and extraction time (15–45 min.). The researchers observed optimal extraction parameters for total polyphenol content and antioxidant activity tested with the DPPH assay: a temperature of 40 °C, an ethanol concentration of 80%, and an extraction time of 45 min. Moreover, the authors postulate that the use of optimal, mild extraction process conditions may reduce environmental costs while maintaining high efficiency [15]. Similarly, Khonchaisri et al. [39], in the ultrasonic extraction of Glycine max L., which, like T. pratense, belongs to the Fabaceae family, observed a decrease in the content of compounds with antioxidant potential, including TPC, with an increase in temperature to 60 °C. The authors observed the highest extraction efficiency as a result of using a lower temperature (40 °C) [39]. The previously cited studies by Le et al. [35] describe a drastic decrease in TPC content in plant extracts with increasing temperature from 60 °C to 80 °C. The authors suggest that this phenomenon is the result of the thermal degradation of polyphenols [35]. Kumar et al. [40] also observed a weakening of the sonication effect with an increase in ultrasonic extraction temperature and the degradation of bioactive compounds [40]. Therefore, in our own studies using an ultrasonic bath, a constant and controlled temperature of 40 ± 1 °C was maintained during the extraction process. Drużyńska et al. [6], based on response surface analysis of parameters for extraction assisted by mixing dried red clover, such as time (20, 40, 60 min), temperature (20, 40, 80 °C), and type of solvent (water and various concentrations of ethanol—40, 60, 80%), obtained higher antioxidant activity in alcoholic extracts than in aqueous ones. The DPPH assay showed a reduction in the amount of free radicals by 92.6–94.5% in ethanolic extracts and by 45.5–53.6% in aqueous extracts. They obtained the highest total polyphenol content in 80% EtOH for 40 min at 80 °C (over 47 mg GAE/g dry weight). The researchers observed a significant decrease in the total polyphenol content with a 20-min extraction at 80 °C and 40% ethanol [6]. In our studies, a decrease in the presence of compounds with antioxidant activity was also observed in extracts prepared in ethanol at concentrations below 40% v/v. Kobus et al. [41] found that the best solvent for extracting polyphenols from Cannabis sativa L. is 50% ethanol. Once again, this demonstrates how significant the influence of solvent polarity is on the extraction of compounds with antioxidant potential. The cited studies [6,15,30,42] also emphasise the significant effect of time on the content of biologically active compounds in plant extracts. In our study, the optimal ultrasound exposure time varied depending on the solvent used, ranging from 3 to 13 min. Kazlauskaite et al. [30] observed that extending sonication from 10 to 30 min reduced phenolic content in red clover flowers, likely due to ultrasound-induced degradation—a phenomenon also reported by Wang et al. [42].
The impact of particle size on extraction efficiency has been widely documented. Luo et al. [16] observed that reducing plant material size from 10 to 40 mesh significantly enhances yield, which aligns with our findings. By utilising ground herb (<0.25 mm), we achieved optimal ultrasound extraction times between 3 and 13 min, depending on the solvent. Muzykiewicz-Szymańska et al. [17] also used ground plant material (<0.25 mm) to increase the efficiency of the extraction process. Kobus et al. [41] also observed a significant impact of the particle size of the studied material on the total polyphenol content and antioxidant effect in Cannabis sativa L. extracts. They observed the highest values of the studied properties after using plant material with a particle size of 0.75 mm and their decrease with the increase in the particle size of the studied material. The highest values of the studied properties were observed with the increase in the size of the plant material particles from 0.25 mm to 0.75 mm, but with larger particles (1.25 mm), a decrease in these values was observed [41]. Alsaud et al. [43] showed that higher efficiency in terpene extraction from dried Manuka leaf extracts can be achieved by reducing the plant material particles to 68–200 µm. The authors noted that this may be related to the increased contact surface area of the solvent with the extracted plant material, which leads to an increase in the efficiency of extracting selected active substances from the plant matrix. Additionally, the grinding process likely affects the release of bioactive compounds from plants [43].
In our own research, a solid-to-solvent ratio of 1:20 g/mL was adopted. A very similar solvent-to-plant material ratio (21 mL/g) was deemed optimal by Zhang et al. [44] in hot extraction from red clover. In other studies, Zhang et al. [45] also applied the ratio of the solid phase to the liquid phase of 1:20 g/mL in the ultrasonic extraction of polyphenols from Pinus elliottii needles. Likewise, Hefied et al. [46] utilised a 1:20 ratio for optimising phenolic extraction from Pistacia atlantica Desf. using RSM, highlighting the prevalence of this ratio in botanical extraction studies.
The limitation of the conducted studies is primarily the optimisation of extraction for a single technique of determining antioxidant activity. The widespread use of the DPPH assay facilitates the comparison of results between authors. It is also possible to study alcoholic extracts with varying degrees of polarity. However, this test may not show the full potential in removing free radicals, as it primarily measures the ability of compounds to donate electrons rather than their overall antioxidant capacity in complex biological systems. Many environmental factors can influence the modification of the DPPH radical scavenging reaction. It happens that the interaction of DPPH radicals with antioxidants is less than the actual activity of individual compounds [47]. In the Folin–Ciocalteu analysis, reaction interference may occur due to the presence of other substances contained in the tested sample. Oxidation of some non-phenolic compounds may result in reduction of the Folin–Ciocalteu reagent. This phenomenon is one of the limitations of this method’s selectivity in determining total polyphenol content [48]. A limitation will also be the natural variability of plant material, which is influenced by various climatic factors in different growing seasons, such as temperature, rainfall, and soil conditions, which can affect the concentration of polyphenols and other compounds in the extracts. Such variability may cause differences in results between authors. This study primarily focuses on determining the total amount of compounds, so further in vitro studies and analyses of the phytochemical profile of the obtained extracts are planned. Moreover, the evaluation of the dermocosmetic potential of the obtained extracts is also planned. Further analyses are necessary, including the assessment of cytotoxicity and other beneficial effects on the skin, such as the evaluation of anti-inflammatory potential and the ability to inhibit extracellular matrix enzymes (elastase and collagenase). Additionally, ex vivo studies on skin, including the penetration and accumulation of active substances, need to be conducted.

5. Conclusions

The present study optimised the ultrasound-assisted extraction (UAE) of Trifolium pratense L. herb to maximise total polyphenol content (TPC) and antioxidant activity (AA-DPPH). The obtained results indicate that all optimised parameters, i.e., extraction time, solvent selection, and water content in the alcohol–water mixture used as the solvent, significantly influenced the tested activity of the obtained extracts. Depending on the solvent used, the optimal extraction time ranged from 3 to 13 min, and the alcohol concentration ranged from 49 to 61% v/v. Among the obtained samples, the methanol extracts demonstrated the highest antioxidant activity, while the n-propanol and ethanol extracts had the highest total polyphenol content. The high antioxidant activity and total polyphenol content in the ethanol extract, as well as very favourable optimal extraction parameters (3 min and 50% ethanol concentration), may support future applications of this extract. The obtained results are preliminary and constitute a starting point for further research, necessary to fully assess its dermocosmetic potential. It is essential, for the further use of extracts in cosmetic formulations, to conduct additional studies that evaluate their safety, efficacy, and compatibility with other ingredients commonly used in cosmetics.

Supplementary Materials

The following supporting information can be downloaded at: https://www.mdpi.com/article/10.3390/app16104979/s1, Figure S1. A scatter plot of the observed and approximate values during the interaction of the studied process parameters, i.e., time (min) and methanol concentration (%); Figure S2. A scatter plot of the observed and approximate values during the interaction of the studied process parameters, i.e., time (min) and ethanol concentration (%); Figure S3. A scatter plot of the observed and approximate values during the interaction of the studied process parameters, i.e., time (min) and n-propanol concentration (%); Figure S4. A scatter plot of the observed and approximate values during the interaction of the studied process parameters, i.e., time (min) and isopropanol concentration (%); Figure S5. UV–vis spectra of red clover herb extracts. Table S1. The obtained values for DPPH; Table S2. The obtained values for TPC; Table S3. Summary statistics for DPPH (ethanol, methanol, n-propanol, isopropanol); Table S4. ANOVA results for DPPH (ethanol, methanol, n-propanol, isopropanol); Table S5. Summary statistics for TPC (ethanol, methanol, n-propanol, isopropanol); Table S6. ANOVA results for TPC (ethanol, methanol, n-propanol, isopropanol); Table S7. One-way ANOVA results for antioxidant activity (AA-DPPH) comparing model-predicted and experimentally obtained values under optimal extraction conditions; Table S8. One-way ANOVA results for total polyphenol content (TPC) comparing model-predicted and experimentally obtained values under optimal extraction conditions.

Author Contributions

Conceptualization, M.T.; methodology, M.T. and R.P.; software, M.T., R.P., and E.K.; validation, M.T.; formal analysis, M.T., R.P., E.K., and A.M.-S.; investigation, M.T., R.P., E.K., and A.M.-S.; resources, M.T.; data curation, M.T.; writing—original draft preparation, M.T., A.M.-S., and E.K.; writing—review and editing, M.T., A.M.-S., E.K., and A.N.; visualization, M.T.; supervision, A.N. and A.M.-S.; project administration, A.M.-S. All authors have read and agreed to the published version of the manuscript.

Funding

This research received no external funding.

Institutional Review Board Statement

Not applicable.

Informed Consent Statement

Not applicable.

Data Availability Statement

The original contributions presented in this study are included in the article/Supplementary Materials. Further inquiries can be directed to the corresponding author.

Conflicts of Interest

The authors declare no conflicts of interest.

Abbreviations

The following abbreviations are used in this manuscript:
UAEUltrasound-assisted extraction
RSMResponse surface methodology
AA-DPPHAntioxidant activity
TPCTotal polyphenol content

References

  1. Saggar, S.; Mir, P.A.; Kumar, N.; Chawla, A.; Uppal, J.; Shilpa, S.; Kaur, A. Traditional and Herbal Medicines: Opportunities and Challenges. Pharmacogn. Res. 2022, 14, 107–114. [Google Scholar] [CrossRef]
  2. Parham, S.; Kharazi, A.Z.; Bakhsheshi-Rad, H.R.; Nur, H.; Ismail, A.F.; Sharif, S.; RamaKrishna, S.; Berto, F. Antioxidant, Antimicrobial and Antiviral Properties of Herbal Materials. Antioxidants 2020, 9, 1309. [Google Scholar] [CrossRef] [PubMed]
  3. Chen, J.; Liu, Y.; Zhao, Z.; Qiu, J. Oxidative Stress in the Skin: Impact and Related Protection. Int. J. Cosmet. Sci. 2021, 43, 495–509. [Google Scholar] [CrossRef]
  4. Marwicka, J.; Zięba, A. Antioxidants as a defence against reactive oxygen species. Aesthetic Cosmetol. Med. 2021, 10, 271–276. [Google Scholar] [CrossRef]
  5. Hasnain, A.; Naqvi, S.A.H.; Ayesha, S.I.; Khalid, F.; Ellahi, M.; Iqbal, S.; Hassan, M.Z.; Abbas, A.; Adamski, R.; Markowska, D.; et al. Plants in Vitro Propagation with Its Applications in Food, Pharmaceuticals and Cosmetic Industries; Current Scenario and Future Approaches. Front. Plant Sci. 2022, 13, 1009395. [Google Scholar] [CrossRef] [PubMed]
  6. Drużyńska, B.; Łukasiewicz, J.; Majewska, E.; Wołosiak, R. Optimization of the Extraction Conditions of Polyphenols from Red Clover (Trifolium pratense L.) Flowers and Evaluation of the Antiradical Activity of the Resulting Extracts. Antioxidants 2024, 13, 414. [Google Scholar] [CrossRef]
  7. Lee, S.G.; Brownmiller, C.R.; Lee, S.-O.; Kang, H.W. Anti-Inflammatory and Antioxidant Effects of Anthocyanins of Trifolium pratense (Red Clover) in Lipopolysaccharide-Stimulated RAW-267.4 Macrophages. Nutrients 2020, 12, 1089. [Google Scholar] [CrossRef]
  8. Bajpai, D.; Rajasekar, A. Preparation and Evaluation of the Biological Properties of Ethanolic Extract of Red Clover: An In Vitro Study. Cureus 2024, 16, e59762. [Google Scholar] [CrossRef]
  9. Cosmile Europe Database. Available online: https://cosmileeurope.eu/inci/results/?q=trifolium+pratense (accessed on 19 March 2026).
  10. Martínez-Patiño, J.C.; Gullón, B.; Romero, I.; Ruiz, E.; Brnčić, M.; Žlabur, J.Š.; Castro, E. Optimization of Ultrasound-Assisted Extraction of Biomass from Olive Trees Using Response Surface Methodology. Ultrason. Sonochem. 2019, 51, 487–495. [Google Scholar] [CrossRef] [PubMed]
  11. Anaya-Esparza, L.M.; Aurora-Vigo, E.F.; Villagrán, Z.; Rodríguez-Lafitte, E.; Ruvalcaba-Gómez, J.M.; Solano-Cornejo, M.Á.; Zamora-Gasga, V.M.; Montalvo-González, E.; Gómez-Rodríguez, H.; Aceves-Aldrete, C.E.; et al. Design of Experiments for Optimizing Ultrasound-Assisted Extraction of Bioactive Compounds from Plant-Based Sources. Molecules 2023, 28, 7752. [Google Scholar] [CrossRef]
  12. Weremfo, A.; Abassah-Oppong, S.; Adulley, F.; Dabie, K.; Seidu-Larry, S. Response Surface Methodology as a Tool to Optimize the Extraction of Bioactive Compounds from Plant Sources. J. Sci. Food Agric. 2023, 103, 26–36. [Google Scholar] [CrossRef]
  13. Szpisják-Gulyás, N.; Al-Tayawi, A.N.; Horváth, Z.H.; László, Z.; Kertész, S.; Hodúr, C. Methods for Experimental Design, Central Composite Design and the Box–Behnken Design, to Optimise Operational Parameters: A Review. Acta Aliment. 2023, 52, 521–537. [Google Scholar] [CrossRef]
  14. Kumar, R.; Reji, M. Response Surface Methodology (RSM): An Overview to Analyze Multivariate Data. Indian J. Microbiol. Res. 2023, 9, 241–248. [Google Scholar] [CrossRef]
  15. Verhulst, E.P.; Álvarez, C.; Brunton, N.P.; Rai, D.K. Optimizing Polyphenol Extraction and UPLC-MS/MS Analysis from Red Clover (Trifolium pratense L.) Species Using Response Surface Methodology. Food Chem. Adv. 2024, 5, 100828. [Google Scholar] [CrossRef]
  16. Luo, Z.; Xu, Y.; Qiu, L.; Lv, S.; Zeng, C.; Tan, A.; Ou, D.; Song, X.; Yang, J. Optimization of Ultrasound-Assisted Extraction Based on Response Surface Methodology Using HPLC-DAD for the Analysis of Red Clover (Trifolium pretense L.) Isoflavones and Its Anti-Inflammatory Activities on LPS-Induced 3D4/2 Cell. Front. Vet. Sci. 2023, 10, 1279178. [Google Scholar] [CrossRef]
  17. Muzykiewicz-Szymańska, A.; Kucharska, E.; Pełech, R.; Nowak, A.; Jakubczyk, K.; Kucharski, Ł. The Optimisation of Ultrasound-Assisted Extraction for the Polyphenols Content and Antioxidant Activity on Sanguisorba officinalis L. Aerial Parts Using Response Surface Methodology. Appl. Sci. 2024, 14, 9579. [Google Scholar] [CrossRef]
  18. Gligor, O.; Clichici, S.; Moldovan, R.; Muntean, D.; Vlase, A.-M.; Nadăș, G.C.; Novac, C.Ș.; Filip, G.A.; Vlase, L.; Crișan, G. Red Clover and the Importance of Extraction Processes—Ways in Which Extraction Techniques and Parameters Affect Trifolium pratense L. Extracts’ Phytochemical Profile and Biological Activities. Processes 2022, 10, 2581. [Google Scholar] [CrossRef]
  19. Nowak, A.; Duchnik, W.; Muzykiewicz-Szymańska, A.; Kucharski, Ł.; Zielonka-Brzezicka, J.; Nowak, A.; Klimowicz, A. The Changes of Antioxidant Activity of Three Varieties of ‘Nalewka’, a Traditional Polish Fruit Alcoholic Beverage during Long-Term Storage. Appl. Sci. 2023, 13, 1114. [Google Scholar] [CrossRef]
  20. Antony, A.; Farid, M. Effect of Temperatures on Polyphenols during Extraction. Appl. Sci. 2022, 12, 2107. [Google Scholar] [CrossRef]
  21. Lee, J.-Y.; Kim, J.-H. Effect of Water Content of Organic Solvent on Microwave-Assisted Extraction Efficiency of Paclitaxel from Plant Cell Culture. Korean J. Chem. Eng. 2011, 28, 1561–1565. [Google Scholar] [CrossRef]
  22. Kaur, H.; Kaur, G. A Critical Appraisal of Solubility Enhancement Techniques of Polyphenols. J. Pharm. 2014, 2014, 180845. [Google Scholar] [CrossRef] [PubMed]
  23. Bolat, E.; Sarıtaş, S.; Duman, H.; Eker, F.; Akdaşçi, E.; Karav, S.; Witkowska, A.M. Polyphenols: Secondary Metabolites with a Biological Impression. Nutrients 2024, 16, 2550. [Google Scholar] [CrossRef]
  24. Nawaz, H.; Shad, M.A.; Rehman, N.; Andaleeb, H.; Ullah, N. Effect of Solvent Polarity on Extraction Yield and Antioxidant Properties of Phytochemicals from Bean (Phaseolus vulgaris) Seeds. Braz. J. Pharm. Sci. 2020, 56, e17129. [Google Scholar] [CrossRef]
  25. Pinheiro Pires, A.P.; Arauzo, J.; Fonts, I.; Domine, M.E.; Fernández Arroyo, A.; Garcia-Perez, M.E.; Montoya, J.; Chejne, F.; Pfromm, P.; Garcia-Perez, M. Challenges and Opportunities for Bio-Oil Refining: A Review. Energy Fuels 2019, 33, 4683–4720. [Google Scholar] [CrossRef]
  26. Huamán-Castilla, N.L.; Copa-Chipana, C.; Mamani-Apaza, L.O.; Luque-Vilca, O.M.; Campos-Quiróz, C.N.; Zirena-Vilca, F.; Mariotti-Celis, M.S. Selective Recovery of Polyphenols from Discarded Blueberries (Vaccinium corymbosum L.) Using Hot Pressurized Liquid Extraction Combined with Isopropanol as an Environmentally Friendly Solvent. Foods 2023, 12, 3694. [Google Scholar] [CrossRef]
  27. Ye, F.; Liang, Q.; Li, H.; Zhao, G. Solvent Effects on Phenolic Content, Composition, and Antioxidant Activity of Extracts from Florets of Sunflower (Helianthus annuus L.). Ind. Crops Prod. 2015, 76, 574–581. [Google Scholar] [CrossRef]
  28. Kumar, N.; Goel, N. Phenolic Acids: Natural Versatile Molecules with Promising Therapeutic Applications. Biotechnol. Rep. 2019, 24, e00370. [Google Scholar] [CrossRef]
  29. Carré, P.; Berthold, S.; Piofczyk, T.; Bothe, S.; Hadjiali, S. Solvent Solutions: Comparing Extraction Methods for Edible Oils and Proteins in a Changing Regulatory Landscape. Part 1: Physical-Properties. OCL 2024, 31, 31. [Google Scholar] [CrossRef]
  30. Kazlauskaite, J.A.; Ivanauskas, L.; Marksa, M.; Bernatoniene, J. The Effect of Traditional and Cyclodextrin-Assisted Extraction Methods on Trifolium pratense L. (Red Clover) Extracts Antioxidant Potential. Antioxidants 2022, 11, 435. [Google Scholar] [CrossRef] [PubMed]
  31. Zawiślak, A.; Francik, R.; Francik, S.; Knapczyk, A. Impact of Drying Conditions on Antioxidant Activity of Red Clover (Trifolium pratense), Sweet Violet (Viola odorata) and Elderberry Flowers (Sambucus nigra). Materials 2022, 15, 3317. [Google Scholar] [CrossRef]
  32. Erenler, R.; Hosaflıoğlu, İ.; Yıldız, İ.; Atalar, M.N.; Çelik, S.M.; Alma, M.H. Quantitative Analysis of Phenolics in Trifolium pratense L. Flowers and Evaluation of Antioxidant Activity by Sensory. J. New Results Sci. 2024, 13, 165–174. [Google Scholar] [CrossRef]
  33. Wakeel, A.; Jan, S.A.; Ullah, I.; Shinwari, Z.K.; Xu, M. Solvent Polarity Mediates Phytochemical Yield and Antioxidant Capacity of Isatis tinctoria. PeerJ 2019, 7, e7857. [Google Scholar] [CrossRef]
  34. Khaddour, J.; Siyo, B.; Tayoub, G. Impact of Solvent Polarity in Ultrasound-Assisted Extraction on the Phytochemical Profile and Antibacterial Potential of Ammi visnaga L. Fruit Extracts from Syria. J. Appl. Res. Med. Aromat. Plants 2026, 51, 100694. [Google Scholar] [CrossRef]
  35. Le, X.T.; Lan Vi, V.L.; Toan, T.Q.; Bach, L.G.; Truc, T.T.; Hai Ha, P.T. Extraction Process of Polyphenols from Soybean (Glycine max L.) Sprouts: Optimization and Evaluation of Antioxidant Activity. Processes 2019, 7, 489. [Google Scholar] [CrossRef]
  36. Tripathi, S.; Singh, S.; Mishra, N.; Mishra, N. The Impact of Solvent Polarity on the Phenolic and Antioxidant Capacity of Green Coffee Beans (Robusta species) Extracts. Curr. Res. Nutr. Food Sci. 2025, 13, 926–936. [Google Scholar] [CrossRef]
  37. Kucharski, Ł.; Kucharska, E.; Muzykiewicz-Szymańska, A.; Nowak, A.; Pełech, R. Chemical Composition, Antioxidant Potential, and Antimicrobial Activity of Novel Antiseptic Lotion from the Leaves of Betula pendula Roth. Appl. Sci. 2025, 15, 3658. [Google Scholar] [CrossRef]
  38. Rabiej-Kozioł, D.; Kryska, N.; Szydłowska-Czerniak, A. Structure-Property Influence on the Amphiphilicity of Phenolipids. Chem. Proc. 2022, 12, 17. [Google Scholar] [CrossRef]
  39. Khonchaisri, R.; Sumonsiri, N.; Prommajak, T.; Rachtanapun, P.; Leksawasdi, N.; Techapun, C.; Taesuwan, S.; Halee, A.; Nunta, R.; Khemacheewakul, J. Optimization of Ultrasonic-Assisted Bioactive Compound Extraction from Green Soybean (Glycine max L.) and the Effect of Drying Methods and Storage Conditions on Procyanidin Extract. Foods 2022, 11, 1775. [Google Scholar] [CrossRef]
  40. Kumar, K.; Srivastav, S.; Sharanagat, V.S. Ultrasound Assisted Extraction (UAE) of Bioactive Compounds from Fruit and Vegetable Processing by-Products: A Review. Ultrason. Sonochem. 2021, 70, 105325. [Google Scholar] [CrossRef] [PubMed]
  41. Kobus, Z.; Buczaj, A.; Pecyna, A.; Kapica, J.; Findura, P.; Kocira, S. Application of Response Surface Method in Pulsed Ultrasound-Assisted Extraction of Complex Plant Materials—A Case Study on Cannabis sativa L. Appl. Sci. 2023, 13, 760. [Google Scholar] [CrossRef]
  42. Wang, Q.; Chen, J.-J.; Qiu, B.; Zhou, L.; Liu, R.-Y.; Huang, J.-F.; He, Y.; Xie, Q. Optimization of Ultrasound-Assisted Deep Eutectic Solvents Extraction of Rutin from Ilex asprella Using Response Surface Methodology. Sci. Rep. 2025, 15, 6205. [Google Scholar] [CrossRef]
  43. Alsaud, N.; Farid, M. Insight into the Influence of Grinding on the Extraction Efficiency of Selected Bioactive Compounds from Various Plant Leaves. Appl. Sci. 2020, 10, 6362. [Google Scholar] [CrossRef]
  44. Zhang, H.; Zhao, J.; Shang, H.; Guo, Y.; Chen, S. Extraction, Purification, Hypoglycemic and Antioxidant Activities of Red Clover (Trifolium pratense L.) Polysaccharides. Int. J. Biol. Macromol. 2020, 148, 750–760. [Google Scholar] [CrossRef] [PubMed]
  45. Zhang, S.; Xie, H.; Huang, J.; Chen, Q.; Li, X.; Chen, X.; Liang, J.; Wang, L. Ultrasound-Assisted Extraction of Polyphenols from Pine Needles (Pinus elliottii): Comprehensive Insights from RSM Optimization, Antioxidant Activity, UHPLC-Q-Exactive Orbitrap MS/MS Analysis and Kinetic Model. Ultrason. Sonochem. 2024, 102, 106742. [Google Scholar] [CrossRef]
  46. Hefied, F.; Ahmed, Z.B.; Yousfi, M. Optimization of Ultrasonic-Assisted Extraction of Phenolic Compounds and Antioxidant Activities from Pistacia atlantica Desf. Galls Using Response Surface Methodology. J. Appl. Res. Med. Aromat. Plants 2023, 32, 100449. [Google Scholar] [CrossRef]
  47. Gulcin, İ.; Alwasel, S.H. DPPH Radical Scavenging Assay. Processes 2023, 11, 2248. [Google Scholar] [CrossRef]
  48. Rizvi, N.B.; Fatima, A.; Busquets, R.; Khan, M.R.; Ashraf, S.; Khan, M.S.; Oz, F. Effect of the Media in the Folin-Ciocalteu Assay for the Analysis of the Total Phenolic Content of Olive Products. Food Anal. Methods 2023, 16, 1627–1634. [Google Scholar] [CrossRef]
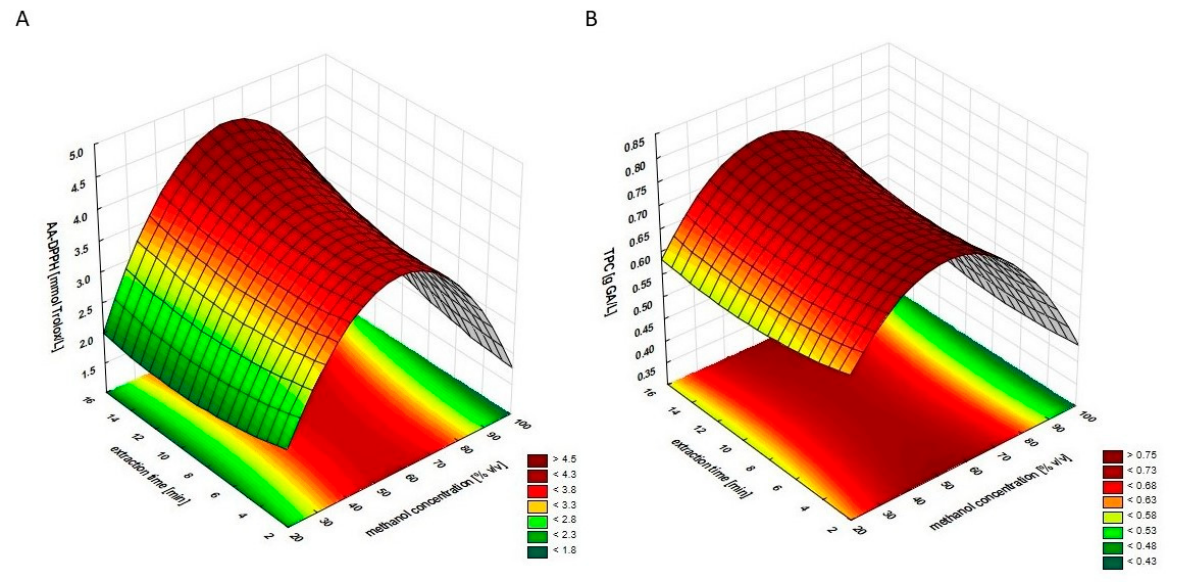
Figure 1. Response surface plots showing the effect of methanol concentration (% v/v) and extraction time (min) on (A) AA-DPPH (mmol Trolox/L) and (B) TPC (g GA/L). The surfaces represent the fitted quadratic models, while the contour projections show iso-response lines corresponding to constant values of the respective responses. The colour scale corresponds to the response values.
Applsci 16 04979 g001
Figure 2. Response surface plots showing the effect of ethanol concentration (% v/v) and extraction time (min) on (A) AA-DPPH (mmol Trolox/L) and (B) TPC (g GA/L). The surfaces represent the fitted quadratic models, while the contour projections show iso-response lines corresponding to constant values of the respective responses. The colour scale corresponds to the response values.
Applsci 16 04979 g002
Figure 3. Response surface plots showing the effect of n-propanol concentration (% v/v) and extraction time (min) on (A) AA-DPPH (mmol Trolox/L) and (B) TPC (g GA/L). The surfaces represent the fitted quadratic models, while the contour projections show iso-response lines corresponding to constant values of the respective responses. The colour scale corresponds to the response values.
Applsci 16 04979 g003
Figure 4. Response surface plots showing the effect of isopropanol concentration (% v/v) and extraction time (min) on (A) AA-DPPH (mmol Trolox/L) and (B) TPC (g GA/L). The surfaces represent the fitted quadratic models, while the contour projections show iso-response lines corresponding to constant values of the respective responses. The colour scale corresponds to the response values.
Applsci 16 04979 g004
Table 1. The most relevant response surface methodology (RSM) optimisation statistics for antioxidant activity, evaluated using the DPPH assay (AA-DPPH).
Antioxidant Activity (AA-DPPH)
EthanolMethanoln-PropanolIsopropanol
a00.444955−0.034251−0.404594−1.29019
a10.1483090.1495210.1545320.19822
a2−0.001494−0.001316−0.001551−0.00188
a3−0.006630−0.1197910.110254−0.06184
a40.0026860.004352−0.0034610.00648
a5−0.0003110.001170−0.000628−0.00043
R20.9040.9650.9740.968
AdjR20.8170.9310.9490.937
Table 2. The most relevant response surface methodology (RSM) optimisation statistics for the total polyphenol content (TPC).
Total Polyphenol Content (TPC)
EthanolMethanoln-PropanolIsopropanol
a00.0607490.401705−0.3794700.184245
a10.0271420.0144550.0291030.024406
a2−0.000259−0.000140−0.000192−0.000264
a30.006105−0.0128810.0202220.004435
a40.0004340.000520−0.000764−0.000328
a5−0.0001610.0000660.0000060.000038
R20.9620.7130.8630.988
AdjR20.9250.5080.7450.976
Table 3. Optimal parameters for the extraction process of red clover herb using methanol, ethanol, n-propanol, and isopropanol as solvents and the corresponding values of the main process functions.
Optimal Parameters
of the Extraction Process
MethanolEthanoln-PropanolIsopropanol
Solvent concentration
[% vol]
57506149
Extraction time
[min]
73138
Functions of the
extraction process
Antioxidant activity
(AA-DPPH)
[mmol Trolox/L]
4.14.13.63.6
Total polyphenol content
[g GA/L]
0.730.770.820.77
Table 4. Values for the main functions of the red clover herb extraction process according to RSM analysis.
Optimal Parameters
of the Extraction Process
MethanolEthanoln-PropanolIsopropanol
Solvent concentration
[% vol]
57506149
Extraction time
[min]
73138
Functions of the
extraction process
Antioxidant activity
(AA-DPPH)
[mmol Trolox/L]
4.21 ± 0.02 a3.92 ± 0.02 b3.84 ± 0.02 c3.72 ± 0.02 d
Total polyphenol content
[g GA/L]
0.72 ± 0.01 b0.81 ± 0.01 a0.84 ± 0.01 a0.76 ± 0.01 b
Values marked with different letters (a–d) differ statistically significantly (α < 0.05) separately for AA-DPPH and TPC.
Disclaimer/Publisher’s Note: The statements, opinions and data contained in all publications are solely those of the individual author(s) and contributor(s) and not of MDPI and/or the editor(s). MDPI and/or the editor(s) disclaim responsibility for any injury to people or property resulting from any ideas, methods, instructions or products referred to in the content.