1. Introduction
Composite solid propellants are extensively employed in rocket motors, missiles, and spacecraft launch vehicles due to their superior mechanical properties, excellent processability, and long-term storage stability. Among various formulations, the ammonium perchlorate/hydroxyl-terminated polybutadiene (AP/HTPB) system remains one of the most established and widely utilized in solid rocket propulsion. Consequently, elucidating the combustion mechanisms and identifying the critical factors governing the burning rate have remained central objectives in propellant research. The combustion process is governed by a complex interplay between intrinsic formulation parameters—such as the oxidizer-to-fuel ratio, catalyst additives, and particle size distribution—and external operating conditions, including initial temperature, ambient pressure, and radiative heat transfer. Building upon a two-dimensional BDP micro-scale combustion model, a systematic analysis of how AP particle size and mass fraction influence component diffusion, flame propagation, and temperature field distribution is of significant value for both fundamental research and the practical optimization of propellant formulations.
During the development of steady-state combustion models for AP/HTPB, Price and his team [
1], using high-resolution scanning electron microscopy (SEM), made detailed observations revealing that the microstructure of AP/HTPB exhibits significant and regular quasi-periodic features, presenting a precisely structured sandwich-like layered configuration. This key discovery provided an important foundation for subsequent research, enabling the macroscopic combustion behavior. to be conceptualized at the micro-scale as the combined effect of individual sandwich-structured units. Furthermore, Beckstead and his collaborators [
2], based on extensive experimental data and rigorous theoretical analysis, pioneered the BDP micro-scale combustion model. Developed jointly by M.W. Beckstead, R.L. Derr, and C.F. Price, the core premise of this model emphasizes the critical role of condensed-phase reactions in burning rate analysis, ensuring that the model’s description of the entire combustion process of composite propellants is both scientifically accurate and highly consistent with observed combustion phenomena. Particularly notable is the model’s excellent demonstration that, under specific assumptions, the macroscopic flame structure of AP/HTPB can be viewed as an ordered collection of numerous micro-scale flame units arranged according to defined geometric rules. This micro-scale essence of macroscopic combustion phenomena reveals the complex kinetic mechanisms involved and offers new perspectives on the theoretical depth and practical application value of combustion models. The critical particle size model proposed by Sammons [
3] was groundbreaking; its detailed model explanation and methodological description were substantial contributions. Nevertheless, this model exhibited a degree of roughness in determining the critical particle size and did not fully account for subtle factors. In contrast, research by Glick [
4] and his team proposed the Packed Ensemble of Particles (PEM) model. This model achieves more accurate simulation results by first classifying randomly distributed oxidizer particles by type and then further subdividing them within the same category by particle size range. This method significantly improves computational accuracy and agreement with actual conditions, albeit at the cost of increased computational complexity and longer computation times. Both studies demonstrate the unique application value of oxidizers under different modeling approaches and provide important references for future research. In studies published in References [
5,
6,
7], the research team led by Xu Wengan systematically investigated the combustion plateau effect and mesa effect of AP composite solid propellants, proposing innovative explanations based on a two-zone model. The researchers further established a precise sandwich structure model, which plays a significant role in revealing the micro-scale combustion mechanism of AP/HTPB, providing crucial theoretical guidance for in-depth research and greatly promoting the expansion and deepening of knowledge in this field.
Through studies of the aforementioned models, researchers have established a relatively mature sandwich structure model. To comprehensively explore the complex combustion behavior of AP/HTPB propellants, pioneering researchers such as Jackson [
8] and Hermance [
9] ingeniously constructed an integrated kinetic framework. This framework focuses on analyzing the core mechanisms within the gas-phase reaction zone, employing a single gas-phase reaction kinetic expression integrated with the thermodynamic equations of the flame sheet to achieve a systematic analysis of the combustion process. Although this model achieved notable success in predicting burning rates, showing high consistency with experimental data, it still faced challenges in revealing the fine influence of key parameters such as temperature and pressure on the dynamic evolution of burning rates, indicating certain applicability limitations. Consequently, researchers continuously optimized and expanded the global kinetic model, gradually upgrading it to a more detailed semi-global chemical reaction kinetic model. This progressive framework, building upon the original, innovatively integrated solid-phase reaction kinetics and apparent chemical reaction rate models, thoroughly revised and improved the fundamental assumptions regarding the flame sheet, thereby significantly enhancing the model’s predictive accuracy and theoretical explanatory power and providing a more reliable tool for understanding propellant combustion mechanisms.
Authoritative scholars such as Manelis G.B. and Strunin V.A. [
10,
11] deeply analyzed the dominant role of the condensed phase in the combustion process, emphasizing its critical influence. They clearly pointed out that the condensed-phase decomposition properties of AP significantly regulate the combustion scale and, based on this view, rigorously revised and optimized existing models. Furthermore, experts including Narahari H.K. [
12], Sahu H. [
13], and Okobeinichev O. P. [
14] focused on constructing more detailed chemical reaction mechanisms, systematically studying the reaction characteristics of AP in the gas phase and precisely analyzing the dynamic distribution patterns of product components during combustion, providing an important basis for theoretical deepening in this field. The aforementioned studies collectively advanced the comprehensive understanding of the AP combustion mechanism, provided theoretical support for model revision, and offered guidance for optimizing AP applications. In the field of solid propellant combustion mechanism research, Jing [
15] systematically deepened the study of solid-phase and condensed-phase reactions during AP combustion, significantly improving the accuracy of determining non-uniform burning rates and surface temperatures through framework optimization. Building on this, research by Jeppesen [
16] expanded the AP gas-phase reaction mechanism to an unprecedented level of detail, incorporating a complete network involving 157 complex reaction steps and 44 key species, thereby providing a new analytical perspective for the combustion kinetics of AP/HTPB composite propellants. The prominent advantage of this advanced model lies in its ability to quantitatively reveal the coupling characteristics of temperature, pressure, and combustion state and to accurately simulate the non-uniform effects of AP particle distribution within the HTPB matrix. Its predictive accuracy and engineering applicability have been widely validated. During their in-depth research, Felt [
17] and Gross [
18] systematically refined and optimized this complex reaction mechanism, successfully simplifying it into an elegant framework containing 127 detailed reaction steps and 37 key species. This model not only excellently inherits the achievements of the solid-phase and condensed-phase reaction mechanisms for AP combustion proposed by Jing but also forms distinctive reaction pathways through differential selection of the proportion of solid-phase AP decomposition.
Relying on mature steady-state combustion models and chemical kinetic models, many domestic scholars have conducted large-scale, multi-dimensional experimental explorations and high-precision numerical simulations on the combustion characteristics of AP/HTPB, yielding abundant and insightful academic results. This work not only deepens the understanding of AP combustion reaction mechanisms but also provides an important theoretical foundation for the combustion design of AP/HTPB propellants. Ma Longze [
19], in his research, adopted a gas–solid coupling theory framework combined with a simplified two-step global chemical reaction kinetic model to numerically simulate the steady-state combustion behavior of AP/HTPB propellant within the pressure range of 0.1 MPa to 7 MPa. The research focused on revealing the complexity and diversity of flame surface topology under different pressure gradients. Meanwhile, Wang et al. [
20] and his research team conducted in-depth investigations into the combustion characteristics of AP/HTPB composite solid propellant under low-pressure conditions. Experimental data showed that in low-pressure environments, the heat transfer process between AP particles and the binder exhibits significant non-uniformity. This non-uniformity causes the combustion front to exhibit an inward concave trend in the interfacial region, with the degree of concavity strengthening as the external pressure decreases, demonstrating a clear positive correlation; that is, the concave phenomenon is more severe under lower pressure conditions. Under the leadership of Li Wenfeng, the research team [
21] successfully established a two-dimensional axisymmetric unsteady heat transfer framework for AP/HTPB propellant, combined with a two-step chemical kinetics model, systematically investigating the influence of different heating conditions on the unsteady combustion phenomena of this propellant, thereby analyzing its detailed combustion response mechanism. The research by Chen Wangqi [
22] was more extensive and diverse, studying the numerical simulation of steady-state combustion characteristics of AP/HTPB solid propellant under different pressure conditions and mixing ratios, as well as the numerical simulation of unsteady combustion characteristics under an initial maximum pressure drop rate of 480 MPa/s, drawing many accurate and reliable conclusions. The team led by Sun Di [
23] conducted a comprehensive sensitivity assessment of the burning rate parameters of AP/HTPB propellant, focusing on the significant effect of activation energy changes on the propellant’s burning rate behavior, while also analyzing the regulatory mechanism of pressure differences on the sensitivity of this parameter. Dou Yanmeng and Luo Yunjun et al. [
24] also studied the combustion performance of hydrogen storage alloy AP/HTPB propellant, analyzing changes in the burning rate of AP/HTPB after adding catalysts. Xu Guanyu et al. [
25], considering that traditional sandwich models neglect the influence of adjacent flames, employed a multi-layer sandwich model structure for numerical simulation. Makoto Kohga [
26] systematically investigated the effects of AP particle size, AP content, and the catalyst Fe
2O
3 on the combustion and thermal decomposition behavior of AP/HTPB propellants, finding that the burning rate increases with higher AP content and smaller AP particle size, and that the addition of Fe
2O
3 also enhances the burning rate. Y.J. Cao et al. [
27] numerically simulated the unsteady combustion process of AP/HTPB propellants under rapid depressurization conditions, revealing a premixed flame at low pressures and a diffusion flame at high pressures, and that depressurization leads to a decrease in the flame heat release rate and an increase in gas velocity. WeiQiang Pang et al. [
28] analyzed the effects of hydroborate iron compound (HIC) in AP/HTPB/Al propellants on burning rate, flame structure, and combustion products, discovering that HIC effectively increases the burning rate and results in a porous and loose structure of the combustion residues. Yu Cang [
29] proposed a novel partitioned numerical framework to simulate the combustion of AP/HTPB propellants at the mesoscale with randomly packed real AP particles. WeiDong Cai [
30] found that a strong axial crossflow within a rocket motor can cause the flame to bend towards the propellant surface and enhance heat feedback, thereby inducing erosive burning.
This study focuses on a two-dimensional BDP microscale combustion model that systematically reveals how AP particle size and mass fraction individually influence near-surface diffusion behavior, flame propagation paths, and temperature distribution at the microscale. This model further enables the identification of threshold conditions and pressure dependence for the transition from premixed-dominated to diffusion-dominated combustion as AP particle size increases. These findings provide new insights and a valuable reference for further understanding the combustion mechanisms of composite propellants, which largely overlooked two-dimensional diffusion effects and coupled parametric interactions. Furthermore, these findings can guide the application and formulation optimization design of composite propellants.
2. Calculation Method
2.1. BDP Micro-Scale Model
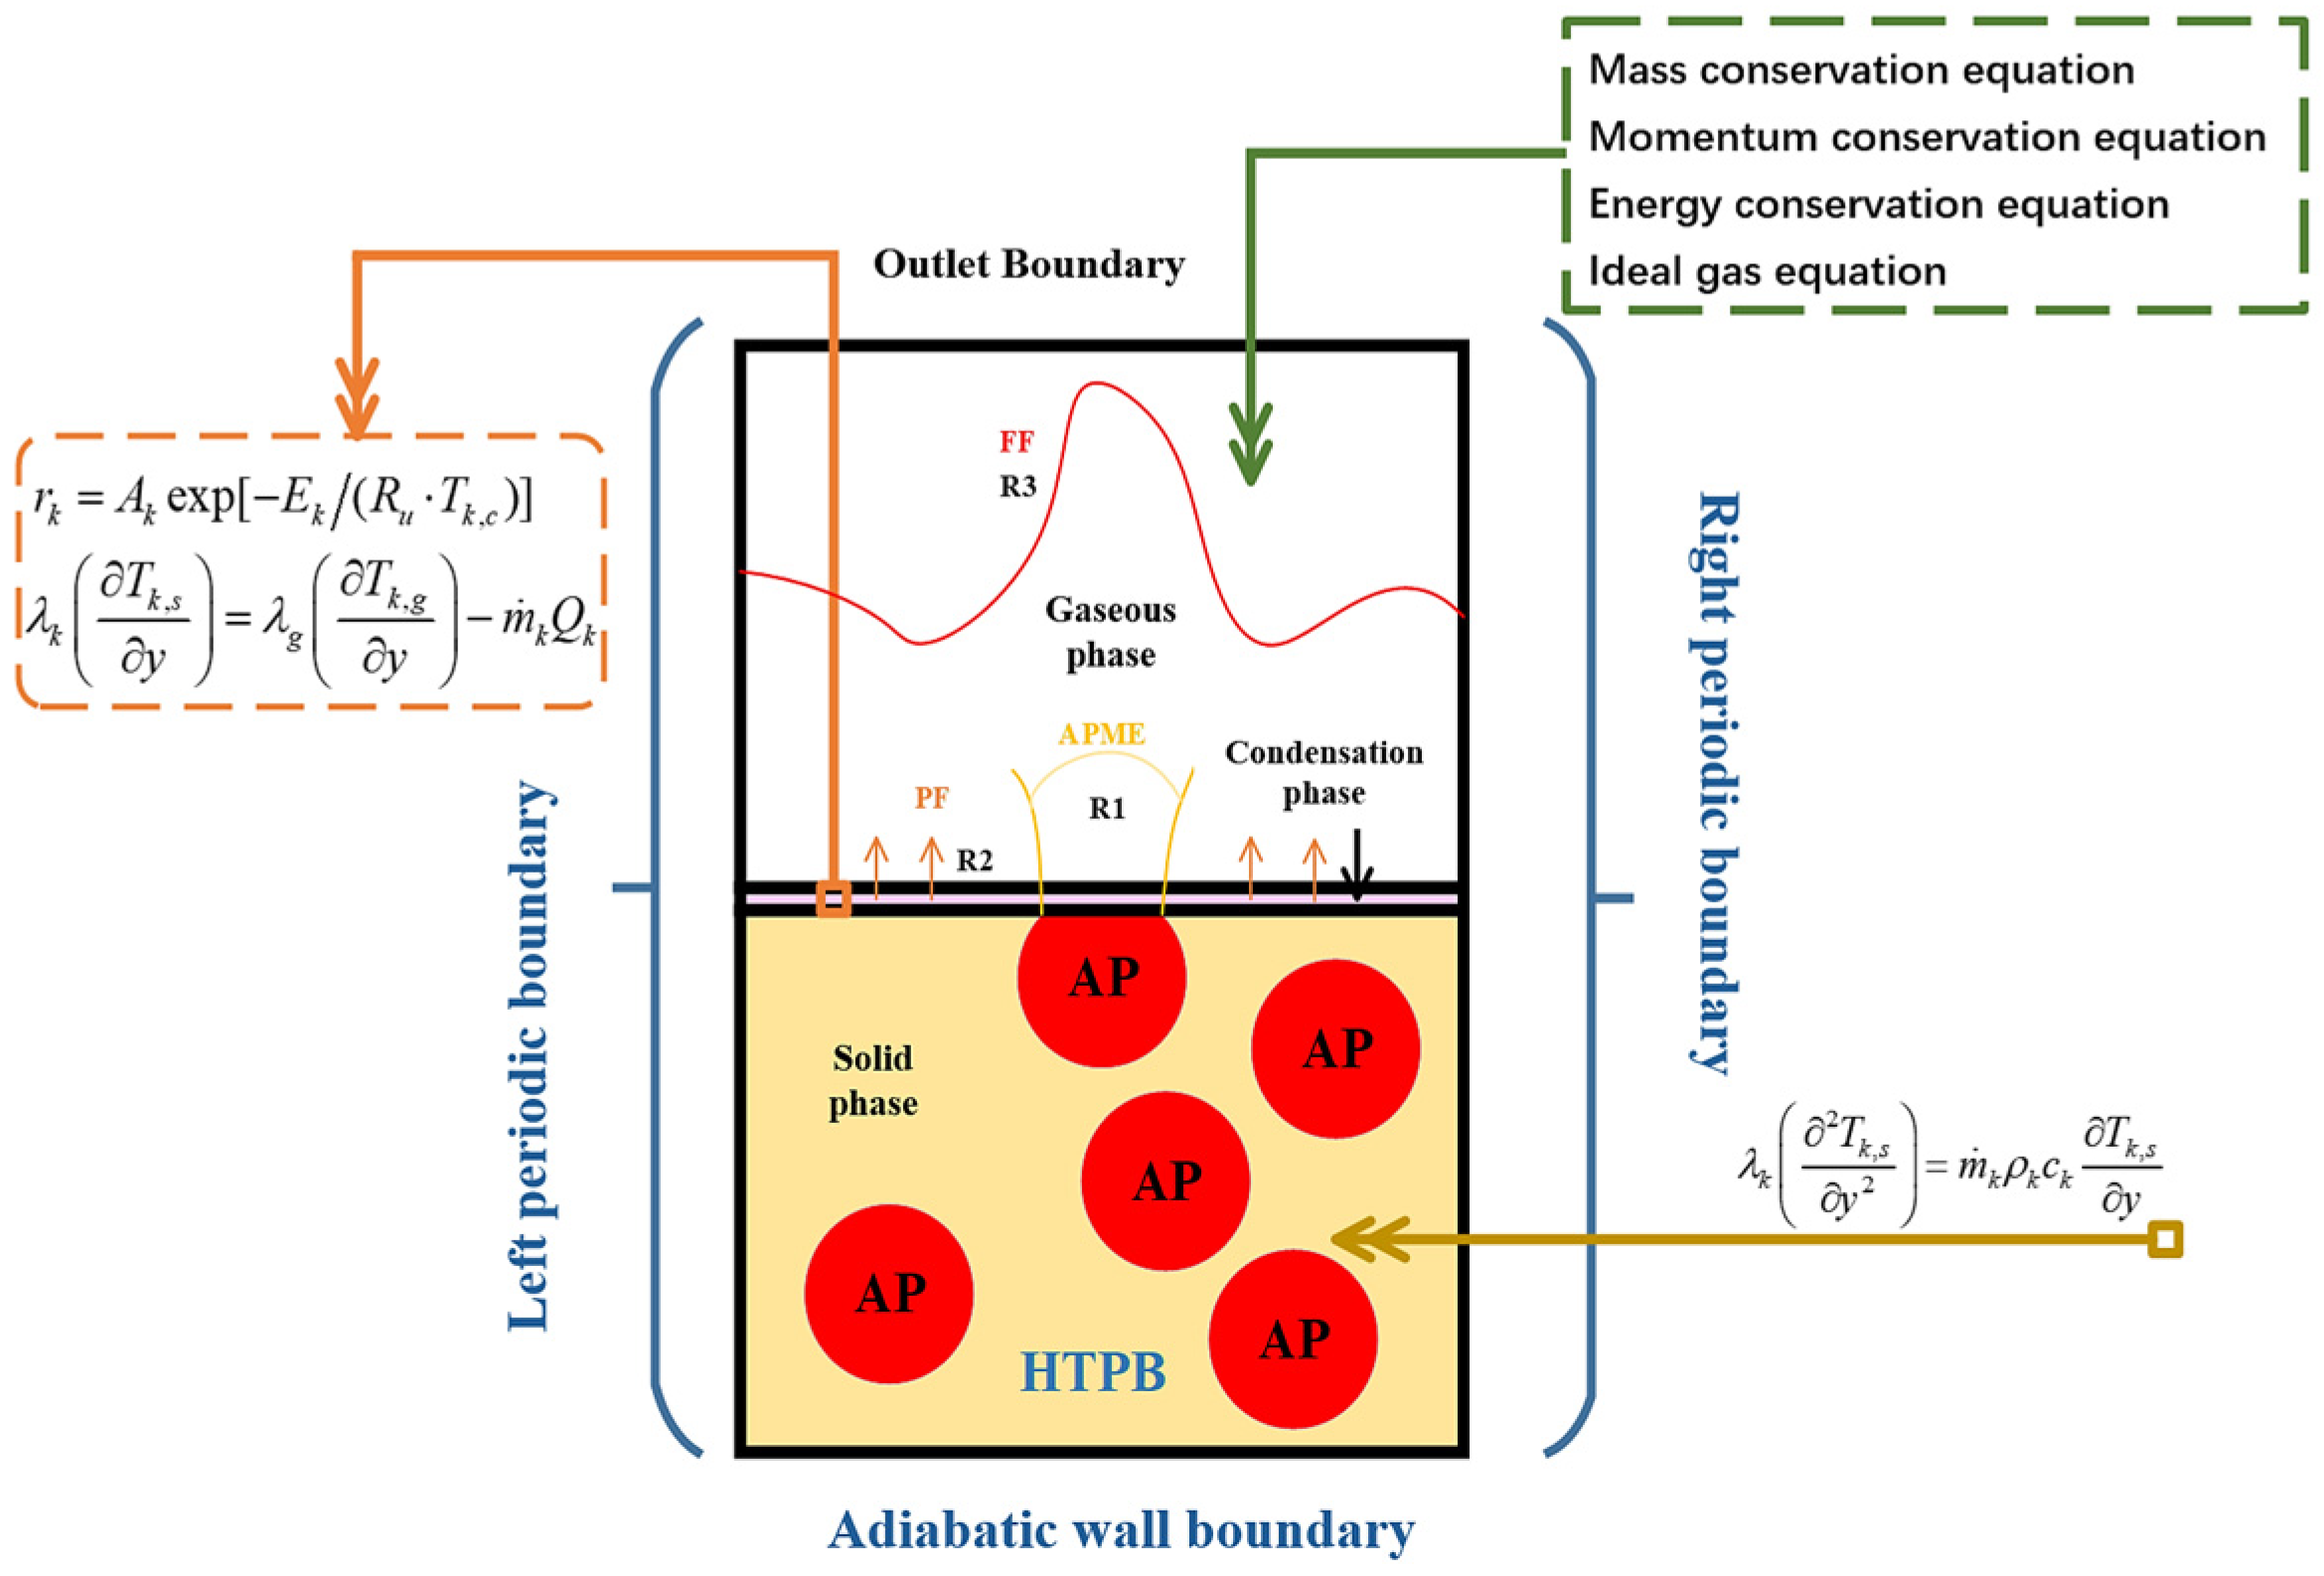
The BDP micro-scale combustion model for AP/HTPB composite propellant is shown in
Figure 1 As can be seen, the model primarily consists of three regions: the solid-phase region, the condensed-phase region, and the gas-phase region.
(1) The solid phase constitutes the bulk of the composite propellant. Upon heating, the AP and HTPB components undergo thermal expansion, melting, sublimation, or decomposition. The resulting products transition into the condensed or gas phases, serving as the primary fuel and oxidizer source for the system. To streamline the computational process, the present model accounts only for heat conduction within the solid phase, neglecting thermal effects at the internal contact interfaces between components and assuming no chemical reactions occur within this region.
(2) The condensed-phase is an intermediate transition zone where AP and HTPB complete the phase change from solid to gas, characterized by a molten state. Key processes, including gasification, evaporation, and pyrolysis, are concentrated in this layer. The condensed layer functions as a thermal buffer, conducting heat to the underlying solid phase while absorbing thermal feedback from the gas phase. In this model, the condensed phase is assumed to be infinitesimally thin; consequently, the mixing and reactions of AP and HTPB in the molten state are neglected. Furthermore, it is assumed that no longitudinal temperature gradient exists within the individual molten layers of AP and HTPB, with the condensed phase temperature defined as being equal to the burning surface temperature.
(3) The gas phase primarily involves the transport and diffusion of fuel and oxidizer components, alongside highly pressure-dependent exothermic reactions. These processes give rise to three distinct flame structures: the decomposition flame, the primary diffusion flame, and the final diffusion flame. The decomposition flame (APME) is formed by the interplay between the diffusion of AP decomposition products from the condensed phase and the rapid gas-phase decomposition of any remaining AP species. The primary diffusion flame (PF) originates from the pyrolysis products of HTPB, which mix and react with undecomposed AP species. Finally, the final diffusion flame (FF) is generated by the subsequent mixing and reaction between residual HTPB fragments and the remaining AP decomposition products.
To address the multi-physics coupling characteristics of AP/HTPB propellant combustion, the two-dimensional microscale BDP combustion model developed in this paper adopts the following simplifications:
(1) Solid-phase heat conduction is assumed to be one-dimensional, with a linear temperature gradient in the condensed phase, neglecting heat exchange between AP and HTPB.
(2) The effects of burning surface regression-induced wall roughness are not considered.
(3) The surface regression of the AP and HTPB phases is modeled via an Arrhenius pyrolysis law. The regression rate is therefore not an imposed boundary condition but is determined self-consistently from the energy balance at the propellant surface, linking solid-phase heat conduction to gas-phase heat feedback.
(4) All gases are treated as ideal gases, with temperature-dependent thermal properties. The properties of the gas mixture are determined by mass-weighted averaging of the component properties.
(5) In the gas phase, the convective transport rates of heat and mass are assumed to be equal, implying a unity Lewis number (Le = 1).
(6) The influence of the bulk flow velocity in the combustion chamber is neglected; near-wall flow is driven mainly by species and thermal diffusion, resulting in a low-speed, laminar flame structure.
(7) Under gas–solid non-isothermal coupling, radiation and convection effects within the boundary layer are ignored in the analysis of heat transfer characteristics.
2.2. Governing Equations
- (a)
Solid-Phase Energy Equation
Under constant-pressure combustion conditions, the propellant exhibits steady-state flame characteristics: the gas-phase temperature field and gas–solid heat exchange flux tend to stabilize, and the solid-phase temperature distribution becomes time-independent. Its governing equation can be simplified to the following one-dimensional steady-state form:
where
ck is the solid-phase heat capacity,
ρk is the solid-phase density,
λk is the solid-phase thermal conductivity, and the solid-phase temperature at infinity (
y = −∞) is defined as equal to
T0. The interface between the condensed phase and solid phase is defined as
y = 0.
The solid-phase temperature distribution along y can be obtained by solving the following equation:
- (b)
Condensed-Phase Decomposition and Energy Equation
The AP crystal first experiences a phase transition from an orthorhombic structure to a cubic structure at 513 K. As the temperature increases, the crystal lattice becomes unstable and melts around 830 K. Equilibrium dissociative sublimation and degradation of AP occurs at this temperature. The degradation results in a thin superficial reaction layer, accounting for 70% consumption of the AP crystal. The remaining 30% undergoes a highly endothermic equilibrium dissociative sublimation (Δ
Hdis = 58 ± 2 kcal/mol) through a proton transfer producing gaseous ammonium and perchlorate acid. The species so generated subsequently undergo a sequence of chain reactions to form a premixed flame producing final products such as O
2, NO, and N
2O, which act as major oxidizers in the gas-phase reactions [
30]. Based on previous scholars’ analysis of the combustion characteristics of AP monopropellant, the chemical reactions for AP condensed-phase decomposition can be represented as RAP1 and RAP2, respectively:
HTPB is a commonly used binder in composite propellants; it is essentially a long-chain, crosslinked polymer. Studies have shown that the pyrolysis process of HTPB and its pyrolysis products are highly dependent on temperature. When the temperature is below 770 K, the major gaseous decomposition product is butadiene (C
4H
6). When the temperature reaches 1170 K, the major gaseous decomposition product becomes ethylene (C
2H
4), while butadiene accounts for only 1–2% of the decomposition products [
31]. Based on the gas-phase near-wall temperature in composite propellants, the pyrolysis equation for HTPB can be expressed as
The regression rate of the condensed phase burning surface can be expressed as
where
Ak is the decomposition rate constant,
Ek is the decomposition activation energy,
Ru is the universal gas constant,
Tk,c is the condensed-phase temperature.
denotes the mass flux per unit area of component
k, representing the rate of mass consumption as the solid phase transforms into gas due to regressing burning surface. The condensed-phase energy equation can be expressed as
where the left-hand term represents the heat conduction from the condensed-phase to the solid phase. The first term on the right-hand side accounts for the gas-phase heat feedback, where only the effect of gas-phase heat conduction is considered. The second term on the right-hand side is the heat release/absorption term in the condensed phase region. For AP, this second term corresponds to the heat absorbed during the transformation of AP crystals into the molten state and their dissociation into free molecules, where Q
AP denotes the heat release per unit mass of AP in the condensed phase. For HTPB, this second term represents the endothermic process of its transition from solid to molten state followed by pyrolysis, where Q
HTPB is the heat absorbed per unit mass of HTPB as it transforms from solid polymer to C
2H
4.
While the current model effectively captures the primary heat release and regression behavior, several simplifications in the condensed-phase treatment and their potential implications should be noted. First, the decomposition of AP and HTPB is represented by a limited set of global reactions (Equations (3)–(5)), which bypasses complex radical chain mechanisms and short-lived intermediate species. This simplification may lead to minor discrepancies in predicting flame sensitivity under highly transient conditions or specific pressure oscillations. Second, the model assumes quasi-one-dimensional heat conduction, potentially underestimating localized thermal heterogeneities and the “sandwich effect” at the AP/HTPB interfaces. Such an idealization might result in a slight smoothing of the calculated local temperature gradients compared to the actual multi-dimensional thermal field. Finally, thermophysical properties, such as thermal conductivity (λ) and activation energy (
Ek), are assumed to be temperature-independent within specific regimes. This may overlook secondary kinetic effects and non-linear material responses under extreme pressure gradients. Despite these limitations, the model maintains high predictive accuracy for steady-state combustion, as evidenced by the strong agreement with experimental burning rate data. These simplifications are therefore considered both reasonable and computationally efficient for investigating the macro-scale combustion characteristics of composite propellants. As demonstrated by the model validation in
Section 3.1, the simulation results are in good agreement with the experimental data, confirming that the model effectively captures the fundamental physical and chemical mechanisms of composite propellant combustion.
- (c)
Gas-Phase Governing Equations and Chemical Reaction Mechanism
The formulation of the gas-phase governing equations involves the comprehensive application of mass, momentum, and energy conservation relations, integrated with the ideal gas equation of state, to systematically depict the physicochemical mechanisms of flame propagation. This model, based on the sophisticated BDP multi-flame model, innovatively proposes a three-step global reaction mechanism to describe the dynamic evolution of AP/HTPB flames. In this mechanism, R1 represents the typical reaction mode of the AP monopropellant flame, initiated by AP decomposition, with its corresponding chemical reaction equation being concise and typical; R2 describes the generation process of the primary diffusion flame, originating from the dynamic diffusion coupling between free AP macromolecules and HTPB pyrolysis products; R3 accurately depicts the formation characteristics of the final diffusion flame, whose essence is the complex diffusion interaction between AP decomposition products and HTPB pyrolysis products.
The chemical reaction expressions for R1, R2, R3 can be respectively represented as
Among them, the component compositions of AP, AP_D, and Final products are defined in Equations (11)–(13) respectively. In the model, these are treated as mixed gases, with their gas-phase concentrations denoted as X (AP) and Z (AP_D) respectively; the gas-phase concentration of HTPB decomposition product C
2H
4 is marked as Y.
The reaction rates for the three reactions are calculated using the pressure-dependent Arrhenius formulas, as shown in Equations (14)–(16).
Here,
A1,
A2, and
A3 are the chemical reaction rate constants;
n1,
n2, and
n3 are the pressure exponents; and
E1,
E2, and
E3 are the activation energies. The maximum heat release for each gas-phase reaction can be determined by subtracting the enthalpy of the reactants from that of the products at a reference temperature, as shown in Equation (17).
In this equation,
mi and
hi are the mass and formation enthalpy of each component in the products;
mj and
hj are the mass and formation enthalpy of each component in the reactants; and
Tref is the reference temperature, equal to 298.15 K. The parameters for the three-step AP/HTPB gas-phase reaction mechanism are listed in
Table 1.
2.3. Calculation Method and Boundary Conditions
Gas-phase periodic boundary:
Here, φ represents all variables in the flow field; x = 0 represents the left starting boundary of the gas-phase region; x = L is the right ending boundary of the gas-phase region.
To ensure the finest AP particles can be calculated smoothly, a base structural grid of 1 µm × 1 µm was chosen. To include the diffusion flame shape of the largest AP particles, after considering the position and length of the AP/HTPB diffusion flame, the calculation length of the gas-phase region was set to 1 mm. According to the principle of controlling a single variable, parameters such as AP particle size, AP mass fraction, and combustion pressure were individually changed for calculation. The model is established as a periodic configuration, with periodic boundary conditions applied on both lateral sides. An isothermal far-field boundary condition with a temperature of T
0 = 300 K is specified at the bottom. The top boundary is set as a pressure outlet, where the external static pressure is consistent with the ambient pressure within the computational domain. The numerical calculation scheme is as follows (
Table 2):
3. Influence of AP Characteristics on Component Diffusion Characteristics
To quantify the evolution characteristics of component diffusion behavior, this paper selects four types of characteristic indicators: NH3 + HClO4, O2, H2O, and CO2. Their analytical value is reflected as follows: NH3 + HClO4 serves dual functions as the sole reactant for R1 (AP decomposition flame) and a reactant for R2 (primary diffusion flame), directly regulating the intensity gradient and spatial configuration of the dual flames; O2, as a reactant for R3 (final diffusion flame) and a product of R1, reveals the chain coupling mechanism of the flames; H2O, as a common product of R1/R3, marks the flame spacing; CO2, as a product of R2/R3, simultaneously reflects the HTPB consumption process and flame front migration.
3.1. Model Validity Verification
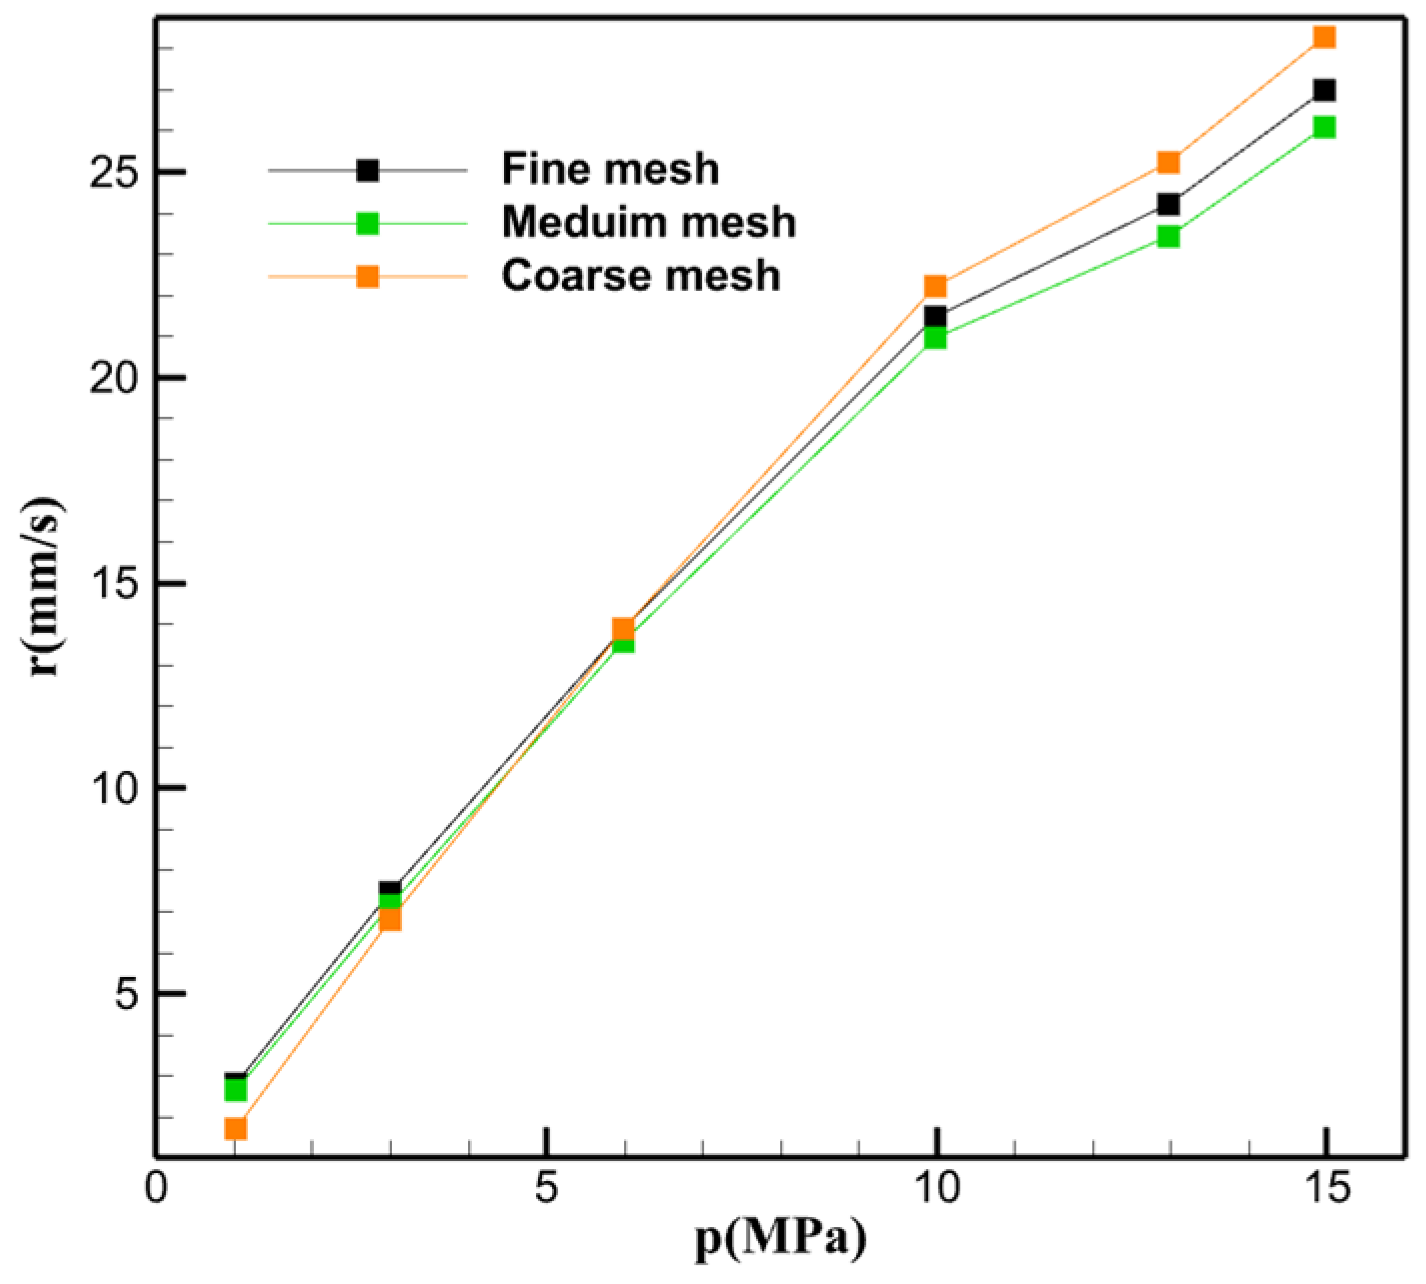
A grid independence study was performed to ensure that the numerical solutions remain independent of the mesh resolution. Three computational grids with varying refinement levels—designated as coarse, medium, and fine—were evaluated. The burning rates calculated from these meshes were compared across a pressure range of 1–10 MPa. As illustrated in
Figure 2, the results obtained from the medium and coarse meshes show excellent agreement with those from the fine mesh, with only negligible deviations observed across the entire pressure spectrum. Although the coarser meshes demonstrate sufficient convergence, the fine mesh was selected for all subsequent simulations to capture the flame structure and near-surface gradients with the highest possible spatial resolution and numerical accuracy.
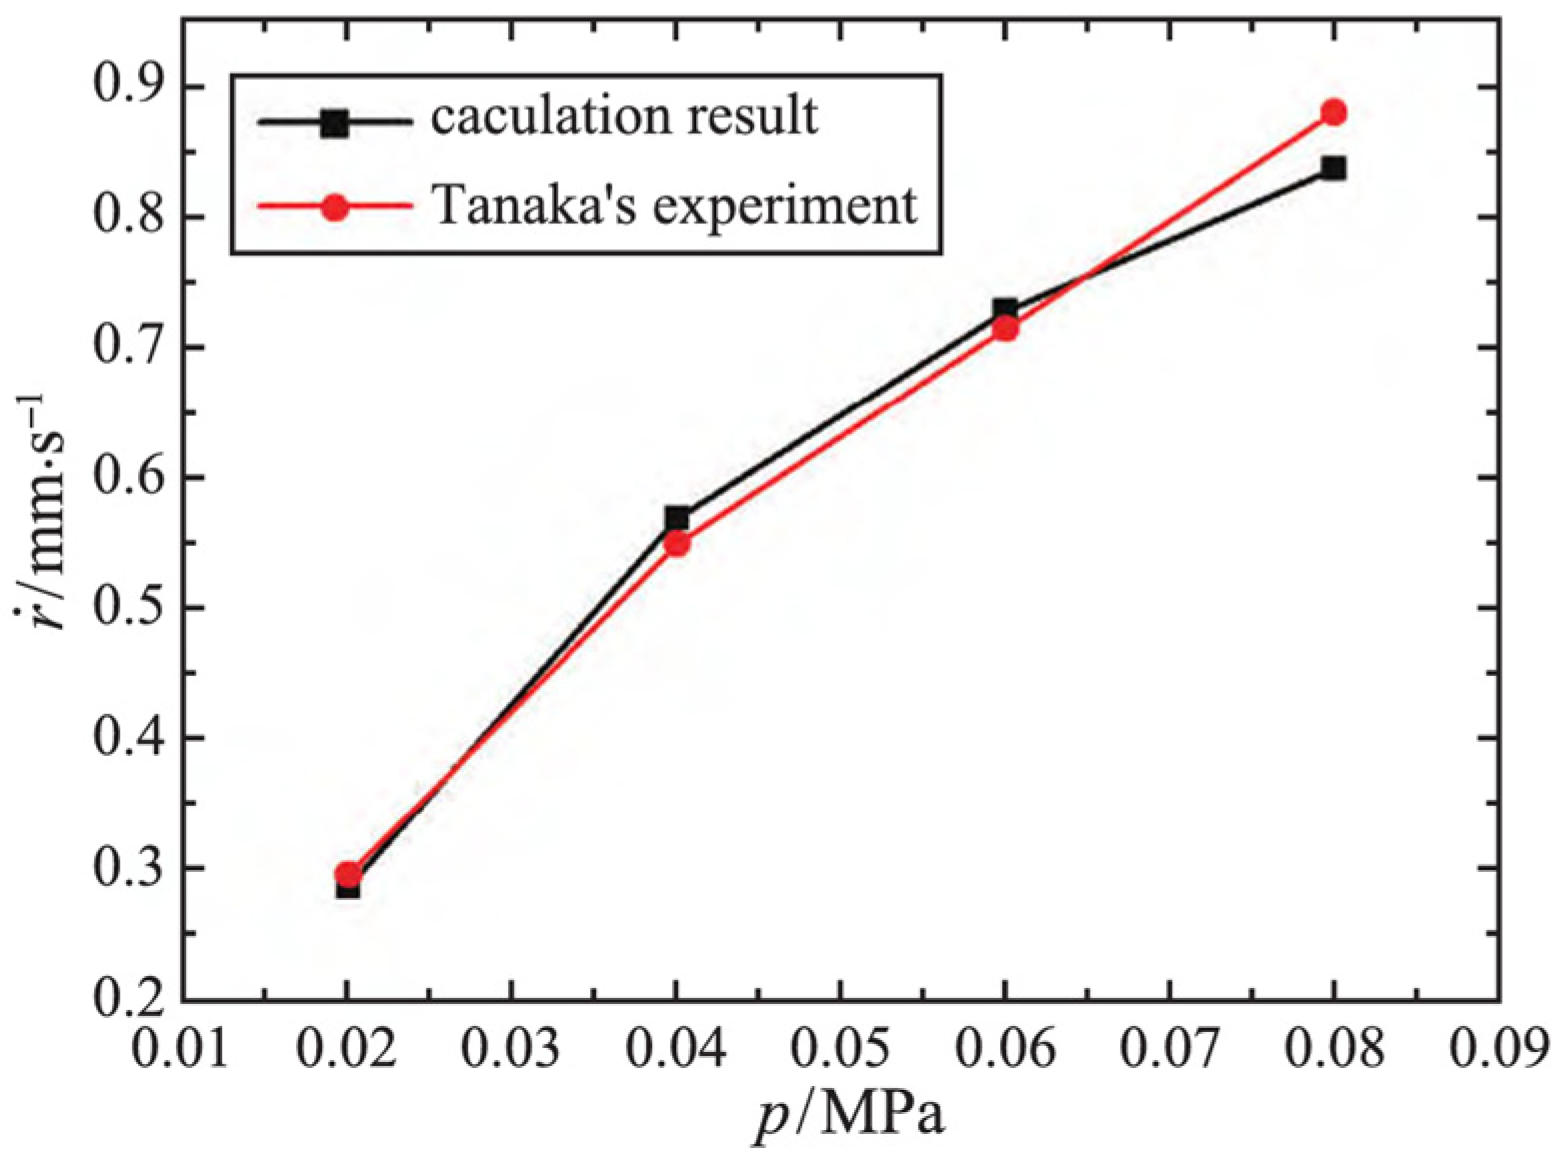
The burning rate of AP/HTPB propellant with an AP volume fraction α of 0.66 and an AP particle size distribution of 200 µm, 50 µm, and 15 µm in the ratio of 4:3:3 (average radius approximately 74 µm) was measured experimentally by Tanaka [
32] under sub-atmospheric pressures. In this work, the burning rates obtained from numerical simulations using a microscale AP/HTPB model with an AP radius of 74 µm are compared with Tanaka’s experimental data. As shown in
Figure 3, the simulation results are in good agreement with the experimental data over the pressure range of 0.02–0.08 MPa, with a maximum relative error of less than 5%, thus validating the reasonableness of the present model.
The burning rate of AP/HTPB propellant was experimentally measured by Kohga [
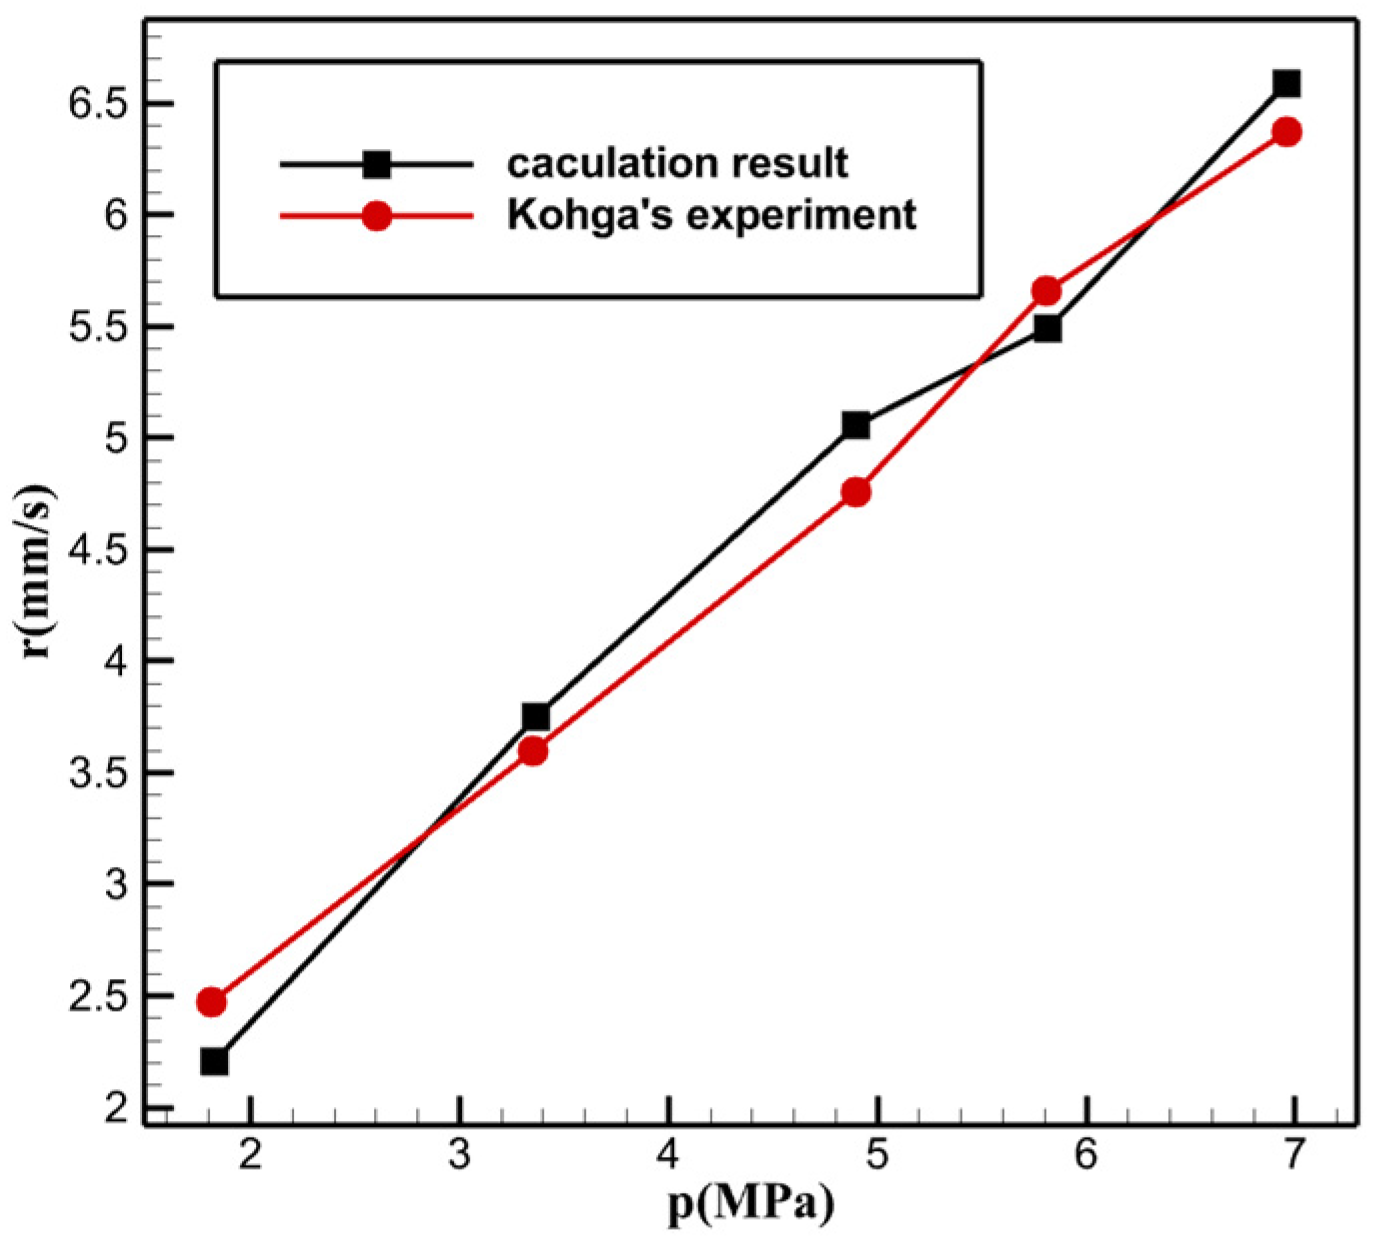
26] under elevated pressures ranging from 1.8 MPa to 7.0 MPa. In this work, the burning rates obtained from numerical simulations using the present model are compared with Kohga’s experimental data. As shown in
Figure 4, the simulation results are in good agreement with the experimental data over the entire pressure range, with the deviations remaining within a reasonable margin. This consistency further validates the reliability and accuracy of the present model under high-pressure conditions.
3.2. Influence of AP Particle Size on Component Diffusion Characteristics
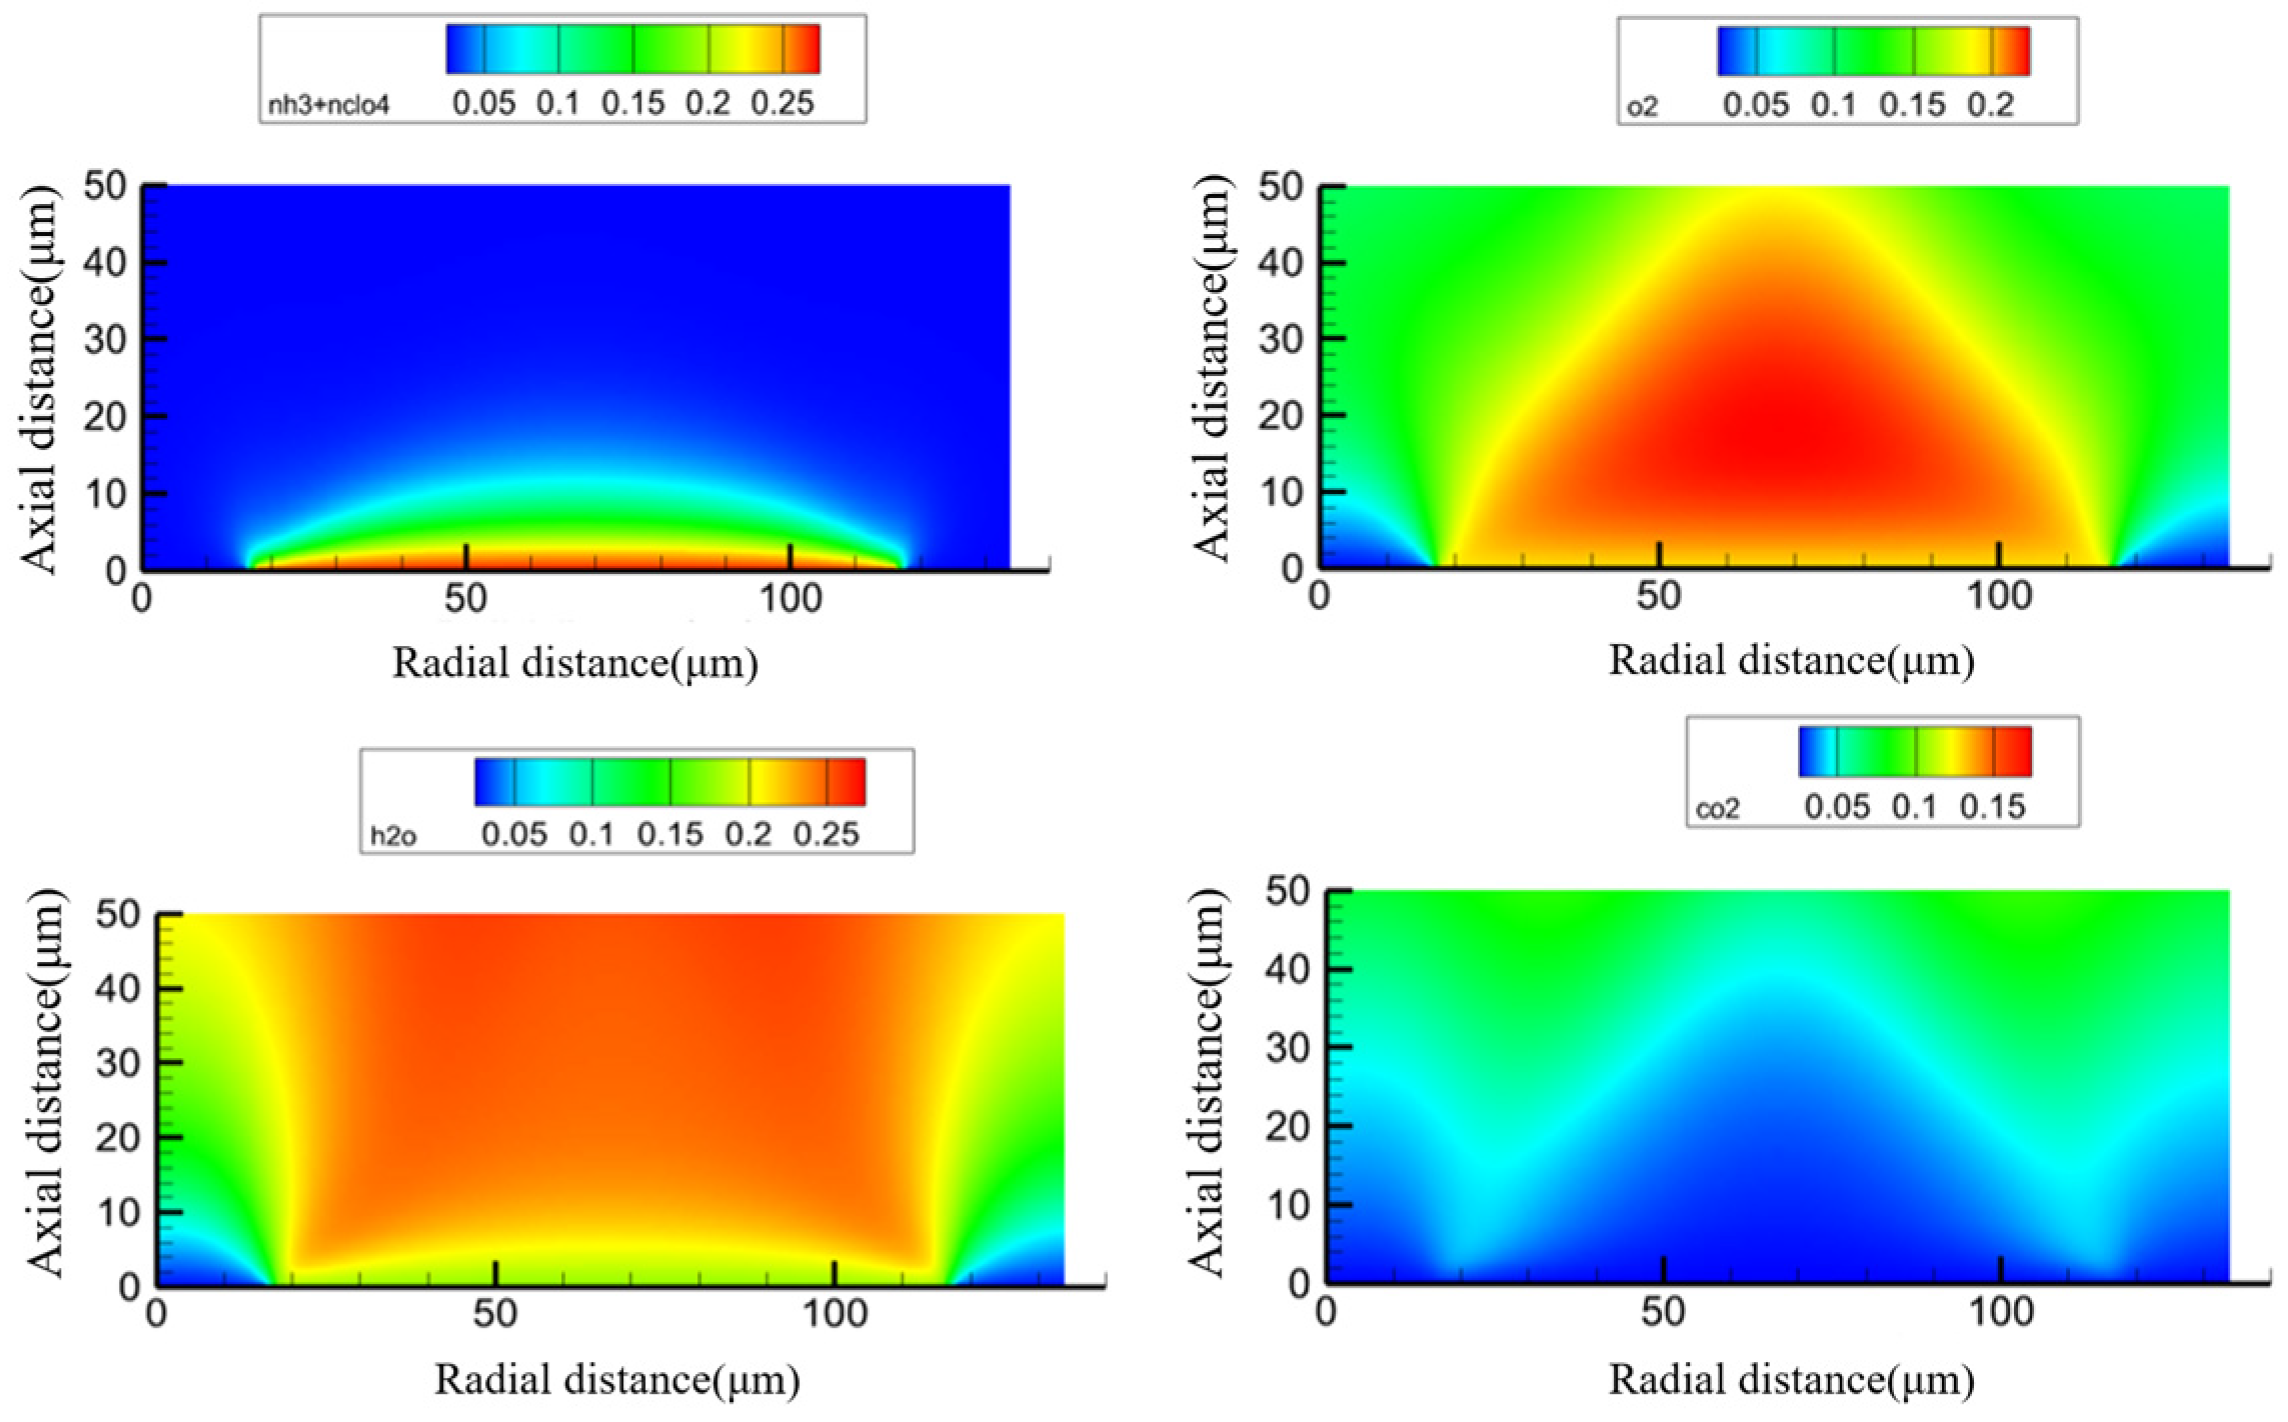
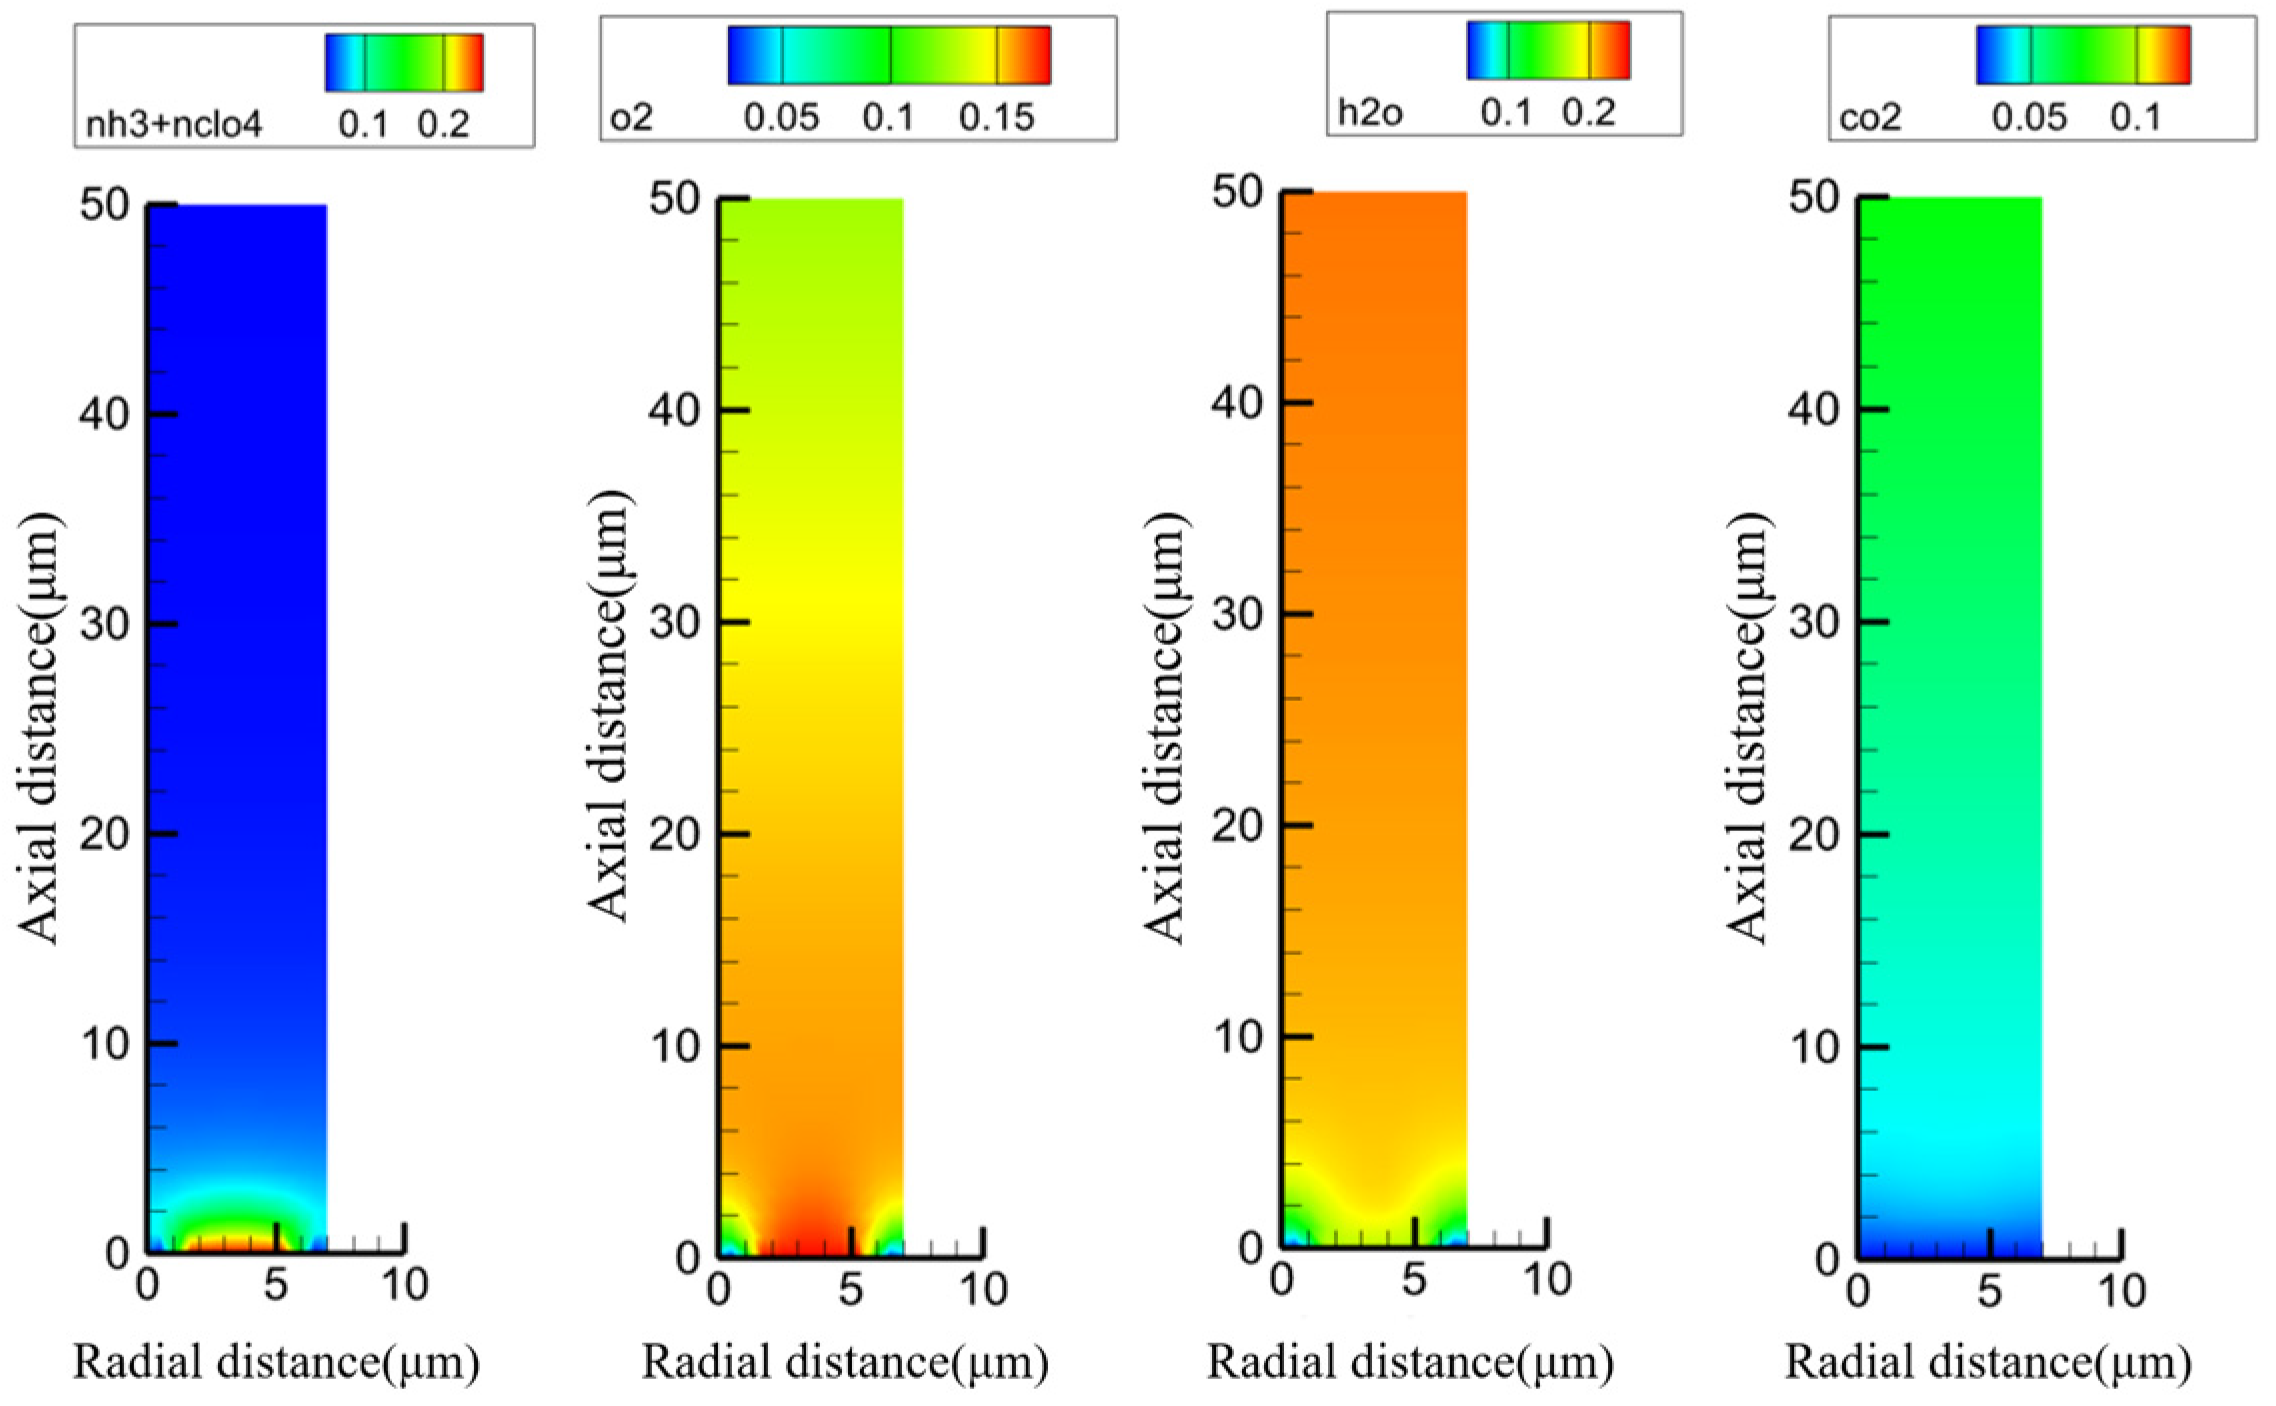
To study the influence of AP particle size on diffusion characteristics, this section analyzes the cases of Case 1 and Case 5 under a combustion chamber pressure of 2 MPa. The distributions of NH
3 + HClO
4, O
2, H
2O, and CO
2 in the near-wall region of 0 µm to 50 µm of the model are obtained, as shown in
Figure 5 and
Figure 6.
According to
Figure 5, under the condition of
dAP = 5 µm, the component NH
3 + HClO
4 shows a trend of diffusing from the AP burning surface as the starting point towards the HTPB burning surface and the far gas phase, forming a flat semi-circle with a thickness of approximately 5 µm. The component O
2 starts diffusing from a region about 2 µm away from the AP burning surface towards the far gas phase. After reaching a region about 4 µm from the wall, it becomes basically uniformly distributed. The distribution of component H
2O is affected by the AP burning surface, showing non-uniform distribution in the near-wall region with a thickness of about 4 µm. Outside this region, it is largely uniformly distributed. The component CO
2 is relatively uniformly distributed from the AP burning surface starting point up to the 50 µm region.
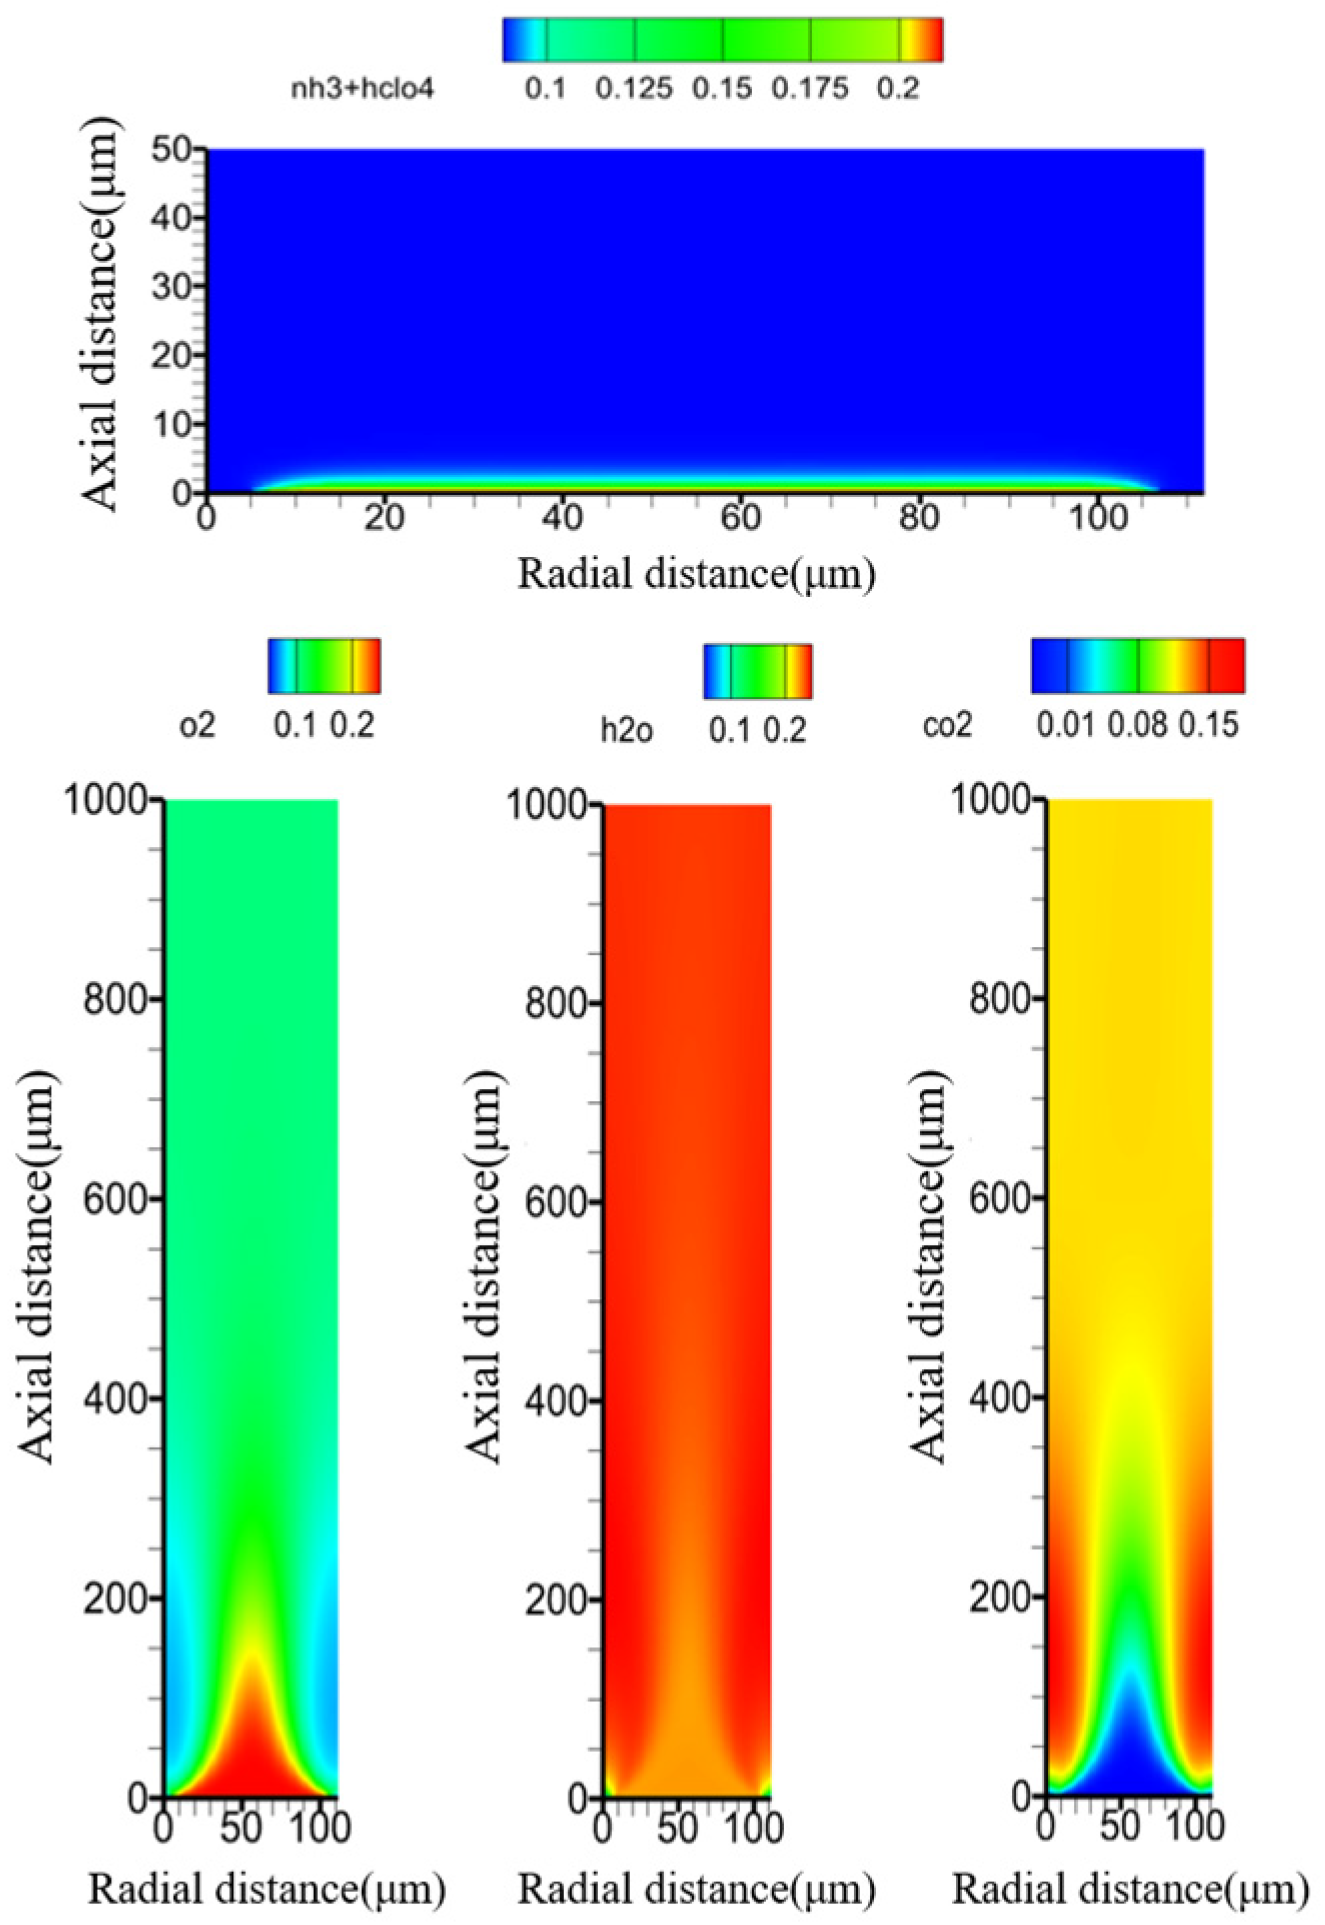
According to
Figure 6, under the condition of
dAP = 100 µm, the component NH
3 + HClO
4 diffuses from the AP burning surface as the starting point towards the HTPB burning surface and the far gas phase, forming a semi-elliptical region with an eccentricity close to 1 in the gas-phase combustion region, with a thickness of about 15 µm. The component O
2 forms a triangular region with a thickness of about 50 µm above the AP burning surface, diffusing from its center towards both sides. Affected by the AP burning surface, the component H
2O shows an uneven distribution from the AP burning surface starting point up to the 50 µm region, with more distribution in the middle and less on both sides. The component CO
2 shows a “W”-shaped distribution from the AP burning surface starting point up to the 50 µm region.
Comparing and analyzing the two results, under the condition of dAP = 5 µm, the component distribution in the near-wall region is generally relatively uniform, indicating that when dAP is 5 µm, it is very close to a premixed state. Under the condition of dAP = 100 µm, the thickness of the gas-phase combustion region for component NH3 + HClO4 increases, while the mass proportion diffusing to the vicinity of the HTPB burning surface decreases. The non-uniform distribution characteristics of components O2, H2O, and CO2 in the near-wall region are significantly stronger. This indicates that when the AP particle size is 100 µm, the components exhibit stronger diffusion characteristics.
3.3. Influence of AP Mass Fraction on Component Diffusion Characteristics
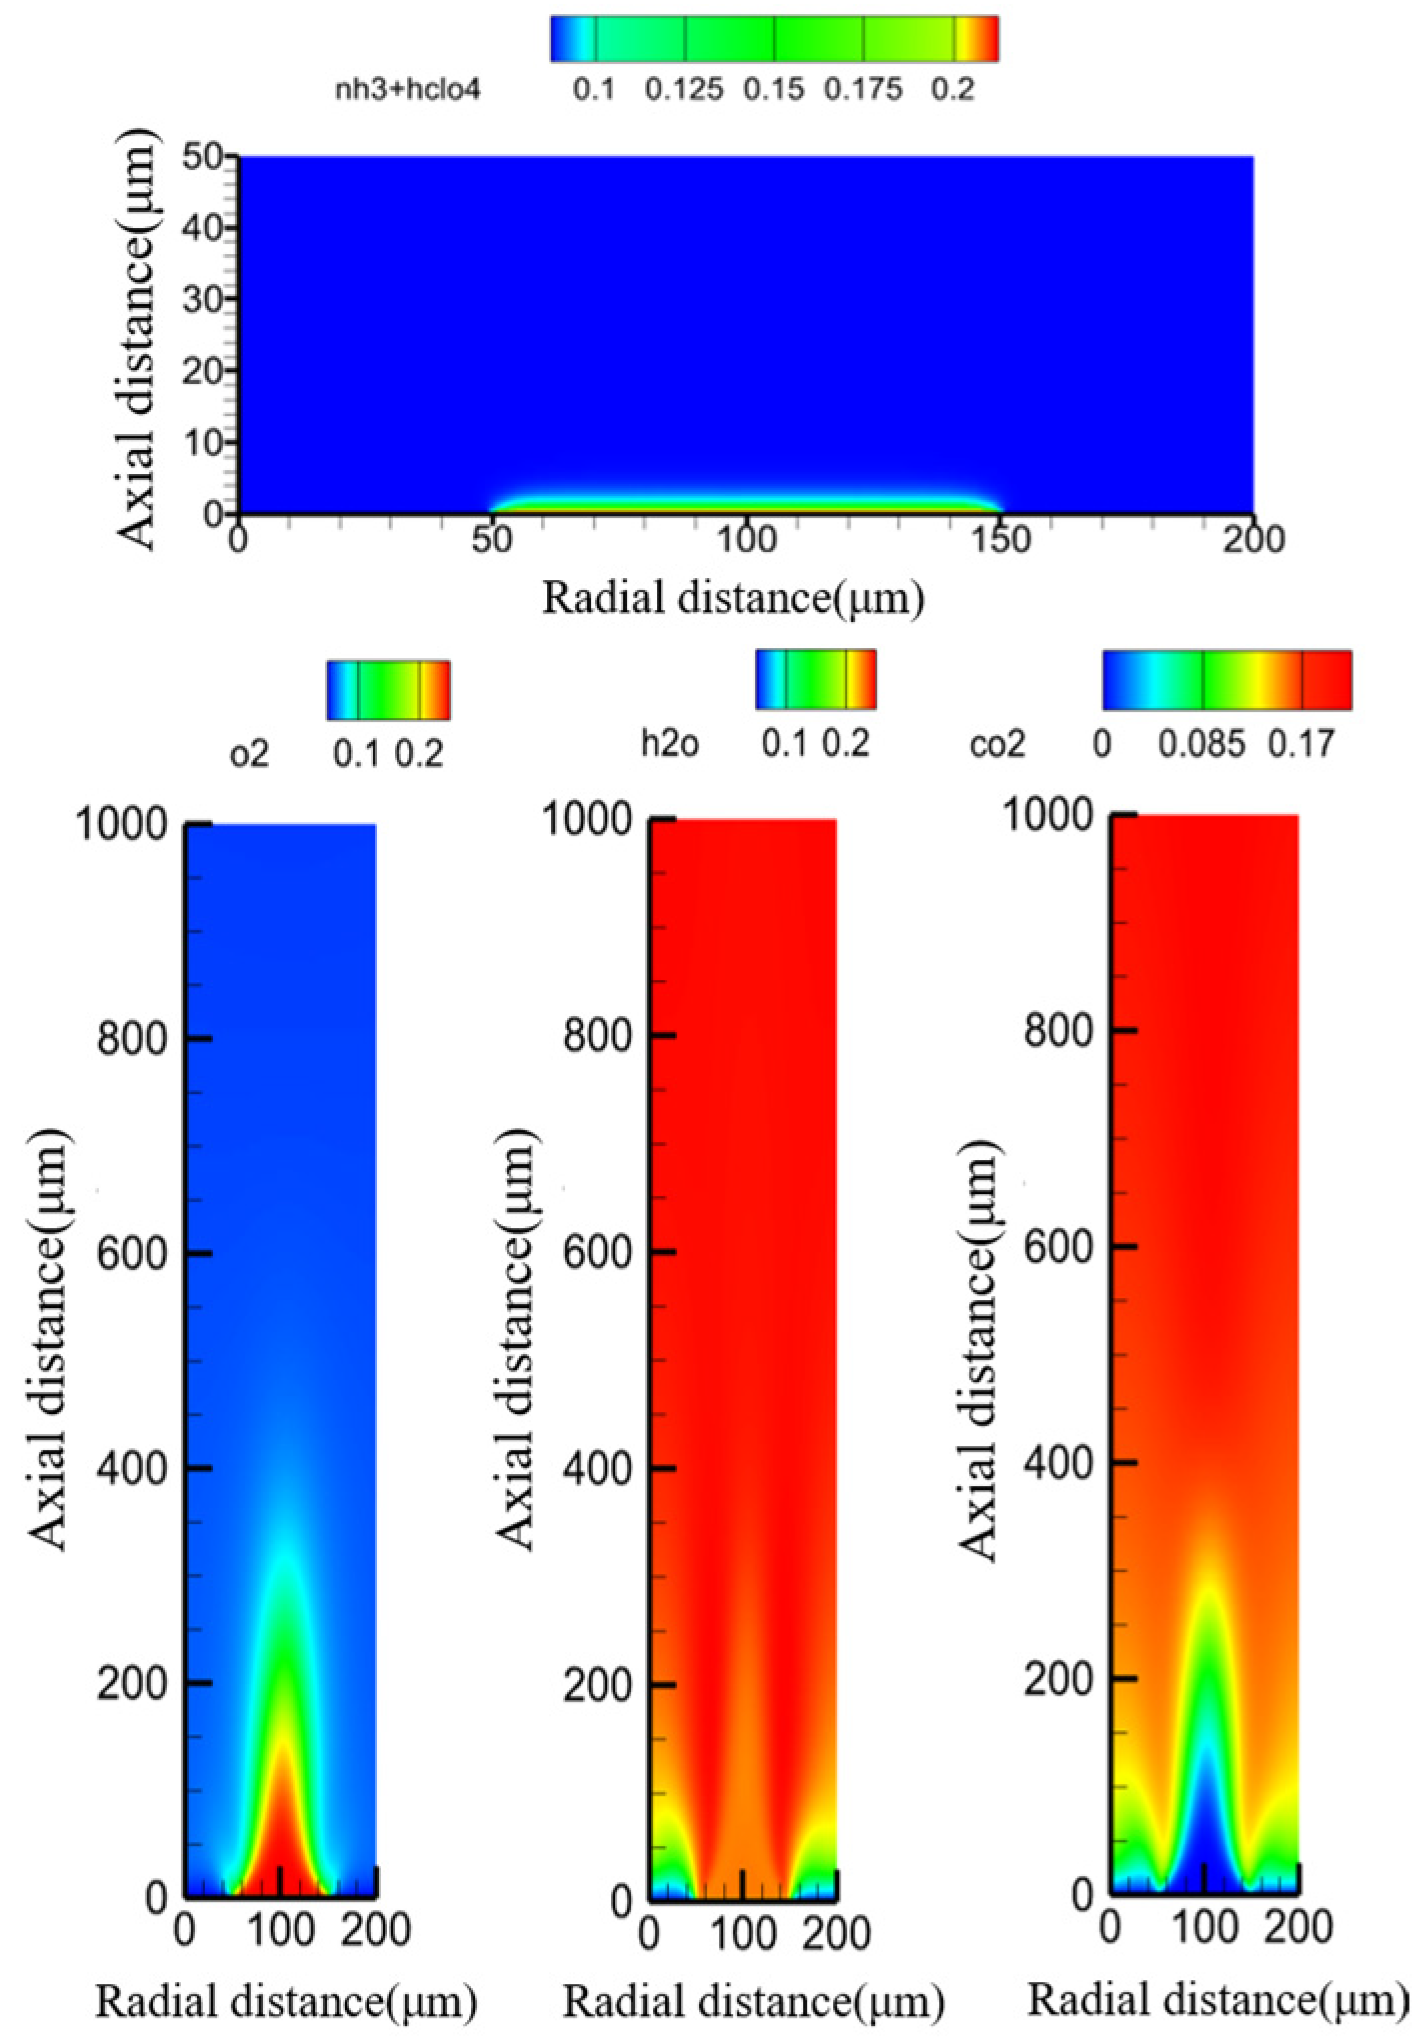
To study the influence of AP mass fraction on component diffusion characteristics, this section analyzes Cases 6 and 7. The mass fraction distribution contours of NH
3 + HClO
4 in the 0 µm to 50 µm near-wall region of the model, and the mass fraction distribution contours of the three components O
2, H
2O, and CO
2 in the 0 µm to 1000 µm calculation region are obtained, as shown in
Figure 7 and
Figure 8.
Analyzing
Figure 7, under the condition of AP mass fraction α = 70%, NH
3 + HClO
4 diffuses from the AP burning surface as the starting point towards the HTPB burning surface and the far gas phase, forming a trapezoidal region with a thickness of about 2 µm. O
2 is mainly distributed in the “bullet-shaped” region formed above the AP burning surface, diffusing from this region towards both sides and the far gas phase. The distribution of H
2O can be divided into three regions: first, a low distribution region with mass fraction less than 0.1, i.e., the region above the HTPB burning surface with a thickness of about 50 µm; second, a medium distribution region with mass fraction between 0.1 and 0.25, i.e., the region around 200 µm above the AP burning surface showing an “inverted V” shape and the region about 50–200 µm above the HTPB burning surface; third, a high distribution region with mass fraction greater than 0.25, i.e., from the junction of the AP and HTPB burning surfaces to the far gas phase. CO
2 is less distributed near the burning surface. As the distance from the near-burning surface increases, the distribution of CO
2 also increases, reaching its maximum at about 400 µm above the AP burning surface, while reaching its maximum at about 200 µm above the HTPB burning surface.
Analyzing
Figure 8, we can observe that when the mass fraction of AP is 95%, NH
3 + HClO
4 diffuses outward from the AP burning surface, forming a trapezoidal region with a thickness of about 2 µm. Compared to the O
2 component mass fraction distribution generated during the combustion process of the propellant with AP mass fraction 70%, while there is also a large amount of O
2 remaining, the region with higher mass fraction (the “bullet-shaped” region) is compressed to be narrower and sharper. The low distribution region for H
2O with mass fraction less than 0.1 almost disappears near the HTPB burning surface; the maximum value of the CO
2 mass fraction becomes smaller, the distance to reach the maximum value above the AP burning surface exceeds 400 µm, while conversely, the distance to reach the maximum value above the HTPB surface decreases to 100 µm.
Comparing and analyzing the two results, the diffusion characteristics of NH3 + HClO4 are very insensitive to changes in AP mass fraction and are almost unaffected; an increase in AP mass fraction leads to a large amount of oxidizer remaining, an increase in the mass fraction of O2, and increases the opportunity for O2 to react with fuel. The increased reaction between O2 and fuel in turn causes changes in the distribution of the products H2O and CO2. CO2 above the AP burning surface is further away from the AP burning surface, while correspondingly, H2O and CO2 above the HTPB burning surface are closer to the HTPB burning surface.
4. Influence of AP Characteristics on Flame Position and Gas-Phase Temperature
The dynamic evolution of temperature contours is fundamental to characterizing the gas-phase temperature distribution. By analyzing the morphological evolution and spatial distribution of these contours, alongside the fluctuations in peak temperatures and their stand-off distances from the burning surface, critical insights into the combustion process can be gained. In terms of flame morphology, the study focuses on the decomposition, primary diffusion, and final diffusion flames. The reaction rates at each stage are precisely quantified, and the total heat release Q(R), including its spatial distribution, is comprehensively evaluated. Specifically, the AP decomposition flame is associated with reaction R1, the primary diffusion flame with R2, and the final diffusion flame with R3. While these three flame types exhibit distinct characteristics, they are intrinsically coupled and interdependent.
4.1. Influence of AP Particle Size on Flame Position and Gas-Phase Temperature
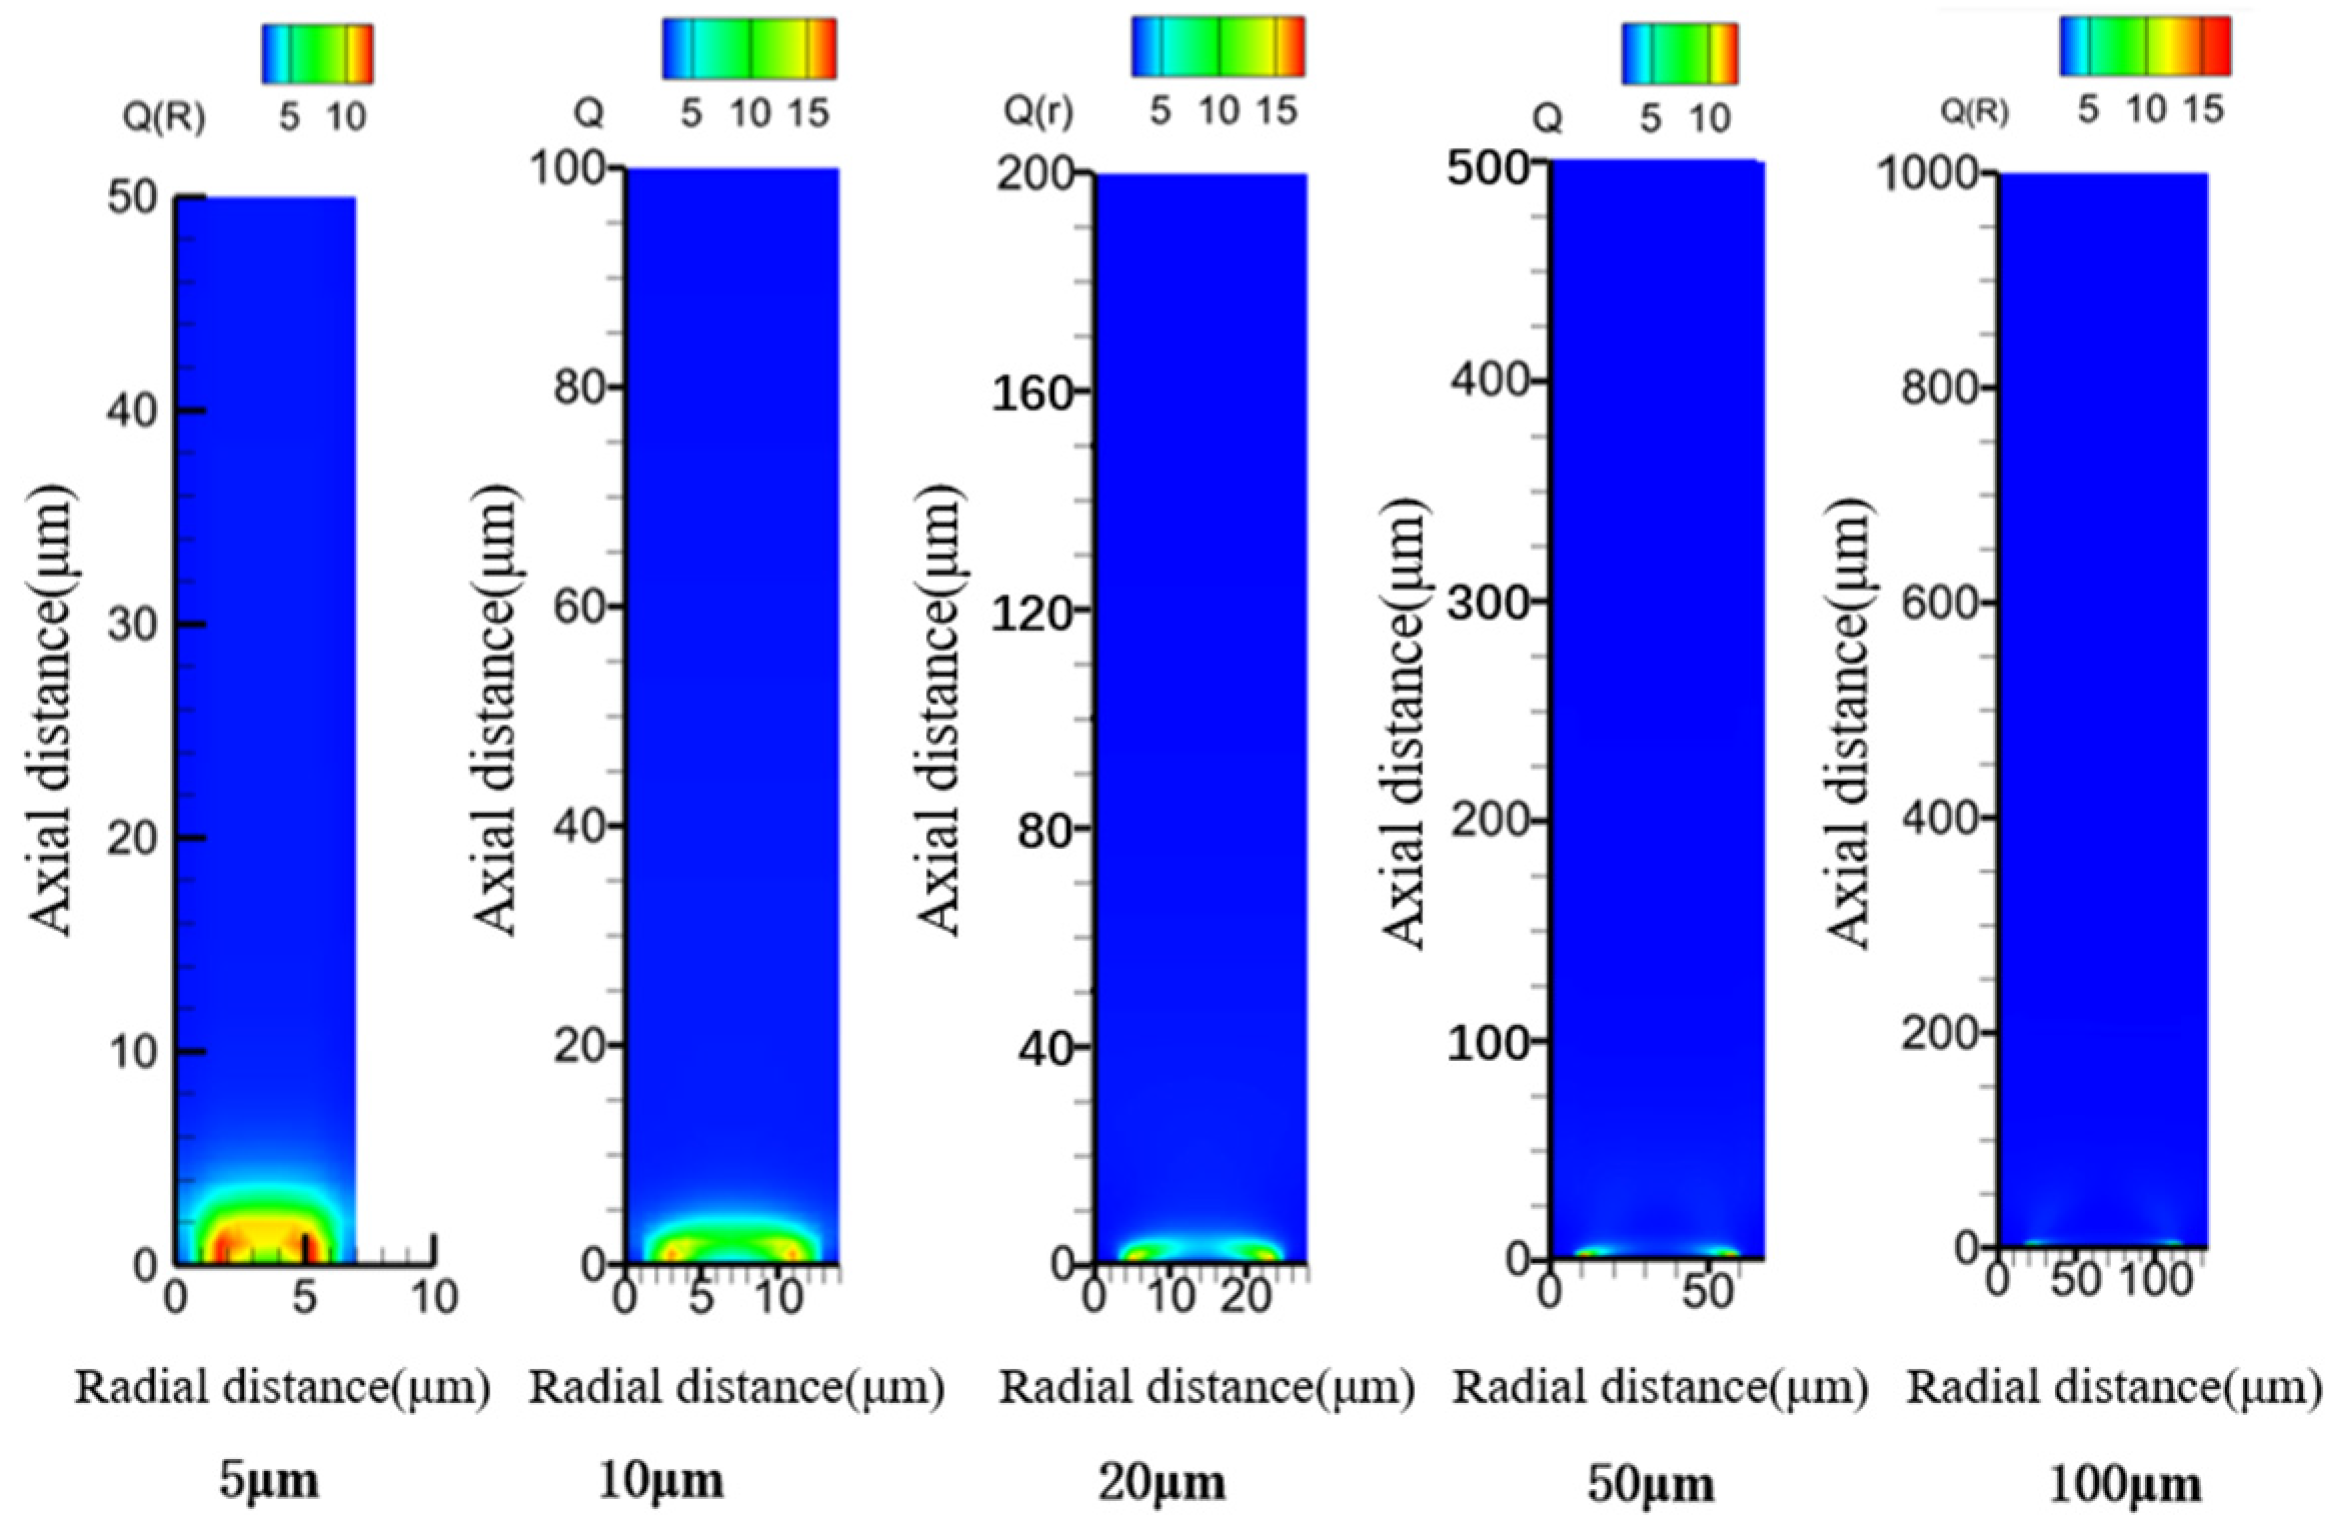
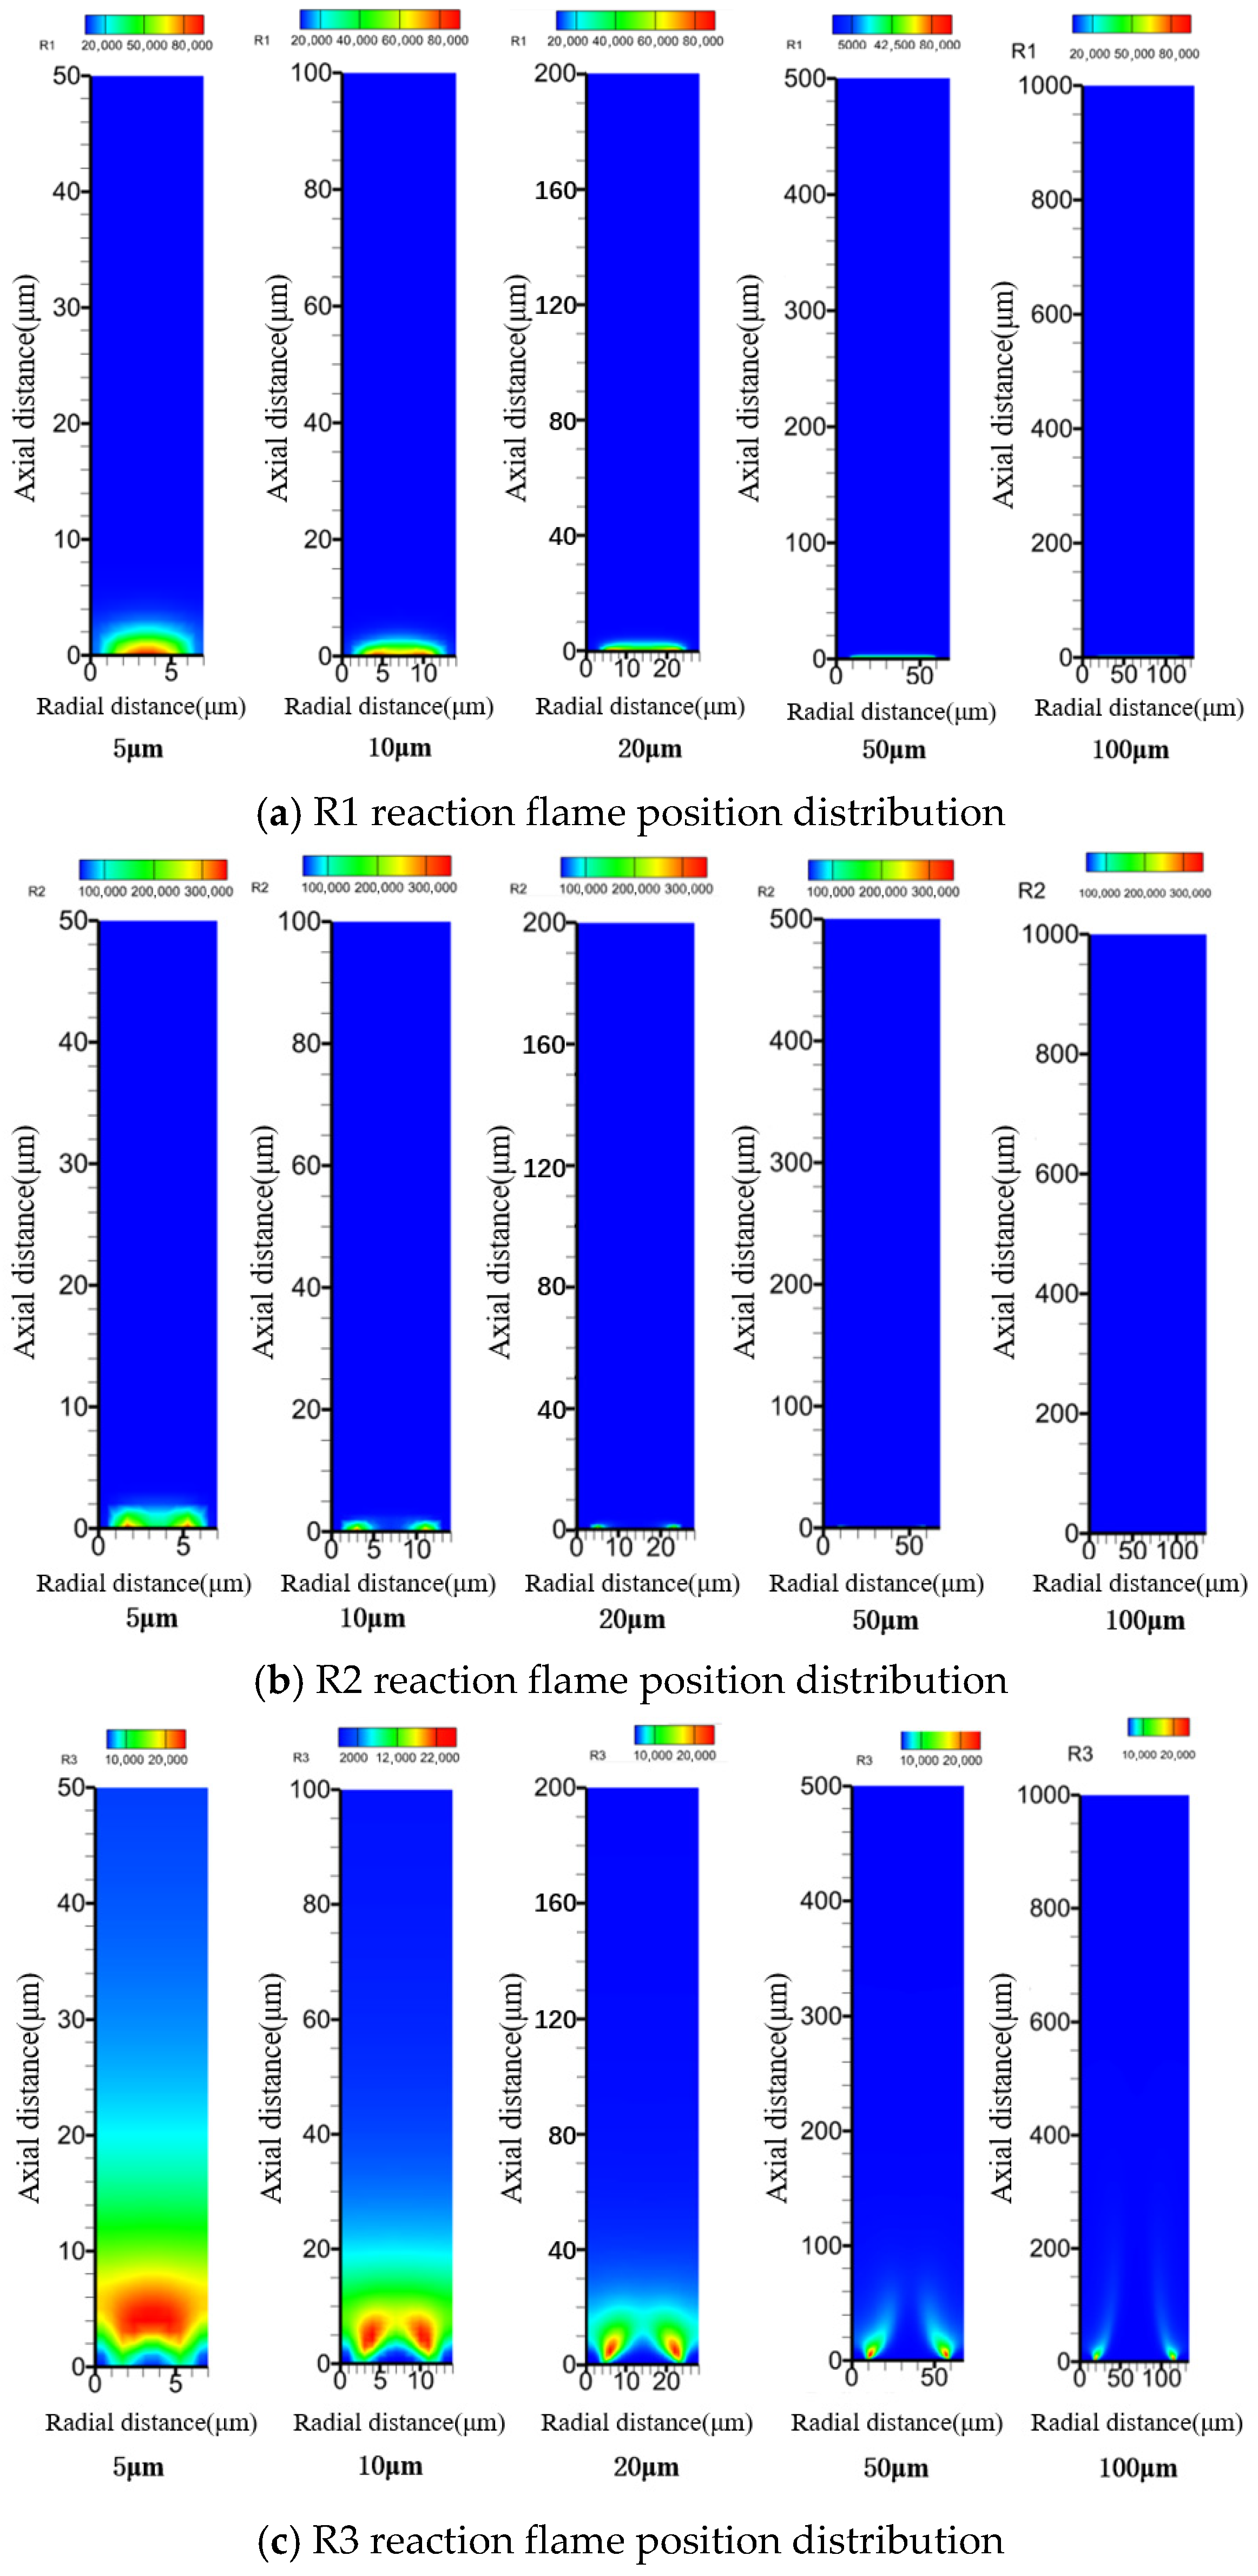
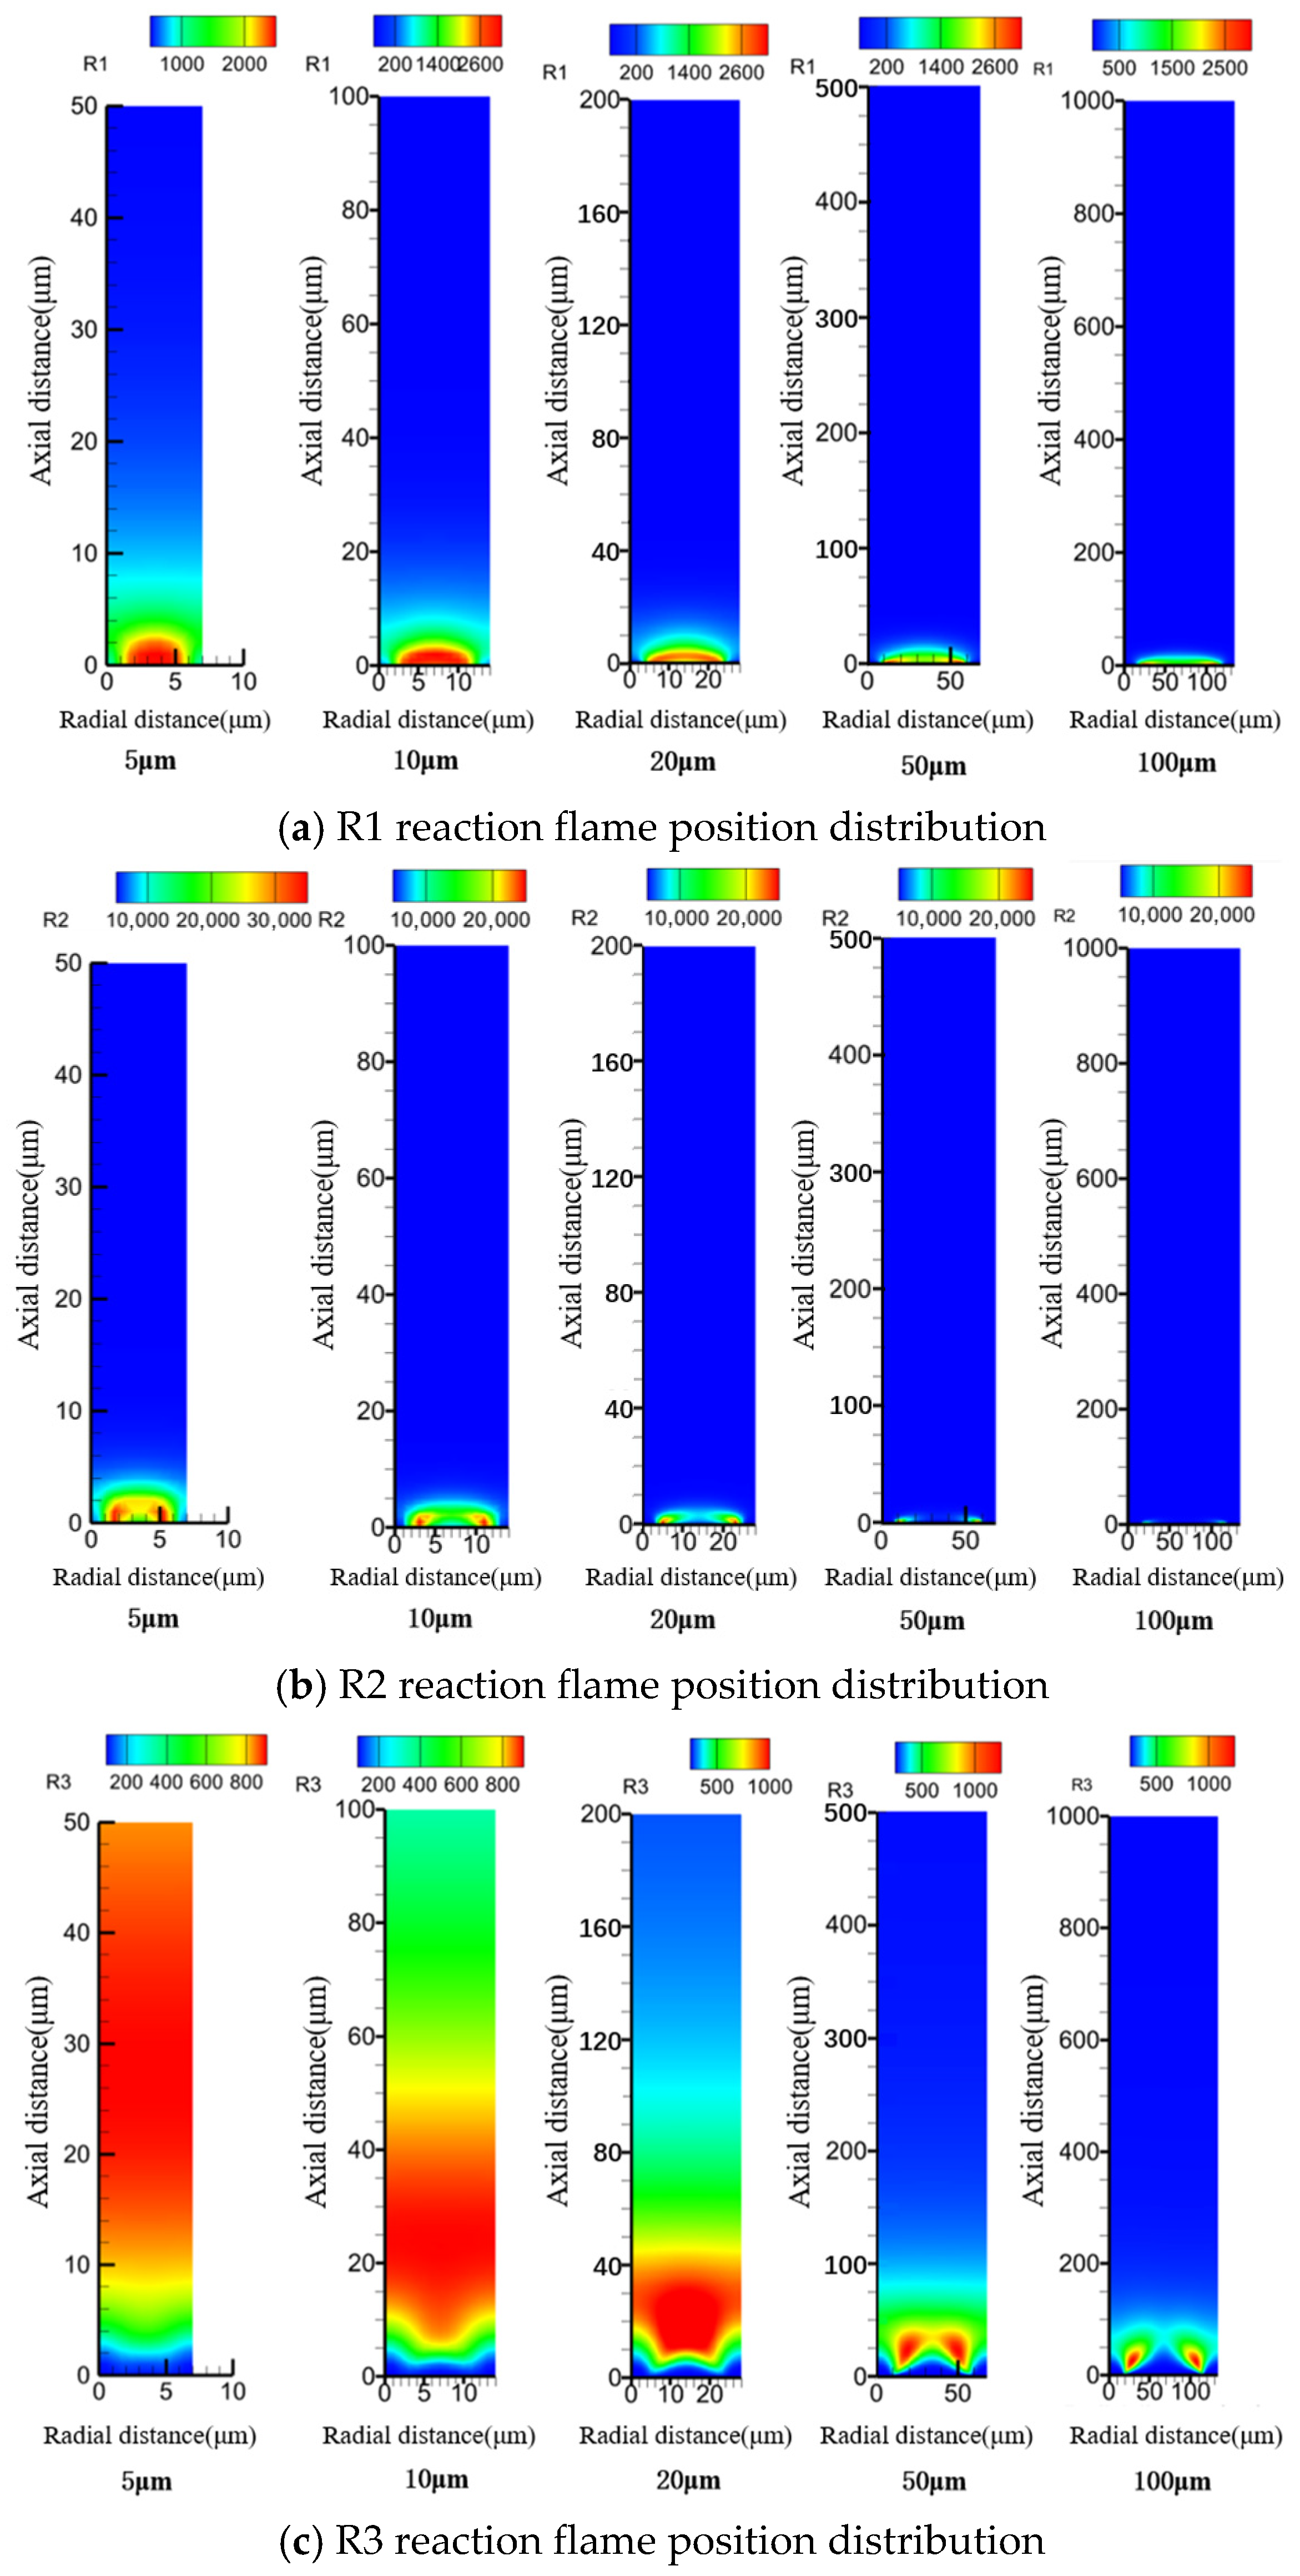
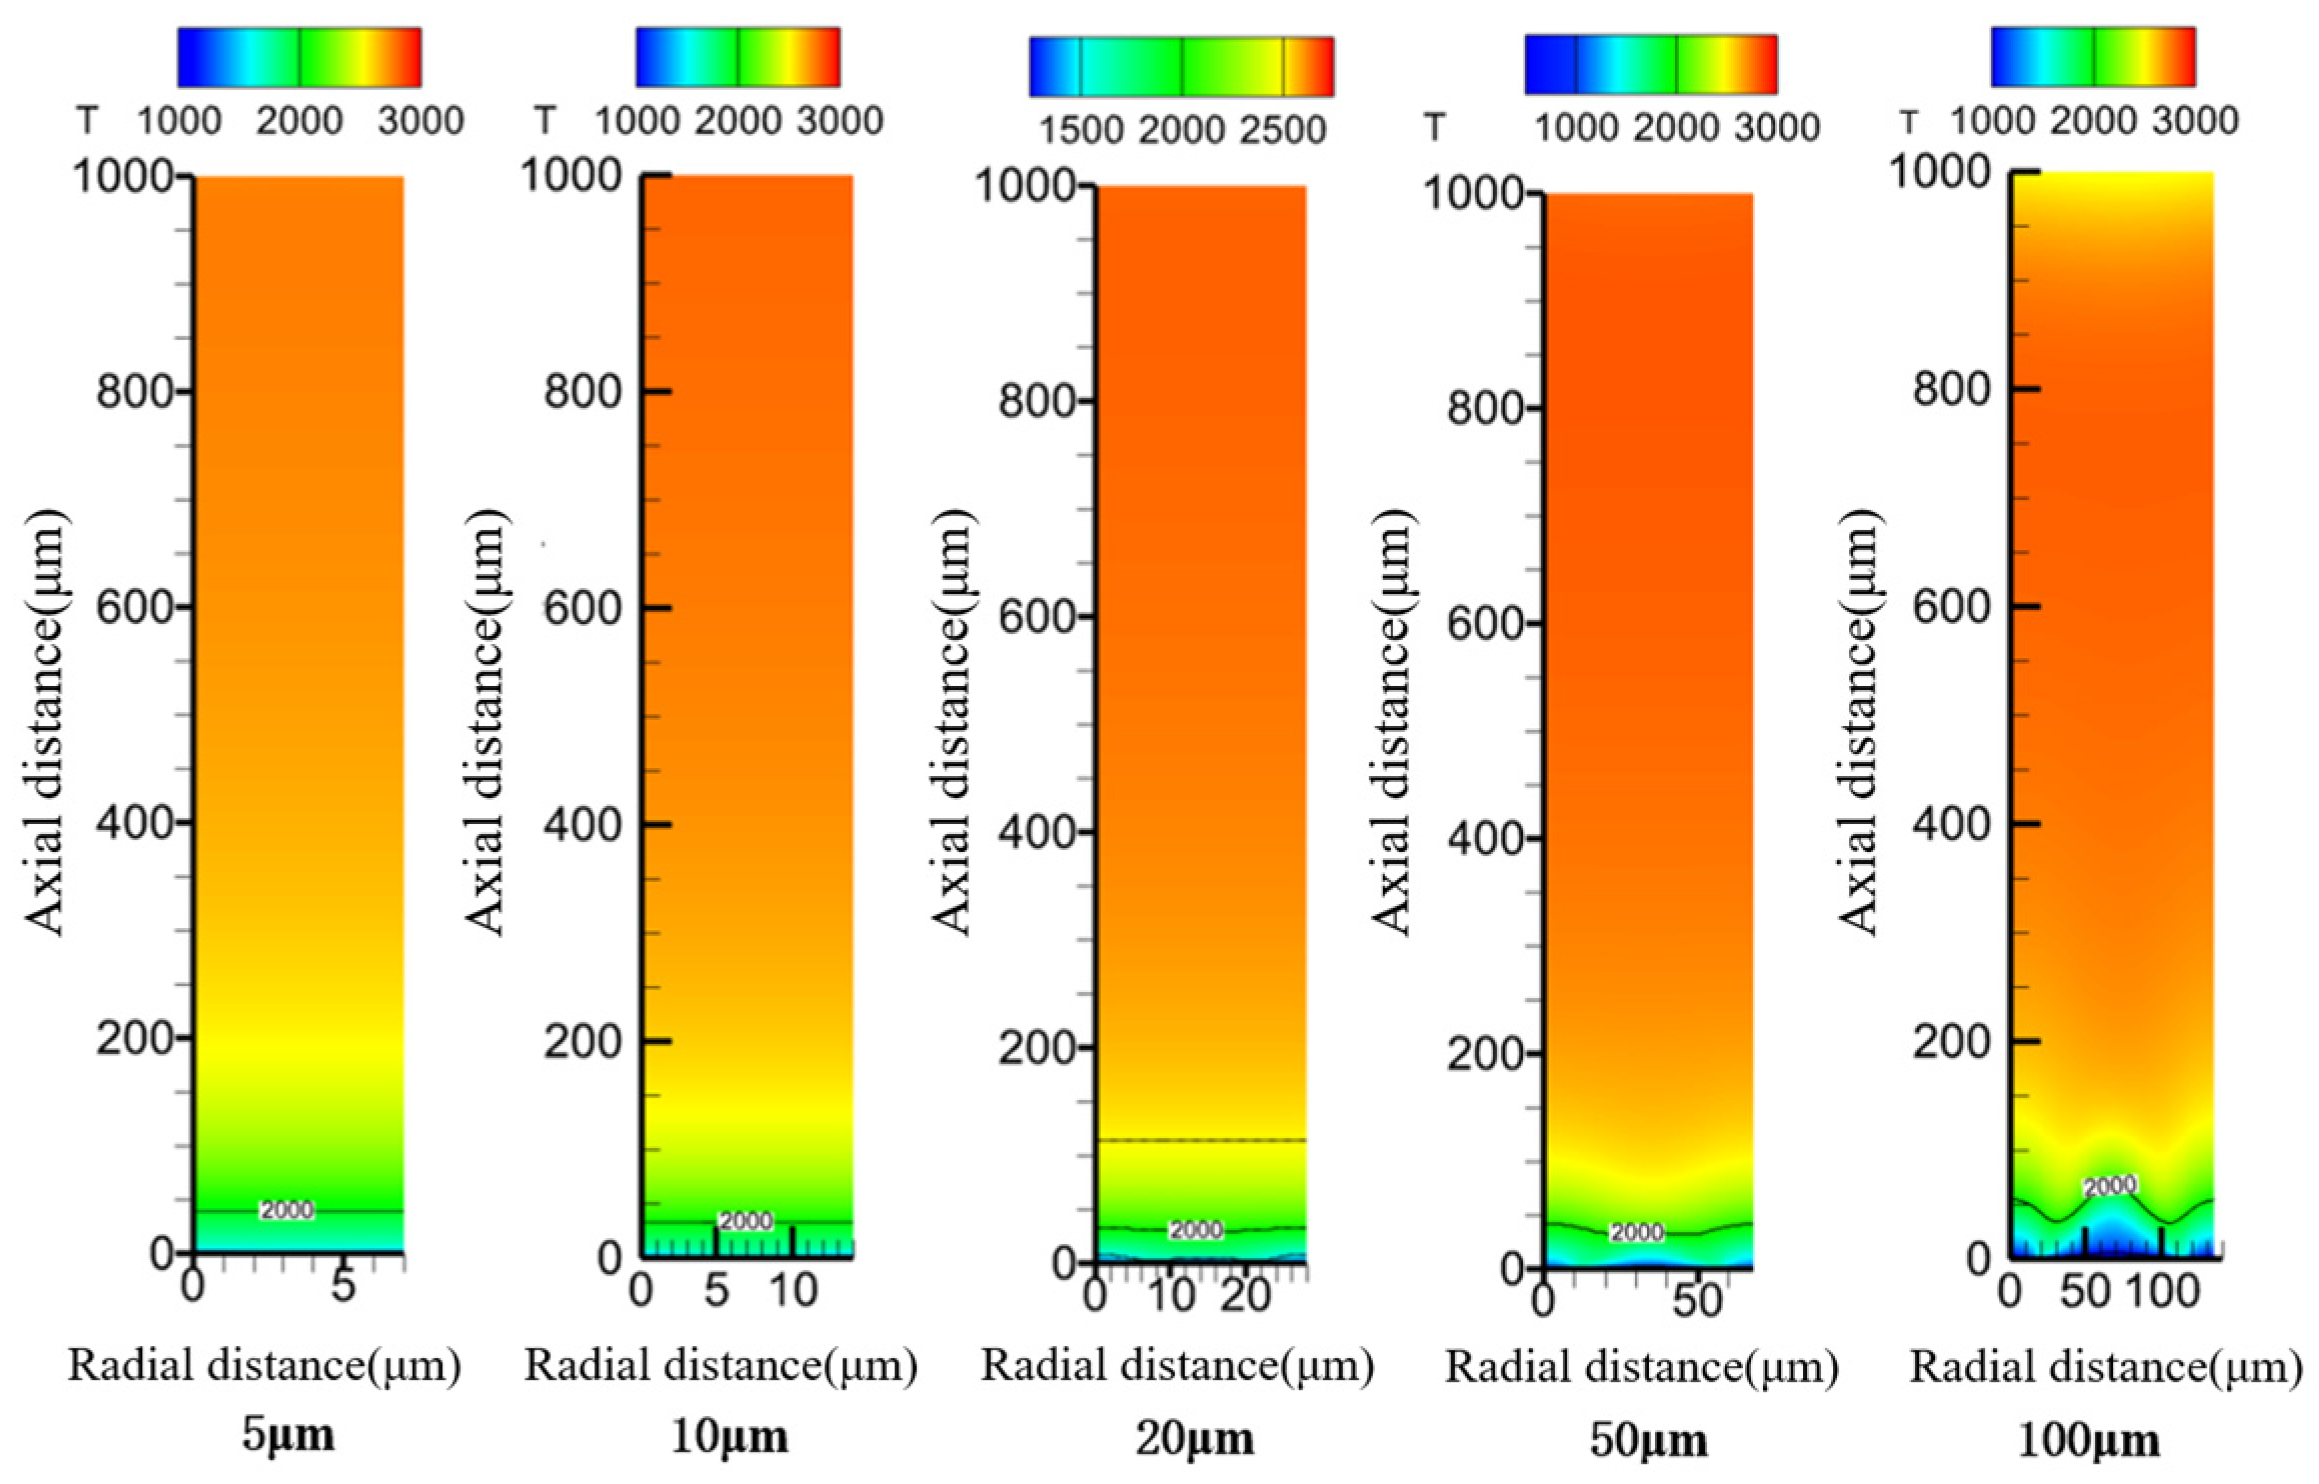
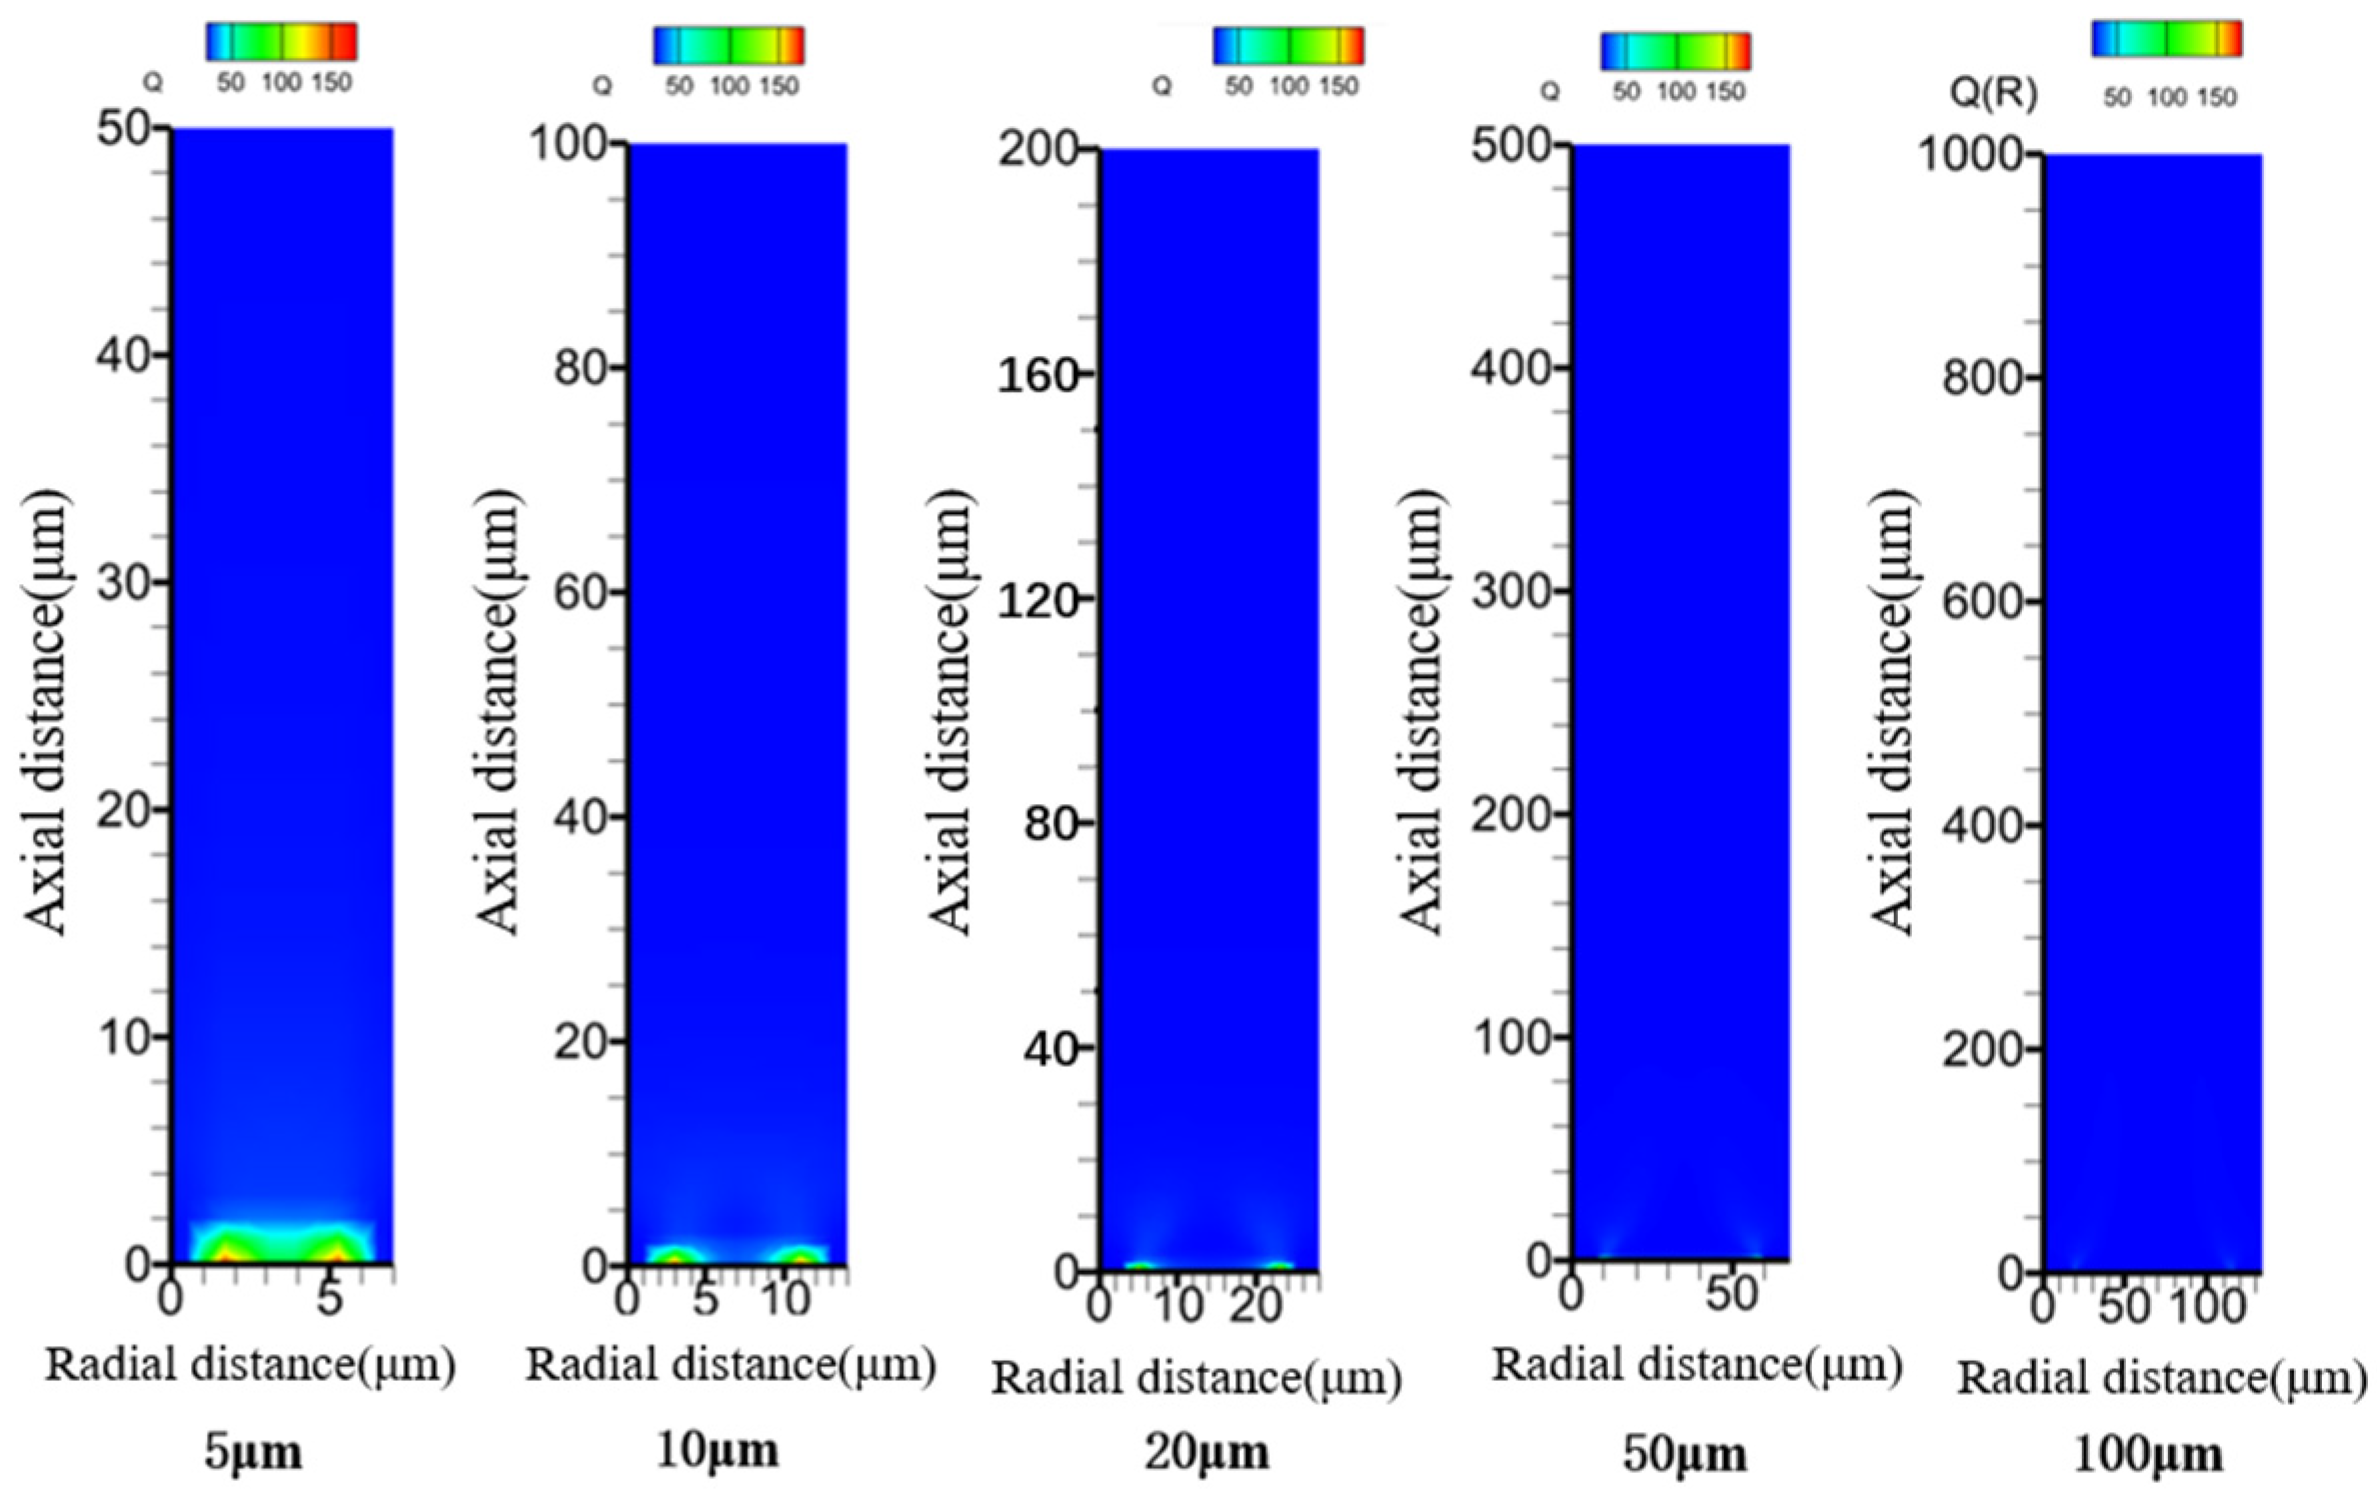
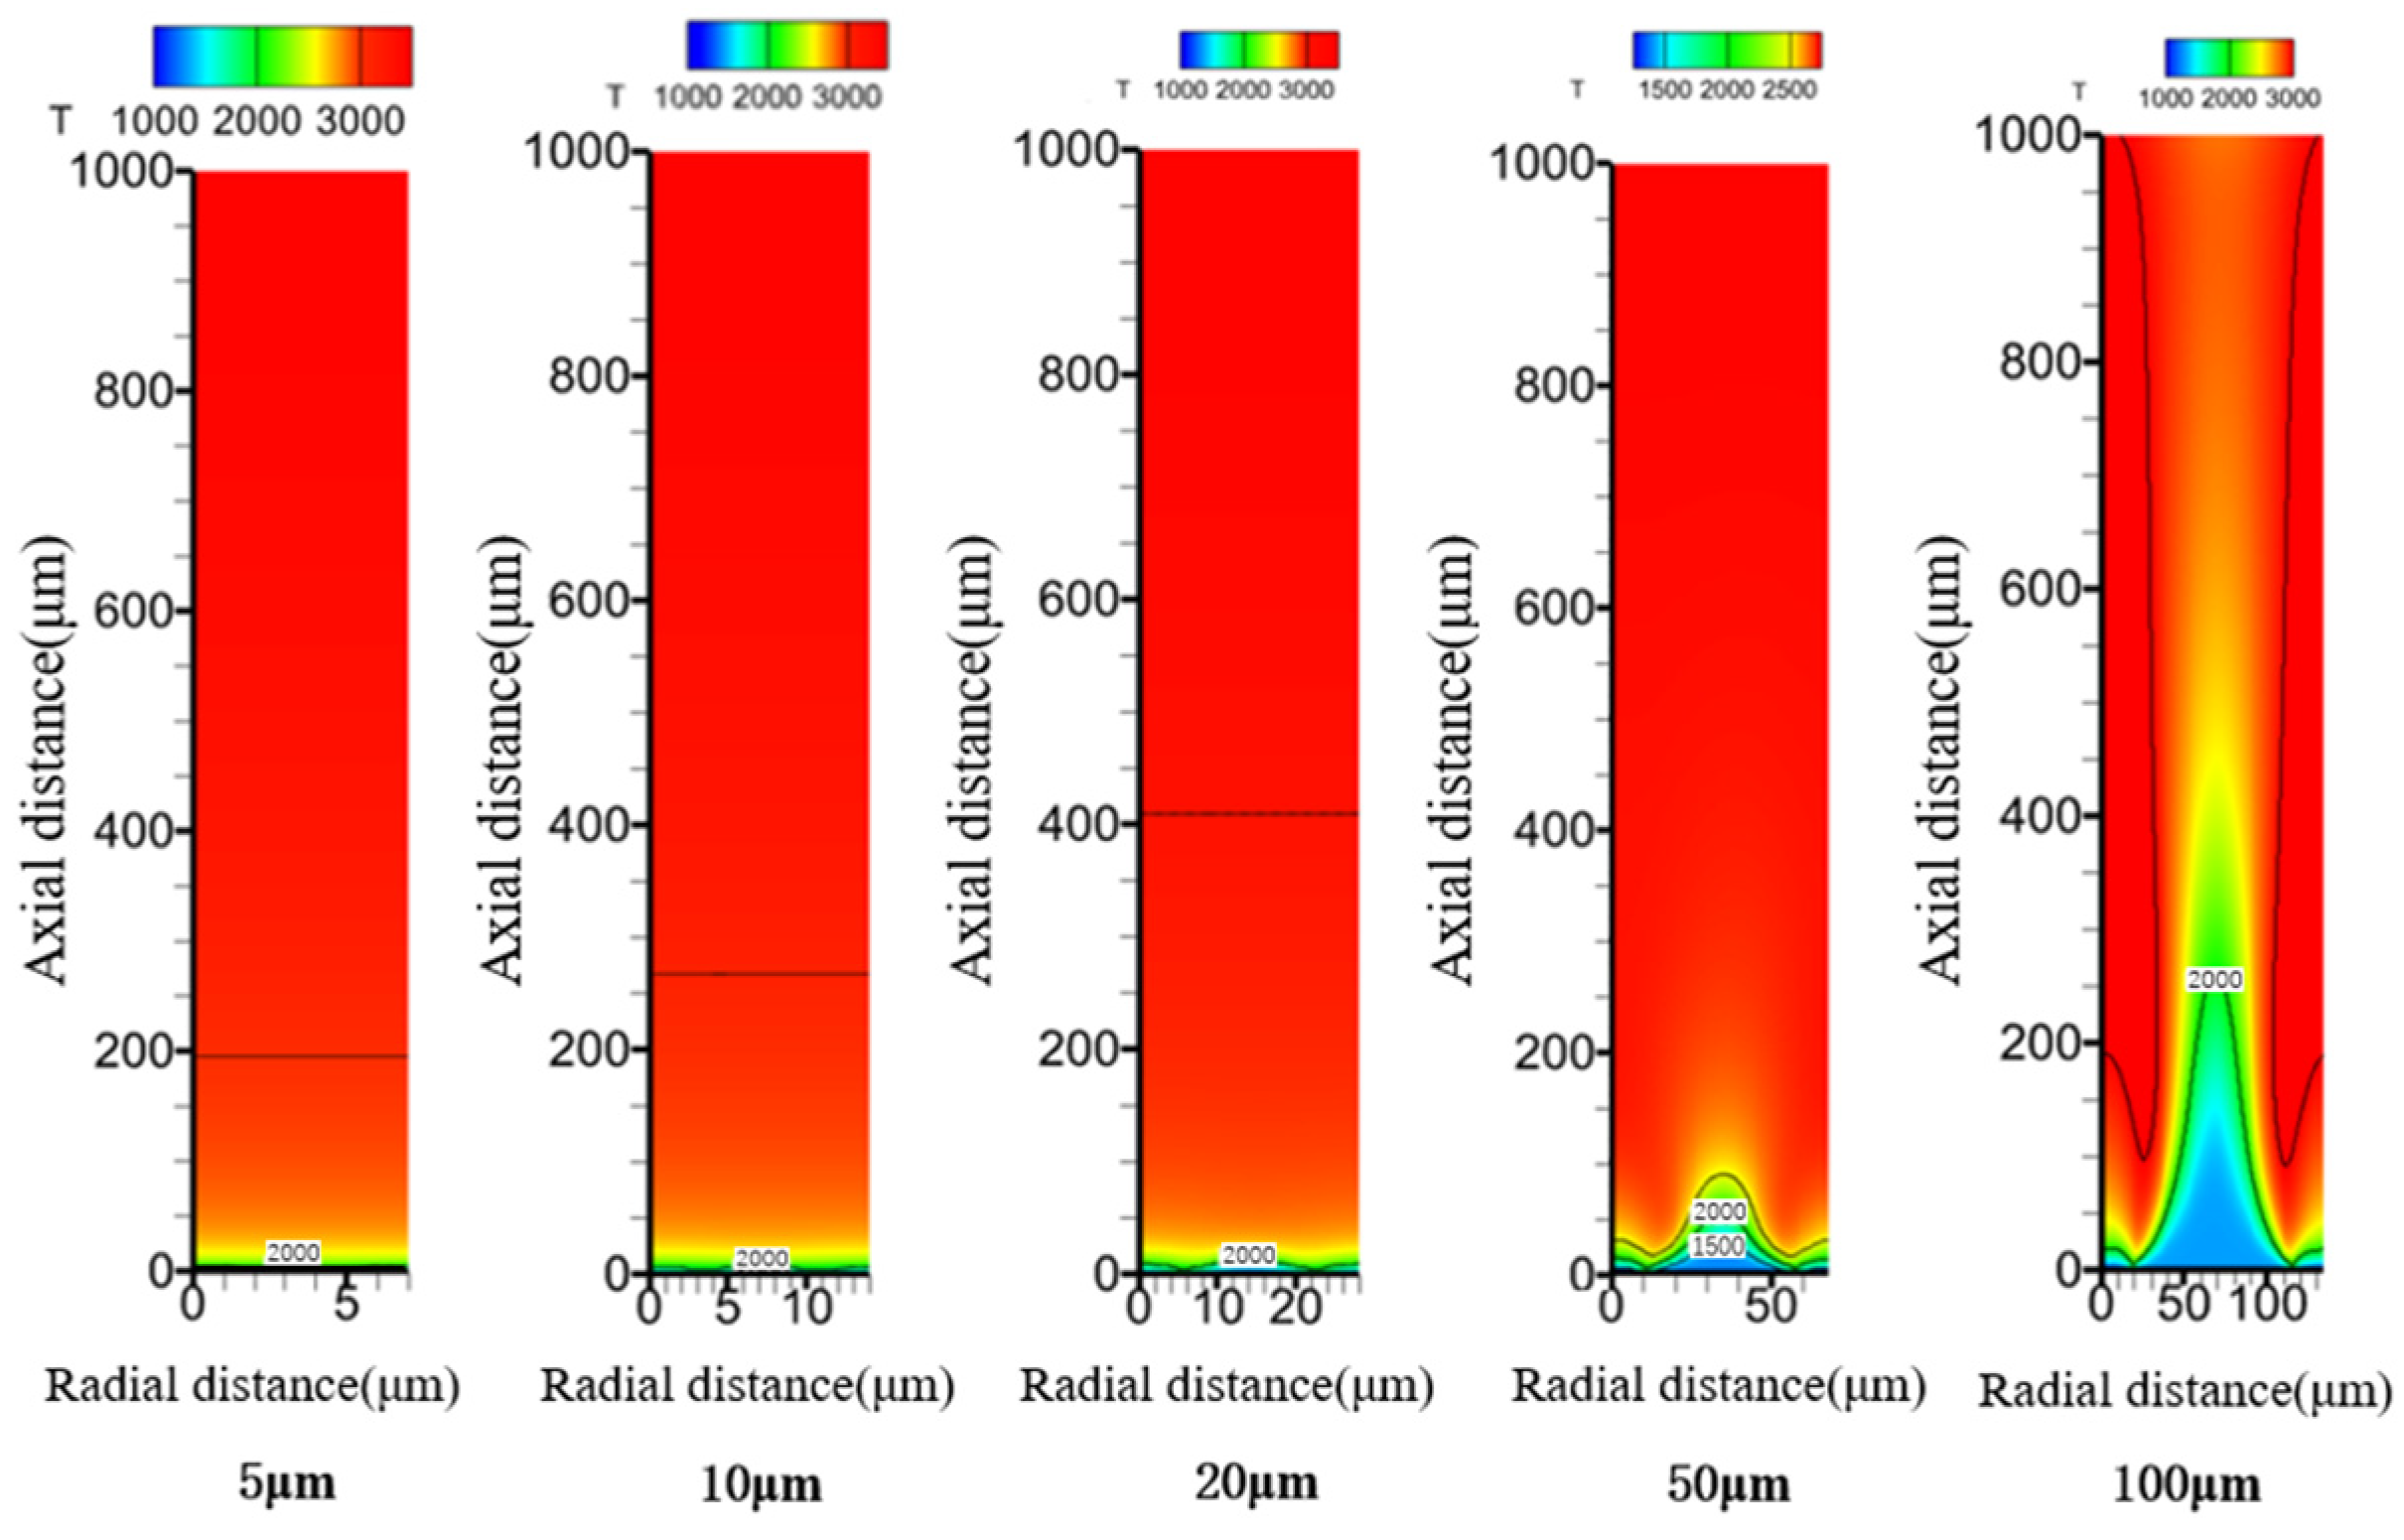
To explore the influence of AP particle size changes on flame position and gas-phase temperature under low and high pressure, this section analyzes Cases 1–5. The three-flame position distribution, combustion surface chemical reaction heat release position distribution, and combustion surface temperature distribution under combustion pressures of 2 MPa and 10 MPa for different AP particle sizes are obtained, as shown in
Figure 7,
Figure 8,
Figure 9,
Figure 10,
Figure 11 and
Figure 12.
As shown in
Figure 9, the primary reaction zone of R1 is located immediately above the AP burning surface, with a thickness of approximately 10–15 µm that remains largely insensitive to variations in AP particle size. The maximum reaction rate, however, decreases with increasing AP particle size, accompanied by a corresponding reduction in the R1 reaction intensity above the HTPB surface. For R2, the main reaction zone undergoes a progressive morphological transition: at small AP particle sizes, it appears as a continuous band spanning the gas phase above both AP and HTPB surfaces; as the particle size increases, it gradually concentrates into two discrete regions near the AP/HTPB interface junctions, with an accompanying decrease in reaction rate. In contrast, the R3 reaction zone is situated at a distinct distance above 50 µm from the burning surface. Although its thickness remains relatively constant, its shape evolves significantly with AP particle size. Under fine AP conditions, R3 exhibits a uniformly distributed diffusion pattern. As the particle size increases, the reaction zone progressively shifts toward the two interface junctions, ultimately forming a characteristic “W”-shaped distribution. Notably, despite this substantial morphological transformation, the peak reaction rate of R3 remains virtually unchanged.
Correspondingly, the total heat release rate distribution (
Figure 10) exhibits an evolution from uniform to non-uniform patterns: at small particle sizes, the heat release zone is continuously distributed above the burning surface; as the particle size increases, the heat release progressively concentrates at the two points of the interface junction. This transition indicates that the flame characteristics are gradually shifting from premix-dominated to diffusion-dominated combustion.
The temperature field analysis in
Figure 11 further corroborates this mechanistic transition. Although the flame temperature near the burning surface remains consistently around 2900 K, unaffected by AP particle size variations, the morphology of the 2000 K isotherm changes significantly: when
dAP ≤ 50 μm, the isotherm remains approximately straight, exhibiting premixed flame characteristics; at
dAP = 100 μm, the isotherm becomes undulated, clearly reflecting the typical morphology of a diffusion flame. This transition threshold (50 μm) provides a quantitative basis for distinguishing between the two flame regimes.
As shown in
Figure 12, under high-pressure conditions (3.0 MPa), the flame structure resembles that observed at low pressure but with significantly compressed scales, with reaction zones positioned closer to the burning surface. The thickness of the R1 reaction zone is reduced to approximately 2 μm, and its morphology evolves from semicircular at small AP particle sizes to an extremely narrow band-like thin layer as particle size increases. The R2 reaction zone similarly undergoes a transition from a connected band-like structure to concentrated regions at the two interface junction points, with a continuous decrease in reaction rate. The R3 reaction zone exhibits the most pronounced morphological evolution: at smaller
dAP, it displays a fan-shaped distribution; as particle size increases, it sequentially evolves into a thickened “M” shape, ultimately forming an elongated “inverted V” structure.
The evolution pattern of heat release distribution in
Figure 13 is consistent with that observed under low-pressure conditions: the heat release zone progressively transitions from a continuous uniform distribution to concentration at the two interface junction points, further confirming that under high pressure, the flame similarly undergoes a transition from premix-dominated to diffusion-dominated combustion.
The temperature field analysis in
Figure 14 reveals that under high-pressure conditions, the flame temperature near the burning surface stabilizes at approximately 3100 K, with negligible influence from AP particle size. The morphologies of the 1500 K and 2000 K isotherms vary significantly with particle size: when
dAP ≤ 20 μm, the isotherms remain essentially straight, exhibiting premixed characteristics; when
dAP ≥ 50 μm, the isotherms display “mountain peak”-shaped curvature, reflecting diffusion flame dominance. This transition threshold (20 μm) is lower than that observed under low-pressure conditions, indicating that elevated pressure accelerates the formation of diffusion-dominated flames.
Comparing and summarizing the analysis results for P = 2 MPa and P = 10 MPa, the following conclusions can be drawn: Both the generation rate and consumption rate of AP macromolecules NH3 + HClO4 increase with increasing AP particle size, but the release rate increases more slowly than the consumption rate, causing the thickness of the AP decomposition flame R1 to decrease with increasing AP particle size. When dAP increases, AP macromolecules NH3 + HClO4 exhibit weaker diffusion characteristics, and the probability of mutual mixing with HTPB decomposition products decreases, thereby reducing the R2 reaction rate and also shrinking its main reaction region. As the AP particle size increases, the R3 reaction rate increases, and its main reaction region gradually shrinks and moves closer to the burning surface. When dAP increases, the distribution of Q(R) in the near-burning surface region gradually changes from uniform to non-uniform, gradually concentrating near the two points at the junction of the AP and HTPB burning surfaces. When dAP increases, the propellant flame gradually evolves from being dominated by premixed characteristics to being dominated by diffusion characteristics. Under low-pressure conditions, the phenomenon where diffusion combustion characteristics begin to dominate starts to manifest after the AP particle size exceeds 50 µm. Under high-pressure conditions, this phenomenon starts to manifest after the AP particle size exceeds 20 µm. This indicates that the sensitivity of gas-phase temperature distribution to AP particle size is much higher under high pressure than under low pressure.
4.2. Influence of AP Mass Fraction on Flame Position and Gas-Phase Temperature
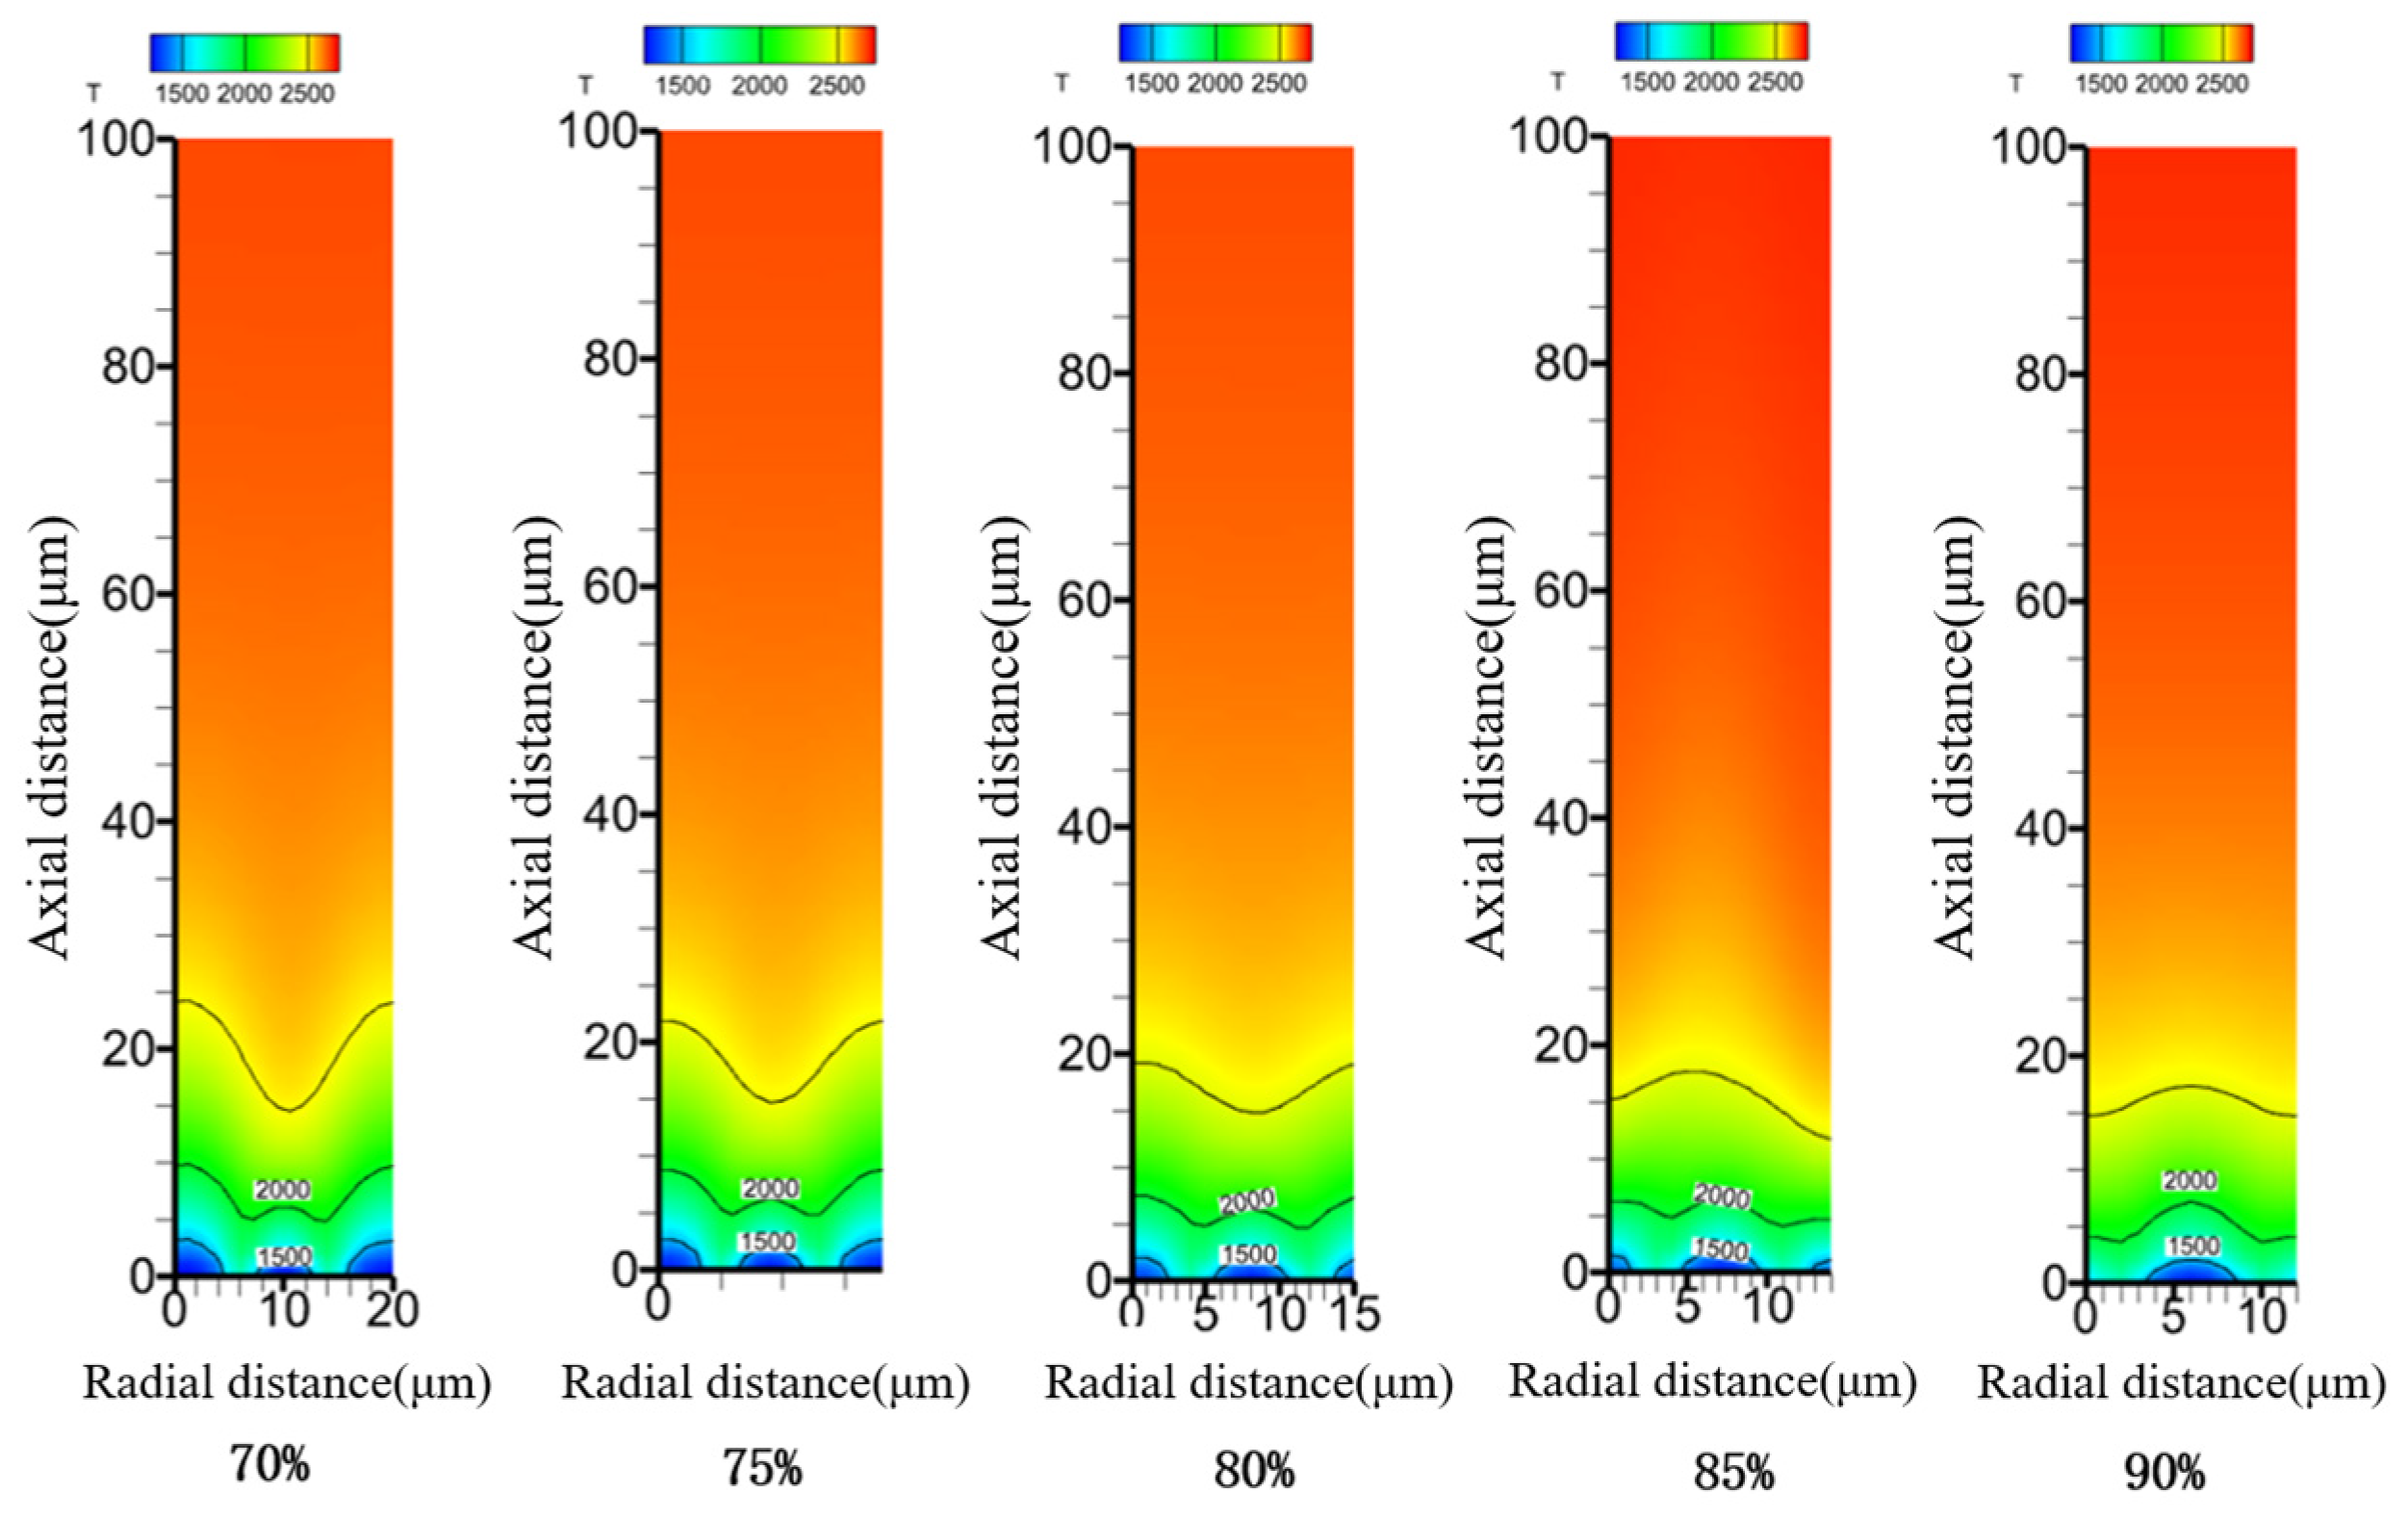
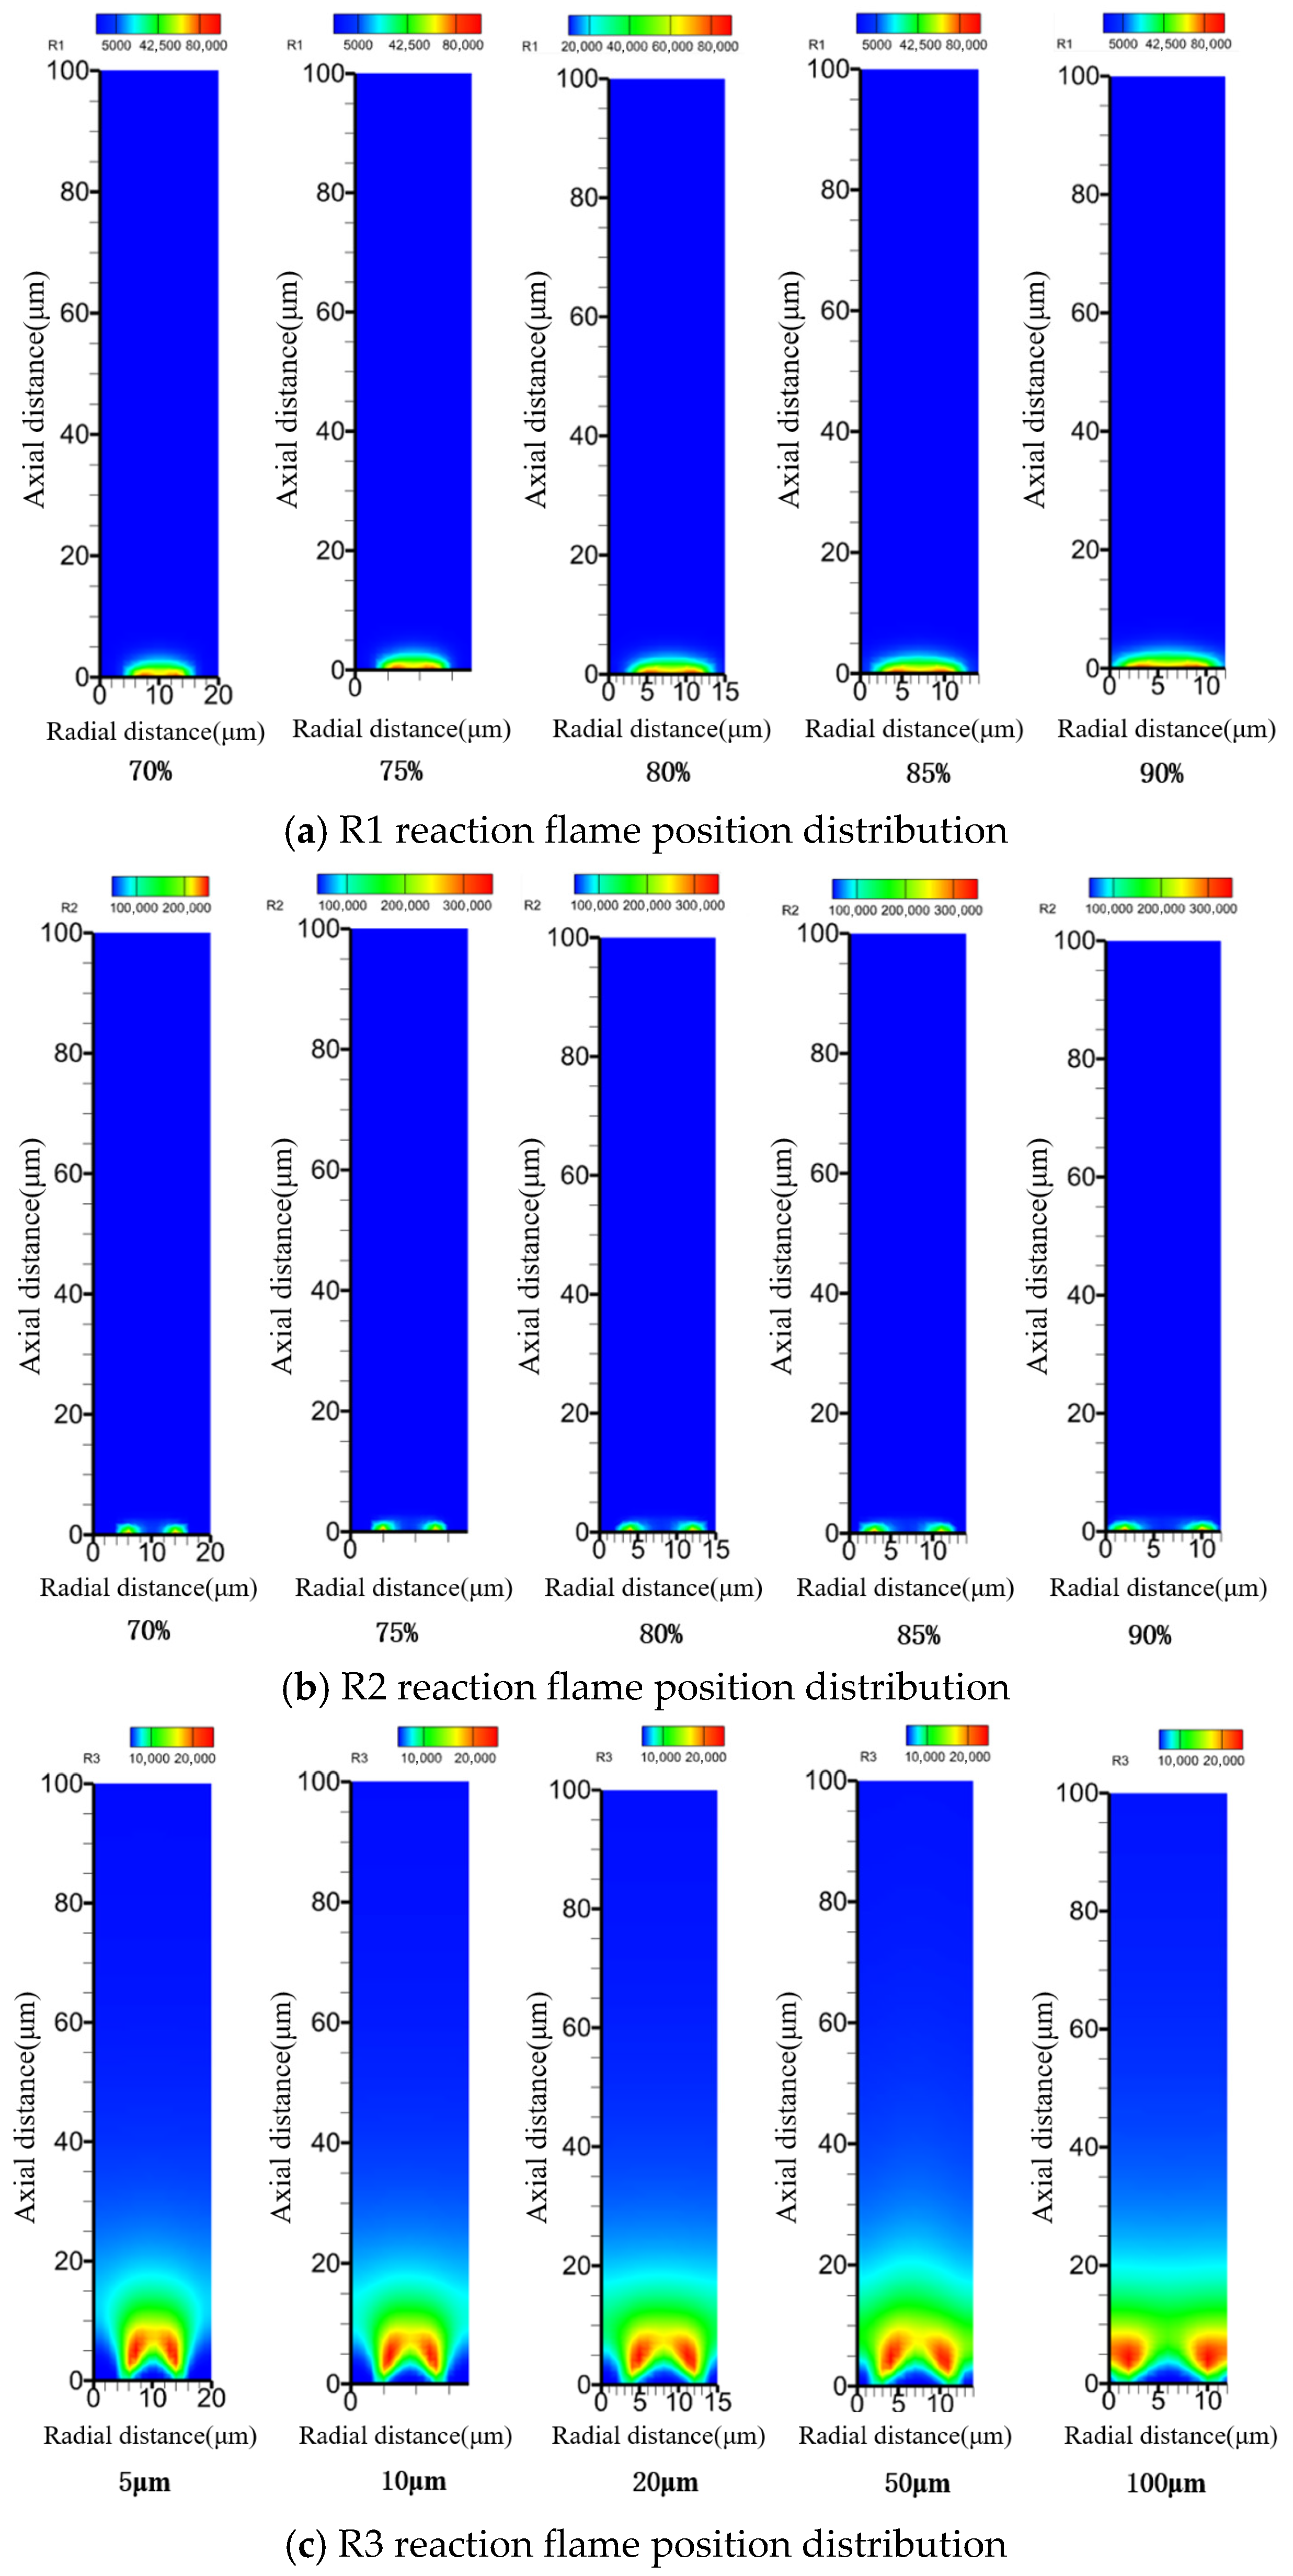
To study the influence of AP mass fraction changes on flame position and gas-phase temperature, this section analyzes Cases 8, 9, 10, 11, and 12. The three-flame reaction position maps, combustion surface chemical reaction heat release distribution maps, and combustion surface temperature distribution contours are obtained, as shown in
Figure 13,
Figure 14 and
Figure 15.
Analyzing
Figure 15, as the AP mass fraction increases, the position, thickness, and shape of the main reaction regions for R1 and R2 do not change significantly. This reflects that AP decomposition and primary diffusion flames are not very sensitive to changes in AP mass fraction (within the range of 70% to 90%). Analyzing the flame position contours of R3 reveals that the R3 reaction rate increases with increasing AP mass fraction, and the main reaction region of R3 tends to diverge from above the AP burning surface towards both sides as the AP mass fraction increases. The main reaction region of R3 above the HTPB burning surface gradually increases.
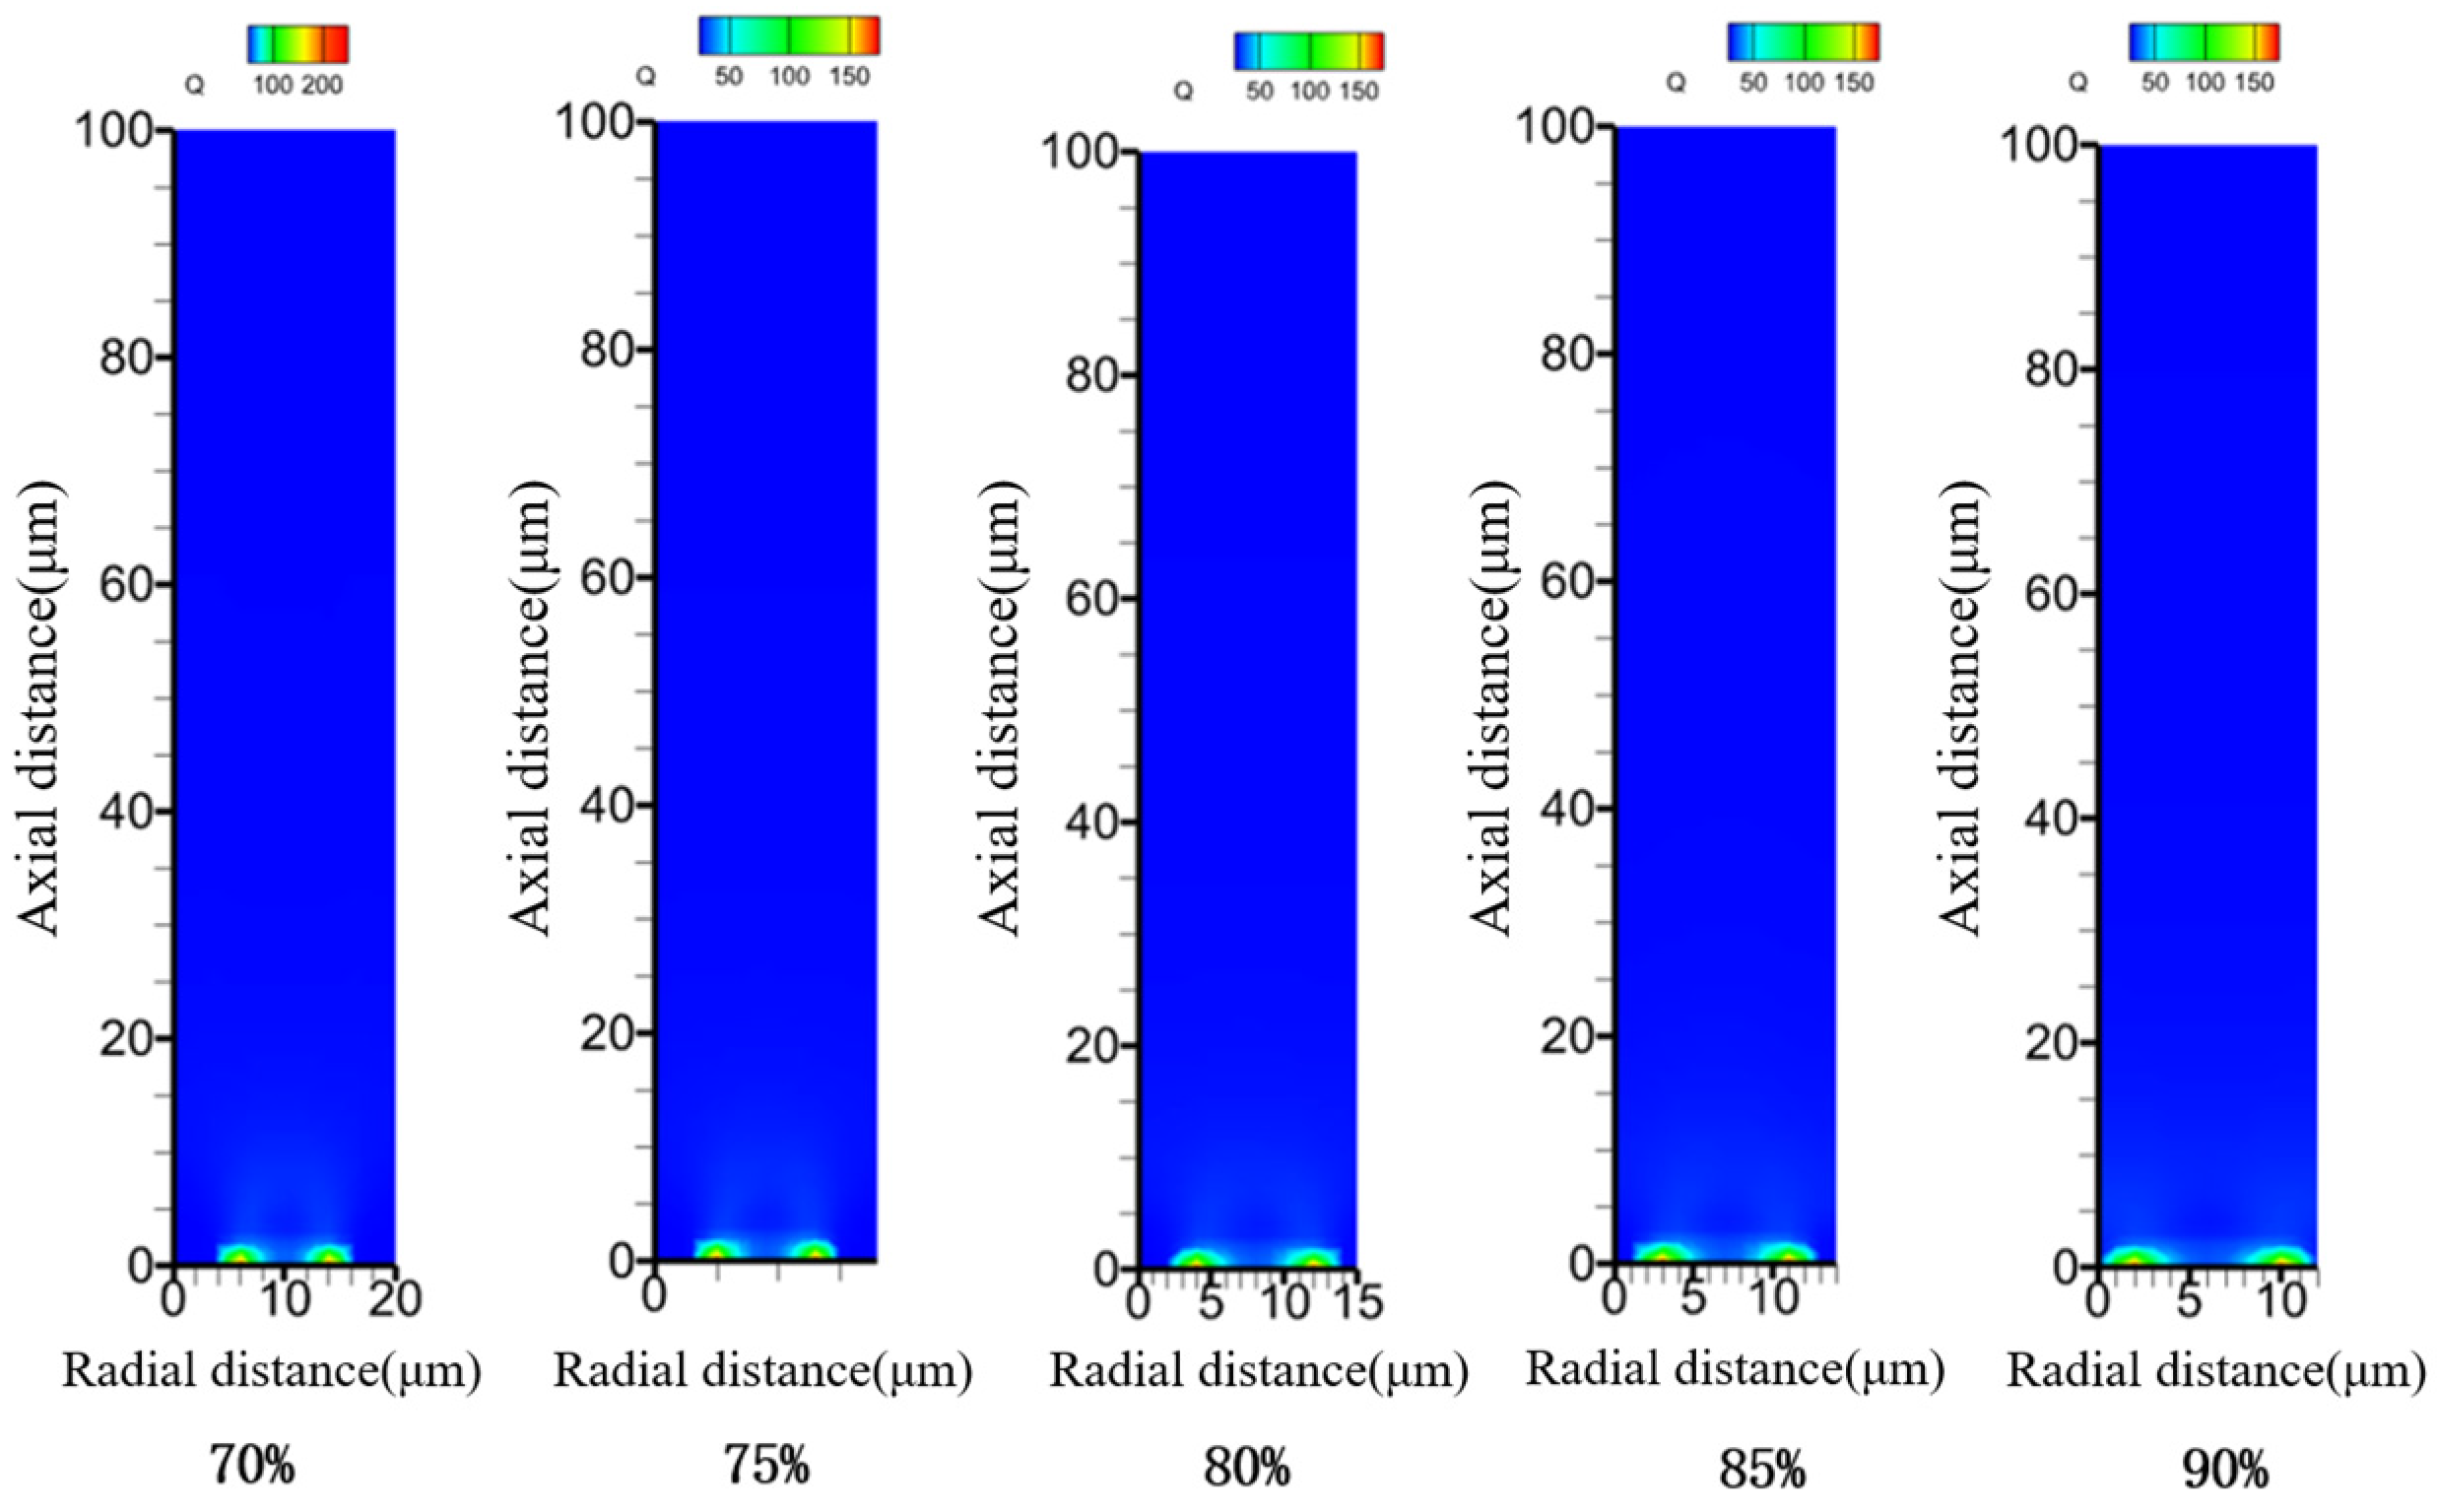
Analyzing
Figure 16, as the AP mass fraction increases, the main heat release region gradually diffuses from being concentrated near the two points at the junction of the AP and HTPB burning surfaces to the vicinity of the HTPB burning surface. However, the overall heat release does not change much with AP mass fraction.
Analyzing
Figure 17, when the AP mass fraction increases (within the range of 70% to 90%), the gas-phase flame temperature increases slightly, from about 2700 K to about 2900 K. Moreover, the 1500 K isotherm and 2000 K isotherm move closer to the burning surface as the AP mass fraction increases, indicating an increase in temperature near the burning surface and an increase in the amount of thermal feedback from the gas phase to the burning surface. Comparing the line shapes of the two isotherms reveals that as the AP mass fraction increases, the curvature of the isotherm lines decreases, tending towards straight lines. Furthermore, the isotherms above the HTPB burning surface gradually approach the wall. The reason for this phenomenon is that the gas-phase temperatures above both the HTPB and AP burning surfaces increase with increasing AP mass fraction, but the increase for HTPB is higher than for AP, consequently leading to a higher increase in the burning rate of HTPB.
Summarizing and comparing the above analysis conclusions comprehensively, we find that R1 and R2 are not sensitive to changes in AP mass fraction. The ability of HTPB to diffuse above the AP burning surface weakens as the AP mass fraction increases. Therefore, the main reaction region of R3 gradually diffuses towards the area above the HTPB burning surface. This is more conducive to gas-phase thermal feedback to the HTPB burning surface. From this, it is found that changes in the temperature distribution on the propellant burning surface primarily depend on changes in the R3 reaction.
5. Conclusions
(1) In AP/HTPB composite propellant systems, variations in AP particle size significantly alter the diffusion modes of chemical species. For instance, at a small particle size (dAP = 5 µm), the species distribution near the burning surface exhibits high uniformity, closely approximating an ideal premixed state with excellent mixing efficiency. However, as the particle size increases to dAP = 100 µm, a distinct shift occurs: the gas-phase reaction zones for NH3 and HClO4 expand significantly, while the mass fraction of species diffusing toward the HTPB burning surface decreases substantially. This transition leads to pronounced non-uniformity in the distribution of O2, H2O, and CO2 within the near-wall region. These enhanced diffusion-controlled characteristics result in a marked decline in mixing efficiency, leading to incomplete homogenization within the system.
(2) The AP mass fraction influences the species diffusion behavior of AP/HTPB propellants: the study reveals that the diffusion characteristics of NH3 and HClO4 are only weakly correlated with fluctuations in AP content. As the AP mass fraction increases, the accumulation of unreacted oxidizer leads to a significant rise in local O2 concentrations. This elevation in oxygen availability subsequently strengthens the displacement (offset) effect of CO2 above the AP combustion zone. Near the HTPB combustion interface, a distinct diffusion pattern is observed, where H2O and CO2 concentrations become more concentrated in closer proximity to the interface.
(3) As AP particle size increases, its influence on flame dynamics becomes more pronounced. Specifically, the thickness of the decomposition flame (R1) exhibits a clear downward trend. Correspondingly, the R2 reaction zone gradually contracts, accompanied by a reduction in the reaction rate. In contrast, the R3 region shows a significant intensification in reaction rate, with its primary reaction zone shifting toward and anchoring closely to the burning surface. Furthermore, the heat release distribution, Q(R), transitions from an initially uniform state to a highly non-uniform one, eventually concentrating at the interfaces between the AP and HTPB surfaces. These flame characteristics indicate a transition from a premixed-dominated regime to a diffusion-dominated one. Notably, the sensitivity of the gas-phase temperature distribution to AP particle size is significantly higher under high-pressure conditions compared to low-pressure environments.
(4) Adjustments in the AP mass fraction significantly alter the temperature distribution and flame positioning within the AP/HTPB propellant. Simulation results indicate that the R1 and R2 reactions are relatively insensitive to variations in AP mass fraction. However, as the AP proportion increases, the penetration of HTPB pyrolysis products above the AP combustion interface shows a steady decline. Conversely, the primary reaction zone of R3 migrates toward the region above the HTPB combustion interface, significantly enhancing the thermal feedback from the gas phase to the HTPB surface. It is particularly noteworthy that the evolution of the temperature gradient at the combustion interface is highly dependent on the R3 reaction dynamics, which exerts a non-negligible influence on the overall combustion process.