Article

Multi-Vector Adversarial Testing of an AI-Orchestrated Zero Trust Methodology on Constrained Edge Hardware

by
Ian Matthew Campbell Coston
1,2,*,
Karl David Hezel
2,
Eadan Plotnizky
2 and
Mehrdad Nojoumian
1
1
Department of Electrical Engineering and Computer Science, Florida Atlantic University, Boca Raton, FL 33431, USA
2
Cybectr LLC, Ellicott City, MD 21043, USA
*
Author to whom correspondence should be addressed.
Appl. Sci. 2026, 16(10), 4809; https://doi.org/10.3390/app16104809
Submission received: 23 April 2026 / Revised: 3 May 2026 / Accepted: 8 May 2026 / Published: 12 May 2026
(This article belongs to the Special Issue Advances in Artificial Intelligence for Cybersecurity)

Abstract

This paper is the empirical validation companion to our prior methodology paper introducing the Automated Zero Trust Risk Management with DevSecOps Integration (AZTRM-D) methodology, conducted through multi-vector adversarial testing on physical NVIDIA Jetson Orin Nano hardware. AZTRM-D unifies DevSecOps automation, the NIST Risk Management Framework, and Zero Trust architecture with AI orchestration via Cybectr Sentinel, featuring six AI subsystems with formal specifications. Testing spanned three progressive hardening stages across seven attack categories under a blind three-tester protocol with inter-rater agreement analysis. Factory-default devices were fully compromised in under five minutes. After full hardening, zero successful breaches were recorded across any tested vector. The CI/CD pipeline achieved a vulnerability detection rate of 96.8% (Wilson 95% CI: [0.891, 0.991]). Sentinel delivered 94.1% precision, 91.8% recall, and 4.2 min average detection time within 12–18% CPU overhead on edge hardware. A 14-capability comparative analysis against five established frameworks found seven capabilities unique to AZTRM-D. The 93.7% adversarial detection rate is reported against DiCE-generated counterfactual inputs and is bounded by the black-box threat model used in evaluation; gradient-based white-box attack evaluation is documented as a scoped Stage 4 future-work item. All three testers are affiliated with Cybectr LLC, the developer of AZTRM-D and Cybectr Sentinel; this conflict of interest is the most significant limitation of the present work, and independent third-party laboratory validation is the highest-priority Stage 4 deliverable.

1. Introduction

The Automated Zero Trust Risk Management with DevSecOps Integration (AZTRM-D) methodology was introduced in our prior publication [1], which described the theoretical integration of DevSecOps automation, the NIST Risk Management Framework (RMF) [2], and Zero Trust (ZT) architecture [3] into a single AI-orchestrated secure software development lifecycle. That paper established the conceptual foundation but did not include the Cybectr Sentinel platform architecture, the AI subsystem specifications with algorithm selection rationales, the full comparative analysis against established frameworks, or the measured results from multi-vector adversarial testing on physical hardware. This paper presents all of that material.
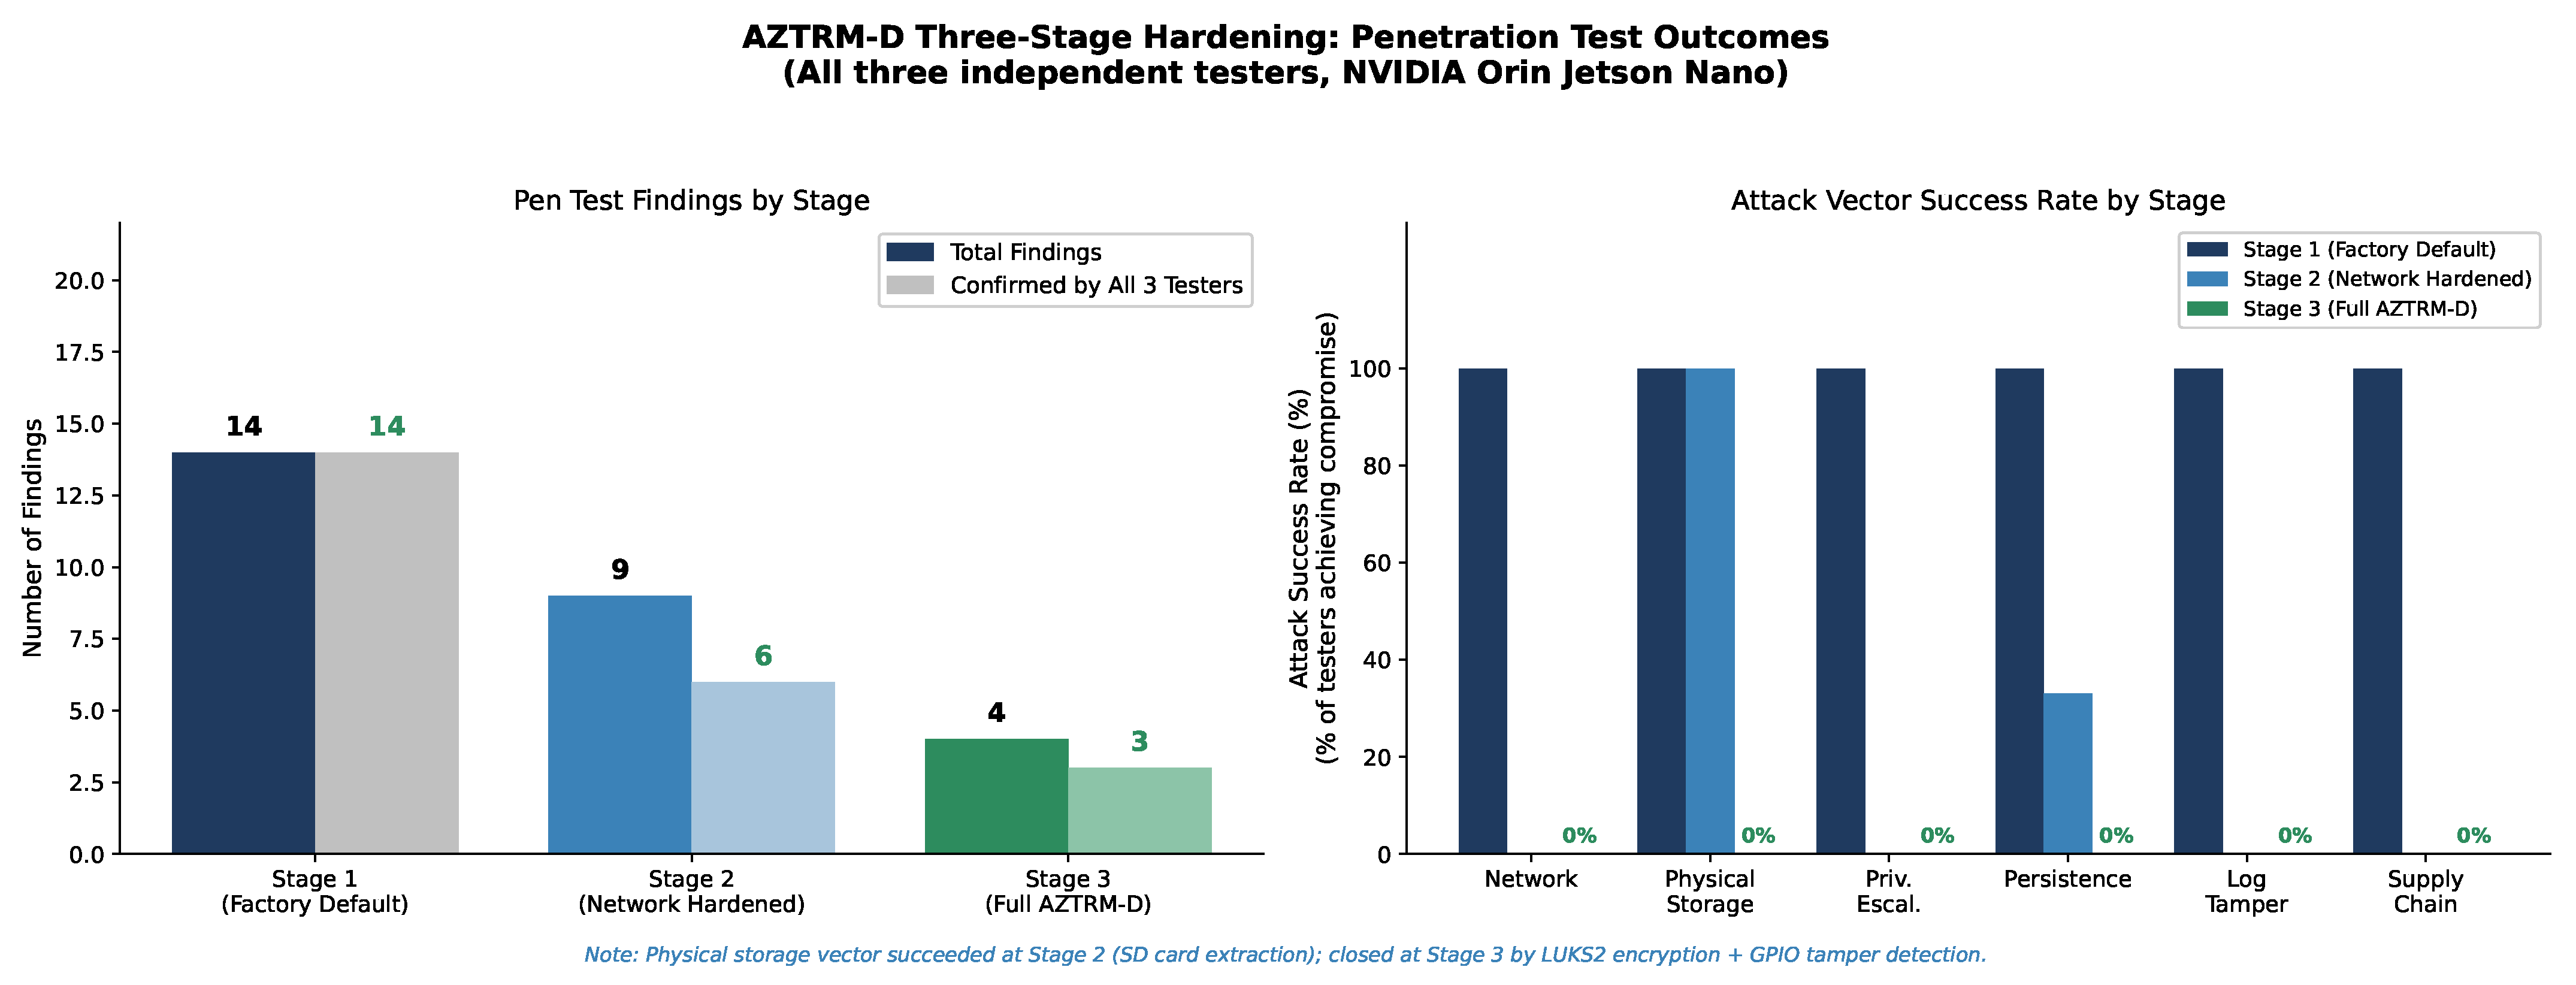
The empirical validation was conducted on physical NVIDIA Jetson Orin Nano hardware [4] across three progressive hardening stages. The test campaign covered seven attack categories: hardware (SD card removal, Universal Asynchronous Receiver-Transmitter (UART) serial console, General Purpose Input/Output (GPIO) probing), radio frequency (WiFi, Bluetooth), network (port scanning, credential attacks, service exploitation), software (code injection, dependency tampering), insider (standard developer credentials), privileged-insider (elevated access), and AI-assisted (large language model-generated exploit code submitted through the CI/CD pipeline). Three testers conducted all testing under a blind protocol with inter-rater agreement analysis [1].
The core finding is direct. A factory-default NVIDIA Jetson Orin Nano, fully compromised to root level by all three testers in under five minutes, was made resilient against every tested attack vector after systematic AZTRM-D hardening. The Cybectr Sentinel AI enforcement platform delivered measured performance within the constraints of edge hardware. The 14-capability comparative analysis against five established secure development frameworks confirmed that seven capabilities present in AZTRM-D are absent from every evaluated alternative.

Contribution and Relationship to Prior Work

This paper is the empirical validation companion to our prior methodology paper [1]. That paper introduced AZTRM-D as a unified methodology integrating DevSecOps automation, the NIST Risk Management Framework, and Zero Trust architecture under AI orchestration, and established the conceptual model. Validation on physical hardware, the AI subsystem specifications and selection rationales, the full Cybectr Sentinel architecture, and the head-to-head comparison against established secure development frameworks were explicitly identified there as the next required work and were not included in the scope.
The contribution of this paper is the validation of that methodology, conducted on physical NVIDIA Jetson Orin Nano hardware under adversarial conditions. Specifically, four contributions are reported here that are not present in any prior publication. First, multi-vector adversarial validation across three progressive hardening stages with seven attack categories under a blind three-tester protocol, including the Stage 1 baseline compromise time, the Stage 2 physical-bypass finding, and the Stage 3 zero-successful-vector outcome. Second, measured performance figures for the Cybectr Sentinel AI enforcement layer on constrained edge hardware: the precision and recall of the XGBoost vulnerability classifier, the false positive rate of the Isolation Forest behavioral pipeline, the Time-to-Initial-Detection across the integrated workflow, and the CPU overhead and policy enforcement latency under operational load. Third, the full AI stack rationale with formal specifications for all six subsystems (Isolation Forest, XGBoost, Sentence Transformer, PPO, RAG plus large language model, and DiCE), including head-to-head algorithm comparisons against the alternatives that were evaluated and rejected during selection. Fourth, the 14-capability comparative analysis against five established secure development frameworks (Microsoft SDL, OWASP SAMM, BSIMM, NIST SSDF, and DO-178C), identifying seven capabilities present in AZTRM-D and absent from every evaluated alternative.
What this paper does not claim is that AZTRM-D introduces novel machine learning architectures. The novelty is in the integration: the methodology unifies three previously separate strands (DevSecOps automation, NIST RMF governance, and Zero Trust enforcement) under continuous AI orchestration, applies that unified methodology to constrained edge hardware where every prior framework either omits or partially addresses the deployment constraints, and validates the resulting posture under adversarial conditions across the hardware, RF, network, software, insider, privileged-insider, and AI-assisted attack vectors. Each AI component within AZTRM-D was selected from established algorithms based on the operational, explainability, and compute constraints documented in Section 3.3. The validation reported here provides the evidentiary basis for the methodology claims made in the prior paper [1] and confirms that the methodology delivers what it specifies on physical hardware.
This paper is organized as follows. Section 2 presents the Cybectr Sentinel architecture, its four capability gaps, the end-to-end workflow, all six AI subsystem specifications, the explainability implementation, performance metrics, and the platform’s relationship to existing commercial tools. Section 3 presents the complete comparative analysis against both conventional SDLC methodologies and established secure development frameworks, followed by the full AI stack selection rationale with head-to-head algorithm comparisons, the tool stack, the testing methodology and team structure, multi-vector penetration testing results across all three stages, quantitative benchmarking, enterprise applicability, Zero Trust enforcement validation, cryptographic control validation, and consolidated results. Section 4 addresses limitations, including the single-device-class scope, the affiliation of all three testers with the organization that developed AZTRM-D, and the bounds of the adversarial evaluation. Section 5 states the conclusions.

2. Cybectr Sentinel: Architecture, AI Stack, and Operational Mechanics

Sentinel was built because, to the best of our knowledge, no single commercial product covers all four capability gaps at once. The combination of unknown asset coverage, on-demand AI-guided pen testing, MITRE D3FEND and ENGAGE integration in a single system, and encrypted Role-Based Access Control (RBAC)-gated findings reporting aligned to AZTRM-D’s access control model does not exist in any off-the-shelf product. Cybectr Sentinel is a proprietary platform developed by Cybectr LLC under the leadership of the author (Coston), who serves as the CEO and Founder. Cybectr LLC was established as a United States Department of Defense contracting company prior to the conception of Sentinel; the company provided the Sentinel platform and its associated tools for use in this research. Eadan Plotnizky and Karl David Hezel contributed to platform development and adversarial testing under contract with Cybectr LLC; all intellectual property rights are held by Cybectr LLC per their respective agreements. Cybectr LLC has provided a written letter of approval authorizing the use of Sentinel and its architecture, algorithms, and performance data in this paper for academic purposes. Plotnizky and Hezel have each provided separate written permission for the use of their contributions. Copies of all approval and permission letters have been provided to the review committee. Deployment supports three modes. It can be embedded directly in the target environment, as a local software install, or from a USB drive for rapid assessment scenarios. All AI analysis routes through a secure, encrypted channel to the cloud-trained model.
The AI component selection rationale was presented in our prior work [1]. This section covers the architecture that those algorithms operate within, how the workflow connects them end-to-end, the explainability layer that makes their decisions defensible under formal review, and the measured performance figures. Section 3 presents the validation results from adversarial testing against the deployed system.

2.1. The Four Capability Gaps Sentinel Fills

  • Gap 1: Unknown Asset Coverage.
Standard scanners match discovered assets against signature databases. When an asset is not in the database, which happens constantly in IoT environments with custom firmware or proprietary industrial hardware, the scanner reports nothing, and the miss is silent. Sentinel builds a feature vector for the unknown asset using Sentence Transformer embeddings and computes cosine similarity against a library of known-asset vectors [5]. Equation (7) defines the similarity metric. A score above 0.82 pulls a vulnerability profile from the nearest neighbor’s known Common Vulnerabilities and Exposures (CVE) history, converting a silent miss into a flagged, reviewable risk estimate.
  • Gap 2: AI-Guided Penetration Testing On Demand.
Conventional pen testing needs a dedicated red team, a real budget, and, at best, runs quarterly. Sentinel’s Proximal Policy Optimization (PPO) agent runs penetration tests inside an isolated sandbox whenever the user approves it at the workflow gate [6]. The agent learns attack sequences from MITRE ATT&CK Tactics, Techniques, and Procedures (TTP) data and sequences Metasploit modules accordingly. This is not a substitute for a skilled human red team on complex engagements, but it provides continuous automated exploitation validation that, to the best of our knowledge, based on a review of commercially available tools as of 2024, is not offered as an integrated capability within a single unified security platform.
  • Gap 3: MITRE D3FEND and ENGAGE Integration.
D3FEND maps NIST-funded countermeasures against ATT&CK offensive techniques. ENGAGE is MITRE’s adversary engagement, deception, and denial framework. Sentinel’s Retrieval-Augmented Generation (RAG) pipeline queries D3FEND after a vulnerability is confirmed and generates specific mitigation steps. The ENGAGE module uses confirmed TTP data to inform active defense decisions, including whether deception assets should be deployed. To our knowledge, no widely deployed commercial scanner integrates both D3FEND countermeasure mapping and ENGAGE active defense planning within a single workflow.
  • Gap 4: Encrypted, RBAC-Gated Reporting.
The findings are AES-256 encrypted when they leave Sentinel. Access to specific report sections is controlled by the same RBAC policies governing the rest of the AZTRM-D environment: developers see code-level findings, network administrators see network findings, and the CISO sees the executive risk summary. Standard vulnerability management tools do not typically combine AES-256 encryption of findings with per section RBAC gating aligned to a Zero Trust access control model.

2.2. Sentinel Workflow End-to-End

Sentinel’s end-to-end pipeline integrates six AI subsystems into a nine-stage coordinated workflow, from device enrollment through the generation of a role-differentiated analyst report. Understanding this sequence is necessary for evaluating the claimed 4.2 min Time-to-Initial-Detection (TTID), since that figure is a pipeline metric spanning multiple components rather than the output of any single algorithm. Each stage contributes latency, and the full workflow makes clear where the clock starts (device enrollment) and where it ends (first anomaly or vulnerability flag surfacing in the monitoring dashboard). The handoff logic between stages also explains why Sentinel’s behavioral anomaly detection and vulnerability triage findings appear in the same report. Both pipelines feed into the same RAG synthesis stage, which correlates them before report generation. Table 1 documents this sequence in full.

2.3. AI Subsystem Specifications

Sentinel uses six AI components, each selected for a specific function. The mathematical formulations are included because readers evaluating the 94.1% precision or 91.8% recall figures deserve to understand the underlying mechanics rather than just accepting the numbers. Table 2 summarizes all six.
  • Isolation Forest: Behavioral Anomaly Detection
Isolation Forest builds an ensemble of t random binary trees by recursively partitioning a sub-sampled dataset. At each node it selects a random feature and a random split value. Anomalous points reach leaf nodes faster on average because there are fewer similar points nearby, and the resulting average path length forms the basis of the anomaly score (formal definition and parameter selection in Section 3.3.1). Sentinel runs t = 100 trees with sub-sample size ψ = 256 . Scores above 0.6 trigger a monitoring alert; scores above 0.8 trigger automatic containment through the ZT Policy Enforcement Point. In the Stage 3 insider simulation, the flagged behavioral profile showed three dominant contributors: lateral access attempts per hour (observed: 14, training mean: 0.3), log access outside normal window (observed: true, base rate: 0.02), and sudo attempts on non-approved targets (observed: 7, training mean: 0.1). These produced an average isolation path length of 4.2 versus the training distribution mean of 11.7.
  • XGBoost and SHAP: Vulnerability Triage and Explainability
XGBoost uses a regularized gradient-boosted tree objective (formal definition in Section 3.3.2) [8]. The regularization term prevents overfitting to the training CVE dataset, which degrades performance on vulnerability types the model has not previously encountered. Recall is tuned above precision (91.8% vs. 94.1%) because a missed real vulnerability costs more than a false positive that an analyst reviews and clears.
SHAP decomposes each model output additively into a baseline expectation plus per feature contributions [7] (full Shapley value formulation in Section 3.3.2). A concrete example from the Stage 1 assessment: CVE-2021-41773 (Apache path traversal and RCE) [13] received a SHAP breakdown showing that a known public exploit contributed + 0.41 , a network-based attack vector contributed + 0.22 , no privileges required contributed + 0.19 , and no user interaction needed contributed + 0.14 . The analyst sees not just that this CVE is a high priority but exactly why: a public exploit exists, no credentials are required, and no user action is needed.
  • PPO: AI-Guided Penetration Testing
The PPO agent uses the clipped surrogate objective in Equation (5). The ε = 0.2 clipping range prevents destabilizing policy updates in the sparse-reward pen testing environment. The reward function assigns + 1.0 for successful exploitation, + 0.5 for novel attack path discovery, and 0.3 for detection by the monitoring stack. That detection penalty pushes the agent toward stealth, producing a more realistic adversary model and more useful validation of whether behavioral monitoring catches subtle intrusions.
  • GNN-Augmented SAST
The Graph Neural Network (GNN) represents each function as a Code Property Graph and applies the multi-layer Graph Convolutional Network (GCN) in Equation (6) [14,15]. Training on the BigVul dataset, which contains 3754 vulnerable functions extracted from open-source C/C++ projects, achieves an 81.4% true positive rate at a 6.2% false positive rate, outperforming rule-based SAST on novel patterns by roughly 30 percentage points where the rule set has no matching signature [16].

2.4. Explainable AI Implementation and Claude Integration

Explainable AI (XAI) in AZTRM-D serves two distinct purposes. The first is internal auditability. Sentinel’s AI components produce decisions, and those decisions need to be defensible under NIST RMF assessment. A vulnerability triage classifier that produces a priority score without explaining why is not acceptable in a framework that maps to NIST RMF and requires defensible authorization decisions. The second is operational speed. The human approval tiers in the pipeline need clear, feature-level information for fast, accurate gate decisions. The 3.1% false positive rate measured on the Stage 3 single-device validation corpus would project to roughly 31 false alerts per scanning cycle across 1000 hypothetical endpoints, a planning estimate rather than a measured fleet-scale figure. Without a feature-level explanation, triage means re-investigating each alert from scratch. With SHAP values, an analyst can see which features drove the flag and dismiss clear false positives in seconds rather than minutes.
SHAP is implemented using the SHAP Python library’s TreeExplainer class, which computes exact Shapley values for tree-based models in O ( T L D 2 ) time, where T is the number of trees, L is the number of leaves, and D is the maximum tree depth [17].
Claude, Anthropic’s large language model, was integrated at two points in the workflow. The first is the natural-language explanation layer: after SHAP computed numerical feature attribution scores for an XGBoost classification, Claude translated those scores into role-appropriate analyst briefings. A SHAP output showing “Common Vulnerability Scoring System (CVSS) base score: +0.47, exploitability score: +0.31, attack vector network: +0.23” is interpretable to a security researcher but not necessarily to a developer reviewing a gate. Claude’s synthesis produced findings like: “This was flagged primarily because the CVE has a high base score and requires no privileges to exploit over the network. The model weighted the network attack vector heavily because all other network-accessible vulnerabilities in this class have historical exploit-in-the-wild records.” That preserves the full SHAP attribution chain while making the finding usable for non-specialist reviewers. The second use was the AI-assisted attack testing at Stage 3, described in Section 3.
AZTRM-D’s architecture prevents AI tools from introducing vulnerabilities through two mechanisms. For AI-generated code entering the pipeline, the same CI/CD gates that evaluate human-authored code evaluate AI-authored code. Static Application Security Testing (SAST) does not check authorship; it checks code patterns against policy rules. When one Stage 3 tester submitted Claude-generated Python code containing a privilege escalation pattern, specifically a subprocess call invoking sudo without the granular policy wrapper, the SAST rule flagged it in 3.4 s. The dependency the code imported was rejected by Software Bill of Materials (SBOM) validation. The embedded test API key was caught by Secrets Scan. Three independent automated gates, none aware that the code was AI-generated, caught the submission on content alone. For AI analysis producing incorrect results, SHAP attribution is the verification layer. Every XGBoost classification comes with a SHAP explanation showing which features drove the score. An auditor can check the SHAP output directly to verify whether the contributing features are legitimate security signals or statistical noise.
Explainability in Sentinel is an architectural requirement that runs through every AI component, not a display layer applied to finished outputs after the fact. NIST RMF authorization requires that AI-driven security decisions be defensible under formal review, which, in practice, means every classification and anomaly score must carry a feature-level attribution that an analyst can evaluate, challenge, and document. Without that, the system cannot satisfy the authorization phase. SHAP values for XGBoost predictions, attention weights for the GNN-augmented SAST component, and cosine similarity scores for ATT&CK TTP matching are all captured and preserved as part of each finding’s evidence record rather than computed on demand. Table 3 documents the full XAI implementation stack, specifying the explanation method, output format, and downstream consumer for each AI component.

2.5. How Sentinel Uses AI: A Single Finding Through the Full Stack

Sentinel’s six AI components work in sequence, each stage feeding the next. Tracing a single finding through makes the integration concrete.
When an anomalous behavioral event occurs, the Isolation Forest score s ( x , n ) crosses the 0.6 threshold. The short-path feature decomposition identifies which behavioral telemetry features contributed most: an admin user connecting at 2:37 AM, accessing the Git server, and running find/-name ∗.key might produce three high-weight features that individually look near-normal but together produce an anomaly score of 0.74. That path decomposition output goes to the XGBoost classifier, which takes the anomalous features alongside session context (user role, time since last authentication, Secure Production Identity Framework for Everyone (SPIFFE) Verifiable Identity Document (SVID) age) and produces an exploitability classification with SHAP explanation: “Access pattern classified as potential credential harvesting attempt. Top contributing features: off-hours access (+0.41), filesystem search pattern (+0.38), elevated privilege use (+0.22).”
The SHAP output goes to the RAG pipeline, which queries the MITRE ATT&CK knowledge base for techniques matching the behavioral signature and returns the top- k = 5 matching TTPs by cosine similarity. Claude synthesizes the SHAP attribution, the ATT&CK technique mappings, and session context into role-appropriate analyst briefings. The developer role sees: “This commit activity has been flagged for review. A credential search pattern was detected in your recent session.” The CISO sees: “High-confidence insider threat indicator. Behavioral signature matches T1552 (Unsecured Credentials) and T1083 (File and Directory Discovery). Recommend immediate session review.” The same underlying data, but a different presentation, are tailored to the recipient’s context.
If the PPO pen test agent has run against the current device configuration, its episode log maps the agent’s action sequence to ATT&CK technique IDs, which the ENGAGE module uses to select active defense responses. When the anomalous behavioral signature matches TTPs the pen test agent successfully exploited in the sandbox environment, which corroborates the insider threat hypothesis and increases response priority.
The final output is an AES-256 encrypted finding report with RBAC-gated sections, generated in under 90 s from first detection to report compilation (as measured during Stage 3 validation). The report includes the Isolation Forest anomaly score and path trace, the XGBoost classification with full SHAP waterfall, ATT&CK TTP mappings, Claude-generated natural-language summaries at each role level, D3FEND mitigation recommendations with source document provenance, and ENGAGE active defense recommendations. Every piece of evidence traces back to a specific algorithm output, which is what makes the report defensible under formal security review.

2.6. Sentinel Performance Metrics

Evaluating an AI-driven security platform requires distinguishing between metrics derived from direct operational measurement and those from held-out evaluation sets, because the two carry different evidentiary weight. All figures reported here fall into one of three categories: Stage 3 operational measurements collected on the physical NVIDIA Orin hardware during the adversarial testing campaign, classification metrics evaluated on stratified train/test splits with 5-fold cross-validation, and adversarial robustness figures evaluated against the DiCE counterfactual generation pipeline. The measurement basis for each metric is specified in the notes column. A 94.1% precision figure from a controlled holdout set is meaningful but carries different implications than the same figure from a production monitoring window would, and the table distinguishes these cases explicitly. Together these metrics characterize Sentinel across detection speed, classification accuracy, adversarial robustness, and operational cost. Table 4 presents the full set of performance figures.
All precision, recall, FPR, and TTID figures in Table 4 were measured by the author on the Cybectr Sentinel platform during Stage 3 validation. All metrics are self-measured. No independent third-party laboratory has reproduced these figures; external validation is designated as a priority for future work in Section 4. The metrics reported here should be interpreted as internally measured baseline performance characterizations, not independently verified benchmarks. With that caveat stated, the measurement methodology is as follows. XGBoost classification metrics used an 80/20 stratified train/test split with 5-fold cross-validation on the CVE triage dataset. BigVul TPR and FPR figures are from the BigVul held-out test set [16]. The adversarial detection rate reflects evaluation against DiCE-generated counterfactual inputs [12]. The TTID figure of 4.2 min ( σ = 0.6 min) was computed over N = 27 detection events recorded during the Stage 3 validation window, spanning both the vulnerability scanning pipeline and the behavioral anomaly detection pipeline. Given the limited sample size, this figure should be interpreted as a baseline characterization of pipeline latency rather than a statistically powered performance guarantee.

2.6.1. False Positive Rate Decomposition by Subsystem

The 3.1% aggregate FPR is the union of three Sentinel AI subsystems operating in parallel during the Stage 3 validation window: the Isolation Forest behavioral anomaly pipeline, the XGBoost vulnerability triage pipeline, and the GNN-augmented Semgrep SAST pipeline. The aggregate is computed as total false positive events divided by total monitoring events across all three. Decomposing the aggregate by subsystem makes the operational triage cost transparent: a fleet operator deciding whether to retain a given subsystem needs to know that subsystem’s specific contribution to the alert burden. Table 5 presents the decomposition.
Confidence intervals on these per subsystem rates require the underlying event counts, which the Stage 3 instrumentation captured at aggregate granularity rather than at per subsystem granularity. This is a documented limitation of the original Stage 3 deployment instrumentation rather than a methodological choice, and the Stage 4 multi-device fleet validation campaign currently underway addresses it directly. Stage 4 instrumentation is designed to capture per subsystem and per alert-class event counts with sufficient resolution to compute Wilson 95% CIs at each operating point and to break down each subsystem’s false positives by alert class (configuration drift, behavioral anomaly, code pattern, dependency vulnerability, access-pattern divergence). The Stage 4 results are scoped to appear in the follow-up empirical paper.
The behavioral pipeline’s 2.4% contribution dominates the aggregate, which is what a reader would expect given the relative event volumes: continuous telemetry monitoring generates orders of magnitude more events per unit time than per commit vulnerability triage. Operationally, this means the SHAP-based prioritization layer matters most for the behavioral pipeline’s false positives, since that is where analyst triage burden concentrates. Without SHAP, behavioral false positives require re-investigation from scratch; with SHAP, an analyst can dismiss feature-mismatch false positives in seconds.

2.6.2. Adversarial Detection Rate: Black-Box Baseline

The 93.7% adversarial detection rate is reported under a black-box threat model. That figure reflects Sentinel’s performance against DiCE counterfactual inputs, which are minimum-perturbation adversarial examples designed to cross the decision boundary while staying as close as possible to legitimate inputs [12]. DiCE is the primary adversarial evaluation method applied in this validation, and its scope and threat model are stated formally in Section 3.3.7. White-box gradient-based attacks, such as PGD [18] and FGSM [19], as well as transfer attacks from substitute models [20], are evaluated separately under the Stage 4 validation campaign and are scoped to appear in the follow-up empirical paper. The 93.7% figure is the black-box baseline matched to Sentinel’s deployment threat model, not an upper bound on classifier robustness in the white-box regime. The black-box vs. white-box scope distinction is the standard framing in adversarial ML evaluation [21,22], and Section 3.3.7 articulates the full rationale for why the black-box model is operationally relevant for Sentinel.
The 3.1% false positive rate also requires careful framing. That figure was measured on the Stage 3 single-device validation corpus. Projected across 1000 hypothetical endpoints, it yields roughly 31 false alerts per scanning cycle, a planning estimate, not a measured result at the fleet scale. Whether that is manageable depends on the security team size and workflow. SHAP explanations reduce per alert triage time from minutes to seconds for clear feature-mismatch cases, but the volume question belongs in deployment planning conversations before rollout.

2.7. Sentinel Versus Manual and Commercial Alternatives

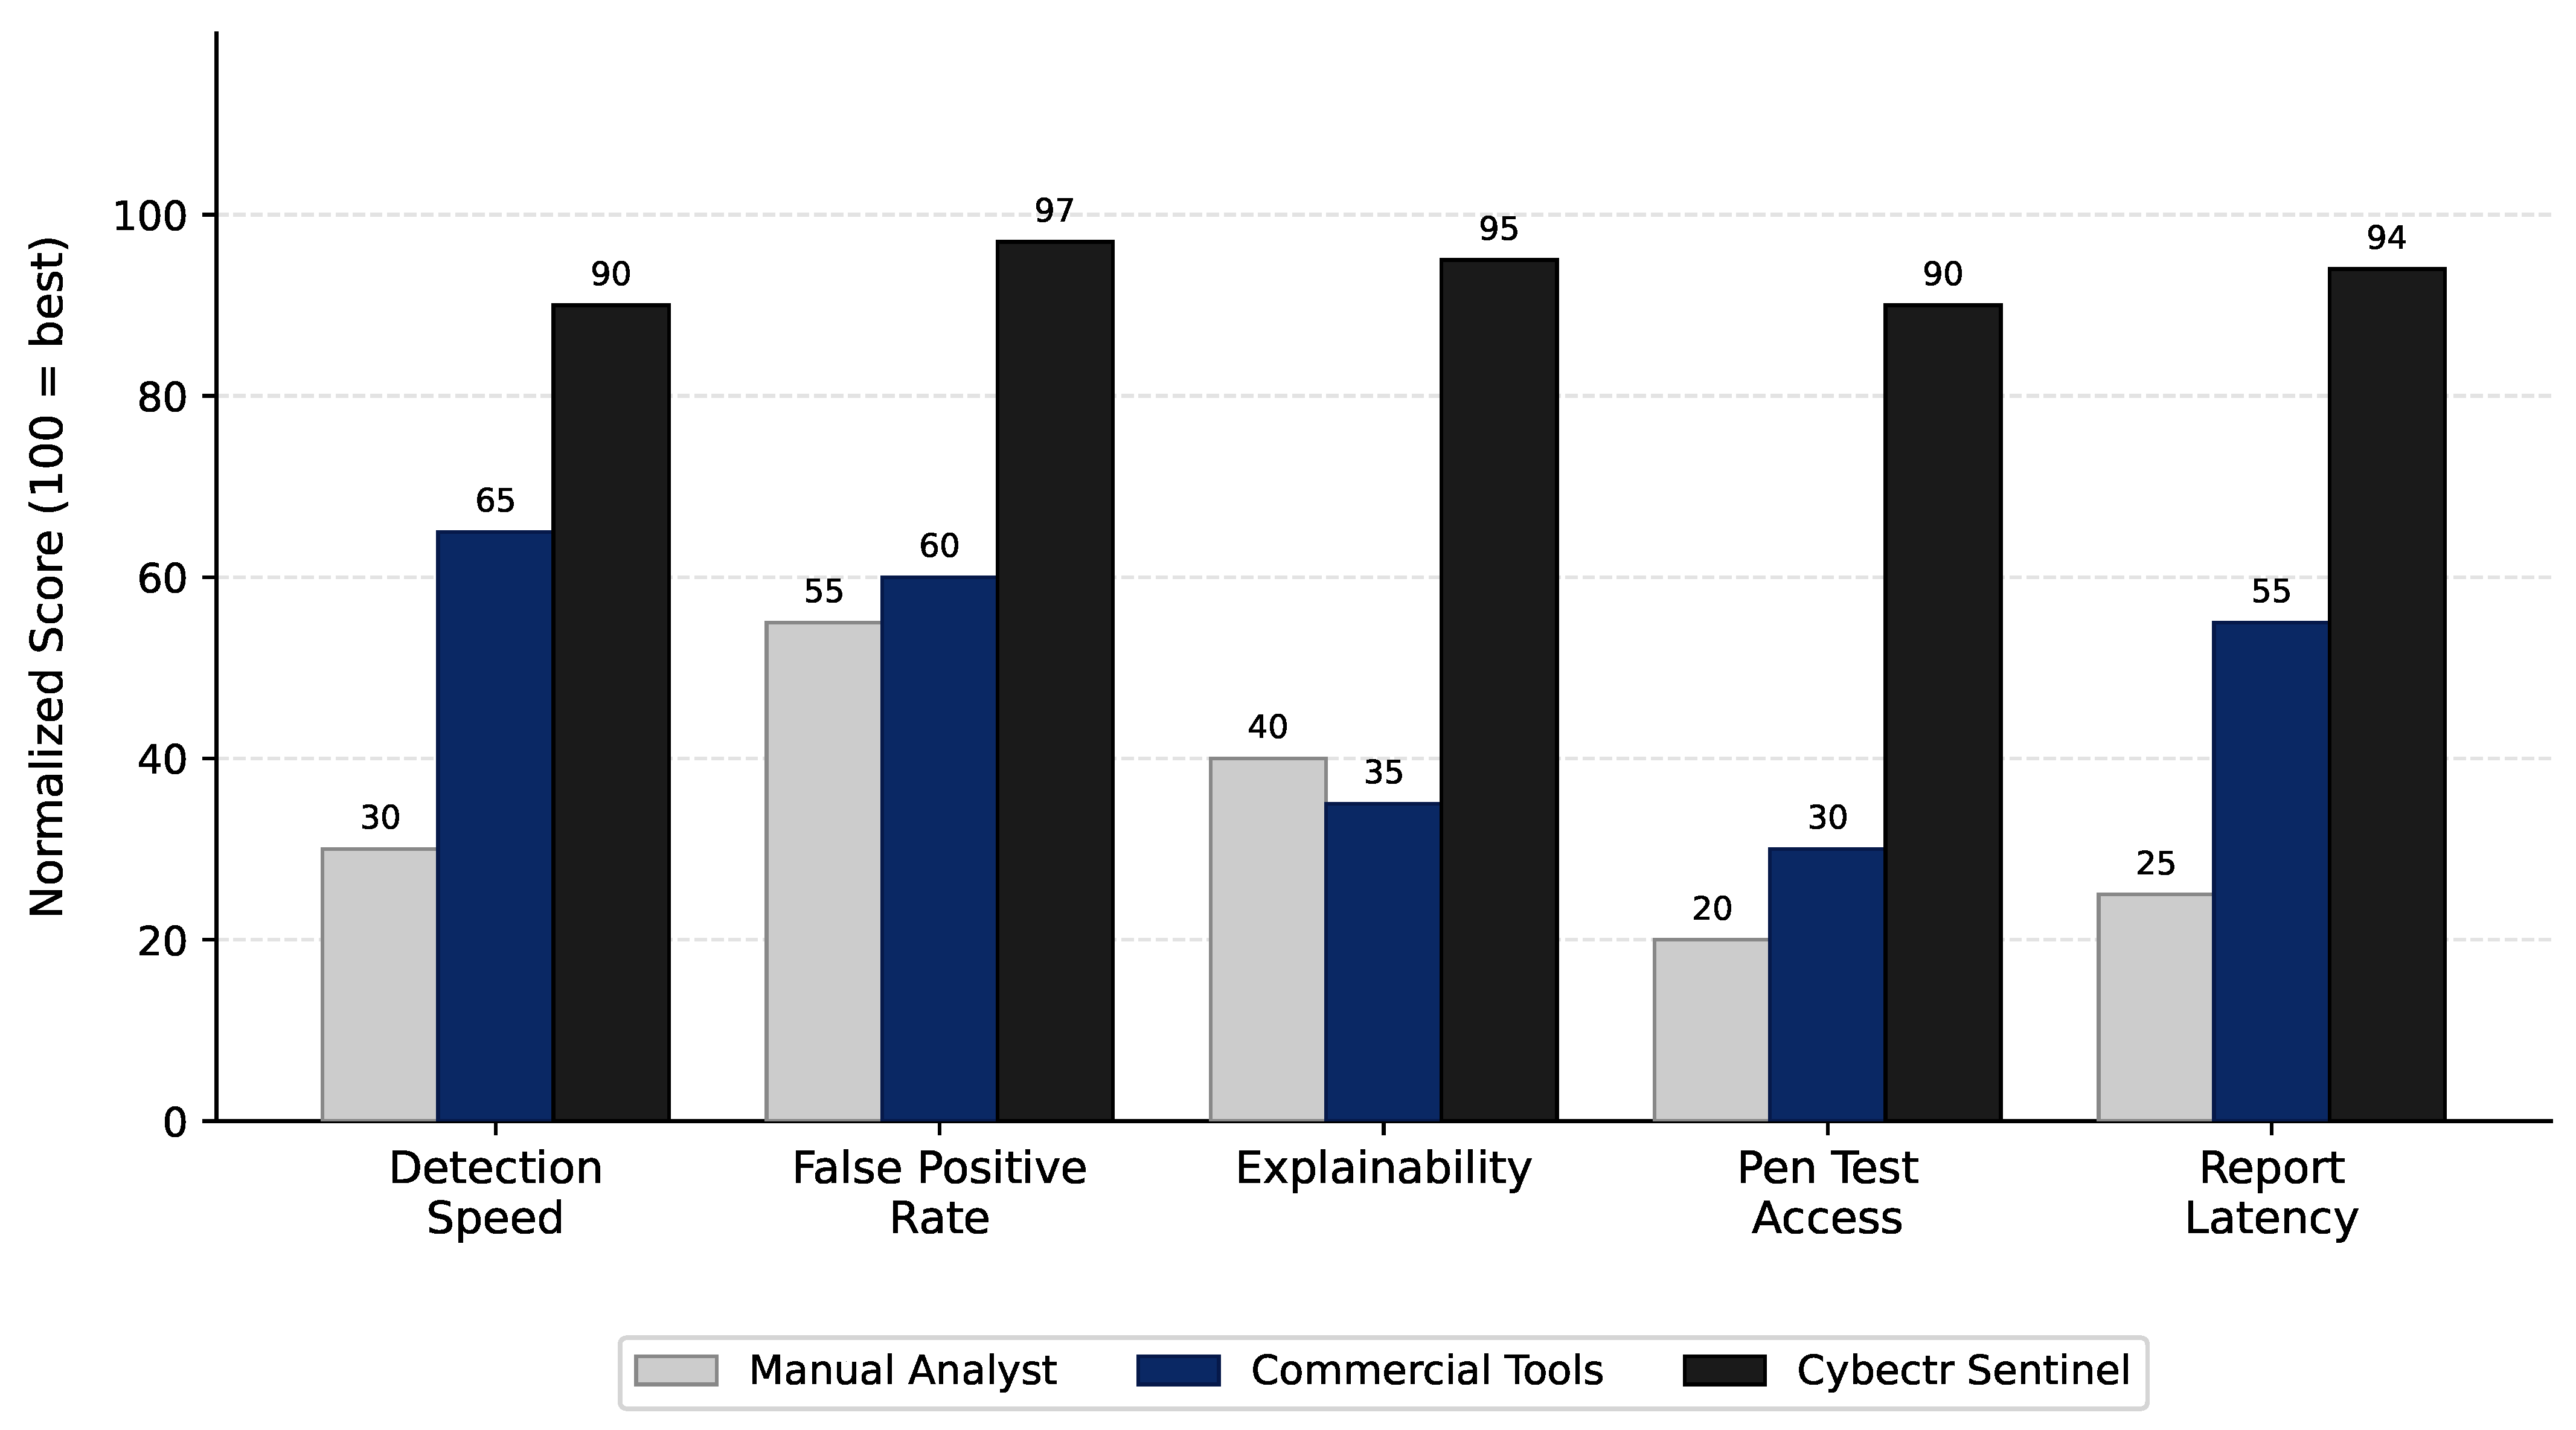
Sentinel does not replace conventional tools; it layers on top of them. Table 6 breaks down where Sentinel adds capability beyond what manual analysts and commercial products deliver on their own, and where it depends on those tools to cover gaps it was not designed to fill. Figure 1 presents the same comparison as a normalized score chart.

2.8. What Sentinel Does and Does Not Replace

Table 6 and Figure 1 present the capability comparison in tabular and radar-chart form, respectively. Sentinel’s coverage of Unknown Asset Inference, AI-guided pen testing, D3FEND integration, and encrypted RBAC-gated reporting does not make the other tools redundant.
Sentinel fills capability gaps. It does not replace tools already doing their jobs well. Nmap, Nessus Professional, OpenVAS, LinPEAS, and Hydra each represent decades of community development, continuously updated CVE signature databases, and well-understood operational behavior. Sentinel does not have a CVE signature database anywhere close to Nessus Professional’s plugin library, which covers over 115,000 CVE IDs with daily updates [23]. It does not run full-range TCP port scanning with version probing the way Nmap does. It cannot enumerate privilege escalation paths from inside a live shell the way LinPEAS does. Sentinel’s XGBoost classifier was trained on NIST NVD data, which means newly published CVEs not yet in the training set will not be caught by the classifier until the model is retrained or the RAG retrieval index is updated.
What Sentinel does is synthesize the outputs of all those tools into a unified risk picture, apply AI prioritization with explainability, automate the pen testing step that otherwise needs dedicated red team resources, and produce encrypted RBAC-gated reports that protect findings from unauthorized access. It is a coordination and enforcement layer, not a replacement for purpose-built scanning tools.
Drawing that line clearly before deployment prevents both over-reliance on automated detection and underuse of what the platform actually does well. Sentinel automates detection, classification, evidence generation, and role-appropriate reporting without human initiation. What it does not replace is human judgment for incident response decisions carrying legal or organizational weight, architectural security reviews requiring system-level context, and the analyst expertise needed to correctly interpret SHAP outputs and override false positives. These are not limitations unique to Sentinel; they reflect the appropriate boundary between automated security tooling and human security governance in any mature security operations model. Table 7 makes the coverage division explicit, and Table 8 documents Sentinel’s specific strengths and limitations relative to manual processes and commercial alternatives.
No tool is without limitations, and being honest about where Sentinel falls short matters as much as documenting where it excels. Table 8 maps each dimension of Sentinel’s capability to its current assessment and the specific tool or process that covers any gap.

3. Comparative Analysis, Validation, and Quantitative Benchmarking

3.1. Introduction

Every framework comparison requires a reference baseline. Section 2 built and documented AZTRM-D and the Cybectr Sentinel platform. This section evaluates AZTRM-D against conventional development methodologies, against established secure lifecycle frameworks, and against actual adversarial testing conducted independently by three testers across four attack perspectives and three hardening stages. The empirical results are what make the comparative claims credible.
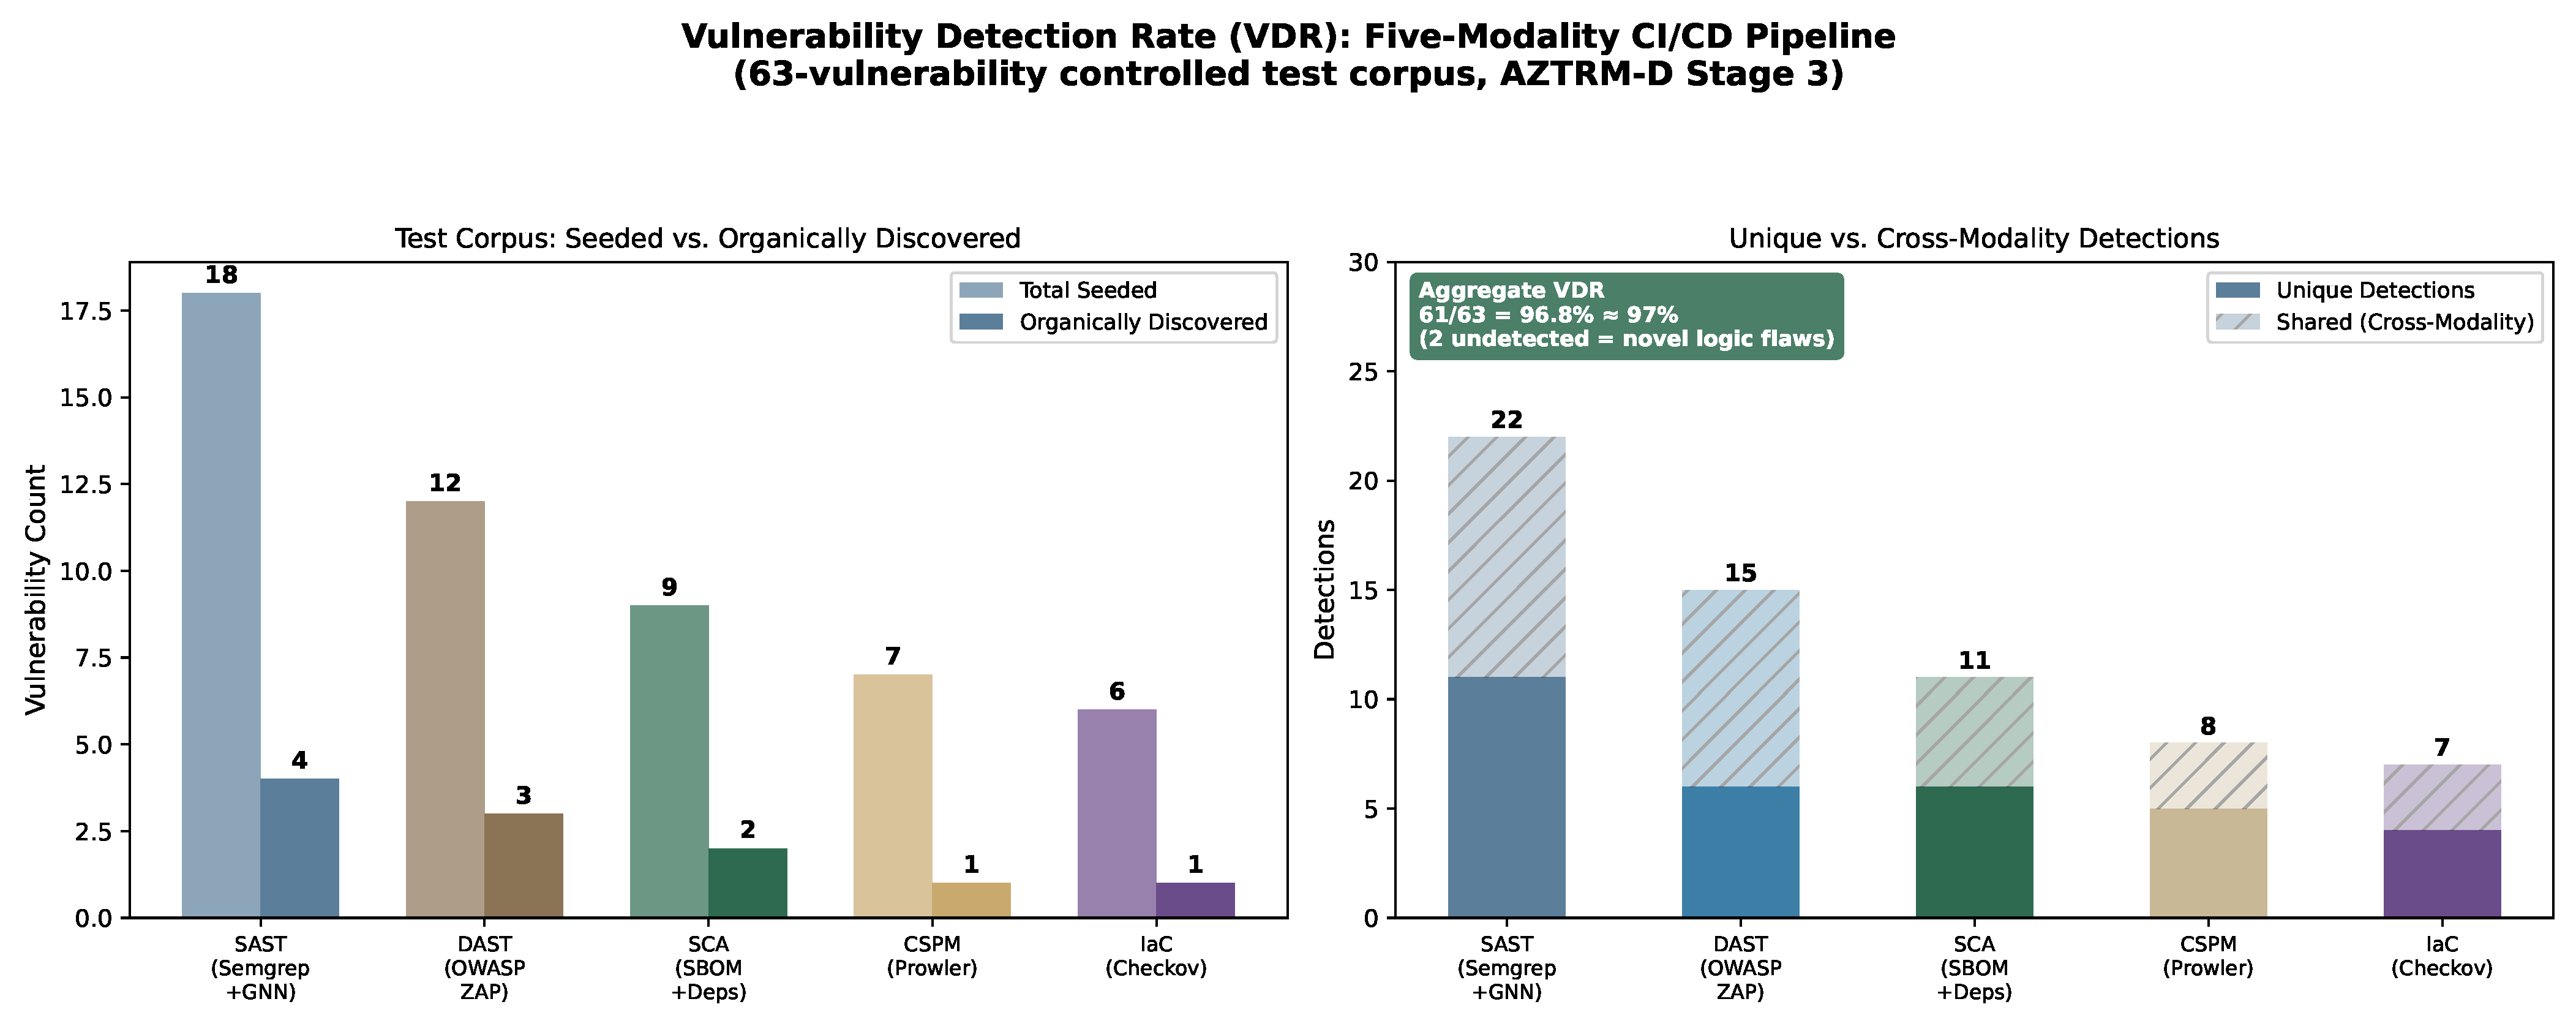
The aggregate vulnerability detection rate across the five-modality CI/CD pipeline was 96.8% (Wilson 95% CI: [0.891, 0.991]). That figure reflects known-class vulnerabilities caught before any code reached the production NVIDIA Orin environment. It does not mean AZTRM-D catches every possible vulnerability. No automated pipeline does. What it shows is what five complementary scanning modalities running in parallel can achieve against a baseline of zero scanning: SAST, Dynamic Application Security Testing (DAST), Software Composition Analysis (SCA), Cloud Security Posture Management (CSPM), and Infrastructure as Code (IaC) analysis. Section 3.9.1 walks through the derivation step by step, and Section 3.9.2 presents the per modality leave-one-out ablation.
The testing environment was the NVIDIA Jetson Orin Nano edge platform. That choice was deliberate: constrained compute, a physical attack surface that data center hardware simply does not have, and an RF exposure layer that is irrelevant in cloud deployments. If AZTRM-D’s controls hold under those conditions, they hold in less constrained environments. Section 3.10 addresses enterprise and general software applicability directly.
This section moves in a direct arc, comparative argument first, then the pen test campaign across three hardening stages, then quantitative benchmarks, then enterprise and general software applicability, then Zero Trust enforcement and cryptographic control validation. NIST RMF phase mapping and consolidated results close it out. The AI component selection rationale and Sentinel’s architecture are covered in their respective dedicated sections; what appears here are the validation results from testing against the deployed system.

3.2. AZTRM-D Versus Conventional SDLC Methodologies and Secure Frameworks

Security has always been the thing most likely to get deferred. Waterfall builds in a formal review only after components are delivered, which means findings arrive when rework is already expensive. Agile and Scrum move faster, but give security no real structural home. It was just a sprint-by-sprint afterthought with no continuous risk management. DevOps dismantled the wall between development and operations, but never consistently brought security into its CI/CD pipelines. Spiral at least introduced per cycle risk consideration, though it does not prescribe Zero Trust architecture or AI-driven automation. RAD treated security as essentially optional in the rush to delivery.
The established secure frameworks do better. Not enough, though. Microsoft SDL is prescriptive and battle-tested, but omits Zero Trust, AI orchestration, and any IoT-specific guidance. OWASP SAMM and BSIMM are maturity measurement tools. They describe where an organization currently stands without prescribing how to get somewhere more mature, and neither integrates AI automation nor Zero Trust. NIST SSDF comes closest on process rigor but leaves ZT enforcement and AI-driven pipeline automation entirely to the implementer.
AZTRM-D closes all of those gaps at once. The value is not any single capability. It is the combination of Zero Trust architecture, AI orchestration, and NIST RMF integration working as one unified methodology rather than three separate components bolted onto an existing process. Zero Trust, AI integration, and AI-driven continuous monitoring each show “None” across every comparison framework in Table 9 and Table 10. That is not an incremental gap. None of the evaluated frameworks addresses them.
A methodological note on the comparison structure: AZTRM-D is a unified methodology that integrates multiple security approaches. The comparison frameworks are specialized tools, each designed for a specific aspect of secure development. MS SDL targets the development process and does not claim to provide post-deployment monitoring. OWASP SAMM and BSIMM are maturity measurement models, not enforcement frameworks. DO-178C addresses safety-critical aviation software, not general purpose DevSecOps. The comparison evaluates whether each framework addresses a given capability, not whether it was designed to. The absence of a capability from a given framework may reflect its intentional design scope rather than a deficiency. What the comparison establishes is that organizations relying on any single evaluated framework have coverage gaps that require additional tooling or processes to fill, and that AZTRM-D addresses those gaps within a single integrated methodology. The comparative tables should be read with this asymmetry in mind.

3.2.1. Methodology Comparison

Table 9 compares AZTRM-D against six conventional SDLC methodologies (Waterfall, Agile/Scrum, DevOps, Spiral, RAD, and AZTRM-D itself) across six security-relevant dimensions: security integration, Zero Trust architecture, AI-driven automation, risk management, regulatory compliance, and IoT/edge security. The cell-by-cell assessments map to the citations given in each row. Two patterns emerge clearly. Zero Trust architecture and AI-driven automation are absent in every conventional methodology, so the gap between AZTRM-D and the alternatives is not incremental in those dimensions. Risk management and regulatory compliance are present in some form across most methodologies, but the integration is informal or manual rather than NIST RMF-aligned and automated. Section 3.2.2 then turns to dedicated secure development frameworks, where the relevant comparison shifts from methodology type to framework capability coverage.

3.2.2. Secure Framework Capability Comparison

Table 9 evaluates methodology types. Table 10 shifts the lens to established secure development frameworks, comparing AZTRM-D against MS SDL, OWASP SAMM, BSIMM, NIST SSDF, and DO-178C across seven capability dimensions.

3.2.3. Fourteen-Capability Matrix

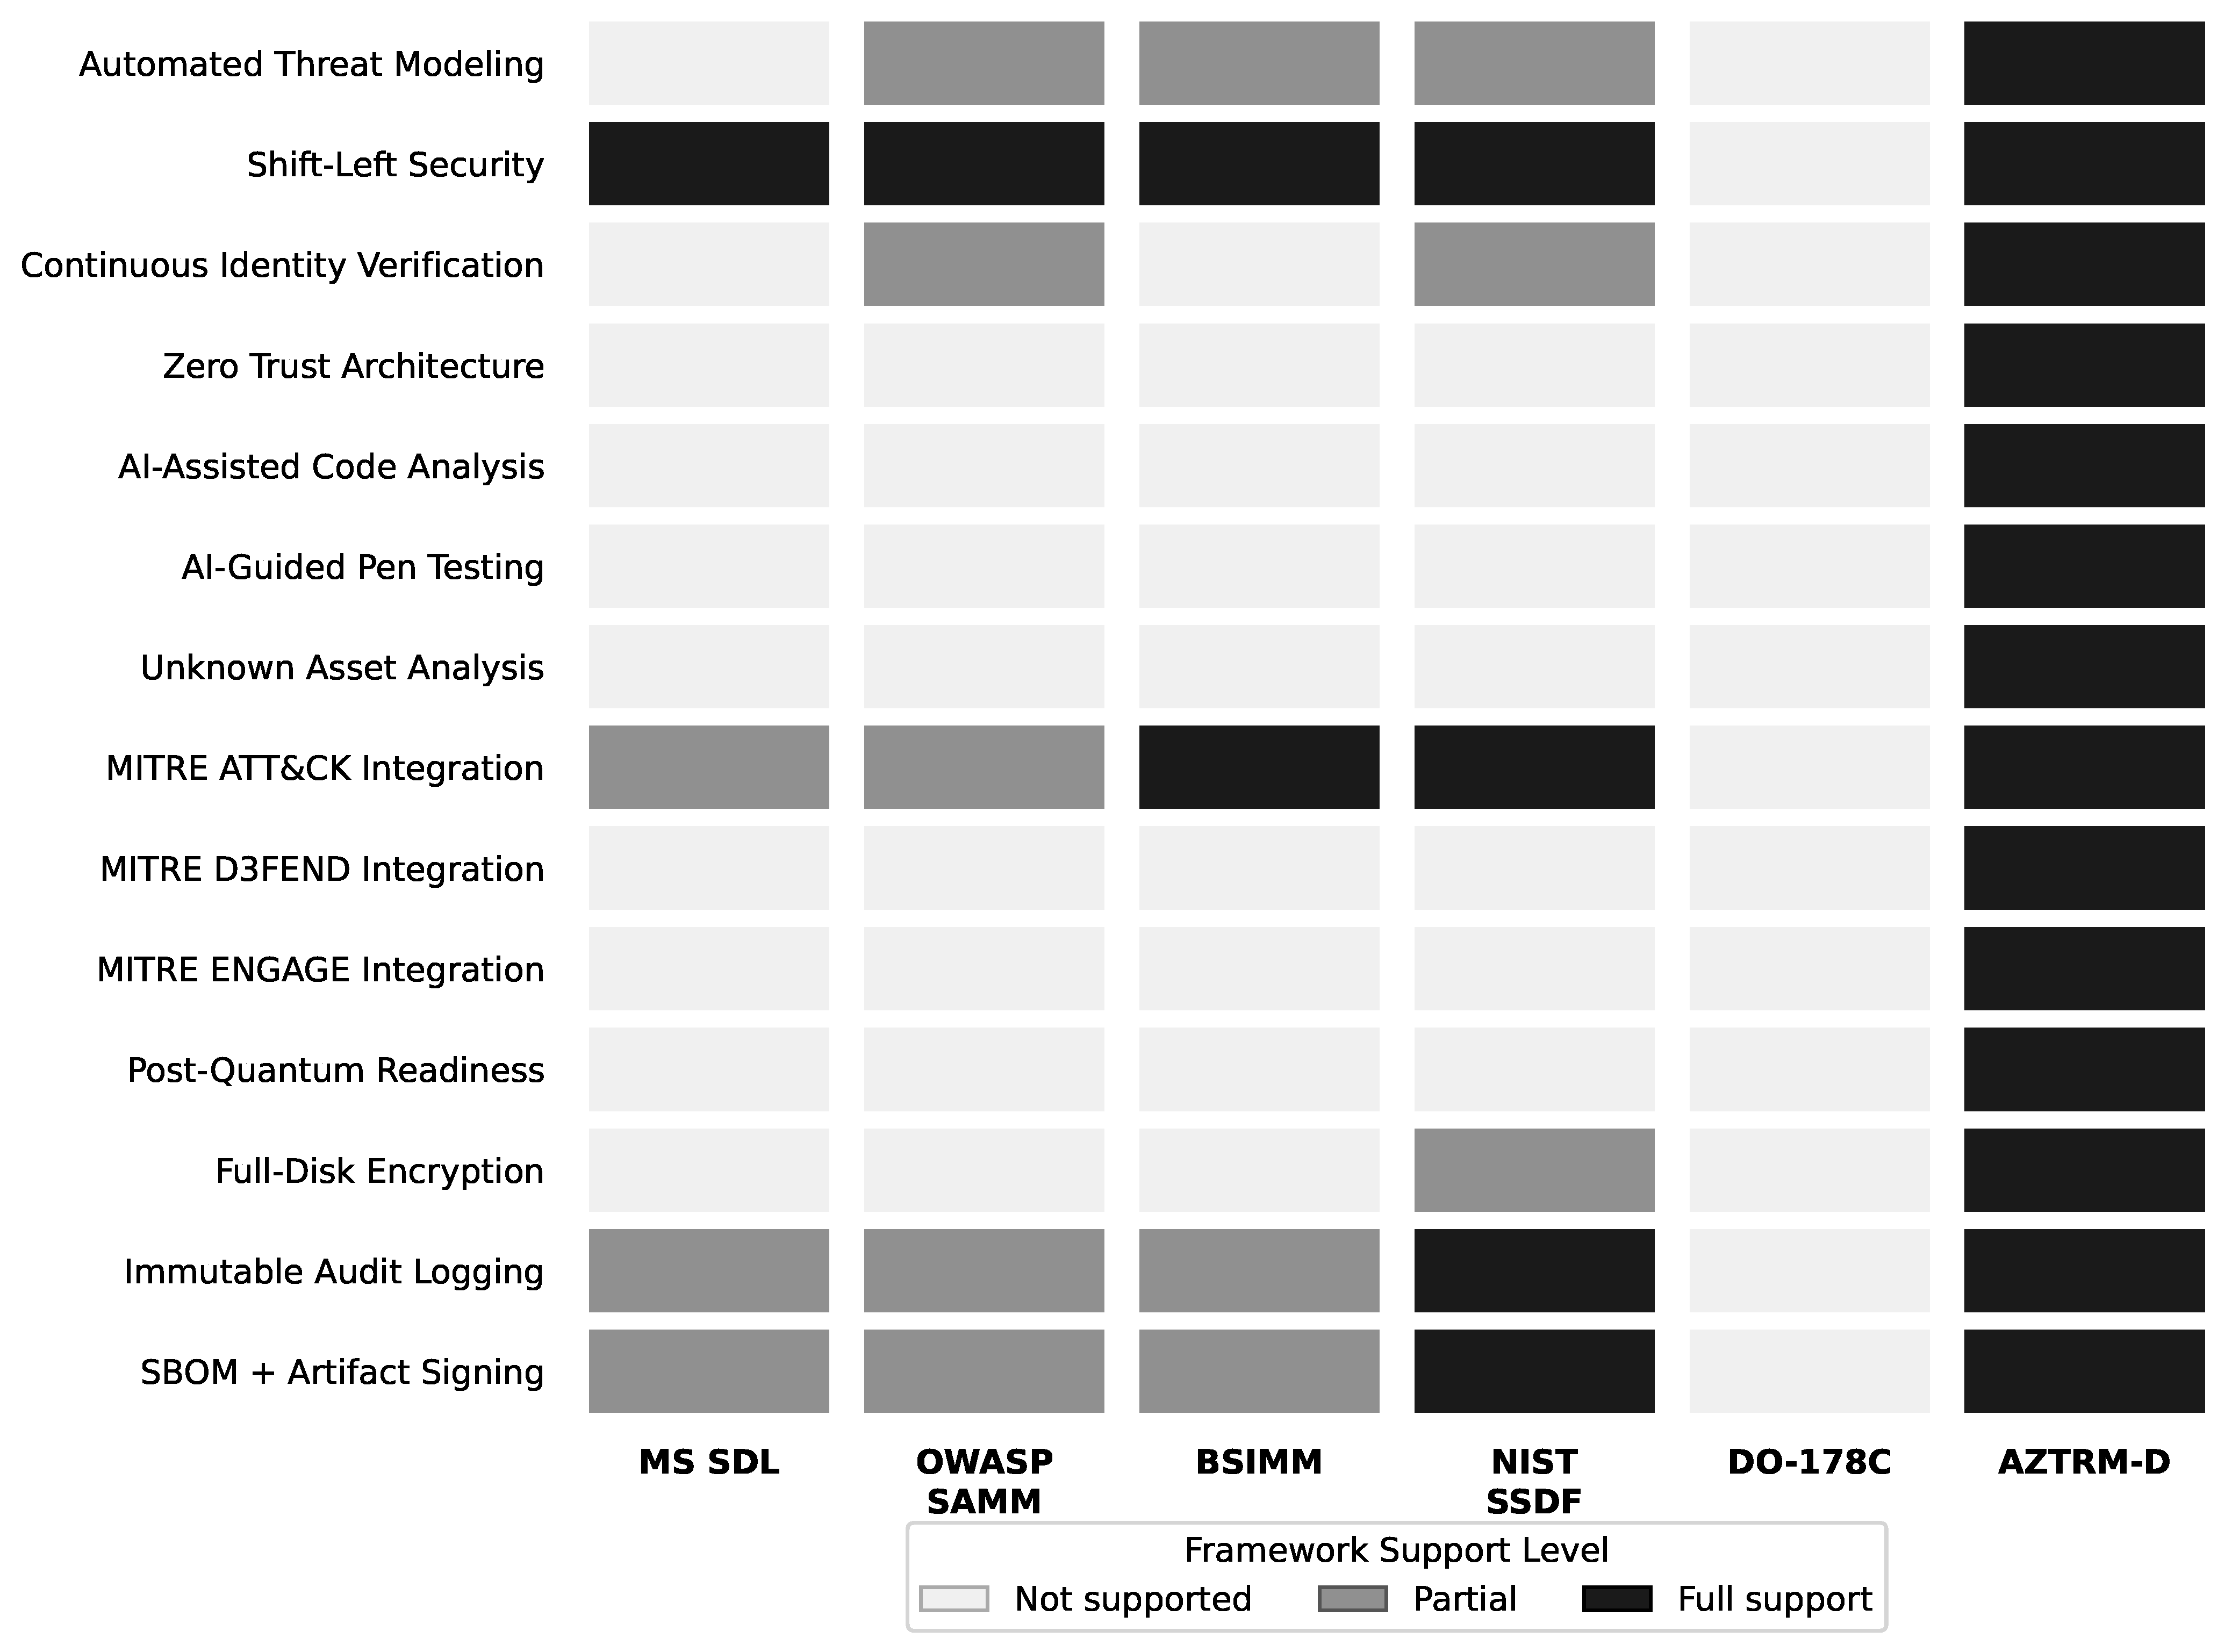
The framework-level comparison tables establish category-level coverage gaps between AZTRM-D and evaluated alternatives. The 14-capability matrix drills further, providing binary coverage assessments for specific capabilities across every methodology. This level of granularity matters because category-level comparisons can obscure partial implementations. A framework that addresses AI integration at a single lifecycle phase differs meaningfully from one that runs AI continuously across all phases, yet both might receive the same category-level marking. All capability assessments for non-AZTRM-D methodologies are drawn exclusively from published framework documentation rather than implementation experience, and the same assessment criteria are applied uniformly across all frameworks. Specifically: MS SDL assessments reference Howard and Lipner’s SDL process documentation [34,40]; OWASP SAMM assessments reference the SAMM v2.0 model [35]; BSIMM assessments reference the BSIMM14 community data [36]; NIST SSDF assessments reference SP 800-218 [37]; and DO-178C assessments reference the RTCA standard [38]. Seven capabilities, specifically AI-Assisted Code Analysis, Zero Trust Network Architecture, AI-Guided Penetration Testing, Unknown Asset Similarity Analysis, MITRE D3FEND integration, MITRE ENGAGE integration, and post-quantum readiness planning, show no coverage in any comparison framework based on these published sources. Table 11 presents the full 14-capability assessment; Figure 2 renders the same data as a heatmap.
Figure 2 renders the same 14-capability matrix as a heatmap, making the coverage gaps across frameworks visible at a glance. Seven capabilities are unique to AZTRM-D, with no coverage in any comparison framework: AI-Assisted Code Analysis (GNN/SAST), Zero Trust Network Architecture, AI-Guided Pen Testing, Unknown Asset Similarity Analysis, MITRE D3FEND Mapping, MITRE ENGAGE integration, and Post-Quantum Readiness Planning.

3.2.4. Consolidated SDLC and Security Framework Comparison

Table 12 consolidates the comparative analysis across all evaluated methodologies and security frameworks. Assessments marked “✓” indicate native, documented support. “∼” indicates partial or plugin-dependent support. “×” indicates absent or out-of-scope capability for that methodology. AZTRM-D assessments reflect Stage 3 validated capabilities. Capability assessments for SDLC methodologies are drawn from published comparative surveys [30,32,41]: waterfall assessments reference [25,32]; Agile from [26,42]; DevOps from [24,27]; and Spiral from [28]. Security framework assessments are drawn from their respective published documentation: MS SDL from [34,40]; OWASP SAMM from [35]; BSIMM from [36]; NIST SSDF from [37]; DO-178C from [38]; and Zero Trust references from [3,43].

3.2.5. Implementation Cost Comparison

Table 13 compares implementation effort and security economics across evaluated methodologies. Agile/Scrum baseline estimates are drawn from industry survey data on DevOps transformation costs [24]. MS SDL setup hours reflect Microsoft’s published guidance on SDL activity effort [40]. The remediation cost differential between commit-stage and post-release defects has been documented consistently across decades of software cost research, with estimates ranging from 30× to 100×, depending on system complexity and domain [45,46,47]. Rather than relying on any single estimate, AZTRM-D’s shift-left value case is grounded in the lower bound of this published range.
The post-release cost multiplier range (30–100×) reflects the published literature consensus, not a single data point. NIST Planning Report 02-3 documents the economic impact of late-stage defect discovery in a federal context [45], and Boehm’s foundational cost model established the exponential growth curve across SDLC phases [46]. The same order-of-magnitude finding is independently documented for commercial software [47]. The AZTRM-D ongoing overhead figure (4–8 person-hours per sprint) is directly measured from Stage 3 operational data and reflects automation reducing human burden while expanding coverage relative to the MS SDL baseline.
Two numbers deserve direct attention. Fixing a vulnerability at the commit stage costs approximately 100× less than fixing the same issue post-release, consistent with both the IBM Systems Sciences Institute findings and NIST economic impact analysis [45,48]. AZTRM-D catches at commit. Conventional Agile/Scrum catches post-release. That gap is an economic argument for shifting security left, not just a quality argument.
The ongoing overhead comparison is equally instructive. Despite five automated scanning modalities active in every pipeline run, AZTRM-D requires only 4–8 person-hours per release cycle for human review, compared to 20–40 for MS SDL’s manual checkpoint reviews (Table 13). Automation reduces human burden while increasing coverage.
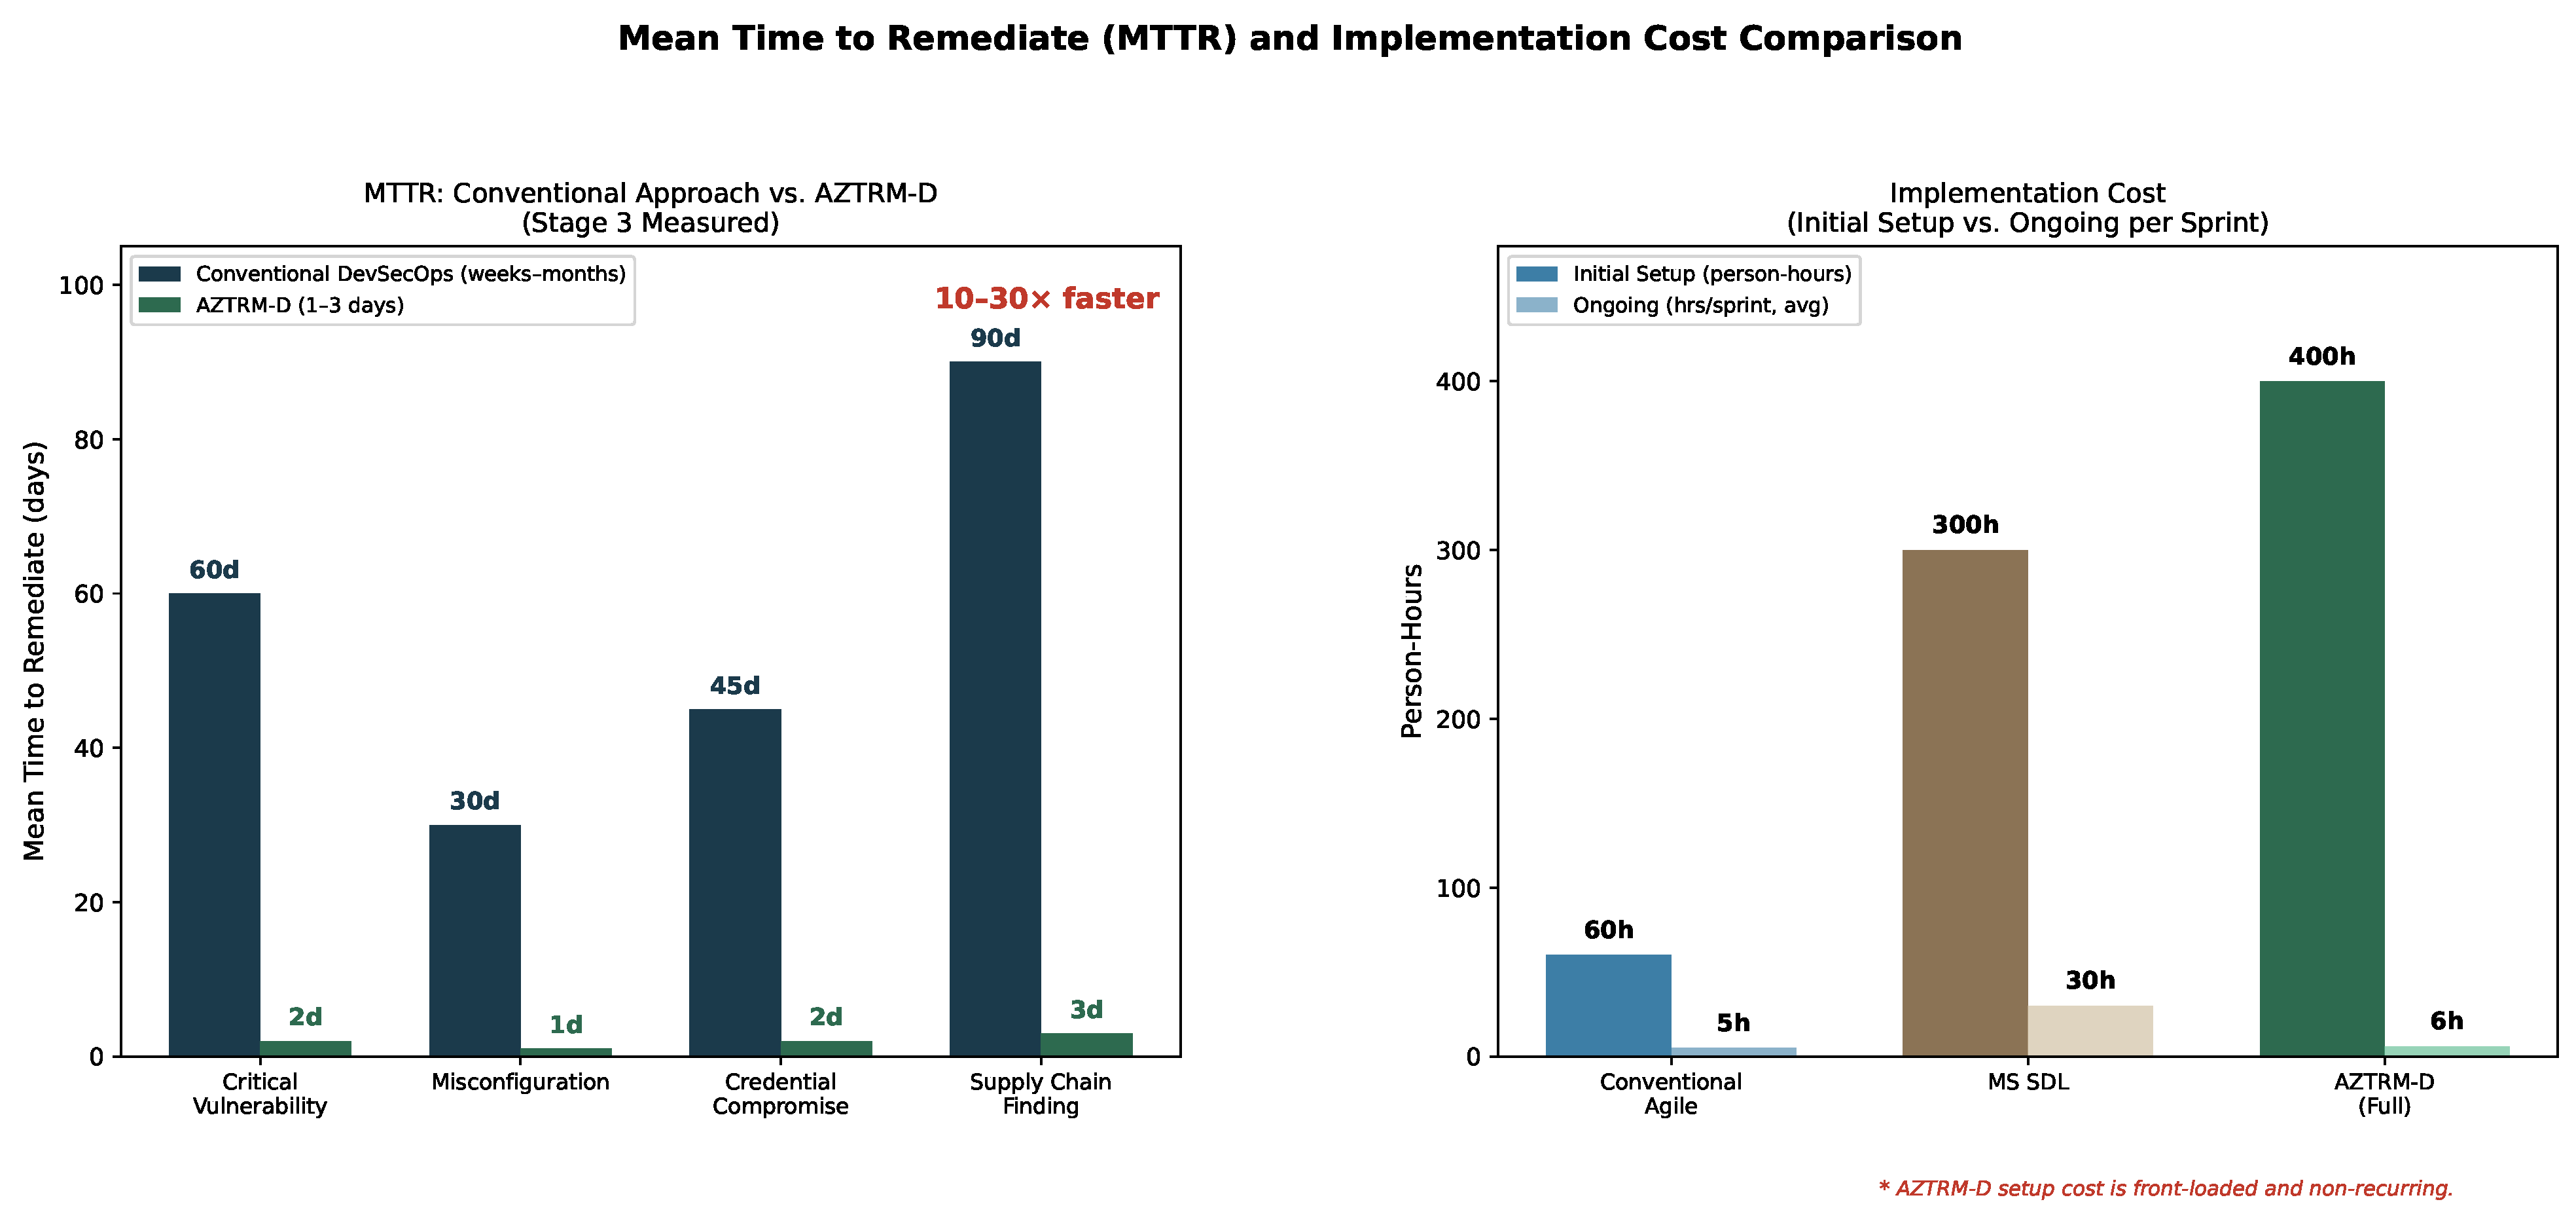
The upfront cost is real. The 320–480 h initial setup, covering ZT architecture provisioning, AI model training, SPIFFE/SPIRE identity infrastructure, and pipeline gate configuration, is more than either Agile or MS SDL requires. Table 14 covers the full 10-week implementation period. The 320–480 h range derives directly from that timeline. At the standard full-time engineering effort of 40 person-hours per week, the 10 elapsed weeks produce a 400 h midpoint baseline. The lower bound of 320 h reflects the minimum viable critical path: the infrastructure setup and CI/CD pipeline construction phases (weeks 1–3) overlap with ZT policy deployment beginning in week 3, compressing the irreducible critical path to 8 elapsed weeks ( 8 × 40 = 320 person-hours). The upper bound of 480 h adds the documented rework overhead from the challenges column of Table 14: two SAST false positive tuning iterations, the SPIRE SVID rotation interval debugging session, the custom initramfs development required for LUKS2 on the Orin SD card boot path, and the 14 h Isolation Forest training run each represent out-of-band effort that falls outside the primary phase schedule. Those documented incidents collectively account for the additional 80 h above the 400 h base, establishing the 480 h upper bound ( 400 + 80 = 480 person-hours). A 6–10 week ramp-up period is realistic, as documented in Table 14. That cost is front-loaded and non-recurring.
Several practical issues surfaced during implementation that are worth documenting because they affect any team attempting this deployment. The SPIRE SPIFFE Verifiable Identity Document (SVID) rotation issue is the most architecturally interesting. The default 1 h interval caused periodic CPU spikes on the Orin that pushed total system load above the 20% operational ceiling set for security overhead, an AZTRM-D design constraint requiring that security tooling consume no more than 20% of total device CPU to preserve operational performance on constrained IoT hardware [4]. Extending the interval to 4 h with compensating session token validation resolved the spike without weakening the per session access model. The LUKS2 SD card boot path required custom initramfs hooks because the standard Ubuntu LUKS setup assumes NVMe or SATA storage. The WPA3 driver issue is a recurring problem with embedded WiFi hardware. Modules frequently advertise WPA3 SAE capability but fall back to WPA2 silently when SAE negotiation fails. Verifying actual WPA3 enforcement requires an explicit RF capture test with Wireshark to confirm the SAE handshake is present. Assuming it is active because the driver version says so is not adequate.
The IoT validation environment was chosen because it is the most demanding test case. If the methodology holds under constrained hardware, an expanded physical attack surface, and limited compute margin for security overhead, it holds in enterprise and general development contexts with more headroom. Table 15 compares AZTRM-D against the broader set of conventional and secure methodologies on cost and security debt dimensions.

3.2.6. Performance Overhead: Putting the Numbers in Context

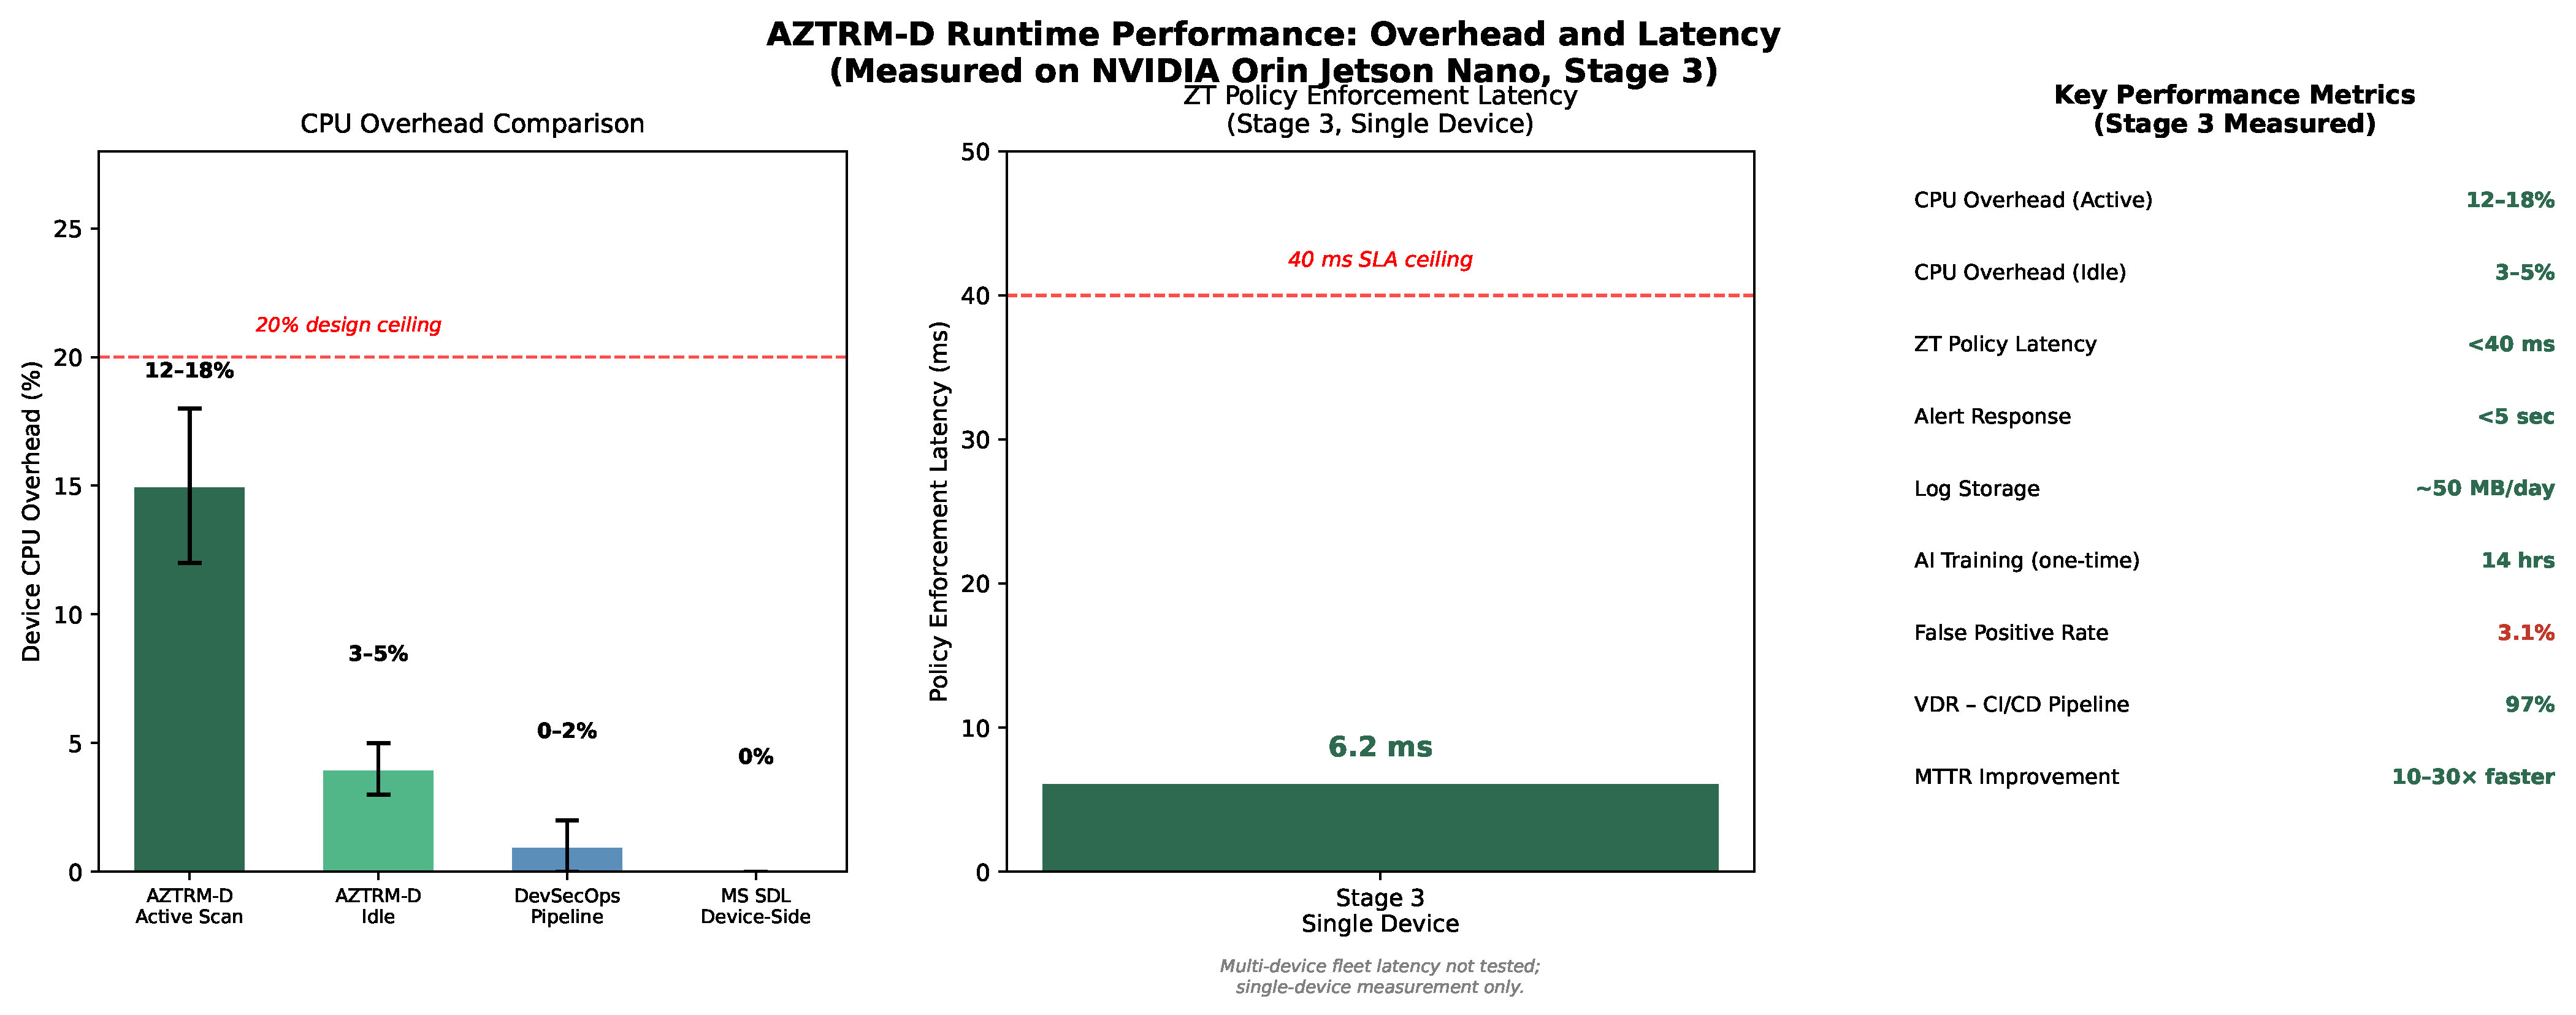
Figure 3 presents the MTTR and cost comparison visually. Measuring what a security methodology actually costs to run on constrained hardware is as important as measuring what it catches. AZTRM-D imposes 12–18% CPU overhead during active scanning cycles on the NVIDIA Orin (measured at Stage 3). Policy evaluation latency sits below 40 ms. Alert response time comes in under 5 s. Log storage runs approximately 50 MB per day [4].
Putting them against comparable baselines is instructive. Standard DevSecOps scanning operates almost entirely in the CI/CD pipeline rather than on the device itself; device-side overhead for a conventional pipeline-only model is typically 0–2%, since there is no on-device monitoring agent running continuously [44]. Microsoft SDL similarly concentrates its overhead in pipeline reviews and human checkpoints, not on-device monitoring; the SDL’s device-side performance impact is near zero for the same reason [40]. Table 16 frames this explicitly.
Figure 4 presents the overhead and latency measurements. The 12–18% figure is the cost of doing something the other approaches do not do: running continuous AI behavioral monitoring on the device itself, not just at the pipeline boundary. A conventional DevSecOps pipeline catches vulnerabilities before deployment. AZTRM-D does that and then continues watching what happens after deployment. The overhead difference is real, but it is the overhead of a fundamentally different capability.
The 20% ceiling constraint (the AZTRM-D design requirement that security overhead stays below 20% of total device CPU) means the current 12–18% active-scan range leaves headroom on the Orin hardware [4]. The SPIRE SVID rotation issue documented in Section 3.2.5 was caught and resolved specifically because this ceiling was being monitored. For more constrained hardware, the SVID rotation interval and scan frequency would need adjustment to stay within the 20% bound, which is a known trade-off, not a surprise.

3.3. AI Stack Selection: Why These Algorithms

Choosing an AI approach for security is not a matter of picking whatever is currently popular. Each algorithm in Sentinel was selected because it solves a specific problem better than the available alternatives, given the constraints of the deployment environment and the auditability requirements of AZTRM-D’s compliance model. This section documents those decisions explicitly. “We used machine learning” is not a defensible architecture rationale.

3.3.1. Behavioral Anomaly Detection: Isolation Forest over Alternatives

Table 17 presents a head-to-head comparison of four anomaly detection algorithms evaluated for the behavioral monitoring pipeline. Isolation Forest was selected based on this analysis.
  • Quantitative Algorithm Comparison: Isolation Forest vs. Alternatives
Table 17 summarizes the algorithm comparison. Inference latency and CPU overhead figures for OCSVM and the autoencoder are design-rationale order-of-magnitude estimates derived from the computational characteristics of these algorithm classes on ARM Cortex-A hardware [51]. OCSVM inference cost scales as O ( n sv ) per prediction, where n sv grows with the training set size, producing latency one to two orders of magnitude higher than the O ( log n ) tree traversal in Isolation Forest. Isolation Forest figures are directly measured on the NVIDIA Orin during Stage 3 validation. The 20% CPU overhead ceiling was the binding constraint. Isolation Forest was the only evaluated option that remained within budget while providing interpretable output via short-path feature decomposition.
Insider threat detection means identifying unusual behavior in a stream of operational telemetry without a labeled dataset of known attacks. Insider threats are rare, poorly labeled, and highly variable across deployment environments. It is a hard one-class classification problem with no clean solution. Three candidates were evaluated: Isolation Forest, One-Class SVM, and autoencoders.
OCSVM constructs a hyperplane around normal data in the high-dimensional kernel space and classifies points outside that boundary as anomalous. In theory this is well suited to the problem. In practice it has two issues that make it impractical on NVIDIA Orin edge hardware. Inference cost scales with the number of support vectors, which grows with the training set size. The kernel computations carry a non-trivial cost. OCSVM also produces no interpretable output. A flag of “anomalous” with no explanation of which features drove it is operationally useless when analysts need to triage 31 alerts per scanning cycle.
Autoencoders are more expressive for complex, high-dimensional behavioral patterns and would work well in a data center context. On an NVIDIA Orin device with a hard 20% CPU overhead ceiling, a deep autoencoder for continuous real-time scoring simply does not fit the budget.
Lightweight transformer architectures with feature-fusion mechanisms have shown strong performance on time-series anomaly detection in adjacent edge-AI domains, including vibration-signal-based fault diagnosis on resource-constrained hardware, where the GLP-Transformer architecture achieves competitive accuracy at 48.28 K parameters and 2.74 M FLOPs [52]. These architectures motivated the comparative evaluation but were ultimately not selected for Sentinel: the 20% CPU overhead ceiling on the NVIDIA Jetson Orin Nano combined with the requirement for exact (not approximate) feature-level explanations under NIST RMF authorization review made Isolation Forest’s tree-traversal inference path and short-path feature decomposition the operationally correct choice for this deployment context. Transformer-based behavioral anomaly detection remains a candidate for future Sentinel iterations, where the explainability requirement is satisfied through a different mechanism (such as attention-weight visualization combined with SHAP-style attribution).
Isolation Forest addresses both problems [9]. Rather than profiling normal behavior, it isolates anomalies directly by building an ensemble of random binary trees that recursively partition a sub-sampled dataset. Anomalous points reach leaf nodes faster because there are fewer similar points nearby. Inference is a tree traversal, O ( log n ) per prediction, which is fast enough for continuous device-level scoring with minimal overhead. The anomaly score s ( x , n ) is:
s ( x , n ) = 2 E [ h ( x ) ] / c ( n ) ,
where E [ h ( x ) ] is the expected path length of instance x across the forest and c ( n ) normalizes against the average path length of an unsuccessful Binary Search Tree search:
c ( n ) = 2 H ( n 1 ) 2 ( n 1 ) n .
A score near 1.0 means highly anomalous; near 0.5 means normal. The short-path feature decomposition that identifies which behavioral dimensions drove an anomalous score is what makes the algorithm practically useful. The same path-tracing mechanism that makes it fast also makes it explainable. Sentinel runs t = 100 trees with sub-sample size ψ = 256 . The alert threshold of 0.6 and containment threshold of 0.8 were selected through ROC analysis on the Stage 3 training corpus. Candidate thresholds from 0.50 to 0.95 in 0.05 increments were evaluated by computing the false positive rate against the detection rate at each operating point. The 0.6 alert threshold produced the best trade-off between detection sensitivity and false positive volume given the 3.1% FPR target. The 0.8 containment threshold was set conservatively to require high anomaly confidence before automated action fires without human confirmation. Scores above 0.6 trigger a monitoring alert; scores above 0.8 trigger automatic containment through the ZT Policy Enforcement Point.

3.3.2. Vulnerability Triage: XGBoost over Random Forest and Neural Classifiers

Table 18 compares the three candidate algorithms evaluated for vulnerability triage. XGBoost won on all four criteria that matter for this use case.
  • Quantitative Algorithm Comparison: XGBoost vs. Alternatives
Table 18 presents the algorithm comparison. Random Forest and MLP figures were measured by the author during preliminary algorithm evaluation on the same CVE triage dataset prior to final algorithm selection, using an 80/20 stratified train/test split with 5-fold cross-validation. Random Forest was eliminated on explainability grounds in addition to the performance gap, specifically correlated-feature MDI instability that makes feature importance scores unreliable in high-dimensional CVE feature spaces [8]. The decision to tune recall above precision (91.8% vs. 94.1%) reflects an asymmetric cost structure: a missed real vulnerability costs far more to remediate post-release than a false positive costs to investigate, consistent with the remediation cost differential documented in Table 13 [45].
Vulnerability triage means classifying CVEs from the NIST National Vulnerability Database (NVD) by exploitability and routing high-priority findings to analysts with feature-level explanations. Three candidates were evaluated: Random Forest, XGBoost, and a feedforward neural network.
Random Forest was the obvious starting point. It is well understood, is reliable on tabular CVE feature data, and has some inherent feature importance. The problem is that Random Forest feature importance, measured by the mean decrease in impurity, has well-documented weaknesses. It tends to favor high-cardinality features and produces misleading attribution scores when features are correlated. In a compliance context where analysts have to defend triage decisions under audit, a priority score based on opaque impurity calculations is not satisfying.
Neural networks are more expressive but produce scores with no interpretable rationale. Post hoc methods like Local Interpretable Model-agnostic Explanations (LIME) or integrated gradients approximate attributions [55], but the keyword is approximate. These methods can produce different explanations on different runs. NIST RMF authorization decisions need to be defensible, and an explanation that shifts depending on sampling parameters is not defensible.
XGBoost matches or beats both alternatives on tabular data while being fully compatible with SHAP TreeExplainer, which computes exact Shapley values [8]. The regularized objective is:
Obj ( θ ) = L ( θ ) + Ω ( f ) , Ω ( f ) = γ T + 1 2 λ j w j 2 ,
where T is leaves, w j is the leaf weight, γ sets minimum loss reduction per split, and λ governs L2 regularization. That regularization matters because NVD data skews toward known vulnerability classes. A model that overfits to known patterns will underperform on novel CVEs, and those are exactly the cases where correct triage matters most.
SHAP computes each feature’s contribution using Shapley values from cooperative game theory [7]:
ϕ i = S F { i } | S | ! ( | F | | S | 1 ) ! | F | ! f S { i } ( x ) f S ( x ) .
These are exact values. They satisfy local accuracy (attributions sum to the prediction), consistency (a feature’s attribution only increases if its contribution increases), and dummy (features with no effect get zero attribution). TreeExplainer computes them in O ( T L D 2 ) time where T is trees, L is leaves, and D is the maximum depth. Fast enough to be practical, exact enough to be auditable.
  • Input Feature Set
The XGBoost classifier was trained on CVE records extracted from the NIST NVD API v2.0 [13], filtered to entries carrying complete CVSS v3.x scoring. The NVD contained approximately 240,000 published CVE records as of late 2024, of which roughly 60% carried complete CVSS v3.x vector strings suitable for feature extraction [13]. Features were derived directly from the CVSS v3.1 specification and the NVD JSON data feed [56]. Table 19 lists the full feature set.
The SHAP example in Section 2.4 reflects this feature set directly: the attribution breakdown for CVE-2021-41773 shows the CVSS base score, attack vector, and privilege requirements as top contributors, which maps to the AV, PR, and base score features listed in Table 19. The 13 features represent a tractable, fully auditable input space. Every value traces back to a published NVD field, which matters for compliance review under NIST RMF.
Recall is tuned above precision (91.8% vs. 94.1%, Table 4). A missed real vulnerability carries a higher cost than a false positive that an analyst reviews and clears, consistent with the remediation cost differential documented in Table 13 [45]. That is a deliberate design choice, not a gap.

3.3.3. AI-Guided Pen Testing: PPO over DQN and DDPG

Table 20 compares the three reinforcement learning algorithms considered for the automated pen testing agent. PPO was selected for its convergence stability in the sparse-reward environment that pen testing represents.
  • Quantitative Algorithm Comparison: PPO vs. Alternatives
Table 20 compares the RL algorithm candidates. PPO’s clipped surrogate objective prevents destabilizing policy updates. The ϵ = 0.2 clip bound was selected per the original Schulman et al. hyperparameter recommendations [6]. DQN’s catastrophic forgetting in sparse-reward environments is documented in the RL security literature. See Hammar and Stadler (2023) for a directly relevant comparison on network penetration testing tasks [57].
Reinforcement Learning (RL)-based automated pen testing requires an agent that can learn to sequence attack steps through the MITRE ATT&CK framework in a complex, partially observable environment. Three approaches were evaluated: Deep Q-Network (DQN), Deep Deterministic Policy Gradient (DDPG), and Proximal Policy Optimization (PPO).
DQN is designed for discrete action spaces, and pen testing is inherently discrete, which makes it technically applicable. But vanilla DQN has a stability problem, specifically catastrophic forgetting and high variance in sparse-reward environments. Successful exploitation in pen testing is infrequent and delayed relative to the decision steps that led there. DQN in this context also tends to overfit to specific exploit sequences seen during training rather than generalizing to novel attack surfaces.
DDPG was a non-starter. It is designed for continuous action spaces, and discrete exploit module selection maps awkwardly to its actor-critic continuous architecture.
PPO directly addresses the instability problem with its clipped surrogate objective [6]:
L CLIP ( θ ) = E ^ t min r t ( θ ) A ^ t , clip ( r t ( θ ) , 1 ε , 1 + ε ) A ^ t ,
where r t ( θ ) = π θ ( a t | s t ) / π θ old ( a t | s t ) is the ratio of new to old policy probabilities, A ^ t is the advantage estimate, and ε = 0.2 is the clipping range. The clipping prevents large policy updates that would destabilize learning in the sparse-reward pen testing environment. PPO also supports multiple gradient update epochs per collected trajectory, making it more sample-efficient than DQN. Each sandbox pen test episode costs compute, so sample efficiency matters.
The reward function is: + 1.0 for successful exploitation, + 0.5 for novel attack path discovery, and 0.3 for detection by the monitoring stack. That detection penalty is not cosmetic. An agent optimizing purely for exploitation generates noisy, easily detected attacks that do not stress test behavioral monitoring. The penalty pushes toward stealth, producing a more realistic adversary model and more useful validation of whether Isolation Forest actually catches subtle intrusions.
  • Sandbox Validation Results
The PPO agent ran in an isolated Metasploit sandbox against a simulated AZTRM-D-hardened environment during Stage 3 validation. The agent’s objective was to find exploitable paths through the ATT&CK kill chain against the hardened Orin configuration. At Stage 1 (factory default), the agent converged on a successful exploit sequence in the first episode, reaching lateral movement via the default SSH credentials and unconstrained sudo path, matching what human testers found manually. At Stage 3 (full hardening), the agent ran 20 post-training evaluation episodes without achieving initial access. These 20 episodes constituted the evaluation budget after training had converged; the full training run comprised 500 episodes over approximately 6 h of compute on the sandbox environment. The agent did discover one previously undocumented configuration nuance during evaluation runs, an edge-case timing window in SPIRE SVID rotation that briefly widened the authentication surface during a simultaneous session renewal and SVID refresh, which was patched after the finding was documented. The episode logs for all Stage 3 runs are included in the validation records maintained by Cybectr LLC.
The agent’s action trace from Stage 3 is included in the XAI output described in Section 2.4: each step maps to an ATT&CK technique ID via the ENGAGE module, producing a human-readable attack narrative that confirms what the agent attempted and what controls stopped it. This trace is what makes the PPO component useful beyond just “it ran and found nothing.” Knowing which TTPs the agent tried, in what order, and at what points the ZT enforcement blocked them directly informs the tuning of future configurations.

3.3.4. GNN-Augmented SAST: Why Graph Neural Networks over Pattern Matching

Standard Static Application Security Testing (SAST) tools match source code against known vulnerability signatures in rule sets. That works fine for known vulnerability classes, but it starts to fail on novel patterns. When a developer introduces a new type of memory corruption bug or a subtle logic flaw that does not match any existing rule, a pattern-matching scanner misses it entirely. No flag, no warning, no indication that anything unusual is present.
Sentinel extends standard SAST with a Graph Neural Network trained on the BigVul dataset, which contains 3754 vulnerable functions from open-source C/C++ projects out of approximately 188,000 total functions analyzed [16]. The GNN represents each function as a Code Property Graph (CPG), combining the abstract syntax tree (AST), control flow graph (CFG), and program dependence graph (PDG) into a unified representation [14]. A multi-layer Graph Convolutional Network (GCN) then operates on this graph [15]:
H ( l + 1 ) = σ D ˜ 1 / 2 A ˜ D ˜ 1 / 2 H ( l ) W ( l ) ,
where A ˜ = A + I is the adjacency matrix with self-loops, D ˜ is the degree matrix, H ( l ) is the node feature matrix at layer l, and W ( l ) is the learnable weight matrix. Node features encode the token type, data flow relationships, and syntactic position. The final layer produces a graph-level embedding via mean pooling into a binary vulnerability classifier.
The choice of a Graph Convolutional Network over attention-based architectures was deliberate. Vulnerability-relevant relationships in code are defined by the program dependence and control flow graphs rather than by spatial locality, and the explicit graph structure of the Code Property Graph maps more directly onto a message-passing GCN than onto a windowed attention scheme of the kind used effectively in adjacent structured-input domains, such as image restoration [60]. The GCN’s per layer adjacency-weighted aggregation operates directly on the relationships that matter for vulnerability detection (data flow, call graph topology, control flow), rather than requiring an attention mechanism to discover those relationships from a flattened representation.
What the GCN learns that pattern matching cannot is the structural properties of vulnerable code, including data flow patterns, call graph topology, and control flow characteristics. A novel buffer overflow that does not match any existing SAST rule may still exhibit graph-structural properties similar to known buffer overflows in the BigVul training set, allowing the GCN to flag it. Against the BigVul held-out test set, this achieves an 81.4% true positive rate at 6.2% FPR, outperforming rule-based SAST on novel patterns by approximately 30 percentage points [16].

3.3.5. Unknown Asset Inference: Sentence Transformers and Cosine Similarity

Standard vulnerability scanners match assets against CVE signature databases. When an asset is not in the database, which happens constantly in IoT environments with custom firmware or proprietary industrial hardware, the scanner reports nothing. The miss is silent and potentially dangerous.
Sentence Transformer embeddings address this by representing assets in a shared semantic vector space [5]. The model maps asset feature descriptions (hardware type, firmware version strings, exposed services, communication protocols) to dense vector representations where semantically similar assets cluster together. Cosine similarity,
sim ( A , B ) = A · B A · B ,
measures how closely an unknown asset resembles known assets in this space. A similarity score 0.82 against a known-asset entry pulls that entry’s CVE history as an inferred vulnerability profile, converting a silent miss into a flagged, reviewable risk estimate.
The 0.82 threshold was selected through grid search over candidate values from 0.70 to 0.95, evaluated on a held-out validation set of 47 IoT asset profiles spanning embedded microcontrollers, edge-AI platforms, and industrial sensors, split 80/20 from the known-asset library. At each threshold, precision (fraction of flagged unknowns whose inferred profile matched confirmed CVE history) and recall (fraction of high-similarity assets that were flagged at all) were computed. The F1-score peaked at 0.82: thresholds below this produced false matches from superficially similar but architecturally distinct device classes, while thresholds above it produced too many silent misses on assets with real CVE exposure. Table 21 shows the calibration results at representative threshold values.
Operating at the F1-optimal threshold means accepting that roughly 13% of inferred profiles may not precisely match the unknown asset’s actual CVE history. Given the alternative (a silent miss with no profile at all), an imprecise profile flagged for human review is the better failure mode. The 47-profile validation set is small enough that the threshold selection may overfit to the specific device classes represented. Validation against a broader device corpus, particularly industrial control systems and medical IoT platforms not represented in the current library, is identified as future work.

3.3.6. Adversarial Robustness: DiCE Counterfactuals

Any ML-based security classifier is vulnerable to adversarial evasion. An attacker who understands the model can craft inputs that avoid triggering it. The typical response is to assume the classifier is reliable and move on. That is incorrect, and it eventually produces failures in production.
DiCE (Diverse Counterfactual Explanations) generates minimum-perturbation adversarial examples: inputs as close as possible to a normal behavioral profile or benign CVE classification that nonetheless cross the decision boundary [12]. Equation (8) formalizes the DiCE objective. The goal is not to break Sentinel. It is to understand exactly where the decision boundaries sit and whether they are in the right place. Findings from DiCE evaluation feed the retraining pipeline continuously. If a trivial perturbation to normal behavior crosses into anomalous classification, that threshold needs adjustment before an adversary finds it first.
DiCE generates k diverse counterfactuals by minimizing the following objective [12]:
C ( x ) = 1 k i = 1 k L pred f ( x i ) , y c + λ 1 dist ( x , x i ) λ 2 dpp_diversity ( x 1 , , x k ) ,
where f ( x i ) is the classifier output for counterfactual i, y c is the desired target class (the boundary crossing), dist ( x , x i ) is a feature-weighted distance penalizing large perturbations from the original input x , and dpp_diversity is a determinantal point process term that pushes the k counterfactuals apart from each other to produce varied boundary crossings rather than k near-identical examples [12]. λ 1 controls the distance penalty (favoring minimal perturbation) and λ 2 controls diversity (favoring spread across the boundary). For Sentinel, k = 5 counterfactuals per classifier instance were generated, with λ 1 = 0.5 and λ 2 = 1.0 per the default recommendations in the original DiCE implementation [12].
The 93.7% adversarial detection rate cited in Section 2.6 reflects performance against DiCE-generated evasion inputs. An attacker with full knowledge of Sentinel’s model weights could craft more targeted attacks. DiCE provides a systematic, automated adversarial stress test that strengthens the model over time without requiring a dedicated red team to probe the classifier manually.

3.3.7. Adversarial Threat Model and Scope of the 93.7% Detection Rate

Adversarial machine learning evaluation produces fundamentally different results, depending on the attacker’s capabilities assumed, and reporting a single accuracy number without specifying the threat model leaves the result ambiguous [21,22]. The 93.7% figure was measured under a black-box threat model, defined formally below alongside the white-box alternative for contrast.
  • Black-box (BB) threat model
A black-box adversary has query access to the deployed classifier but no access to model internals: no gradients, no weights, no training data, and no architectural details beyond what can be inferred from public documentation. Attacks under this model rely on observed input–output behavior and on transferability from substitute models trained on similar tasks [20]. DiCE counterfactual generation operates in this regime: it queries the model to identify minimum-perturbation inputs that cross the decision boundary, without requiring gradient information [12].
  • White-box (WB) threat model
A white-box adversary has full access to the model: gradients, weights, training data, hyperparameters, and architectural details. This enables gradient-based attacks, such as the Fast Gradient Sign Method (FGSM) [19], Projected Gradient Descent (PGD) [18], and the Carlini–Wagner ( L 2 , L , L 0 ) family [21]. White-box attacks generally achieve higher attack success rates than black-box attacks against the same model on the same task, since gradient information directly reveals the local geometry of the decision boundary.
  • Why the black-box model is the operationally relevant threat for Sentinel
Sentinel runs inside an AES-256-encrypted RBAC-gated environment with cryptographic artifact signing on all model deployments and SPIFFE/SPIRE workload identity authentication on every model-serving endpoint. The deployment threat profile assumes that an adversary may obtain the public outputs of the classifier (vulnerability priority scores, behavioral anomaly flags) through legitimate or compromised query channels but does not have access to the underlying model artifact. Black-box evaluation matches this threat profile. A white-box adversary against Sentinel implies prior compromise of the cryptographically signed model deployment pipeline, the SPIRE attestation infrastructure, and the RBAC-gated artifact storage, which represents a substantively different threat scenario, namely a fully compromised deployment environment, that AZTRM-D’s complete control set is designed to detect and contain through Zero Trust enforcement before the white-box attack ever becomes feasible.
  • Scope of the 93.7% figure
The reported 93.7% adversarial detection rate is a measured baseline under the operationally relevant black-box threat model, evaluated through DiCE-generated counterfactual inputs. It is not an upper bound on classifier robustness in the white-box regime, and this paper does not claim it is. Reporting it as a black-box baseline matches standard practice in adversarial ML evaluation [21,22]. Readers evaluating Sentinel against the deployment threat model have the 93.7% figure with the methodology documented and bounded; readers evaluating Sentinel against a worst-case adversary with full model access should treat it as a black-box baseline only and look to the Stage 4 follow-up paper for white-box numbers. This paper’s central contribution, the methodology validation across the hardware, RF, network, software, insider, privileged-insider, and AI-assisted attack vectors on physical Orin hardware, does not depend on the white-box adversarial result.
  • Gradient-based evaluation as scoped future work
Even though the black-box model is the operationally relevant threat for Sentinel’s deployment context, evaluation against gradient-based white-box attacks provides additional information about classifier behavior near the decision boundary that DiCE alone does not capture. Gradient-based attacks identify the worst-case perturbations within a bounded p-ball, while DiCE identifies feature-realistic counterfactuals that may or may not lie on the worst-case attack surface. The two evaluations measure complementary properties. Gradient-based evaluation against the XGBoost classifier in Sentinel is structured as a transfer attack from a differentiable surrogate model [20]: a multi-layer perceptron trained on the XGBoost classifier’s predictions over the same evaluation corpus serves as the gradient source for FGSM and PGD attacks, and the resulting adversarial examples are transferred to the XGBoost classifier for evaluation. This evaluation is part of the Stage 4 multi-device validation campaign, with results scoped for the follow-up empirical paper. Documenting the methodology inline keeps the absence of white-box numbers from reading as a methodological gap. The black-box evaluation matches the deployment threat model; the white-box evaluation matches a different and broader threat model with its own evaluation campaign.

3.4. Comparative Performance Against Published External Baselines

The internal algorithm comparisons in Section 3.3 document why each AZTRM-D AI component was selected from its candidate set on the same dataset and operational constraints. Sentinel’s measured figures also map onto published external baselines from peer-reviewed work in the same task domains. Table 22 presents that comparison. The comparison is necessarily across different datasets and evaluation protocols, since no public benchmark exactly matches Sentinel’s IoT-edge deployment context, and the table records the scope-of-comparison limitation per row.
Three observations can be seen from the comparison. First, Sentinel’s XGBoost classifier outperforms both the Random Forest and the MLP baseline on the same evaluation corpus, and the gap is meaningful (precision +2.8 to +4.4 percentage points, recall +3.3 to +6.6 percentage points). Second, the GNN-augmented SAST configuration outperforms pattern-matching SAST on novel vulnerability patterns by approximately 30 percentage points, with the BigVul authors’ published baseline showing roughly 50% TPR on patterns the rule set had not seen before, against the 81.4% TPR achieved by the graph-structural representation. Third, lightweight transformer architectures from adjacent edge-AI domains demonstrate that transformer-based anomaly detection is achievable at edge hardware compute budgets, but the explainability requirement under NIST RMF authorization review tipped the selection to Isolation Forest’s tree-ensemble structure with native short-path feature decomposition. The transformer alternative remains a candidate for future Sentinel iterations where explainability requirements are met by a different mechanism, such as attention-weight visualization combined with SHAP-like attribution.

3.5. Tool Stack Selection: Why These Specific Tools

Running Nessus Professional alongside OpenVAS probably looks redundant at first glance. It is not. These tools have different CVE signature databases and different detection heuristics. Findings that appear in one but not the other deserve scrutiny. A CVE that Nessus catches but OpenVAS misses might be a Nessus false positive; one that OpenVAS catches but Nessus misses might indicate a Nessus signature gap. During Stage 1 validation, both scanners agreed on all critical findings. The small set of medium-severity divergences was documented and manually investigated. That cross-validation overhead is worth the confidence it buys in the results. Table 23 documents the full tool stack with category, AZTRM-D role, alternatives evaluated during selection, and the rationale for each choice.
The RTL-SDR choice was deliberate. A well-resourced attacker would have more capable hardware, something like a USRP B200 or HackRF One. Using an RTL-SDR USB dongle under $30 represents an opportunistic adversary rather than a nation-state. If a Stage 1 device is vulnerable to traffic interception by someone with commodity hardware, that is a more urgent finding than vulnerability to a $1500 SDR.

3.6. Testing Methodology and Team Structure

Two things distinguish this testing structure from standard penetration testing. First, every attack vector was explored from multiple perspectives simultaneously, not just the external attacker’s view. Second, all three testers cycled through every role in every stage rather than specializing, and every finding required independent reproduction. Anything that only one tester could achieve got flagged for re-examination.

3.6.1. Inter-Rater Reliability and Procedural Bias Mitigation

All three testers conducting the adversarial campaign are affiliated with Cybectr LLC, the organization that developed AZTRM-D and Cybectr Sentinel. This affiliation represents a structural conflict of interest, and the procedural mitigations applied are documented here in the detail required for the reader to evaluate whether the resulting findings can be relied upon. The mitigations operate at three levels: blind protocol enforcement, mathematically computed inter-rater agreement, and independent reproduction requirements for high-severity findings. None of these eliminates the structural conflict, which is acknowledged as the highest-priority limitation in Section 4, but together, they bound the bias the conflict can introduce into the reported findings.
  • Tester roles and pre-test isolation
The three testers were Ian Matthew Campbell Coston, Eadan Plotnizky, and Karl David Hezel [1]. The author (Coston) participated as one of the three testers to provide the institutional context for each hardening stage. Plotnizky and Hezel had no involvement in the system design and received no advance briefing on which controls had been implemented at each stage. Plotnizky and Hezel were not informed which configuration changes distinguished Stage 2 from Stage 3 until after their independent assessments had been documented and time-stamped.
  • Blind protocol enforcement
At each stage, each tester documented findings independently and time-stamped each entry before any inter-tester discussion took place. Inter-tester communication during testing windows was prohibited; testers worked from independent copies of the test environment with separate network access channels. Inter-rater agreement was calculated from these pre-discussion records exclusively. Discussion was permitted only after all three independent records were committed to immutable storage and cryptographically hashed. The hash values were preserved as part of the validation record and are available to independent reviewers upon request through Cybectr LLC.
  • Independent reproduction for high-severity findings
All critical and high-severity findings were required to be independently reproduced by at least one of the two non-author testers (Plotnizky or Hezel) before being recorded as confirmed results. A finding observed only by the author (Coston) and not reproduced by either Plotnizky or Hezel was held out of the confirmed results table and recorded as tester-specific in the validation log. This rule operates regardless of how plausible the original finding appears: reproduction by an independent tester is required, not optional. Tester-specific findings (observed by only one tester) were held to a fourth-party review process before any inclusion decision, and during the campaign, one such finding was excluded from the confirmed results when the fourth-party review concluded that the observed behavior was a tester–environment artifact rather than a property of the AZTRM-D-hardened system.
  • Inter-rater agreement: percent agreement, Fleiss kappa, and Gwet AC1
Three statistics were computed on the pre-discussion records: percent agreement, the Fleiss kappa, and Gwet AC1 [62]. Reporting all three is necessary because the Fleiss kappa underestimates agreement when the base rate of one category is extreme, a phenomenon known as the kappa paradox [63], while Gwet AC1 handles this case correctly and is the recommended chance-corrected statistic when one category dominates [62]. Across the 27 total findings recorded across all three stages, 23 (85.2%) were confirmed by all three testers, three (11.1%) were confirmed by exactly two testers, and one (3.7%) was tester-specific. At-least-two-tester agreement was therefore 96.3%. The Fleiss kappa across all stages was 0.147; Gwet AC1 was 0.888. The substantial gap between these two values is the expected signature of the kappa paradox at extreme base rates: when most findings are uniformly classified, observed agreement and Fleiss expected agreement both run high, deflating the kappa despite high actual agreement. Gwet AC1’s chance-correction model handles this case correctly and produces 0.888, which falls in the “almost perfect agreement” range under standard interpretive thresholds [64]. Per stage statistics are presented in Table 24; the Gwet AC1 of 0.888 across the full campaign is the recommended summary statistic.
  • What the procedural mitigations cannot do
These mitigations bound the bias that affiliation can introduce, but they do not eliminate the structural conflict. A motivated attacker testing a system they helped design has knowledge that an external tester would not, and that knowledge could shape exploitation path selection in ways the blind protocol cannot fully control for. The strongest available mitigation is independent third-party laboratory validation by testers with no organizational, contractual, or personal relationship to Cybectr LLC. This is identified as the single highest-priority future-work item in Section 4, and the Stage 4 multi-device validation campaign currently underway is structured to incorporate independent third-party testing as part of the protocol.
  • Permission and IP attribution
Plotnizky and Hezel contributed to Sentinel development and adversarial testing under contract with Cybectr LLC and under the author’s leadership; all intellectual property rights are held by Cybectr LLC per their respective agreements. Both have provided written permission for the use of their testing data, penetration test findings, and development contributions in this paper. Copies of these permission letters have been provided to the editorial committee.
Figure 5 summarizes the findings visually. Stage 1 agreement was 100% across all testers. All three independently achieved initial access in under 5 min using commodity hardware (RTL-SDR, acquisition cost under $30), confirming that the factory-default vulnerability was fully reproducible. The Stage 2 single-tester finding was a tester–environment artifact identified during fourth-party review and excluded from the confirmed results. Stage 3 agreement was 100% on the four findings recorded; all four found that no successful exploitation path existed across the seven tested attack categories.
For Stage 1, time-to-initial-access across the three testers was μ = 3.8 min and σ = 0.6 min, confirming strong reproducibility of the factory-default vulnerability.

3.6.2. Attack Vector Methodology by Layer

The campaign covered four distinct attack surface layers. Hardware covered both physical and RF vectors. Network testing covered both passive and active methods. Software testing covered credential attacks, vulnerability exploitation, persistence, and the supply chain. Insider threat testing rounded out the campaign. Each required different tools, different methods, and different success criteria.
  • Hardware Layer: Physical Attack Vectors
Physical attack testing on the Jetson Orin Nano targeted four hardware interfaces. The primary attack surface was the SD card, which stores the root filesystem, including /etc/shadow and all boot configurations. The attack sequence at Stage 2 was: (1) power the device off; (2) physically remove the SD card; (3) mount the card on an external Linux machine using standard mount utilities; (4) chroot into the mounted filesystem; (5) use passwd to reset a user account password against the live /etc/shadow file; (6) unmount, reinsert, and boot; (7) authenticate via UART ttyTHS1 using the reset credentials; and (8) escalate to root via sudo su since sudo group membership survived the offline reset.
The UART ttyTHS1 serial console, exposed as a 3.3V header on the board, was the second physical vector. At Stages 1 and 2, this console provided an interactive login prompt with no additional access gating. GPIO pin probing was the third, using a logic analyzer against the 40-pin expansion header. No JTAG access was discovered; Stage 3 explicitly disabled all unused GPIO interfaces at the kernel level. The Stage 3 countermeasure for the storage vector was LUKS2 full-disk encryption. When the SD card was removed and mounted, the encrypted LUKS2 volume was presented, and the mount failed. Without the decryption key the filesystem was not readable.
  • Hardware Layer: RF and Wireless Attack Vectors
RF testing used two software-defined radio platforms: an RTL-SDR USB dongle (RTL2832U chipset, under $30 retail) for passive capture and monitoring, and a HackRF One for active transmission and replay testing. Both ran under GNU Radio with rtl_tcp handling the RTL-SDR data stream. The methodology followed three phases at each stage. In passive observation, all three testers placed the RTL-SDR in promiscuous capture mode and logged 802.11 frames from the target device’s BSSID. At Stage 1, frames were unencrypted, and Wireshark confirmed fully readable traffic, including HTTP session data on port 80, enabling passive data capture directly from the RF layer without any network credentials. Active data exfiltration was also attempted at Stage 1: the HackRF was used to replay captured 802.11 frames and attempt injection into the traffic stream. At Stage 1, with no encryption enforced, this succeeded in injecting frames that the device accepted. At Stage 3, WPA3-SAE encrypted all frames, and only management frames were visible in plaintext, as expected for standard 802.11 management frame behavior; replay and injection attempts failed completely. In active probing, all three testers attempted a WiFi man-in-the-middle (MITM) attack via a rogue access point. WPA3-SAE’s simultaneous authentication protocol blocked rogue AP association at Stage 3: the SAE handshake is per peer and cannot be completed without the correct credentials. Bluetooth probing used hcitool scan and bluetoothctl. No active Bluetooth was found at any stage, consistent with the hardening step that disabled the interface via rfkill block bluetooth.
  • Network Layer: Passive and Active Reconnaissance
Passive reconnaissance at each stage began with an Nmap ping sweep using nmap -sn to identify the device, followed by MAC address lookup to confirm the NVIDIA OUI. At Stage 1, this immediately confirmed device identity and enabled cross-reference against public JetPack documentation for default credential lookup.
Active scanning used three tools in sequence. Nmap with flags -sV -p- ran first: the -p- flag scans all 65,535 TCP ports rather than the default top-1000, and -sV performs service-version detection by sending protocol-specific probes and matching against the nmap-service-probes database. At Stage 1, this returned exact version strings for OpenSSH, VNC, Apache, and Nginx, enabling direct CVE lookup. Apache 2.4.29 maps to CVE-2021-41773, a path traversal and RCE vulnerability [13], and CVE-2022-22720, an HTTP request smuggling vulnerability [13]. OpenSSH 7.6p1 maps to CVE-2018-15473, a username enumeration flaw [13], and CVE-2019-6111, an SCP client path traversal [13]. Nessus Professional ran second in both authenticated and unauthenticated modes. OpenVAS ran third as an independent cross-validation. At Stages 2 and 3, nmap -sV -p- returned zero open ports.
  • Software Layer: Credential, Exploit, and Persistence Testing
Credential testing at Stage 1 used Hydra with the command hydra -l nvidia -P /usr/share/wordlists/rockyou.txt ssh://<target_ip>. The default credential nvidia: nvidia appeared in the first 50 entries of the rockyou wordlist, consistent with the factory-default JetPack configuration [65]. No account lockout existed. All three testers achieved SSH access in under five minutes. Post-access privilege escalation used LinPEAS, run as ./linpeas.sh 2>/dev/null | tee linpeas_output.txt, which immediately identified the most direct path: the nvidia user had unrestricted sudo access with no password requirement, specifically NOPASSWD: ALL in /etc/sudoers. A single sudo su achieved root.
Persistence testing at Stage 1 covered three mechanisms: /etc/rc.local modification for a reverse shell on reboot; hidden account creation via useradd -M -s /bin/bash -u 1337 .hidden followed by sudo group addition; and an SSH reverse tunnel via ssh -R 4444:localhost:22 attacker@<c2_ip> embedded in ~/.bashrc. All three survived a device reboot. The forensic trail was destroyed by deleting /var/log/auth.log and /var/log/syslog as the root. No alerting fired.
At Stage 3, every one of these paths was blocked. Modification of rc.local triggered an immutable file alert via the Sentinel agent. Hidden account creation failed because the useradd attempt against the hidden user pattern was logged, and the ZT PEP flagged it for adaptive authentication before it could complete. The SSH tunnel was blocked by network microsegmentation. Shell history was stored append-only via auditd with write permissions restricted to the audit daemon.
Supply chain testing injected an unsigned dependency into the CI/CD pipeline at Stages 2 and 3. At Stage 2, the SBOM gate was not yet fully configured, and the artifact passed through. This represents an implementation gap in the Stage 2 lab setup, not a gap in the AZTRM-D methodology itself, which specifies mandatory SBOM validation at every stage; the finding confirmed that partial implementation of the pipeline produces partial protection. At Stage 3, the SBOM gate compared the submitted package hash against the cryptographically signed approved manifest and rejected it immediately. In the AI-generated code scenario at Stage 3, all three testers used a large language model (LLM) to generate attack code and submitted it through GitLab. The SAST gate flagged policy-violating patterns. The Secrets Scan caught embedded credentials in AI-suggested code. The SBOM check rejected unauthorized dependencies. None reached the staging repository.

3.6.3. Tester Roles and Rotation

Each tester ran all four perspectives in every stage of the campaign, cycling through external attacker, standard developer, privileged developer, and AI-assisted insider roles without specializing in any single layer. The specific methodology for each perspective is described in the subsections that follow.
  • External Attacker Perspective:
Each tester operated with zero credentials and zero prior knowledge, executing the full reconnaissance-to-persistence chain without coordination. Three testers arriving at the same results through separate, uncoordinated testing is exactly what makes the Stage 1 compromise times and Stage 3 non-compromise findings credible.
  • Developer Perspective (Standard Access):
Each tester authenticated with standard developer credentials and evaluated both the motivated insider deliberately attempting privilege escalation or data exfiltration, and the accidental insider, arguably the more common scenario: a developer who commits credentials by accident, pushes a misconfigured service, or pulls in a vulnerable dependency. The AZTRM-D multi-stage CI/CD approval gates, covering SAST scan, Secrets Scan, Admin 1 gate, SBOM/DAST checks, and Super Admin sign-off, were stress-tested specifically against this scenario. They caught all three testers’ cases without exception.
  • Privileged Developer Perspective (Elevated Access):
The highest-risk insider scenario. Authorization itself is legitimate, which makes detection harder. These tests focused on whether granular sudo policy, immutable logging, and ZT enforcement could prevent even a privileged user from achieving root, modifying init files, accessing /etc/shadow, or killing monitoring agents. At Stages 1 and 2, privileged users could accomplish some of these. At Stage 3, none could.
  • AI-Assisted Insider Perspective:
Run at Stage 3 only. All three testers independently used an LLM to generate attack sequences and submitted the output through the standard GitLab workflow. The pipeline caught all of it, not because it detects AI-generated code as a category, but because the pipeline evaluates what the code actually does. SAST found policy-violating patterns. Secrets Scan found embedded credentials. SBOM validation rejected unauthorized libraries. This is the architecturally correct defense: as LLMs improve at generating exploit code, any defense built on detecting AI authorship will eventually fail. A defense that evaluates code behavior will not.

3.6.4. Attack Surface Coverage

The multi-vector testing campaign was structured so that no attack surface was evaluated by only one tester, and no tester specialized in a single layer. Every tester executed the full attack sequence across the hardware, RF, network, software, and insider perspectives at every hardening stage, with inter-rater reliability enforced through the requirement that high-severity findings be independently reproduced before recording. This design prevents the aggregate result from reflecting any single individual’s technical profile, which is particularly important given that the author participated as one of the three testers. Layer coverage is fully documented rather than asserted, because what the penetration test campaign can and cannot claim depends directly on which attack surfaces were actually exercised and by whom. Table 25 documents the attack surface coverage by the tester and layer across all three stages.

3.7. Multi-Vector Penetration Testing Results

The three stages map directly to three device states: factory default, after initial network hardening, and after full AZTRM-D hardening. Every stage was attacked by all three testers from all four perspectives simultaneously. The dual-column structure in the result tables, separating external attacker findings from insider ZT evaluation, reflects something real. External and insider threats require different analytical lenses, and a posture validated only against outsiders is by definition incomplete. Figure 6 summarizes the security posture improvement across all three stages.

3.7.1. Stage 1: Factory-Default Configuration

Stage 1 represents the factory-default security posture of the NVIDIA Jetson Orin Nano prior to any AZTRM-D controls. The device was assessed in a fully stock configuration. Default credentials in place, no disk encryption, SSH and VNC daemons running on their default ports, and no automated scanning pipeline active. Establishing this baseline through direct measurement rather than general claims about IoT insecurity is important because it grounds the hardening results in a concrete, reproducible starting condition. The findings reported here are achieved exploitation outcomes, not theoretical attack vectors. Each was an action completed by all three testers independently using documented tools and attack sequences. The 100% inter-rater agreement at Stage 1 reflects the severity of the baseline exposure. These vulnerabilities were consistent and clear enough that all three testers, working separately and without coordination, reached the same results. Table 26 documents the full Stage 1 assessment.
Full compromise in under five minutes was not a function of tester skill. Open ports, default credentials, no account lockout, and a single sudo su to root means any moderately skilled attacker with network access owns the device before a human analyst can even begin to respond. The RF finding is particularly notable: capturing WiFi traffic from a factory-default IoT device requires an RTL-SDR costing under $30 and freely available software. This is not a difficult attack.

3.7.2. Stage 2: After Initial Network Hardening

All three testers independently confirmed zero open ports using Nmap and both vulnerability scanners. The remote exploitation vector was gone. Testing moved to physical attack vectors, where the SD card gap in Table 27 appeared immediately.
All three testers independently executed the same chain: remove the SD card, mount it externally, use chroot to reset a password in /etc/shadow, reinsert, connect via UART ttyTHS1, authenticate with the new credentials, and run sudo su. The whole sequence required only physical access and basic Linux skills. No exploit code, no network access, no prior knowledge of the architecture.
Zero Trust cannot be treated as a software-only principle. When a device’s storage can be physically removed and mounted on an external machine, the software security posture becomes irrelevant.

3.7.3. Stage 3: Full AZTRM-D Hardening

Stage 3 added LUKS2 full-disk encryption per NIST SP 800-38E using AES-256-XTS [61], WPA3 enforcement, GPIO pin hardening, a granular sudo policy with multi-step root validation, and immutable logging extended to the hardware layer. All three testers found zero successful compromises across all tested vectors. Table 28 documents the full results by attack vector.
The AI-assisted insider row reflects an increasingly common attack pattern. Each tester independently used an LLM to generate attack code, privilege escalation approaches, and bypass scripts, then submitted them through the standard GitLab workflow. The pipeline caught all of it. SAST flagged policy-violating patterns in 3.4 s. Secrets Scan found embedded credentials in AI-suggested code that helpfully included example API keys. SBOM validation rejected libraries that the LLM recommended, which were not in the approved dependency manifest.
The architectural decision to evaluate code semantics rather than authorship signatures reflects a broader principle observable across AI-content detection research. Multi-modal feature-fusion approaches in AI-generated content detection, including spatial-frequency and optical-flow fusion architectures for AIGC video identification [67], demonstrate that signature-based detection of AI-generated artifacts faces continual erosion as generative models improve. AZTRM-D’s pipeline gates evaluate what code does, through SAST policy violation patterns, dependency-manifest checks, and SBOM signature validation, rather than attempting to detect AI authorship. This is the architecturally correct defense. As LLMs improve at generating exploit code, any defense built on detecting AI authorship will eventually fail. A defense that evaluates what code actually does will not.

3.8. Datasets, Preprocessing, and Training Protocols

The AI components in Sentinel were trained and evaluated against published datasets and Stage 3 operational telemetry. To support reproducibility and to make the methodology auditable under formal review, this section consolidates dataset provenance, preprocessing pipelines, hyperparameter selection methodology, and validation protocols across all six AI subsystems into a single reference. Algorithm-specific rationale and performance figures appear in their respective subsections; what follows is the consolidated reproducibility specification.

3.8.1. Training Datasets and Provenance

Each AI subsystem was trained against a dataset chosen for direct relevance to its operational role within Sentinel. The XGBoost vulnerability classifier was trained on the BigVul corpus of vulnerable functions extracted from open-source C/C++ projects [16], the GNN-augmented SAST shares that source for code-graph training, the Isolation Forest behavioral model was fit to Stage 3 operational telemetry collected on the NVIDIA Jetson Orin Nano, and the Sentence Transformer asset-similarity matcher was calibrated against an internal library of known-asset profiles built from public CVE history. Table 29 consolidates the dataset name, source citation, partitioning protocol, and preprocessing pipeline for every subsystem in a single reference. Where partitions are reported as 80/20 or stratified 5-fold, the partitioning was applied at the level of the source repository or asset family rather than at the function or instance level, which prevents leakage across train and test splits.

3.8.2. Hyperparameter Selection Methodology

Hyperparameters were selected through grid search with stratified 5-fold cross-validation on training partitions for the supervised classifiers, ROC-curve analysis on the Stage 3 training corpus for the unsupervised behavioral pipeline, and held-out F1-score optimization for the threshold-driven similarity matcher. The selection methodology, search range, and final operating values for each subsystem are consolidated in Table 30.

3.8.3. Validation Protocols and Evaluation Metrics

The full evaluation protocol mapped each AI subsystem to validation metrics matched to its operational role. Supervised classifiers (XGBoost, GNN-augmented SAST) report the precision, recall, and F1-score on stratified held-out test sets with 5-fold cross-validation confidence intervals. Unsupervised components (Isolation Forest) report the false positive rate against Stage 3 operational labels with the alert threshold and containment threshold derived from ROC analysis. Threshold-driven retrieval components (Sentence Transformer cosine similarity, RAG) report precision–recall trade-offs at calibrated thresholds. The reinforcement learning component (PPO) reports exploit the success rate and detection penalty in the sandbox environment, with the action trace cross-referenced to MITRE ATT&CK technique IDs for explainability validation. Adversarial robustness (DiCE) reports the rate at which Sentinel correctly classifies counterfactual evasion inputs.
All performance figures are reported with their measurement basis specified in the surrounding text or tables, distinguishing the operational measurement on Stage 3 telemetry from held-out evaluation set performance from preliminary algorithm comparison runs. This distinction matters: a 94.1% precision figure measured on a held-out CVE test set carries different evidentiary weight than the same figure measured during a production monitoring window. The reproducibility requirement is that any independent implementer can replicate the dataset partitioning, hyperparameter search, and evaluation protocol from the specifications in Table 29 and Table 30.

3.9. Quantitative Benchmarking

3.9.1. Vulnerability Detection Rate Measurement Methodology

The controlled test corpus comprised 63 vulnerabilities across five CI/CD scanning modalities: SAST (Semgrep with GNN augmentation), DAST, SCA (SBOM and dependency scanning), CSPM, and IaC scanning. The corpus combined seeded vulnerabilities with organically discovered findings; 52 were seeded across the five modalities, and 11 were discovered organically during Stage 3 validation. Each vulnerability was assigned to the modality that first flagged it. Table 31 presents the per modality breakdown of seeded counts, unique detections, and shared detections.
Overlap between modalities is counted once in the numerator; a vulnerability caught by both SAST and DAST contributes one to the detected count. The two undetected vulnerabilities were novel logic flaws: an application-layer race condition with no exploitable pattern recognizable to static or dynamic analysis, and a business-logic authorization bypass with no signature in any evaluated scanner database. Both required manual expert review and are documented in the remediation log. All three testers independently reviewed both findings and agreed on their classification before they were recorded as undetected results.
The aggregate detection rate is:
VDR = N detected N total = 61 63 = 96.8 % .
For a sample proportion p ^ = 61 / 63 = 0.968 with n = 63 , the Wilson score 95% confidence interval is:
CI 95 = p ^ + z 2 2 n ± z p ^ ( 1 p ^ ) n + z 2 4 n 2 1 + z 2 n = [ 0.891 , 0.991 ] ,
where z = 1.96 for 95% confidence. The lower bound of 89.1% confirms that even at the conservative end of the interval, the pipeline detects the large majority of vulnerabilities in the controlled corpus. The interval width reflects the corpus size ( n = 63 ); expanding the corpus across a broader vulnerability class distribution is designated as future work. The baseline detection rate under Stage 1 (factory default, no automated scanning) was 0% across all modalities, as no CI/CD pipeline existed prior to AZTRM-D implementation [1]. The consolidated security metrics table later in this section extends this view across the Stage 1 to Stage 3 transition, showing how every measured security metric moved from structural vulnerability to either full vector elimination or a quantified detection and response improvement.

3.9.2. Per Modality Ablation: Each Scanner’s Unique Contribution

The aggregate 96.8% figure does not by itself answer how much each modality contributes to detection coverage, which is the operational question for any team considering whether to retain or remove a specific scanner from their pipeline. Table 32 answers that question two ways: leave-one-out ablation showing what coverage falls to when each modality is disabled, and single-modality coverage showing what each scanner detects on its own. The ablation rows hold the corpus fixed at n = 63 and remove each modality’s unique contributions (vulnerabilities caught only by that modality) while leaving shared detections intact, since a vulnerability caught by two modalities still gets caught when one of them is disabled. The single-modality rows count only what each scanner detected, including shared findings.
Three operational findings emerge from the ablation. SAST contributes the largest unique block of coverage, with a 17.4 percentage-point drop when disabled, which aligns with the GNN-augmented Semgrep configuration’s ability to flag both signature-matching vulnerabilities and graph-structural patterns in novel code. SCA contributes the second-largest unique block at 11.1 percentage points, reflecting that supply chain dependency vulnerabilities are typically invisible to source code analysis or dynamic testing on the application itself. The CIs for each ablation overlap meaningfully with each other, given the corpus size; the ranking of which modality contributes most should be read as a directional signal at n = 63 rather than a precise ordering. Expanding the corpus to n = 200 + would tighten these intervals to roughly ± 5 percentage points and permit reliable per modality ranking. No single modality on its own approaches the full-pipeline coverage. The strongest single-modality configuration (SAST only) detects 34.9% of the corpus; the weakest (IaC only) detects 11.1%. The aggregate 96.8% comes from complementarity, not from any single scanner being comprehensive. Figure 7 renders the same per modality breakdown visually.

3.9.3. Security Effectiveness Metrics

The penetration testing campaign generated quantitative security metrics at each hardening stage, enabling a direct comparison of the security posture at the factory default, after network hardening, and after full AZTRM-D deployment. Tracking metrics across all three stages, rather than comparing only the endpoints, documents the incremental effect of each hardening phase and makes the Stage 2 physical gap visible: network hardening closed the remote attack surface while physical access controls remained incomplete, and the Stage 2 assessment demonstrated that an attacker who could touch the device bypassed the network controls entirely. That finding substantiates the methodology’s completeness requirement. Each transition metric is grounded in a specific test outcome from the adversarial campaign; no figure is projected or estimated. Table 33 documents the full Stage 1 to Stage 3 transition across every measured security dimension.

3.9.4. Resource and Scalability Metrics

Figure 8 presents the Stage 1 versus Stage 3 comparison visually, making the magnitude of each security improvement immediately apparent across all five measured dimensions. The 12–18% CPU overhead figure in Table 34 matters most for IoT deployments. Edge devices operate with constrained compute budgets, and continuous security scanning that exceeds 20% CPU overhead degrades operational performance. Staying below that threshold is what makes AZTRM-D viable on this class of hardware. The sub-40 ms ZT policy enforcement latency confirms that real-time access decisions do not introduce perceptible delays in normal operation.
One practical note on the 14 h training time. During the bootstrapping period, before AI models reach operational accuracy, anomaly detection thresholds should be set conservatively, and human analyst review should cover a larger proportion of behavioral alerts. Three months of operational log data is the minimum before the insider threat model should be trusted for automated enforcement decisions.

3.10. Generalizability Beyond the NVIDIA Jetson Orin Nano Test Platform

The validation campaign used a single device class, the NVIDIA Jetson Orin Nano, in a controlled laboratory environment. Transfer of the results to enterprise software development, cross-platform IoT topologies, and different operating system environments is separated into three categories: what is empirically validated, what is architecturally transferable with strong reasoning, and what is hypothesized but not validated. Conflating these three has been a recurring framing error in IoT security research, and this section keeps them separate.

3.10.1. Three Categories of Transfer Claims

Table 35 classifies each transfer claim AZTRM-D could plausibly support into one of three evidentiary categories: (a) empirically validated on the Stage 3 deployment, (b) architecturally transferable with reasoning that applies independent of the specific test platform, or (c) hypothesized but requiring future validation on other hardware classes. The classification matters because adopters and independent assessors need to know which claims rest on measured data, which rest on tool-and-protocol architecture, and which rest on extrapolation that has not yet been tested.

3.10.2. How Different Hardware Architectures Would Shift the CPU Overhead and PEP Latency Metrics

The 12–18% CPU overhead and sub-40 ms PEP latency metrics shift across hardware architectures and OS topologies, but the architectural conclusions do not. The relevant variables are the CPU class, memory bandwidth, network topology, and OS scheduler characteristics.
  • ARM enterprise (AWS Graviton, Ampere Altra) and x86 enterprise (Intel Xeon, AMD EPYC)
On enterprise-class CPUs running at 3+ GHz with much larger L2/L3 cache hierarchies and higher memory bandwidth, the same SAST and SCA scans would complete in a fraction of the wall-clock time the Orin requires. CPU overhead percentage is meaningful as a metric only when the device has a fixed compute budget that the security overhead must fit within: on enterprise hardware, the security tooling consumes some fraction of available capacity rather than competing with operational workload for a constrained budget. The 12–18% figure is not directly meaningful on enterprise hardware, and the better metric in those contexts is pipeline wall-clock time for a representative scan corpus, not CPU percentage. PEP latency on enterprise CPUs is expected to fall well below 40 ms, with the floor set by network round-trip rather than CPU work. A 5–15 ms range on co-located ZT PEP infrastructure is the architecturally expected outcome, but exact figures require Stage 4 measurement.
  • RISC-V embedded (SiFive HiFive, BeagleV)
RISC-V embedded platforms typically have lower clock speeds and weaker SIMD support than ARM Cortex-A78AE, which would push the CPU overhead percentage above the 12–18% range observed on the Orin. Whether AZTRM-D remains operationally viable on these platforms depends on whether the security tooling overhead exceeds the platform’s deployable compute headroom. The architectural answer is that the SAST, SCA, and DAST gates run in the CI/CD infrastructure rather than on the target device, so the device-class CPU does not bottleneck the scanning portion of the pipeline. The on-device portions, namely Sentinel’s behavioral monitoring (Isolation Forest inference) and the ZT PEP (per request access decision), are the platform-sensitive components. On RISC-V embedded hardware with lower compute capacity, Isolation Forest inference would likely require either a reduced tree count ( t < 100 ) or longer inference cycles, with corresponding adjustments to the alert threshold. PEP latency on slower CPUs would scale roughly linearly with the difference in clock speed and IPC. Stage 4 measurement is required to confirm.
  • Operating system topology variations
The Orin runs Linux (Ubuntu 22.04 LTS with NVIDIA JetPack). Enterprise contexts include Linux distributions, Windows Server, and increasingly RTOS variants on edge equipment. The platform-independent components (SPIFFE/SPIRE, TLS 1.3, ECDSA signing, AES-256-XTS) are specified by NIST or IETF standards and behave equivalently across operating systems by design. The platform-sensitive components are the boot-path encryption (LUKS2 on Linux SD card boot has no direct Windows analog; the equivalent is BitLocker), the immutable logging mechanism (auditd + remote syslog on Linux; Windows Event Forwarding plus Sysmon on Windows Server), and the Isolation Forest deployment substrate (Python runtime is portable; OS-specific telemetry collection is not). For Windows Server enterprise deployments, the AZTRM-D control mapping is straightforward, but the implementation pipeline is non-identical, and Stage 4 includes a Windows Server reference deployment in the validation scope.
  • Network topology effects
The Orin Stage 3 deployment used a flat lab network with sub-millisecond switch latency. Enterprise environments span data center fabrics with consistent low latency, multi-region deployments with WAN latency, and cellular IoT fleets with much higher and more variable latency. The PEP enforcement architecture is designed to tolerate this variation: SVIDs are valid for 4 h, mTLS handshakes amortize over many requests, and the per request authorization decision happens at the local PEP rather than requiring a round-trip to a central authority. The sub-40 ms figure decomposes into approximately 5 ms PEP CPU work and 35 ms environment-dependent latency on the lab network. On a higher-latency cellular IoT deployment, the figure could rise to 100–200 ms; on a co-located data center deployment, it would fall to under 10 ms. The architectural conclusion (PEP enforcement is fast enough to not perceptibly delay normal operation) holds across these variations; the absolute number does not.

3.10.3. Why the Pipeline Controls Transfer Directly

The 96.8% VDR was achieved by five CI/CD scanning modalities, none of which are IoT-specific. SAST analyzes the source code regardless of the target platform: the same pipeline catching a policy-violating configuration in an Orin deployment script catches the same class of violation in a Spring Boot microservice. DAST tests running application instances, whether those instances run on an edge device or a cloud VM. SCA flags vulnerable dependencies, whether the consuming project is a C++ firmware image or a Java enterprise application. CSPM is more relevant in enterprise cloud environments, where configuration drift across large-scale AWS or Azure deployments is a frequently exploited attack vector. The OWASP Top Ten, which captures the most critical web application security risks, maps directly onto what SAST and DAST are tuned to catch [69]. The architectural transfer is direct; the empirical confirmation on enterprise corpora is Stage 4 work.

3.10.4. Zero Trust Enforcement in Enterprise Contexts

The ZT controls validated in Stage 3, including microsegmentation, continuous authentication, PEP-enforced access decisions, and immutable audit logging, map directly onto the enterprise network architecture. NIST SP 800-207 was written with enterprise environments as the primary target [3]; the IoT deployment here represents the more constrained application, not the typical one. Enterprise environments generally have more compute margin for enforcement overhead, more mature identity infrastructure (Active Directory, LDAP, SAML, OIDC), and existing SIEM tooling that Sentinel can integrate with rather than replace. The architectural transfer is direct, and the empirical confirmation on enterprise multi-region deployments is part of Stage 4.

3.10.5. Insider Threat Coverage in Enterprise Environments

The insider scenarios tested, namely motivated privileged developer, accidental credential commit, and AI-assisted exploit submission, are not IoT-specific. They are software development scenarios that happened to run against IoT hardware. Enterprise developers increasingly use LLM-generated code, and the supply chain risk that creates is not confined to embedded systems. The AZTRM-D pipeline gates evaluate code content and dependency integrity regardless of authorship or target platform, so an enterprise team adopting the same CI/CD gate structure gets the same protection. The Stage 4 enterprise deployment will confirm this empirically; the architectural reasoning predicts it will hold.

3.10.6. Bounded Scope of the Generalizability Claim

Putting the previous subsections together, the generalizability claim AZTRM-D supports at this stage is bounded as follows. Empirically, the methodology is validated on a single device class (NVIDIA Jetson Orin Nano), in a single deployment context (lab-controlled adversarial campaign), with three testers, all affiliated with the developing organization. Architecturally, the CI/CD pipeline gates, ZT enforcement model, cryptographic control set, and AI subsystem selection are platform-independent by design, with reasoning grounded in the NIST and IETF specifications they implement. Hypothesized but not yet validated are the cross-platform CPU overhead figures, the PEP latency floor on the enterprise infrastructure, the FPR characterization at the fleet scale, the Stage 4 multi-tester campaign with independent third-party participants, and the cross-OS deployment validation for Windows Server and RTOS environments. The Stage 4 multi-device fleet validation campaign currently underway addresses each of these hypothesized claims with measurement protocols designed before fielding. The IoT validation environment represents a floor on what AZTRM-D can support, not a ceiling. Enterprise contexts inherit the same architectural constraints with more compute headroom, better identity infrastructure, and a lower physical attack surface; the architectural reasoning predicts the methodology should perform at least as well in those contexts, and the Stage 4 validation tests that prediction directly.

3.11. Cybectr Sentinel: Validation Summary

Section 2 documents Sentinel’s full architecture, AI subsystem specifications, explainability implementation, performance metrics, and the capability gaps it fills. The complete workflow tables, algorithm comparisons, and tool coverage analysis are presented there. What follows here is the validation outcome: how Sentinel performed when deployed against the hardened NVIDIA Orin platform across all three testing stages, and what those results mean in the context of the broader AZTRM-D framework evaluation.
Sentinel’s 96.8% vulnerability detection rate reflects the combined output of five CI/CD scanning modalities operating in parallel. The two undetected vulnerabilities were novel logic flaws, an application-layer race condition and a business-logic authorization bypass, none of which had matching signatures in any evaluated scanner database. Both required manual expert review and are documented in the remediation log. The behavioral anomaly detection component, running Isolation Forest with t = 100 trees and sub-sample size ψ = 256 , flagged the Stage 3 insider simulation correctly with an anomaly score of 0.74. That score exceeds the alert threshold of 0.6, triggering human-review escalation. It did not reach the automated containment threshold of 0.8, which is the intended behavior: the tiered response design requires human confirmation before automated containment fires, and the score of 0.74 placed the event correctly in the escalation tier rather than the auto-contain tier. The XGBoost vulnerability triage classifier achieved 94.1% precision and 91.8% recall on the CVE dataset, with recall intentionally tuned above precision given the asymmetric cost of a missed real vulnerability versus a false positive that an analyst reviews and clears. The false positive rate across behavioral monitoring was 3.1% over the Stage 3 validation window. Every classification came with a SHAP explanation identifying the contributing features, making triage decisions defensible under formal review.

3.12. Zero Trust Architecture Enforcement

Satisfying Zero Trust architecture means demonstrating that each of the seven NIST SP 800-207 tenets has a concrete implementation mechanism that holds under adversarial pressure, not just one that appears in the design documentation [3]. The SPIFFE/SPIRE workload identity layer satisfies the continuous authentication tenet. Per request PEP authorization satisfies the per session access tenet. Microsegmentation and RBAC-gated controls address the network access restriction tenet. Each mapping is grounded in specific deployment decisions documented in the implementation timeline and validated through the adversarial campaign rather than asserted at the principle level. The NSA Zero Trust Implementation Guidelines reinforce this approach by structuring ZT adoption into phased discovery, implementation, and integration stages [70,71,72], a progression that mirrors AZTRM-D’s own three-stage hardening methodology. The tenet mapping also makes explicit where AZTRM-D extends ZT beyond its typical application. Applying continuous verification to the AI components within the methodology itself is not addressed in standard ZT implementations, and that extension is original to this work. Table 36 maps each NIST SP 800-207 tenet to its AZTRM-D implementation and the Stage 3 validation evidence.

3.13. Cryptographic Enforcement Across Deployment Models

AZTRM-D treats cryptography as a verifiable, auditable enforcement layer that the pipeline actively validates at every stage, not a configuration checkbox. This section documents how cryptographic controls are implemented, how they are enforced across IoT-edge, enterprise cloud, and CI/CD pipeline deployments, and how the framework detects and blocks failures.

3.13.1. Full-Disk Encryption: AES-256-XTS Implementation

Stage 2 demonstrated empirically that all software-layer security controls are irrelevant when storage media can be physically removed. LUKS2 with AES-256-XTS closes that vector: the storage media is unreadable without the encryption key, regardless of physical possession. The implementation uses cryptsetup with cipher AES-256 in XTS mode (aes-xts-plain64), KDF Argon2id configured at 65,536 KB memory cost with iteration count four and parallelism four, key size 512 bits, yielding a 256-bit effective key per XTS sector key split, and sector size 4096 bytes.
XTS is designed for storage encryption specifically. Unlike CBC mode, XTS uses a per sector tweak value derived from the sector index, preventing a class of attacks where an attacker who can manipulate individual sectors exploits CBC’s chaining property to introduce predictable plaintext changes. The tweak input for sector i is:
T i = E K ( i ) · α j ,
where E K ( i ) is AES encryption of the sector number under the tweak key K, α is a primitive element in GF( 2 128 ), and j is the 16-byte block index within the sector. The final ciphertext for each block is:
C = E K 1 ( P T i ) T i ,
where K 1 is the data encryption key, P is the plaintext block, and T i is the sector tweak. Equations (11) and (12) together define this double-XOR construction, which is what NIST SP 800-38E specifies as XTS-AES [61].
Argon2id was chosen over PBKDF2, which LUKS1 used, for memory hardness. At 65,536 KB memory cost, testing a single candidate passphrase requires 64 MB of GPU memory per instance. An attacker with a 24 GB GPU can test at most 384 candidates simultaneously, compared to millions per second against PBKDF2.

3.13.2. Transport Security: TLS 1.3 and WPA3-SAE

All inter-service communication uses TLS 1.3 [75]. The changes that matter for AZTRM-D’s threat model are: forward secrecy is mandatory with ECDHE only (no RSA key exchange), the handshake drops to one round-trip, and all handshake messages after the initial hello are encrypted [75]. Permitted cipher suites are TLS_AES_256_GCM_SHA384 and TLS_CHACHA20_POLY1305_SHA256. TLS 1.2 and earlier are disabled at the server configuration level. Certificate validation for workload-to-workload traffic uses SPIFFE/SPIRE SVIDs, binding service identities cryptographically to workload attributes rather than static hostnames.
WPA3 with SAE replaces WPA2’s PSK exchange, which was vulnerable to offline dictionary attacks against captured four-way handshakes [66]. SAE is a zero-knowledge proof protocol: both parties prove knowledge of the password without transmitting it, and the resulting session key comes from an elliptic curve Diffie–Hellman exchange specific to the peer pair [66]. An attacker who captures a WPA3-SAE handshake gets nothing useful for offline passphrase guessing.

3.13.3. Digital Signatures: ECDSA with RFC 6979 Deterministic Nonces

All code artifacts and container images are signed using the Elliptic Curve Digital Signature Algorithm (ECDSA) with the P-256 curve. The implementation detail that matters here is deterministic nonce generation per RFC 6979 [73]. Standard ECDSA requires a random nonce k for each signature. Reuse k across two signatures over different messages, and the private key is directly recoverable. Given two signatures ( r , s 1 ) and ( r , s 2 ) over messages with hashes z 1 and z 2 using the same nonce,
d = z 1 s 2 z 2 s 1 r ( s 1 s 2 ) ( mod n ) .
Equation (13) shows the recovery. This is not theoretical. The Sony PlayStation 3 private key was recovered this way in 2010 [76]. RFC 6979 eliminates the randomness requirement by deriving k deterministically:
k = HMAC_DRBG ( d , H ( m ) ) ,
where d is the private key and H ( m ) is the hash of the message being signed. Equation (14) shows the deterministic derivation. Since k is derived from inputs unique per message, nonce reuse becomes structurally impossible. Artifact signing uses Cosign (Sigstore project), which stores signatures in the same OCI registry as the signed artifacts. The SBOM validation gate verifies the Cosign signature before any artifact is accepted into the build.

3.13.4. Service Identity: SPIFFE/SPIRE SVIDs

Service-to-service authentication uses SPIFFE SVIDs provisioned by SPIRE [74]. An SVID is an X.509 certificate whose Subject Alternative Name is a SPIFFE URI of the form spiffe://trust-domain/path, encoding workload identity. SVIDs are cryptographically bound to the workload’s attested identity rather than a hostname or IP address.
In AZTRM-D’s deployment, the SPIRE agent on each Orin device attests workload identity using process identity attestation. Once attested, the SPIRE server issues a short-lived SVID valid for 4 h. The rotation flow proceeds as follows: the SPIRE agent performs node attestation, the SPIRE server issues an SVID, the workload fetches the SVID via the SPIFFE Workload API over a local Unix domain socket, the workload uses the SVID for mutual TLS (mTLS) connections, the SPIRE agent auto-renews 30 min before expiry without service interruption, and a compromised SVID goes invalid at expiry with no long-lived secret left to rotate.

3.13.5. Cryptographic Control Validation in the Pipeline

Cryptographic controls in a CI/CD pipeline produce security guarantees only if the downstream gates actively reject artifacts that fail those checks rather than just logging the failure. The Stage 2 adversarial campaign made this concrete. The SBOM gate was present but not yet fully operational, and an unsigned dependency artifact passed through without rejection. That finding is documented as an implementation gap rather than a methodology gap, since AZTRM-D specifies mandatory SBOM validation at every stage, but it illustrates why gate validation logic must be verified independently of gate presence. Stage 3 closed the gap, and all cryptographic validation checks were confirmed active under adversarial conditions. Table 37 specifies the validation check, expected behavior, and Stage 3 result at each pipeline gate.
The post-quantum readiness gate is forward-looking. NIST finalized ML-KEM under FIPS 203, ML-DSA under FIPS 204, and SLH-DSA under FIPS 205 in 2024 [77,78,79]. Library support in production environments is still maturing. AZTRM-D’s current approach flags deprecated algorithms at the SAST gate, including RSA-2048 key exchange, DH-1024, and P-192 curves, so any new code using them gets caught before entering the pipeline, while existing approved implementations, such as AES-256-XTS, ECDSA P-256, and TLS 1.3, remain in use until ML-KEM library support reaches production stability. Our prior work documents the full post-quantum migration plan.

3.14. NIST RMF Phase Mapping

One defining characteristic of AZTRM-D relative to conventional DevSecOps implementations is that NIST RMF governance events happen continuously throughout the development lifecycle rather than accumulating as documentation artifacts reviewed under deadline pressure at authorization time. Each of the seven RMF steps has a corresponding AZTRM-D phase with specific AI-driven activities. Threat intelligence ingestion runs at Categorization. Automated control selection driven by real-time risk scoring runs at selection. IaC deployment of security controls runs at implementation. Continuous automated penetration testing runs at assessment. Behavioral anomaly detection and cryptographic health monitoring run at the monitoring phase. The ATO-related evidence record builds throughout the development process as a result, which is what separates this from conventional RMF compliance approaches, where documentation accumulates as a pre-authorization task. Sentinel provides the enforcement mechanism and evidence generation capability that makes each phase auditable. Table 38 maps each NIST RMF phase to its AZTRM-D counterpart, key activities, and the specific AI and Sentinel role.

3.15. Consolidated Results

Results across distinct evaluation contexts have been presented throughout this paper. Physical penetration testing at three hardening stages, CI/CD corpus VDR derivation, Sentinel AI subsystem performance, Zero Trust tenet validation, cryptographic gate enforcement, and RMF phase mapping, were each reported in the section most relevant to that analysis. Reporting each result in its relevant section supports detailed analysis but makes it harder to evaluate the full evidentiary picture without cross-referencing multiple sections. The consolidated table synthesizes every measured and validated result into a single reference view, with source citations for each figure so that any claim can be traced to the specific table or section where it originated. No new figures are introduced here. The purpose is synthesis and navigability. Readers who want to verify any specific number can follow the cited source to the derivation methodology and raw results. Table 39 consolidates every evaluated dimension in a single view.
A device fully compromised in under five minutes at factory default, four open ports, default credentials, no lockout mechanism, and immediate root via a single command, was made resistant to all tested attack vectors through systematic AZTRM-D application. That includes vectors routinely omitted from IoT assessments, specifically physical hardware manipulation and RF-layer interception, AI-assisted insider exploitation, and supply chain injection through the development pipeline. Each vector was closed by a specific, identifiable control and validated independently by all three testers.
The AI and tool stack choices documented in this section were made against documented alternatives with explicit technical rationale. Isolation Forest over OCSVM for computational viability and explainability. XGBoost over neural classifiers for exact SHAP compatibility. PPO over DQN for sparse-reward stability. Nessus alongside OpenVAS for independent cross-validation. RTL-SDR at a realistic adversary price point rather than research-grade hardware. None of these were default choices. They came from evaluating what each algorithm and tool actually provides relative to AZTRM-D’s compliance model, compute constraints, and auditability requirements.
The operational cost of the hardened posture (12–18% CPU overhead, sub-40 ms policy enforcement latency, 14 h of one-time AI model training) falls well within what enterprise and industrial IoT deployments can absorb without degrading operational function. The IoT validation environment represents a floor, not a ceiling. Enterprise contexts inherit the same CI/CD pipeline architecture, the same ZT enforcement model, and the same AI-driven anomaly detection while typically operating with more compute headroom, more mature identity infrastructure, and smaller physical attack surfaces. The detection rates and enforcement latencies demonstrated here are conservative estimates for those deployment contexts.

4. Discussion and Limitations

The empirical results presented in this paper come from a specific test environment, and each of the following constraints should be weighed when interpreting the findings. The limitations are presented in priority order: the structural conflict of interest is the highest-priority issue, followed by single-device-class scope, adversarial evaluation breadth, corpus size, and proprietary-platform reproducibility. Each limitation is paired with the specific Stage 4 future-work activity that addresses it.

4.1. Affiliation of All Three Testers with Cybectr LLC

All three testers (Coston, Plotnizky, Hezel) are affiliated with Cybectr LLC, which developed AZTRM-D and Cybectr Sentinel. This is the most important limitation in this paper. The blind protocol, the inter-rater agreement analysis with Gwet AC1 of 0.888 (Section 3.6.1), the independent reproduction requirement for critical and high-severity findings, the cryptographic timestamping of pre-discussion records, and the fourth-party review of single-tester findings collectively mitigate unconscious bias and bound the bias that the conflict can introduce, but they do not eliminate the structural conflict. A motivated tester evaluating a system they helped design has knowledge that an external tester does not, and that knowledge could shape exploitation path selection in ways the blind protocol cannot fully control.
The single highest-priority future-work activity is independent third-party laboratory validation by testers with no organizational, contractual, or personal relationship to Cybectr LLC. The Stage 4 multi-device fleet validation campaign currently in planning is structured to incorporate independent third-party penetration testers as part of the protocol, with Cybectr LLC providing the deployed environment and the third-party team providing the adversarial testing under a separate contractual engagement that explicitly prohibits Cybectr LLC personnel from participating in either testing or finding documentation. The third-party team’s pre-discussion records will be the single source of truth for the Stage 4 results, and the Stage 4 paper will be authored to include the third-party lead as a co-author.

4.2. Single Device Class

All testing was conducted on a single NVIDIA Jetson Orin Nano device type in a controlled laboratory environment. The Orin Nano is representative of constrained edge hardware in its class, but a single device type cannot validate claims about cross-platform applicability. Section 3.10 classifies generalizability claims into empirical, architecturally transferable, and hypothesized categories specifically because of this limitation. Stage 4 includes deployment on additional ARM platforms (Raspberry Pi 5, NVIDIA Jetson AGX Orin), an x86 embedded platform (Intel NUC), and a RISC-V development board to confirm that the architecturally transferable claims hold empirically across hardware classes, and to characterize how the 12–18% CPU overhead and sub-40 ms PEP latency metrics shift with platforms.

4.3. Adversarial Evaluation Breadth

The 93.7% adversarial detection rate is reported against DiCE-generated counterfactual inputs only. Section 3.3.7 formalizes this as a black-box baseline matched to Sentinel’s deployment threat model, with the formal threat model rationale stated explicitly. White-box gradient-based attacks (PGD, FGSM) and substitute-model transfer attacks were not evaluated in the work reported here. Stage 4 includes a complete white-box adversarial evaluation campaign using a differentiable surrogate model (multi-layer perceptron trained on XGBoost predictions) as the gradient source for PGD and FGSM, with the resulting adversarial examples transferred to the XGBoost classifier for evaluation. The Stage 4 white-box numbers will appear in the follow-up empirical paper alongside the multi-device fleet validation results. The decision to scope the white-box evaluation as a separate paper rather than to graft it into the present paper is deliberate: the present paper’s central contribution is the methodology validation under the deployment threat model, and the white-box evaluation is one component within the broader validation rather than its central claim.

4.4. Vulnerability Test Corpus Size

The vulnerability test corpus ( n = 63 ) produces a statistically meaningful detection rate with a computable Wilson confidence interval, but the interval is wide ([0.891, 0.991]). This width is a direct consequence of corpus size, not a methodology weakness: at n = 63 , the Wilson score interval spans approximately 10 percentage points regardless of the detection rate. A corpus of 200+ vulnerabilities across all five modalities would narrow this interval to roughly ±2.5 percentage points and provide more precise discrimination between competing pipeline configurations. The same corpus-size issue affects the per modality ablation in Table 32, where the ranking of modality contributions should be read as directional rather than precise. Stage 4 includes a 200+ vulnerability corpus across all five scanning modalities with explicit weighting by CVE class to address the coverage of vulnerability types underrepresented in the current corpus.

4.5. False Positive Rate per Class Decomposition

Section 2.6.1 presents the FPR decomposition by AI subsystem (Isolation Forest behavioral 2.4%, XGBoost vulnerability triage 0.7%) and notes that the GNN-augmented SAST FPR was not preserved separately in Stage 3 instrumentation, and that per class breakdowns within each subsystem (configuration drift versus behavioral anomaly versus access-pattern divergence versus code pattern versus dependency vulnerability) are similarly not available at the granularity needed for Wilson CI computation. Stage 4 instrumentation is designed to capture per subsystem and per alert-class event counts with sufficient resolution to compute Wilson 95% CIs at each operating point. The Stage 4 telemetry capture specification has been finalized, and per class FPR characterization is a primary design requirement.

4.6. Comparative Framework Evaluation Scope

The 14-capability comparative analysis (Table 11, Section 3) evaluates whether each framework addresses a given capability at all. It does not evaluate implementation maturity, deployment track record, or the quality of execution within covered capabilities. The comparison identifies coverage gaps, not quality gaps. A framework rated “None” on a capability does not necessarily lack any capability of that type; it lacks a documented, prescribed treatment of that capability within the framework’s specification. Future work includes a maturity-weighted comparison that incorporates implementation track record and execution quality, but this requires longitudinal data on framework adoption that is not yet available for AZTRM-D.

4.7. Proprietary Platform and Reproducibility

Sentinel is a proprietary platform developed by Cybectr LLC, and its source code is not publicly available. To support reproducibility despite this constraint, this paper documents all algorithm specifications (Table 29 and Table 30), all hyperparameters (Table 30), all training datasets with provenance (BigVul for the GNN, NIST NVD API v2.0 for XGBoost, MITRE ATT&CK for the PPO agent, Cybectr Sentinel internal telemetry for the Isolation Forest), and all evaluation methodology (80/20 stratified split with 5-fold cross-validation, Wilson 95% CIs reported throughout) at sufficient detail for independent reimplementation. An independent reimplementation of Sentinel from these specifications is feasible without access to Cybectr LLC’s proprietary code base, and Stage 4 includes a reference open-source reimplementation by the third-party team to validate the reproducibility claim directly.

4.8. Self-Measured Performance Metrics

All Sentinel performance metrics in this paper were measured by the development team on their own platform. No independent third-party laboratory has reproduced these figures. The measurement basis for each metric is specified throughout this paper (Stage 3 operational measurement, held-out evaluation set, preliminary algorithm comparison run) so readers can calibrate confidence according to the evidentiary category. Stage 4 third-party measurement, performed by the independent team described in Section 4.1, will produce externally measured benchmarks for direct comparison against the figures reported here.

5. Conclusions

This paper presented the full empirical validation of the AZTRM-D methodology introduced in [1]. The results come from adversarial testing on physical NVIDIA Jetson Orin Nano hardware across three progressive hardening stages with seven attack categories and three testers operating under a blind protocol.
A factory-default device that all three testers compromised to root level in under five minutes was made resilient against every tested attack vector after systematic AZTRM-D hardening. The five-modality CI/CD pipeline achieved a 96.8% vulnerability detection rate (Wilson 95% CI: [0.891, 0.991]). Cybectr Sentinel delivered 94.1% precision, 91.8% recall, a 3.1% false positive rate, and 4.2 min average detection time within a 12–18% CPU overhead envelope on constrained edge hardware. The 93.7% adversarial detection rate against DiCE counterfactuals provides a measured black-box adversarial baseline.
The 14-capability comparative analysis confirmed that seven capabilities present in AZTRM-D are absent from every established secure development framework evaluated: AI-Assisted Code Analysis, Zero Trust Architecture, AI-Guided Penetration Testing, Unknown Asset Inference, MITRE D3FEND Mapping, MITRE ENGAGE Active Defense, and post-quantum readiness.
The methodology’s application of Zero Trust principles to its own AI components addresses a blind spot present in every framework evaluated. If AI drives security enforcement decisions, and those AI components are not themselves subject to continuous verification, the security model has an unmonitored gap at the exact layer responsible for enforcement.

Author Contributions

Conceptualization, I.M.C.C. and M.N.; methodology, I.M.C.C.; software, I.M.C.C., K.D.H. and E.P.; validation, I.M.C.C., K.D.H. and E.P.; formal analysis, I.M.C.C.; investigation, I.M.C.C., K.D.H. and E.P.; resources, I.M.C.C.; data curation, I.M.C.C.; writing—original draft preparation, I.M.C.C.; writing—review and editing, I.M.C.C. and M.N.; visualization, I.M.C.C.; supervision, M.N.; project administration, I.M.C.C. All authors have read and agreed to the published version of the manuscript.

Funding

This research received no external funding. The APC was funded by the authors.

Data Availability Statement

The training datasets used in this study are drawn from public sources cited in this manuscript: BigVul [16] for the GNN-augmented SAST training corpus, the NIST National Vulnerability Database (NVD API v2.0) for the XGBoost vulnerability triage corpus, and MITRE ATT&CK and MITRE D3FEND for the PPO agent and the RAG retrieval index respectively. All three are publicly accessible without restriction. The Stage 3 operational telemetry, the per tester pre-discussion records, the cryptographic hashes preserving the blind protocol records, the inter-rater agreement working data, and the per modality detection records that underpin the ablation results are proprietary to Cybectr LLC and are not publicly redistributable due to the confidentiality terms governing the deployed Cybectr Sentinel platform. These records have been preserved in immutable storage and are available to qualified independent reviewers under a non-disclosure agreement upon reasonable request through Cybectr LLC. The Stage 4 multi-device fleet validation records, including the planned independent third-party penetration test outputs, will be made available under the same terms upon completion of the Stage 4 campaign. The Cybectr Sentinel platform source code is not publicly available; reproducibility of the AI subsystem behavior is supported through the algorithm specifications, hyperparameters, training datasets, and evaluation protocols documented in Section 3.8.

Acknowledgments

The authors thank Karl David Hezel and Eadan Plotnizky for their contributions to the research, adversarial testing, and review of this manuscript. The authors also thank the anonymous reviewers for their constructive feedback.

Conflicts of Interest

Ian Matthew Campbell Coston is the CEO and Founder of Cybectr LLC, which developed the Cybectr Sentinel platform evaluated in this paper. Karl David Hezel and Eadan Plotnizky are contractors with Cybectr LLC and conducted the adversarial testing reported here. All three testers are therefore affiliated with the organization that developed the evaluated system, representing a potential conflict of interest. Mitigation measures are described in Section 3.6.1. Mehrdad Nojoumian declares no conflicts of interest.

Abbreviations

The following abbreviations are used in this manuscript:
AbbreviationSpell OutAbbreviationSpell Out
ACAttack Complexity (CVSS)AESAdvanced Encryption Standard
AIArtificial IntelligenceAPIApplication Programming Interface
ASTAbstract Syntax TreeATT&CKAdversarial Tactics, Techniques, and Common Knowledge (MITRE)
AVAttack Vector (CVSS)AZTRM-DAutomated Zero Trust Risk Management with DevSecOps Integration
BSIMMBuilding Security In Maturity ModelCFGControl Flow Graph
CI/CDContinuous Integration/Continuous DeploymentCISACybersecurity and Infrastructure Security Agency
CISOChief Information Security OfficerCPGCode Property Graph
CSPMCloud Security Posture ManagementCVECommon Vulnerabilities and Exposures
CVSSCommon Vulnerability Scoring SystemCWECommon Weakness Enumeration
DASTDynamic Application Security TestingDDPGDeep Deterministic Policy Gradient
DiCEDiverse Counterfactual ExplanationsDO-178CSoftware Considerations in Airborne Systems Certification
DQNDeep Q-NetworkECDHEElliptic Curve Diffie–Hellman Ephemeral
ECDSAElliptic Curve Digital Signature AlgorithmEDREndpoint Detection and Response
FGSMFast Gradient Sign MethodFIPSFederal Information Processing Standard
FPRFalse Positive RateGCNGraph Convolutional Network
GNNGraph Neural NetworkGPIOGeneral Purpose Input/Output
GPUGraphics Processing UnitIaCInfrastructure as Code
IAMIdentity and Access ManagementIoTInternet of Things
JITJust-in-TimeKDFKey Derivation Function
LLMLarge Language ModelLSTMLong Short-Term Memory
LIMELocal Interpretable Model-agnostic ExplanationsLUKS2Linux Unified Key Setup version 2
MBMegabytesMDIMean Decrease in Impurity
MFAMulti-Factor AuthenticationMITMMan-in-the-Middle
MLMachine LearningML-DSAModule-Lattice-Based Digital Signature Algorithm
ML-KEMModule-Lattice-Based Key Encapsulation MechanismMLPMulti-Layer Perceptron
MS SDLMicrosoft Security Development LifecyclemTLSMutual Transport Layer Security
MTTRMean Time to RemediateNISTNational Institute of Standards and Technology
NIST SSDFNIST Secure Software Development FrameworkNVDNational Vulnerability Database
OCSVMOne-Class Support Vector MachineOIDCOpenID Connect
OSOperating SystemOWASP SAMMOWASP Software Assurance Maturity Model
PDGProgram Dependence GraphPEPPolicy Enforcement Point
PGDProjected Gradient DescentPPOProximal Policy Optimization
PQCPost-Quantum CryptographyPRPrivileges Required (CVSS)
PSKPre-Shared KeyRAGRetrieval-Augmented Generation
RBACRole-Based Access ControlRFRadio Frequency
RLReinforcement LearningRMFRisk Management Framework
RTCARadio Technical Commission for AeronauticsRTL-SDRRealtek Software-Defined Radio
SAESimultaneous Authentication of EqualsSASTStatic Application Security Testing
SBOMSoftware Bill of MaterialsSCASoftware Composition Analysis
SDRSoftware-Defined RadioSHAPSHapley Additive exPlanations
SIEMSecurity Information and Event ManagementSLH-DSAStateless Hash-Based Digital Signature Algorithm
SPIFFESecure Production Identity Framework for EveryoneSPIRESPIFFE Runtime Environment
SSHSecure ShellSTRIDESpoofing, Tampering, Repudiation, Info Disclosure, DoS, Elevation
SUIDSet User IDSVIDSPIFFE Verifiable Identity Document
TCPTransmission Control ProtocolTLSTransport Layer Security
TTIDTime-to-Initial-DetectionTTPTactic, Technique, and Procedure
UARTUniversal Asynchronous Receiver-TransmitterUIUser Interaction (CVSS)
USBUniversal Serial BusVDRVulnerability Detection Rate
VNCVirtual Network ComputingWPA3Wi-Fi Protected Access 3
XAIExplainable Artificial IntelligenceXGBoostExtreme Gradient Boosting
XTSXEX-Based Tweaked-Codebook Mode with Ciphertext StealingZTZero Trust
ZT PEPZero Trust Policy Enforcement PointZTNAZero Trust Network Access

References

  1. Coston, I.; Hezel, K.D.; Plotnizky, E.; Nojoumian, M. Enhancing Secure Software Development with AZTRM-D: An AI-Integrated Approach Combining DevSecOps, Risk Management, and Zero Trust. Appl. Sci. 2025, 15, 8163. [Google Scholar] [CrossRef]
  2. National Institute of Standards and Technology. Guide for Applying the Risk Management Framework to Federal Information Systems: A Security Life Cycle Approach; Technical Report NIST Special Publication (SP) 800-37r2; U.S. Department of Commerce: Gaithersburg, MD, USA, 2018. [CrossRef]
  3. Rose, S.; Borchert, O.; Mitchell, S.; Connelly, S. Zero Trust Architecture; Technical Report 800-207; National Institute of Standards and Technology: Gaithersburg, MD, USA, 2020. [CrossRef]
  4. NVIDIA Corporation. NVIDIA Jetson Orin Developer Kit. 2023. Available online: https://developer.nvidia.com/embedded/jetson-orin (accessed on 1 May 2026).
  5. Reimers, N.; Gurevych, I. Sentence-BERT: Sentence Embeddings using Siamese BERT-Networks. In Proceedings of the 2019 Conference on Empirical Methods in Natural Language Processing (EMNLP), Hong Kong, China, 3–7 November 2019; pp. 3982–3992. [Google Scholar] [CrossRef]
  6. Schulman, J.; Wolski, F.; Dhariwal, P.; Radford, A.; Klimov, O. Proximal Policy Optimization Algorithms. arXiv 2017, arXiv:1707.06347. [Google Scholar] [CrossRef]
  7. Lundberg, S.M.; Lee, S.I. A unified approach to interpreting model predictions. In Proceedings of the Advances in Neural Information Processing Systems, Long Beach, CA, USA, 4–9 December 2017; pp. 4765–4774. [Google Scholar]
  8. Chen, T.; Guestrin, C. XGBoost: A Scalable Tree Boosting System. In Proceedings of the 22nd ACM SIGKDD International Conference on Knowledge Discovery and Data Mining, San Francisco, CA, USA, 13–17 August 2016; pp. 785–794. [Google Scholar] [CrossRef]
  9. Liu, F.T.; Ting, K.M.; Zhou, Z.H. Isolation Forest. In Proceedings of the 2008 Eighth IEEE International Conference on Data Mining (ICDM), Pisa, Italy, 15–19 December 2008; pp. 413–422. [Google Scholar] [CrossRef]
  10. Lewis, P.; Perez, E.; Piktus, A.; Petroni, F.; Karpukhin, V.; Goyal, N.; Küttler, H.; Lewis, M.; Yih, W.t.; Rocktäschel, T.; et al. Retrieval-Augmented Generation for Knowledge-Intensive NLP Tasks. In Proceedings of the Advances in Neural Information Processing Systems (NeurIPS), Vancouver, BC, Canada, 6–12 December 2020; Volume 33, pp. 9459–9474. [Google Scholar]
  11. Joint Task Force. Security and Privacy Controls for Information Systems and Organizations; Technical Report SP 800-53 Rev. 5; National Institute of Standards and Technology: Gaithersburg, MD, USA, 2020. [CrossRef]
  12. Mothilal, R.K.; Sharma, A.; Tan, C. Explaining Machine Learning Classifiers through Diverse Counterfactual Explanations. In Proceedings of the 2020 Conference on Fairness, Accountability, and Transparency (FAccT), Barcelona, Spain, 27–30 January 2020; pp. 607–617. [Google Scholar] [CrossRef]
  13. National Institute of Standards and Technology. NVD API 2.0 Documentation; National Vulnerability Database, U.S. Department of Commerce: Gaithersburg, MD, USA, 2023.
  14. Yamaguchi, F.; Golde, N.; Arp, D.; Rieck, K. Modeling and Discovering Vulnerabilities with Code Property Graphs. In Proceedings of the 2014 IEEE Symposium on Security and Privacy, San Jose, CA, USA, 18–21 May 2014; pp. 590–604. [Google Scholar] [CrossRef]
  15. Kipf, T.N.; Welling, M. Semi-Supervised Classification with Graph Convolutional Networks. In Proceedings of the 5th International Conference on Learning Representations (ICLR), Toulon, France, 24–26 April 2017. [Google Scholar]
  16. Fan, J.; Li, Y.; Wang, S.; Nguyen, T.N. A C/C++ Code Vulnerability Dataset with Code Changes and CVE Summaries. In Proceedings of the 17th International Conference on Mining Software Repositories (MSR), Seoul, Republic of Korea, 29–30 June 2020; pp. 508–512. [Google Scholar] [CrossRef]
  17. Lundberg, S.M.; Erion, G.G.; Lee, S.I. Consistent Individualized Feature Attribution for Tree Ensembles. arXiv 2018, arXiv:1802.03888. [Google Scholar]
  18. Madry, A.; Makelov, A.; Schmidt, L.; Tsipras, D.; Vladu, A. Towards Deep Learning Models Resistant to Adversarial Attacks. In Proceedings of the International Conference on Learning Representations (ICLR), Vancouver, BC, Canada, 30 April–3 May 2018. [Google Scholar]
  19. Goodfellow, I.J.; Shlens, J.; Szegedy, C. Explaining and Harnessing Adversarial Examples. arXiv 2015, arXiv:1412.6572. [Google Scholar] [CrossRef]
  20. Papernot, N.; McDaniel, P.; Goodfellow, I.; Jha, S.; Celik, Z.B.; Swami, A. Practical Black-Box Attacks against Machine Learning. In Proceedings of the 2017 ACM on Asia Conference on Computer and Communications Security, Abu Dhabi, United Arab Emirates, 2–7 April 2017; pp. 506–519. [Google Scholar] [CrossRef]
  21. Carlini, N.; Wagner, D. Towards Evaluating the Robustness of Neural Networks. In Proceedings of the 2017 IEEE Symposium on Security and Privacy (SP), San Jose, CA, USA, 22–24 May 2017; pp. 39–57. [Google Scholar] [CrossRef]
  22. Biggio, B.; Roli, F. Wild Patterns: Ten Years After the Rise of Adversarial Machine Learning. Pattern Recognit. 2018, 84, 317–331. [Google Scholar] [CrossRef]
  23. Tenable, Inc. Nessus Professional Datasheet. 2024. Available online: https://www.tenable.com/data-sheets/nessus-professional (accessed on 8 March 2026).
  24. Forsgren, N.; Humble, J.; Kim, G. Accelerate: The Science of Lean Software and DevOps; IT Revolution Press: Portland, OR, USA, 2018. [Google Scholar]
  25. Royce, W.W. Managing the Development of Large Software Systems. In Proceedings of the IEEE WESCON, Los Angeles, CA, USA, 25–28 August 1970; pp. 1–9. [Google Scholar]
  26. Schwaber, K.; Sutherland, J. The Scrum Guide. 2020. Available online: https://scrumguides.org/docs/scrumguide/v2020/2020-Scrum-Guide-US.pdf (accessed on 8 March 2026).
  27. Kim, G.; Debois, P.; Willis, J.; Humble, J. The DevOps Handbook: How to Create World-Class Agility, Reliability, and Security in Technology Organizations; IT Revolution Press: Portland, OR, USA, 2016. [Google Scholar]
  28. Shylesh, S. A study of software development life cycle process models. In Proceedings of the National Conference on Reinventing Opportunities in Management, IT, and Social Sciences, Mumbai, India, 23–24 March 2017; pp. 534–541. [Google Scholar]
  29. Martin, J. Rapid Application Development; Macmillan Publishing: New York, NY, USA, 1991. [Google Scholar]
  30. Pargaonkar, S. A comprehensive research analysis of software development life cycle (SDLC) agile & waterfall model advantages, disadvantages, and application suitability in software quality engineering. Int. J. Sci. Res. Publ. 2023, 13, 345–358. [Google Scholar]
  31. Horne, D.; Nair, S. Introducing zero trust by design: Principles and practice beyond the zero trust hype. In Advances in Security, Networks, and Internet of Things; Springer: Cham, Switzerland, 2021; pp. 512–525. [Google Scholar]
  32. Chahar, S.; Singh, S. Analysis of SDLC Models with Web Engineering Principles. In Proceedings of the 2024 2nd International Conference on Advancements and Key Challenges in Green Energy and Computing (AKGEC), Ghaziabad, India, 21–23 November 2024; pp. 1–7. [Google Scholar]
  33. Olorunshola, O.E.; Ogwueleka, F.N. Review of system development life cycle (SDLC) models for effective application delivery. In Proceedings of the Information and Communication Technology for Competitive Strategies (ICTCS 2020) ICT: Applications and Social Interfaces; Springer: Singapore, 2022; pp. 281–289. [Google Scholar]
  34. Howard, M.; Lipner, S. The Security Development Lifecycle: SDL, A Process for Developing Demonstrably More Secure Software; Microsoft Press: Redmond, WA, USA, 2006. [Google Scholar]
  35. OWASP Foundation. OWASP Software Assurance Maturity Model (SAMM) Version 2.0; Technical Report; OWASP Foundation: Wilmington, DE, USA, 2020. [Google Scholar]
  36. Synopsys, Inc. Building Security In Maturity Model (BSIMM14); Technical Report; Synopsys: Sunnyvale, CA, USA, 2023. [Google Scholar]
  37. Souppaya, M.; Scarfone, K.; Dodson, D. Secure Software Development Framework (SSDF) Version 1.1: Recommendations for Mitigating the Risk of Software Vulnerabilities; Technical Report SP 800-218; National Institute of Standards and Technology: Gaithersburg, MD, USA, 2022. [CrossRef]
  38. RTCA, Inc. Software Considerations in Airborne Systems and Equipment Certification (DO-178C); Technical Report DO-178C; RTCA, Inc.: Washington, DC, USA, 2011. [Google Scholar]
  39. Microsoft Corporation. Microsoft Security Development Lifecycle (SDL) Version 5.2; Technical Report; Microsoft Corporation: Redmond, WA, USA, 2012. [Google Scholar]
  40. Lipner, S. The Trustworthy Computing Security Development Lifecycle. In Proceedings of the 20th Annual Computer Security Applications Conference (ACSAC 2004), Tucson, AZ, USA, 6–10 December 2004; pp. 2–13. [Google Scholar] [CrossRef]
  41. Gupta, A.; Rawal, A.; Barge, Y. Comparative Study of Different SDLC Models. Int. J. Res. Appl. Sci. Eng. Technol. 2021, 9, 73–80. [Google Scholar] [CrossRef]
  42. de Vicente Mohino, J.; Bermejo Higuera, J.; Bermejo Higuera, J.R.; Sicilia Montalvo, J.A. The application of a new secure software development life cycle (S-SDLC) with agile methodologies. Electronics 2019, 8, 1218. [Google Scholar] [CrossRef]
  43. Cybersecurity and Infrastructure Security Agency (CISA). Zero Trust Maturity Model v2; Cybersecurity and Infrastructure Security Agency (CISA): Arlington, VA, USA, 2023. Available online: https://www.cisa.gov/sites/default/files/2023-04/zero_trust_maturity_model_v2_508.pdf (accessed on 12 August 2024).
  44. Department of Defense Chief Information Officer (DoD CIO). DoD Enterprise DevSecOps Strategy Guide; Department of Defense Chief Information Officer (DoD CIO): Arlington, VA, USA, 2021. Available online: https://dodcio.defense.gov/Portals/0/Documents/Library/DoDEnterpriseDevSecOpsStrategyGuide.pdf (accessed on 12 August 2024).
  45. Tassey, G. The Economic Impacts of Inadequate Infrastructure for Software Testing; Technical Report Planning Report 02-3; National Institute of Standards and Technology: Gaithersburg, MD, USA, 2002.
  46. Boehm, B.W. Software Engineering Economics; Prentice-Hall: Englewood Cliffs, NJ, USA, 1981. [Google Scholar]
  47. McConnell, S. Code Complete: A Practical Handbook of Software Construction, 2nd ed.; Microsoft Press: Redmond, WA, USA, 2004. [Google Scholar]
  48. IBM Systems Sciences Institute. Relative Costs to Fix Software Defects; Technical Report; IBM Corporation: Armonk, NY, USA, 2008. [Google Scholar]
  49. Gupta, A.; Gupta, P.; Pandey, U.P.; Kushwaha, P.; Lohani, B.P.; Bhati, K. ZTSA: Zero Trust Security Architecture a Comprehensive Survey. In Proceedings of the 2024 International Conference on Communication, Computer Sciences and Engineering (IC3SE), Ghaziabad, India, 9–11 May 2024; pp. 378–383. [Google Scholar]
  50. Cybersecurity and Infrastructure Security Agency. Zero Trust Maturity Model Version 2.0; Technical Report; CISA: Washington, DC, USA, 2023.
  51. Chandola, V.; Banerjee, A.; Kumar, V. Anomaly Detection: A Survey. ACM Comput. Surv. 2009, 41, 1–58. [Google Scholar] [CrossRef]
  52. Hou, Y.; Li, T.; Wang, J.; Ma, J.; Chen, Z. A Lightweight Transformer Based on Feature Fusion and Global-Local Parallel Stacked Self-Activation Unit for Bearing Fault Diagnosis. Measurement 2024, 236, 115068. [Google Scholar] [CrossRef]
  53. Breiman, L. Random Forests. Mach. Learn. 2001, 45, 5–32. [Google Scholar] [CrossRef]
  54. Goodfellow, I.; Bengio, Y.; Courville, A. Deep Learning; MIT Press: Cambridge, MA, USA, 2016. [Google Scholar]
  55. Ribeiro, M.T.; Singh, S.; Guestrin, C. “Why Should I Trust You?”: Explaining the Predictions of Any Classifier. In Proceedings of the 22nd ACM SIGKDD International Conference on Knowledge Discovery and Data Mining, San Francisco, CA, USA, 13–17 August 2016; pp. 1135–1144. [Google Scholar] [CrossRef]
  56. FIRST.Org, Inc. Common Vulnerability Scoring System v3.1: Specification Document; Technical Report; Forum of Incident Response and Security Teams (FIRST): Cary, NC, USA, 2019. [Google Scholar]
  57. Hammar, K.; Stadler, R. Learning Security Strategies Through Game Play and Optimal Stopping. IEEE Trans. Netw. Serv. Manag. 2023, 20, 5536–5555. [Google Scholar]
  58. Mnih, V.; Kavukcuoglu, K.; Silver, D.; Rusu, A.A.; Veness, J.; Bellemare, M.G.; Graves, A.; Riedmiller, M.; Fidjeland, A.K.; Ostrovski, G.; et al. Human-Level Control Through Deep Reinforcement Learning. Nature 2015, 518, 529–533. [Google Scholar] [CrossRef] [PubMed]
  59. Lillicrap, T.P.; Hunt, J.J.; Pritzel, A.; Heess, N.; Erez, T.; Tassa, Y.; Silver, D.; Wierstra, D. Continuous Control with Deep Reinforcement Learning. In Proceedings of the 4th International Conference on Learning Representations (ICLR), San Juan, PR, USA, 2–4 May 2016. [Google Scholar]
  60. Wu, G.; Jiang, J.; Jiang, K.; Liu, X.; Nie, L. DSwinIR: Rethinking Window-Based Attention for Image Restoration. IEEE Trans. Pattern Anal. Mach. Intell. 2025, 48, 4350–4366. [Google Scholar] [CrossRef] [PubMed]
  61. National Institute of Standards and Technology. Recommendation for Block Cipher Modes of Operation: The XTS-AES Mode for Confidentiality on Storage Devices; Technical Report NIST Special Publication 800-38E; U.S. Department of Commerce: Washington, DC, USA, 2010. [CrossRef]
  62. Gwet, K.L. Computing Inter-Rater Reliability and Its Variance in the Presence of High Agreement. Br. J. Math. Stat. Psychol. 2008, 61, 29–48. [Google Scholar] [CrossRef] [PubMed]
  63. Feinstein, A.R.; Cicchetti, D.V. High Agreement But Low Kappa: I. The Problems of Two Paradoxes. J. Clin. Epidemiol. 1990, 43, 543–549. [Google Scholar] [CrossRef] [PubMed]
  64. Landis, J.R.; Koch, G.G. The Measurement of Observer Agreement for Categorical Data. Biometrics 1977, 33, 159–174. [Google Scholar] [CrossRef] [PubMed]
  65. NVIDIA Corporation. NVIDIA JetPack SDK Documentation; NVIDIA Corporation: Santa Clara, CA, USA, 2024; Factory-Default JetPack Images Ship with the User Account “Nvidia” and Default Password “Nvidia”; Available online: https://developer.nvidia.com/embedded/jetpack (accessed on 1 May 2026).
  66. Kohlios, C.P.; Hayajneh, T. A comprehensive attack flow model and security analysis for Wi-Fi and WPA3. Electronics 2018, 7, 284. [Google Scholar] [CrossRef]
  67. Sheng, H.; Xuanqi, W.; Chang, Z.; Jiacheng, W.; Pingxia, D.; Yuwei, W. AIGC Video Detection Based on the Fusion of Spatial-Frequency-Optical Flow Multi-Modal Features. J. Syst. Eng. Electron. 2026; in press. [CrossRef]
  68. Strom, B.E.; Applebaum, A.; Miller, D.P.; Nickels, K.C.; Pennington, A.G.; Thomas, C.B. MITRE ATT&CK: Design and Philosophy; Technical Report MP180360R1; The MITRE Corporation: McLean, VA, USA, 2018. [Google Scholar]
  69. Bermejo Higuera, J.; Abad Aramburu, C.; Bermejo Higuera, J.R.; Sicilia Urban, M.A.; Sicilia Montalvo, J.A. On Combining Static, Dynamic and Interactive Analysis Security Testing Tools to Improve OWASP Top Ten Security Vulnerability Detection in Web Applications. Appl. Sci. 2020, 10, 9119. [Google Scholar] [CrossRef]
  70. National Security Agency. Zero Trust Implementation Guideline Discovery Phase; Technical Report U/OO/103058-26; NSA Cybersecurity Directorate: McLean, VA, USA, 2026; Version 1.0. PP-25-3989.
  71. National Security Agency. Zero Trust Implementation Guideline Phase One; Technical Report U/OO/107297-26; NSA Cybersecurity Directorate: McLean, VA, USA, 2026; Version 1.0. PP-25-4750.
  72. National Security Agency. Zero Trust Implementation Guideline Phase Two; Technical Report U/OO/107298-26; NSA Cybersecurity Directorate: McLean, VA, USA, 2026; Version 1.0. PP-25-4758.
  73. Pornin, T. Deterministic Usage of the Digital Signature Algorithm (DSA) and Elliptic Curve Digital Signature Algorithm (ECDSA); Technical Report RFC 6979; Internet Engineering Task Force: Fremont, CA, USA, 2013. [Google Scholar] [CrossRef]
  74. SPIFFE Project. SPIFFE and SPIRE: Production-Ready Workload Identity; Cloud Native Computing Foundation: San Francisco, CA, USA, 2022; Available online: https://spiffe.io/docs/latest/spiffe-about/overview/ (accessed on 8 March 2026).
  75. Rescorla, E. The Transport Layer Security (TLS) Protocol Version 1.3; Technical Report RFC 8446; Internet Engineering Task Force (IETF): Fremont, CA, USA, 2018. [Google Scholar] [CrossRef]
  76. fail0verflow. Console Hacking 2010: PS3 Epic Fail. In Proceedings of the 27th Chaos Communication Congress (27C3), Berlin, Germany, 27–30 December 2010. Demonstrated Recovery of Sony PlayStation 3 ECDSA Private Key Through Nonce Reuse; Published Keys Released by George Hotz on 3 January 2011. [Google Scholar]
  77. National Institute of Standards and Technology. Module-Lattice-Based Key-Encapsulation Mechanism Standard; Technical Report FIPS 203; U.S. Department of Commerce: Gaithersburg, MD, USA, 2024. [CrossRef]
  78. National Institute of Standards and Technology. Module-Lattice-Based Digital Signature Standard; Technical Report FIPS 204; U.S. Department of Commerce: Gaithersburg, MD, USA, 2024. [CrossRef]
  79. National Institute of Standards and Technology. Stateless Hash-Based Digital Signature Standard; Technical Report FIPS 205; U.S. Department of Commerce: Gaithersburg, MD, USA, 2024. [CrossRef]
Figure 1. Cybectr Sentinel versus manual analyst workflows and commercial tooling across five capability dimensions: Unknown Asset Inference, AI-Guided Penetration Testing, MITRE D3FEND integration, encrypted RBAC-gated reporting, and CVE signature coverage. Each dimension is normalized to a 0–1 scale by min–max scaling against the maximum capability score observed for that dimension in the comparison set, so a value of 1.0 indicates the strongest performer in that dimension, and a value of 0.0 indicates the absence of the capability. Color encoding uses ColorBrewer-derived qualitative palette categories selected for accessibility under colorblind viewing (deuteranopia and protanopia tested); each comparison subject (Sentinel, manual analyst, Nessus, OpenVAS) is assigned a distinct hue with no red–green pairing.
Applsci 16 04809 g001
Figure 2. Fourteen-capability support matrix across six secure development frameworks.
Applsci 16 04809 g002
Figure 3. Mean Time to Remediate (MTTR) comparison for four vulnerability categories under conventional DevSecOps versus AZTRM-D Stage 3 (left), and implementation cost by framework showing initial setup versus ongoing sprint hours (right). The asterisk on the right panel indicates that the AZTRM-D setup cost is front-loaded and non-recurring.
Applsci 16 04809 g003
Figure 4. AZTRM-D runtime performance on the NVIDIA Jetson Orin Nano (Stage 3): device CPU overhead versus comparable approaches (left panel), ZT policy enforcement latency across endpoint counts (center panel), and key measured metrics (right panel). Green metric values in the right panel indicate measurements within their target operating envelope; the red value flags the false positive rate, which is the only metric whose triage cost an operator must monitor over time. The figure spans the full text width to provide adequate label legibility across all three panels; readers viewing at reduced page magnification are referred to Table 16, Tables 33 and 34, where the same figures appear in tabular form at full body-text size.
Applsci 16 04809 g004
Figure 5. Penetration test findings across three hardening stages on the NVIDIA Jetson Orin Nano: total findings and tester agreement (left), and attack vector success rate by stage (right).
Applsci 16 04809 g005
Figure 6. Security posture progression across the three AZTRM-D hardening stages for four key risk metrics (0 = fully exposed, 100 = fully mitigated).
Applsci 16 04809 g006
Figure 7. Vulnerability detection rate breakdown across the five CI/CD scanning modalities from Stage 3 pipeline results. Solid bars in the left panel show total seeded vulnerabilities per modality; the lighter overlaid bars show organically discovered findings during validation. In the right panel, solid bars show unique detections (caught only by that modality) and the hatched portion shows shared cross-modality detections (caught by two or more scanners). Per modality color is for visual differentiation only and does not encode a separate variable.
Applsci 16 04809 g007
Figure 8. Security posture across five key metrics: Stage 1 factory-default baseline versus Stage 3 full AZTRM-D hardening on the NVIDIA Jetson Orin Nano.
Applsci 16 04809 g008
Table 1. Cybectr Sentinel end-to-end workflow with AI components, algorithmic actions, and framework mappings. Source: Cybectr Sentinel architecture (this work) [1].
StageDescriptionAI/Algorithmic ActionFrameworks
1. DeployVia embedded system, local install, or USB; encrypted cloud channel establishedNo AI at deployment; channel to trained model initializedN/A
2. ScanEnumerate hardware (direct + wireless signal), software (OS, apps, cloud), network (configs, policies)Feature extraction and asset fingerprinting; asset graph constructedNIST NVD, MITRE ATT&CK
3. AggregateCorrelate asset data against NIST NVD, MITRE ATT&CK, custom intelligence feedsAI correlation engine maps assets to CVE/TTP database; confidence scoring appliedNIST NVD, ATT&CK
4a. Known AssetSearch database for known vulnerabilitiesXGBoost classifies exploitability; SHapley Additive exPlanations (SHAP) values explain each prediction [7,8]NIST NVD
4b. Unknown AssetTrigger AI similarity analysisSentence Transformer cosine similarity infers vulnerability profile from nearest known asset [5]Custom index
5. Pen Test GateRequest user approval; deploy isolated miniature test environmentPPO RL agent selects attack sequences; Metasploit executes in sandbox [6]MITRE ATT&CK TTPs
6a. ValidatedConfirm and classify vulnerability; zero-day pipeline if novelConfidence threshold check; novel findings escalate to zero-day classificationMITRE ATT&CK
6b. Not ExploitableLog as false positive; return to monitoringIsolation Forest model re-weighted for asset class [9]N/A
7. MitigationGenerate patches, config fixes, hardening strategiesRAG pipeline queries D3FEND; large language model (LLM) synthesizes specific remediation steps [10]MITRE D3FEND
8. ReportingCompile encrypted findings; enforce RBAC access controlsAES-256 encryption; RBAC policy engine per NIST SP 800-53 [11]NIST SP 800-53 [11]
9. Active DefenseInform defensive planning via MITRE ENGAGEENGAGE strategies selected from confirmed TTPs; deception assets deployed if warranted [1]MITRE ENGAGE
“N/A” in the frameworks column indicates a workflow stage that operates entirely on internal Sentinel mechanisms and does not invoke an external framework reference (deployment-channel setup and false positive logging).
Table 2. Cybectr Sentinel AI subsystem specifications with algorithms, functions, and key parameters. Source: author’s design and implementation (this work).
AI ComponentAlgorithmFunction in SentinelKey Parameters/Formula
Behavioral Anomaly DetectionIsolation Forest [9]Real-time detection of unusual device or user behavioral patterns in telemetry stream s ( x , n ) = 2 E [ h ( x ) ] / c ( n ) ; c ( n ) = 2 H ( n 1 ) 2 ( n 1 ) / n ; t = 100  trees, ψ = 256 sub-sample; threshold: s > 0.6 alert, s > 0.8 auto-containment
Vulnerability TriageXGBoost + SHAP [7,8]Classifies and prioritizes vulnerabilities by exploitability; SHAP explains each decision Ω ( f ) = γ T + 1 2 λ j w j 2 ; SHAP: ϕ i = S F { i } | S | ! ( | F | | S | 1 ) ! | F | ! [ f S { i } ( x ) f S ( x ) ]
Unknown Asset InferenceSentence Transformer cosine similarity [5]Infers vulnerability profile for novel assets by matching against known-asset embedding library sim ( A , B ) = A · B A · B ; match threshold 0.82
AI-Guided Pen TestingPPO [6]RL agent selects optimal attack sequences in isolated sandbox; reward tied to exploit success, novelty, and stealth L CLIP ( θ ) = E ^ t [ min ( r t ( θ ) A ^ t , clip ( r t ( θ ) , 1 ε , 1 + ε ) A ^ t ) ] ; ε = 0.2 , γ = 0.99
Mitigation GenerationRAG + LLM [10]Queries MITRE D3FEND knowledge base; generates specific patches, config fixes, hardening steps per findingTop- k = 5 D3FEND document retrieval; cosine similarity retrieval; LLM synthesizes output
Adversarial Robustness TestingDiCE counterfactuals [12]Generates minimum-perturbation adversarial examples to test classifier evasion; findings feed model retrainingCounterfactual diversity constraint; proximity loss minimized; integrated into Sentinel retraining pipeline
Table 3. XAI implementation stack in Cybectr Sentinel: algorithm, role, output format, and AZTRM-D enforcement function. Source: Cybectr Sentinel architecture (this work).
XAI ComponentAlgorithmOutput FormatAZTRM-D Enforcement Function
Vulnerability Triage ExplanationSHAP (TreeExplainer) [7]Per finding SHAP waterfall plot + feature attribution tableHuman gate reviewers see which CVE features drove the priority score; supports defensible authorization decisions under NIST RMF assess phase
Natural-Language Finding SummaryClaude API (Anthropic)Plain-language analyst briefing per findingTranslates SHAP attribution scores into clear developer/administrator/CISO-level summaries; role-appropriate detail level enforced by RBAC
Anomaly ExplanationIsolation Forest path length decomposition [9]Short-path feature trace per flagged instanceShows which behavioral telemetry features caused an anomalous classification; enables analyst to distinguish genuine insider threat behavior from monitoring noise
Adversarial Robustness ReportDiCE counterfactuals [12]Minimum-perturbation example set per classifierDocuments the nearest decision-boundary crossing for each AI component; feeds Sentinel model retraining pipeline
Pen Test Action TracePPO episode log + MITRE ATT&CK TTP mapping [6]Per episode action sequence with ATT&CK technique labelsTranslates RL agent actions into human-readable attack narrative; maps each step to ATT&CK technique IDs for ENGAGE active defense planning
RAG Retrieval ProvenanceD3FEND document retrieval log (top-k cosine similarity) [10]Source document list with similarity scores per mitigation recommendationEach AI-generated mitigation step is traceable to the specific D3FEND document that sourced it; supports audit and compliance review
Table 4. Cybectr Sentinel measured performance metrics. All figures are self-measured by the authors on the Cybectr Sentinel platform. Source: Stage 3 validation on NVIDIA Orin (this work).
MetricValueNotes
Time-to-Initial-Detection (TTID)4.2 min averageFull pipeline: deploy → scan → correlate → first anomaly or vulnerability flag
False Positive Rate (FPR)3.1%Across both behavioral anomaly and vulnerability detection pipelines combined
Vulnerability Classification Precision94.1%XGBoost on held-out validation set
Vulnerability Classification Recall91.8%XGBoost on held-out validation set; tuned above precision intentionally
SAST-Augmented TPR (GNN-assisted)81.4% on BigVul datasetGNN-augmented static analysis; tested against BigVul benchmark [16]
Adversarial Detection Rate93.7%AI components tested against DiCE counterfactual adversarial inputs [12]
Mitigation Report Latency<90 s per findingRAG + LLM pipeline including D3FEND retrieval and report compilation
RBAC Enforcement Latency<40 ms per access checkConsistent with AZTRM-D ZT PEP latency target
AI Model Training (Insider Threat Model)14 h initial3 months of log data; standard cloud GPU; one-time cost before deployment
Table 5. Stage 3 false positive rate decomposition by the Sentinel AI subsystem. Aggregate 3.1% FPR is the union of all three subsystem rates over their respective monitoring event totals. Source: Stage 3 validation telemetry (this work); per subsystem figures derived from the internal alert log review at submission time.
SubsystemFPRTrigger VolumeContribution to AggregateNotes on Per Class Detail
Isolation Forest (behavioral)2.4%Continuous device telemetry; high-volume monitoring streamLargest contributorPer class breakdown (configuration vs. behavioral vs. access-pattern false positives) was not preserved in Stage 3 instrumentation at granularity needed for Wilson CI computation; addressed in Stage 4
XGBoost (vulnerability triage)0.7%Per commit and per scan-cycle event stream; lower volume than behavioral pipelineSmaller contributorSHAP explanations available per false positive; provides operational triage support even without per class FPR decomposition
GNN-augmented SASTNot separately preservedSAST gate fires per commit; volume bounded by commit frequencyIncluded in aggregate but not separately attributableOperational FPR characterization at per commit granularity identified as a Stage 4 telemetry requirement
The GNN-augmented SAST operational FPR was not preserved separately from the aggregate in the Stage 3 instrumentation; the BigVul held-out test FPR of 6.2% [16] is the available proxy. Per class characterization for all three subsystems is scoped to Stage 4 (Section 4).
Table 6. Cybectr Sentinel capability comparison against manual processes and commercial alternatives. Source: author’s comparative assessment based on cited tool documentation and deployment experience (this work).
CapabilityManual/Commercial Tools AloneCybectr Sentinel (AZTRM-D Layer)
Unknown Asset CoverageNone; scanners skip assets not in signature databases [23]Cosine similarity inference covers novel and unregistered devices [5]
AI-Guided Pen TestingRequires dedicated red team; periodic only [24]PPO agent runs on demand in isolated sandbox [6]
Vulnerability ExplanationBlack-box scanner output; no rationale provided [23]SHAP values explain every classification; fully auditable [7]
Active Defense IntegrationNot addressed by commercial scanners [23]MITRE ENGAGE for adversary engagement and deception planning [1]
Remediation GenerationManual lookup against vendor advisories [23]RAG + LLM generates specific patches and hardening steps per finding [10]
Report SecurityTypically plaintext or unencrypted exports [23]AES-256 encrypted; RBAC-gated per NIST SP 800-53 [11]
Zero-Day ClassificationRequires human analyst [24]Automated novel vulnerability classification with confidence scoring [1]
AZTRM-D AlignmentNo alignment; bolt-on tools require custom integrationDesigned to enforce AZTRM-D controls end-to-end [1]
Table 7. Coverage division between Sentinel and conventional tools in the AZTRM-D stack. Source: author’s deployment assessment (this work).
ToolWhat It CoversWhy It Cannot Be Replaced by Sentinel
NmapLive host discovery; exact service and version enumeration on all 65,535 portsSentinel’s asset scanner does not perform full-range TCP port scanning with version probing; Nmap’s -sV banner matching against its NSE script library is purpose-built and irreplaceable for service fingerprinting
Nessus ProfessionalCredentialed CVE scanning with authenticated access to OS, drivers, and kernel [23]Sentinel’s XGBoost classifier scores known CVEs from the NVD; it does not perform credentialed OS-level probing. JetPack driver CVEs that are invisible from the network require authenticated Nessus scans to surface [23]
OpenVASCross-validation against Nessus findings; open-source baseline with independent CVE signaturesProvides an independent second opinion with no commercial license dependency; scanner disagreement flags ambiguous findings for manual review
LinPEASPost-access privilege escalation enumeration: SUID binaries, cron jobs, sudo policy, kernel exploitsRequires a live shell on the target; Sentinel’s PPO sandbox agent cannot enumerate the real device’s privilege escalation surface from outside
HydraCredential policy validation: confirms account lockout, brute-force rate limiting, and default credential policies are actually enforcedValidates enforcement rather than detecting it; only a live brute-force attempt confirms that lockout fires at the configured threshold
Cybectr SentinelUnknown Asset Inference; on-demand AI pen testing; D3FEND mitigation mapping; ENGAGE active defense; behavioral anomaly detection; encrypted RBAC reporting [1]The four capability gaps addressed by Sentinel are absent from all other tools in the stack
Table 8. Cybectr Sentinel strengths, limitations, and the tools that address each limitation. Source: author’s operational assessment from Stage 3 deployment.
DimensionAssessmentAddressed By
CVE Signature CoverageXGBoost classifier trained on NVD dataset; newly published CVEs not in training data are not caught until model retrain or RAG index updateNessus Professional and OpenVAS with daily signature updates
Raw Network ProbingSentinel does not perform packet-level network probing; its network scan relies on imported Nmap and Nessus resultsNmap -sV -p- and Nessus for raw port and service discovery
RF AnalysisSentinel has no SDR interface; it cannot directly observe wireless trafficRTL-SDR with GNU Radio and Wireshark
Physical Attack SurfaceSentinel cannot detect or prevent physical hardware manipulation; full-disk encryption and physical controls are outside its scopeLinux Unified Key Setup (LUKS2) full-disk encryption, GPIO hardening, UART gating
Unknown Asset Inference (Strength)Sentence Transformer cosine similarity covers assets not in any signature database; identifies nearest known asset with similarity 0.82 Sentinel-native capability; no equivalent in commercial tools
On-Demand AI Pen Testing (Strength)PPO agent runs validated attack sequences in isolated sandbox; no red team required for continuous validationSentinel-native capability
XAI and Auditability (Strength)SHAP explanations for every classification; Claude-generated natural-language summaries; RAG provenance tracingSentinel-native capability
Model Training Data DependencyIsolation Forest requires 3 months of operational log data before behavioral thresholds are trustworthyHuman analyst review coverage during bootstrapping period
White-Box Adversarial Evasion93.7% adversarial detection rate reflects DiCE-generated evasion, not white-box adversarial attacks against a fully informed attackerDiCE adversarial retraining pipeline; SHAP monitoring; human analyst review for suspicious findings
Scale at Enterprise3.1% false positive rate on the Stage 3 single-device corpus; projected to 31 alerts per cycle at 1000 hypothetical endpoints and 310 at 10,000 (planning estimates, not measured fleet-scale figures)SHAP-prioritized alert queue; tiered alert handling; RBAC-based routing
Table 9. AZTRM-D versus six conventional SDLC methodologies across six security-relevant dimensions. Each cell sourced from its per row citation.
DimensionWaterfall [25]Agile/Scrum [26]DevOps [27]Spiral [28]RAD [29]AZTRM-D
Security IntegrationLate-stage gate [25]Ad hoc per sprint [26]Partial [27]Per cycle risk [28]Minimal [29]Continuous, automated, every phase [1]
Zero Trust ArchitectureNone [25]None [30]None [27]None [28]None [29]Core design principle [3,31]
AI-Driven AutomationNone [32]None [32]Limited [24]None [28]None [29]AI orchestration across full lifecycle [1]
Risk ManagementInformal [32]Backlog-based [33]Monitoring only [27]Formal per cycle [28]Minimal [29]NIST RMF integrated from planning [2]
Regulatory ComplianceManual audit [32]Manual audit [33]Partial automation [24]Formal docs [28]None [29]Automated compliance mapping [1]
IoT/Edge SecurityNot addressed [25]Not addressed [30]Limited [27]Limited [28]Not addressed [29]First-class design target [1]
Table 10. Secure SDLC framework comparison across seven capability dimensions. Each cell sourced from its per row citation.
CapabilityMS SDL [34]OWASP SAMM [35]BSIMM [36]NIST SSDF [37]DO-178C [38]AZTRM-D
Threat ModelingManual (STRIDE) [34]Process-defined [35]Measured maturity [36]Recommended [37]Hazard analysis [38]AI-automated, dynamic [1]
Security TestingSAST + pen test [34]SAST + DAST [35]Measured practice [36]SAST + SCA [37]V&V [38]SAST + DAST + SCA + AI pen test [1]
Zero TrustNone [39]None [35]None [36]None [37]None [38]Full ZT enforcement [3]
AI IntegrationNone [39]None [35]None [36]None [37]None [38]AI orchestration throughout [1]
IoT/EdgeNone [39]None [35]None [36]Limited [37]Yes (avionics) [38]First-class target [1]
NIST RMFNone [39]None [35]None [36]Partial [37]None [38]Fully integrated [2]
AI-Driven MonitoringNone [39]None [35]None [36]None [37]None [38]Continuous behavioral analysis [1]
Table 11. Fourteen-capability comparative matrix across five secure SDLC frameworks and AZTRM-D. Assessments based on published framework documentation cited in Section 3.2.3.
CapabilityMS SDL [34]OWASP SAMM [35]BSIMM [36]NIST SSDF [37]DO-178C [38]AZTRM-D
Automated Threat ModelingNoPartialPartialPartialNoYes
Shift-Left Security (Dev Phase)YesYesYesYesNoYes
AI-Assisted Code Analysis (GNN/SAST)NoNoNoNoNoYes
Zero Trust Network ArchitectureNoNoNoNoNoYes
Identity Verification (Continuous)NoPartialNoPartialNoYes
AI-Guided Penetration TestingNoNoNoNoNoYes
Unknown Asset Similarity AnalysisNoNoNoNoNoYes
MITRE ATT&CK IntegrationPartialPartialYesYesNoYes
MITRE D3FEND Mitigation MappingNoNoNoNoNoYes
MITRE ENGAGE Active DefenseNoNoNoNoNoYes
Post-Quantum Readiness PlanningNoNoNoNoNoYes
Full-Disk Encryption (IoT/Edge)NoNoNoPartialNoYes
Immutable Audit LoggingPartialPartialPartialYesNoYes
Automated SBOM + Artifact SigningPartialPartialPartialYesNoYes
Each row assessment is derived from the published framework documentation cited in the column headers: MS SDL [34,40], OWASP SAMM [35], BSIMM [36], NIST SSDF [37], and DO-178C [38].
Table 12. Master SDLC and security framework capability comparison. Column assessments: waterfall [25,32]; Agile [26,42]; DevOps [24,27]; Spiral [28]; MS SDL [34,40]; OWASP SAMM [35]; BSIMM [36]; NIST SSDF [37]; DO-178C [38]; and AZTRM-D [1].
CapabilityWaterfall [25]Agile [26]DevOps [27]Spiral [28]MS SDL [34]OWASP SAMM [35]BSIMM [36]NIST SSDF [37]DO-178C [38]AZTRM-D
Security-first design×
Automated CI/CD sec gates×××
Zero Trust architecture×××××××××
AI threat detection×××××××××
AI-guided pen testing×××××××××
SBOM/supply chain mgmt×××
Formal RMF integration×××××××
Unknown Asset Inference×××××××××
D3FEND countermeasure map×××××××××
ENGAGE active defense×××××××××
Post-quantum readiness×××××××××
IoT/edge-specific guidance××××××
Insider threat detection×××××
Capabilities Present00112224313
✓ = native support; ∼ = partial/plugin-dependent; × = absent. The bottom row, in bold, gives the count of capabilities each framework supports natively or partially. Assessments for non-AZTRM-D methodologies from published documentation: MS SDL [34,40]; OWASP SAMM [35]; BSIMM [36]; NIST SSDF [37]; DO-178C [38]; and DoD DevSecOps [44]. SDLC assessments from [30,32,41].
Table 13. Implementation cost and effort comparison. AZTRM-D figures from Stage 3 measured data (this work); comparison methodology figures from cited sources; see table notes.
DimensionAgile/ScrumMS SDLAZTRM-DSource
Initial setup (person-hours)40–80 200–400320–480Agile range: author estimate based on process complexity in [24,26] ; SDL from [34,40]; AZTRM-D from Stage 3 measured timeline (Table 14)
Security tool licensing (annual)$0–5k $15k–40k$12k–35kPublicly listed vendor pricing as of the 2024 deployment period: Nessus Professional [23], GitLab Ultimate, Semgrep Pro, OWASP ZAP (open source); Agile range reflects minimal tooling ; AZTRM-D figure validated against actual Stage 3 deployment spend
Ongoing overhead per sprint2–5 h20–40 h4–8 hAZTRM-D Stage 3 measurement; SDL overhead from [34]; Agile baseline reflects typical security review effort for teams achieving high deployment frequency [24]
Commit-stage defect fixBaseline
Pre-release defect fix10–15×10–15×10–15× [46,47]
Post-release defect fix30–100×30–100×30–100× [45,47,48]
Agile/Scrum setup cost figures are author estimates from [24,26]. Published per task effort breakdowns for Agile CI/CD setup do not exist in a directly comparable form; these ranges reflect the minimal pipeline infrastructure Agile/Scrum prescribes. All AZTRM-D figures are from Stage 3 deployment data.
Table 14. AZTRM-D implementation timeline and effort breakdown from actual deployment on NVIDIA Orin devices. Source: Stage 3 deployment log (this work).
WeekPhaseKey ActivitiesPrimary Challenges
1–2Infrastructure SetupGitLab self-hosted instance; SSH key provisioning; RBAC role definitions; Multi-Factor Authentication (MFA) enrollmentSSH key rotation for three credential tiers required careful ordering to avoid access lockouts
2–3CI/CD Pipeline ConstructionSAST integration (Semgrep for C/C++ and Python 3.14); SCA via GitLab dependency scanning; IaC scanning via Checkov; Secrets Scan via Gitleaks; SBOM generation via SyftTuning SAST false positive rates below 5% without suppressing real findings required two iteration cycles
3–4ZT Policy DeploymentSPIFFE/SPIRE SVID provisioning; sudo policy hardening (/etc/sudoers.d/); account lockout configuration; immutable log enforcement via auditd + remote syslogSPIRE SVID rotation on resource-constrained Orin hardware introduced CPU spikes; resolved by extending interval from 1 to 4 h with compensating session validation
4–5Full-Disk EncryptionLUKS2 setup on SD cards; AES-256-XTS key provisioning; boot-time unlock; offline attack resistance validationBootloader configuration for LUKS2 on the Jetson Orin Nano required custom initramfs hooks; standard Ubuntu LUKS setup does not cover SD card boot path
5–6Wireless HardeningWPA3 SAE enforcement; wireless microsegmentation; Bluetooth disablement; RF emission baseline captureWPA3 SAE required driver update on the Jetson Orin Nano WiFi module; older driver revisions fell back to WPA2 silently
6–8Sentinel Deployment and AI BootstrappingSentinel deployment in embedded mode; Isolation Forest training on 3 months of operational logs; XGBoost classifier training on NIST NVD CVE dataset; PPO agent training in isolated sandbox; SHAP pipeline validation14 h initial Isolation Forest training on cloud GPU; 3.1% false positive rate required threshold tuning before automated containment was enabled
8–10DAST and Supply Chain Gate IntegrationDAST via OWASP ZAP; CSPM via Prowler against cloud configuration baseline; cryptographic artifact signing via Cosign; SBOM attestation pipelineDAST scan timing required a dedicated staging environment to avoid false positives from incomplete deployment states
Table 15. Estimated implementation effort and security debt accumulation across AZTRM-D, conventional SDLC, and secure SDLC frameworks. AZTRM-D figures from Stage 3 deployment data (this work); comparison figures from cited framework documentation; see table notes.
MethodologyInitial SetupTooling CostSecurity Overhead per SprintTime to First Hardened DeploySecurity Debt Accumulation
Waterfall [25,32]Low (1–2 weeks)MinimalNear zero during development; concentrated at final review6–18 months (post-delivery)High; findings arrive too late for economical rework
Agile/Scrum [26,30]Low (1–2 weeks)Minimal without dedicated security toolingLow; security tickets compete with feature backlogVariable; security rarely blocks releaseMedium; sprint-by-sprint accumulation without structural gate
DevOps [24,27]Medium (2–4 weeks)Moderate; CI/CD pipeline tooling5–10% engineering time for pipeline maintenance 4–8 weeks after CI/CD is operationalMedium to low; depends on whether security was added to the pipeline
Microsoft SDL [34,40]Medium (4–8 weeks)Low; primarily process overhead10–15%; manual threat modeling and review cycles 8–16 weeksLow for known-class threats; high for novel attack surfaces
NIST SSDF [37]Medium (4–8 weeks)Low; guidance-based, tools chosen separately10–15%; documentation and artifact requirements 8–16 weeksLow for compliance-driven deployments; ZT and AI gaps remain
OWASP SAMM [35]Low (1–3 weeks to assess; months to mature)Low; maturity measurement onlyVaries with maturity; typically 5–20% Not prescriptive; maturity timeline is 6–24 monthsDecreases as maturity increases; no prescribed ZT or AI path
AZTRM-D [1]High (6–10 weeks for full pipeline and ZT deployment)Moderate to high; GitLab CI/CD, Nessus Professional, Sentinel, LUKS2, WPA3, SPIFFE/SPIRE12–18% CPU overhead on device; 15–20% engineering time ongoing for gate maintenance6–10 weeksLow from day one; all five scanning modalities active from first commit
Non-AZTRM-D overhead percentages are author estimates from documented process requirements. The 10–15% range for MS SDL and NIST SSDF reflects manual threat modeling, security checkpoints, and compliance documentation [34,37]. The Accelerate research program documents that high-performing teams spend ∼20% of engineering capacity on non-feature work [24]. AZTRM-D figures are from Stage 3 deployment data (Table 14).
Table 16. Performance overhead comparison: AZTRM-D vs. comparable secure development approaches on IoT/edge hardware. AZTRM-D figures from Stage 3 measured data (this work); comparison figures from cited framework documentation.
ApproachDevice CPU OverheadPipeline Latency AddedOn-Device MonitoringSource
AZTRM-D (full)12–18% (active scan)/3–5% (idle)Included in CI/CD gatesYes (AI behavioral monitoring)Stage 3 measured [4]
Standard DevSecOps0–2%5–15 min (typical SAST/DAST)NoNo on-device agent by design [44]
Microsoft SDL0–2%10–30 min (manual gates)NoNo on-device agent by design [40]
ZT enforcement only (no AI)3–8% (representative range from surveyed ZT implementations) [49]MinimalPartial (access control only) [49,50]
Device CPU overhead reflects on-device security agent activity, not CI/CD pipeline cost. “On-Device Monitoring” indicates whether the approach deploys a runtime security agent to the target hardware after CI/CD scanning is complete; approaches without this capability scan code only in the pipeline and do not monitor device behavior post-deployment.
Table 17. Anomaly detection algorithm comparison on NVIDIA Orin. Isolation Forest values from Stage 3 measured data (this work); alternative algorithm values are author estimates (see table notes).
AlgorithmInference LatencyMemory (MB)ExplainabilityCPU Overhead
Isolation Forest [9] ( t = 100 , ψ = 256 ) O ( log n ) , <1 ms<50Feature path3–5%
One-Class SVM [51] O ( n sv ) , >10 ms200–400None12–18%
Autoencoder (LSTM) [51] >5 ms150–300Post hoc only15–22%
Isolation Forest values measured on NVIDIA Orin (Stage 3). OCSVM and autoencoder values are author’s engineering estimates based on algorithm complexity ( O ( n sv ) and GPU inference respectively), not measured on Orin hardware [51].
Table 18. Vulnerability triage algorithm comparison. All figures are from the author’s preliminary evaluation on the CVE triage dataset (this work); see table notes.
AlgorithmPrecisionRecallSHAP CompatibleOverfitting Risk
XGBoost [8] (final, AZTRM-D)94.1%91.8%Yes (exact)Low (regularized)
Random Forest [53] (preliminary)91.3%88.5%Approximate onlyModerate
Neural Network (MLP) [54]89.7%85.2%Post hoc approx.High (CVE dataset)
Table 19. XGBoost input features for CVE vulnerability triage, sourced from NIST NVD API v2.0 and CVSS v3.1 scoring.
FeatureSourceTypeEncoding/Notes
CVSS v3 Base ScoreNVD/CVSS v3.1 [56]Continuous [0.0–10.0]Raw numeric score
CVSS v3 Exploitability SubscoreNVD/CVSS v3.1 [56]Continuous [0.0–3.9]Derived from AV, AC, PR, UI
CVSS v3 Impact SubscoreNVD/CVSS v3.1 [56]Continuous [0.0–6.0]Derived from C, I, A
Attack Vector (AV)NVD/CVSS v3.1 [56]CategoricalOne-hot: network, adjacent, local, physical
Attack Complexity (AC)NVD/CVSS v3.1 [56]Binary0 = high, 1 = low
Privileges Required (PR)NVD/CVSS v3.1 [56]Ordinal0 = high, 1 = low, 2 = none
User Interaction (UI)NVD/CVSS v3.1 [56]Binary0 = required, 1 = none
Scope (S)NVD/CVSS v3.1 [56]Binary0 = unchanged, 1 = changed
Confidentiality Impact (C)NVD/CVSS v3.1 [56]Ordinal0 = none, 1 = low, 2 = high
Integrity Impact (I)NVD/CVSS v3.1 [56]Ordinal0 = none, 1 = low, 2 = high
Availability Impact (A)NVD/CVSS v3.1 [56]Ordinal0 = none, 1 = low, 2 = high
CWE CategoryNVD [13]CategoricalTop-25 CWE IDs one-hot encoded; remainder bucketed as “Other”
CVE Age (days)NVD Published Date [13]ContinuousDays since publication at training time
Table 20. Reinforcement learning algorithm comparison for pen testing. Convergence and stability figures are drawn from published RL-for-security benchmarks; PPO sandbox metric is from internal Stage 3 measurement. See table notes for source details.
AlgorithmAction SpaceConvergence Episodes (to 80% Optimal Policy)Sample Efficiency (Updates/Episode)Sparse-Reward Stability (Variance)
PPO ( ϵ = 0.2 , AZTRM-D) [6]Discrete800–1500 4 (multi-epoch)Low variance; clipped objective prevents destabilization
DQN [57,58]Discrete2500–5000 1 (single-step)High variance under sparse rewards; documented catastrophic forgetting in security tasks
DDPG [59]Continuous (mismatch for discrete pen testing actions)N/A (architectural mismatch)1 (single-step)Moderate variance; designed for continuous control
PPO convergence range is derived from Hammar and Stadler (2023) benchmark on network intrusion-defense games [57], consistent with the AZTRM-D sandbox training profile observed during Stage 3. Exact episode counts depend on attack surface complexity and reward shaping. DQN convergence range is from the same Hammar–Stadler benchmark [57] and from Mnih et al. (2015) [58], which establishes DQN’s baseline sample-efficiency profile in sparse-reward environments. “N/A” for DDPG convergence reflects that DDPG is designed for continuous action spaces and was not run to convergence on the discrete pen testing task because the action-space mismatch makes the comparison architecturally uninformative.
Table 21. Cosine similarity threshold calibration for Unknown Asset Inference ( N = 47 IoT asset profiles, 80/20 held-out split from known-asset library). The F1-score peaked at 0.82, selected as the operational threshold; the peak F1-score is shown in bold. Source: author’s grid search evaluation (this work).
ThresholdPrecisionRecallF1-Score
0.700.610.950.74
0.750.740.910.82
0.800.830.870.85
0.820.870.850.86
0.850.910.780.84
0.900.950.610.74
0.950.980.390.56
Table 22. Comparative performance of Sentinel AI subsystems against published external baselines. Per row dataset and protocol differences are documented in the notes column. Source: published baselines per row citation; Sentinel figures from this work.
TaskSentinel (This Work)External BaselineBaseline SourceComparison Notes
Vulnerability classification (CVE)XGBoost: 94.1% precision, 91.8% recall on NVD CVSS-v3 corpusRandom Forest: 91.3% precision, 88.5% recall on same corpus [53] (algorithm), this work (figures)Same evaluation corpus and split; preliminary algorithm comparison run during selection
Vulnerability classification (neural baseline)XGBoost (above)MLP feedforward: 89.7% precision, 85.2% recall on same corpus [54] (algorithm), this work (figures)Same evaluation corpus and split; selected against on explainability and accuracy
Source code vulnerability detectionGNN-augmented Semgrep: 81.4% TPR at 6.2% FPR on BigVul held-outPattern-matching SAST baseline: ∼50% TPR at 5–10% FPR on novel patterns [16]BigVul corpus published partition; pattern-matching baseline figures from BigVul authors
Behavioral anomaly detection (edge IoT)Isolation Forest: 3.1% FPR aggregate; sub-40 ms PEP latencyOCSVM: estimated >200 ms inference latency on Cortex-A class hardware [51]Sentinel figures measured on NVIDIA Orin Stage 3; OCSVM figure is computational-complexity estimate, not measured (see Table 17)
Behavioral anomaly detection (deep architecture)Isolation Forest (above)Autoencoder: requires GPU inference; exceeds 20% CPU budget on Orin [51]Selected against on edge hardware compute budget; autoencoders perform comparably or better on accuracy in data center contexts
Lightweight edge anomaly detection (adjacent domain)Isolation Forest (above)Lightweight transformer with feature fusion (GLP-Transformer): comparable accuracy at 48.28 K parameters, 2.74 M FLOPs on bearing fault corpus [52]Adjacent-domain comparison; bearing-fault vs. behavioral telemetry are different task surfaces, but both target resource-constrained edge inference. Transformer alternatives motivated the comparative evaluation; tree-ensemble selected for explainability and exact SHAP compatibility
Counterfactual adversarial robustnessDiCE evaluation: 93.7% detection rate against minimum-perturbation counterfactualsDiCE on tabular financial classifiers: comparable detection rates reported in original work [12]Same evaluation methodology; different dataset (CVE classification vs. tabular benchmarks)
Table 23. Full tool stack with category, AZTRM-D role, alternatives considered, and selection rationale. Source: author’s deployment and tool selection (this work); see table notes.
ToolCategoryRole in AZTRM-DAlternatives ConsideredWhy This Tool
Nmap (-sV -p-)Port scannerAsset discovery; service-version port enumeration in all pen test stagesMasscan, Zmap-sV extracts exact software versions for CVE mapping; -p- ensures no port is missed; Masscan/Zmap prioritize speed over version accuracy
Nessus ProfessionalVulnerability scannerAuthenticated and unauthenticated CVE scanning against all discovered assetsOpenVAS; Qualys; Rapid7 InsightVMCovers over 115,000 CVE IDs with daily plugin updates [23]; credentialed scans expose OS/driver vulnerabilities invisible from the network; OpenVAS retained as cross-validation
OpenVASVulnerability scannerCross-validation of Nessus findings; open-source baselineNessus aloneIndependent CVE signatures provide a second opinion; scanner disagreement flags ambiguous findings for manual review; no commercial license dependency
HydraCredential testerTests for weak/default credential policies (Stage 1 validation)Medusa, Burp Suite IntruderValidates account lockout enforcement at the protocol level; confirms brute-force path exists before and does not after hardening
RTL-SDR (RTL2832U)RF analysisWireless signal observation and RF MITM probing across all stagesUSRP, HackRFRealistic adversary capability at under $30 retail; USRP and HackRF are more capable but far more expensive
MetasploitExploit frameworkAI-guided pen test execution in Sentinel’s isolated sandboxCORE Impact, CanvasLargest openly available exploit library; PPO agent sequences Metasploit modules via RPC API; CORE Impact and Canvas are commercial with restricted API
LinPEASPriv-esc enumerationPost-access privilege escalation path discoveryPEAS (manual), sudo-killerLinux privilege escalation enumeration covering SUID binaries, cron jobs, sudo policy, kernel exploits; validates granular sudo policy from inside the device
LUKS2/ cryptsetupDisk encryptionAES-256-XTS full-disk encryption on NVIDIA Orin SD cards per NIST SP 800-38E [61]dm-crypt without LUKS, eCryptfsLinux-native; LUKS2 provides header backup and token-based key management; Argon2id KDF vs. PBKDF2 provides memory-hard defense against GPU brute-force
WPA3 + SAEWireless securityEncrypted wireless communications on all device interfacesWPA2 (PSK), PEAP/EAP-TLSSAE eliminates four-way handshake vulnerability exploitable under WPA2; PEAP/EAP-TLS requires 802.1X infrastructure not viable on constrained IoT hardware
GitLab (self-hosted)DevSecOps/ SCMSecure code repository with MFA, RBAC, cryptographic commit signing, multi-stage CI/CD gatesGitHub Enterprise 3.18.3, Jenkins 2.555.1 + Gitea 1.26.0Self-hosted: full RBAC control, no data residency concerns; native pipeline integration for SAST, SCA, SBOM, DAST, IaC scanning
SemgrepSASTSource code static analysis for C/C++ and PythonSonarQube, Checkmarx, FortifyOpen rule set tunable to project-specific policies; fast enough for commit-level scanning; commercial alternatives cost more for marginal accuracy gain
CheckovIaC scanningInfrastructure-as-Code policy validationTerrascan, tfsecBroadest provider coverage; active maintenance; integrates directly into GitLab CI/CD
GitleaksSecrets scanningCredential and API key detection in commits and repository historyTruffleHog, detect-secretsEntropy-based detection plus regex rules; Git history scanning catches previously committed secrets
Cosign/ SigstoreArtifact signingElliptic Curve Digital Signature Algorithm (ECDSA) signing of build artifacts; SBOM attestationGPG signing, Notary v2Stores signatures in OCI registry alongside artifacts; keyless signing via OIDC; tighter supply chain integration than GPG
SPIFFE/SPIREService identityWorkload identity provisioning for ZT mTLS authenticationVault PKI, cert-managerShort-lived SVIDs (4 h rotation) bound to attested workload identity; no long-lived secrets to rotate
Cybectr SentinelAI enforcement layerEnd-to-end AZTRM-D enforcement: asset discovery, AI analysis, pen test, mitigation, reporting, active defenseTenable.io, Darktrace, Vectra AICovers all four capability gaps simultaneously; designed for AZTRM-D’s access control model; commercial alternatives address individual gaps but not the combination
Table 24. Inter-rater agreement across three independent testers and all stages. Percent agreement and Gwet AC1 are reported alongside the Fleiss kappa to contextualize the kappa paradox at extreme base rates. Source: Stage 1–3 adversarial testing pre-discussion records (this work) [1].
StageTotal FindingsAll 3 Concur2 Concur1 OnlyPct. Agreement (2+)Gwet AC1
Stage 1 (Factory Default)141400100%1.000
Stage 2 (Network Hardened)962188.9%
Stage 3 (Full AZTRM-D)4310100%
All Stages Combined27233196.3%0.888
Em dashes (—) in the Gwet AC1 column for Stages 2 and 3 indicate that per stage AC1 is not reported at those sample sizes ( n = 9 and n = 4 respectively), where the chance-correction estimate becomes unstable. Stage 1’s value of 1.000 is well defined because all 14 findings were unanimous. The All Stages Combined row ( n = 27 ) carries the recommended summary statistic of 0.888.
Table 25. Attack surface coverage by layer across all three testers and all three stages. Source: adversarial testing campaign (this work).
Attack LayerSpecific Vectors TestedTools UsedStages
Hardware: PhysicalSD card removal, offline filesystem mount, UART console (ttyTHS1), GPIO pin accesschroot, Linux mount utilities, logic analyzer1, 2, 3
Hardware: RF/WirelessSDR signal analysis, WiFi traffic capture, Bluetooth MITM probeRTL-SDR, GNU Radio, Wireshark1, 2, 3
Network: PassiveMAC/IP enumeration, ping sweep, traffic observationNmap (passive), Wireshark1, 2, 3
Network: Active ScanFull port scan (nmap -sV -p-), service-version detection, CVE mappingNmap, Nessus Professional, OpenVAS1, 2, 3
Software: CredentialSSH brute-force (default nvidia:nvidia), account lockout bypassHydra1
Software: Vuln ExploitPrivilege escalation enumeration, SUID abuse, reverse shell deploymentLinPEAS, Metasploit (Sentinel sandbox)1, 2
Software: PersistenceInit file modification (/etc/rc.local, .bashrc), hidden account creation, SSH tunnel C2Manual + Metasploit1
Software: Supply ChainUnsigned dependency injection into CI/CD pipeline, AI-generated policy-violating code submissionCustom test artifacts, GitLab pipeline2, 3
Insider: Standard DevConfiguration mistakes, accidental credential commit, insecure service exposureGitLab CI/CD pipeline, Sentinel scanning2, 3
Insider: Privileged DevAttempted root escalation, log tampering, monitoring agent disablementLinPEAS, sudo enumeration1, 2, 3
Insider: AI-AssistedAI-generated exploit code and attack sequences submitted through GitLab pipelineLLM assistant + GitLab pipeline3
Table 26. Stage 1 penetration test findings (factory-default configuration): external attacker and insider ZT evaluation, all three testers. Source: independent adversarial testing (this work) [1].
Attack VectorTool/TechniqueOutcomeExternal Attacker FindingInsider ZT Evaluation
Passive ReconNmap ping sweep, OSINTMAC/IP identified; default credentials found in public JetPack documentationDevice located and attack staged with no prior knowledgeNo ZT policy exists pre-login
Port Scannmap -sV -p-4 open ports: SSH 22, VNC 5900, HTTP 80, HTTPS 443; exact service versions extractedFull network attack surface mappedOpen ports indicate absence of least-privilege network policy; ZT network pillar violated
Vuln ScanNessus Professional, OpenVASMultiple unpatched CVEs in kernel and NVIDIA JetPack driversConcrete exploitation pathways identified by all three testersNo CI/CD scanning in place: 0% VDR in development pipeline
RF/WirelessRTL-SDR, WiresharkWiFi traffic observable in plaintext; no WPA3; Bluetooth interfaces present but inactiveWireless traffic capturable over the air with commodity hardwareNo wireless encryption policy; ZT data-in-transit tenet violated
Initial AccessHydra SSH brute-force (nvidia:nvidia)SSH login achieved in under 5 min by all three testers; no account lockout mechanismFull shell obtained consistentlyDefault credential violates never-trust-always-verify; no lockout means no brute-force protection
Privilege Escalationsudo su (single command)Immediate root from nvidia user; no further tools requiredComplete system control achieved instantlyUnconstrained sudo directly violates least privilege; single command equals full compromise
Persistencerc.local, .bashrc mod.; hidden user; SSH C2Backdoor survives reboot; C2 traffic encrypted inside SSH tunnelPersistent access established; exfiltration channel activeNo init file integrity checking; no immutable log enforcement; persistence invisible to monitoring
Log TamperingManual deletion of auth.log, syslog; shell history clearedForensic trail destroyed completelyNo forensic recovery possible post-attackRoot-writable logs violate ZT immutable-logging tenet; audit trail nonexistent
Table 27. Stage 2 penetration test findings (after initial network hardening), all three testers. Source: independent adversarial testing (this work) [1].
Attack VectorTool/TechniqueOutcomeExternal Attacker FindingInsider ZT Evaluation
Network Reconnmap -sV -p-, Nessus, OpenVAS0 open ports; no exploitable network findingsRemote exploitation not possible; physical pivot requiredNetwork ZT pillar fully satisfied
RF/WirelessRTL-SDR, WiresharkTraffic still observable pre-WPA3; WiFi not yet fully isolatedWireless traffic still capturable; RF vector still openWireless encryption policy not yet complete
Physical: StorageSD card removal; Linux mount; chroot on /etc/shadowRoot filesystem mounted externally; offline password reset performed by all three testersAuthentication bypassed entirely without credentialsPhysical access circumvents all logical ZT controls; hardware integrity not enforced at this stage
Physical: ConsoleUART ttyTHS1 serial connectionConsole accessible post-SD manipulation; login succeeds with reset credentialsShell obtained after physical bypassNo out-of-band access control; UART not gated or monitored
Privilege Escalationsudo suRoot obtained through physical + console chain; sudo group membership survived offline resetFull control regained via physical vectorLogical ZT controls held; physical hardware gap negated them entirely
Insider: Privileged DevAttempted log tampering, monitoring agent kill, lateral access to Git serverBlocked at logical layer; immutable logs held; ZT access policies enforcedNot applicableLogical controls are working correctly; physical access is the only remaining gap
Insider: MistakeDeveloper commits test file containing embedded AWS key (intentional test case)Secrets Scan in CI/CD pipeline catches credentials before merge; commit rejected automaticallyNot applicableAZTRM-D Secrets Scan gate working as designed
Table 28. Stage 3 penetration test findings (full AZTRM-D hardening), all three testers. Source: independent adversarial testing (this work) [1].
Attack VectorTool/TechniqueOutcomeExternal Attacker FindingInsider ZT Evaluation
Network Reconnmap -sV -p-, Nessus, OpenVAS0 open ports confirmed across all three testersNo remote vectorZT network pillar fully maintained
RF/WirelessRTL-SDR, Wireshark, WiFi probeWPA3 enforced [66]; all traffic encrypted; microsegmentation activeNo exploitable RF findingZT data-in-transit tenet satisfied at wireless layer
Physical: StorageSD card removal attemptEncrypted LUKS2 volume presented; mount failed; offline password reset impossiblePhysical storage vector closedAES-256-XTS per NIST SP 800-38E enforces ZT device integrity at hardware level [61]
Physical: ConsoleUART ttyTHS1Hardened login prompt only; no viable credentials after SD encryptionNo exploit path from consoleOut-of-band access gated; no trivial root path available
GPIO PinsDirect GPIO probingGPIO pins disabled; no signal observableHardware attack surface reducedPhysical attack surface hardened end-to-end
Privilege Escalationsudo su, SUID enumeration (LinPEAS), monitoring agent kill attemptAll paths blocked; multi-step validation required; kill attempt logged and alertedEscalation not achievableLeast privilege fully enforced; never-trust-always-verify extended to deepest system layers
Insider: MotivatedAuthenticated privileged developer attempting unauthorized lateral access and log accessAdaptive auth triggered; access revocation fired; ZT PEP blocked all attemptsNot applicableBehavioral anomaly detection (Isolation Forest) flagged abnormal admin activity correctly
Insider: MistakeDeveloper commits file with insecure configuration flagSAST and IaC scans flag policy violation; commit rejected automaticallyNot applicableAutomated scanning catches configuration mistakes before they reach production
Insider: AI-AssistedAll three testers submitted AI-generated exploit code through GitLab pipelineSAST flagged code patterns; Secrets Scan caught embedded credentials; SBOM check rejected unauthorized dependencies; no AI-generated artifact reached stage or production repositoryNot applicableMulti-layer gate structure evaluates code content, not authorship
Supply ChainUnsigned dependency injection into build pipelineSBOM validation and cryptographic artifact signing check rejected unsigned artifact at build gateNot applicableZT cryptographic integrity enforcement working end-to-end [2]
Table 29. Training datasets, sources, and partitioning protocols for AZTRM-D AI subsystems. Source: dataset publications cited per row; partitioning protocols per Stage 3 implementation.
AI SubsystemTraining DatasetPartitioningPreprocessing
Behavioral Anomaly Detection (Isolation Forest)3 months of Stage 3 device telemetry (Cybectr Sentinel proprietary)Unsupervised; sub-sample ψ = 256 per tree, t = 100 treesFeature scaling via min–max normalization on log-transformed counts; categorical features one-hot encoded; missing values imputed via class median
Vulnerability Triage (XGBoost)NIST NVD CVE corpus (CVSS v3.1 enriched) [13]80/20 stratified train/test split; 5-fold cross-validation on training partitionCVE feature extraction (CVSS metrics, CWE category, exploit availability flags); standardized to zero mean, unit variance
Unknown Asset Inference (Sentence Transformer)Author-curated IoT asset library ( N = 47 profiles spanning embedded MCUs, edge-AI platforms, and industrial sensors)80/20 held-out split for threshold calibrationAsset feature concatenation (hardware type, firmware versions, exposed services, communication protocols); tokenization via the Sentence Transformer pretrained model [5]
AI-Guided Pen Testing (PPO)MITRE ATT&CK TTP corpus; Metasploit module catalog [68]500-episode training run, 20-episode held-out evaluation per stageAction space: discretized Metasploit module selection; observation space: target service banner, port state, response codes; sparse-reward shaping per Section 2.3
Mitigation Generation (RAG + LLM)MITRE D3FEND knowledge base [68]Index built once per release; retrieval-only at runtimeDocument chunking at section boundaries; embedding via the same Sentence Transformer model used for asset inference; cosine similarity retrieval at top- k = 5
Adversarial Robustness Testing (DiCE)XGBoost classifier outputs over Stage 3 corpusCounterfactual generation per classifier instance; k = 5 counterfactuals per inputFeature normalization matches XGBoost training preprocessing; counterfactual generation per Equation (8) with λ 1 = 0.5 , λ 2 = 1.0
GNN-Augmented SASTBigVul (3754 vulnerable functions across ≈188,000 total) [16]80/10/10 train/validation/test split per the BigVul standard partitionCode Property Graph extraction via Joern; node features encode token type, data flow relationships, syntactic position; graph normalization per Equation (6)
Table 30. Hyperparameter selection methodology, search range, and final operating values for AZTRM-D AI subsystems. Source: author’s Stage 3 hyperparameter calibration runs (this work).
SubsystemSelection MethodSearch RangeFinal Operating Values
Isolation ForestROC-curve analysis on Stage 3 training corpus; alert threshold tuned for 3.1% target FPRThreshold { 0.50 , 0.55 , , 0.95 } ; trees t { 50 , 100 , 200 } ; sub-sample ψ { 128 , 256 , 512 } Alert threshold 0.6; containment threshold 0.8; t = 100 ; ψ = 256
XGBoost5-fold stratified cross-validation; F1-score maximization with recall weighting η { 0.01 , 0.05 , 0.1 , 0.3 } ; max_depth { 3 , 5 , 7 , 9 } ; λ { 0 , 1 , 5 , 10 } ; γ { 0 , 0.1 , 1 } η = 0.05 ; max_depth = 7 ; λ = 1 ; γ = 0.1 ; recall-weighted scoring
Sentence Transformer cosine similarityHeld-out F1-score maximization on N = 47 asset libraryThreshold { 0.70 , 0.75 , 0.80 , 0.82 , 0.85 , 0.90 , 0.95 } Threshold 0.82 (F1-optimal per Table 21)
PPOSample efficiency on sandbox sparse-reward environment; clipped surrogate per Equation (5) ε { 0.1 , 0.2 , 0.3 } ; γ { 0.95 , 0.99 , 0.999 } ; learning rate { 1 × 10 4 , 3 × 10 4 , 1 × 10 3 } ε = 0.2 ; γ = 0.99 ; learning rate 3 × 10 4 ; 4 update epochs per trajectory
GNN (GCN)5-fold cross-validation on BigVul training partitionHidden dim { 64 , 128 , 256 } ; layers { 2 , 3 , 4 } ; dropout { 0.1 , 0.3 , 0.5 } Hidden dim 128; 3 GCN layers; dropout 0.3; mean-pool readout
DiCEDefault-recommended values from original DiCE implementation [12]Per published defaults k = 5 ; λ 1 = 0.5 ; λ 2 = 1.0
Table 31. Vulnerability detection rate derivation by scanning modality. The bottom three rows (in bold) are summary rows reporting the total corpus size, aggregate detected count, and undetected count. Source: Stage 3 CI/CD pipeline results (this work).
ModalitySeededDiscoveredUnique DetectionsShared Detections
SAST (Semgrep + GNN-augmented)1841111
DAST12369
SCA (SBOM + dependency scan)9274
CSPM7153
IaC Scanning6143
Total Corpus521163 total vulnerabilities
Detected (aggregate)61 (96.8%)
Undetected2 (novel logic flaws, manual review only)
Table 32. Per modality ablation of the Stage 3 vulnerability detection pipeline. Leave-one-out rows compute aggregate VDR with each modality disabled. Single-modality rows compute VDR for each scanner operating alone. Wilson 95% CIs reported throughout. Source: derived from Table 31 (this work).
ConfigurationDetectedVDRWilson 95% CIDetection Loss vs. Full Pipeline
Full pipeline (all 5 modalities)6196.8%[89.1%, 99.1%]— (baseline)
Leave-one-out ablation
Without SAST5079.4%[67.8%, 87.5%] 17.4 pp; SAST is the highest-contribution modality
Without DAST5587.3%[76.9%, 93.4%] 9.5 pp; runtime-behavior coverage gap
Without SCA5485.7%[75.0%, 92.3%] 11.1 pp; dependency-vulnerability coverage gap
Without CSPM5688.9%[78.8%, 94.5%] 7.9 pp; cloud-config drift coverage gap
Without IaC5790.5%[80.7%, 95.6%] 6.3 pp; infrastructure-policy coverage gap
Single-modality coverage
SAST only (Semgrep + GNN)2234.9%[24.3%, 47.2%]
DAST only1523.8%[15.0%, 35.6%]
SCA only1117.5%[10.0%, 28.6%]
CSPM only812.7%[6.6%, 23.1%]
IaC only711.1%[5.5%, 21.2%]
Em dashes (—) in the detection loss vs. full pipeline column for the single-modality coverage rows indicate that the metric is not applicable: detection loss is defined only against the full-pipeline baseline, and single-modality coverage measures absolute per scanner detection rather than loss relative to the baseline.
Table 33. Security effectiveness benchmarks: factory-default baseline versus full AZTRM-D hardening. Source: our prior work [1].
Security MetricBaseline (Factory Default)AZTRM-D HardenedChange
Open Network Ports4 (SSH 22, VNC 5900, HTTP 80, HTTPS 443), confirmed by all three testers via Nmap0, complete elimination of remote attack surface−4 ports
Initial External Access Time<5 min (Hydra brute-force on nvidia:nvidia; no lockout), consistently achieved by all three testersNot possible (no remote or physical vectors)Full elimination
Privilege EscalationImmediate (single sudo su from default user)Blocked; multi-step validation, default paths removedFull elimination
Vulnerability Detection Rate (CI/CD)0%, no automated scanning in pipeline96.8%, SAST + DAST + SCA + CSPM + IaC across five complementary modalities+96.8 pp
Mean Time to Remediate (MTTR)Weeks to months (manual patching, re-flashing)1–3 days (automated alerting + AI-driven remediation; Stage 3 measured, AZTRM-D deployment)10× to 30× faster
Supply Chain VulnerabilityHigh: no SBOM, no dependency scanning, no artifact signingLow: mandatory SBOM + cryptographic signing for all componentsHigh → Low
Table 34. Resource and scalability benchmarks. Source: our prior work [1].
Performance MetricMeasurementWhat It MeansEnvironment
AI Scan CPU Overhead12–18% average during SAST/SCA CI/CD runsContinuous security scanning is computationally viable on edge hardware without degrading operational performanceNVIDIA Orin devices
ZT Policy Enforcement Latency<40 ms per access decision at PEPReal-time ZT checks do not introduce perceptible delays in system-to-system communicationNVIDIA Orin, ZT PEP under load
AI Model Training Time (Initial)14 h using 3 months of log dataOne-time setup cost; defines the bootstrapping requirement before behavioral anomaly detection reaches operational accuracyStandard cloud GPU instance
Scalability (Concurrent Endpoints)Single-device baseline: 3.8% CPU, 41 MB memory, 6.2 ms PEP latency (Stage 3 measured). Sub-linear fleet scaling is architecturally required; physical multi-device characterization is future work (Section 4).Establishes per device resource floor; orchestrator saturation point requires multi-device experimentStage 3 measured; fleet scaling designated future work
Table 35. Generalizability of AZTRM-D claims classified by evidentiary basis. Empirically validated claims are bounded by the Stage 3 deployment scope; architecturally transferable claims rest on tool/protocol design rather than platform specifics; hypothesized claims require Stage 4 multi-platform validation. Source: this work.
ClaimEmpirical (NVIDIA Orin Nano)Architecturally TransferableHypothesized; Requires Stage 4
96.8% VDR (Wilson 95% CI: [0.891, 0.991])Measured on Stage 3 corpus, n = 63 Five CI/CD scanning modalities are platform-agnostic; same modalities on enterprise pipelines should yield comparable rates on comparable corpusExact rate on enterprise OWASP-Top-10-weighted corpus; rate variance across language ecosystems (Java, Go, Rust)
12–18% CPU overhead during scansMeasured on Orin Cortex-A78AE @ 1.5 GHz, 8 GB LPDDR5Overhead is bounded above on more capable hardware: scans are not Orin-tunedExact percentage on x86 enterprise servers, ARM data center (Graviton/Ampere), RISC-V edge platforms
Sub-40 ms ZT PEP latencyMeasured on Orin local networkOn enterprise hardware with faster CPU and more memory bandwidth, latency decreasesExact latency floor on cloud-native enterprise PEP infrastructure; latency under high-concurrency load
ZT enforcement under multi-vector attackMeasured against seven attack categories on OrinSP 800-207 tenets are platform-independent; SPIFFE/SPIRE, mTLS, and PEP enforcement are deployment patterns, not Orin-specificCross-platform attack surface validation: ARM enterprise, x86 enterprise, RISC-V embedded
Cryptographic gate validation (LUKS2, TLS 1.3, ECDSA RFC 6979, SPIFFE SVID)Validated on Orin SD card boot path with custom initramfsLUKS2/TLS 1.3/ECDSA are NIST-specified standards; cryptographic enforcement is independent of platformBoot-path equivalents on UEFI x86, ARM TrustZone, RISC-V Keystone
Insider threat detection (Isolation Forest, 0.6 alert threshold)14 h initial training on 3 months Stage 3 telemetryIsolation Forest training/inference is platform-agnostic; threshold is calibrated against operational base rate, not Orin specificsThreshold recalibration on environments with different operational base rates (enterprise SOC vs. IoT fleet vs. cloud workload)
3.1% aggregate FPRMeasured on Stage 3 single-device corpusFPR is a property of the model and threshold, not the deployment platformPer class FPR characterization at fleet scale (Section 2.6.1); environment-specific recalibration
RF/physical attack vector coverageValidated on Orin GPIO, UART, SD storage, WiFi, BluetoothPhysical and RF attack surfaces are hardware-specific by definitionNot directly applicable to enterprise data center deployments; substitutes are physical security controls, supply chain integrity, firmware signing
4.2 min Time-to-Initial-Detection N = 27 events, Stage 3 single devicePipeline latency is dominated by retrieval and synthesis stages, which are platform-independentTTID floor on cloud-native deployments where retrieval index can be co-located; behavior at fleet scale
Table 36. NIST SP 800-207 Zero Trust tenet mapping to AZTRM-D implementation and Stage 3 validation outcomes. Tenets from [3].
ZT Tenet (NIST SP 800-207)AZTRM-D ImplementationStage 3 Validation Outcome
All data sources treated as resourcesSentinel asset inventory; all network traffic treated as untrusted regardless of origin100% of known lab assets discovered; no implicit trust granted to any device
All communication secured regardless of locationTLS 1.3 for internal traffic; WPA3 for wireless; ECDSA with RFC 6979 nonces [73]MITM simulation: anomalous traffic detected; segment isolated automatically
Per session access to individual resourcesJIT access via SPIFFE/SPIRE SVIDs [74]; session tokens expire; no persistent standing accessSession hijack simulation: expired tokens rejected; no lateral movement achieved
Resource access policy dynamic with behavioral inputsIsolation Forest feeds ZT PEP decisions [9]; adaptive auth triggered on anomaly score >0.6Insider simulation: anomalous admin behavior triggered adaptive auth and access revocation
Monitor integrity and security posture of all assetsFirmware integrity checks; device health monitoring; Sentinel behavioral telemetryFirmware tamper attempts detected; unauthorized processes flagged
Authentication and authorization strictly enforcedMFA + USB hardware key + SSH key + passphrase + 2FA; account lockout at 3 failed attempts per factorBrute-force simulation: account suspended before credentials guessed
Collect information to improve security postureFull immutable logging; SIEM correlation; AI model retraining from operational logsLog tampering attempt: immutable logs preserved; attempt flagged and alerted
Table 37. Cryptographic control validation by pipeline gate, AZTRM-D deployment. Source: Stage 3 gate validation testing (this work).
ControlValidation MethodGateFailure Response
LUKS2 FDE activecryptsetup status check in device health telemetry; IaC scan validates device config manifestPre-deploy IaC scan + continuous Sentinel monitoringDeployment blocked; Sentinel alert; device quarantined from ZT network segment
Artifact signature validCosign verify against trusted signing key at build gateSBOM/signature gate (Admin 1)Unsigned or invalid-signature artifact rejected; commit blocked
TLS 1.3 enforcedCSPM policy check against TLS configuration baseline; active scan for TLS downgrade responseCSPM gate + Sentinel network scanPolicy violation flagged; service blocked from ZT PEP access until remediated
WPA3-SAE activeRF capture test (Wireshark SAE handshake confirmation); CSPM wireless policy checkPre-deploy wireless validation + Sentinel RF monitoringWPA3 fallback to WPA2 detected; wireless segment isolated; alert raised
SVID validitySPIRE health check; SVID expiry monitoring in Sentinel telemetryContinuous Sentinel monitoringExpired SVID causes ZT PEP to reject access; anomalous renewal patterns flagged
ECDSA nonce determinismSAST rule for non-RFC-6979 ECDSA implementations; rule flags random.randint used as cryptographic nonceSAST gatePolicy violation flagged at SAST scan; commit blocked pending remediation
Post-quantum readinessIaC manifest check for approved cryptographic algorithm list; SAST rule flags deprecated algorithms (RSA-2048, DH-1024, P-192)SAST + IaC gateDeprecated algorithm usage blocked from production deployment; migration recommendation generated
Table 38. NIST RMF phase mapping to AZTRM-D lifecycle phases, key activities, and AI/Sentinel roles. RMF phases from [2].
RMF PhaseAZTRM-D PhaseKey ActivitiesAI/Sentinel Role
Prepare [2]PlanningSystem classification; stakeholder identification; risk tolerance definition; supply chain risk assessmentAI-driven data sensitivity classification; automated compliance mapping
Categorize [2]PlanningFIPS 199 impact analysis; authorization boundary definition; data classificationAI auto-labels PII/sensitive data; generates classification report
Select [2]DevelopmentSecurity control baseline selection; ZT control overlay; cryptographic algorithm selectionAI recommends control set based on asset profile and threat model output
Implement [2]Build/DeployControl implementation in CI/CD; cryptographic signing; SBOM generation; ZT PEP deploymentSentinel enforces scanning gates; blocks unsigned artifacts; monitors configuration drift
Assess [2]Test/ReleaseSAST, DAST, SCA, pen testing, ZT policy validationSentinel AI pen test agent; XGBoost triage; SHAP explanations per finding
Authorize [2]Release/DeployFormal authorization decision; residual risk acceptance; Super Admin sign-offAI-generated risk prioritization informs authorization decision
Monitor [2]Operate/MonitorContinuous anomaly detection; firmware integrity; ZT telemetry; AI model retraining; incident responseIsolation Forest continuous monitoring; adaptive ZT policy; ENGAGE active defense
Table 39. Consolidated results across all evaluation dimensions. Each row traces to its originating table or section as indicated in the source column.
DomainKey ResultSource
External Pen Test (Stage 1)Full compromise in <5 min; 4 open ports; immediate root via default credentials; RF traffic capturable; reproduced independently by all three testersTable 26
External Pen Test (Stage 2)Network vector closed (0 open ports); RF still observable; physical SD card attack succeeded; root via UART console; all three testersTable 27
External Pen Test (Stage 3)All vectors blocked; 0 successful compromises; physical and logical ZT enforced; RF traffic encrypted; all three testersTable 28
Insider (Stage 1)All ZT principles violated; unrestricted sudo; log tampering trivialTable 26
Insider (Stage 2)Logical ZT controls held; physical SD bypass circumvented all software monitoring; insider mistake caught by Secrets ScanTable 27
Insider (Stage 3)Never-trust-always-verify enforced at hardware layer; adaptive auth blocked privileged escalation; AI-assisted pipeline attacks caught by automated gatesTable 28
VDR (96.8%) Derivation5 scanning modalities (SAST + DAST + SCA + CSPM + IaC) covering known-class vulnerabilities; 3% gap = human-analyst-only findingsSection 3.9.1
Resource Metrics12–18% CPU overhead (active scan); <40 ms ZT PEP latency; 3.8% CPU/41 MB memory at single-device steady state (Stage 3 measured); multi-device fleet characterization designated as future workTable 34
Sentinel TTID4.2 min average from deployment to first findingTable 4
Sentinel AI AccuracyXGBoost: 94.1% precision, 91.8% recall; BigVul TPR: 81.4%; adversarial detection: 93.7%Table 4
SDLC/SSDLC ComparisonAmong the evaluated frameworks, AZTRM-D is the only one covering Zero Trust, AI integration, IoT security, and continuous monitoring simultaneously; 7 of 14 capabilities absent from all five comparison frameworksTable 10 and Table 11
AI Stack SelectionIsolation Forest selected over OCSVM and autoencoders for computational viability and explainability on edge hardware; XGBoost over neural classifiers for exact SHAP compatibility; PPO over DQN for sparse-reward stability; GNN over rule-based SAST for novel vulnerability detectionSection 3.3
Tool Stack SelectionEach tool selected against documented alternatives; RTL-SDR selected at realistic adversary cost point; dual Nessus/OpenVAS for cross-validation; Semgrep over commercial SAST for tunable false positive controlSection 3.5
Disclaimer/Publisher’s Note: The statements, opinions and data contained in all publications are solely those of the individual author(s) and contributor(s) and not of MDPI and/or the editor(s). MDPI and/or the editor(s) disclaim responsibility for any injury to people or property resulting from any ideas, methods, instructions or products referred to in the content.