1. Introduction
The near-real-time identification of landslide susceptibility remains a field that is still strongly investigated in the scientific literature. On one hand, at a small scale, geotechnical factors triggering landslide processes and slope failures are analyzed [
1,
2,
3,
4]; on the other hand, there is still the need for a constantly updated tool that can be used by local authorities for large-scale early warning activities [
5,
6,
7,
8].
At the territorial scale, one of the most effective solutions for analyzing how and where the ground moves is represented by Remote Sensing. Traditional Remote Sensing approaches for landslide detection and susceptibility assessment, when used independently, present intrinsic limitations. Optical-based methods are strongly affected by cloud cover, illumination conditions, and vegetation, which often hinder continuous monitoring, especially during or immediately after extreme meteorological events. As a consequence, optical imagery may fail to capture early or subtle signals of instability precisely when landslide triggering conditions are most critical. On the other hand, radar data constitute an extremely useful tool for measuring surface movements and, more specifically, ground subsidence [
9]. Radar data are particularly complex to process, yet extremely effective for identifying “moving” areas, as they allow the measurement of even millimetric ground displacements with high precision, depending on the spatial resolution and the wavelength used by the satellite [
10]. Several radar-based satellite constellations provide continuous information on ground movements, and numerous authors in the literature have identified the most effective satellites and the most suitable approaches to fully exploit the potential of this methodology. Among the most commonly used satellites, which offer a good compromise between availability, coverage, spatial and temporal distribution, are the Sentinel satellites of the European Earth observation program Copernicus [
11]. Radar images from this constellation are provided by the Sentinel-1A and Sentinel-1C satellites, characterized by a spatial resolution of 5 × 20 m and operating in the C-band (central frequency of 5.405 GHz). Radar images provided by the Sentinel-1 constellation can be exploited for different types of processing by using both the phase component and the intensity component of the radar signal. With regard to the phase, several well-established methodologies exist to estimate ground deformations recorded by the sensor; among the most widely used are the SBAS-InSAR and PS-InSAR approaches, which are applied differently depending on the application, the scale of analysis, and the characteristics of the study area. A recent study [
12] describes the use of the SBAS-InSAR technique for landslide detection and analysis, allowing the mapping of new landslides with respect to those already known. The same technique has also been used for the monitoring and assessment of urban subsidence susceptibility through InSAR and statistical modeling [
13], in which ground deformations, active faults, lithology, and subsidence susceptibility are related to one another. Interferometric SAR techniques, while providing accurate measurements of ground deformation, are also subject to important constraints. In densely vegetated areas, steep terrains, or zones characterized by rapid surface changes, temporal and geometric decorrelation can significantly reduce interferometric coherence, limiting the reliability or spatial continuity of deformation measurements. Moreover, sudden surface disturbances may lead to a loss of coherence, preventing the detection of deformation precisely in areas undergoing rapid geomorphological change. In this context, backscatter time-series analysis represents a complementary source of information. Variations in radar intensity are less sensitive to coherence loss and can capture surface changes related to vegetation disturbance, soil moisture variation, erosion, or material redistribution. Although backscatter variations do not provide direct measurements of ground displacement, they are particularly effective for highlighting recent and localized surface changes that may precede or accompany instability processes. Several authors have highlighted how the analysis of radar intensity time series can be used to identify anomalies and potential early signals of instability. In Ref. [
14], landslides are detected and characterized by improving the accuracy of unstable area identification through the use of backscatter and multicriteria decision-making (MCDM) techniques. In particular, the study explores the possibility of integrating a non-interferometric radiometric approach by combining several factors, such as slope, lithology, land use, and environmental conditions; the results show that the inclusion of SAR imagery improves the accuracy of landslide identification by approximately 35% compared to the use of multispectral imagery alone.
With regard to landslide phenomena, the scientific literature proposes numerous models and methodologies for the rapid identification of areas with higher susceptibility, with the aim of providing institutions with effective and updatable tools for risk prevention. In this context as well, several studies have analyzed approaches based on geological, geomorphological, climatic, and satellite data. Ref. [
15] presents a bibliometric review of the use of artificial intelligence in landslide susceptibility modeling, highlighting that this technique is increasingly oriented toward the development and use of interpretable models and reliable applications in real operational contexts.
Despite the effectiveness of existing methods, the present work introduces relevant novelties with respect to the state of the art. First, the intensity component of the Sentinel-1 radar signal is exploited and processed through a fully automated pipeline that leverages preprocessed data available on Google Earth Engine (GEE). From these time series, dynamic indicators inspired by an “SBAS-like” approach, are extracted. The term “SBAS-like dynamic indicators” refers to temporal descriptors derived from Sentinel-1 radiometrically calibrated backscatter time series, conceptually inspired by the multitemporal logic of SBAS processing but computed exclusively on intensity data. The analysis is performed on σ0 VV backscatter values extracted from Sentinel-1 GRD products, preprocessed and calibrated within the Google Earth Engine (GEE) environment. For each pixel, a multitemporal backscatter stack is constructed using acquisitions acquired from the same orbit to ensure geometric consistency. Let σ0(t) denote the calibrated VV backscatter value at acquisition time t. The following temporal indicators are then computed:
Linear backscatter trend (T), estimated as the slope of a least-squares linear regression fitted to σ0(t), representing the average rate of radiometric change over time;
Temporal standard deviation (STD), defined as the standard deviation of σ0(t), used as a measure of radiometric variability and surface instability;
Normalized trend (Z-score), computed by normalizing the pixel-wise trend with respect to the mean and standard deviation of the trend distribution over the entire study area, in order to highlight statistically anomalous behaviors;
Statistical temporal correlation (R), calculated as a pixel-wise correlation metric describing the temporal regularity of the backscatter signal.
Snow-affected acquisitions are identified through the detection of abrupt, seasonal drops in VV backscatter and visual inspection of anomalous temporal outliers, and they are excluded from the final stack. This strategy allows the reduction in seasonal and meteorological influences without applying explicit temporal detrending or harmonic modeling. Radiometric calibration uncertainties are mitigated by using consistently preprocessed Sentinel-1 GRD products and by focusing on relative temporal variations rather than absolute backscatter values. The adopted indicators are therefore robust to small calibration biases and are intentionally designed to detect persistent or anomalous temporal behaviors rather than precise physical surface properties. Subsequently, the SBAS-InSAR technique is effectively applied to the study area to generate a velocity map limited exclusively to the ROIs identified through backscatter analysis. Through this combined approach, intensity analysis acts as an effective preliminary filter, while the SBAS technique proves essential for the dynamic characterization of the territory. Their integration also allows for a significant reduction in false positives, providing greater value to territorial planning processes, civil protection activities, and continuous monitoring systems. Finally, the results are integrated into a 3D-4D WebGIS system that enables the near-real-time visualization of landslide hazard information, offering an operational and updatable tool for risk monitoring and management.
2. Materials and Methods
The methodology adopted in the present research work is structured into different phases, summarized as follows:
Preliminary analysis through backscatter analysis of Sentinel-1 images;
Evaluation of ground dynamic behavior through SBAS-InSAR analysis within the ROIs identified by backscatter analysis;
Integration into the landslide susceptibility model and into a 3D-4D WebGIS system with Decision Support System (DSS) connotation.
With regard to the first phase, namely the preliminary analysis through backscatter analysis of Sentinel-1 images, the selection of Sentinel-1 satellite images for the study area was carried out. Twenty Sentinel-1 acquisitions from 2021, all belonging to the same orbit to ensure geometric consistency, were selected. From each scene, the calibrated VV backscatter band (σ0, expressed in dB) was extracted. The images were resampled onto a common spatial grid and used to construct a multitemporal stack with dimensions T × H × W. During this initial stage, no data values introduced by image clipping were converted to NaN, and a validity mask was generated by retaining only pixels that were consistently valid across all acquisition dates. To minimize the influence of seasonal effects, particularly snow cover, the analysis was repeated on a reduced subset of the dataset, decreasing the total number of acquisitions from twenty to seventeen. Snow-affected scenes were identified through a combined approach: detection of abrupt, seasonal decreases in VV backscatter, characteristic of snow-covered surfaces, and visual inspection of time-series outliers consistent with documented winter snowfall events in the study area. For each pixel in the multitemporal stack, several key temporal metrics were computed. These include the temporal trend of the backscatter signal (rate of change in dB per unit time); the standard deviation, which provides an indication of variability or instability; and the Z-score of the trend, used to enhance the identification of anomalous behaviors relative to the global distribution. The metric employed is not interferometric coherence; instead, it consists of a pixel-wise statistical temporal correlation calculated on the calibrated VV backscatter values across the time series. This correlation quantifies the radiometric regularity and temporal consistency of each pixel, independently of any phase information. This processing pipeline enables optimized detection of radiometrically active or anomalous areas, potentially associated with surface-related phenomena. Subsequently, a change-detection analysis was performed to identify surface instability. To detect sudden and persistent variations, which are typical indicators of surface disturbances, the analysis was applied on a pixel-by-pixel basis across the temporal stack. Temporal differences were computed, and several diagnostic metrics were derived: the synchrony F(t), defined as the percentage of pixels exhibiting significant changes within a given time interval and useful for filtering out spatially diffuse events such as rainfall or snowfall; the break amplitude (B), corresponding to the maximum observed jump in backscatter intensity (in dB) over time; and persistence, calculated as the difference between post-event and pre-event mean backscatter values. In addition, post-event stability was evaluated, as low variability following a detected change is consistent with a genuine surface modification rather than a transient fluctuation. Only pixels satisfying a combination of the derived criteria were ultimately classified as anomalous. These pixels were then spatially clustered, and small or isolated clusters (likely attributable to noise) were discarded. For each retained cluster, the mean temporal backscatter profile and the timing of the detected break were analyzed.
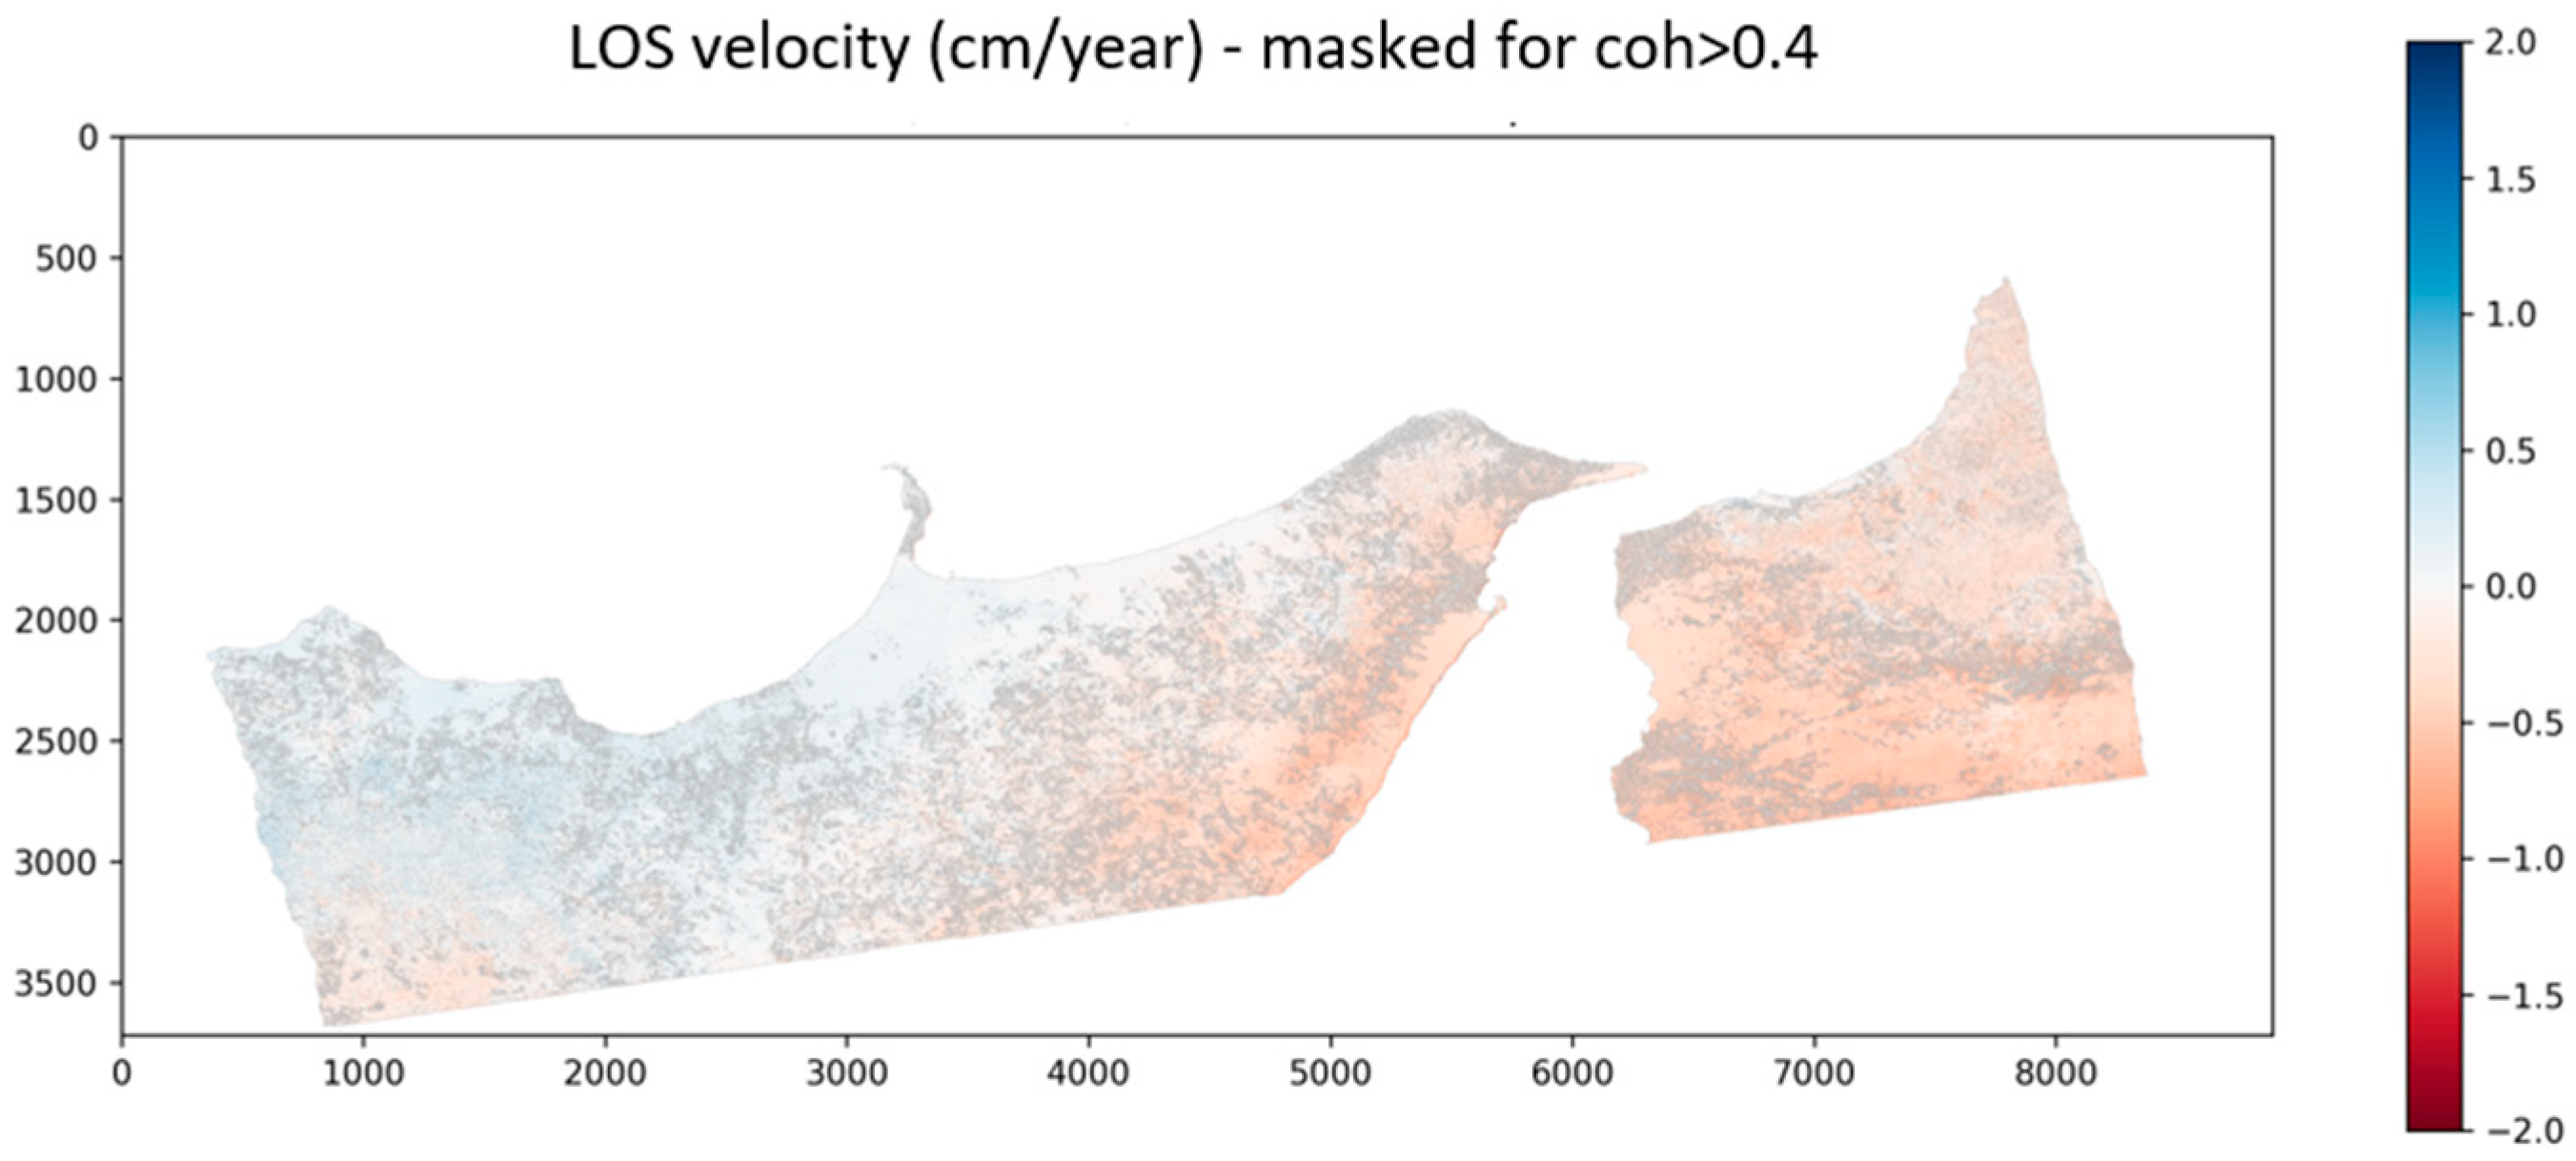
With regard to the second phase, namely the evaluation of ground dynamic behavior through SBAS-InSAR analysis within the ROIs identified by backscatter analysis, the SBAS-InSAR technique was applied using MintPy to generate the ground deformation velocity map and the time series over predefined time intervals. In particular, complex interferograms, coherence maps, and the DEM with the corresponding geometries (latitude, longitude, and incidence angle) were generated using the SNAP software (Version 13.0.0), since MintPy accepts standardized formats and converts them into HDF5 files. Once the MintPy configuration file was set, the files were converted into HDF5 format through mintpy.load_data, integrity checks were performed, temporal and spatial normalization was applied, and the interferogram stack (ifgramStack.h5) was generated. Water masks and coherence masks were then applied, along with spatial smoothing. Subsequently, phase components not related to deformation were separated, and the residual topographic error was estimated through spatiotemporal regression. The process then moved to the crucial phase of time-series estimation, by solving the interferometric system to extract cumulative deformation over time for each pixel and generating the timeseries.h5 file as output. Finally, the deformation velocity (mm/year) was estimated for each of the clusters identified during the first phase.
In the third phase, namely the integration into the landslide susceptibility model and into the 3D-4D WebGIS system with DSS connotation, the results of the second phase (namely the areas where both components of the radar signal contribute to the identification of instability zones) were integrated within a simulation framework that uses a weighted sum of static and dynamic contributions. The used model is essentially based on the combination of different causal factors, with the aim of representing, albeit in a simplified manner, the behavior of the territory. Static factors include lithology, slope, geomorphology, land cover, and other territorial attributes, which represent the long-term predisposition of the terrain to instability. These factors are normalized and discretized into thematic classes and combined using a weighted linear model. Dynamic information derived from Sentinel-1 data is incorporated as an additional causal component of the model. The radar-derived parameters are not considered as a standalone susceptibility product but as a dynamic contribution that complements the static factors.
The overall susceptibility index S is computed as a weighted combination of static and dynamic components [
16], according to a weighted overlay approach (1):
where F
s represents the set of static factors, w
s their associated weights, and D
sar the dynamic SAR-derived contribution, weighted by w
d. The weighting scheme is defined to preserve the dominance of the static predisposition of the terrain while allowing dynamic radar signals to modulate susceptibility in response to recent or ongoing surface processes.
The adopted model and the 3D/4D WebGIS system, described in [
17], were designed to be composed of the following:
Geospatial database (PostgreSQL/PostGIS), for the management of raster and vector data;
GeoServer, for the publication of geospatial services (WMS, WFS, WCS) compliant with OGC standards;
Backend API (FastAPI), for the management of REST services and processing operations;
Frontend (CesiumJS), for interactive three-dimensional visualization and management of geospatial layers.
The integration of the phase and intensity components of the radar signal made it possible to effectively calibrate the developed model, first enabling a preliminary analysis of areas characterized by radiometric anomalies and subsequently a quantitative assessment of ground deformation velocity. This latter information was used as a dynamic input within the neural network integrated into the WebGIS system, allowing the inference of landslide susceptibility values.
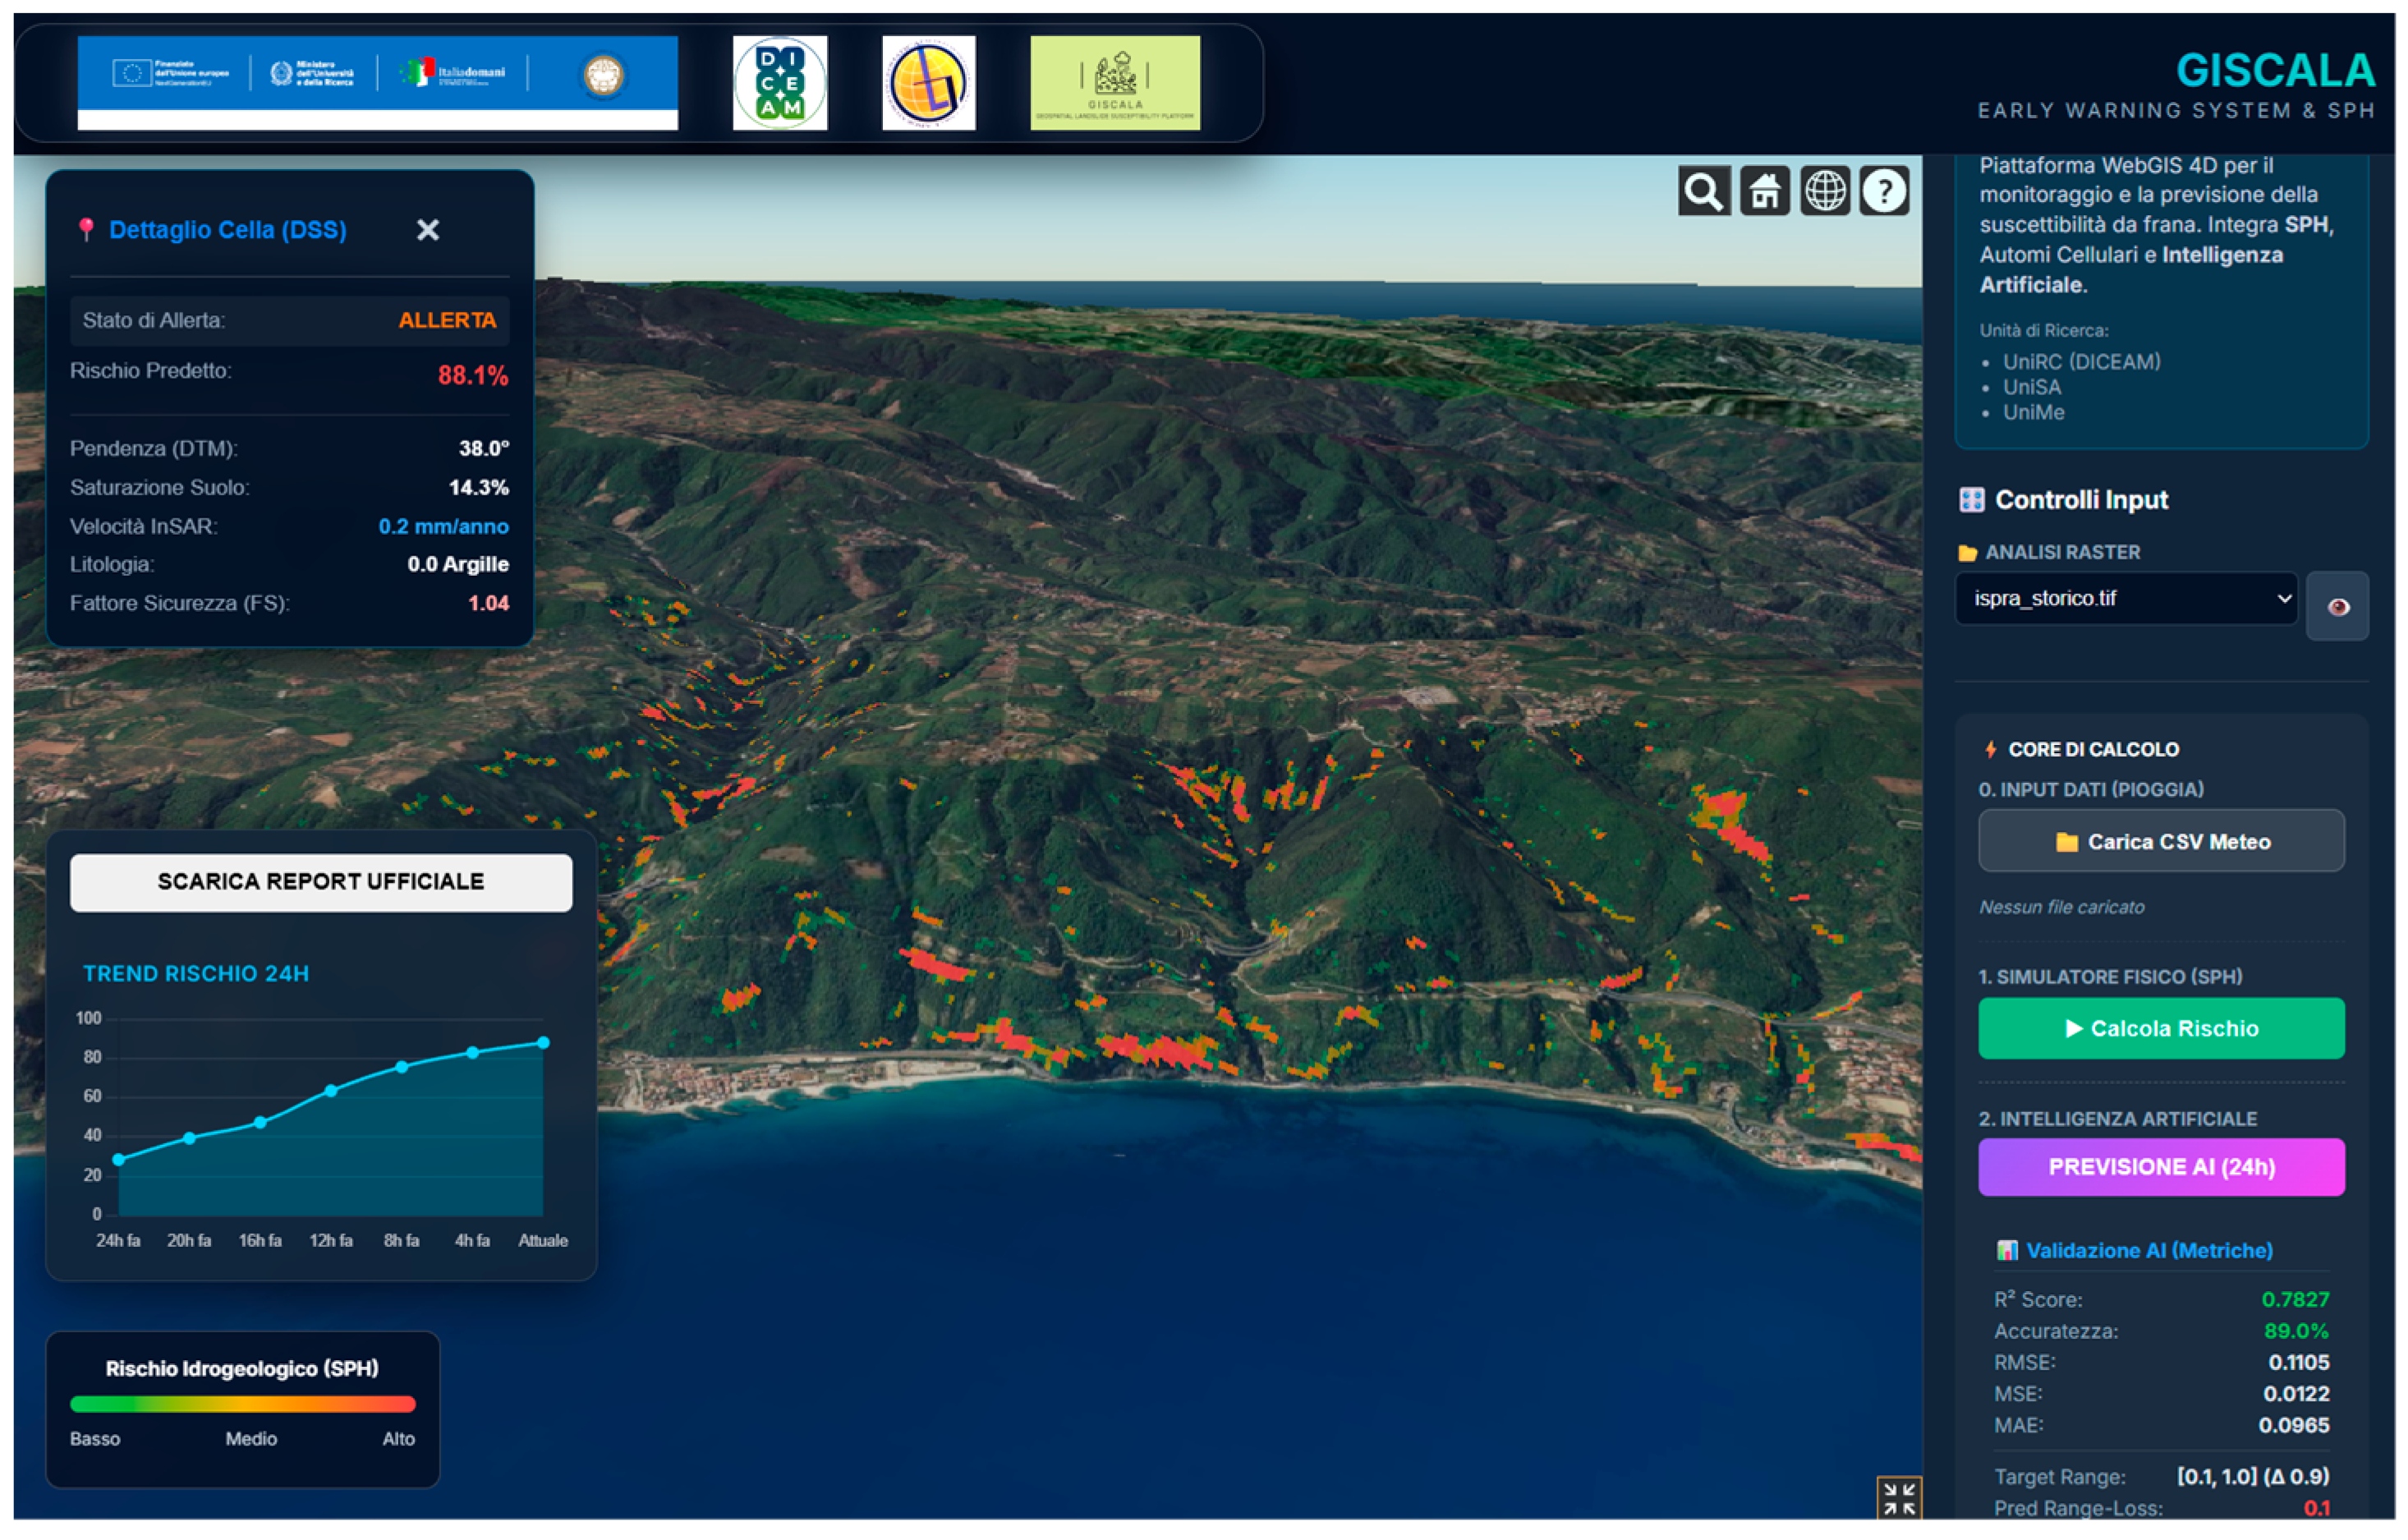
The developed system overall enables the visualization and management of input raster data, the execution of simulations based on a model capable of representing (albeit in a simplified method) the complex hydro-geological dynamics of the territory, and the consultation of inference outputs produced by a neural network specifically designed for the prediction and zoning of areas belonging to different alert classes. The neural network component is not used as a standalone classifier aimed at directly detecting landslides. Instead, it is embedded within the broader susceptibility modelling framework as a pattern recognition and inference module, designed to integrate static territorial factors and dynamic information derived from simulations and satellite data. The input features of the neural network consist of both static and dynamic variables. Static features include morphometric, geological, and land-use parameters characterizing the long-term predisposition of the terrain. Dynamic features include satellite-derived information, such as SBAS-InSAR deformation velocity and backscatter-based anomaly indicators, as well as variables generated by the simulation framework integrated into the WebGIS environment. The adopted neural network is a feed-forward Artificial Neural Network composed of three hidden layers with 128, 64, and 32 neurons, respectively. This funnel-shaped architecture is designed to progressively extract the most relevant features while reducing noise and redundancy in the input data. The network is trained using the Adam optimizer with a learning rate set to 0.001 and a batch size of 256. To mitigate overfitting, a dropout rate of 0.3 is applied, and an early stopping strategy with a patience of 10 epochs is implemented, interrupting the training process when no improvement in validation performance is observed. Training and validation are performed using datasets derived from both historical landslide inventories and simulated scenarios generated within the modelling framework.
Thanks to this integrated architecture, the WebGIS platform assumes the characteristics of a Decision Support System (DSS), providing an operational tool capable of dynamic updating and of supporting monitoring activities, territorial planning, and risk management. The system therefore represents an effective early-warning tool, potentially usable by institutional bodies and civil protection agencies to support decision-making in contexts characterized by high hydro-geological vulnerability.
Study Area
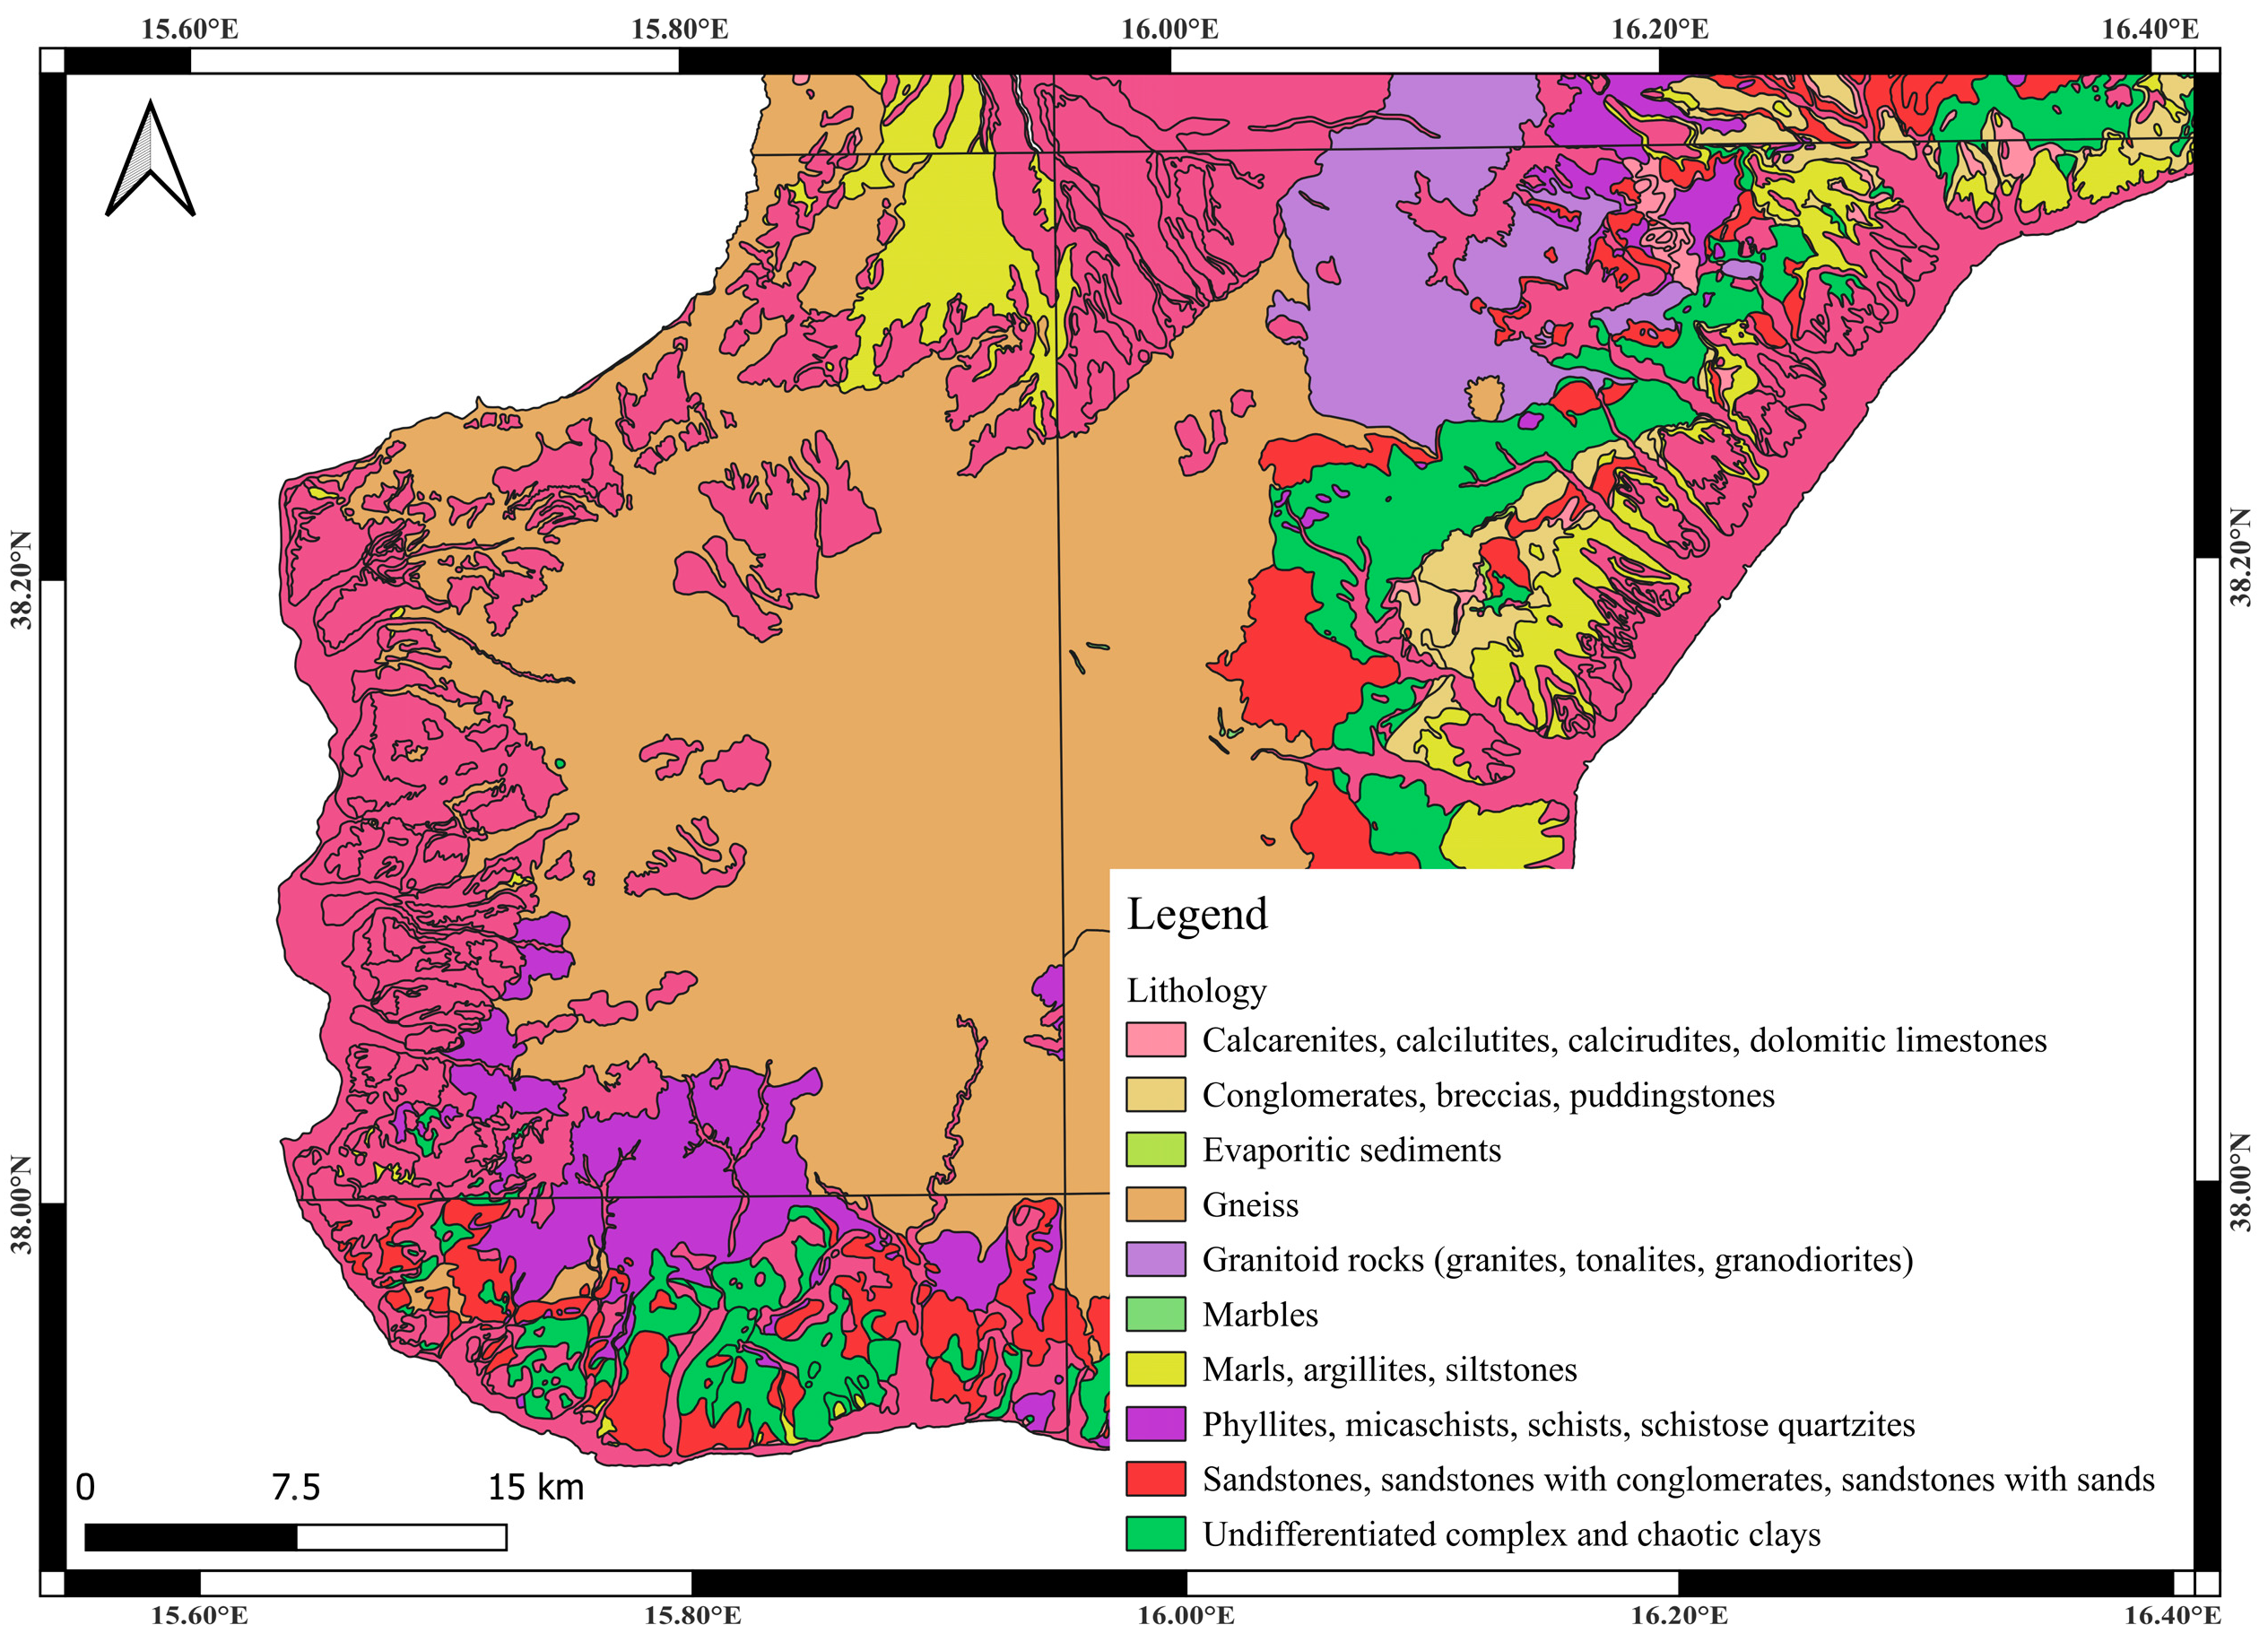
The study area selected for the application of this methodology is located in Southern Italy and is known for its high slope instability, caused by intense rainfall and a significant hydrogeological risk. From a geological perspective, the area is characterized by a long and complex tectonic history related to the convergence between the African and Eurasian plates. From a lithostratigraphic point of view (
Figure 1), the territory is composed of a metamorphic basement consisting of gneiss, schists, and phyllites, overlain by sedimentary covers made up of sandstones, calcarenites, and deposits with variable grain size.
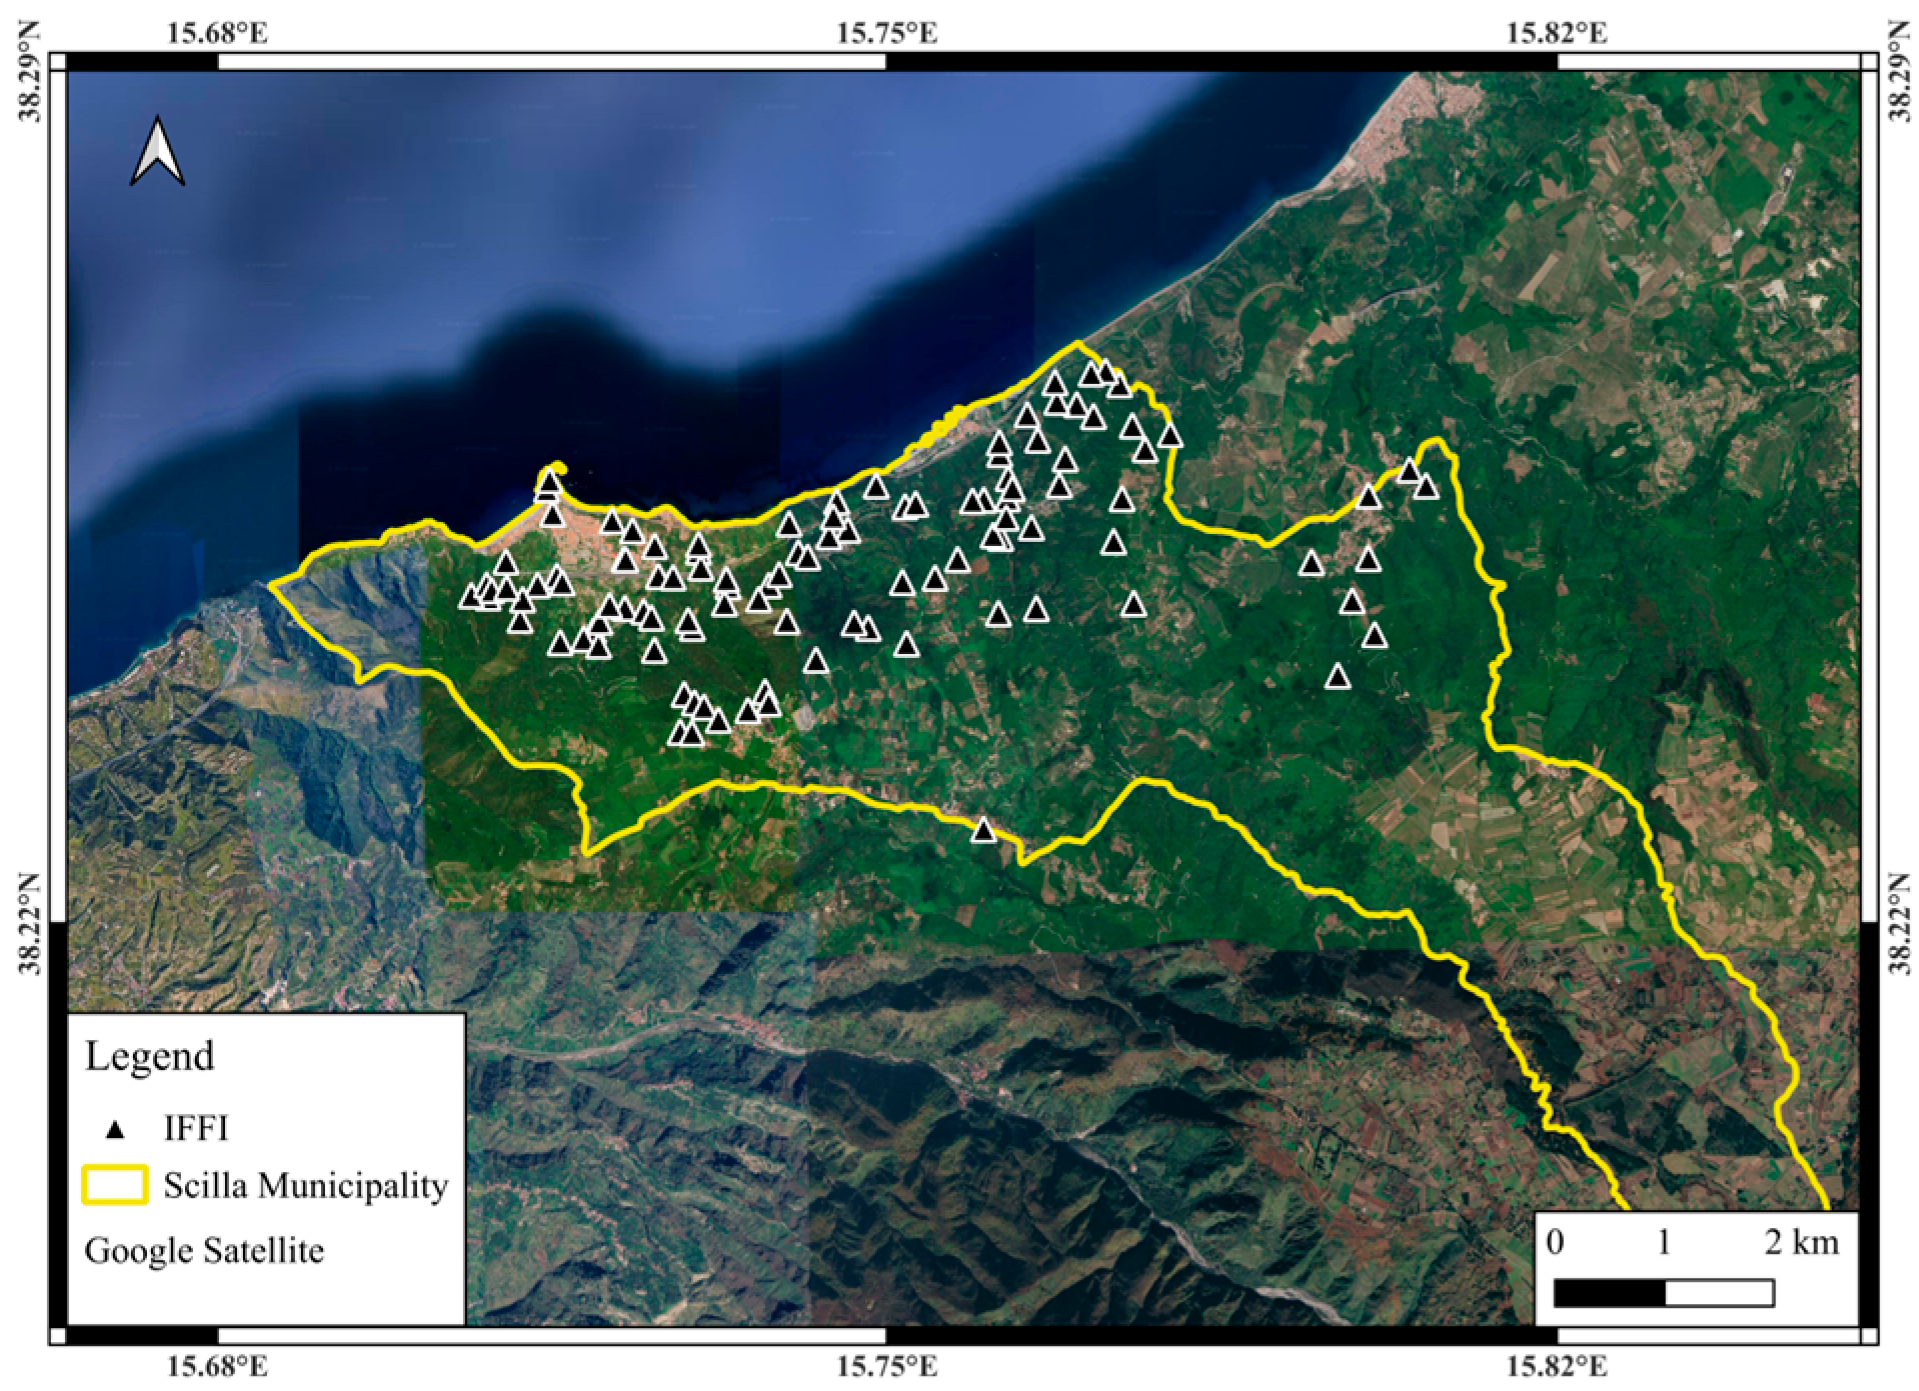
The steepness of the slopes and the strong incision of the hydrographic network make the area particularly vulnerable to shallow landslides, debris flows, and rapid instability processes, which are frequently reactivated during intense rainfall events. The increasing frequency of extreme weather events, such as intense precipitation episodes or prolonged drought periods followed by heavy rainfall, is important in the triggering and reactivation of landslide processes. These conditions alter soil moisture, pore pressure, and slope stability, often leading to rapid changes in susceptibility and making traditional static assessments insufficient. In particular, the Favazzina area represents one of the most critical sectors from a geological-geomorphological perspective along the entire Calabrian Costa Viola (
Figure 2).
It is located between the steep mountainous slopes of the western Aspromonte and a narrow, heavily urbanized coastal strip, crossed by important strategic infrastructures such as the Tyrrhenian railway line, the SS18 state road, and the A2 motorway. From a geomorphological standpoint, the area is characterized by very steep slopes, deep and narrow torrential incisions with high erosive capacity, and a disordered drainage network, partly attributable to anthropogenic interventions. This results in a clear need for regional and local authorities to have an advanced methodology available that is not aimed at producing a new landslide inventory but rather at providing a tool oriented toward early landslide susceptibility assessment. In fact, the set of territorial characteristics highlights how landslide phenomena in this area are spatially widespread, often reactivated and controlled by the coexistence of slow and rapid processes. It is therefore important to develop combined methodologies capable of identifying potentially unstable areas, distinguishing signals of superficial instability from slow deformations, and supporting land-use planning and continuous territorial monitoring.
3. Results
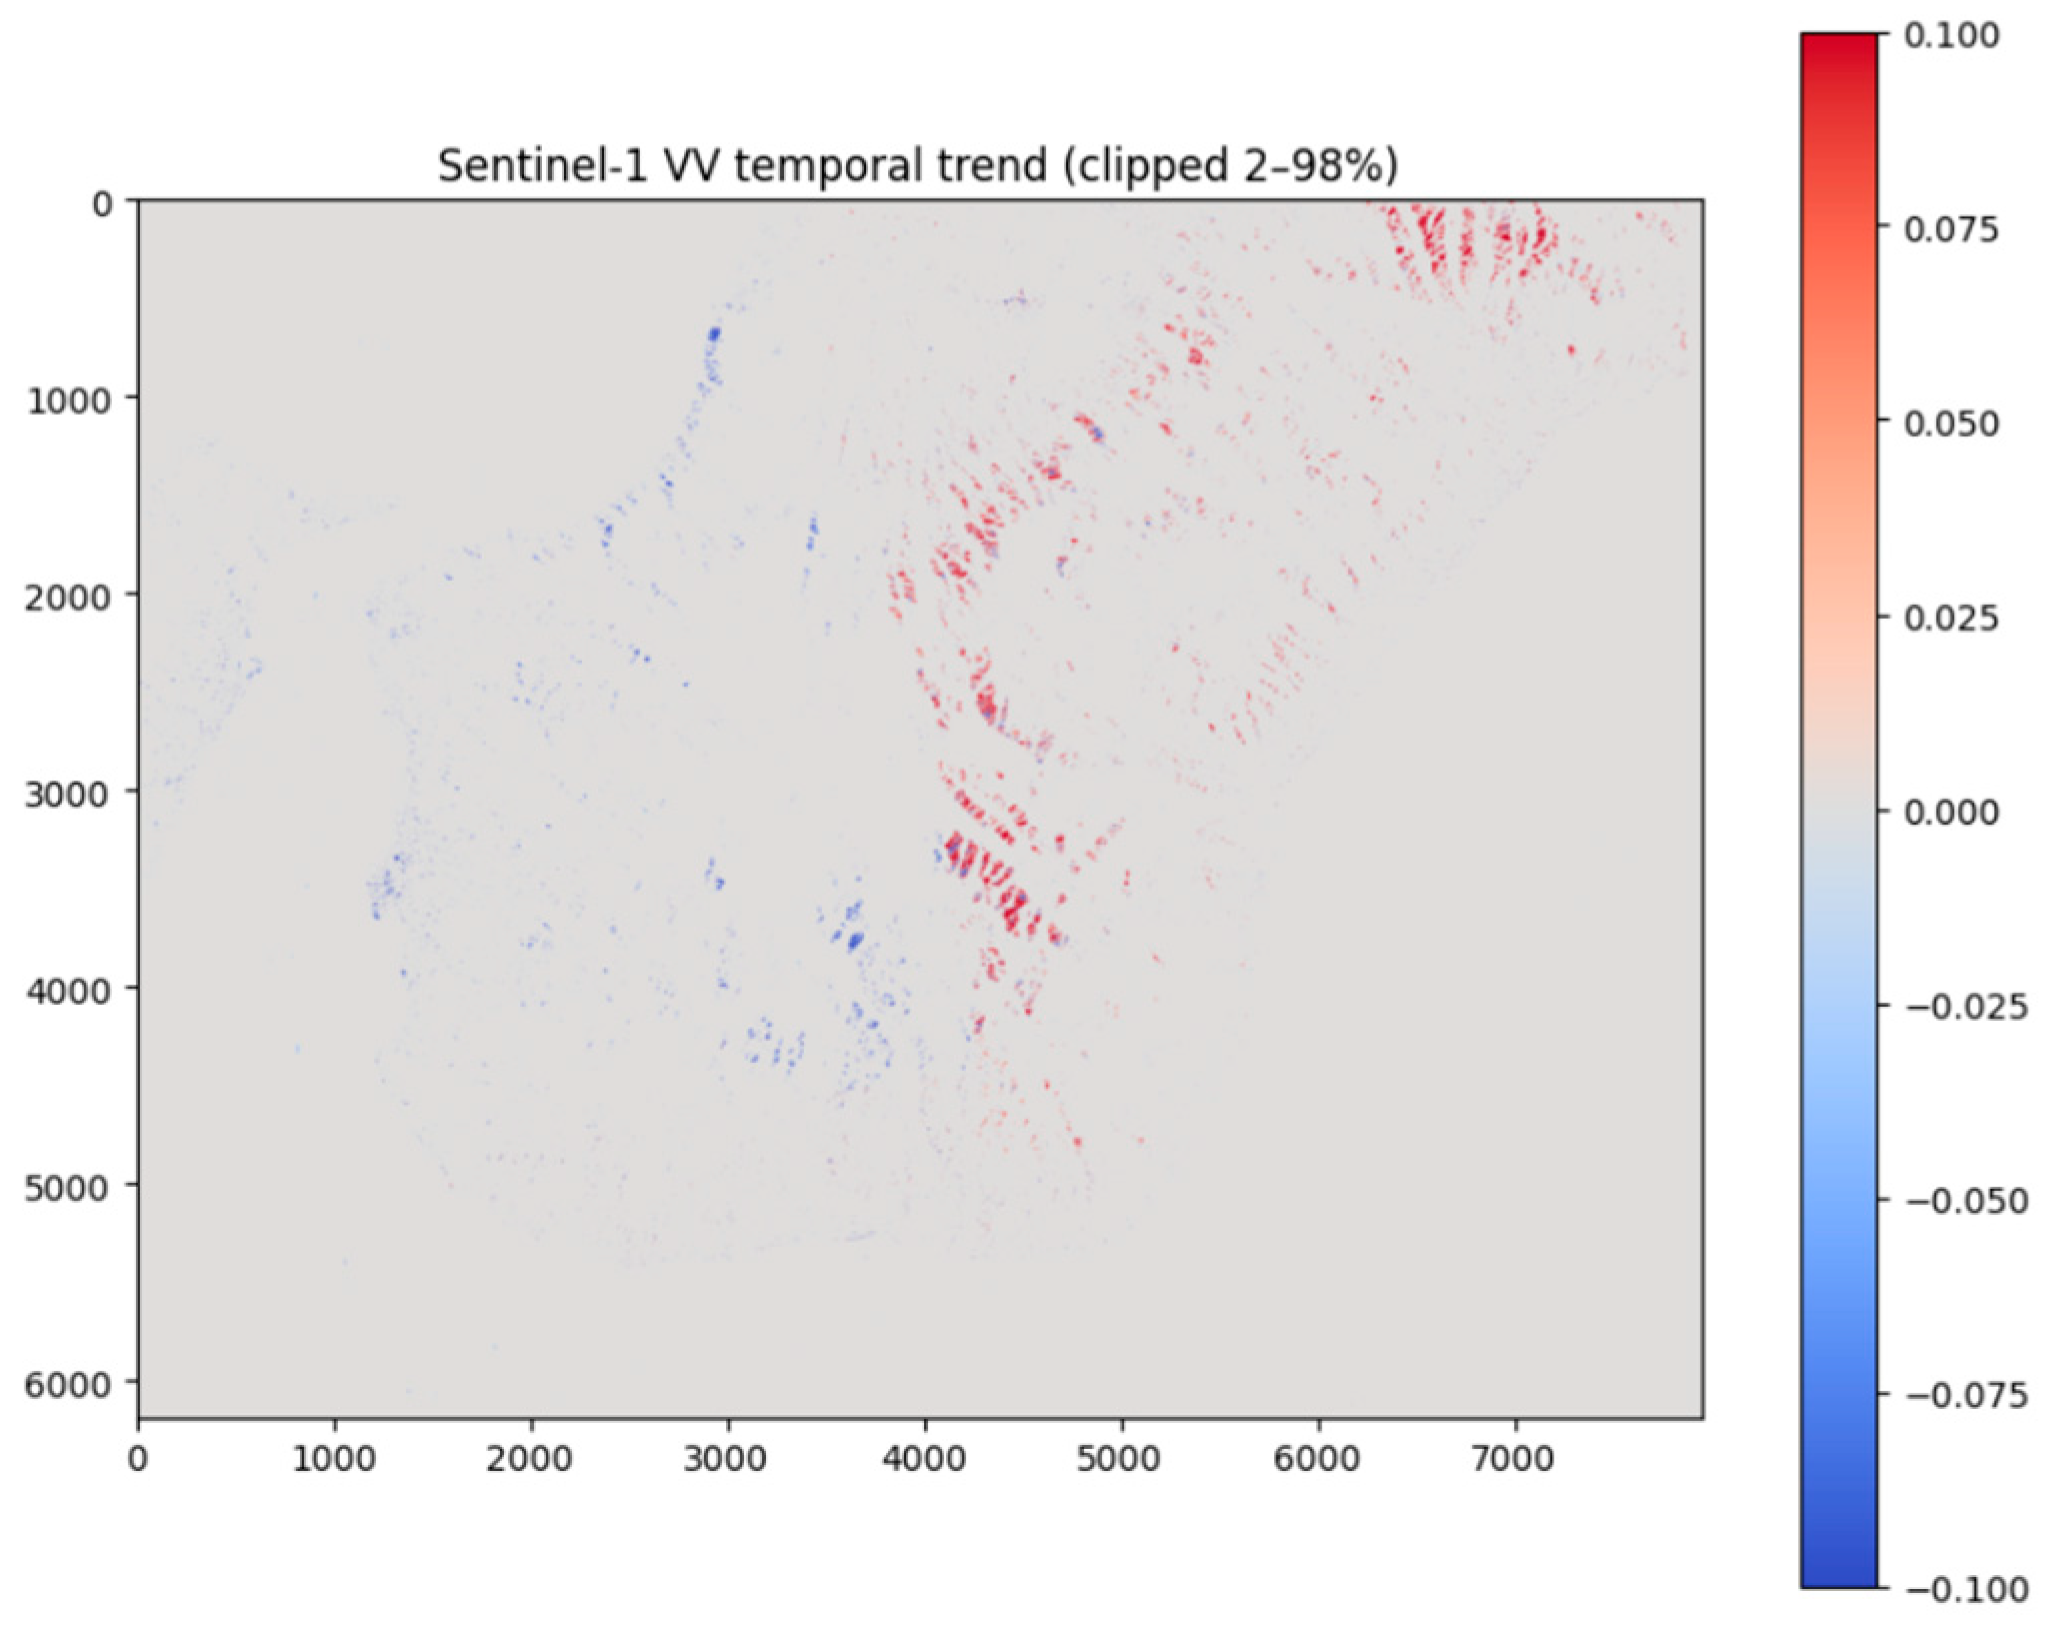
The methodology described above allowed us to conduct important assessments on the study area, which is subject to significant morphological changes and therefore requires detailed analysis. As anticipated, the temporal trend of the VV backscatter was calculated, as shown in
Figure 3.
Figure 3 shows the linear trend of VV backscatter over the analyzed period, after clipping the extreme values. The signal shows a coherent structure, with evident areas of positive trend (red), mainly located along ridges and exposed slopes of the province, indicative of a progressive increase in backscatter. There are also rarer and irregularly distributed areas of negative trend (blue), which can be interpreted as zones characterized by radiometric attenuation variations (e.g., subsidence phenomena or reduction in surface roughness). Overall, this trend confirms the presence of significant surface dynamics within the study area.
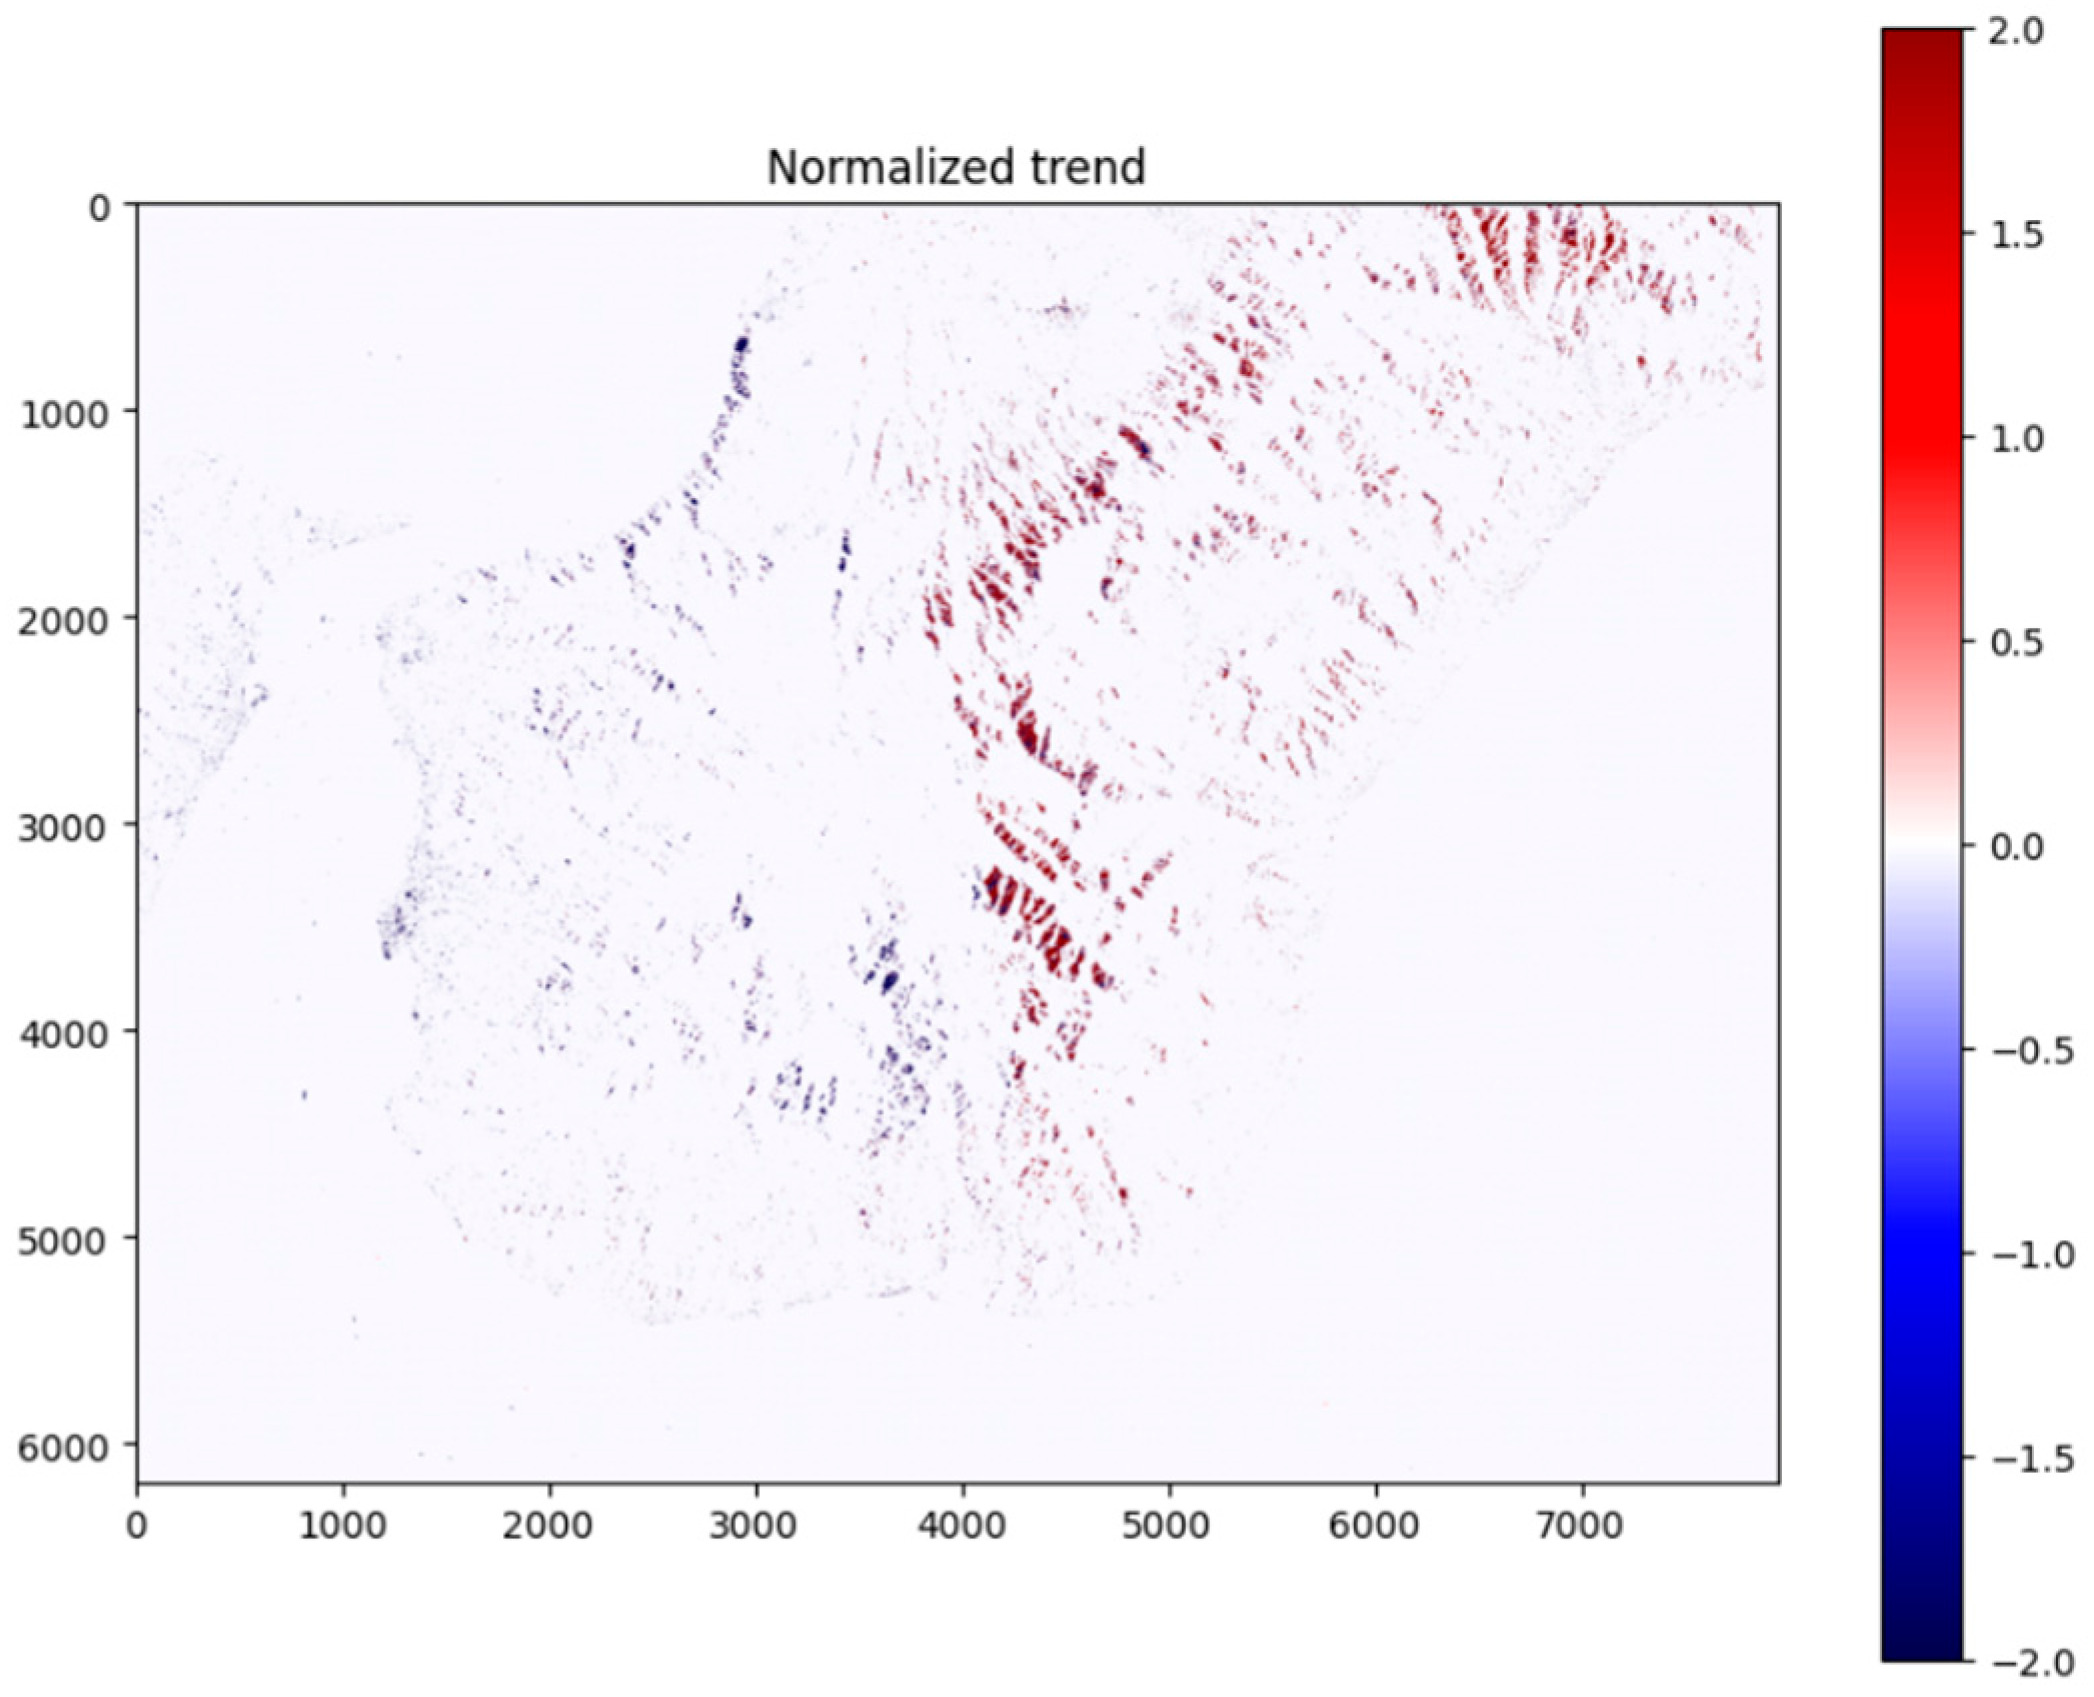
Figure 4 shows the normalized trend, i.e., the trend compared to the global distribution, and highlights Z values > 1 (deep red) as the most marked positive variations compared to the average, while Z values < −1 (deep blue) highlight negative changes inconsistent with the typical variability in the area. Normalization allows us to isolate the most statistically significant anomalies, distinguishing them from smaller or uniformly distributed variations.
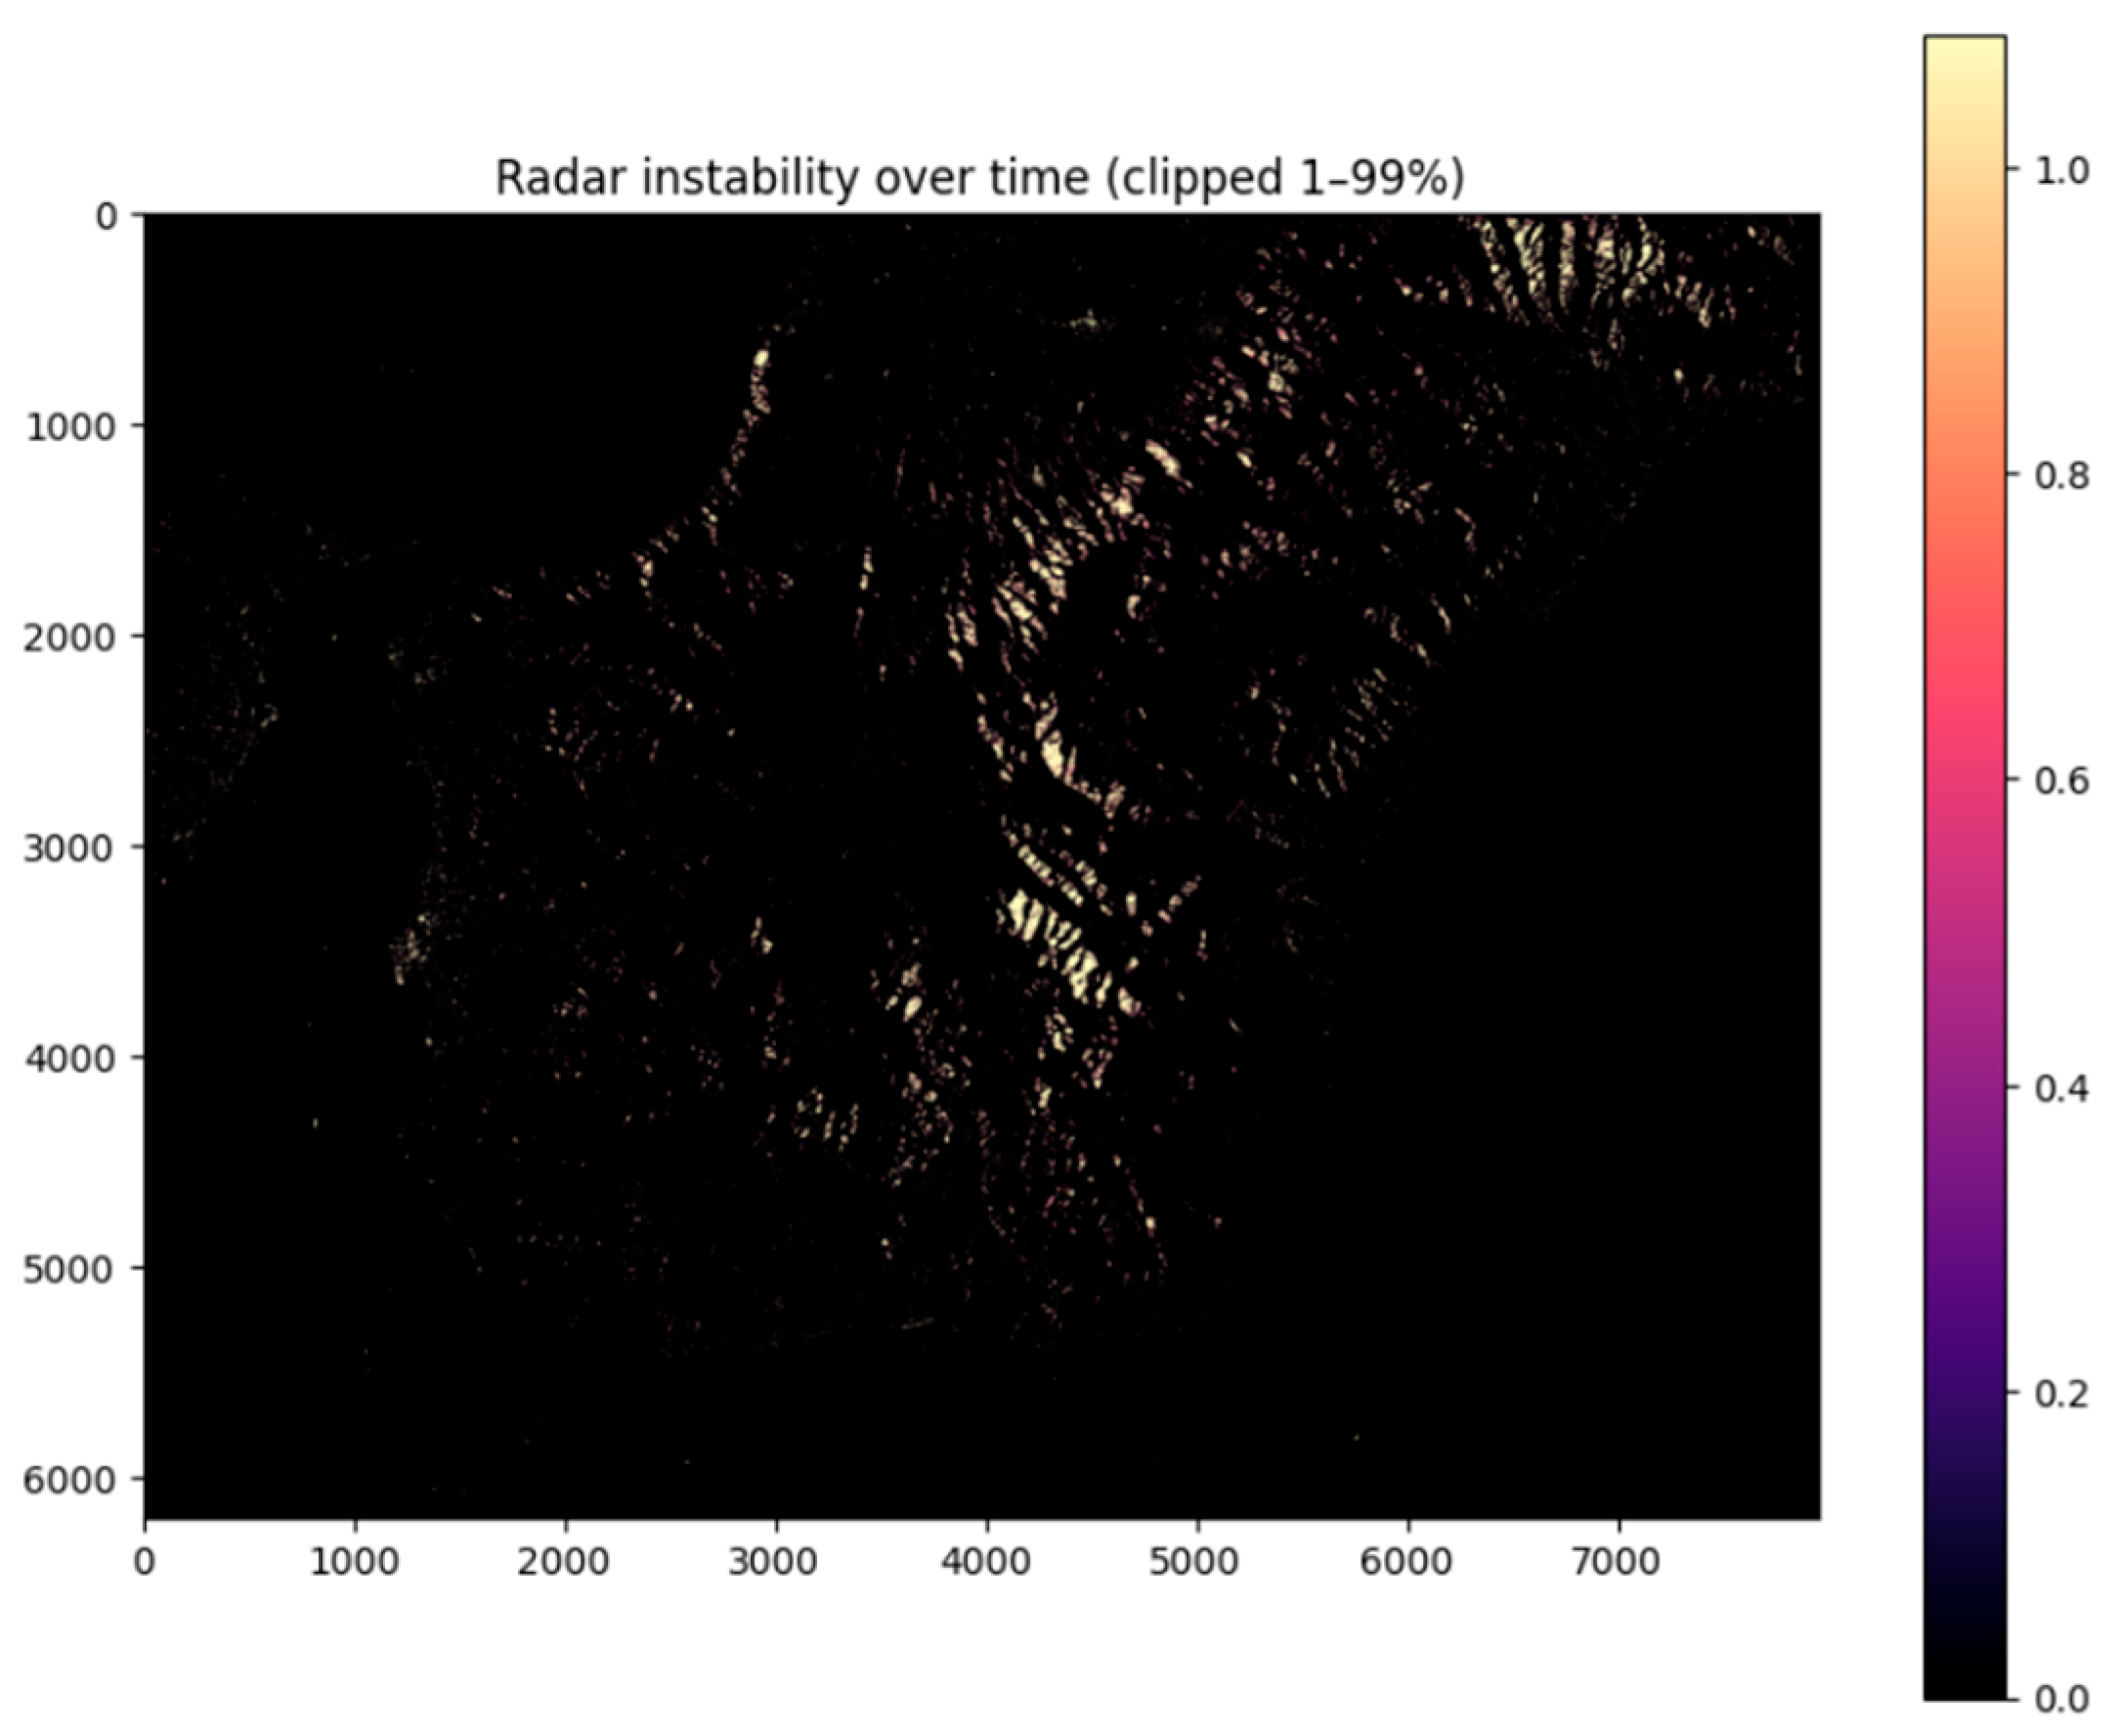
Figure 5 shows the temporal standard deviation of backscatter, used as an index of radiometric instability. Areas with high standard deviation, typically between 0.6 and 1.0 dB, suggest surfaces subject to frequent and repeated changes over time, consistent with active dynamics or highly radiometrically sensitive surface conditions.
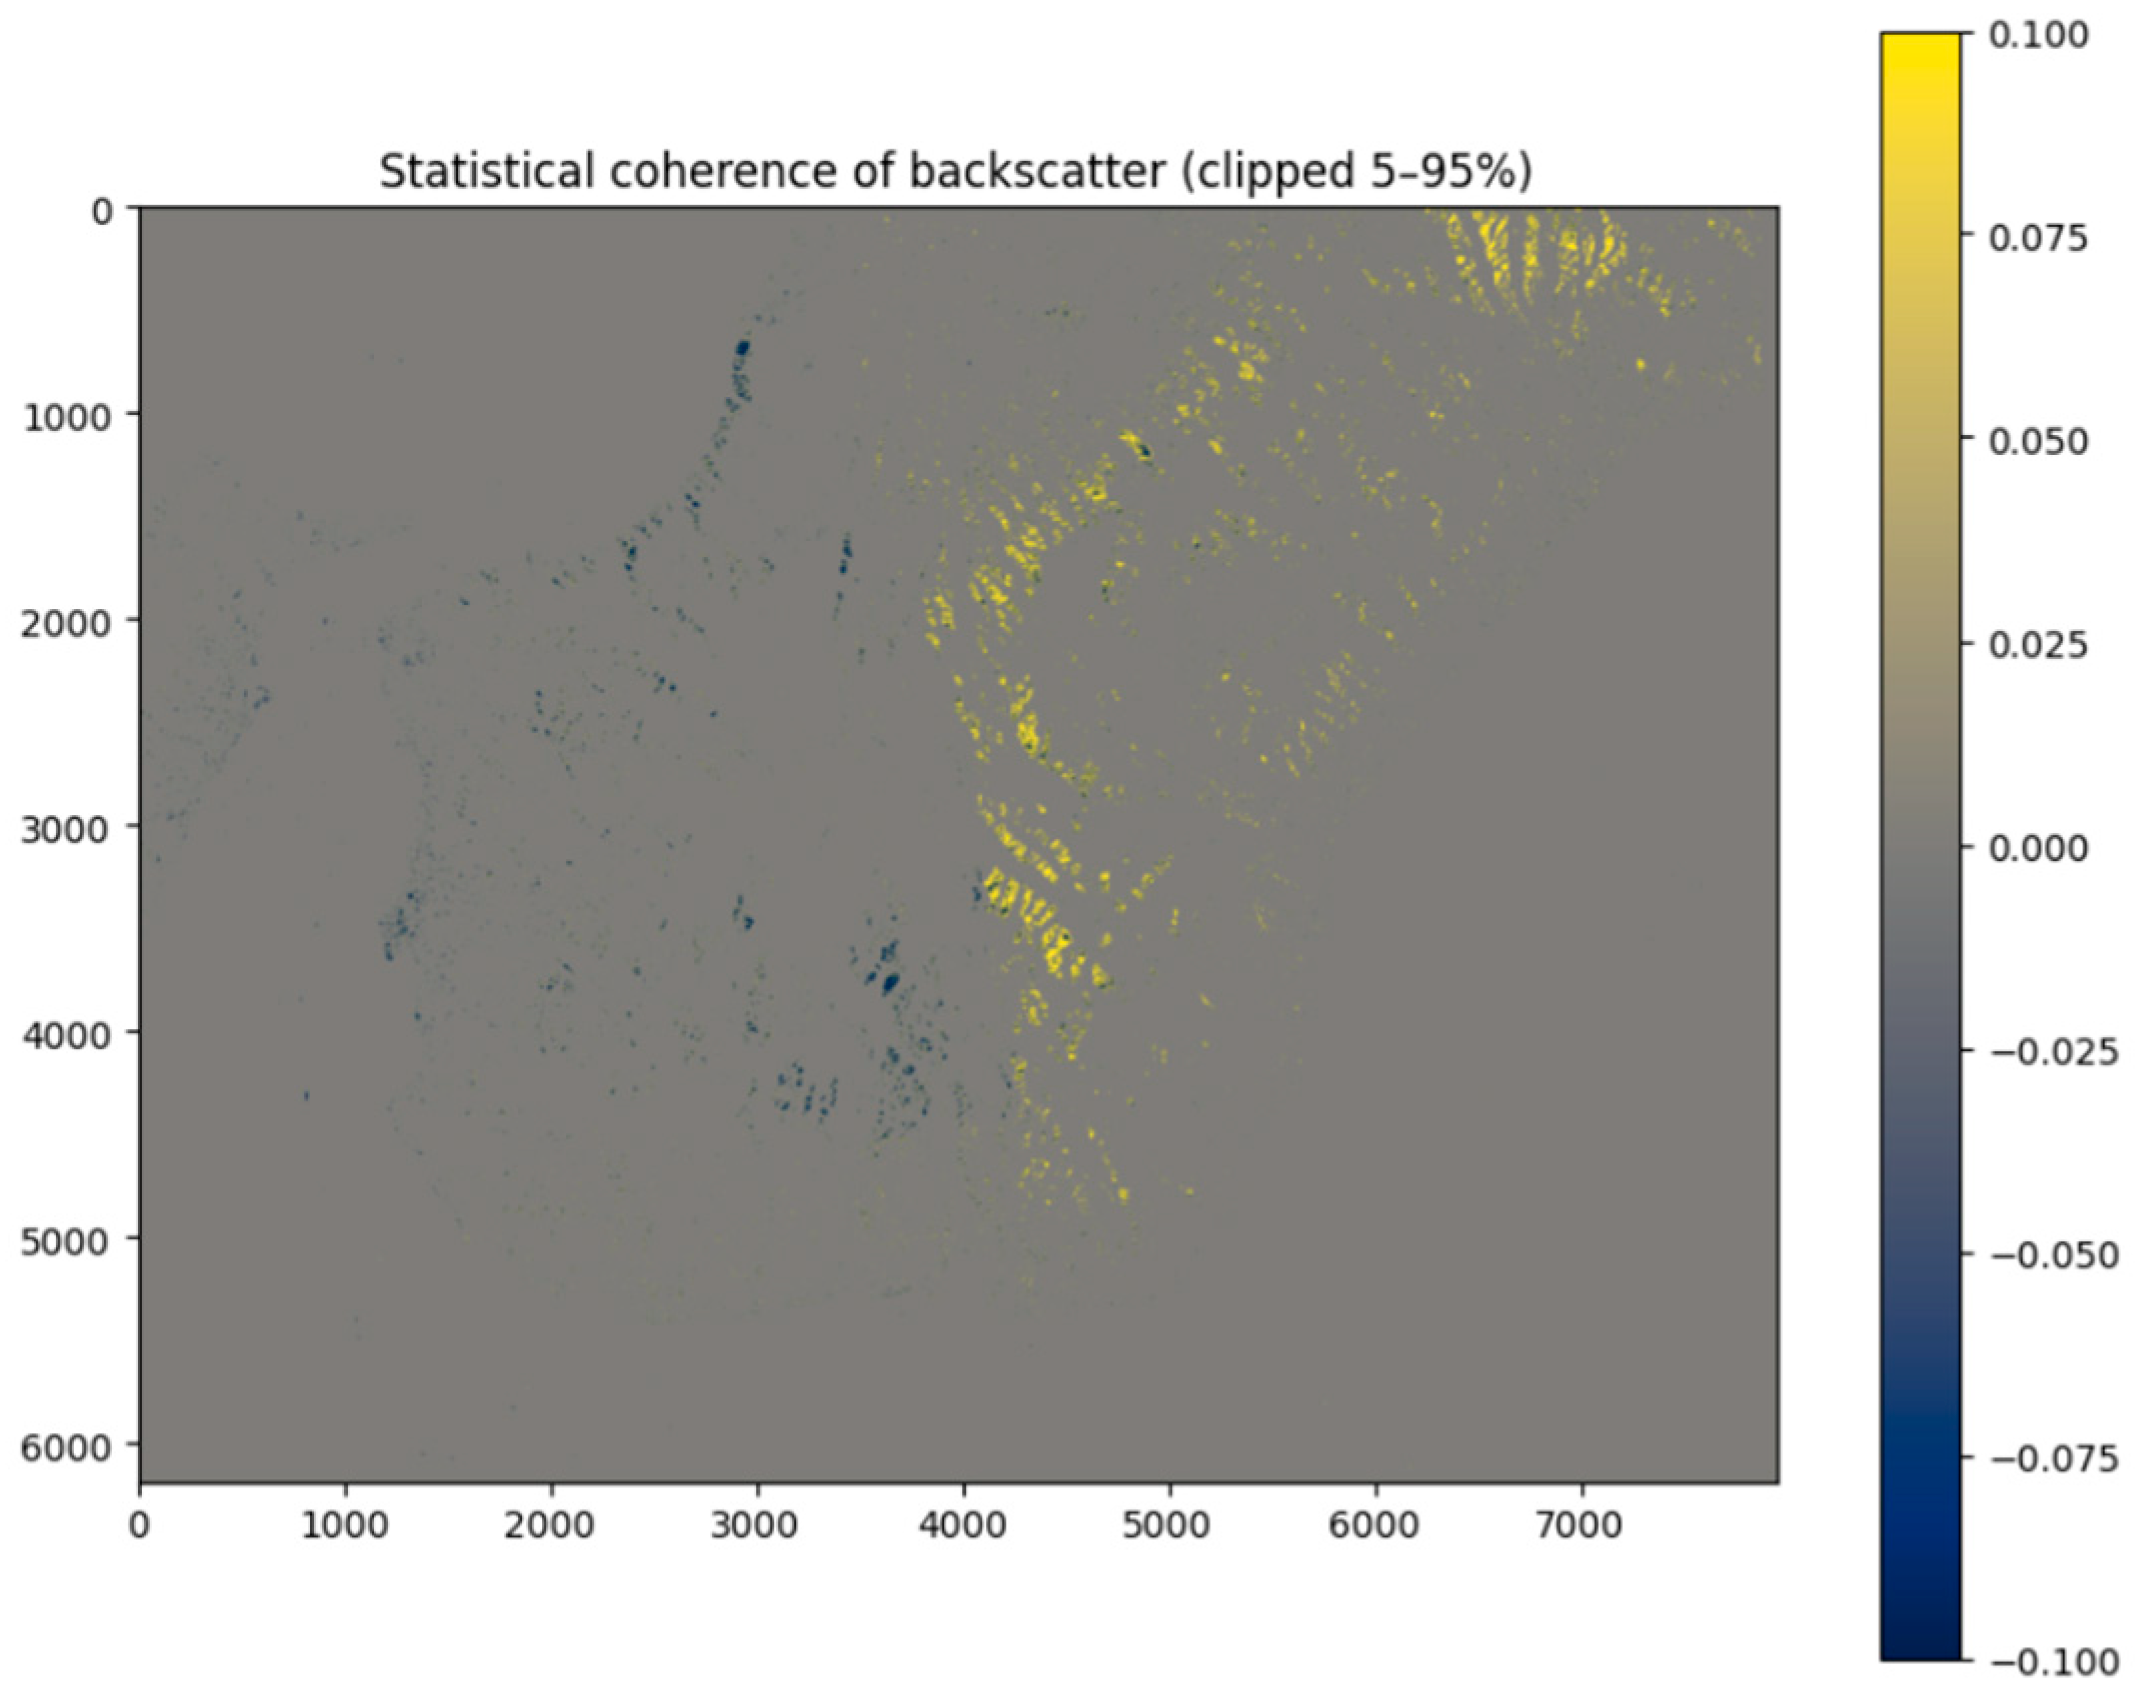
Figure 6 shows the statistical temporal coherence of the radar signal. The pattern highlights that the most coherent zones (in yellow) coincide with stable and well-illuminated areas by the radar, characterized by a regular radiometric response over time. Conversely, the blue zones represent areas with low temporal correlation, typically associated with meteorological variations, changes in surface moisture, or geometric effects related to terrain morphology. This metric is therefore useful for distinguishing stable surfaces from those subject to greater radiometric variability.
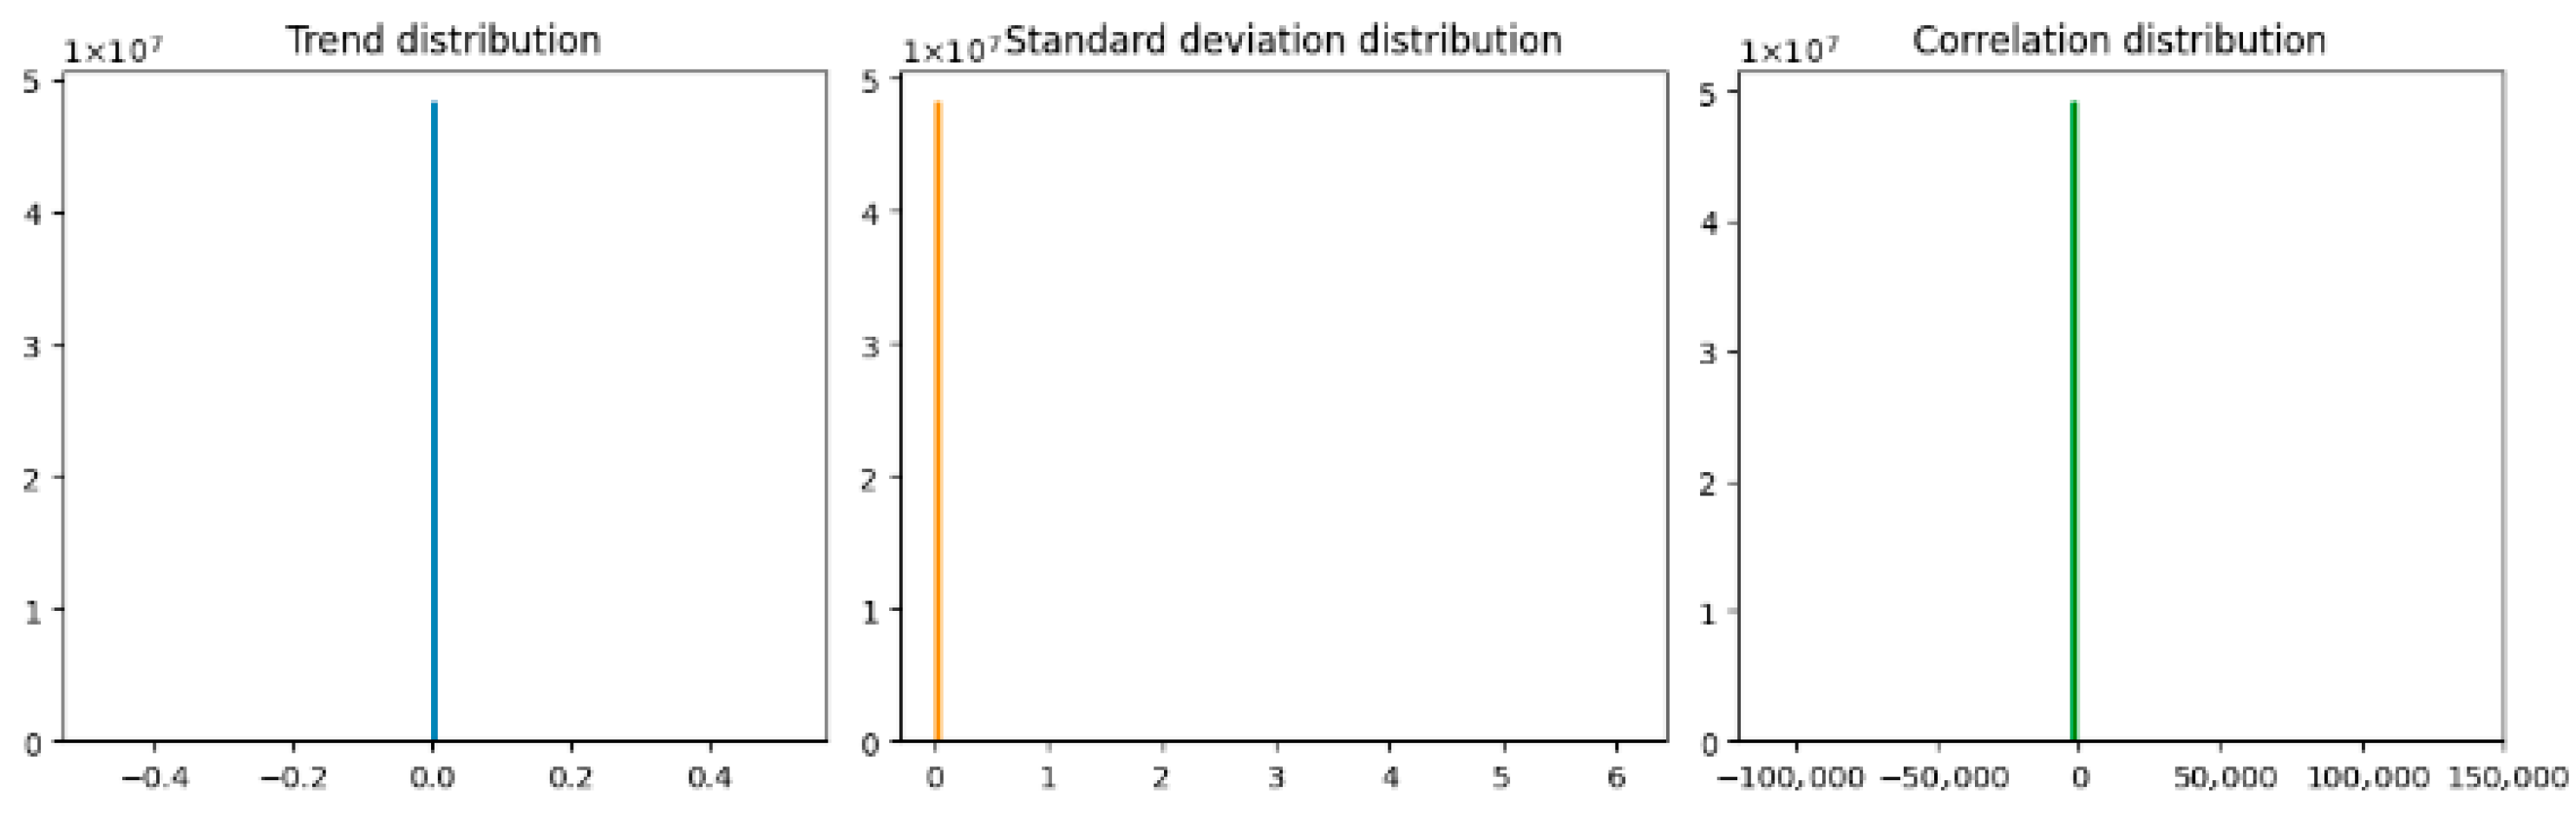
Figure 7 shows the distributions of the main radar-derived temporal metrics, namely the backscatter trend, the temporal standard deviation, and the statistical temporal correlation. In all three cases, the distributions are strongly concentrated around central values, indicating that most pixels exhibit relatively stable radiometric behaviour over the investigated period. This pattern suggests that the study area is generally characterized by limited temporal variability, while only a smaller fraction of pixels departs from the bulk of the distribution. Such deviations, although not visually dominant in the histograms, are consistent with the presence of localized anomalous or more dynamic zones. Therefore, these metrics are useful not because they directly isolate instability on their own but because they provide a statistical basis for distinguishing the general background behaviour of the scene from pixels showing less typical temporal responses.
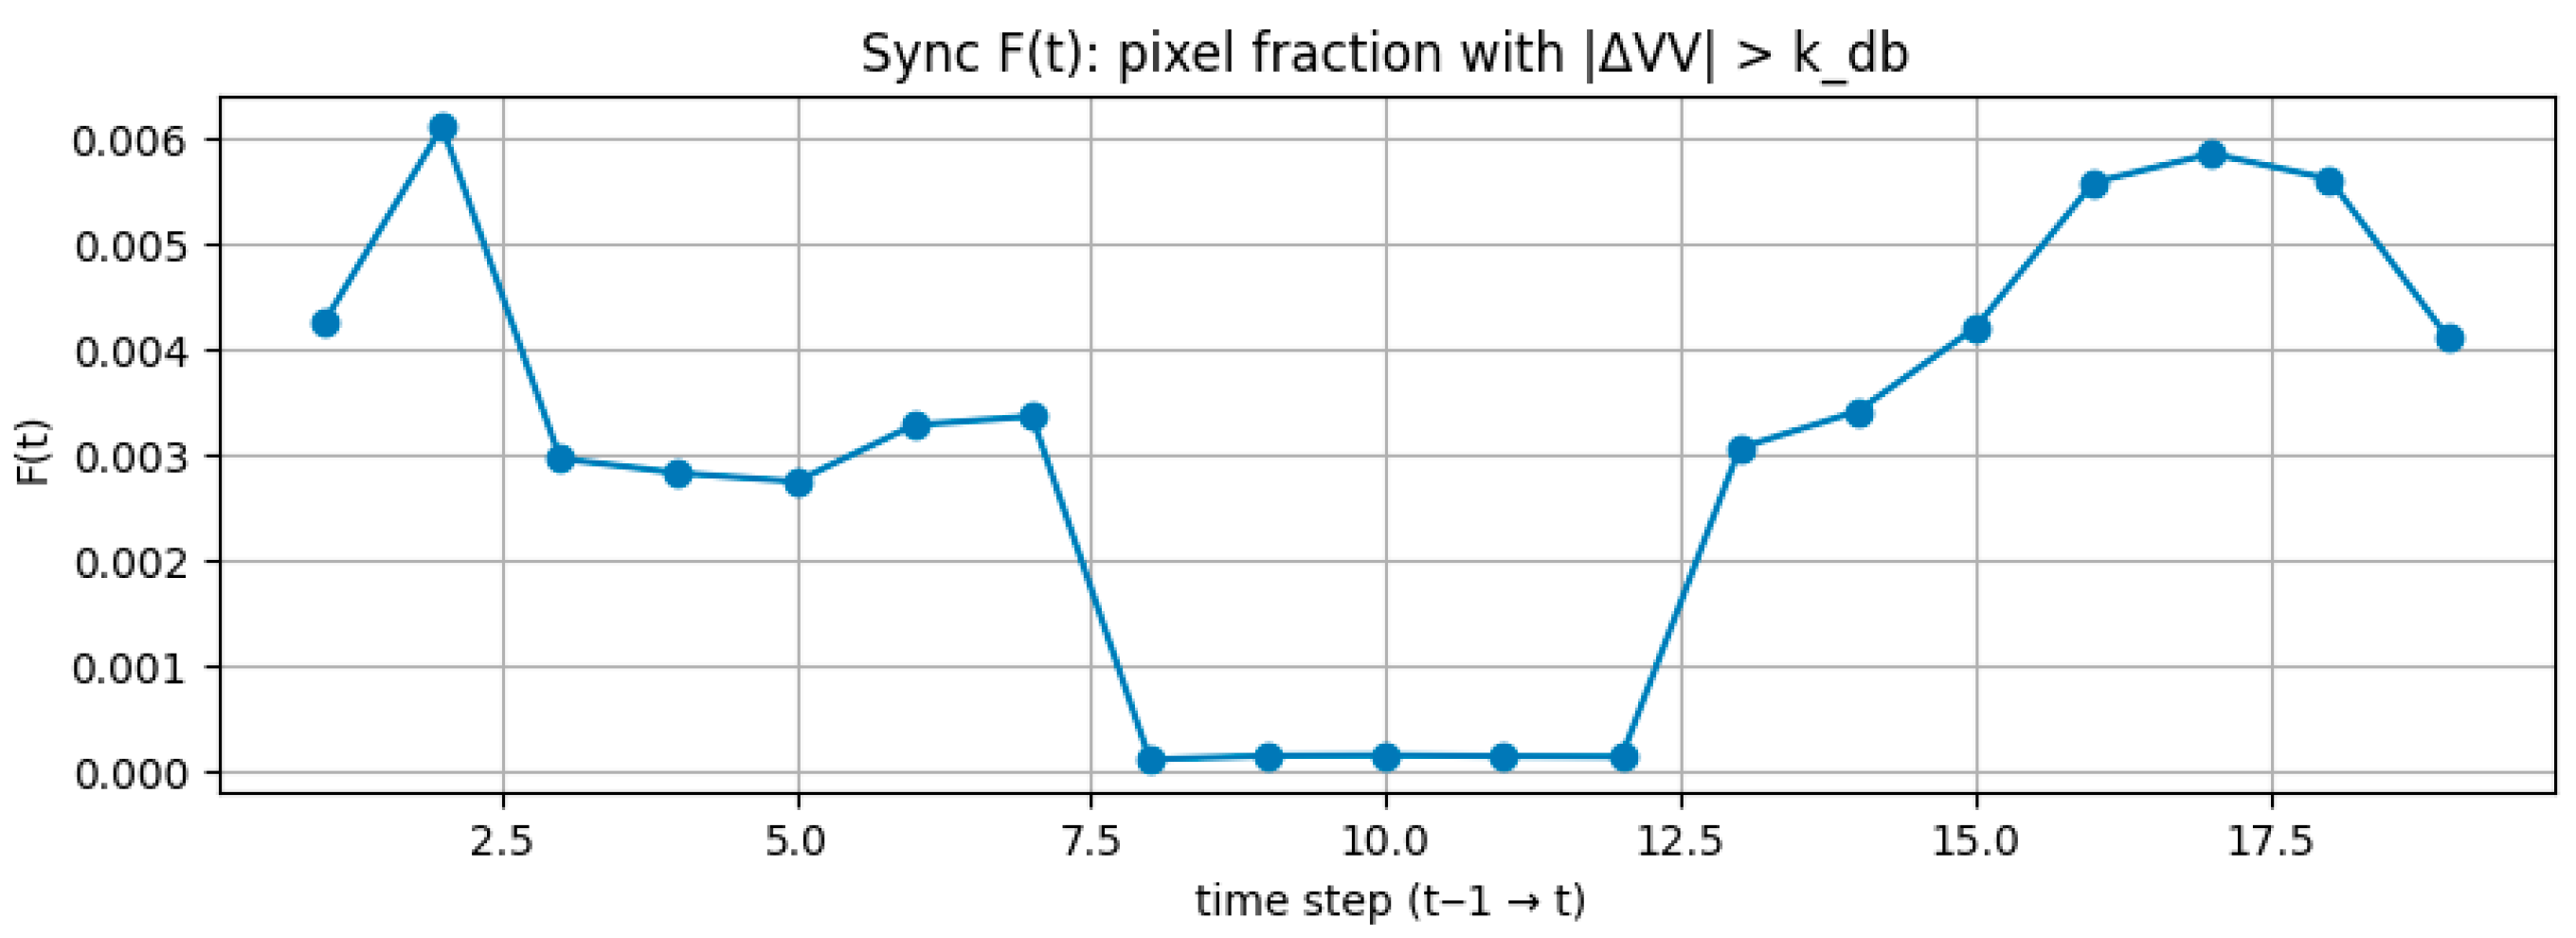
Subsequently, the synchrony F(t) was calculated (
Figure 8), which represents the fraction of pixels that, at each time interval, show a signal variation greater than the defined threshold. Thresholds used for anomalous pixel detection are not defined as fixed empirical values but are derived from the statistical distribution of each backscatter-based indicator over the entire study area. For each metric, pixel-wise values are evaluated relative to the global distribution, and only statistically extreme values are retained.
High values of F(t) indicate spatially widespread radiometric variations and are interpreted as meteorologically driven events. Conversely, low F(t) values indicate localized changes, which are considered potentially relevant for instability detection.
The F(t) values shown in the figure are generally very low and indicate the absence of widespread events capable of influencing the entire study area. Some dates show circumscribed peaks, interpretable as localized episodes of radiometric variation. This behavior confirms that the created stack is adequate for identifying specific changes that are not dominated by widespread or seasonal phenomena.
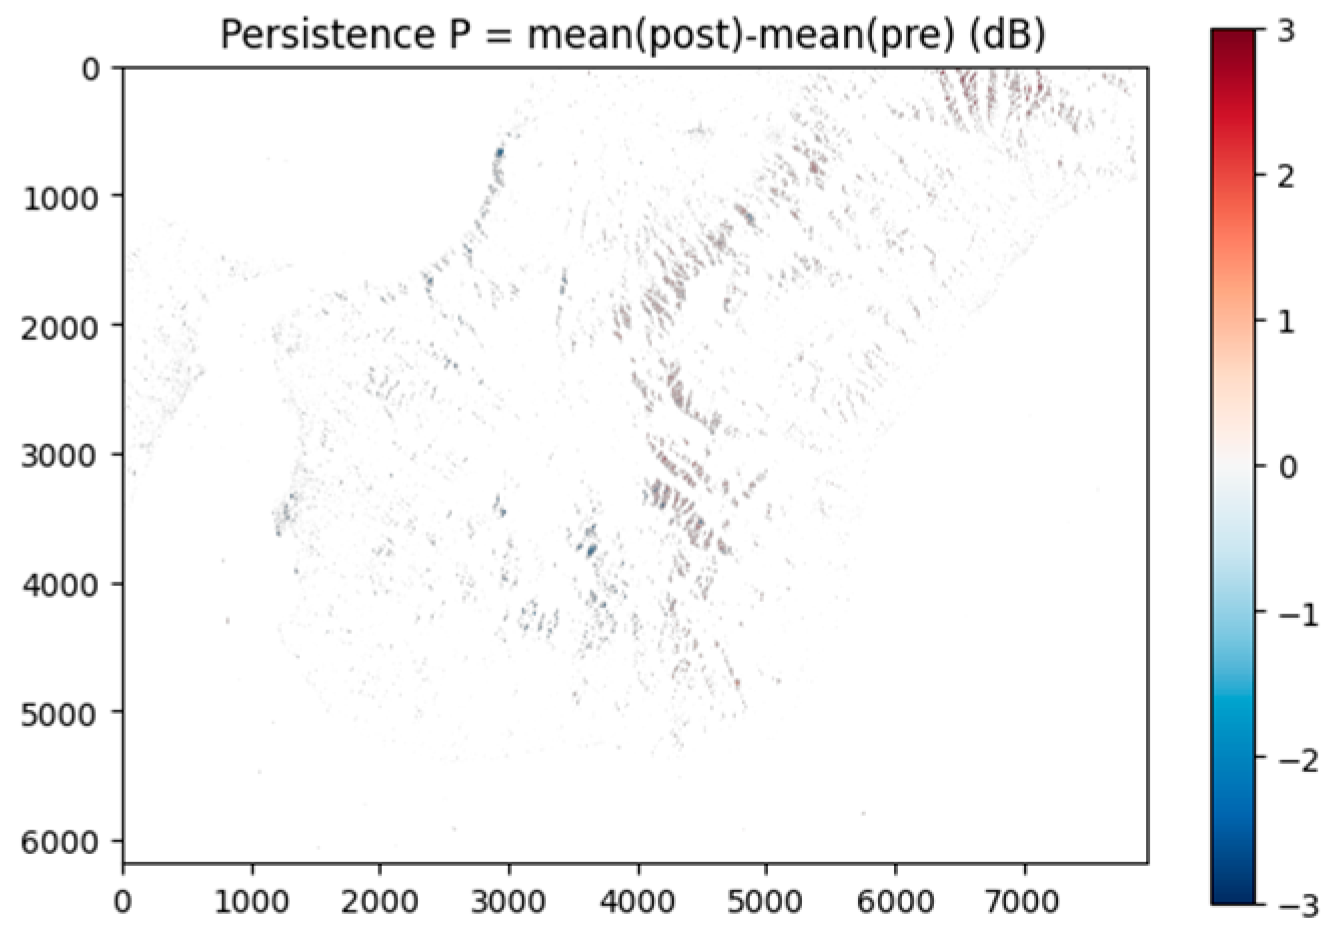
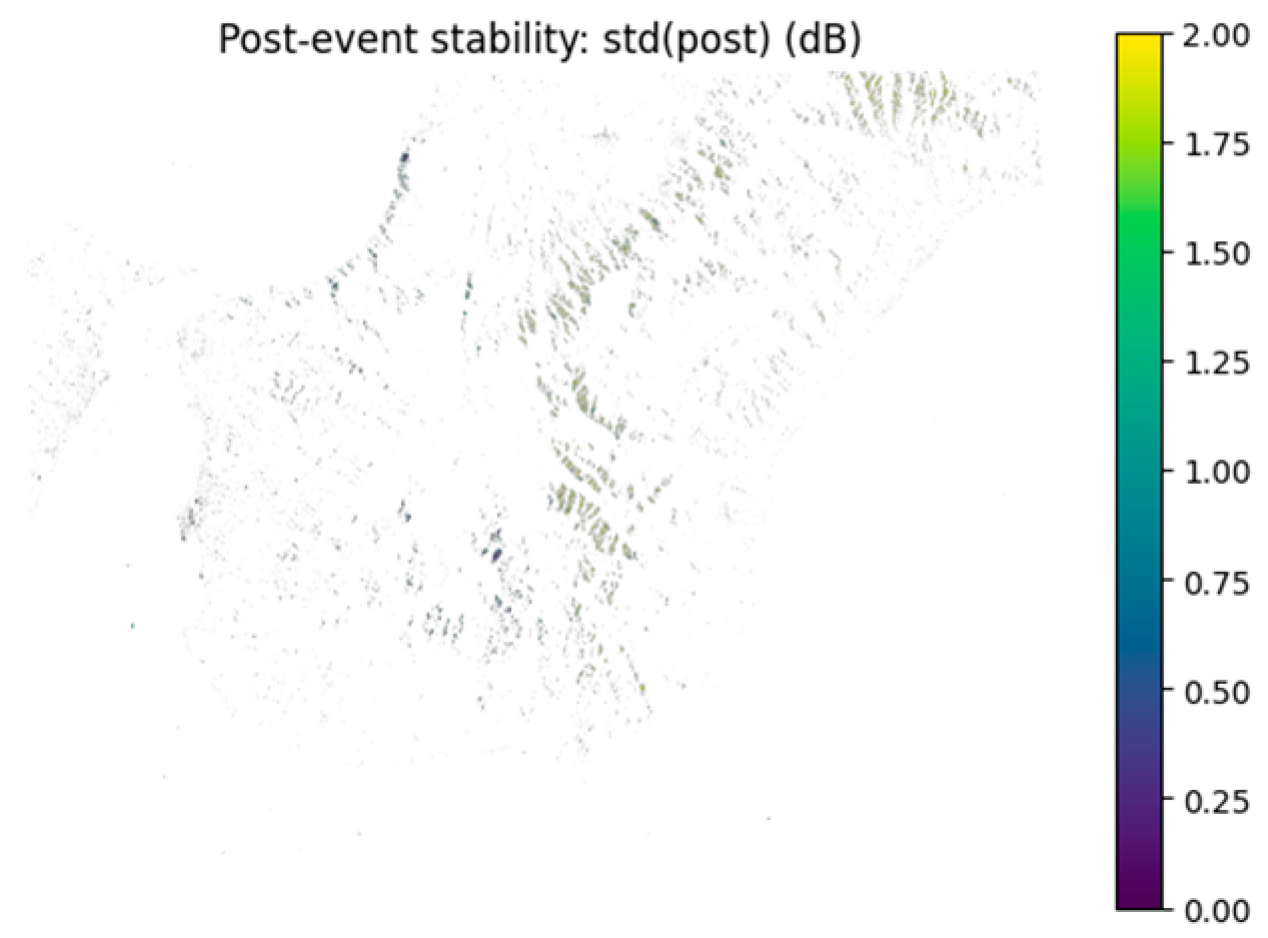
The post-event persistence and stability maps (
Figure 9 and
Figure 10) highlight areas where significant radiometric shifts over time, persistent differences between the pre- and post-change levels, and reduced variability after the break are observed.
Persistence and post-event stability are used to characterize the temporal behavior of backscatter changes following a detected radiometric break. These indicators are designed to distinguish persistent surface modifications from short-lived or transient fluctuations. Persistence is defined as the difference between the mean backscatter level before and after a detected change point. For each pixel, let
denote the mean backscatter value computed over a temporal window preceding the detected break, and
the mean value computed over a subsequent window. Persistence is then expressed as shown in (2):
Large absolute values of P indicate a sustained radiometric shift, whereas values close to zero indicate reversible or transient changes. Post-event stability is defined as a measure of the temporal variability of the backscatter signal following the detected change. It is computed as the standard deviation of σ0 values within a post-event temporal window. Low post-event standard deviation indicates a stable radiometric behavior after the change, consistent with a permanent surface modification, while high variability suggests ongoing fluctuations or noise-related effects. Persistence and post-event stability are evaluated jointly. Only pixels exhibiting both a significant mean shift (high absolute persistence) and reduced post-event variability are considered indicative of meaningful and sustained surface changes.
These parameters are useful for isolating sudden and long-lasting changes that could represent surface disturbance phenomena. However, these indicators provide only a radiometric signal: the physical nature of the change therefore requires further verification and cannot be unambiguously inferred from the GRD backscatter. Overall, Sentinel-1 backscatter-based metrics highlight spatially consistent and statistically significant patterns, suggesting the presence of dynamic or radiometrically anomalous zones.
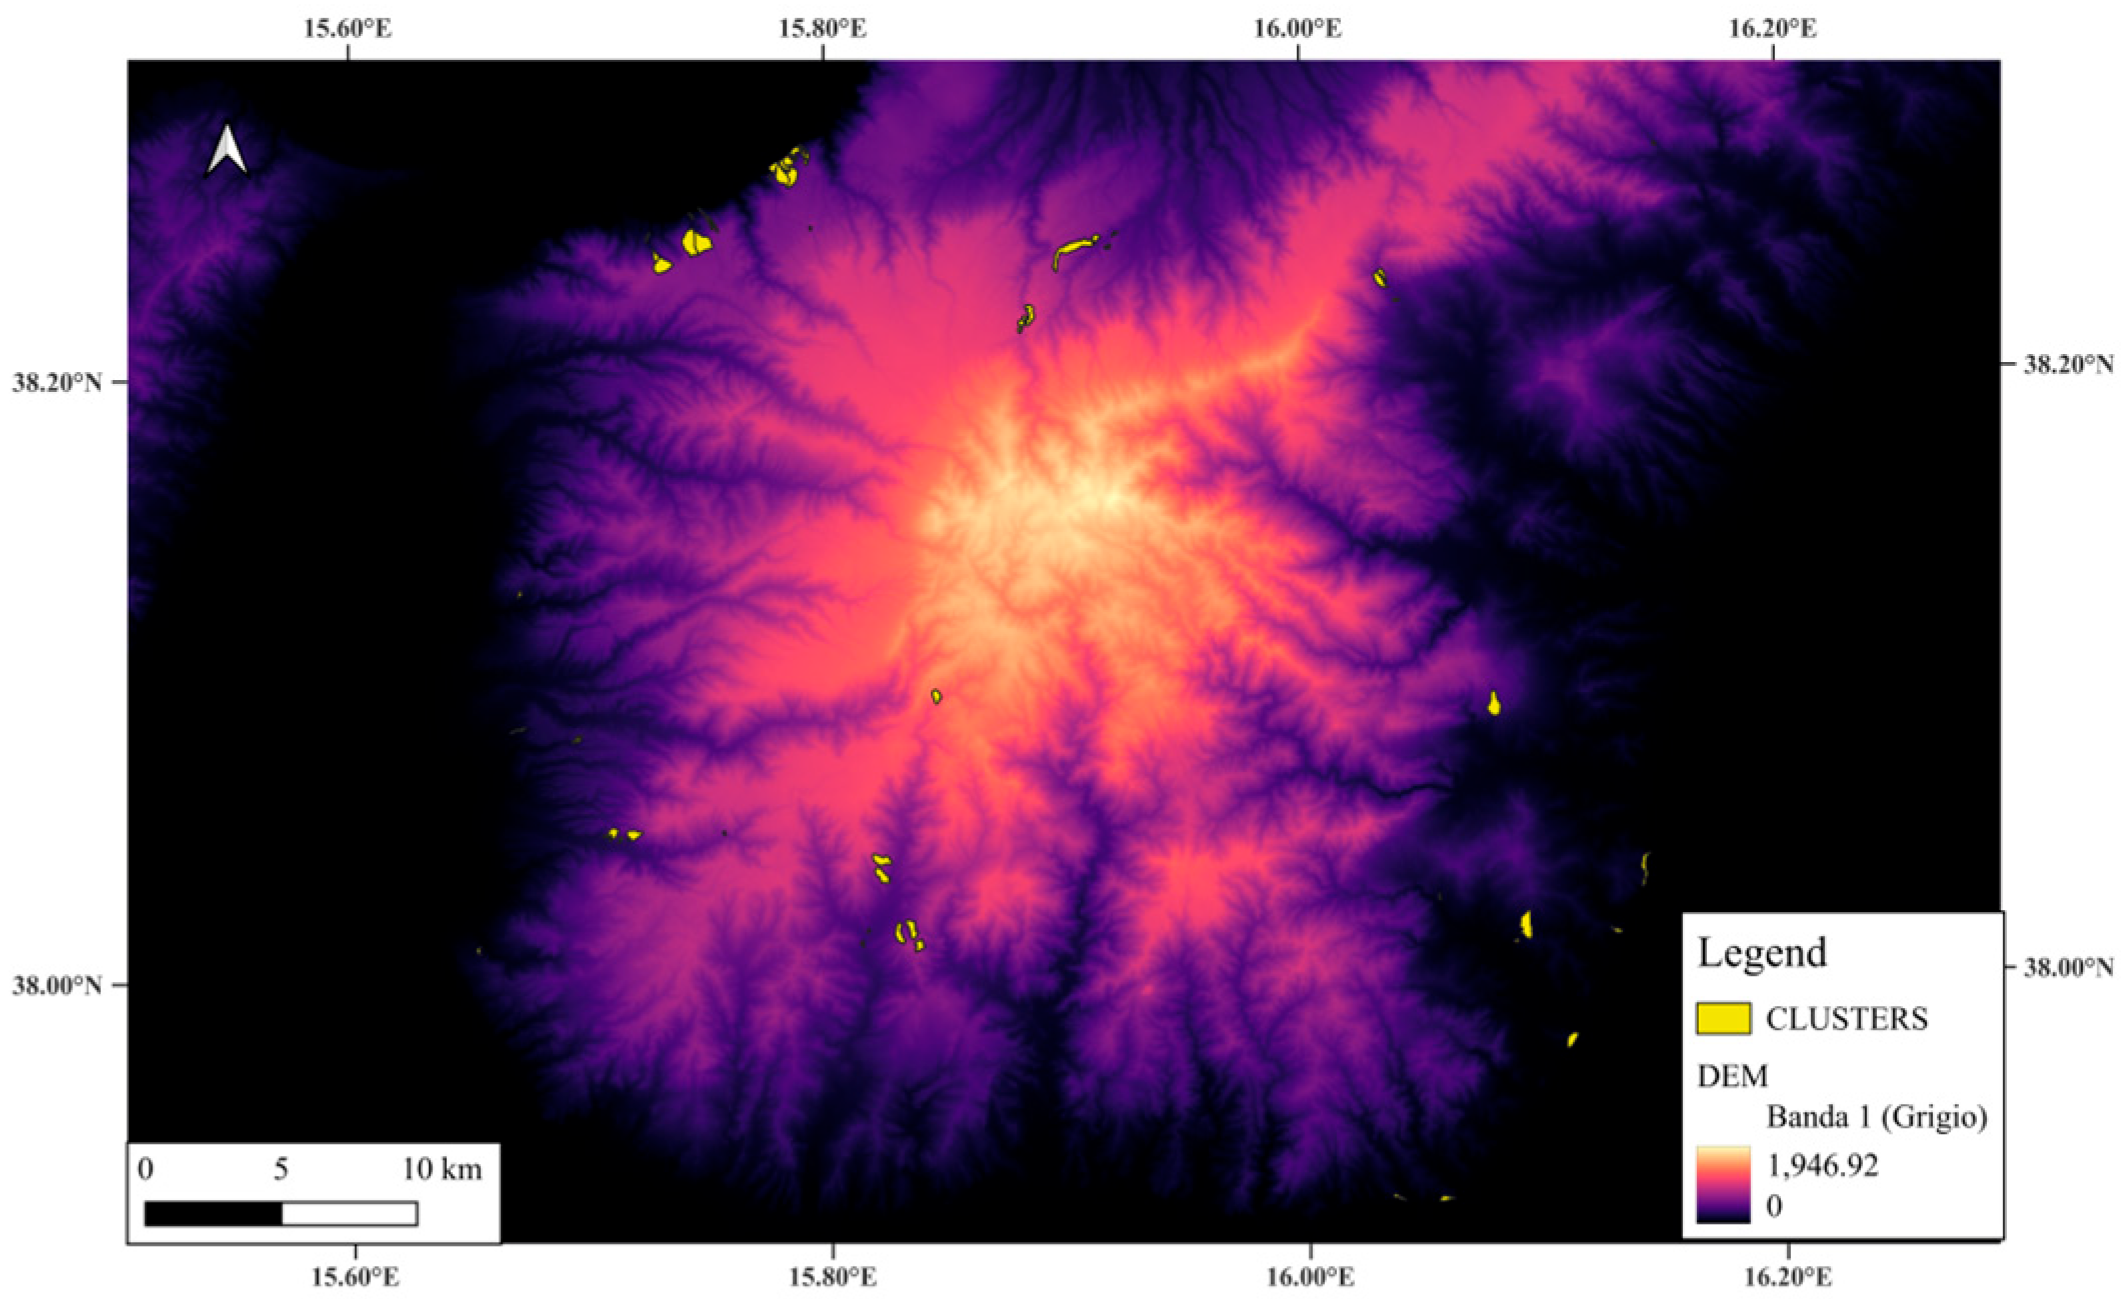
Finally, a final map of candidate clusters was created (
Figure 11), obtained from the change detection analysis based on radiometric break, pre- and post-event change persistence, post-event stability, and spatial clustering. The background indicates areas without significant radiometric anomalies, while the yellow clusters highlight groups of pixels that passed all selection criteria and are therefore candidate areas for anomalies. The yellow clusters are few and highly focused, confirming that the change detection pipeline eliminated almost all false positives. The identified anomalies are not due to noise or generalized signal variations but represent localized radiometric changes. The anomalous pixels were aggregated into coherent and contiguous zones, thus providing a spatially consistent indication of potential areas deserving further analysis.
It is noteworthy that the clusters are concentrated on steep slopes, along morphological transitions, and in areas subject to greater geomorphological sensitivity. These are therefore areas where the backscatter has undergone a sudden and long-lasting change, not explainable by noise or simple seasonal fluctuations. These clusters represent candidate areas of potential instability identified solely on the basis of radiometric behavior, without any a priori information on ground displacement.
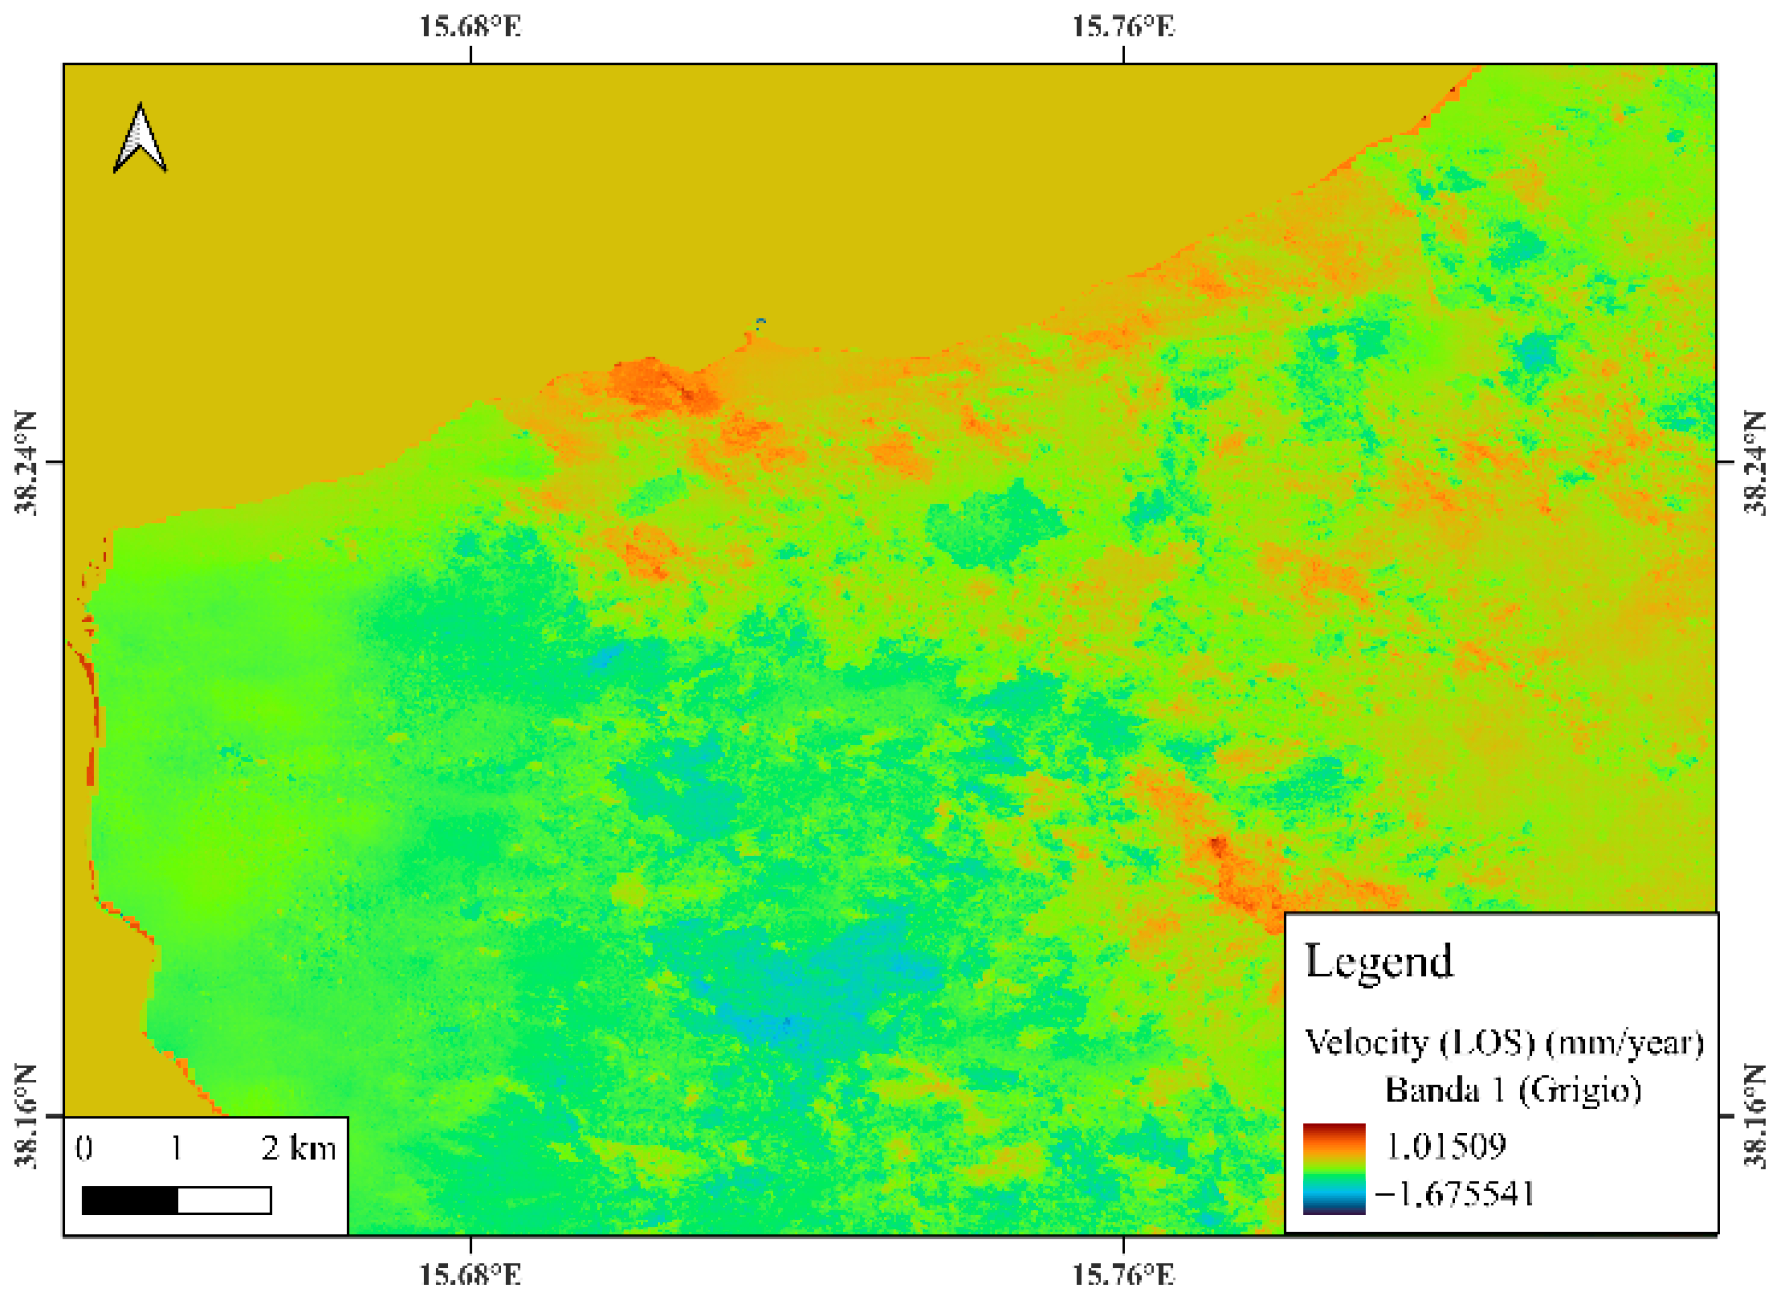
With regard to the second phase, as described in the
Section 2, deformation velocities were estimated using the SBAS-InSAR technique, and the resulting product was integrated into the model as a dynamic parameter (
Figure 12 and
Figure 13).
The integration of deformation velocity made it possible to determine, among the clusters identified during the first phase, those clusters that not only exhibited anomalous backscatter behavior but also showed anomalous deformation velocities, and therefore actual ground movement.
Radiometric anomaly detection acts as a spatial filter that successfully pre-identifies areas where ground deformation is subsequently confirmed by SBAS-InSAR. Accordingly, the SBAS-InSAR results were specifically analyzed within the radiometric clusters identified in the first phase in order to verify whether radiometric anomalies correspond to measurable ground deformation.
Table 1 summarizes the characteristics of the radiometric clusters identified by backscatter-based change detection and their corresponding SBAS-InSAR response. The majority of clusters exhibit low to negligible mean deformation rates, with LOS velocities generally below 0.5 mm/year. Persistent and post-event stable clusters with low deformation rates were therefore classified as radiometric anomalies only, suggesting surface-related changes not linked to measurable ground displacement. Conversely, clusters characterized by lower post-event stability or reduced persistence were classified as transient or noise-related, indicating short-lived radiometric variations likely driven by environmental or acquisition-related factors. The presence of very limited clusters classified as active instability highlights the conservative nature of the proposed framework. Radiometric change detection efficiently identifies candidate areas, while SBAS-InSAR prevents misinterpretation of short-term or surface-related variations as true ground deformation. Specifically, C40 is characterized by a very small number of pixels that underwent an abrupt and large radiometric shift concentrated within a short temporal interval. In such cases, the difference between pre-event and post-event mean backscatter values (persistence) and the post-event variability metrics are amplified, resulting in extreme values compared to clusters with more gradual or spatially distributed changes. These extreme values reflect the sensitivity of mean shift and variability-based indicators to localized and sudden radiometric changes and are therefore expected in specific cases. For this reason, absolute persistence and stability values are not interpreted in isolation but only in combination with spatial coherence and interferometric validation. Despite the extreme radiometric indicators, the corresponding SBAS-InSAR deformation velocity associated with cluster C40 remains very low. This confirms that the detected signal is radiometric in nature and not associated with measurable ground displacement, supporting its classification as a radiometric anomaly rather than an active instability. The presence of such extreme cases further highlights the importance of integrating radiometric analysis with interferometric validation. Without SBAS-InSAR filtering, clusters such as C40 could be misinterpreted as highly unstable, whereas the proposed framework correctly prevents overinterpretation by exploiting the complementary information provided by the phase component.
These clusters alone cannot be considered sufficient to define susceptibility events or to produce a reliable susceptibility map. Indeed, landslide susceptibility is strongly controlled by static conditioning factors, such as lithology, slope, land cover, geomorphological setting, and other territorial characteristics, which play a fundamental role in determining the spatial predisposition of the terrain to instability. For this reason, rather than interpreting the radiometric and interferometric clusters as a standalone susceptibility product, they were integrated into a broader modelling framework already designed to account for static parameters. Within this perspective, the radiometric and interferometric information was incorporated as an additional dynamic component of the model, thus complementing the static factors with satellite-derived evidence of recent surface changes and ground deformation. This integration makes it possible to obtain a more complete and realistic representation of susceptibility conditions, combining long-term territorial predisposition with short-term dynamic behaviour. The results of the entire proposed framework are reported in
Figure 14.
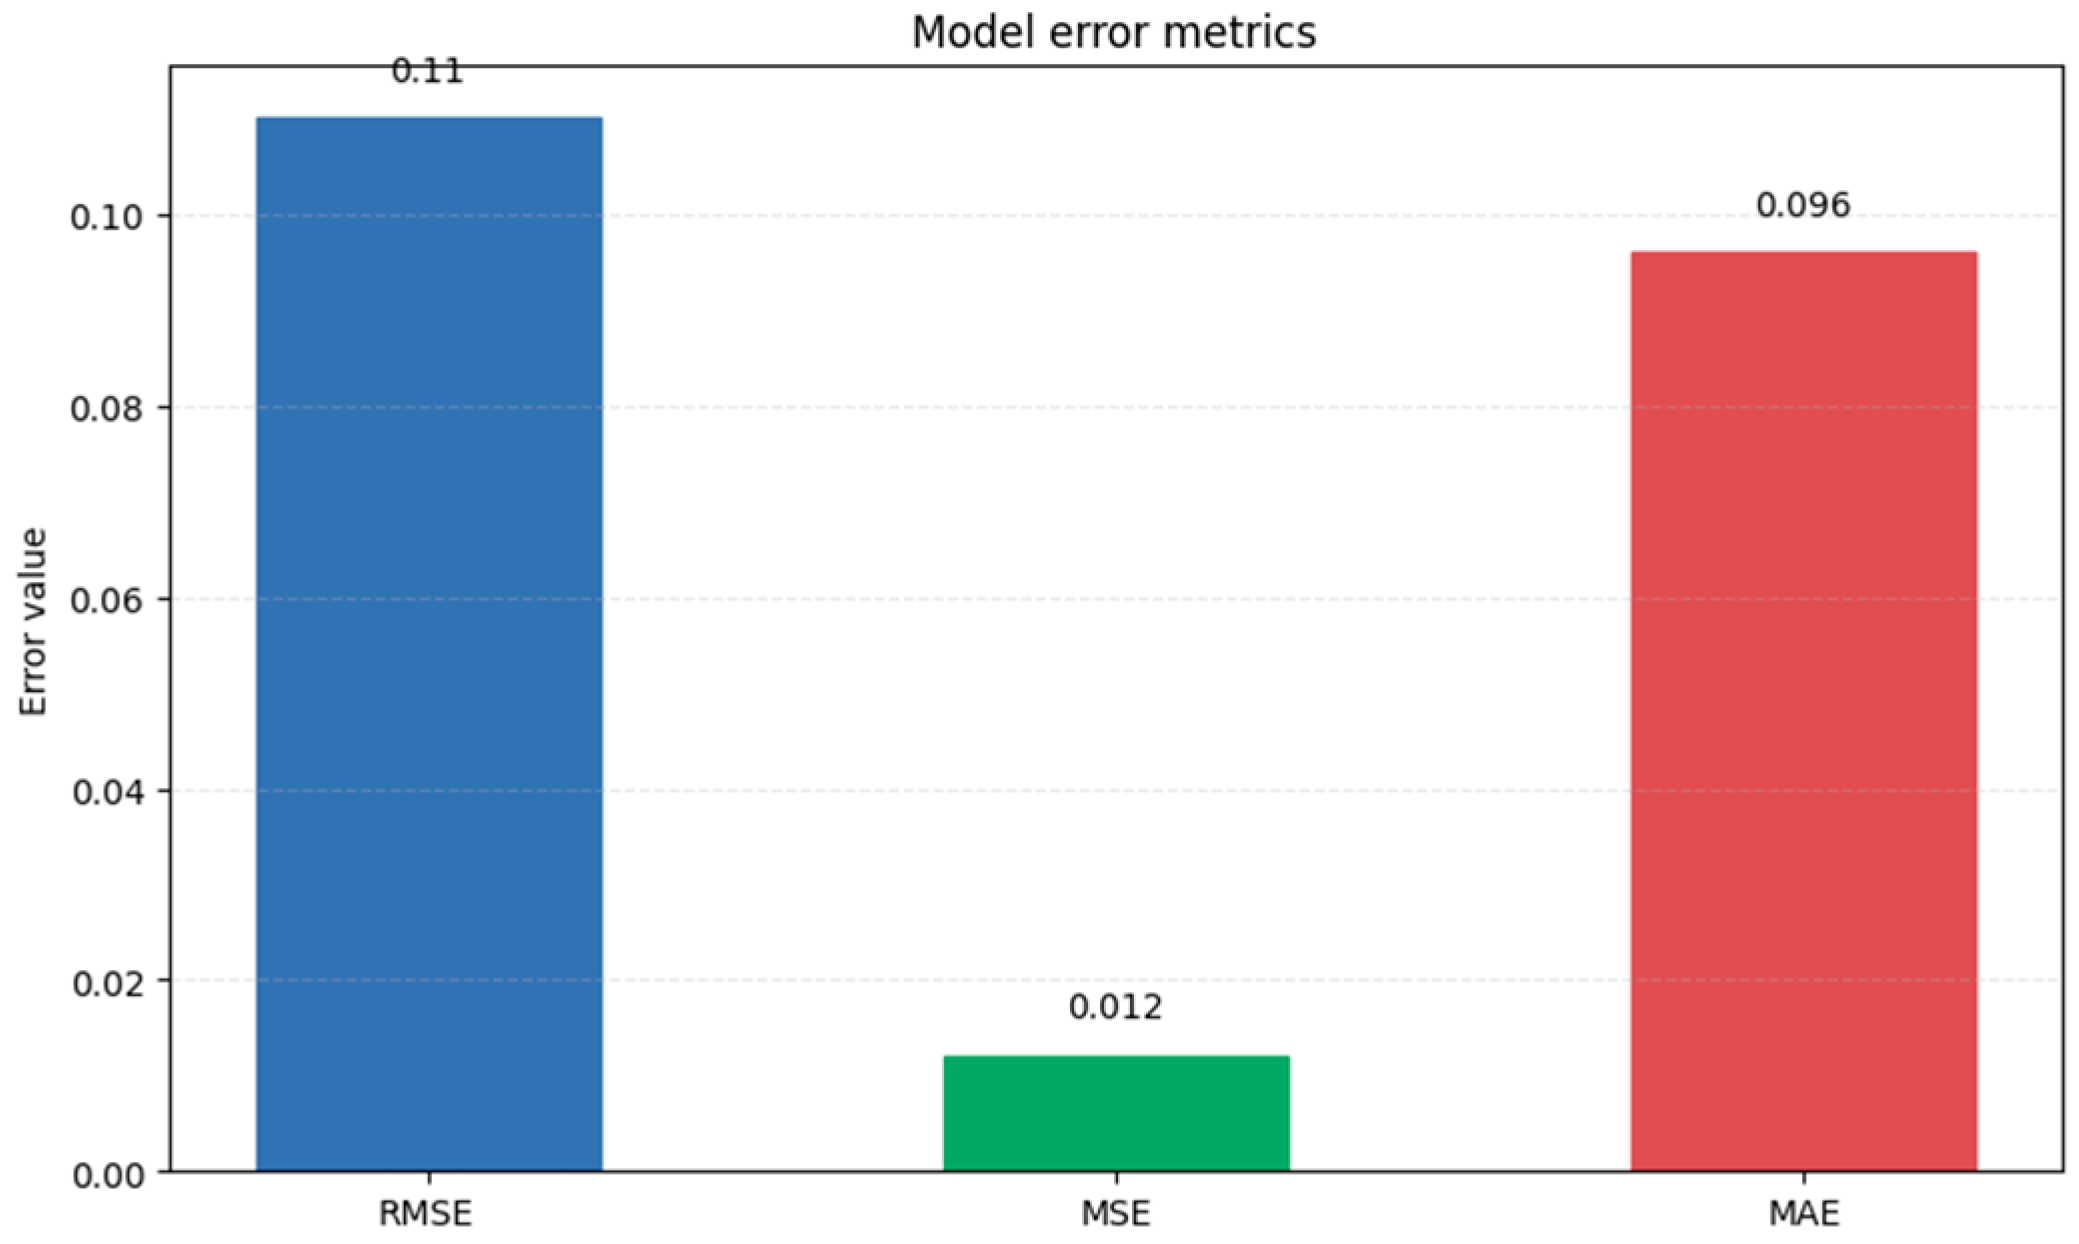
Within the WebGIS system (GiSCaLA), a quantitative model performance evaluation module was also implemented, based on statistical and machine-learning metrics. Specifically, classification metrics were introduced to assess the system’s ability to discriminate between stable and unstable areas, along with regression metrics such as the Root Mean Square Error (RMSE) and the coefficient of determination (R
2 = 0.78), which were used to quantify the deviation between simulated and observed values (
Figure 15). The following performance metrics were obtained.
Finally, a comparison was carried out between the model results and the ISPRA landslide inventory (IFFI), which highlighted the good spatial consistency between the areas identified as having higher susceptibility and zones historically affected by landslide phenomena. In particular, areas classified as high-risk by the model are predominantly located within or in close proximity to the inventory polygons, confirming the system’s ability to correctly identify unstable conditions. The presence of high-susceptibility pixels also in areas adjacent to the inventoried polygons further suggests a potential predictive capability of the model, enabling the identification of susceptible zones that are not yet documented or that may represent future evolutions of the phenomenon.
4. Discussion and Conclusions
The results of this study confirm that the joint exploitation of the two complementary components of the Sentinel-1 radar signal, namely the intensity (backscatter) and the phase, represents a particularly effective strategy for improving the identification and interpretation of slope instability conditions. While these two signal components are often used separately in the literature, the proposed framework demonstrates that their integration provides a more robust and operationally useful representation of terrain dynamics than either component alone. The intensity component proved especially valuable in the preliminary identification of anomalous areas. Backscatter-derived indicators such as temporal trend, standard deviation, statistical temporal correlation, break amplitude, persistence, and post-event stability made it possible to detect localized and temporally meaningful radiometric changes. In particular, the backscatter-based change detection procedure acts as an effective spatial screening tool, capable of isolating candidate clusters while reducing the impact of diffuse seasonal or meteorological effects through the synchrony analysis. However, the discussion of the results also highlights a fundamental limitation of relying exclusively on the radiometric component. A persistent variation in backscatter does not necessarily correspond to actual ground deformation. Radiometric anomalies may reflect superficial or environmental changes, acquisition geometry effects, or transient disturbances unrelated to landslide motion. This aspect is crucial because a system intended to support decision-making cannot rely only on the presence of surface anomalies if the final objective is the identification of actual instability processes. This is precisely where the phase component, processed through the SBAS-DInSAR technique, becomes essential. Interferometric analysis adds a physically interpretable and quantitative measure of ground displacement, expressed in terms of deformation velocity. The SBAS results therefore provide the dynamic confirmation needed to distinguish between generic radiometric anomalies and true ground movement. In this sense, the phase information does not replace the intensity-based analysis but rather complements and validates it. The proposed methodology demonstrates that the intensity signal is particularly effective in narrowing the spatial domain of interest, whereas the phase signal is indispensable for verifying whether those anomalous areas are associated with measurable kinematic behavior.
The main strength of the proposed system thus lies in the synergistic integration of the two radar components. Backscatter analysis increases sensitivity to localized and recent surface changes, while SBAS-DInSAR increases specificity by confirming or excluding the presence of deformation. This combined use significantly reduces false positives and avoids overinterpretation of radiometric anomalies. The results obtained in the study area clearly show that most radiometric clusters do not correspond to deformation rates compatible with active slope movement, confirming the conservative and reliable nature of the framework. In operational contexts, this is a particularly relevant outcome: it allows analysts and decision-makers to focus attention on the most meaningful areas, without confusing transient surface signals with actual hazard conditions. Another important contribution of this work is that radar-derived information is not treated as an isolated mapping product but as a dynamic causal factor integrated into a broader susceptibility assessment framework. The proposed approach moves beyond the traditional use of satellite data as mere supporting information and instead incorporates them directly into a simulation and inference environment that combines static territorial factors and dynamic observations. In this regard, the system is not limited to detecting anomalies but also contributes to the construction of a more adaptive and updatable susceptibility model.
The integration of the outputs into the 3D/4D WebGIS platform with DSS connotation further enhances the practical value of the proposed methodology. The usefulness of the system lies not only in the scientific soundness of the processing chain but also in its operational deployment within a digital environment that supports visualization, querying, simulation, and decision-making. Through the WebGIS architecture, users can access geospatial layers, compare dynamic radar-derived indicators with static conditioning factors, inspect model outputs in space and time, and support territorial monitoring activities through an intuitive and updatable interface. This makes the system particularly relevant for public administrations, civil protection agencies, and technical bodies involved in hydrogeological risk management. From a broader perspective, the proposed framework demonstrates that the integration of Earth Observation data into a decision-support architecture can effectively bridge the gap between remote sensing research and territorial governance. In this study, radar information was not only used to characterize the study area but also to calibrate and enrich a model aimed at supporting practical actions in vulnerable contexts. The consistency observed between model outputs and the IFFI further supports the reliability of the overall framework and suggests that the system may also have predictive potential, especially in adjacent or not yet inventoried areas. At the same time, some limitations should be acknowledged. First, the phase component is intrinsically constrained by coherence conditions, vegetation cover, slope geometry, and the line-of-sight nature of SAR measurements, which may reduce the detectability of some landslide processes. Second, the intensity component, although highly sensitive to change, remains non-specific with respect to the physical cause of the observed anomaly. Third, the current application is based on a limited temporal dataset and a single study area, and therefore further validation in different geomorphological and climatic settings is needed to assess the transferability of the methodology. This two-stage strategy substantially reduces false positives and prevents the misinterpretation of transient or surface-related changes as active instabilities. By prioritizing robustness over sensitivity and embedding the results within a 3D/4D WebGIS with Decision Support System connotation, the proposed approach provides more reliable information for civil protection agencies, supporting informed decision-making while minimizing unnecessary alerts.
Future developments of the system should proceed along several lines. A first line of development concerns the multi-polarization and multi-geometry extension of the radar analysis. The inclusion of both VV and VH channels, as well as ascending and descending acquisitions, could improve the characterization of surface processes and enhance deformation interpretation. A second development involves the integration of additional EO data sources, such as optical imagery, rainfall products, soil moisture observations, DEM-derived morphometric variables, and near-real-time meteorological information, in order to enrich the dynamic representation of triggering and predisposing factors. A further advancement concerns the temporal automation of the entire pipeline. The implementation of a continuously updated processing chain capable of ingesting new Sentinel-1 acquisitions, recalculating backscatter anomalies, updating SBAS-derived deformation information, and automatically refreshing the WebGIS layers would significantly strengthen the early-warning value of the platform. In the same direction, the DSS could be extended with automatic alert thresholds, confidence scores, and explainable outputs to support risk communication toward technical operators and institutional users. On the modelling side, future work should aim at improving the neural-network component through the inclusion of larger training datasets, inventory refinement, uncertainty quantification, and comparison with other interpretable machine-learning approaches. In addition, the current weighted-overlay and inference strategy could be complemented by spatio-temporal forecasting modules, allowing not only the estimation of current susceptibility but also the simulation of possible short-term scenario evolutions under different environmental conditions.
In conclusion, this work demonstrates that the combined use of the intensity and phase components of the Sentinel-1 radar signal provides a more complete and operationally meaningful framework for landslide susceptibility-oriented analysis than single-component approaches. Backscatter analysis enables the rapid and spatially extensive detection of candidate anomalous areas, whereas SBAS-DInSAR supplies the quantitative deformation information required to validate and interpret those anomalies. Their integration within a 3D/4D WebGIS-based DSS transforms radar-derived observations into an operational tool that supports monitoring, territorial planning, and hydrogeological risk management. The proposed system therefore represents not only a methodological contribution in the field of remote sensing for landslide analysis but also a concrete step toward scalable, updatable, and decision-oriented platforms for the management of vulnerable territories.
Author Contributions
Conceptualization, E.G., D.B., C.M. and V.B.; methodology, E.G., D.B., C.M. and V.B.; software, E.G., D.B., C.M. and V.B.; validation, E.G., D.B., C.M. and V.B.; formal analysis, E.G., D.B., C.M. and V.B.; investigation, E.G., D.B., C.M. and V.B.; resources, E.G., D.B., C.M. and V.B.; data curation, E.G., D.B., C.M. and V.B.; writing—original draft preparation, E.G., D.B., C.M. and V.B.; writing—review and editing, E.G., D.B., C.M. and V.B.; visualization, E.G., D.B., C.M. and V.B.; supervision, E.G., D.B., C.M. and V.B.; project administration, E.G., D.B., C.M. and V.B.; funding acquisition, E.G., D.B., C.M. and V.B. All authors have read and agreed to the published version of the manuscript.
Funding
This research was funded by PRIN_2022PNRR project “WebGIS 4D with DSS (Decision Support System) connotation for prediction of landslide susceptibility and hazard through innovative simulation systems with emerging properties such as 3D Cellular Automata, Neural Networks and SPH Fluids” (CUP C53D23010170001) funded by Italian Ministry of University and Research—MUR (PRIN_2022PNRR_P2022CK8F9).
Data Availability Statement
The data supporting the findings of this study consist of both publicly available datasets and derived products generated by the authors. Sentinel-1 GRD data used for the backscatter analysis are publicly available through the Copernicus Open Access Hub and Google Earth Engine (GEE). Derived datasets generated during the study, including backscatter temporal metrics, radiometric anomaly maps, clustered susceptibility-prone areas, SBAS-InSAR deformation products, and WebGIS-integrated outputs, are available from the corresponding author upon reasonable request. Static territorial layers used within the susceptibility framework (e.g., lithology, slope, geomorphology, and land-cover information) were obtained from regional and national geospatial repositories and subsequently processed and harmonized for the purposes of this study. The IFFI inventory was used exclusively for validation purposes and is available through the official ISPRA repository.
Conflicts of Interest
Author Davide Borrello was employed by the company Bustles 2.0 S.r.l. The remaining authors declare that the research was conducted in the absence of any commercial or financial relationships that could be construed as a potential conflict of interest.
References
- Ehsan, M.; Anees, M.T.; Bakar, A.F.B.A.; Ahmed, A. A review of geological and triggering factors influencing landslide susceptibility: Artificial intelligence-based trends in mapping and prediction. Int. J. Environ. Sci. Technol. 2025, 22, 17347–17382. [Google Scholar] [CrossRef]
- Tzampoglou, P.; Loukidis, D.; Tsangaratos, P.; Anastasiades, A.; Karalis, K. Correlation between geotechnical indexes and landslide occurrence in southwestern cyprus using GIS and machine learning. Geotech. Geol. Eng. 2025, 43, 43. [Google Scholar] [CrossRef]
- Tzampoglou, P.; Loukidis, D.; Anastasiades, A.; Tsangaratos, P. Advanced machine learning techniques for enhanced landslide susceptibility mapping: Integrating geotechnical parameters in the case of Southwestern Cyprus. Earth Sci. Inform. 2025, 18, 357. [Google Scholar] [CrossRef]
- Singh, S.; Nayak, N.P.; Aggarwal, A.; Verma, H.K. Role of remote sensing and geotechnical studies in assessing the landslide vulnerability in the Chamoli region of Uttarakhand, India. Discov. Appl. Sci. 2025, 7, 614. [Google Scholar] [CrossRef]
- Araki, K.; Takimoto, K.; Yamazaki, Y.; Loi, D.H.; Konagai, K.; Sassa, K. Time and site prediction of a potential large-scale landslides and the AR (augmented reality) presentation for early warning. In Progress in Landslide Research and Technology 2025; Springer Nature: Cham, Switzerland, 2024; Volume 3, pp. 347–355. [Google Scholar]
- Tagarelli, V.; Cotecchia, F. Weather-induced landslide activity in clayey slopes: Modeling for the design of site-scale early warning systems. J. Geotech. Geoenviron. Eng. 2025, 151, 04025092. [Google Scholar] [CrossRef]
- Ghosh, K.; Saha, R. A critical review on rainfall induced landslide occurrences and early warning systems. Geomech. Geoengin. 2025, 20, 1052–1074. [Google Scholar] [CrossRef]
- Li, P.; Xu, Q.; Liu, J.; Zhang, F.; Ji, X.; Peng, D.; Pu, C.; Chen, W.; Yuan, S.; He, C. Establishing radar-derived rainfall thresholds for a landslide early warning system: A case study in the Sichuan Basin, Southwest China. Sci. Rep. 2025, 15, 26308. [Google Scholar] [CrossRef] [PubMed]
- Shirani, K.; Pasandi, M.; Shirani, P. Machine learning-driven land subsidence prediction using radar imagery. In Water Scarcity Management; Elsevier: Amsterdam, The Netherlands, 2026; pp. 175–204. [Google Scholar]
- Jiang, M.; Wu, Z.; Wang, X.; Bai, L.; Li, Z.; Lu, Z. Mapping wide-area land subsidence from groundwater use in the North China plain by machine learning-based InSAR adjustment. Remote Sens. Environ. 2026, 334, 115226. [Google Scholar] [CrossRef]
- Torres, R.; Geudtner, D.; Davidson, M.; Bibby, D.; Navas-Traver, I.; Hernandez, A.I.G.; Laduree, G.; Poupaert, J.; Bollian, T.; Graham, S. Sentinel-1 next generation: Enhanced C-band data continuity. In EUSAR 2024; 15th European Conference on Synthetic Aperture Radar; VDE: Offenbach am Main, Germany, 2024; pp. 1–4. [Google Scholar]
- Zhang, J.; Zuo, X.; Li, Y.; Shi, M.; Shi, C.; Huang, C.; Tang, X. Detection and assessment of potential landslides in the Xiaojiang River Basin using SBAS-InSAR. Sci. Rep. 2025, 15, 16082. [Google Scholar] [CrossRef] [PubMed]
- Hussain, S.; Pan, B.; Afzal, Z.; Sajjad, M.M.; Kakar, N.; Ahmed, N.; Hussain, W.; Ali, M. SBAS-InSAR analysis of tectonic-derived ground deformation and subsidence susceptibility mapping via machine learning in Quetta City, Pakistan. Int. J. Digit. Earth 2025, 18, 2441926. [Google Scholar] [CrossRef]
- Misbari, S.; Hashim, S.E.S.; Yusri, N.A. Application of Sentinel-1 image for landslide characterisation and detection using backscatter analysis. In IOP Conference Series: Earth and Environmental Science; IOP Publishing: Bristol, UK, 2026; Volume 1605, p. 012015. [Google Scholar]
- Konakoglu, B.; Kurt Konakoglu, S.S. Artificial intelligence in landslide susceptibility: A bibliometric analysis. Trans. GIS 2025, 29, e70099. [Google Scholar] [CrossRef]
- Barrile, V.; Bibbò, L.; Bilotta, G.; Meduri, G.M.; Genovese, E. Geomatics Innovation and Simulation for Landslide Risk Management: The Use of Cellular Automata and Random Forest Automation. Appl. Sci. 2024, 14, 11853. [Google Scholar] [CrossRef]
- La Guardia, M.; Genovese, E.; Maesano, C.; Mussumeci, G.; Barrile, V. WebGIS Dynamic Framework for AHP+ Random Forest Susceptibility Mapping with Open-Source Technologies. Land 2026, 15, 356. [Google Scholar] [CrossRef]
| Disclaimer/Publisher’s Note: The statements, opinions and data contained in all publications are solely those of the individual author(s) and contributor(s) and not of MDPI and/or the editor(s). MDPI and/or the editor(s) disclaim responsibility for any injury to people or property resulting from any ideas, methods, instructions or products referred to in the content. |