1. Introduction
With the continuous advancement of transportation infrastructure construction, long-span suspension bridges have been widely adopted in complex terrain conditions such as mountainous regions and river valleys, owing to their exceptional spanning capability and economic efficiency [
1,
2,
3,
4,
5]. Conventional suspension bridge anchorage systems predominantly employ gravity-type or tunnel-type configurations, and their design theories and engineering practices have reached a relatively mature stage [
6,
7,
8,
9,
10]. In recent years, to accommodate special topographic constraints and landscape requirements, the rotating-cable suspension bridge has been proposed and implemented as an innovative structural form [
11,
12]. In this bridge type, the main cables are spatially redirected within the anchorage zone, which substantially improves the cable force transmission path and the stress distribution pattern of the anchorage. However, no completed precedent exists worldwide for this bridge type, and both its design theory and construction control present new challenges.
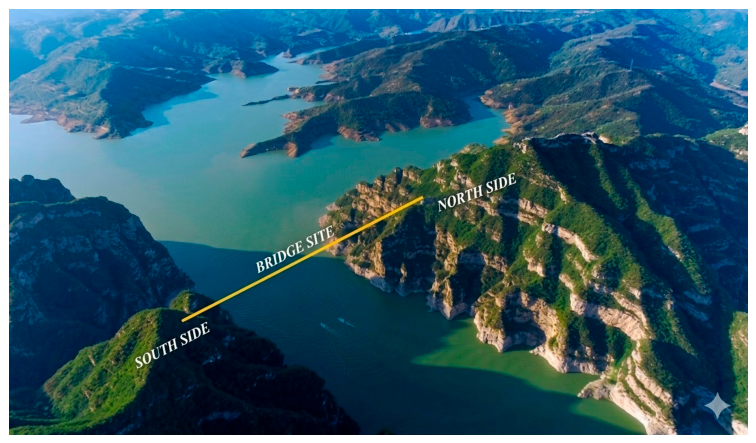
The Yellow River Three Gorges Rotating-Cable Suspension Bridge, as the world’s first rotation-cable suspension bridge, features a main span of 510 m and adopts a single-tower ground-anchor system. The north bank anchorage is embedded within a steep rock slope, with the anchorage body measuring 61.5 m in length and 45 m in width, and a maximum excavation depth of approximately 30 m. The excavation depth is considerable, and the geological conditions are complex, characterized by pronounced stress unloading, significant weathering effects, and marked variability in rock mass quality. During the processes of excavation, anchorage casting, and main cable tensioning, the stress redistribution, deformation evolution, and stability of the slope rock mass directly govern the long-term safety of the anchorage and the overall structural performance of the bridge [
13,
14,
15,
16,
17]. In particular, under extreme conditions such as heavy rainfall and seismic loading, the deterioration of rock mass parameters and the associated dynamic response may further exacerbate the risk of slope instability [
18,
19,
20,
21,
22]. Therefore, conducting refined stability analysis of the north bank anchorage excavation slope is of significant theoretical importance and practical engineering urgency.
At present, the methodological framework for rock slope stability analysis is relatively mature, encompassing limit equilibrium methods, continuum numerical simulation methods such as the finite element method and finite difference method, limit analysis methods, discrete element methods, field monitoring, and machine learning prediction approaches [
23,
24,
25,
26,
27,
28]. Arif et al. [
29], in their review of rock slope stability prediction methods, noted that traditional methods such as the limit equilibrium method, the finite element method, and the finite difference method, although widely applied, still face challenges in addressing the complexity of heterogeneous geological conditions and dynamic environmental factors. Steiakakis et al. [
30], through a comparative study of the limit equilibrium method, the limit analysis method, and the finite element method in the stability analysis of multi-layered slopes, found that different methods yield discrepancies in the location of the critical slip surface and the calculated factor of safety, thereby emphasizing the importance of combined analysis using multiple methods. Furthermore, Metya and Chaudhary [
31] developed a deterministic model for the factor of safety against planar failure of rock slopes containing irregular discontinuities, based on Patton’s shear strength criterion, revealing the influence of discontinuity surface undulation characteristics on slope stability evaluation. The aforementioned studies demonstrate that different analytical methods each have their applicable conditions and limitations, and it is advisable in engineering practice to employ multiple methods in an integrated manner. In this study, considering the complex geological structure, the significant heterogeneity of the rock mass, and the need for systematic analysis of coupled effects under multiple loading conditions during both the construction and operational stages of the north bank anchorage slope, a three-dimensional finite difference numerical simulation method based on FLAC3D is adopted as the primary analytical approach. Specifically, the limit equilibrium method, although computationally convenient, is unable to capture the three-dimensional spatial effects and progressive failure processes of slopes. In contrast, three-dimensional numerical simulation techniques can fully account for rock mass heterogeneity, structural discontinuities, and complex loading conditions, and have gradually become a primary tool for analyzing high and steep slope stability.
However, existing studies have mostly focused on conventional slopes or traditional bridge-type anchorages [
32,
33,
34,
35], and research on the stability evolution mechanisms of rotating-cable suspension bridge anchorage slopes throughout the entire construction and operational process remains a blank. In particular, the deformation patterns, plastic zone development, safety reserves, and failure modes of slopes under multi-scenario coupled loading still require systematic investigation.
To this end, based on the geotechnical investigation and rock mass parameter test results, this study establishes a true three-dimensional geological model using Rhino6 software and systematically simulates the slope stability under five loading conditions—foundation pit excavation, main cable load application, heavy rainfall, and seismic loading (natural and artificial waves)—using FLAC3D7.0 software, with a focus on the comparative analysis of displacement distribution characteristics and plastic zone evolution patterns under each condition, and the elucidation of the influence mechanisms of anchorage counterweight effects, saturated seepage, and seismic dynamic loading on slope stability. Meanwhile, a stereographic projection kinematic analysis is employed to evaluate the feasibility of discontinuity-controlled failure modes, and the shear strength reduction (SSR) method is used to quantitatively calculate the factors of safety for the critical loading conditions, thereby compensating for the limitations of displacement and plastic zone analysis alone in evaluating the safety margin. The research findings can provide theoretical support for the construction safety control and long-term operational maintenance of this bridge, and also serve as a reference for slope design and protection of similar rotating-cable suspension bridges.
3. Three-Dimensional Numerical Simulation of the Slope
3.1. Three-Dimensional Numerical Model and Boundary Conditions
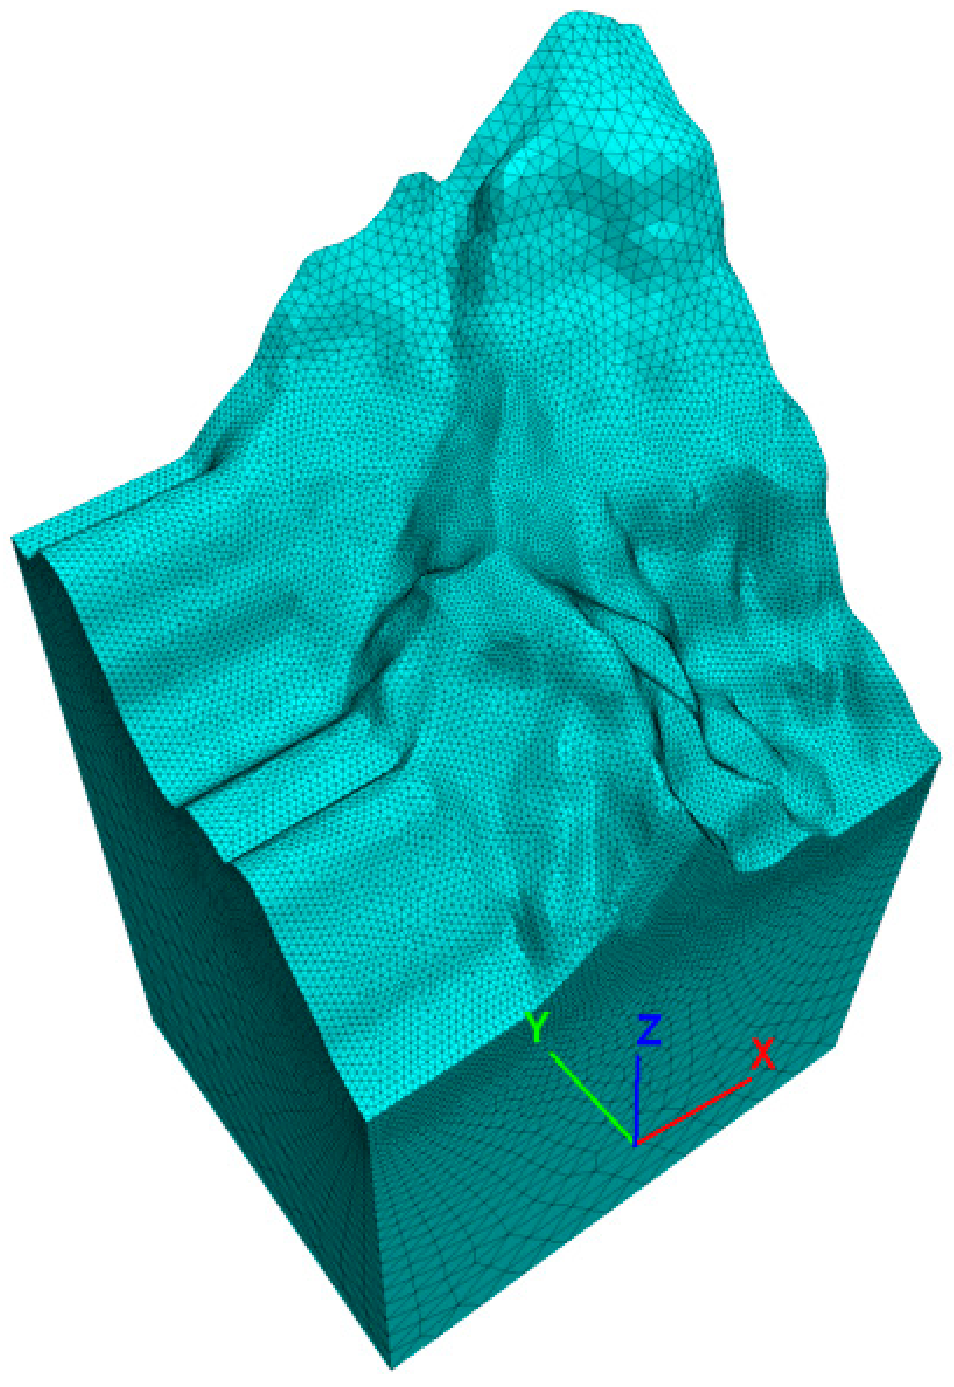
Given the complexity of the slope’s geological structure, this study establishes a true three-dimensional (3D) geological model using Rhinoceros6 (Rhino6) software, based on geological survey reports, borehole data, and UAV photogrammetric survey data. The model domain encompasses the anchorage and its zone of influence, with a longitudinal extent of 240 m, a transverse width of 190 m, and a vertical extent modeled in accordance with the actual topographic relief. The model is discretized using tetrahedral elements, with local mesh refinement applied to the anchorage foundation pit region, resulting in a total of 189,424 elements and 35,319 nodes. Fixed boundary conditions are applied to the base of the model, normal displacement constraints are imposed on the lateral boundaries, and the ground surface is treated as a free boundary. The 3D geological model and its mesh discretization are presented in
Figure 3.
In the meantime, to verify the influence of mesh density on the calculation results, this study conducted a mesh sensitivity analysis, comparing the calculation results of three different density mesh schemes: sparse mesh (71,691 elements), medium mesh (189,424 elements, adopted in this paper), and dense mesh (261,525 elements). Taking condition 1 (anchorage pit excavation) as an example, the maximum displacement of the slope obtained by the three mesh schemes was 12.75 mm, 13.13 mm, and 13.35 mm respectively. The distribution characteristics of the plastic zone were basically the same. The maximum displacement difference between the medium mesh and the dense mesh was 1.68%, and the difference with the sparse mesh was 2.89%, both of which were less than the 5% convergence threshold commonly accepted in engineering. The results show that the medium mesh density adopted in this paper can fully meet the calculation accuracy requirements while also taking into account the calculation efficiency.
3.2. Material Parameters and Constitutive Models
Based on the geological survey reports, the geotechnical parameters adopted in the present computational model were comprehensively determined, as summarized in
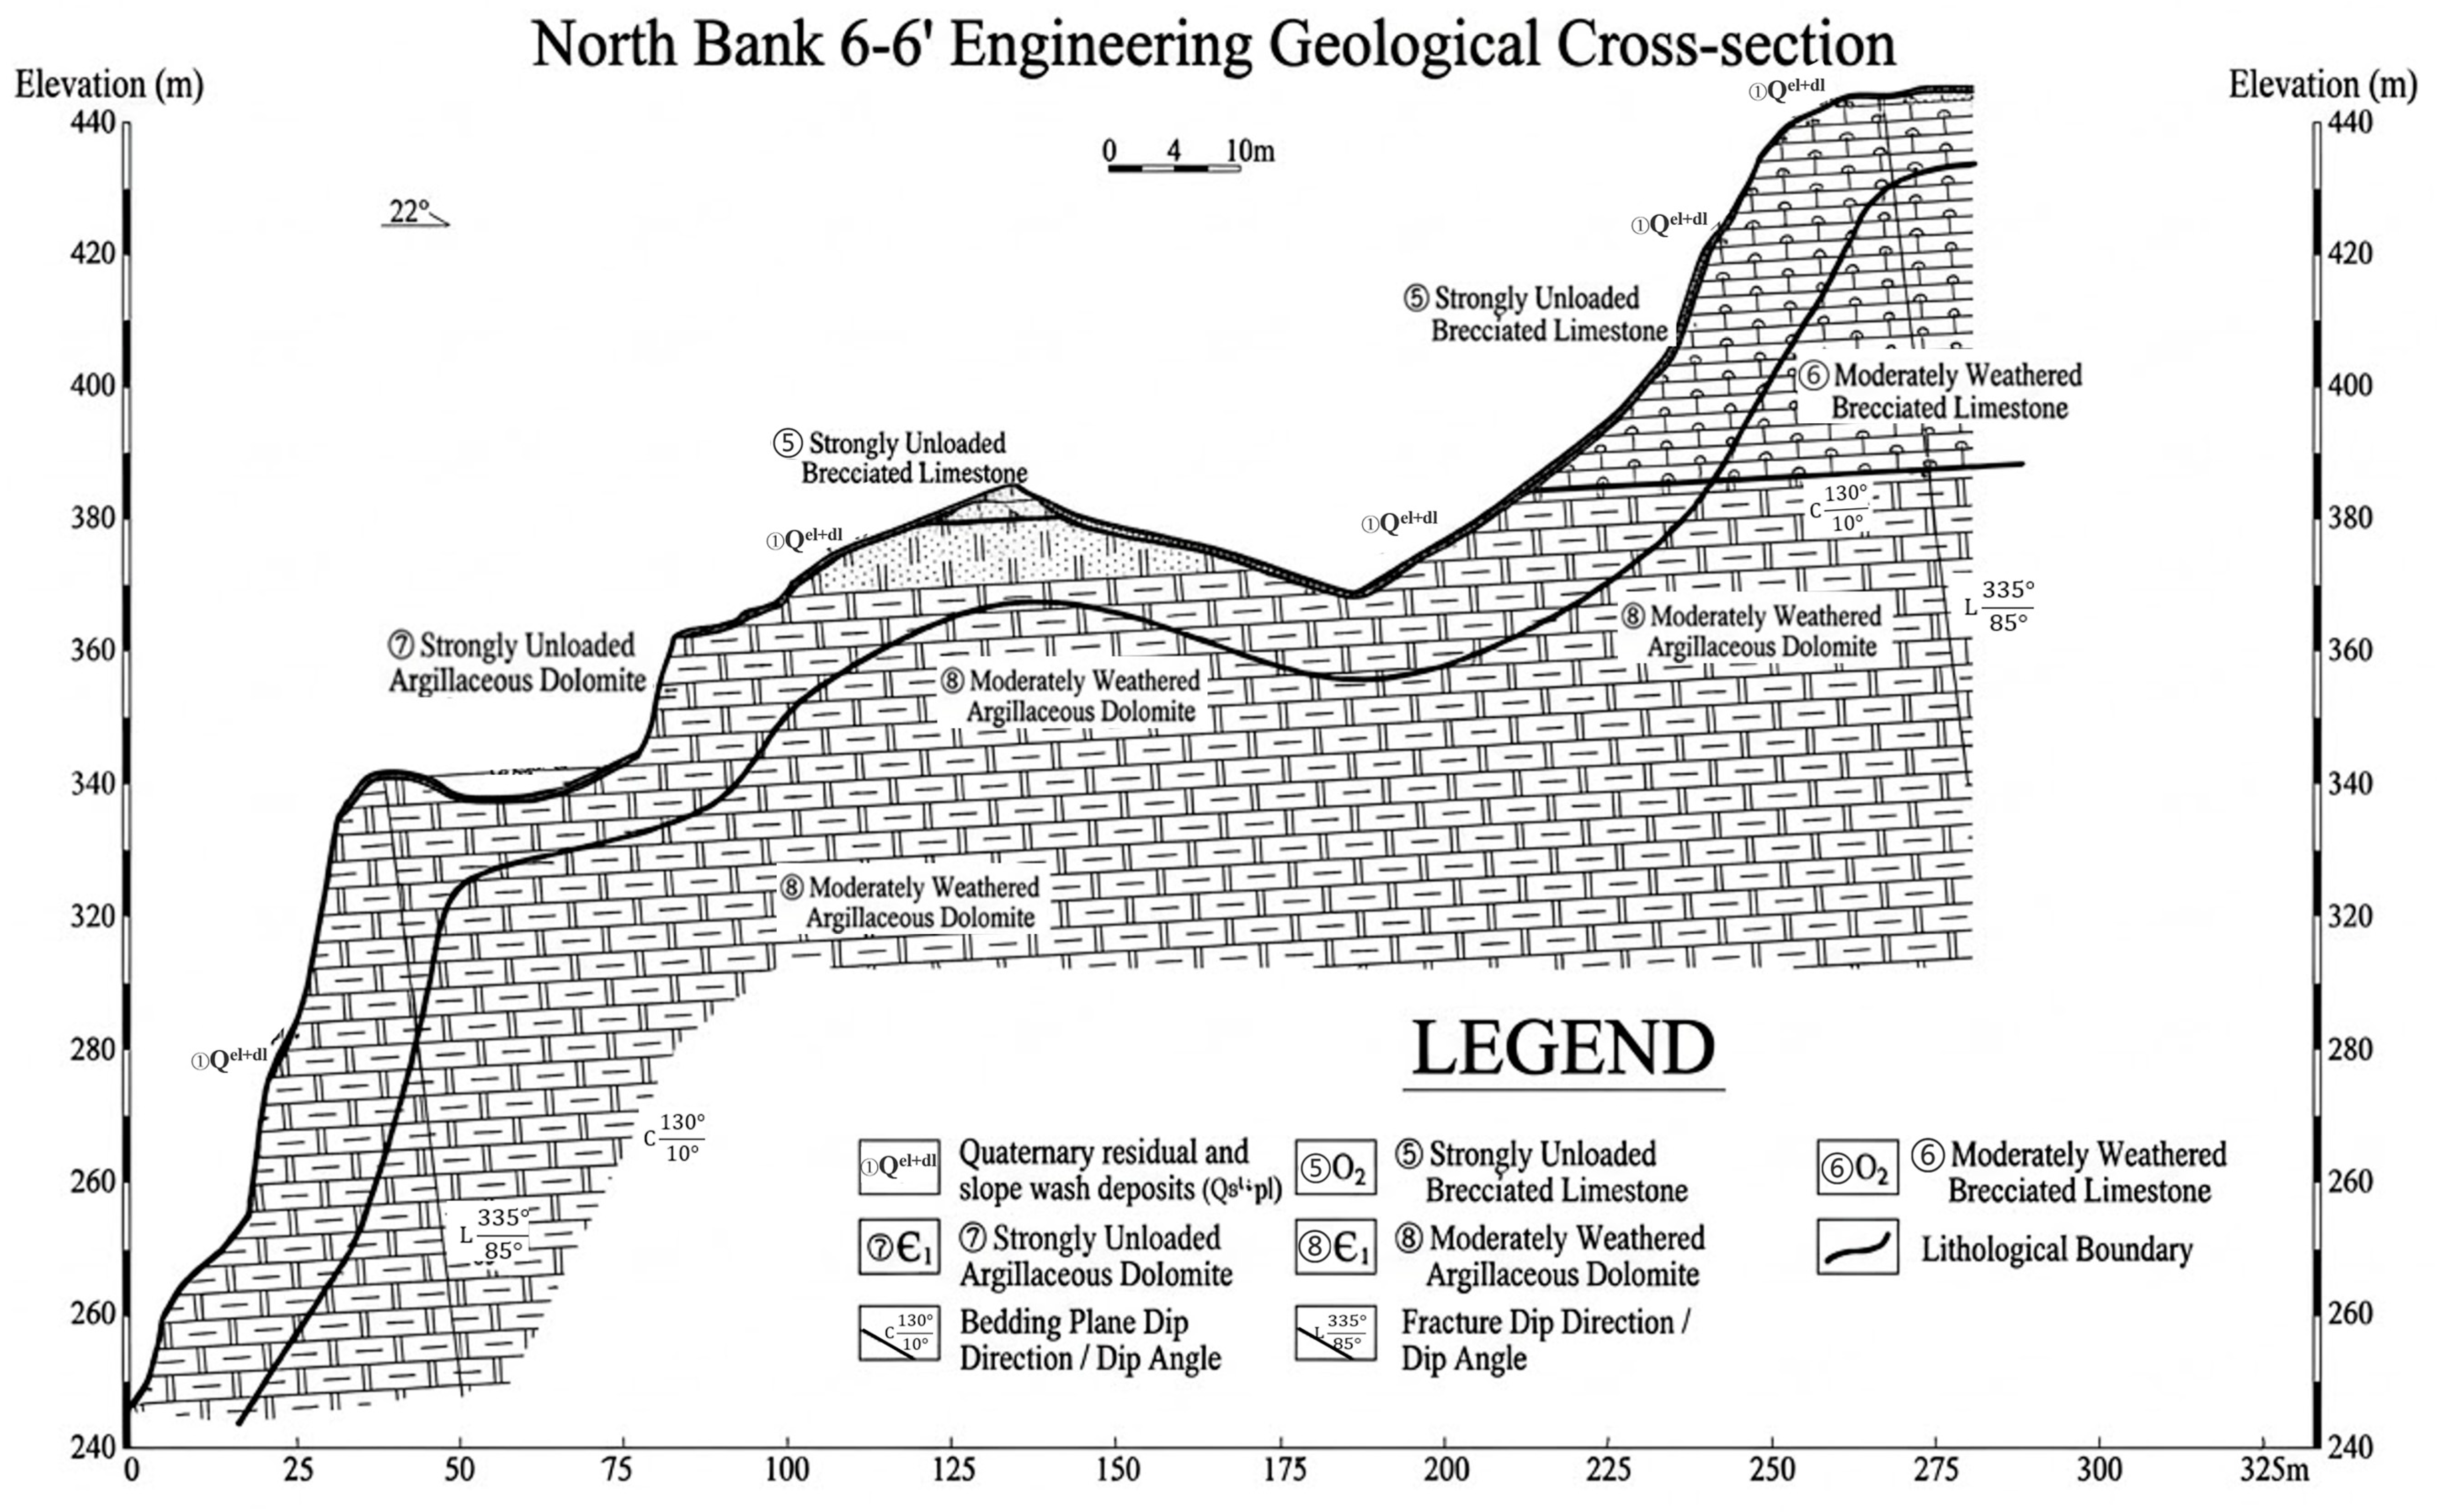
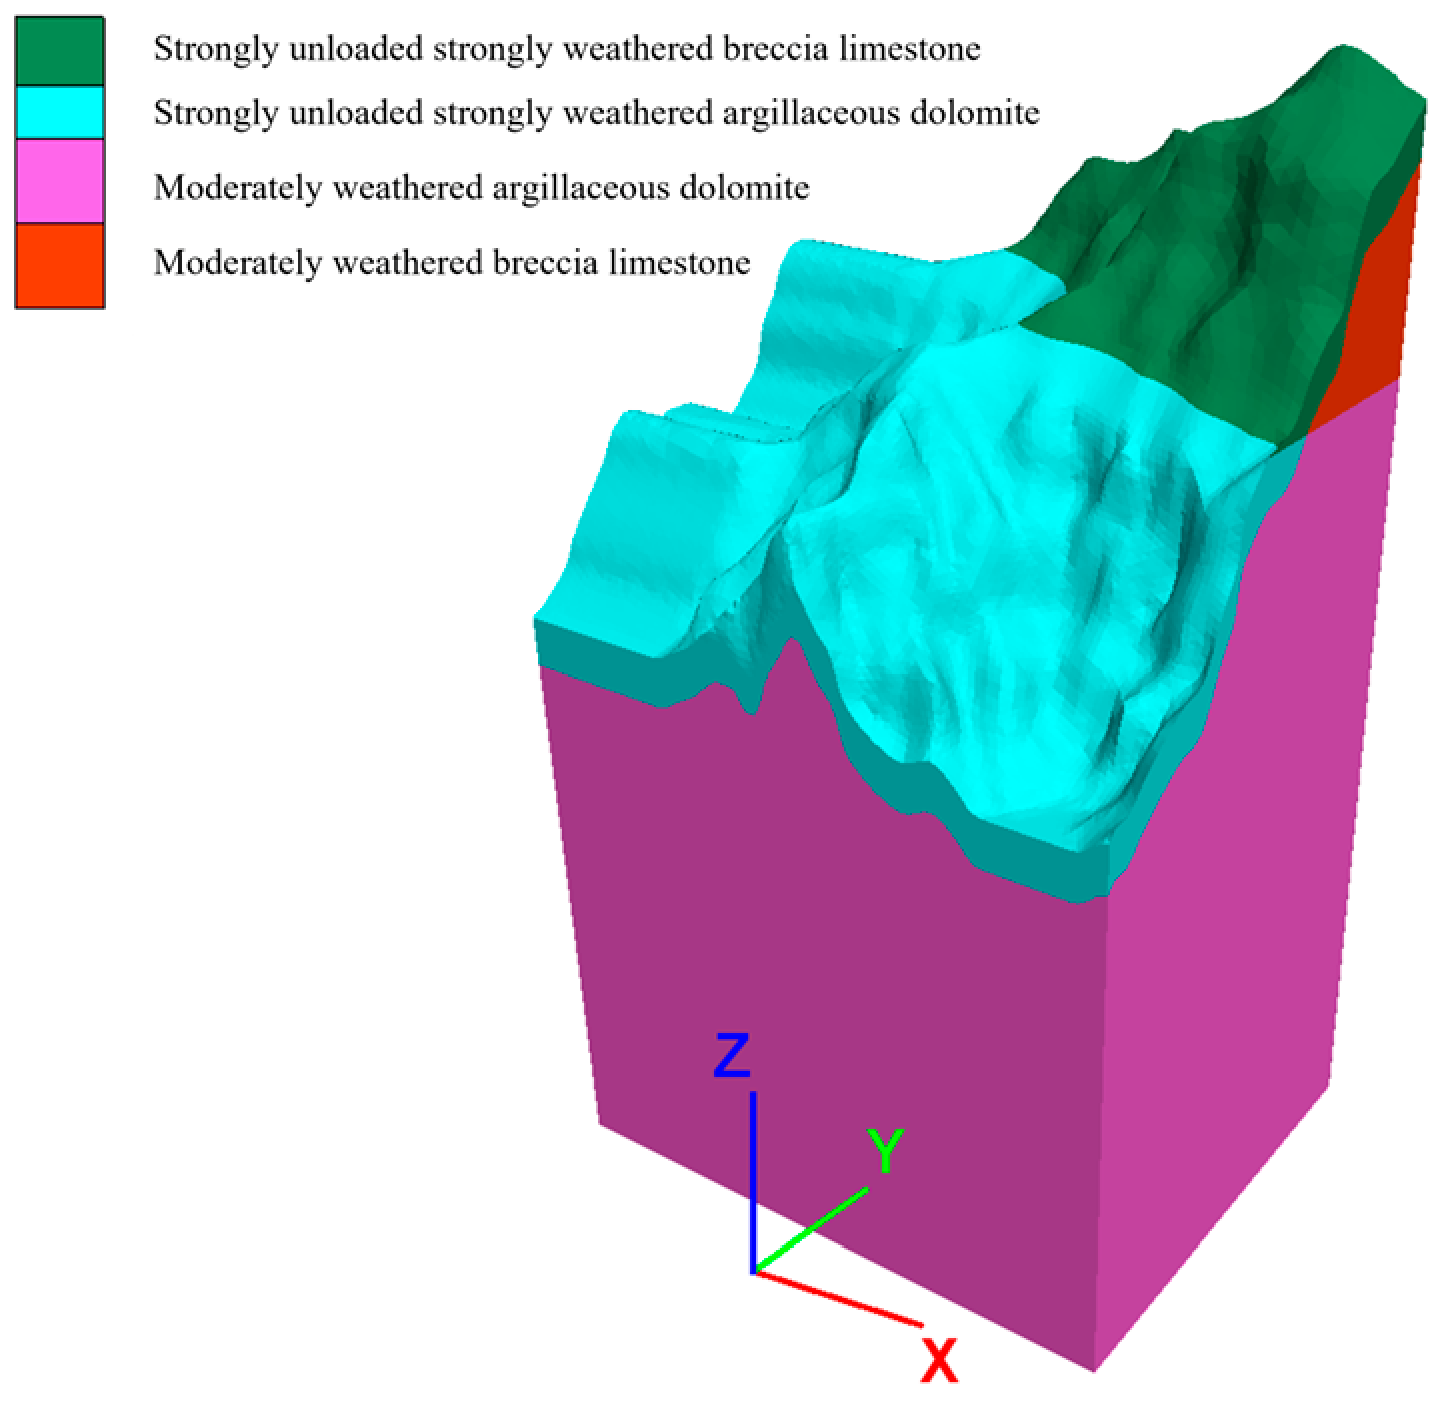
Table 1. The rock mass units incorporated in the model are as follows: strongly unloaded and strongly weathered brecciated limestone, moderately weathered brecciated limestone, strongly unloaded and strongly weathered argillaceous dolomite, moderately weathered argillaceous dolomite (as illustrated in
Figure 4). The anchorage is located in the shallow subsurface of the hillside, with a relatively small burial depth. Although the regional geological structure of the bridge site area is controlled by the Fenwei Graben Belt and the Taihang Mountain Piedmont Fault Belt, the faults nearest to the bridge site are the F4 Shangye–Tadi normal fault and the F16 Anli fault, and the anchorage foundation pit is located at a certain distance from these major fault zones. Moreover, the shallow rock mass of the north bank slope has undergone long-term unloading and weathering, with the intense unloading depth reaching 20–22 m, and the tectonic stresses within this depth range have been largely released, such that the present-day in situ stress field of the shallow layer is dominated by gravitational stress. The geotechnical investigation report also indicates that the anchorage is situated in the shallow subsurface of the hillside and that the influence of the tectonic stress field is insignificant. In summary, only the gravitational stress field is considered in the computational analysis.
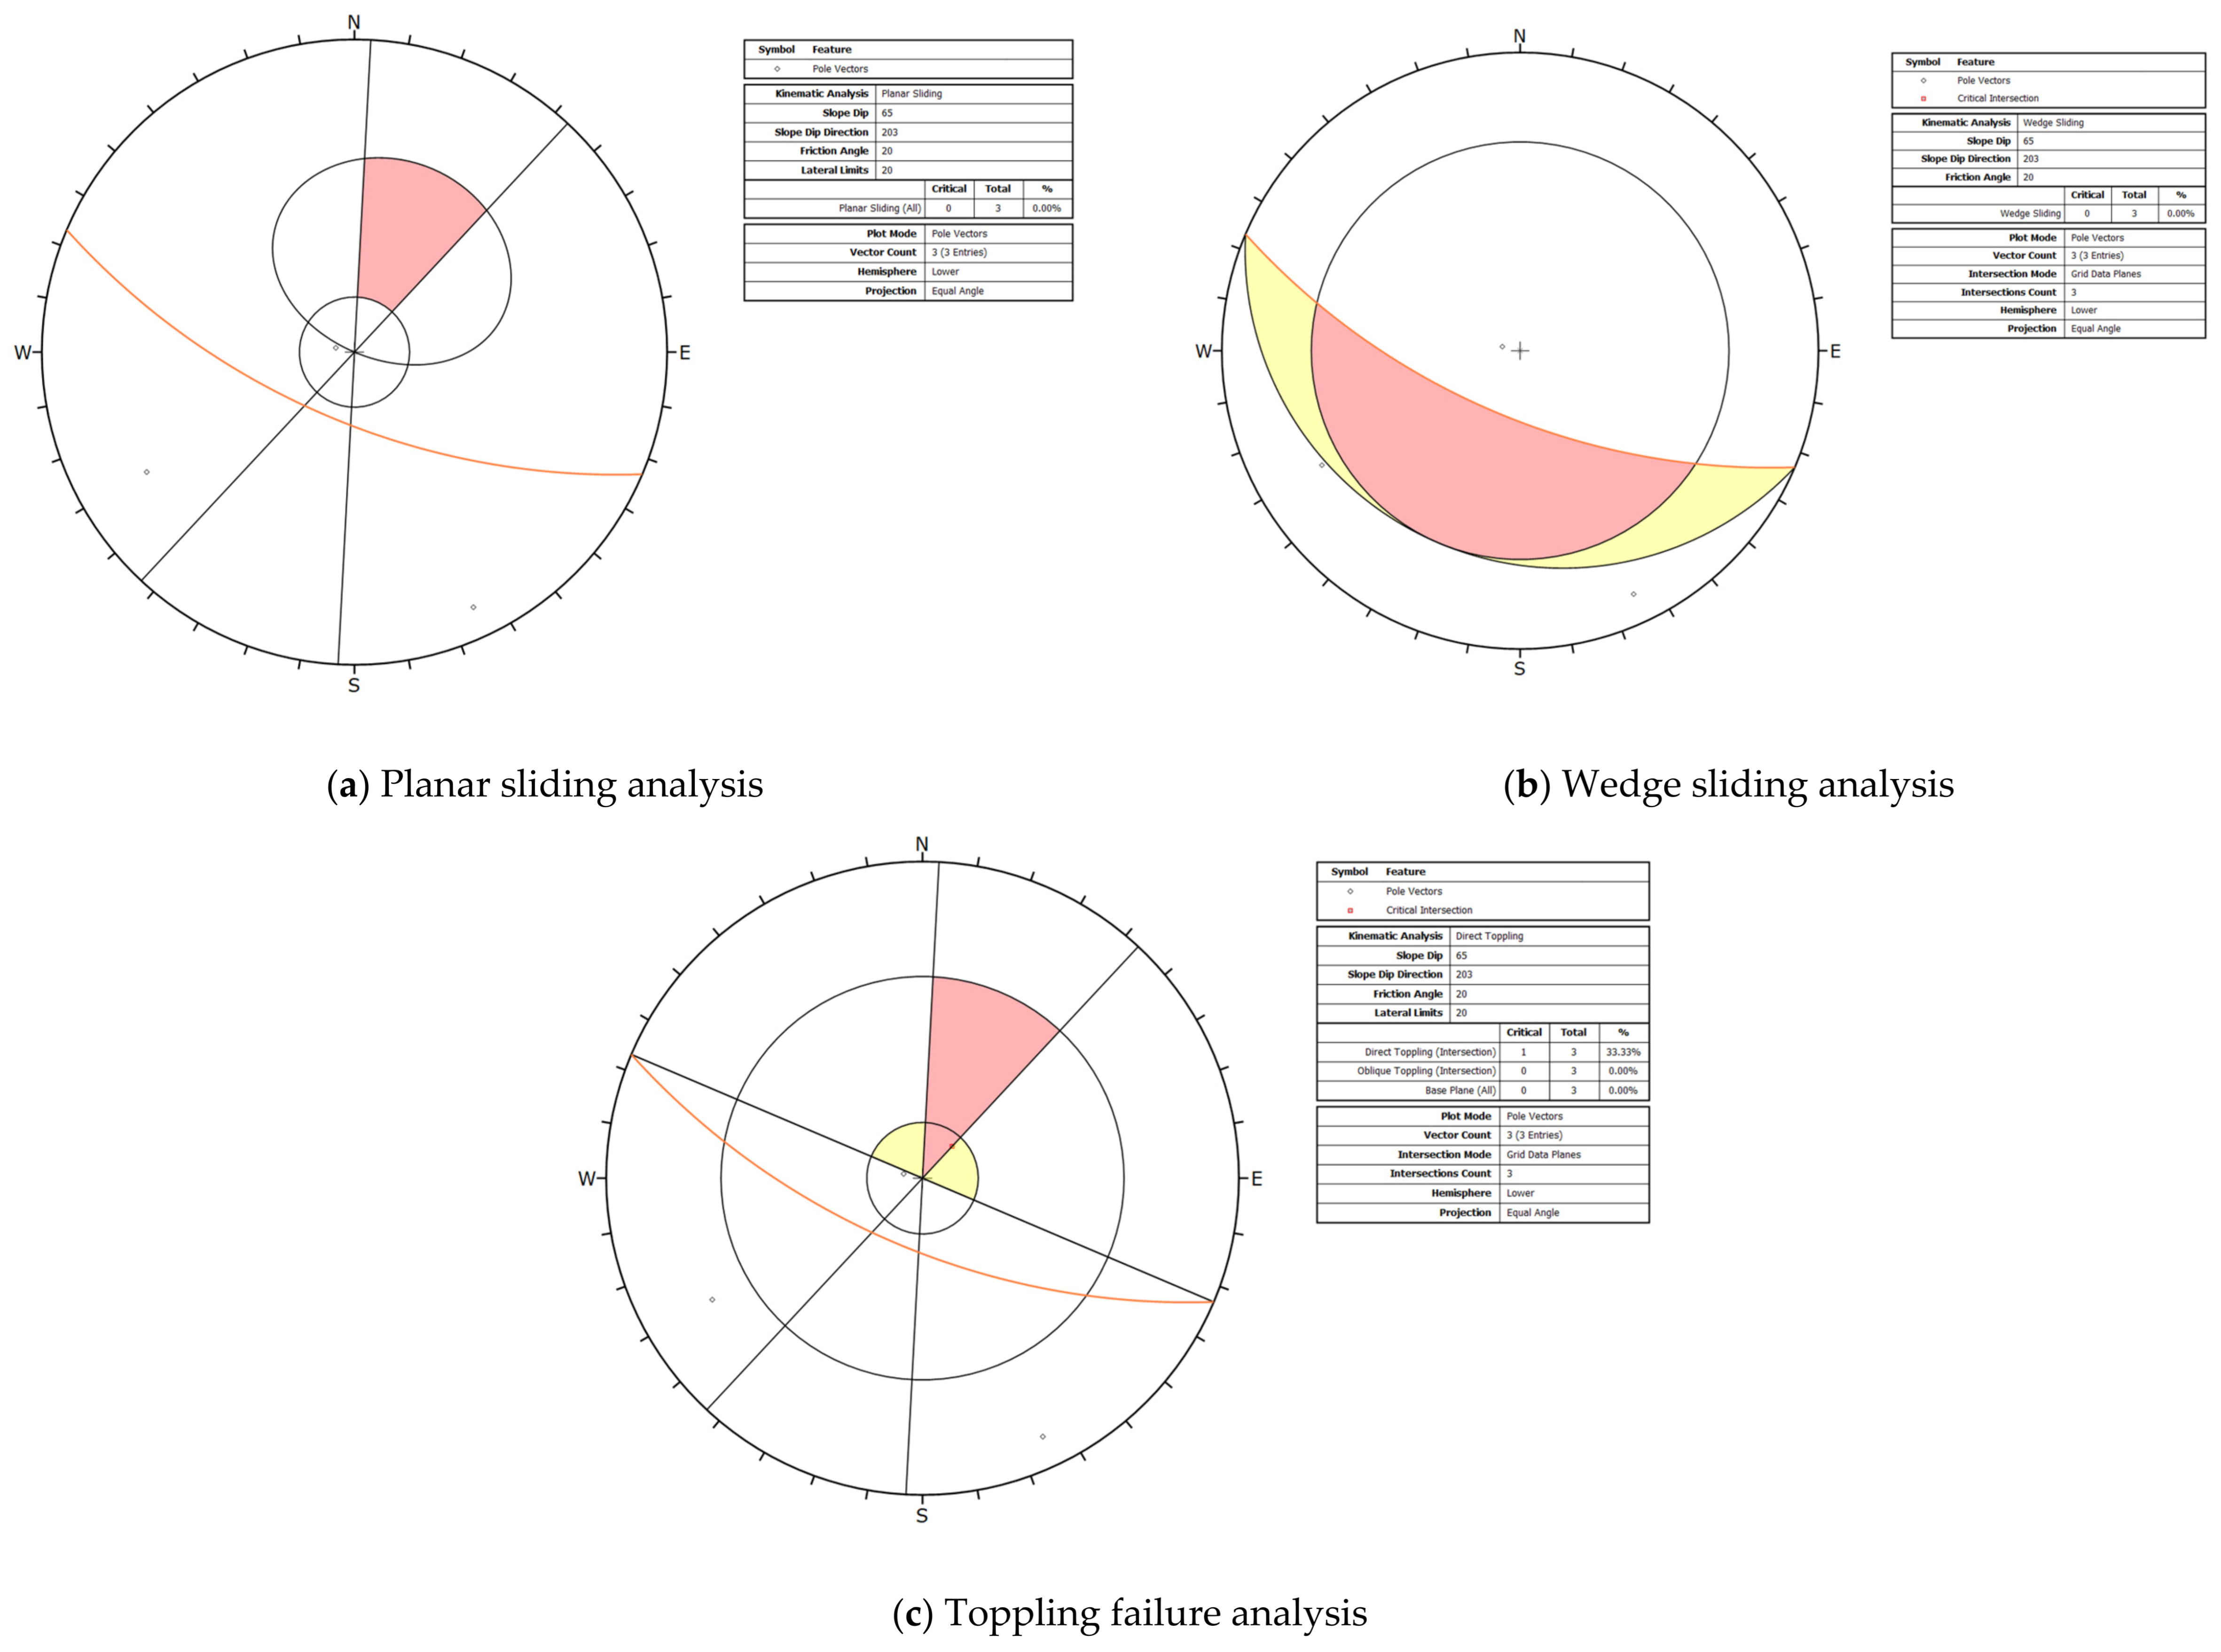
To assess whether kinematically admissible failure modes controlled by discontinuities exist in the north bank anchorage slope, a kinematic analysis using stereographic projection was performed with Dips7.0 software based on the discontinuity orientation data from the geotechnical investigation report (
Figure 5). The analysis parameters are as follows: slope dip direction 203°, slope dip angle 65°; the input discontinuities include the bedding plane (100° ∠7°), dominant joint set J1 (60° ∠75°), and J2 (335° ∠84°), with discontinuity friction angles of 25–27° determined from direct shear test results on fracture surfaces. The kinematic analysis results are as follows: the planar sliding analysis indicates that none of the pole vectors of the discontinuity sets fall within the critical sliding zone, yielding a kinematic feasibility of 0% for planar sliding (
Figure 5a); the wedge sliding analysis indicates that none of the intersection lines of the discontinuity combinations fall within the wedge sliding critical zone, yielding a kinematic feasibility of 0% for wedge sliding (
Figure 5b); the toppling analysis shows that one discontinuity intersection line falls within the kinematic critical zone for direct toppling, but the base plane analysis yields a failure probability of 0%, indicating the absence of the basal sliding surface condition required for toppling failure (
Figure 5c). Furthermore, toppling failure requires the rock mass to exhibit a slender columnar geometry with well-connected through-going joints, whereas the rock mass of the north bank slope is characterized by a medium to medium-thick bedded structure, which does not satisfy the rock mass structural conditions necessary for toppling failure. In summary, the kinematic feasibility of discontinuity-controlled failure in the north bank anchorage slope is extremely low, and it is reasonable to adopt a continuum numerical model for the slope stability analysis.
The rock mass is modeled using the elastic–plastic Mohr–Coulomb constitutive model. Although the Hoek–Brown criterion can better describe the nonlinear strength envelope of jointed rock masses, its parameter estimation relies on a reliable assessment of the Geological Strength Index (GSI). In this project, the rock mass exhibits pronounced unloading zonation, with the intense unloading depth reaching 20–22 m, and the GSI values within the same rock unit show a considerable range (28–37 for the shallow layer and 48–54 for the deeper layer), resulting in substantial uncertainty in the input parameters themselves. Furthermore, in the numerical implementation, the nonlinear Hoek–Brown strength envelope must be linearized over a specific confining pressure range, which may introduce additional fitting errors in the shallow low-confinement zone of the slope. In contrast, the parameters of the Mohr–Coulomb model (cohesion c and friction angle φ) can be directly determined from laboratory triaxial tests and direct shear tests, with clear physical significance, thereby avoiding the additional uncertainties introduced during GSI assessment and strength envelope fitting. Therefore, this model is adopted in the present study. The anchorage material is modeled using a linear elastic model.
3.3. Calculation Schemes
To systematically investigate the stability of the anchorage slope on the north bank of the Yellow River Three Gorges Bridge throughout the entire construction and operational phases, the slope stability analysis is divided into two stages—the construction stage and the operational stage—in accordance with the requirements of the Technical Code for Building Slope Engineering (GB 50330-2013 [
37]). The construction stage analysis examines the slope response following foundation pit excavation. The operational stage analysis evaluates the slope response under the applied anchorage and main cable loads for the following loading scenarios: normal operating conditions, heavy rainfall conditions, and seismic conditions (incorporating one natural seismic wave and one artificially synthesized seismic wave). According to the structural design of the north bank gravity anchorage, the anchorage base is of a stepped configuration with plan dimensions of approximately 61.5 m × 45 m and a thickness ranging from 7.8 m to 28.8 m. The self-weight of the anchorage is applied as a body force to the anchorage elements. The main cable load is 56,400 kN, applied as a horizontal force in the bridge axial direction to the nodes at the cable–anchorage connection zone at the rear end of the anchorage, simulating the resultant force transmitted from the main cable through the anchorage to the surrounding rock mass. This simplified treatment equivalently represents the actually distributed cable forces as a concentrated resultant force acting on the connection zone. Given that the main cable force is approximately horizontal in direction and the contact area between the anchorage and the rock mass is large, this simplification is considered reasonable and tends to be conservative in terms of local stress concentration. The specific configurations of each loading scenario are presented in
Table 2.
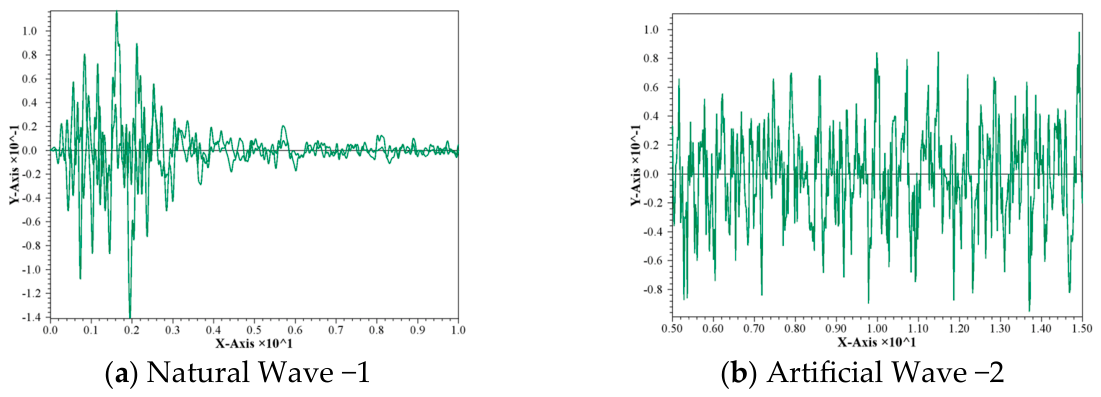
In this dynamic simulation, one natural seismic wave and one artificially synthesized seismic wave were selected, with original record durations of 20 s and 40 s, respectively. The natural seismic wave exhibits typical non-stationary characteristics, with the strong-motion phase concentrated in the first 2–3 s and the amplitude gradually attenuating thereafter. As shown in the processed acceleration time–history curve (
Figure 6a), the amplitude has diminished to near zero by 10 s, indicating that 10 s adequately covers the strong-motion phase. The artificially synthesized seismic wave was generated to match the site design response spectrum and exhibits the characteristics of a stationary random wave, with essentially uniform amplitude throughout the entire duration. For this type of artificial wave, the frequency content and energy characteristics of any consecutive 10 s segment are essentially consistent, and are sufficient to fully represent the spectral characteristics of the target response spectrum. Considering computational efficiency, both seismic waves were truncated to a duration of 10 s in this simulation. It should be noted that, for the artificial wave, given its stationary nature, extending the duration would primarily increase the cumulative damage effect, and subsequent studies will consider adopting longer durations for supplementary verification. A static boundary condition was applied at the base of the model, and free-field boundary conditions were imposed on the lateral boundaries. Local damping was adopted with a local damping coefficient of 0.157. A “dynamic multi-step” procedure was employed during the computation to reduce the overall calculation time.
4. Simulation Results and Analysis
Due to the limitations of this article’s length, the numerical analysis results are presented here in the form of a typical profile (axial section of the bridge).
4.1. Slope Excavation Under Normal Conditions During Construction Stage (Condition 1)
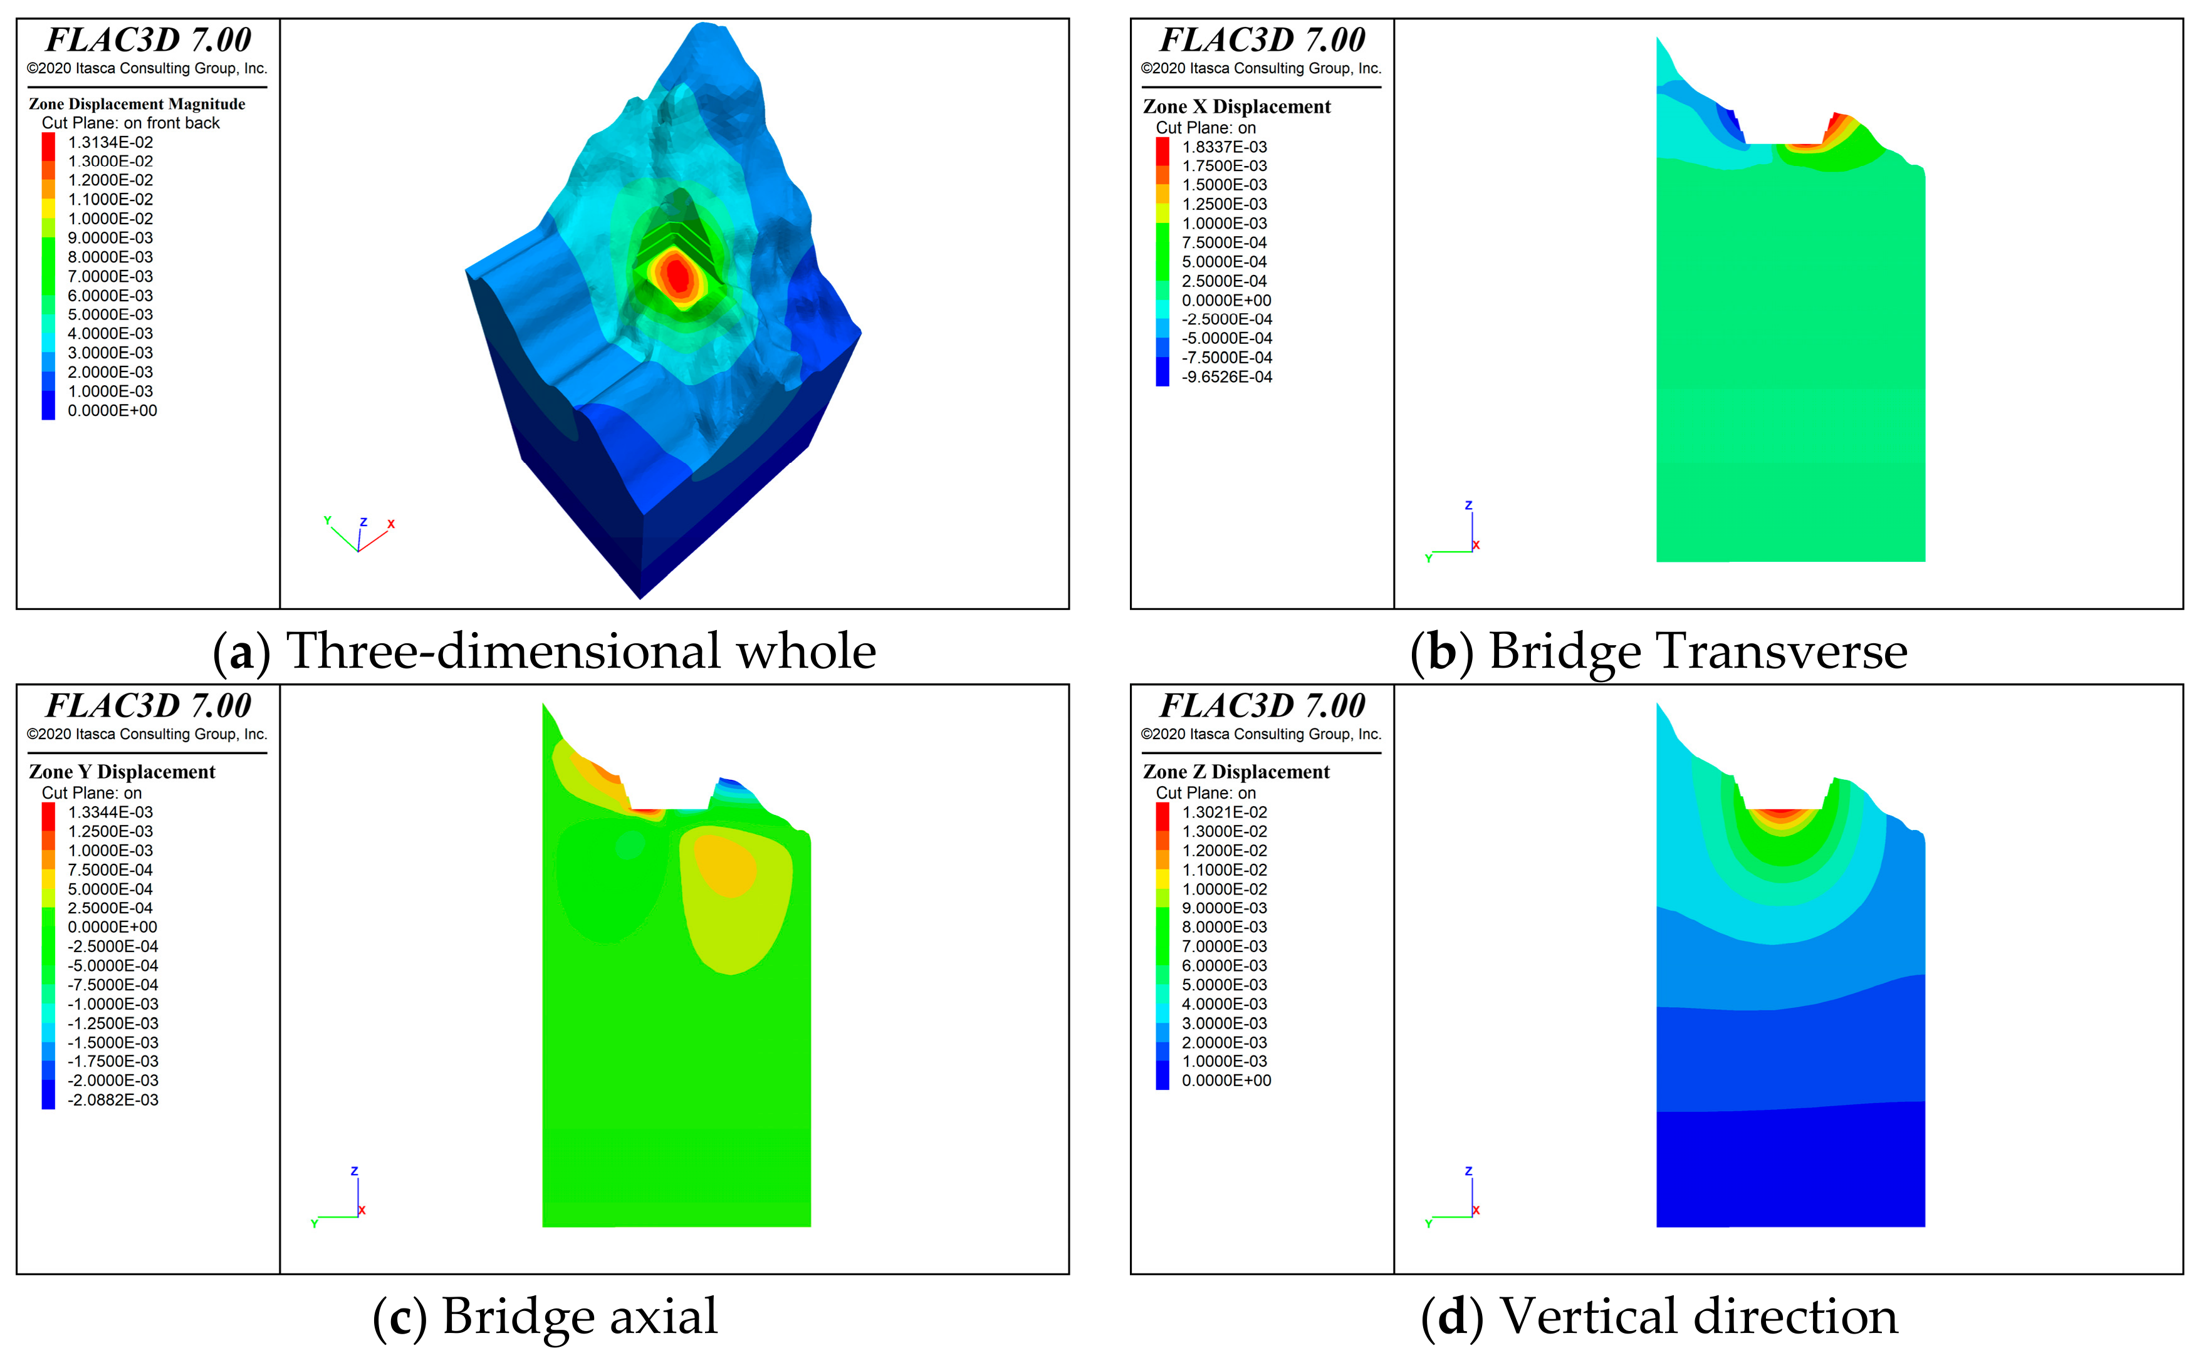
The displacement distribution of the slope following anchorage foundation pit excavation is presented in
Figure 7. As indicated by the displacement magnitude contour plot, the maximum slope displacement is 13.13 mm, occurring in the upper-to-middle portion of the foundation pit. The displacement field exhibits a progressive increase from the interior of the slope mass toward the free face, with the zone of influence extending approximately 1.0 to 1.5 times the excavation depth. These results indicate that the excavation-induced disturbance is predominantly concentrated within the shallow surface layer in the vicinity of the excavation face. This can be attributed to the following mechanism: upon the formation of the free face during foundation pit excavation, the lateral confinement of the slope mass is released, causing the rock mass to deform toward the free face under stress unloading. The closer the rock mass is to the free face, the more pronounced the stress release and, consequently, the greater the resulting deformation [
38].
In terms of the directional displacement components, the vertical displacement is the largest, reaching 13.02 mm, while the horizontal displacements are comparatively smaller, with values of 1.83 mm and 2.09 mm in the X- and Y-directions, respectively. The base of the foundation pit exhibits upward rebound, whereas the upper portion of the slope undergoes settlement, which is consistent with the typical excavation unloading response behavior observed in rock slopes. This can be attributed to the following mechanisms: the release of compressive stress at the base following excavation induces elastic rebound; the upper portion of the slope, having lost its underlying support, undergoes settlement under self-weight; and the rock mass in the vicinity of the free face moves outward upon the release of lateral confinement. The maximum displacement occurs at the interface between the strongly weathered and moderately weathered rock masses, and displacement concentration is observed at the crest edges of the foundation pit benches, indicating that differential rock mass stiffness and geometric discontinuities are the governing factors controlling the localization of deformation. The deformation modulus of the strongly weathered rock mass is significantly lower than that of the moderately weathered rock mass, and the abrupt stiffness transition at the interface leads to deformation concentration. The geometric discontinuity at the bench edges induces stress concentration, which further amplifies the displacement in this region.
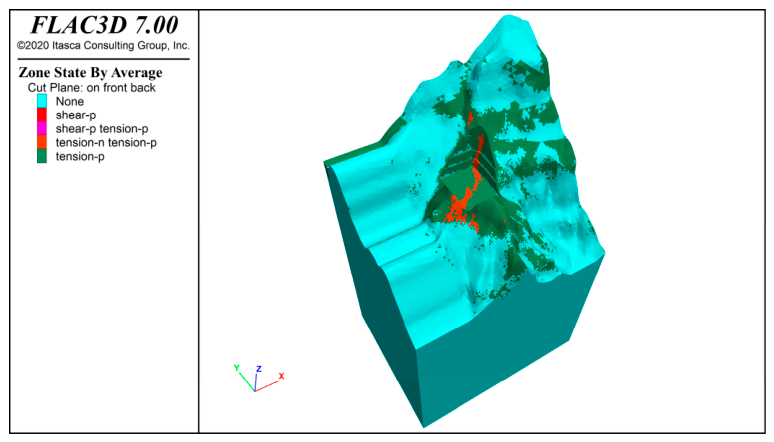
The distribution of the plastic zone in the slope following anchorage foundation pit excavation is presented in
Figure 8. As shown in the figure, the plastic zone is predominantly distributed in the vicinity of the excavation face and within the shallow surface layer of the slope, exhibiting a discontinuous and dispersed distribution pattern with a depth of approximately 3 to 5 m. No through-going failure surface has developed, indicating that the slope remains globally stable following foundation pit excavation, although localized regions have entered a state of plastic yielding. This can be attributed to the stress redistribution induced by excavation: the confinement of the rock mass in the vicinity of the excavation face is reduced, and once the stress level exceeds the strength of the rock mass, the material transitions into a plastic state.
In terms of failure modes, the shear plastic zone is concentrated along the excavation face in the middle portion of the foundation pit, exhibiting a banded distribution pattern. Tensile failure zones are sporadically distributed within the shallow surface layer of the slope, while tensile–shear composite failure zones emerge at the slope crest and along the bench edges. The distinct failure modes reflect the spatial heterogeneity of the stress field: shear stress concentration in the vicinity of the excavation face gives rise to shear failure; unloading-induced tensile stresses within the shallow surface layer result in tensile failure; and the combined tensile–shear action at the slope crest and bench edges produces composite failure. The plastic zone is predominantly developed within the strongly weathered rock mass, whereas the extent of the plastic zone in the moderately weathered rock mass is considerably more limited. This indicates that the degree of rock mass weathering governs the development of the plastic zone, as the lower strength of the strongly weathered rock mass renders it more susceptible to reaching yield conditions.
4.2. Operation Stage
4.2.1. Effect of Main Cable Load Under Normal Conditions (Condition 2)
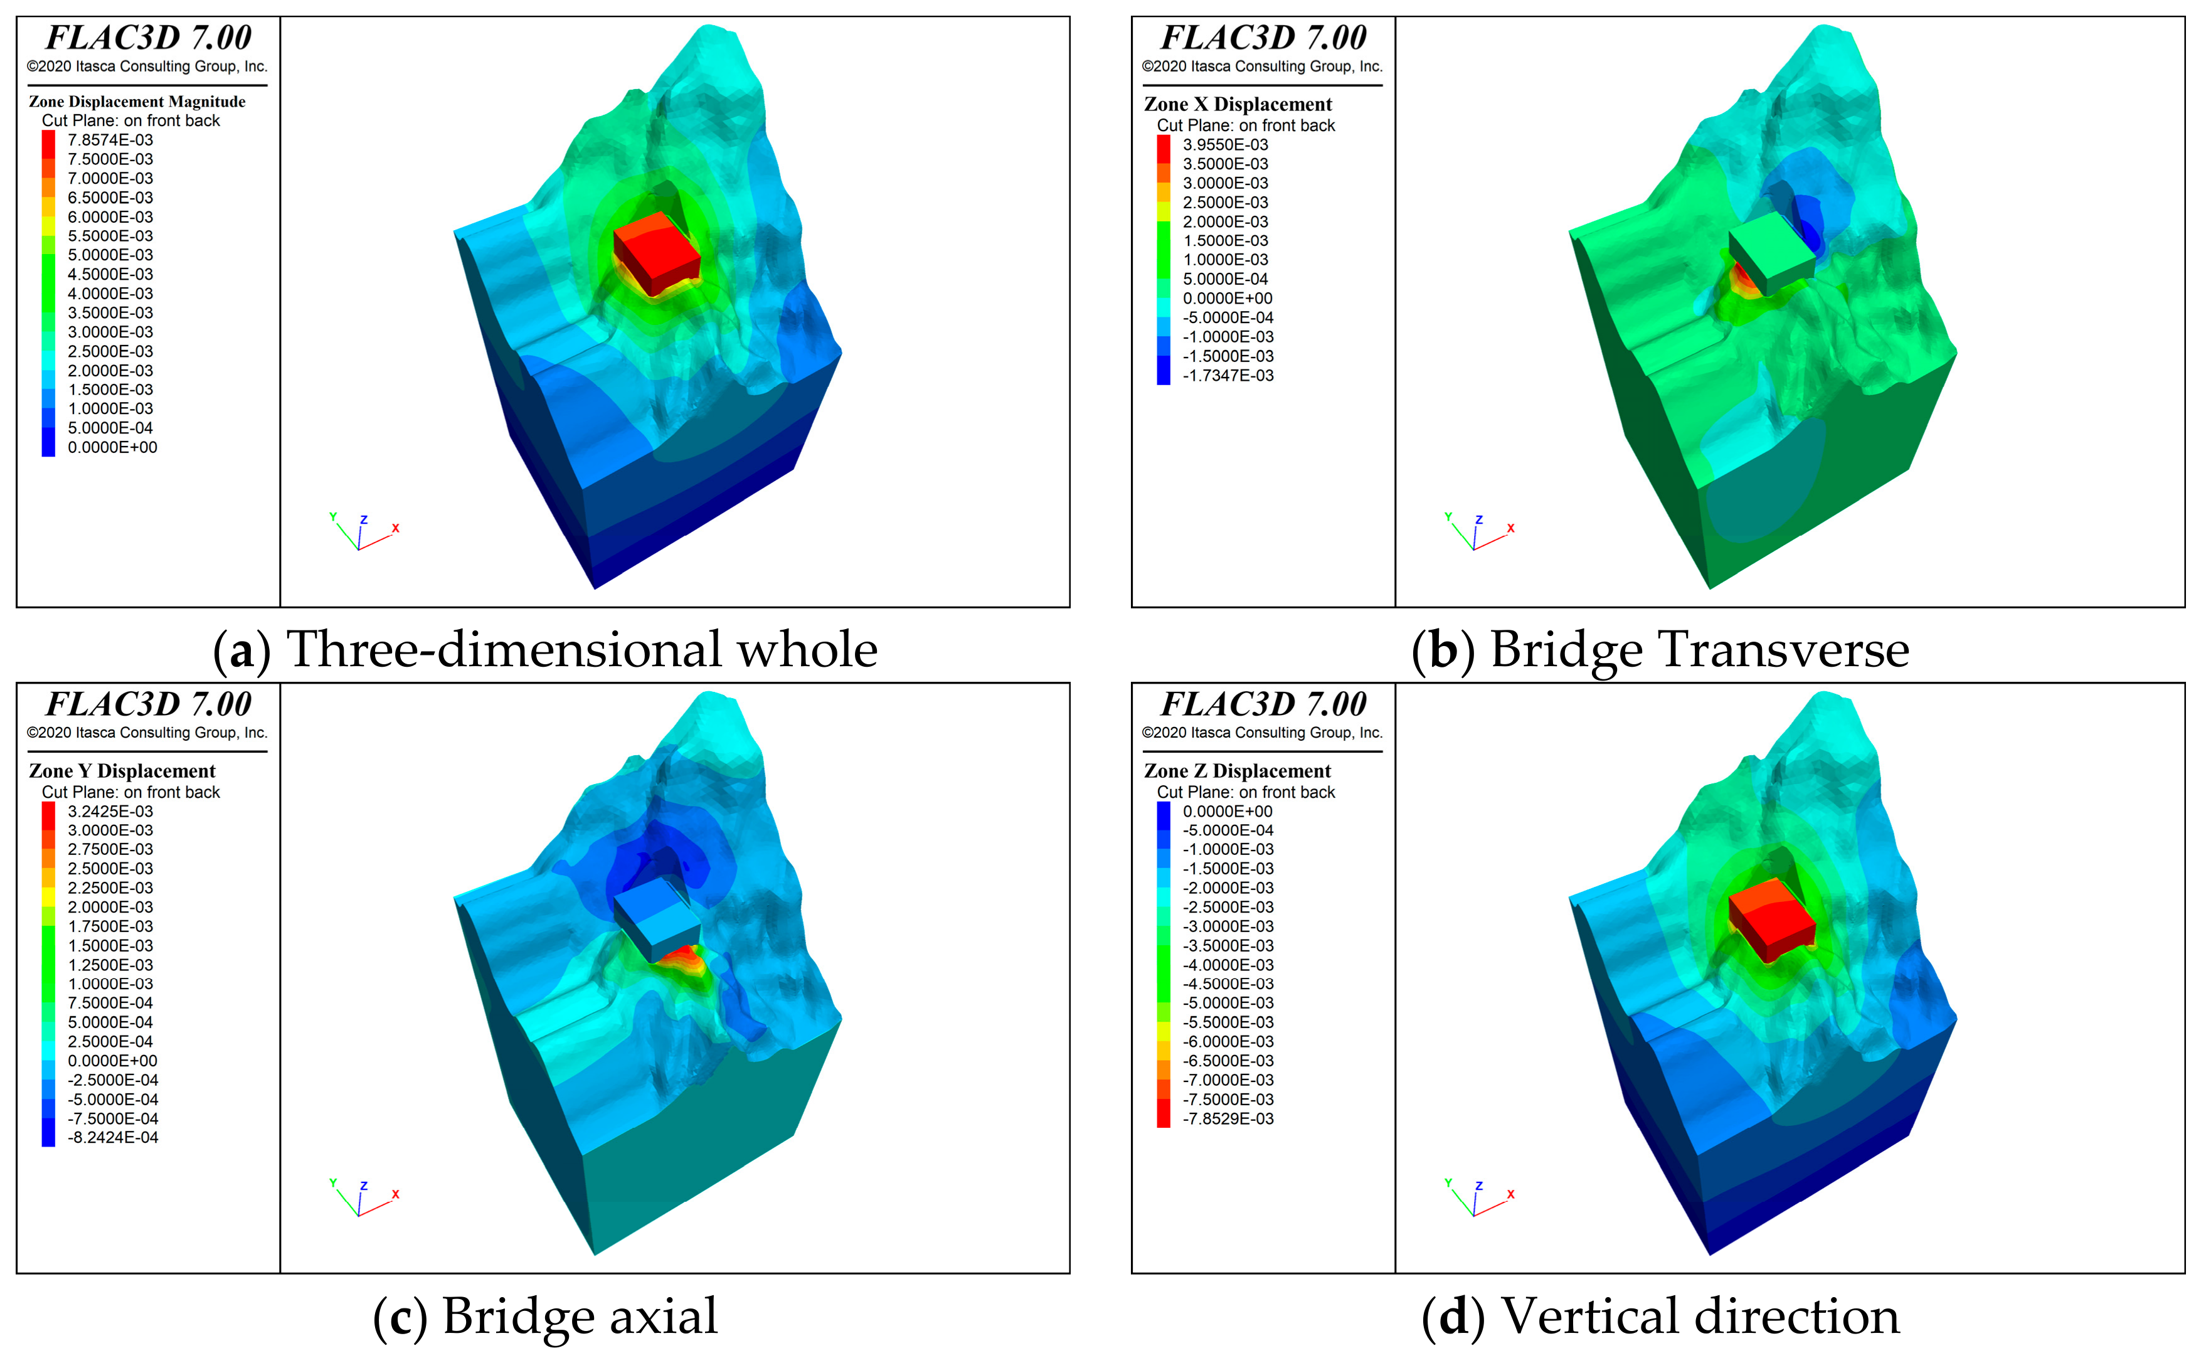
The displacement distribution of the slope following the application of the main cable load under normal operating conditions is presented in
Figure 9. As indicated by the displacement magnitude contour plot, the maximum slope displacement decreases to 7.86 mm, representing a reduction of 40.2% compared to the excavation condition. The displacement is concentrated in the anchorage structure and its frontal zone, exhibiting a pronounced localization characteristic. The displacement in the rock mass behind and beneath the anchorage is further reduced, indicating that the surcharge effect of the anchorage self-weight significantly improves the overall stability of the slope. This can be attributed to the fact that the self-weight of the anchorage induces substantial compressive stress on the underlying rock mass, thereby increasing the confining pressure, partially counteracting the tensile stresses generated by excavation unloading, and effectively suppressing the rebound deformation of the slope mass.
In terms of the directional displacement components, the vertical displacement remains the largest at 7.85 mm, reflecting a reduction of 39.7% relative to the excavation condition. The displacements in the X- and Y-directions are 3.96 mm and 3.24 mm, respectively, both of which are slightly increased compared to the excavation condition. The rock mass at the base of the anchorage transitions from upward rebound to downward compressive settlement, while the frontal zone of the anchorage exhibits horizontal displacement in the direction toward the river. This transformation in deformation pattern reflects the alteration of the stress state within the foundation pit region induced by the applied loading. The self-weight of the anchorage causes the underlying rock mass to transition from a tensile to a compressive stress state, with the vertical deformation correspondingly shifting from rebound to settlement. The horizontal tension from the main cable is transmitted through the anchorage to the surrounding rock mass, generating new stress concentrations at the frontal zone and consequently leading to increased horizontal displacement in that region.
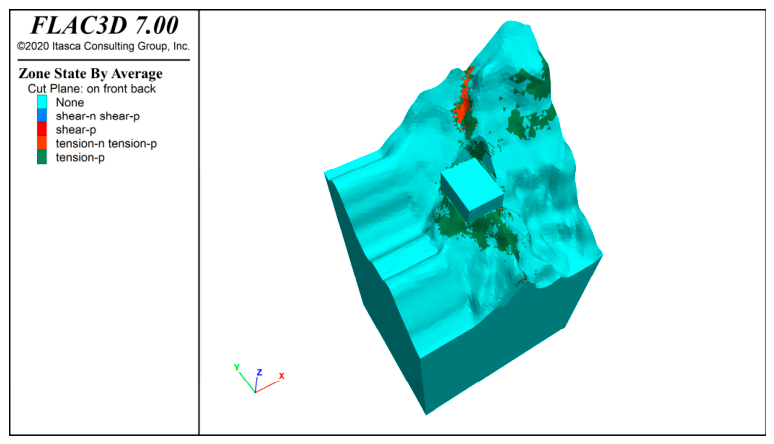
The distribution of the plastic zone in the slope following the application of the main cable load is presented in
Figure 10. As shown in the figure, the total volume of the plastic zone is reduced compared to the excavation condition, and its connectivity is markedly diminished. The extent of the plastic zone at the base and periphery of the anchorage is significantly reduced, with the majority of the shear plastic zones that were widely distributed under the excavation condition reverting to an elastic state. The plastic zone within the shallow surface layer of the slope exhibits a dispersed, point-like distribution, predominantly concentrated within the strongly weathered rock mass. A new shear plastic zone emerges at the toe of the frontal face of the anchorage, displaying a wedge-shaped distribution. The surcharge effect improves the stability of the basal region; however, the horizontal tensile force introduces a new risk of localized failure at the frontal zone. This is because the self-weight of the anchorage increases the confining pressure of the underlying rock mass; in accordance with the Mohr–Coulomb criterion, the increase in confining pressure directly enhances the shear strength, causing elements that were previously in a plastic state to revert to an elastic state. The persistence of the plastic zone within the shallow surface layer is attributable to the low strength of the strongly weathered rock mass and its pronounced susceptibility to excavation-induced disturbance. The newly developed shear plastic zone at the frontal zone of the anchorage is a consequence of localized stress concentration generated by the transmission of the horizontal tensile force from the main cable through the anchorage structure.
4.2.2. Effect of Anchorage Load Under Heavy Rainfall Conditions (Condition 3)
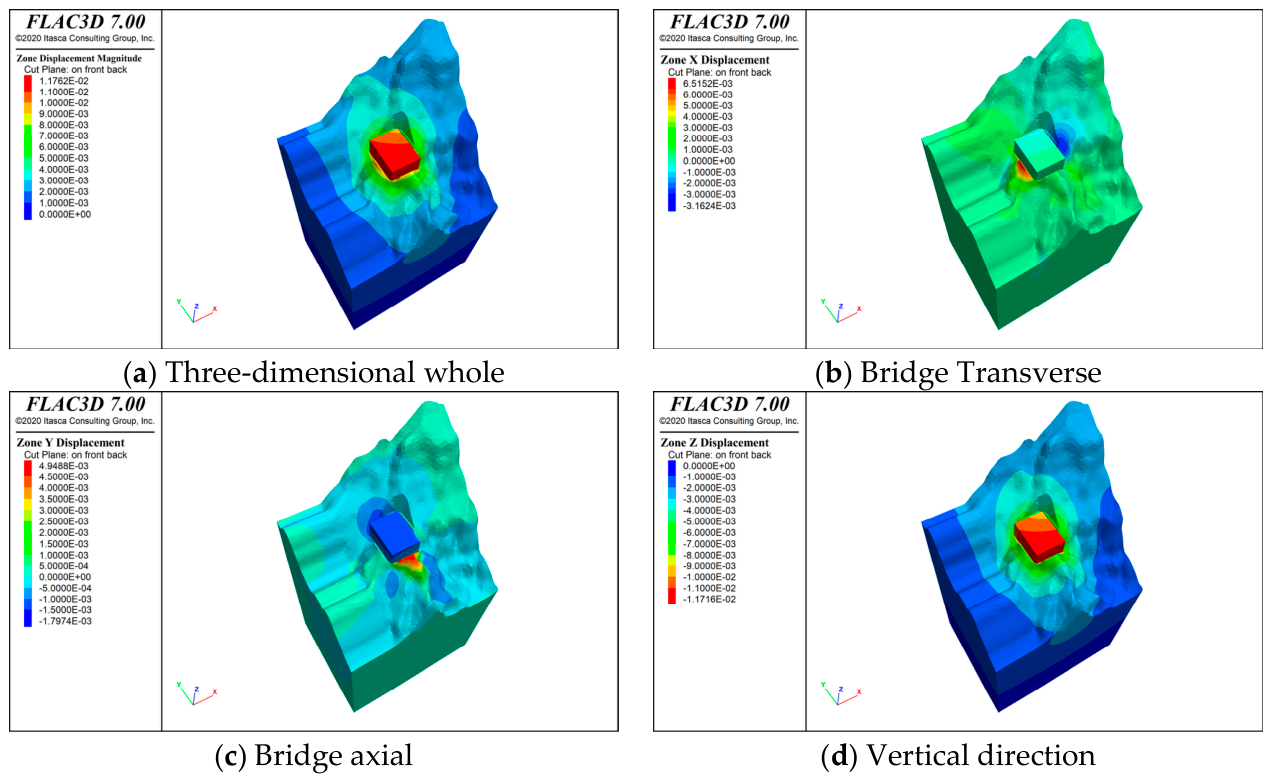
The displacement distribution of the slope under heavy rainfall conditions is presented in
Figure 11. As shown in the figure, the maximum slope displacement increases to 11.76 mm, representing an increase of 49.6% relative to the normal operating condition. The displacements in the X-, Y-, and Z-directions are 6.52 mm, 4.95 mm, and 11.72 mm, corresponding to increases of 64.6%, 52.8%, and 49.3%, respectively. The zone of influence of the displacement expands by approximately 20% to 30% compared to the normal operating condition, exhibiting an annular diffusion pattern centered on the anchorage structure. These results indicate that saturation of the rock mass significantly reduces slope stability, with deformation increasing markedly in all directions. This can be attributed to the following mechanisms: upon saturation, the strength parameters of the rock mass are substantially reduced, with cohesion and the coefficient of internal friction decreasing by 20–25% and 5–8%, respectively, leading to a degradation in shear resistance. The pore water pressure generated by the rise in groundwater level reduces the effective stress within the rock mass; in accordance with the principle of effective stress, the reduction in effective stress directly weakens the shear strength. Furthermore, seepage forces alter the internal stress distribution within the slope mass, generating locally unfavorable stress states that further exacerbate the deformation [
39].
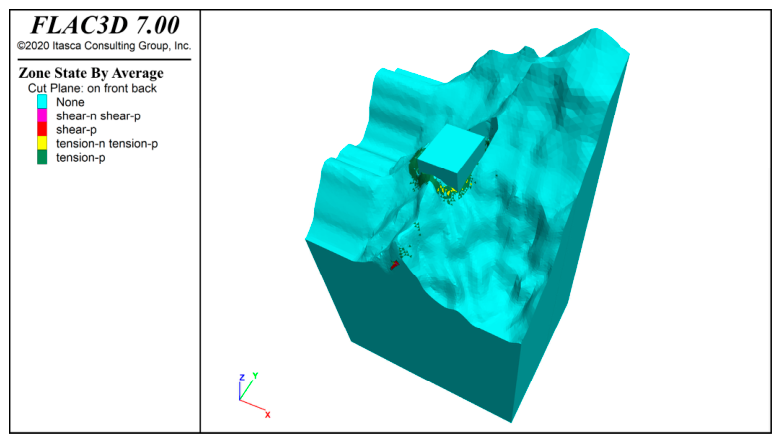
The distribution of the plastic zone in the slope under heavy rainfall conditions is presented in
Figure 12. As shown in the figure, both the total volume of the plastic zone and the depth of the shear plastic zone at the frontal zone of the anchorage are increased relative to the normal operating condition, with the wedge-shaped characteristics becoming more pronounced. The tensile failure zones and tensile–shear composite failure zones within the shallow surface layer of the slope increase markedly, exhibiting a banded distribution pattern along the contour lines, with partial regions of the plastic zone displaying a tendency toward connectivity. New shear–tensile composite failure zones emerge along the sidewalls and rear edge of the anchorage. These results indicate that rock mass saturation significantly reduces the factor of safety of the slope, leading to a pronounced expansion of the plastic failure zone. This is attributed to the reduction in strength parameters of the saturated rock mass, which causes a greater number of elements to reach yield conditions and consequently increases the volume of the plastic zone. The strongly weathered rock mass, characterized by well-developed porosity and high permeability, is preferentially affected by rainfall infiltration, resulting in a substantial reduction in strength upon saturation. Furthermore, pore water pressure within the shallow layer generates additional tensile stresses, promoting the development of tensile fractures. The increased depth of the shear plastic zone at the frontal zone of the anchorage is attributable to the downward propagation of the wedge-shaped failure zone driven by the reduction in rock mass strength. The newly developed failure zones along the sidewalls and rear edge are associated with the redistribution of the stress field induced by the coupled effects of seepage forces and gravitational forces.
It should be noted that, considering that in practical engineering the slope stability is typically evaluated under the most unfavorable conditions to ensure an adequate safety margin, this study adopts the most unfavorable bounding assumption for the heavy rainfall scenario, in which the rock mass parameters throughout the model are uniformly replaced with saturated-state parameters. According to the hydrogeological data from the geotechnical investigation, the north bank slope has poorly developed surface water systems, the shallow groundwater dynamics are seasonally controlled, with only a small amount of ephemeral springs appearing briefly after rainfall before quickly drying up, and the carbonate rock fracture-karst water exhibits weak water-bearing capacity with uneven spatial distribution. The aforementioned characteristics indicate that the likelihood of the rock mass reaching complete saturation under actual heavy rainfall conditions is low. The approach adopted in this study yields results that tend to be conservative, and the actual slope stability under rainfall conditions should be better than the analysis results presented herein.
4.2.3. Effect of Anchorage Load Under Seismic Conditions (Conditions 4 and 5)
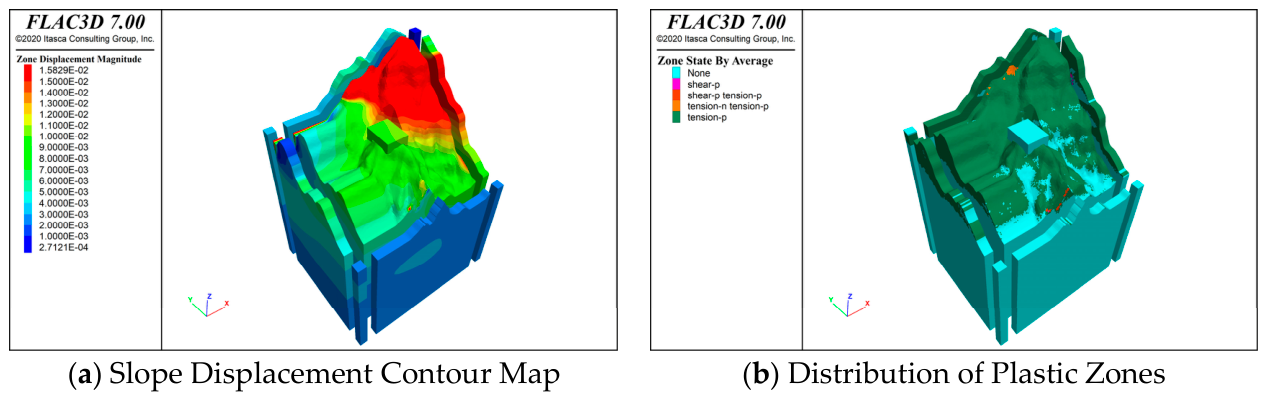
The displacement distribution and plastic zone development of the slope under the natural seismic wave excitation are presented in
Figure 13. As shown in the figure, the maximum slope displacement reaches 15.83 mm, representing an increase of 101.4% relative to the normal operating condition. The displacement exhibits a pronounced elevation amplification effect, with the maximum displacement occurring at the slope crest and relatively smaller displacements at the base. Tensile failure zones are extensively distributed within the shallow surface layer, forming continuous, coalesced patterns at the slope crest and the upper-to-middle portion of the slope, while a considerable number of shear plastic zones emerge at the foundation pit bench edges and within the strongly weathered rock mass. These results indicate that seismic dynamic loading significantly aggravates both slope deformation and plastic failure. This is attributed to the following mechanisms: during the upward propagation of seismic waves, the wave amplitude is progressively amplified due to the free surface effect and topographic amplification effect, with the acceleration response at the slope crest reaching 1.5 to 2.5 times that at the slope base [
40,
41]. The superposition of seismic dynamic tensile stresses and static tensile stresses exceeds the tensile strength of the rock mass, thereby inducing tensile failure within the shallow surface layer. The strongly weathered rock mass, characterized by low strength and high sensitivity to dynamic loading, is more prone to failure under seismic excitation.
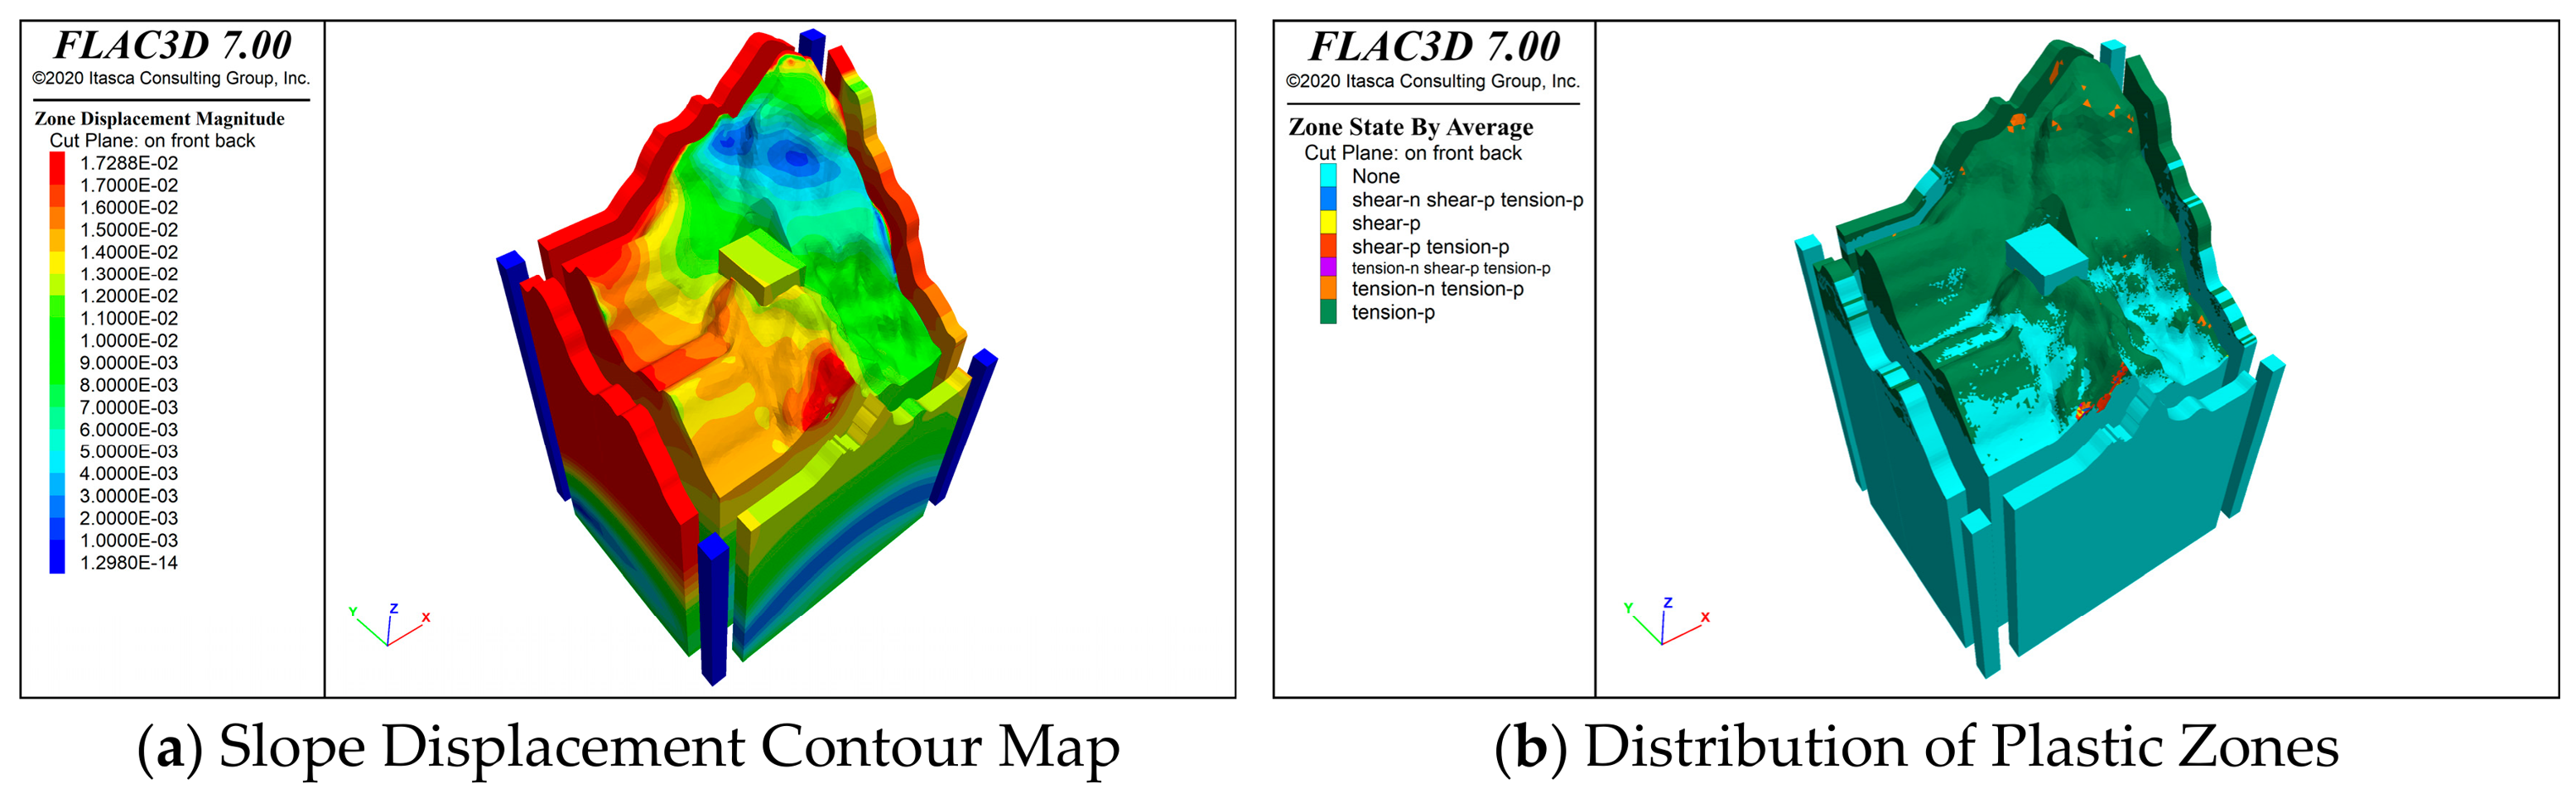
The displacement distribution and plastic zone development of the slope under the artificially synthesized seismic wave are presented in
Figure 14. As shown in the figure, the maximum slope displacement is 17.29 mm, representing an increase of 120.0% relative to the normal operating condition and slightly exceeding that of the natural seismic wave condition. The displacement distribution is more extensive, with a relatively large high-displacement zone also emerging in the middle portion of the slope. The tensile plastic zone within the shallow surface layer is larger in extent and exhibits stronger connectivity, with quasi-continuous plastic bands forming in certain regions. The number of shear plastic zones at the slope crest increases and their distribution becomes more concentrated. These results indicate that the dynamic response and degree of failure of the slope under the artificially synthesized seismic wave are slightly more severe than those under the natural seismic wave. This is attributed to the broader frequency content of the artificially synthesized wave, which is capable of exciting multiple vibration modes of the slope mass, thereby inducing a more widespread dynamic response. The intensified dynamic action exacerbates tensile failure within the shallow surface layer and enhances the connectivity of the plastic zone. A comparative analysis of the two seismic waves reveals that, despite differences in the input ground motion characteristics, the dynamic response patterns of the slope are essentially consistent: both cases exhibit displacement amplification with elevation and intensified shallow plastic failure, while the deep interior of the slope mass remains in an elastic state throughout. As can be observed from the plastic zone distribution plots, under both seismic wave inputs, the plastic zones develop exclusively within the shallow surface layer of the slope, predominantly in the form of tensile failure and combined shear–tension failure, while the deep rock mass remains entirely in the elastic state (None) with no plastic yielding elements.
4.3. Comprehensive Stability Evaluation and Factor of Safety Analysis
To systematically compare the differences in slope stability across various conditions, the maximum slope displacement, characteristics of plastic zone development, and the displacement change rate of each operational condition relative to the normal condition (Condition 2) were adopted as quantitative evaluation indices. The computed results for all five conditions were summarized and compared in two stages—the construction stage and the operational stage—as presented in
Table 3. During the construction stage, the maximum slope displacement under the excavation condition was 13.13 mm, with plastic zones exhibiting a discontinuous and dispersed distribution, indicating overall slope stability. During the operational stage, taking the normal condition as the reference baseline, the slope stability exhibited distinctly differentiated evolutionary patterns under various extreme conditions. Upon application of the main cable load, the surcharge effect of the anchorage dead weight significantly suppressed slope deformation, reducing the maximum displacement to 7.86 mm with a notable contraction in plastic zone volume, representing the most favorable stability state during the operational stage. Under the heavy rainfall condition, the degradation of rock mass strength parameters combined with elevated pore water pressure resulted in a 49.6% increase in maximum displacement relative to the normal condition, along with a marked expansion of the plastic zone and an emerging interconnection tendency, indicating a substantially reduced safety reserve. Under the seismic condition, the dynamic amplification effect further intensified slope deformation and plastic failure; the maximum displacements under the natural wave and artificial wave conditions increased by 101.4% and 120.0%, respectively, compared to the normal condition. Notably, under the artificial wave condition, the shallow plastic zone exhibited a quasi-continuous band-like distribution, representing the most unfavorable scenario among all conditions examined and thus constituting the governing condition for slope stability design.
To quantitatively evaluate the margin of safety against failure, shear strength reduction (SSR) analyses were performed using FLAC3D for the critical loading conditions. In this method, the cohesion c and friction angle φ of the rock mass are simultaneously reduced by a common factor until the computation no longer converges, at which point the reduction factor corresponds to the factor of safety (FOS). For the heavy rainfall condition (Condition 3), the SSR analysis was performed directly, yielding a factor of safety of FOS = 2.4. For the seismic condition (Condition 5), a “dynamic time-history analysis followed by post-earthquake SSR” approach was adopted: the complete dynamic time–history analysis was first performed, retaining the post-seismic stress state and accumulated plastic deformation; the boundary conditions were then restored to static conditions and the model was solved to static equilibrium; finally, the SSR analysis was conducted on this basis, yielding a factor of safety of FOS = 2.27. This approach accounts for the influence of cumulative seismic damage on the post-earthquake slope stability. The factors of safety for all critical loading conditions satisfy the requirements of the Technical Code for Building Slope Engineering (GB 50330-2013) (≥1.20 for non-normal condition I, ≥1.10 for non-normal condition II), demonstrating that the slope possesses an adequate safety margin under extreme loading conditions.