Article

Influence of Ultrasonic Impact Treatment on the Aging of S355 Welded T-Joints

Laboratoire de Structures Métalliques et à Câbles (SMC), Département Matériaux et Structures (MAST), Université Gustave Eiffel, 44344 Bouguenais, France
*
Author to whom correspondence should be addressed.
Appl. Sci. 2026, 16(10), 4723; https://doi.org/10.3390/app16104723
Submission received: 13 April 2026 / Revised: 30 April 2026 / Accepted: 6 May 2026 / Published: 9 May 2026

Abstract

Ultrasonic impact treatment (UIT) is widely employed as a post-weld treatment to enhance the fatigue performance of welded joints through the introduction of surface plastic deformation and compressive residual stresses. While its beneficial effect on fatigue life when applied at an earlier stage is well established, the influence of UIT on aged structures remains controversial in the literature. This study investigates the effect of UIT on the corrosion performance of S355 steel welded T-joints after accelerated corrosion-induced aging. As-welded (AW) and UIT-treated T-joints were subjected to salt spray exposure, followed by detailed microstructural and surface analyses to assess corrosion morphology and damage evolution. The results show that UIT induces significant surface plastic deformation and microstructural refinement in the weld toe region without promoting preferential corrosion aging or accelerated degradation. The aging behavior of UIT-treated joints, following accelerated environmental exposure, is comparable to that of the AW condition, with corrosion rates decreasing from 3.27 and 3.28 mm/year at 42 days to 1.32 and 1.26 mm/year at 126 days for AW and UIT specimens, respectively. These results indicate that the compressive residual stresses and surface modifications introduced by UIT do not adversely affect material durability. These findings clarify the role of UIT under such exposure conditions and demonstrate that UIT can be applied as a post-weld treatment to improve fatigue properties without compromising the long-term performance of structural steel welded joints.

1. Introduction

Welded joints, particularly T-joints, are essential structural components in steel constructions for civil engineering and offshore fields. However, the presence of high tensile residual stresses generated in the weld bead and the surrounding heat-affected and base material zones during welding can compromise the structural integrity of these elements, particularly under cyclic loading conditions. Such stresses are a major factor governing the fatigue performance of structures. Welding-induced residual stresses have therefore been the subject of extensive investigations over the past decades, owing to their dominant role in fatigue crack initiation and early crack propagation [1,2,3]. These studies have primarily focused on enhancing the fatigue life of welded joints using different post-weld mechanical surface treatment methods. These surface techniques are generally applied at the weld toe area, which represents the most susceptible zone for fatigue crack initiation due to geometric discontinuities and stress concentration effects. Crack initiation is primarily driven by welding-induced residual stresses and local geometric stress concentrations. Subsequent crack propagation through the material thickness further intensifies the local stress field, ultimately leading to final fracture.
Post-weld treatments therefore aim to modify the local stress state and surface condition by smoothing surface defects and introducing beneficial compressive residual stresses that counteract tensile ones, thereby improving fatigue performance [4]. Several techniques of surface strengthening have been investigated in the literature. According to [5], the ultrasonic peening (UP) process significantly reduced tensile residual stresses by 50% at the weld toe, thereby enhancing the fatigue life by 40–70% depending on the applied loading. Daavari and Vanini [6] demonstrated that the fatigue life of butt welds can be improved by up to 99.4% through UIT on weld toes due to the introduction of compressive residual stresses. As reported in [7], TIG dressing, burr grinding, and hammer peening have been shown to effectively increase the fatigue resistance of welded joints. In fact, burr grinding and UUIT alone improved fatigue strength by 20% and 35%, respectively, while their combination yielded a 61% improvement. Among these methods, ultrasonic impact treatment (UIT) has attracted considerable attention due to its favorable combination of convenience, efficiency, and affordability [8]. Numerous other studies have shown a significant enhancement in fatigue life of mechanically treated welded joints [9,10,11,12,13,14,15,16,17,18].
Despite these advances in understanding fatigue behavior, the effects of post-weld mechanical treatments on corrosion mechanisms have not yet been systematically investigated [2,3,4]. Most of the available investigations showed a beneficial effect of such treatments on corrosion resistance, which is commonly attributed to the introduction of compressive residual stresses and surface modification. For instance, Fereidooni et al. [5] reported that ultrasonic peening (UP) increased the life of 316 SS-welded joints by 25–75%, depending on the applied loading, after fatigue-corrosion tests. He et al. [19] demonstrated that HFMI-treated welded joints exhibit reduced corrosion rates by 22.67% to 56.54% depending on the treatment duration, due to the conversion of tensile stresses into compressive stresses and grain refinement within the plastically induced deformed layer of up to 300 µm depth. Knysh et al. [20] further reported a 3-fold increase in the fatigue life of HFMI-treated joints of low-alloy steel exposed to neutral salt spray fog. Gu et al. [21,22] demonstrated that UIT surface treatment of both hot-rolled S355 steel and S355 welded joints refines grain, reducing the average grain size from 18.65 µm to 5.84 µm, resulting in decreased corrosion pits depth and therefore improved corrosion resistance.
Metallic structures are subjected to two main aging mechanisms: fatigue and environmentally driven degradation, the latter being predominant in structures exposed to aggressive service conditions. While post-weld mechanical treatments are known to enhance fatigue performance, their influence on aging behavior under accelerated environmental exposure remains insufficiently understood. In particular, it is still unclear whether such treatments have a beneficial or detrimental effect when applied to pre-aged specimens and how the aging response of treated joints compares to that of as-welded (AW) ones under identical conditions. The present paper aims to investigate the effect of UIT on the corrosion behavior of S355 structural steel welded T-joints under accelerated environmental exposure. The evolution of UIT-induced surface modifications over exposure time is assessed to provide a better understanding of the long-term effectiveness of UIT in corrosive environments. Section 1 of this paper describes the experimental procedure adopted in this study, while Section 2 presents and discusses the main findings.

2. Materials and Methods

2.1. Materials

Non-alloyed structural steel, S355J2 + N, was used to produce the test specimens, as it is representative of welded infrastructures exposed to aggressive environments, where the durability of surface treatments is essential. Welding was performed using an EWM FIREP Picomig pulse power source with a G3Si1 metal wire that had a diameter of 1.2 mm (NF EN 13479 standard [23]). The chemical composition of the base material and filler metal, as provided, are presented in Table 1.

2.2. Specimens and Processes

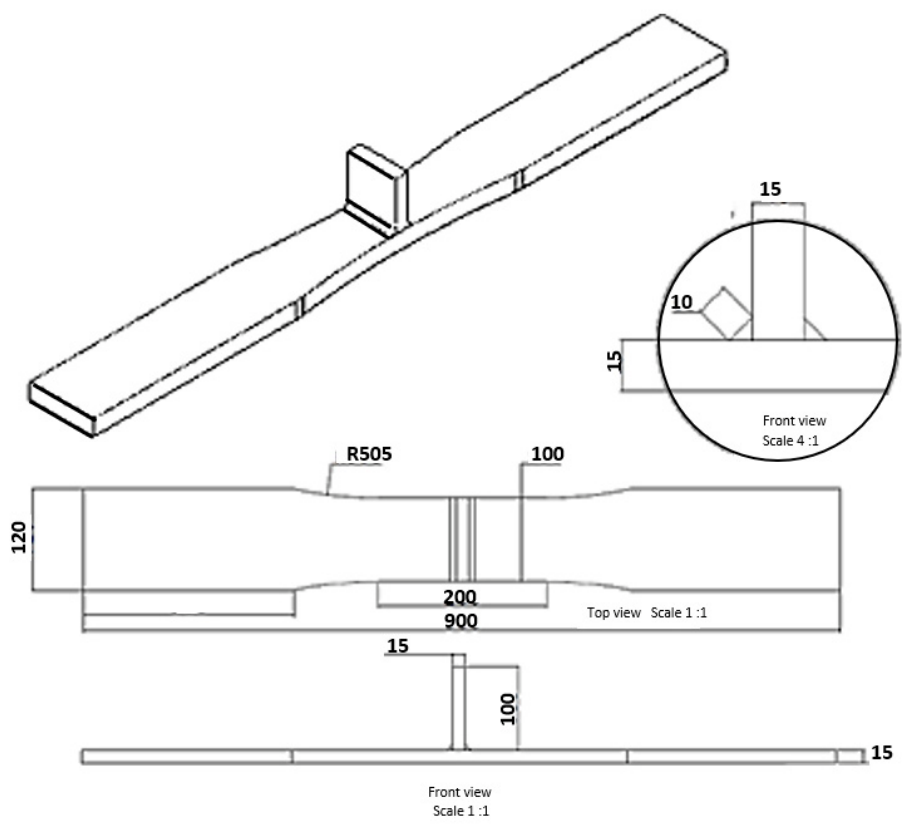
Figure 1 illustrates the geometry of the welded T-joints investigated in this study. Plates with dimensions of 900 mm × 120 mm were prepared from a 15 mm thick hot-rolled sheet [24]. The joints were then fabricated using the manual metal active gas (MAG) welding method, following the parameters summarized in Table 2.
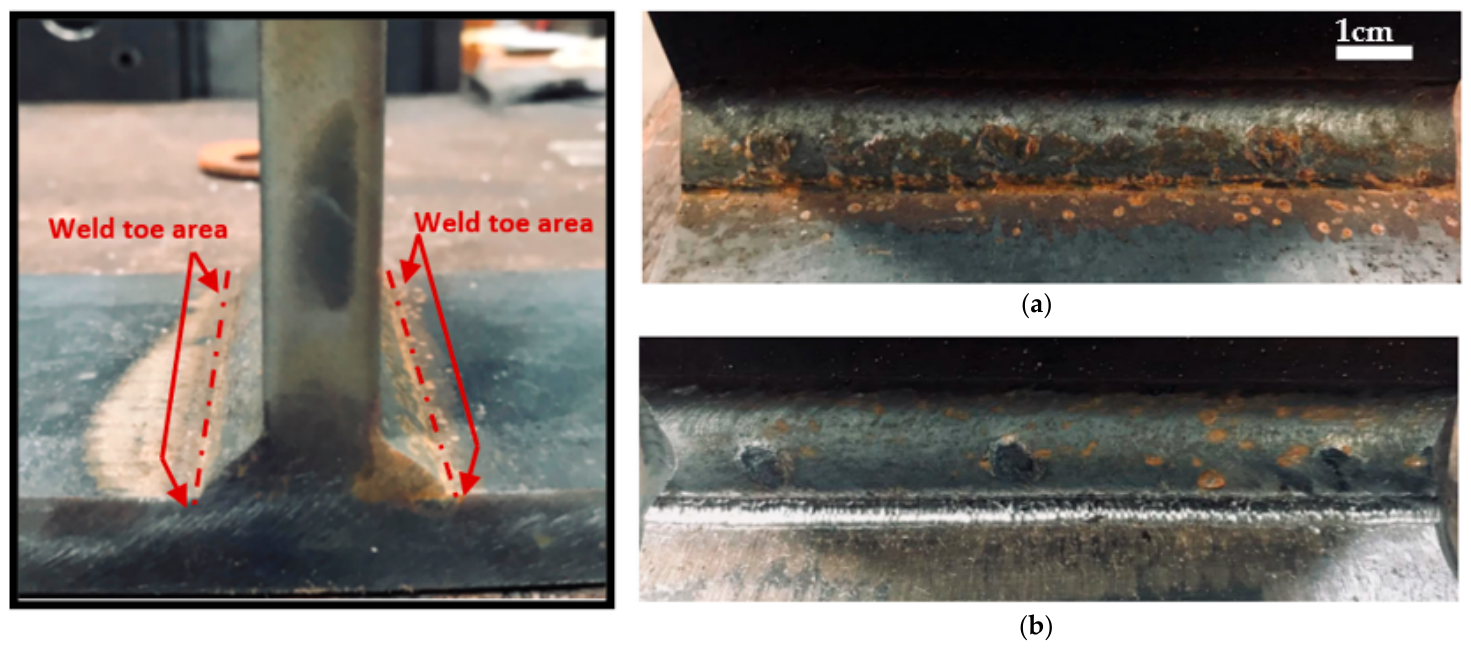
In this study, tests were performed on both AW and UIT-treated samples (Figure 2a,b). The UIT of welded joints was performed using the NOMAD HFMI/UIT system by SONATS (Nantes, France). The treatment consists of striking the weld toe area with a 3 mm diameter indenter at a vibration frequency of 20,000 ± 400 Hz, an oscillation amplitude of 60 μm, and a peening speed of 1 mm/s. These parameters were selected in accordance with the recommendations of the International Institute of Welding (IIW) and based on the practical experience of SONATS to ensure optimal surface coverage and treatment efficiency. This cold mechanical treatment increases the weld toe radius surface and induces compressive residual stresses.

2.3. Aging Process

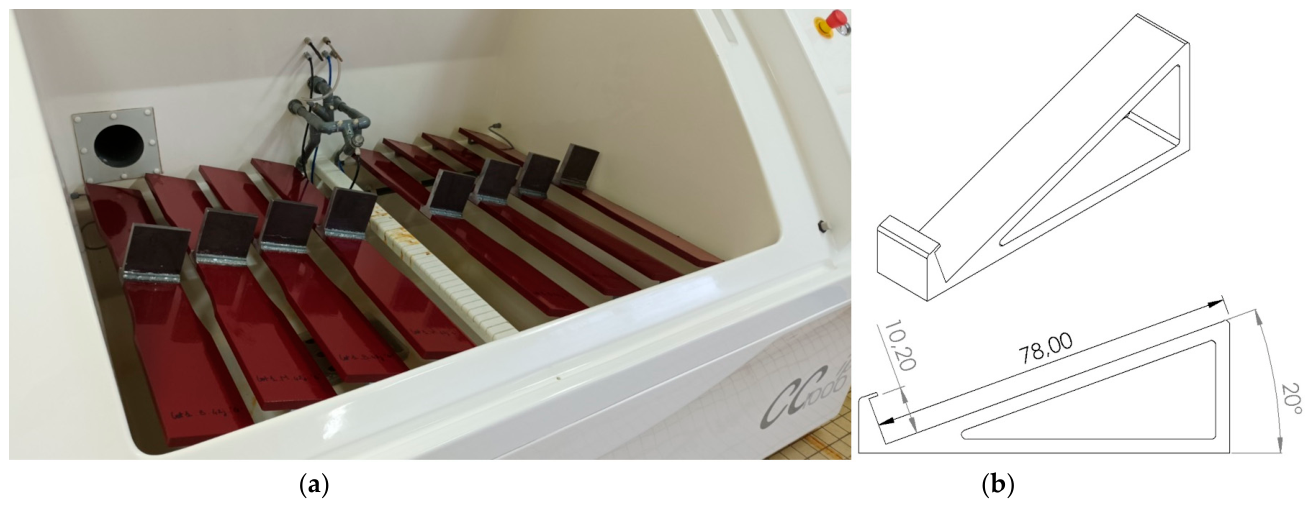
In this study, accelerated aging was induced through cyclic salt spray exposure, chosen as the representative environmental aging condition. The tests were carried out on welded assembly samples in an ASCOTT CCT cyclic chamber (Ascott Analytical, Tamworth, UK), in accordance with procedures derived from the ISO 9227 and ISO 16701 standards [25,26]. To prevent any corrosion occurrence outside the designated study area, all sample surfaces were coated with an anti-corrosion paint. The welded joints were mounted in the salt spray chamber on slightly inclined (20°) 3D-printed ABS supports, ensuring a 20 mm spacing between specimens to prevent salt solution from dripping from one specimen to another, as shown in Figure 3. Both AW and UIT-treated specimens were exposed in three batches for durations of 1008 h (42 days), 2016 h (84 days) and 3024 h (126 days).
Accelerated aging tests were conducted under controlled environmental conditions, featuring humidity cycling and periodic NaCl solution spraying (50 ± 5 g/L) to stimulate a highly aggressive corrosive environment. A full cycle repeats every 84 h to maximize the corrosion impact.
Other parameters remain constant during the accelerated corrosion test. These values, chosen according to the adopted standards, are presented in Table 3.
After aging tests, the specimens were carefully cleaned to eliminate the corrosion products according to the ISO 8407 standard for the determination of mass loss and corrosion rate [27].
For metallographic analysis of the welded joints, the central portions of the samples, including both weld toes, were sectioned from the corresponding sets and examined using an Inverted Reichert-Jung Microscope (IM) and a Hitachi SU5000 Scanning Electron Microscope (SEM).
The composition of the rust layer was investigated using a Horiba Scientific LabRAM HR Evolution Raman spectrometer (HORIBA FRANCE SAS, Vénissieux, France). The system was equipped with an Olympus BX41 microscope (Olympus Corporation, Tokyo, Japan) and a 532 nm green laser. Spectra were acquired over a spectral range of 100–1800 cm−1 with an acquisition time of 60 s to ensure optimal signal resolution.

3. Findings and Discussion

3.1. Visual and Microscopic Observations

3.1.1. Visual Inspections

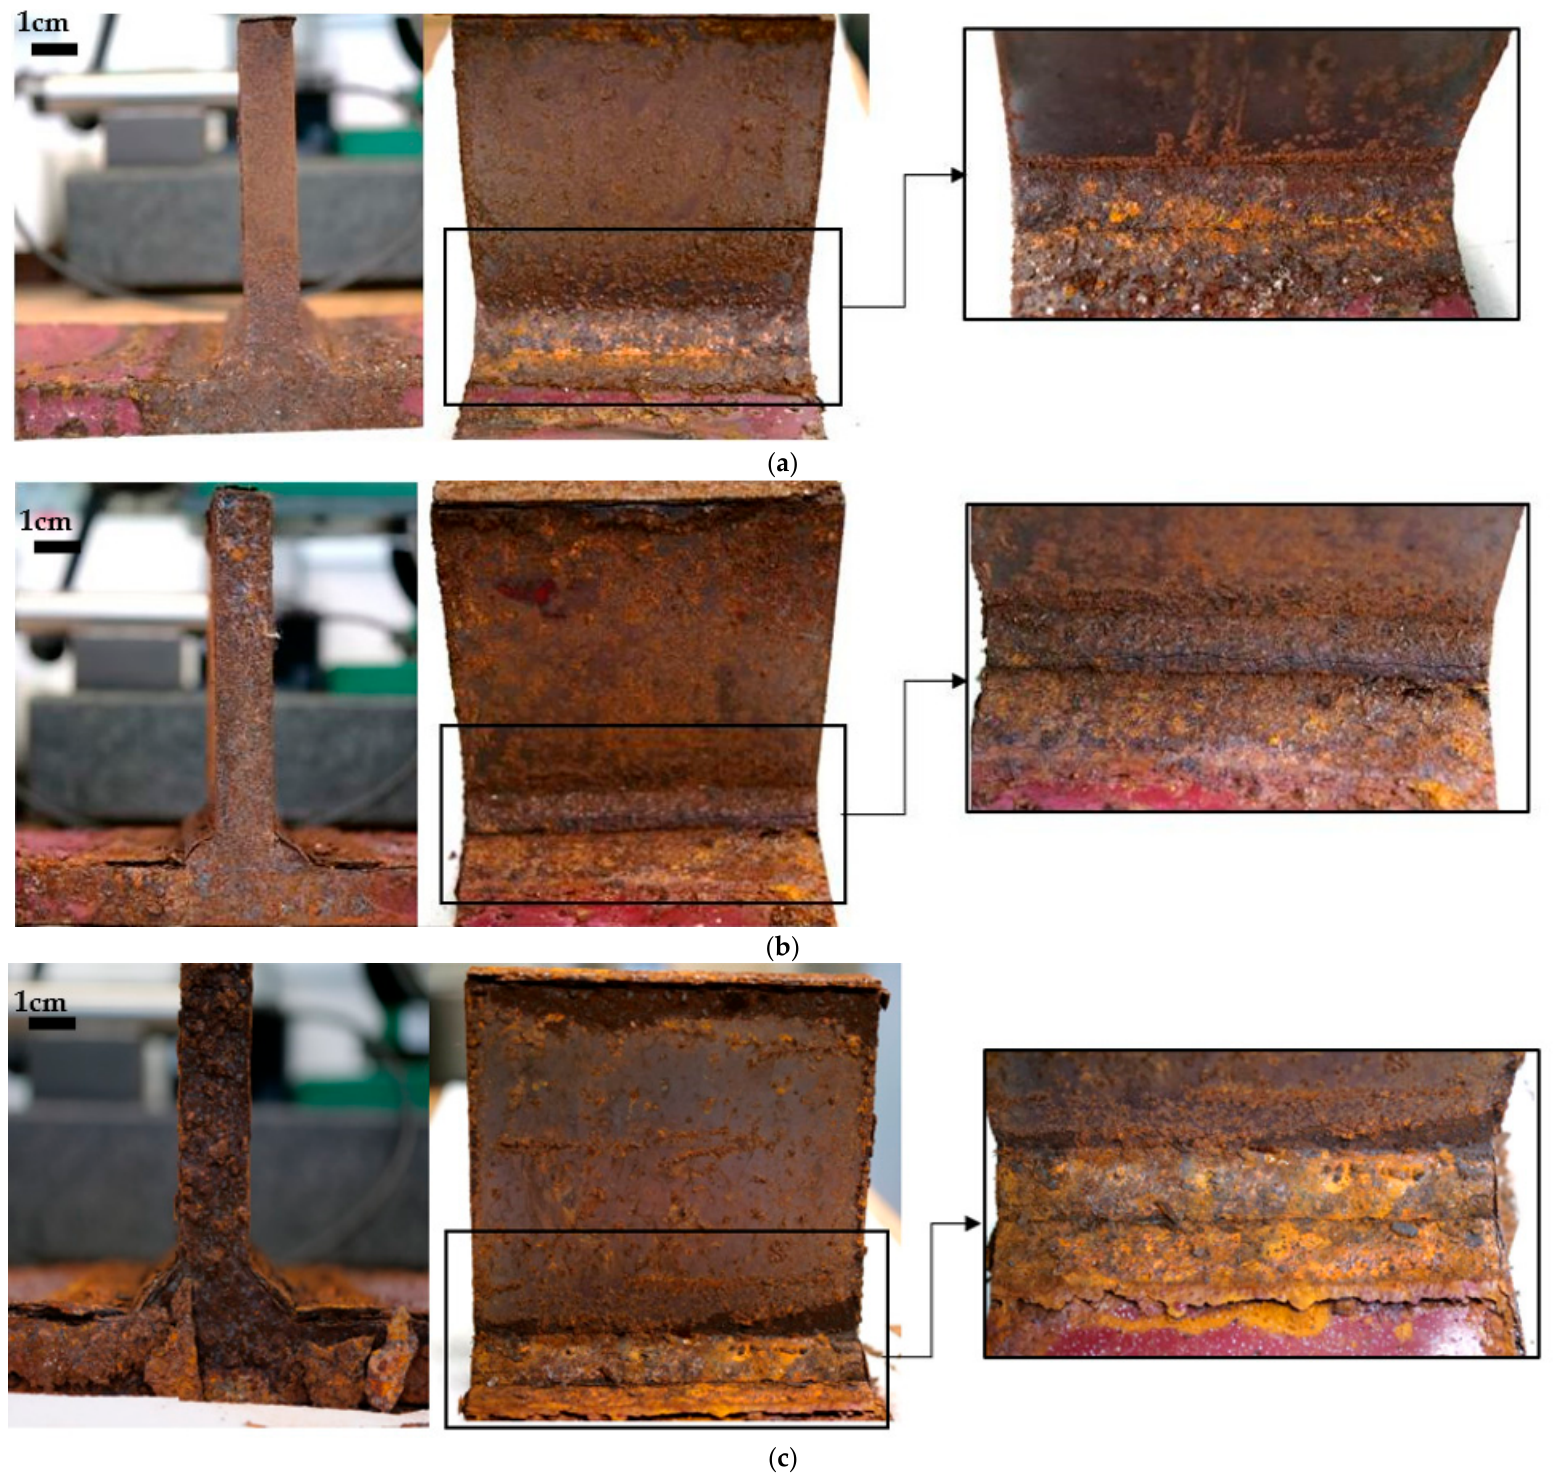
Figure 4 illustrates images of test specimens after salt spray exposure at different time periods, focusing on the AW corroded specimens, given their similarity to the UIT corroded specimens. Both AW and UIT surface specimens underwent similar alterations caused by the random deposition of corrosion products across the surfaces of welded joints. Their densities increased with the exposition time. After 42 days of corrosion (Figure 4a), the test samples show initial signs of degradation, with rust uniformly present on the top surface of the welded joints. By 84 days of salt spray exposure (Figure 4b), visible swelling indicates the stacking of corrosion products under the metal surface layers. Simultaneously, initial flaking occurs as cracks start forming in the protective oxide layer due to the expansion of corrosion products. By 126 days (Figure 4c), the corrosion progresses further. The swelling becomes more pronounced, and the protective oxide layer deteriorates, resulting in a discontinuous surface where parts of the rust layer have peeled off, exposing fresh metal below. The detachment of these rusted areas highlights significant structural weakening caused by a continuous aging process.
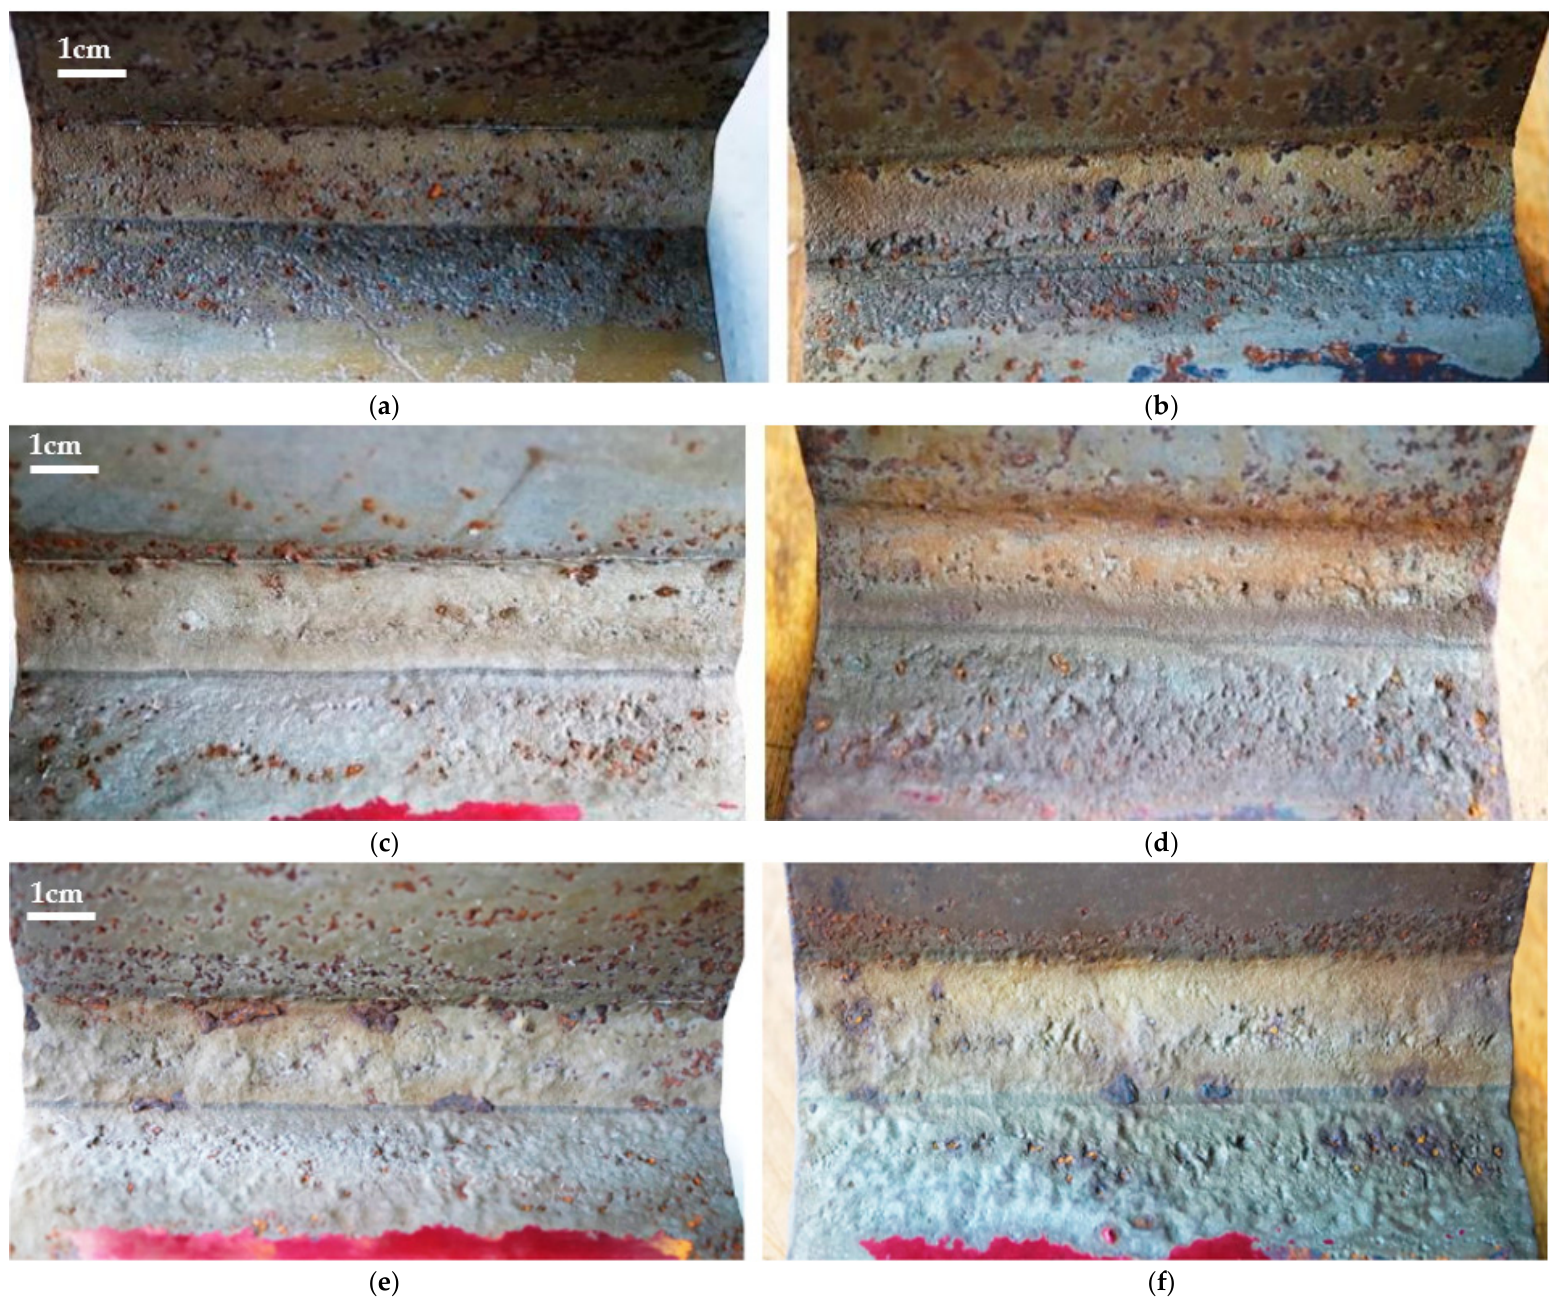
Upon chemical removal of the corrosion products, as illustrated in Figure 5, dimensional reductions were found compared to the non-corroded samples, revealing several surface pits that were particularly pronounced after 126 days of continuous exposure. The disappearance of hammer marks due to UIT can be observed after 84 days of corrosion (Figure 5d). This is mainly due to the gradual loss of material from the metal surface caused by corrosion, which smooths out surface irregularities and erases the UIT marks over exposure time. Microscopical observations provide further details on the corrosion-related changes to the surface.

3.1.2. Microscopical Observations

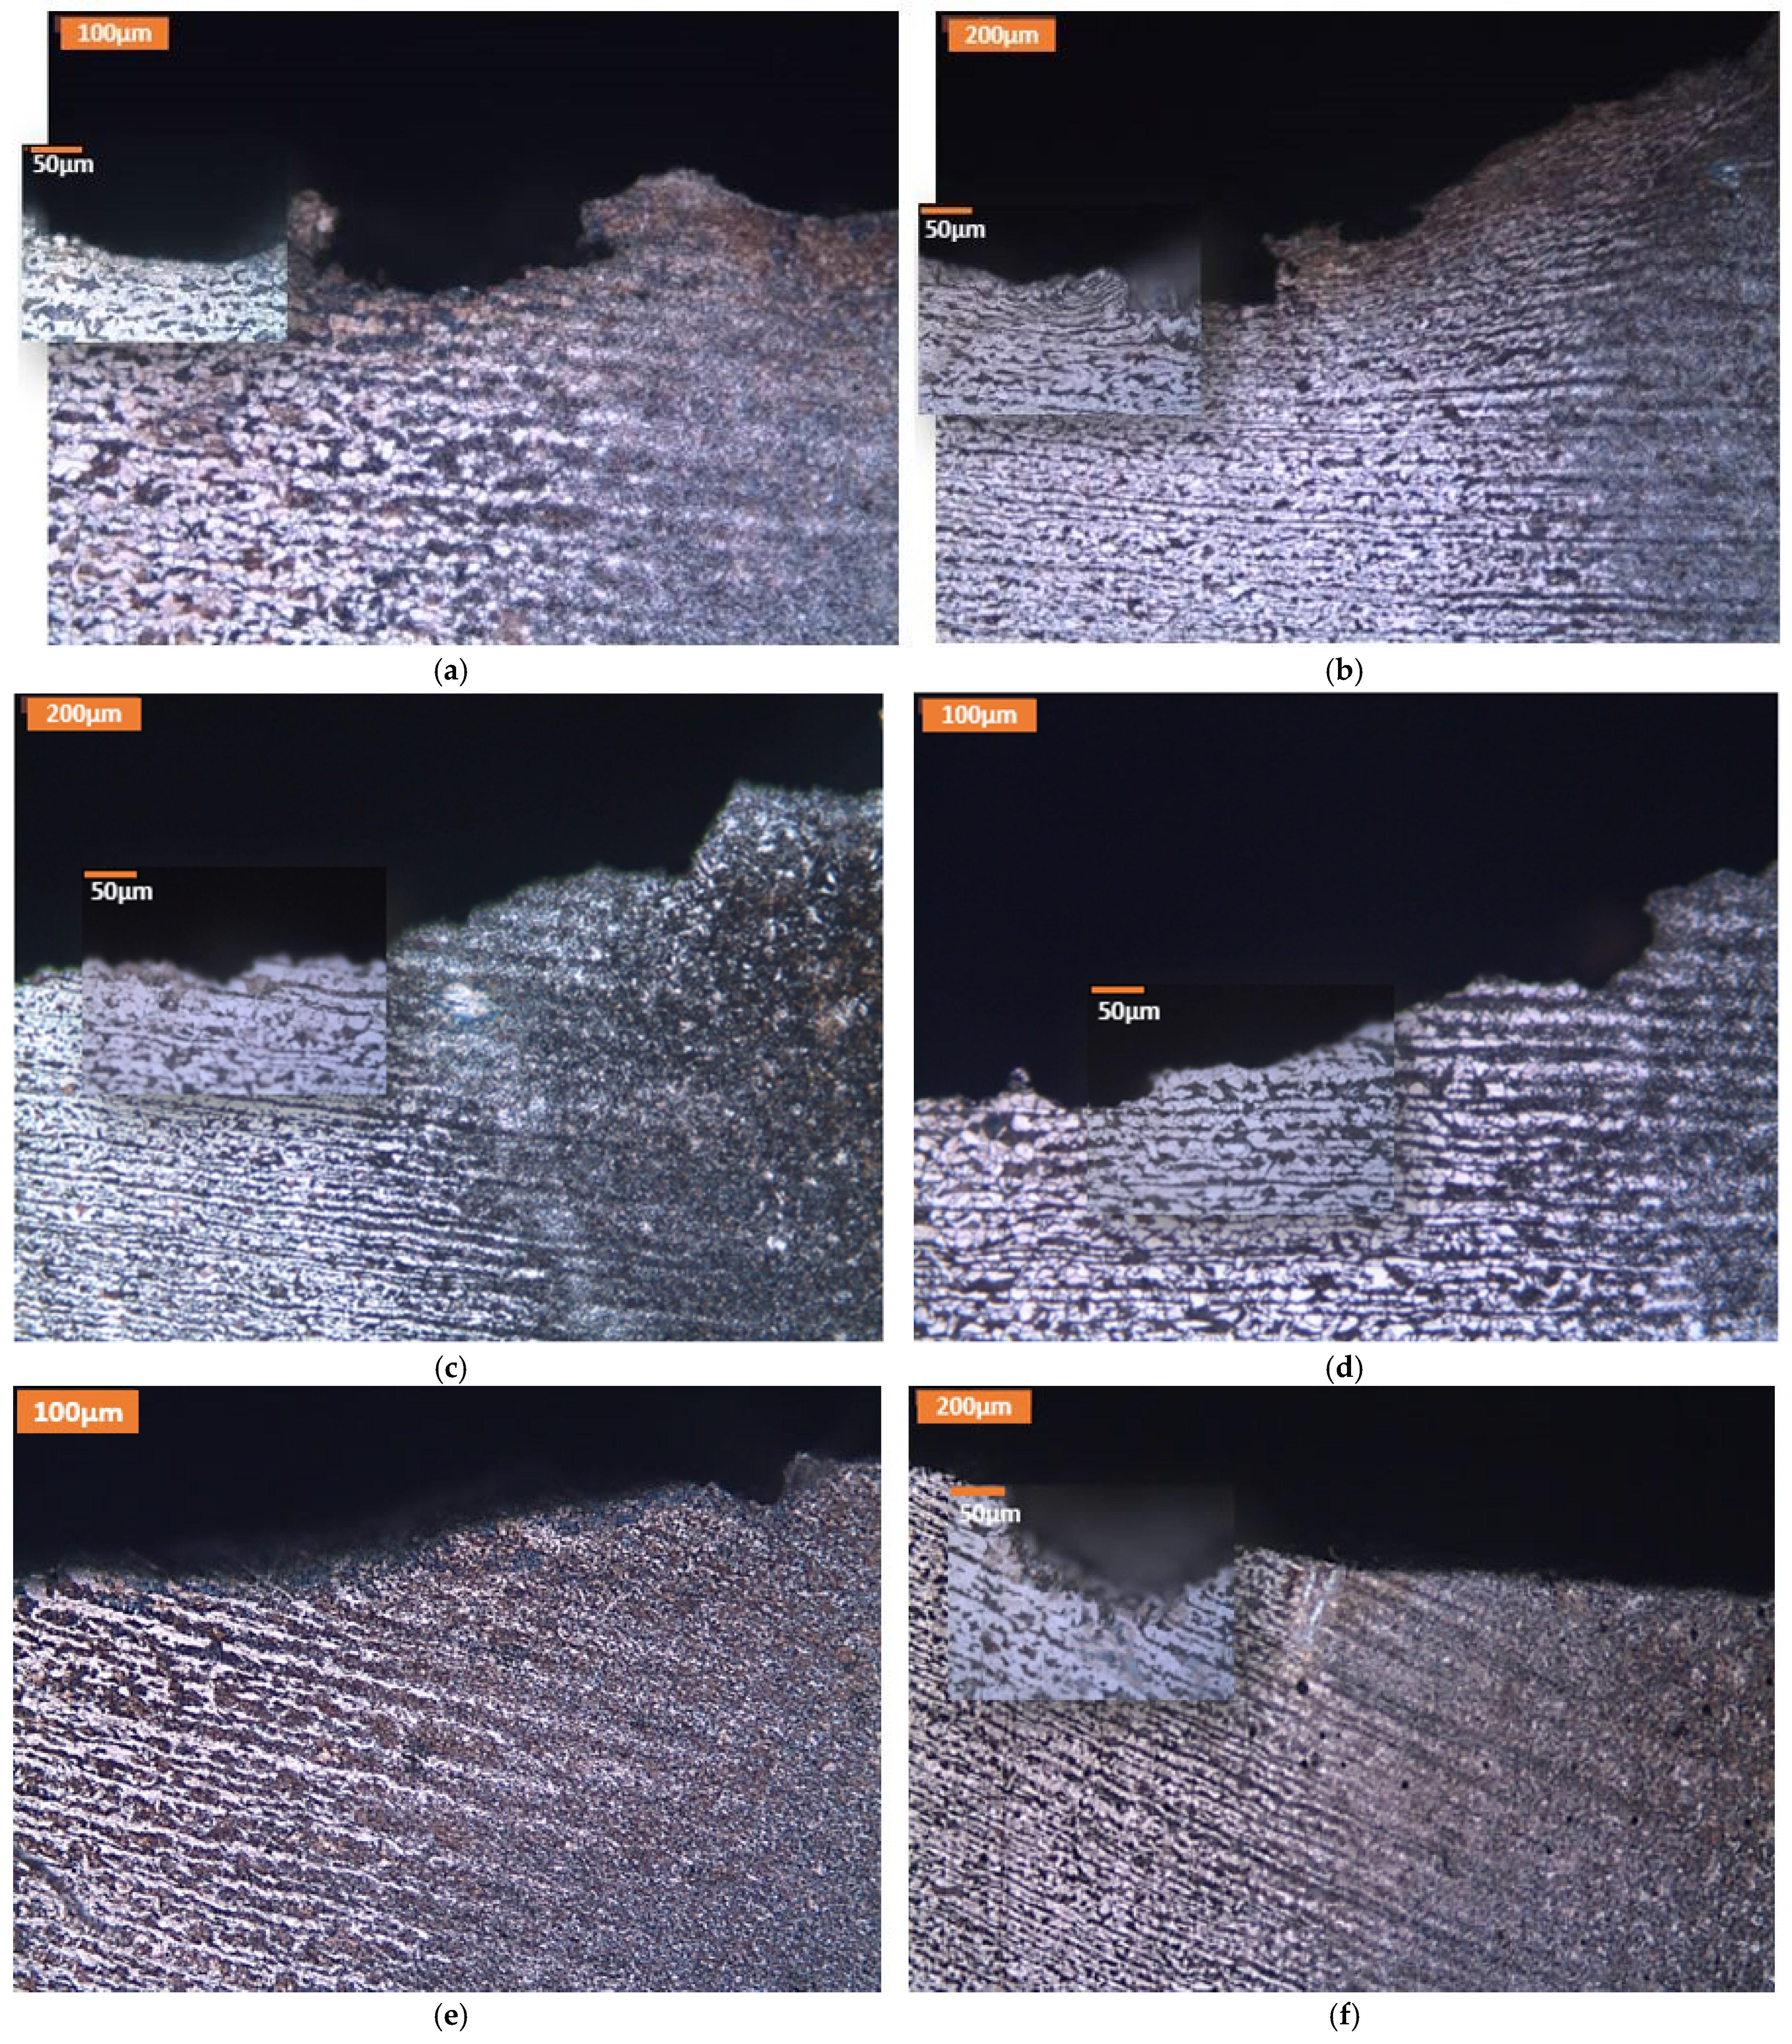
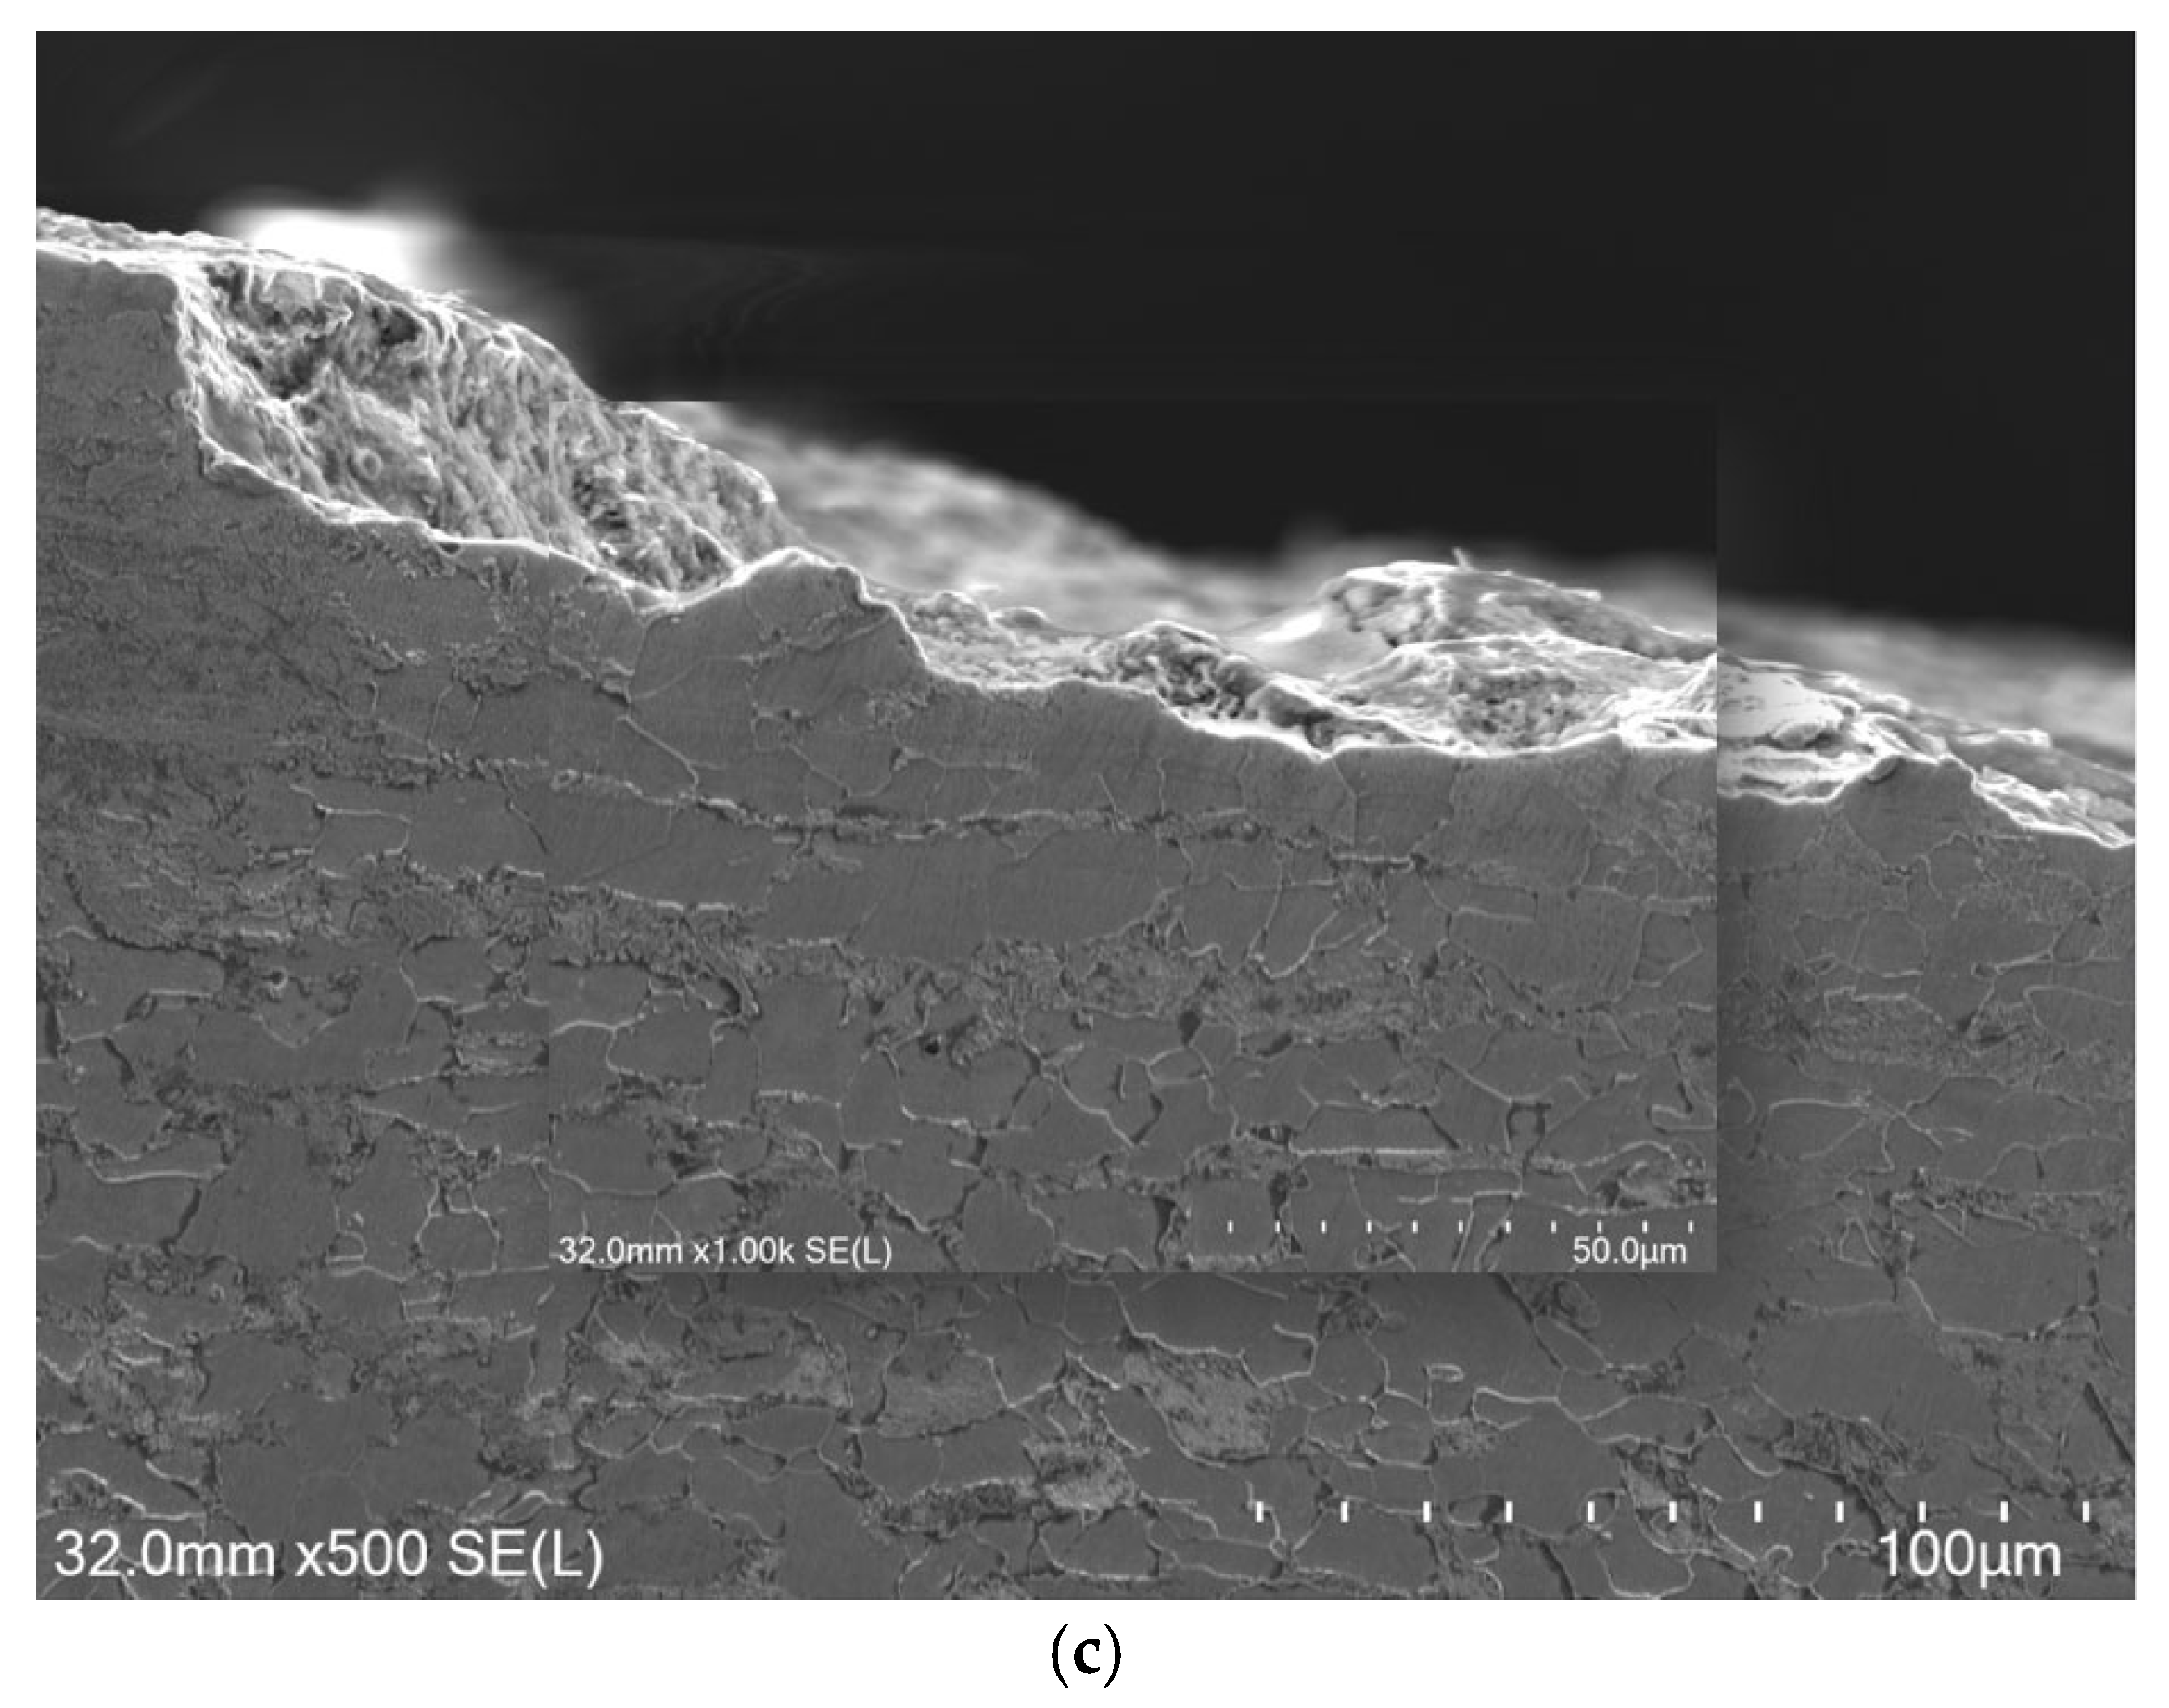
Cross-sectional microstructural analysis was performed on both AW and UIT corroded samples. Figure 6 presents IM observations of the cross-sectional microstructure at the weld toe in the near surface region for all specimens. The observation results showed that after 42 days of exposure, remnants of the UIT-processed surface layer were still present at the weld toe area (Figure 6b). However, the deformed layer was entirely absent after 84 and 126 days of salt spray exposure (Figure 6d,f).
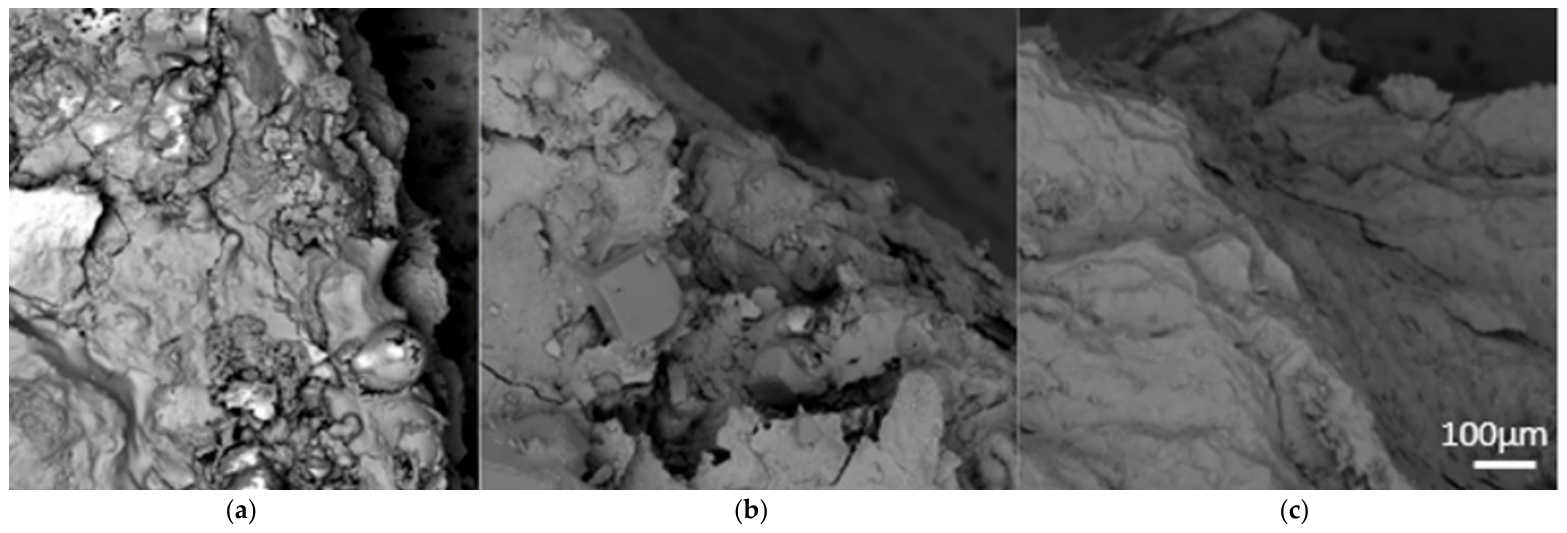
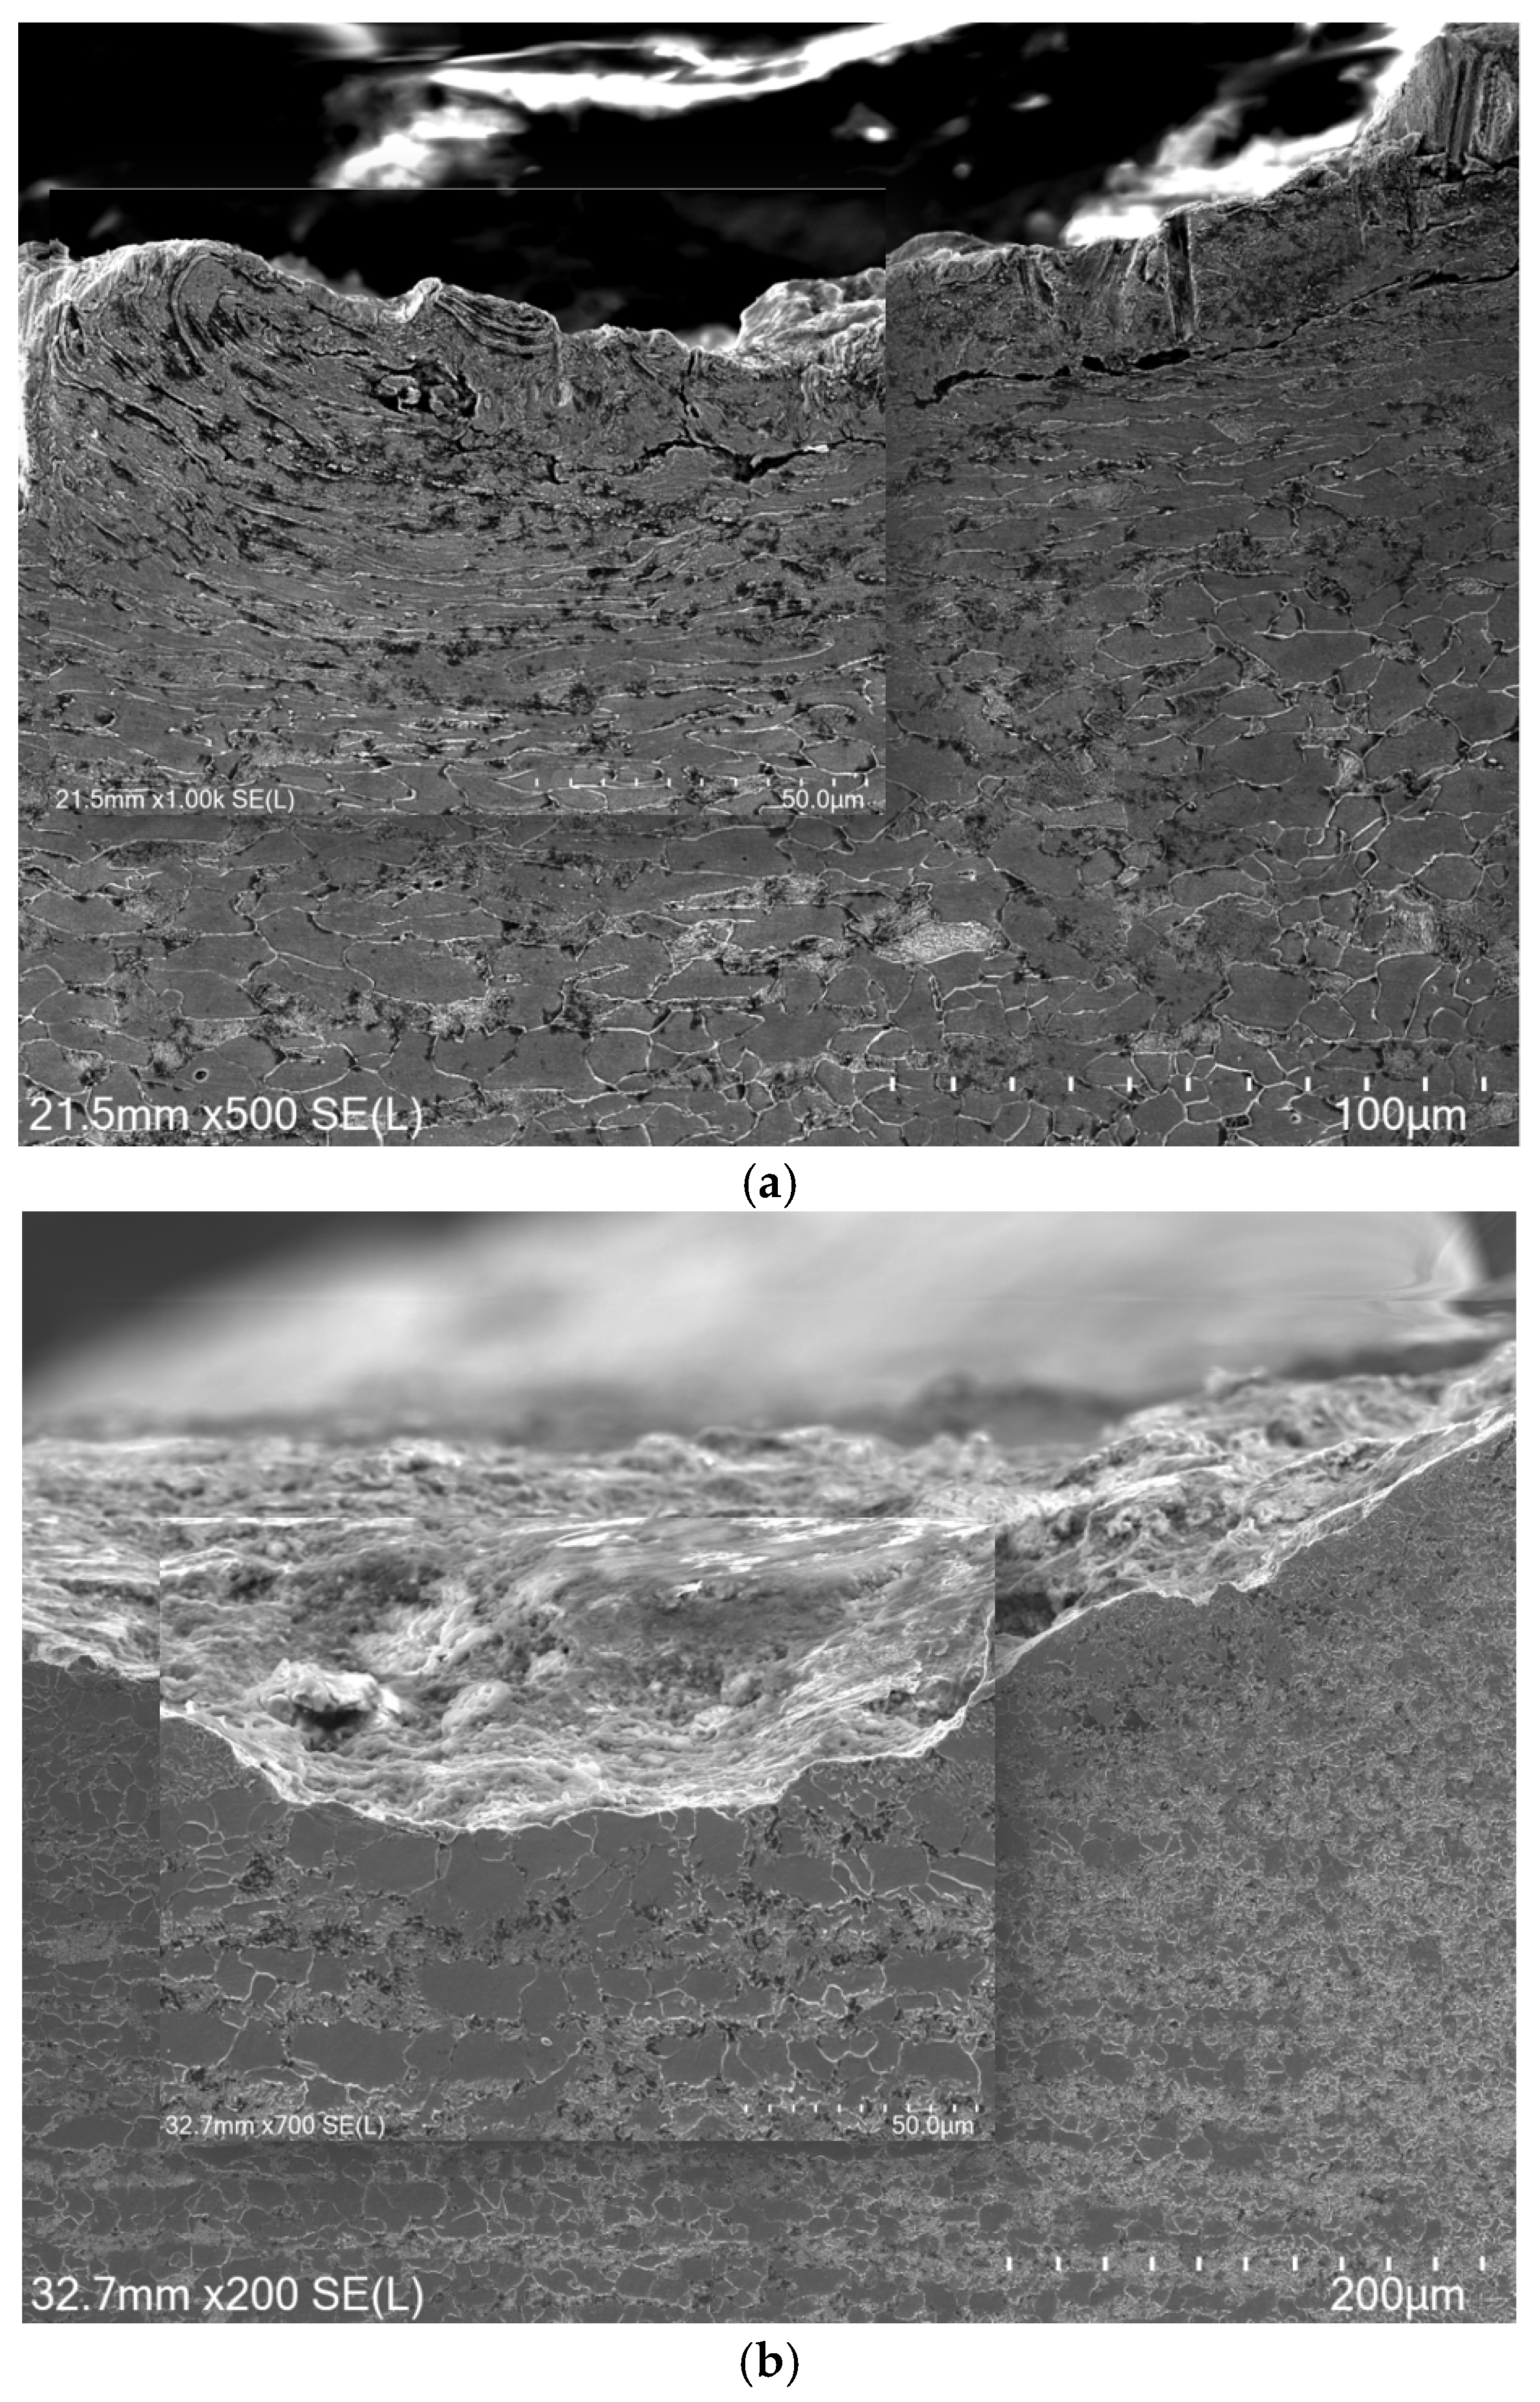
To further investigate this evolution at a higher resolution, a detailed SEM examination of the UIT-treated specimens was conducted (Figure 7). The obtained micrographs corroborate and refine the IM observations, revealing the persistence of the modified layer in localized areas at 42 days of exposure. In fact, a distinct layer of severely flattened and elongated grains, extending approximately 60 µm in depth, remained clearly visible, confirming that the UIT-induced changes were still partially preserved at this stage. However, the total absence of the entire UIT-treated thickness at 84 and 126 days provides definitive evidence that the corrosion process progressively consumes the entire plastically deformed layer introduced by UIT. This gradual consumption of the UIT-treated layer suggests that corrosion attacks the mechanically modified region. As this layer is removed, the underlying base microstructure is reached, resulting in a microstructure comparable to that of the AW specimens.
Such results agreed with results reported by Knysh et al. [20], who showed that residuals of the HFMI-processed layer remained on localized areas after 50 days of salt spray exposure. However, no plastically deformed layer was identified after 100 days of exposure.
  • Morphology and composition of rust:
Understanding the rust composition is essential for predicting corrosion in steel structures, especially in marine atmospheres. A detailed analysis of the specific rust phases provides valuable information on the corrosion mechanisms, which are influenced by factors such as chloride ion concentration. Such insights enable the development of targeted protective measures to prevent the formation of particularly aggressive rust forms, thereby ensuring the structural integrity and longevity of steel assets.
The rust film of both AW and UIT-treated specimens appears to be composed of two distinct layers at all exposure times (42, 84 and 126 days). The outer layer displays an orange to brown color, while the inner layer is more homogeneous, with a gray to black color. The film seemed to be more compact and thicker over exposure time (Figure 8). For UIT-treated specimens, the average thickness increased from approximately 1.33 ± 0.11 mm at 42 days to 3.70 ± 0.08 mm after 126 days. Similarly, the AW specimens showed an increase from 1.36 ± 0.17 mm to 3.76 ± 0.06 mm over the same period of salt exposure. This convergence indicates that UIT has no significant long-term influence on the overall growth kinetics of corrosion products. This can be attributed to the total consumption of the mechanically modified surface layer by the corrosion process, after which the corrosion behavior of the S355 steel becomes identical for all specimens.
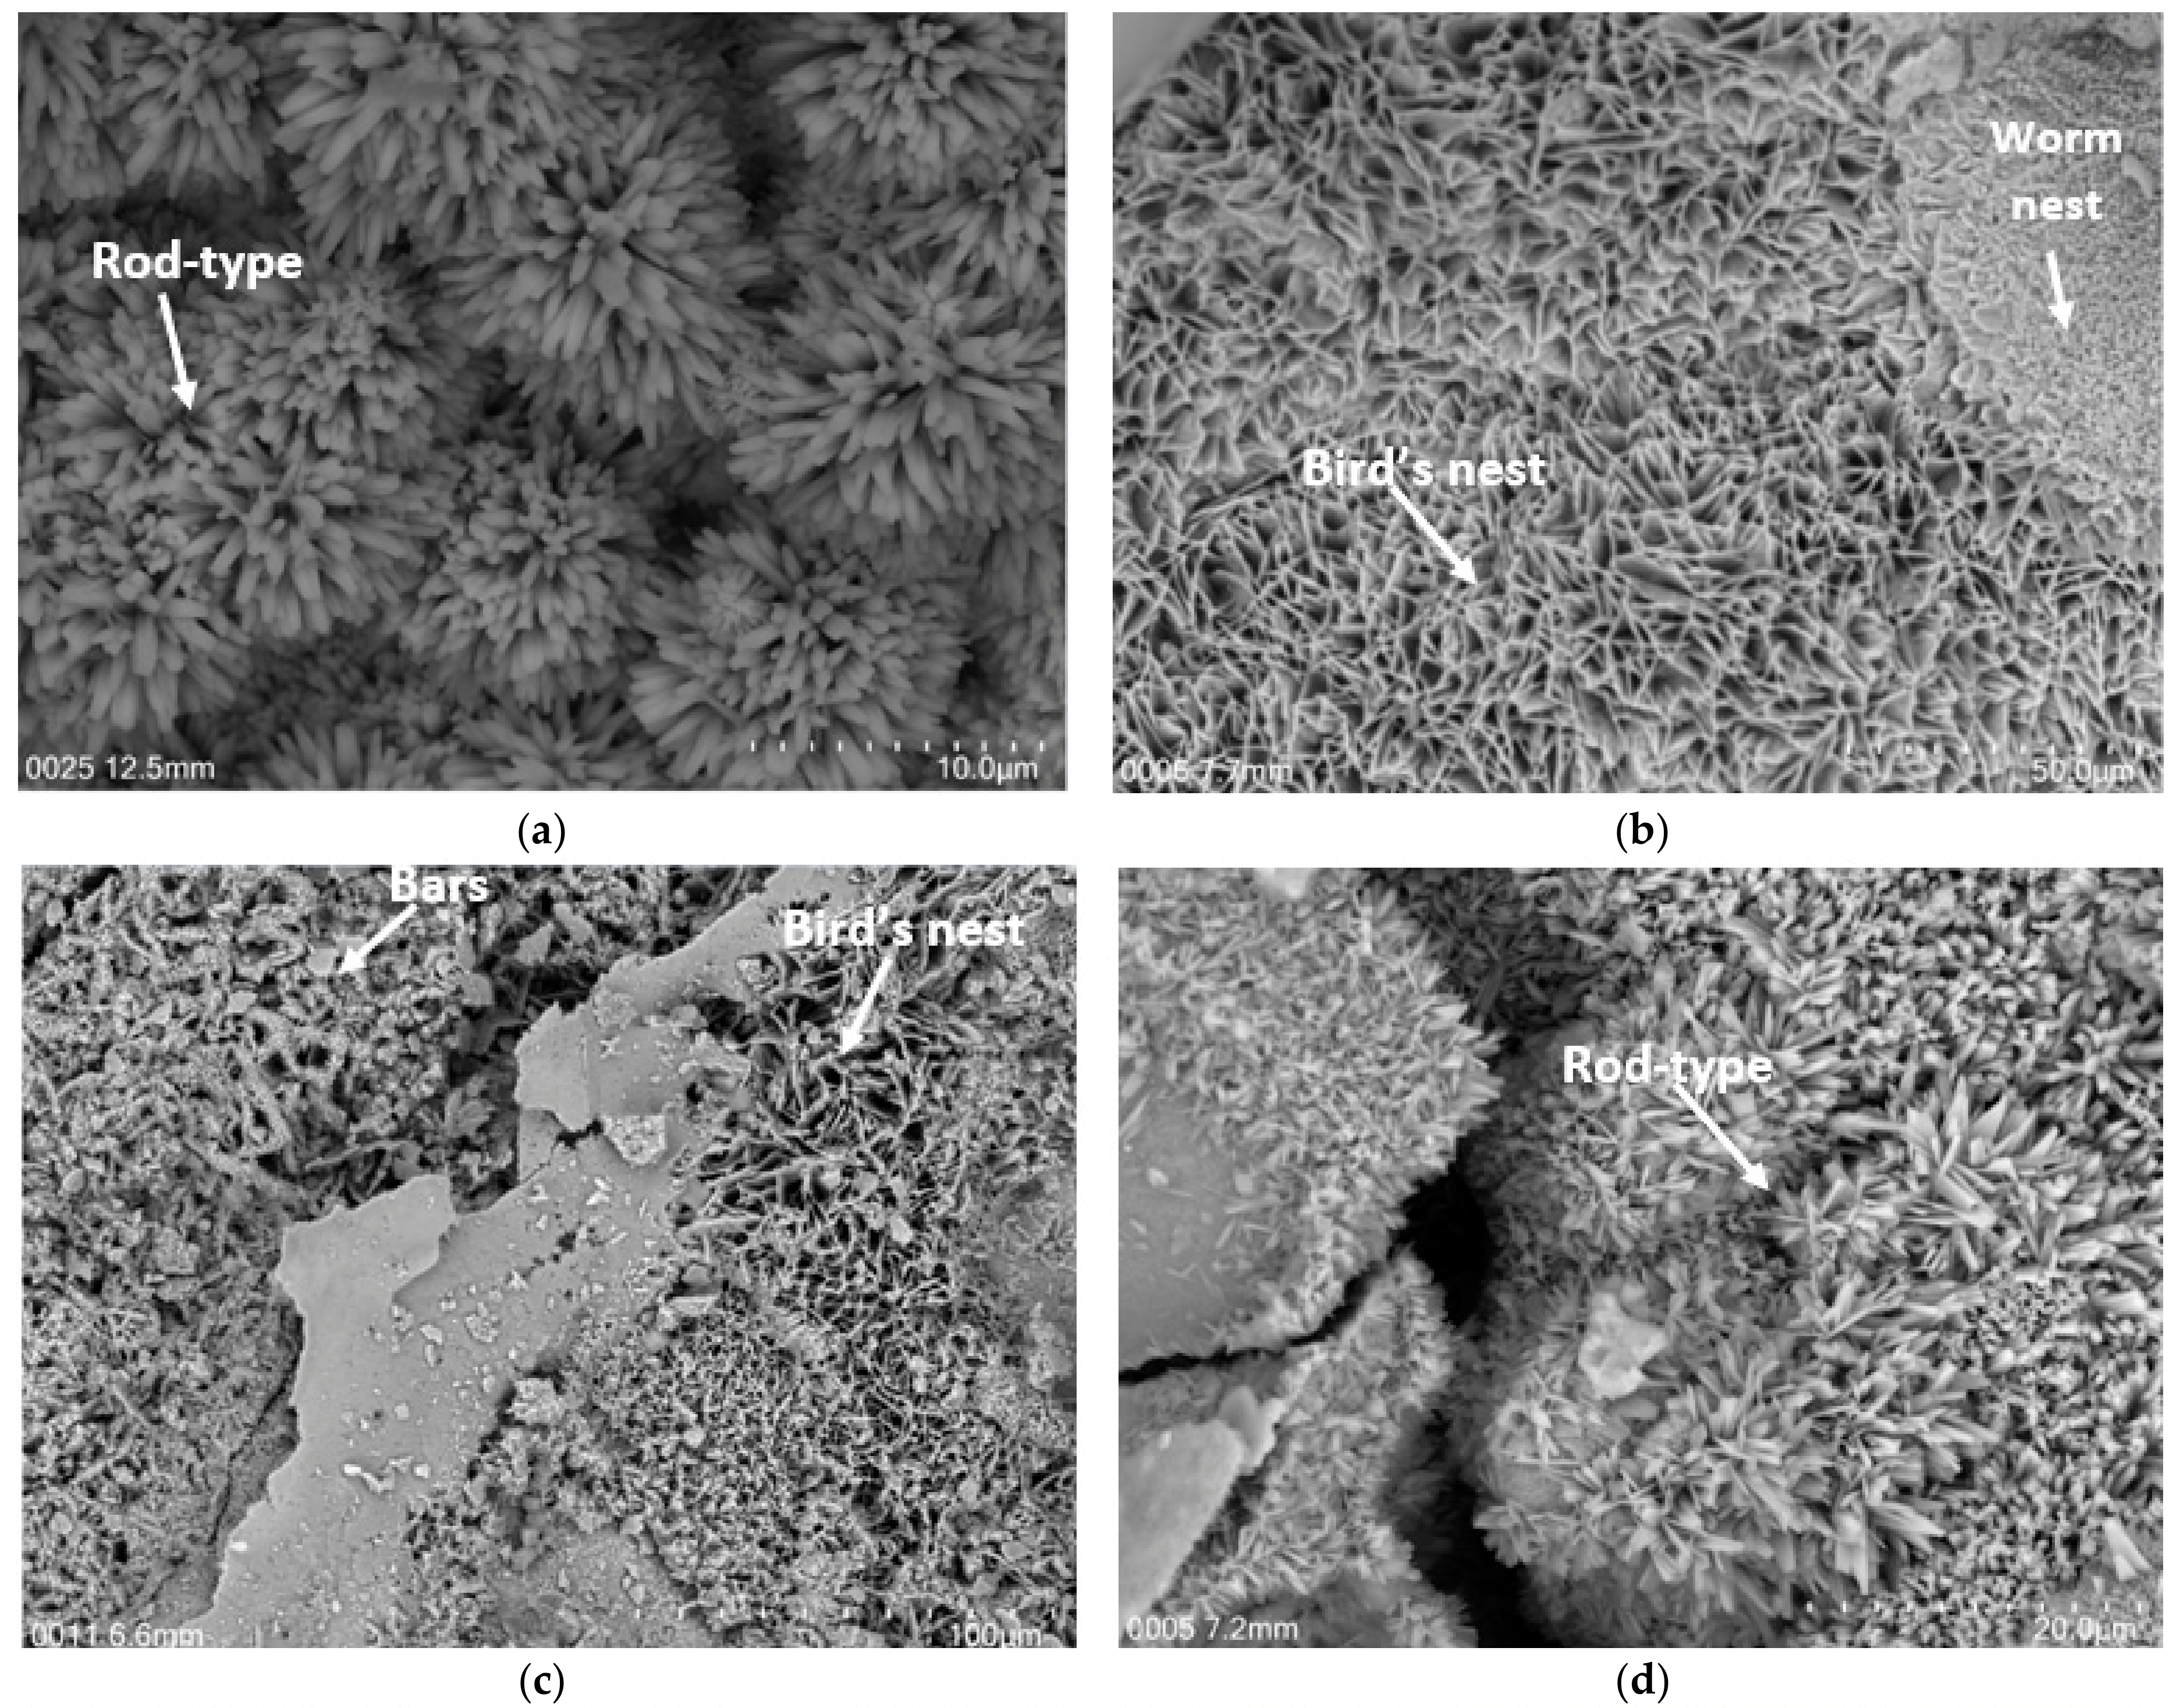
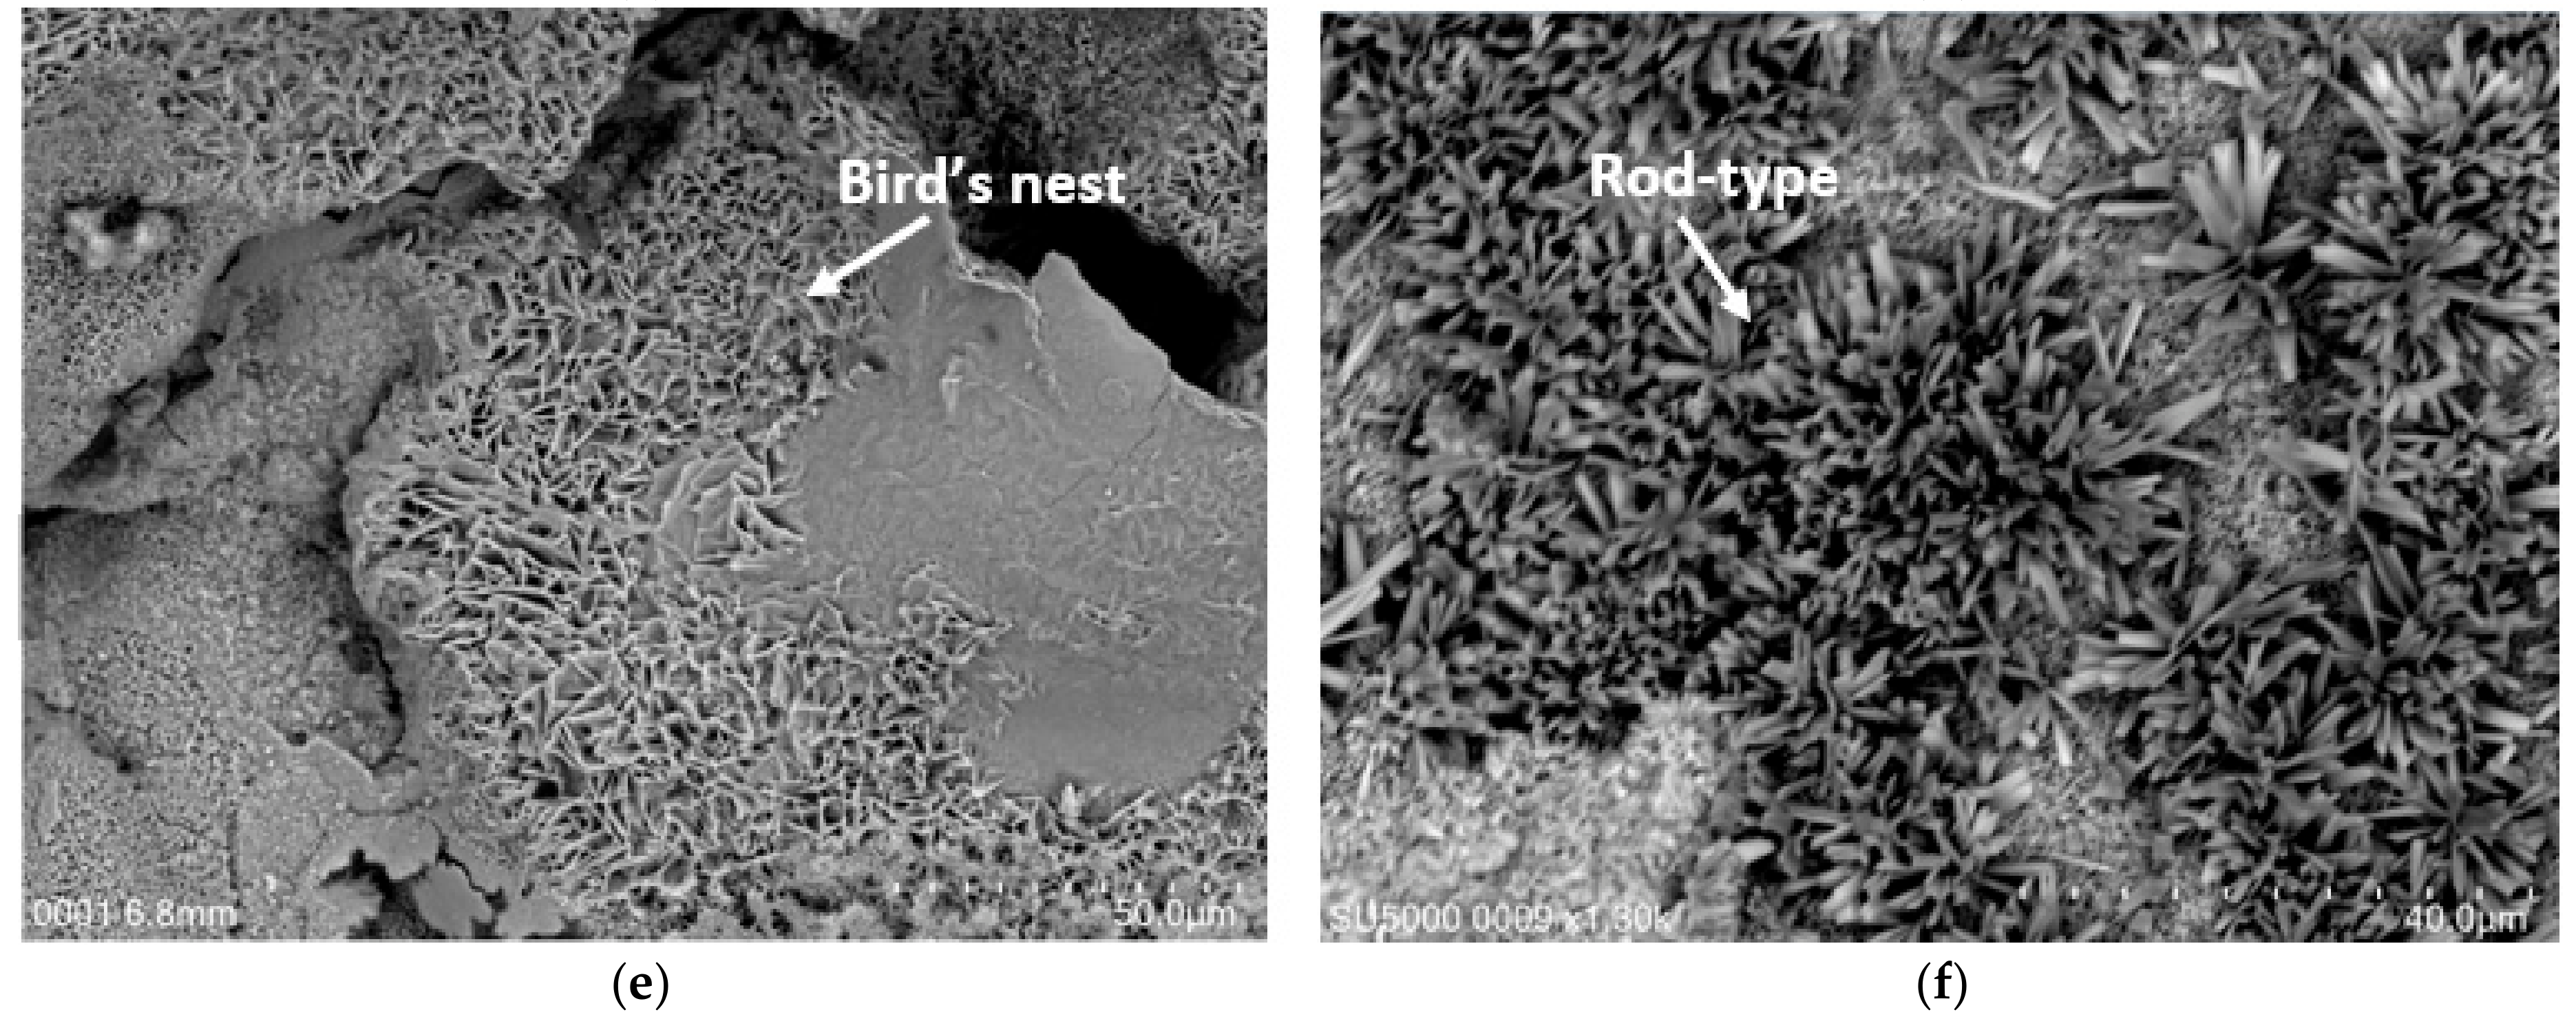
The morphology of both outer and inner rust layers was carried out by SEM. Figure 9 illustrates different rust-phase morphologies with various shapes and sizes observed in both outer and inner layers of UIT-treated specimens after different salt spray exposure times.
During exposure, each rust phase has its own growth conditions depending on several factors such as pH, humidity and chloride ion concentration. These conditions influence which oxide or oxyhydroxide phase predominates. As corrosion progresses, these phases do not develop independently but rather coexist, resulting in a complex mixture of different rust phases. The heterogeneous structure and composition of the rust layer show the different conditions that governed the corrosion process at various stage of exposure.
In Figure 9a, after 42 days of exposure, the outer rust layer is composed of a lattice of tubular crystals with a rod-like morphology characteristic of akaganeite, indicating a chloride-rich environment, while the inner rust layer displays two different laminar morphologies. Similar morphologies have also been reported by other researchers, such as bird’s nest and worm nest shapes, as presented in Figure 9b, corresponding to the lepidocrocite phase [28].
As corrosion advances to 84 days, the outer rust layer transitions to bars and bird’s nest-shaped phases, characteristic of the lepidocrocite phase, as shown in Figure 9c, likely due to changes in exposure conditions. However, the inner layer, presented in Figure 9d, mainly has a tube-shaped morphology, typical of the akaganeite phase.
This pattern continues after 126 days of salt spray exposure, the inner layer dominated by akaganeite while the outer layer remains mostly composed of lepidocrocite, as shown in Figure 9e,f. The persistence of lepidocrocite at this stage indicates that the outer layer still has conditions favorable to its formation. Also, the inner layer remains dominated by akaganeite, indicating that the conditions within this layer have consistently supported its formation over time. This suggests a relatively stable internal environment, especially in terms of chloride presence [29].
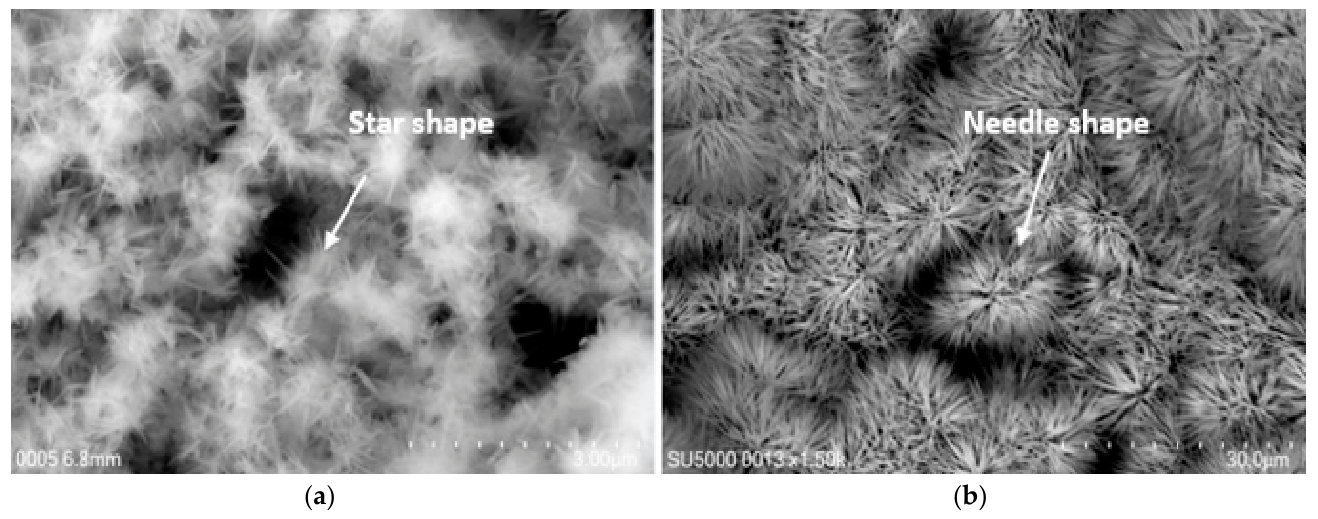
In some local spots of the outer rust layer after 126 days of exposure, two additional types of crystalline growth were detected. One exhibited a star shape (Figure 10a), while the second displayed a needle-like shape (Figure 10b). These acicular morphologies correspond to the formation of the goethite phase, as identified in previous studies [28,29,30,31]. The emergence of this phase suggests variation in the exposure conditions (a lower chloride concentration or a higher pH).
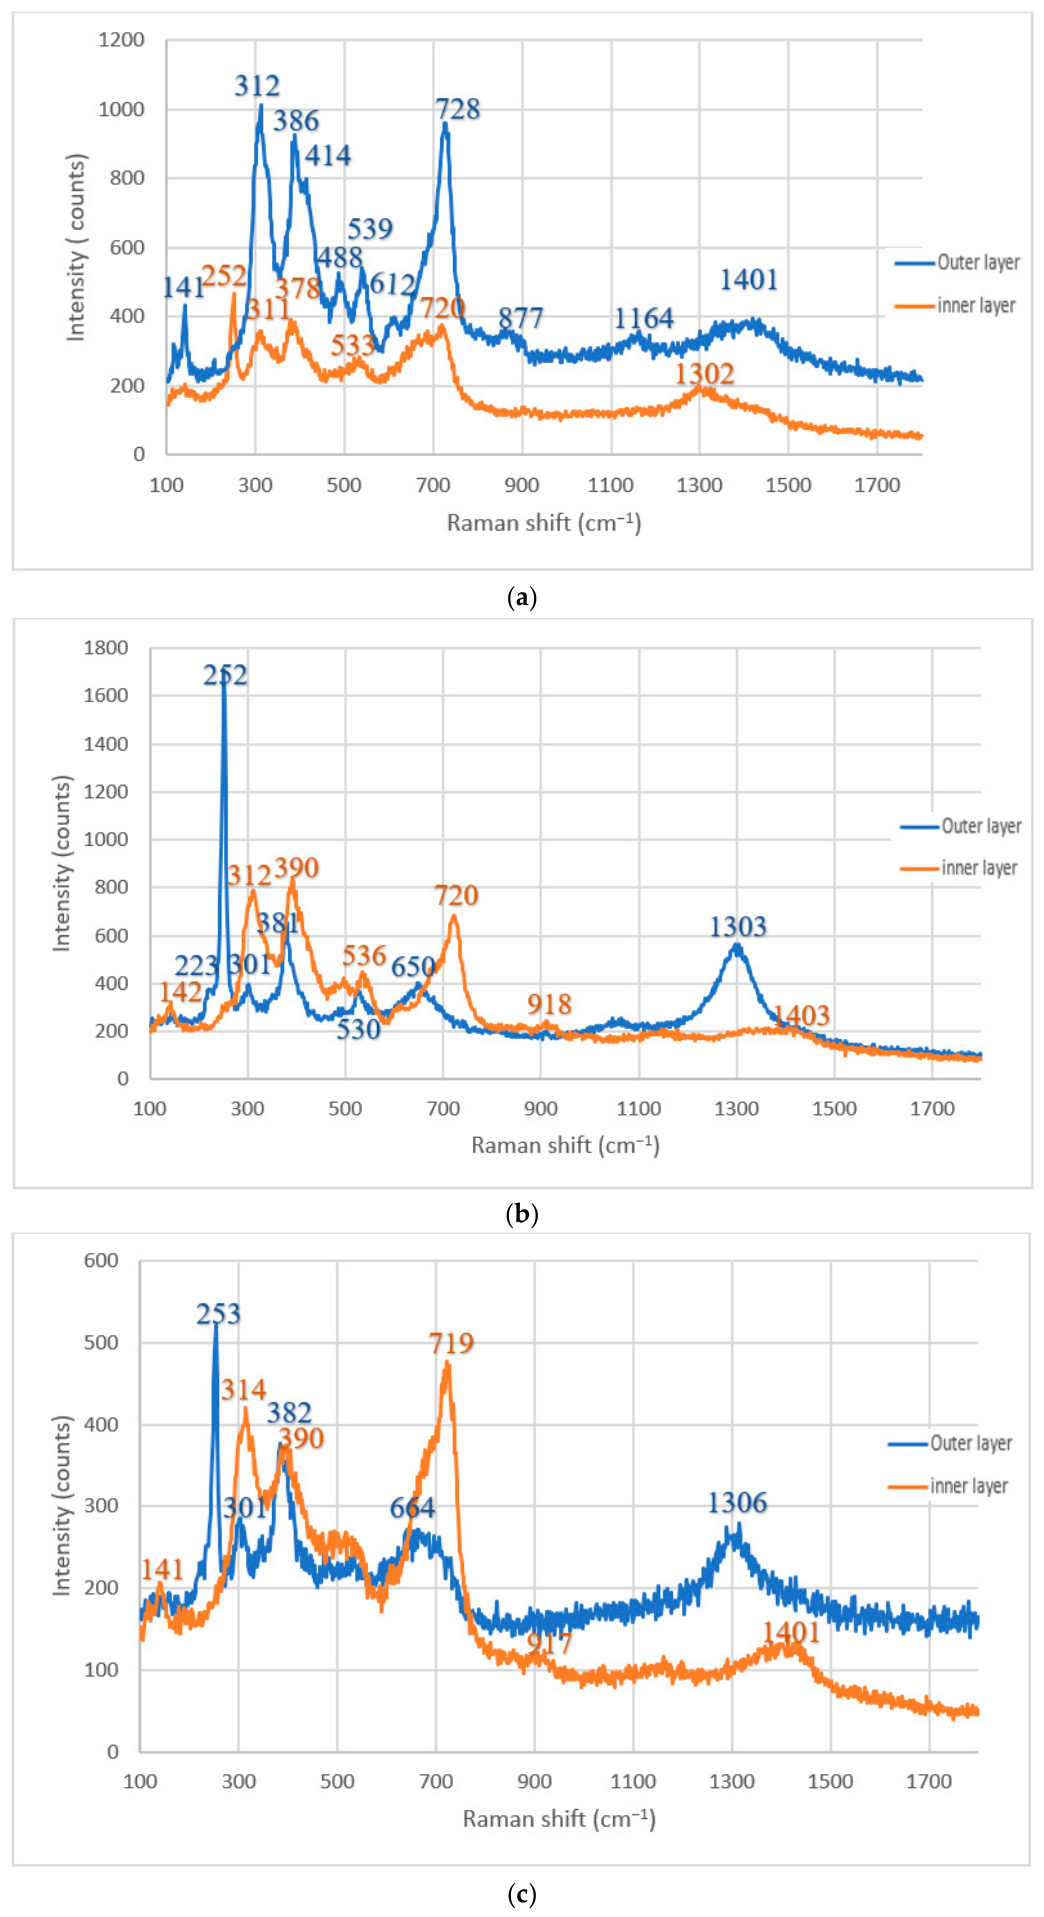
Raman spectroscopy was performed on the rust of both AW and UIT-treated samples to analyze their composition. Several spots were analyzed for each rust sample to make sure that the results were reproducible. Examples of Raman spectra acquired from the outer and inner layers of each rust sample of the UIT-treated specimens are presented in Figure 11.
The main Raman shifts detected at 312, 386, 539 and 728 cm−1 confirm the existence of akaganeite in the outer rust layer after 42 days of salt spray exposure. Other Raman shifts with lower intensities were found by other researchers and were attributed to the akaganeite phase [32,33,34,35,36,37]. However, the inner rust layer is composed of lepidocrocite, identified due to the main Raman shifts at 252, 378,533 and 1302 cm−1 [38,39,40]. Some studies considered shifts obtained at 720 cm−1 as an impurity of maghemite and the shift at around of 300 cm−1 as an indication of the presence of the goethite phase [41,42].
After 84 days, typical Raman spectra of lepidocrocite and akaganeite were obtained from the outer and the inner rust layer, respectively. Similar spectra were obtained after 126 days of salt spray exposure, with the strongest peak at around 300 cm−1 probably indicating the presence of goethite in the outer layer and the disappearance of the shift at around 530 cm−1 suggesting structural modifications affecting the typical vibrational modes.
These results are consistent with the findings of the initial SEM analyses. The mineral-phase evolution in rust layers during salt spray exposure can be attributed to the dynamic process of corrosion and chemical changes over time. After 42 days, the presence of akaganeite in the outer layer and lepidocrocite in the inner layer suggests that akaganeite forms quickly on the surface due to the direct exposure to moisture and chloride ions, which penetrate more easily into the outer rust layer. Lepidocrocite, which is less susceptible to chloride ions, develops in the more protected inner layer. By 84 days, the detection of lepidocrocite in the outer layer and akaganeite in the inner layer may result from the progressive transformation of akaganeite into lepidocrocite at the surface, induced by continuous oxidation and oxygen diffusion. Simultaneously, as chloride ions penetrate the rust layer, akaganeite relocates to the inner layer. After 126 days, a similar distribution is observed with the additional formation of goethite in the outer layer, a more stable phase that appears in advanced stages of corrosion and typically results from the transformation of lepidocrocite. Akaganeite remains in the inner layer, most likely due to the retention of chloride ions in these more protected areas.

3.2. Corrosion Rate

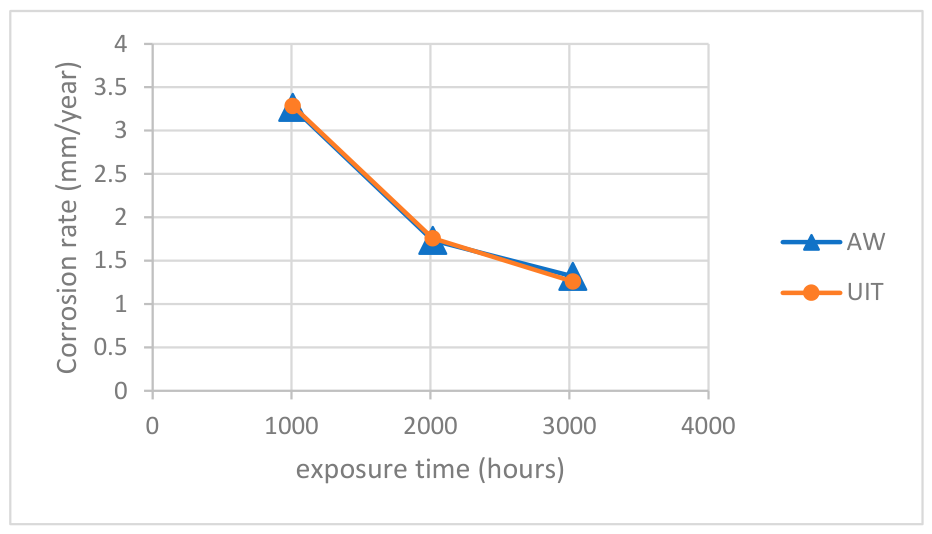
The corrosion rate measurements of AW and UIT test specimens after salt spray exposure after various time durations, 1008 h (42 days), 2016 h (84 days) and 3024 h (126 days), were calculated according to the ASTM G1 [43]. The evolution of the corrosion rate with the exposure time is illustrated in Figure 12.
The following Equation (1) was employed to calculate the corrosion rate of the test samples [44]:
C o r r o s i o n   R a t e   ( m m / y e a r ) = K · W A · T · D
where K is a constant, W is the mass loss in g, A is the surface area in cm2, T is the exposure time in hours and D is the density in g/cm3.
The corrosion rate curves for both AW and UIT specimens display a similar evolution during the salt spray exposure, showing a decrease in the corrosion rate over time. At first, after 42 days, both AW and UIT samples exhibit relatively high corrosion rates of 3.27 and 3.28 mm/year, respectively. This high rate is probably due to the initial aggressive interaction between the surface material and the corrosive environment. After 84 days, the corrosion rates decrease to 1.73 mm/year and 1.76 mm/year for AW and UIT samples, respectively, representing a reduction of approximately 47%. By 126 days, the corrosion rates further decline to 1.32 mm/year and 1.26 mm/year for AW and UIT samples, respectively, showing a decrease of around 25%. The development of a protective corrosion product layer can explain this slower reduction, as it helps to mitigate additional corrosion. Whereas the influence of UIT on corrosion resistance remains uncertain, as the corrosion rates of UIT samples are similar to those of AW specimens, it is clear that UIT does not have a negative effect on long-term corrosion performance. Thus, while it does not enhance corrosion resistance, it maintains similar corrosion behavior to AW samples, showing no adverse effects.
Microscopic observations confirm these findings. After 42 days of exposure, UIT surface modifications are no longer visible, indicating that the mechanical impact of the UIT process is removed by the corrosion effect. At this stage, the rust layers show that lepidocrocite forms the internal layer, while akaganeite is present on the outer surface. This suggests that the initial corrosion process favors the formation of lepidocrocite close to the metal interface, with akaganeite developing as a surface layer. By 84 days, the layer composition transitions to lepidocrocite on the outer surface and akaganeite internally, which corresponds to the corrosion environment modification and the attainment of stable corrosion products. Such a transition suggests that the protective layer is developing, which contributes to the observed decrease in corrosion rates over time. However, the corrosion rates of UIT samples remain comparable to those of AW specimens. This suggests that peening neither enhances nor adversely impacts the corrosion resistance over extended exposure times. This is likely due to the fact that the plastically modified surface layer is removed. These findings align with the results of Knysh and al. [20], who demonstrated that the benefits induced by HFMI surface treatment were either minimal or eventually became insignificant over time.

4. Conclusions

Ultrasonic impact treatment (UIT) was applied to S355 welded T-joints, and the aging behavior of both AW and UIT-treated specimens under accelerated environmental exposure was investigated. The experimental protocol developed in this study proved effective for evaluating the aging response of the different conditions, as well as for analyzing phase evolution and associated degradation mechanisms.
Both AW and UIT-treated specimens exhibit a similar corrosion rate evolution over the salt spray exposure time, decreasing from 3.27 and 3.28 mm/year at 42 days to 1.32 and 1.26 mm/year at 126 days, respectively. This reduction is related to the evolution of the rust layer composition. At 42 days, the rust layer is composed of internal lepidocrocite and external akaganeite. By 84 days, a phase inversion occurs, with lepidocrocite migrating to the outer surface and akaganeite to the inner one. The subsequent formation of goethite in the outer layer by 126 days indicates the development of a stable and more protective phase. The corrosion film thickness also increases similarly for both conditions, from approximately 1.33 ± 0.11 and 1.36 ± 0.17 mm at 42 days to 3.70 ± 0.08 mm and 3.76 ± 0.06 mm at 126 days for UIT and AW specimens, respectively. The similar behavior of both AW and UIT-treated specimens can be explained by the progressive consumption of the UIT-induced layer. Microstructural observations confirm that only some traces of the UIT-treated layer were present at 42 days of salt spray exposure. However, this layer was not detected at 126 days.
Under the specific accelerated conditions of this study and based on the physicochemical characterization of the surface products, UIT was found to have no significant influence—either beneficial or detrimental—on the long-term aging resistance of the material. This conclusion is limited to the material degradation aspects, as assessed through mass loss, surface observations, and product layer composition. However, the present study focused primarily on the metallurgical evolution of the surface and did not assess the mechanical response of the specimens, particularly the retention and relaxation of residual stresses induced by UIT. Future research focusing on the mechanical properties and the evolution of the stress field in UIT-treated welded joints is necessary to fully assess the impact of UIT on structural integrity under loading and environmental conditions. In addition, shorter exposure durations should be considered in future work to better analyze the effect of UIT before the degradation of the surface-modified layer.

Author Contributions

Conceptualization, S.Z. and L.D.; methodology, S.Z.; validation, L.D.; formal analysis, S.Z.; investigation, S.Z.; data curation, S.Z.; writing—original draft preparation, S.Z.; writing—review and editing, S.Z. and L.D.; visualization, L.D.; supervision, L.D. All authors have read and agreed to the published version of the manuscript.

Funding

This research received no external funding.

Institutional Review Board Statement

Not applicable.

Informed Consent Statement

Not applicable.

Data Availability Statement

The raw data supporting the conclusions of this article will be made available by the authors on request.

Acknowledgments

The authors would like to sincerely thank J. Creus from the LASIE laboratory of the University of la Rochelle for his help in performing the Raman spectroscopy tests. They also acknowledge Yannick Falaise and Nicolas Séjourné of the SMC laboratory of the University Gustave Eiffel for their valuable assistance in conducting the corrosion tests.

Conflicts of Interest

The authors declare no conflicts of interest.

References

  1. Marquis, G.B.; Barsoum, Z. Fatigue strength improvement of steel structures by HFMI: Proposed procedures and quality assurance guidelines. Weld. World 2014, 58, 19–28. [Google Scholar] [CrossRef]
  2. Marquis, G.B.; Mikkola, E.; Yildirim, H.C.; Barsoum, Z. Fatigue strength improvement of steel structures by HFMI: Proposed fatigue assessment guidelines. Weld. World 2013, 57, 803–822. [Google Scholar] [CrossRef]
  3. Mughrabi, H. Microstructural mechanisms of cyclic deformation, fatigue crack initiation and early crack growth. Philos. Trans. R. Soc. A 2015, 373, 20140132. [Google Scholar] [CrossRef]
  4. Le Quilliec, G. Application du Martelage à Haute Fréquence à L’optimisation de la Maintenance des Ouvrages et des Structures Soudées. Ph.D. Thesis, Ecole Centrale de Nantes (ECN), Nantes, France, 2011. Available online: https://theses.hal.science/tel-00961736 (accessed on 2 March 2026).
  5. Fereidooni, B.; Morovvati, M.R.; Sadough-Vanini, S.A. Influence of severe plastic deformation on fatigue life applied by ultrasonic peening in welded pipe 316 Stainless Steel joints in corrosive environment. Ultrasonics 2018, 88, 137–147. [Google Scholar] [CrossRef]
  6. Daavary, M.; Sadough Vanini, S.A. Corrosion fatigue enhancement of welded steel pipes by ultrasonic impact treatment. Mater. Lett. 2015, 139, 462–466. [Google Scholar] [CrossRef]
  7. Gao, W.; Wang, D.; Cheng, F.; Deng, C.; Xu, W. Enhancement of the fatigue strength of underwater wet welds by grinding and ultrasonic impact treatment. J. Mater. Process. Technol. 2015, 223, 305–312. [Google Scholar] [CrossRef]
  8. Yildirim, H.C.; Marquis, G.B. Fatigue strength improvement factors for high strength steel welded joints treated by high frequency mechanical impact. Int. J. Fatigue 2012, 44, 168–176. [Google Scholar] [CrossRef]
  9. Gkatzogiannis, S.; Weinert, J.; Engelhardt, I.; Knoedel, P.; Ummenhofer, T. Correlation of laboratory and real marine corrosion for the investigation of corrosion fatigue behaviour of steel components. Int. J. Fatigue 2019, 126, 90–102. [Google Scholar] [CrossRef]
  10. Itoga, H.; Tokaji, K.; Nakajima, M.; Koizumi, T. Effect of surface roughness on step-wise S–N characteristics in high strength steel. Int. J. Fatigue 2003, 25, 379–385. [Google Scholar] [CrossRef]
  11. Rokhlin, S.I.; Kim, J.Y.; Nagy, H.; Clark, B. Effect of pitting corrosion on fatigue crack initiation and fatigue life. Eng. Fract. Mech. 1999, 62, 425–444. [Google Scholar] [CrossRef]
  12. Thorpe, T.W.; Scott, P.M.; Rance, A.; Silvester, D. Corrosion fatigue of BS 4360: 50D structural steel in seawater. Int. J. Fatigue 1983, 5, 123–133. [Google Scholar] [CrossRef]
  13. Adedipe, O.; Brennan, F.; Kolios, A. Review of corrosion fatigue in offshore structures: Present status and challenges in the offshore wind sector. Renew. Sustain. Energy Rev. 2016, 61, 141–154. [Google Scholar] [CrossRef]
  14. Echeverría, M.; Abreu, C.M.; Lau, K.; García-Caballero, F.G. Viability of epoxy–siloxane hybrid coatings for preventing steel corrosion. Prog. Org. Coat. 2016, 92, 29–43. [Google Scholar] [CrossRef]
  15. Schürz, S.; Luckeneder, G.H.; Fleischanderl, M.; Mack, P.; Gsaller, H.; Kneissl, A.C.; Duchoslav, J.; Stifter, D. Chemistry of corrosion products on Zn–Al–Mg alloy coated steel. Corros. Sci. 2010, 52, 3271–3279. [Google Scholar] [CrossRef]
  16. Xue, H.; Peng, X.; Chen, Y.; Zhang, W.; Xu, S.; Li, K.; Li, J. Full-Process Multiphysics Simulation and Experimental Study on the Fatigue Performance Enhancement of Butt-Welded Joints of QSTE700TM Through Ultrasonic Impact Treatment. Appl. Sci. 2026, 16, 2397. [Google Scholar] [CrossRef]
  17. Han, S.; Wang, Y.; Zhang, Y.; Ma, Y.; Wang, Y.; Cui, C. Refinement effect of ultrasonic impact treatment on fatigue life of welded joints: A quantitative analysis based on crystal plasticity. Eng. Fract. Mech. 2026, 331, 111708. [Google Scholar] [CrossRef]
  18. Štěpán, J.; Ryjáček, P.; Kepka, M., Jr.; Minich, R. Influence of HFMI on new and repaired welds under four-point bending. J. Constr. Steel Res. 2026, 243, 110405. [Google Scholar] [CrossRef]
  19. He, B.L.; Yu, Y.X.; Liu, J.; Li, S.H.; Zhou, Q. Effect of Ultrasonic Impact Treatment on Corrosion Resistance of Welded Joints of 16MnR Steel. Adv. Mater. Res. 2013, 815, 689–694. [Google Scholar] [CrossRef]
  20. Knysh, V.; Solovei, S.; Motrunich, S.; Nyrkova, L.; Labur, T. Influence of the accelerated corrosion exposure on the fatigue behaviour of welded joints treated by high frequency mechanical impact. Int. J. Fatigue 2021, 149, 106272. [Google Scholar] [CrossRef]
  21. Gu, B.; Wang, C.; Wang, Y.; Gao, L.; Xu, G.; Yang, Y.; Zhu, X. Effect of ultrasonic impact treatment on surface residual stress, microstructure and electrochemical properties of the hot-rolled S355 steel. Surf. Coat. Technol. 2024, 494, 131468. [Google Scholar] [CrossRef]
  22. Gu, B.; Chu, J.; Zhang, H.; Gao, L.; Xu, G.; Yue, C. Effects of ultrasonic impact on surface characterization of S355 steel welded joint. Mater. Today Commun. 2024, 40, 109878. [Google Scholar] [CrossRef]
  23. NF EN 13479:2017; Welding Consumables—General Product Standard for Filler Metals and Fluxes for Fusion Welding of Metallic Materials. Association Française de Normalisation (AFNOR): La Plaine Saint-Denis, France, 2017.
  24. Dieng, L.; Amine, D.; Falaise, Y.; Galimard, P. Parametric study of the finite element modeling of shot peening on welded joints. J. Constr. Steel Res. 2017, 130, 234–247. [Google Scholar] [CrossRef]
  25. ISO 9227:2017; Corrosion Tests in Artificial Atmospheres—Salt Spray Tests. International Organization for Standardization: Geneva, Switzerland, 2017.
  26. ISO 16701:2015; Corrosion of Metals and Alloys—Corrosion in Artificial Atmosphere—Accelerated Corrosion Test Involving Exposure Under Controlled Conditions of Humidity Cycling and Intermittent Spraying of a Salt Solution. International Organization for Standardization: Geneva, Switzerland, 2015.
  27. ISO 8407:2009; Corrosion on Metals and Alloys—Removal of Corrosion Products from Corrosion Test Specimens. International Organization for Standardization: Geneva, Switzerland, 2009.
  28. Alcántara, J.; Chico, B.; Simancas, J.; Díaz, I.; de la Fuente, D.; Morcillo, M. An attempt to classify the morphologies presented by different rust phases formed during the exposure of carbon steel to marine atmospheres. Mater. Charact. 2016, 118, 65–78. [Google Scholar] [CrossRef]
  29. Alcántara, J.; de la Fuente, D.; Chico, B.; Simancas, J.; Díaz, I.; Morcillo, M. Marine atmospheric corrosion of carbon steel: A review. Materials 2017, 10, 406. [Google Scholar] [CrossRef]
  30. Raman, A.; Nasrazadani, S.; Sharma, L. Morphology of rust phases formed on weathering steels in various laboratory corrosion tests. Metallography 1989, 22, 79–96. [Google Scholar] [CrossRef]
  31. Gallagher, K.J.; Phillips, D.N. Proton transfer studies in the ferric oxyhydroxides. Part 1. Hydrogen exchange between α-FeOOH and water. Trans. Faraday Soc. 1968, 64, 785–795. [Google Scholar] [CrossRef]
  32. Boucherit, N.; Delichere, P.; Joiret, S.; Hugot-Le Goff, A. Passivity of iron and iron alloys studied by voltammetry and Raman spectroscopy. Mater. Sci. Forum 1989, 44–45, 51–62. [Google Scholar] [CrossRef]
  33. Ohtsuka, T. Raman spectra of passive films of iron in neutral borate solution. Mater. Trans. JIM 1996, 37, 67–69. [Google Scholar] [CrossRef]
  34. de Faria, D.L.A.; Venâncio Silva, S.; de Oliveira, M.T. Raman microspectroscopy of some iron oxides and oxyhydroxides. J. Raman Spectrosc. 1997, 28, 873–878. [Google Scholar] [CrossRef]
  35. Oh, S.J.; Cook, D.C.; Townsend, H.E. Characterization of iron oxides commonly formed as corrosion products on steel. Hyperfine Interact. 1998, 112, 59–65. [Google Scholar] [CrossRef]
  36. Neff, D.; Bellot-Gurlet, L.; Dillmann, P.; Réguer, S.; Legrand, L. Raman imaging of ancient rust scales on archaeological iron artefacts for long-term atmospheric corrosion mechanisms study. J. Raman Spectrosc. 2006, 37, 1228–1237. [Google Scholar] [CrossRef]
  37. Colomban, P. Potential and drawbacks of Raman (micro) spectrometry for the understanding of iron and steel corrosion. In New Trends and Developments in Automotive Systems Engineering; Chiaberge, M., Ed.; IntechOpen: Rijeka, Croatia, 2011. [Google Scholar] [CrossRef]
  38. Thibeau, R.J.; Brown, C.W.; Heidersbach, R.H. Raman spectra of possible corrosion products of iron. Appl. Spectrosc. 1978, 32, 532–535. [Google Scholar] [CrossRef]
  39. Dubois, F.; Mendibide, C.; Pagnier, T.; Perrard, F.; Duret, C. Raman mapping of corrosion products formed onto spring steels during salt spray experiments. A correlation between the scale composition and the corrosion resistance. Corros. Sci. 2008, 50, 3401–3409. [Google Scholar] [CrossRef]
  40. Ohtsuka, T.; Tanaka, S. Monitoring the development of rust layers on weathering steel using in situ Raman spectroscopy under wet-and-dry cyclic conditions. J. Solid State Electrochem. 2015, 19, 3559–3566. [Google Scholar] [CrossRef]
  41. Neff, D.; Réguer, S.; Bellot-Gurlet, L.; Dillmann, P.; Bertholon, R. Structural characterization of corrosion products on archaeological iron: An integrated analytical approach to establish corrosion forms. J. Raman Spectrosc. 2004, 35, 739–745. [Google Scholar] [CrossRef]
  42. Demoulin, A.; Trigance, C.; Neff, D.; Foy, E.; Dillmann, P.; L’Hostis, V. The evolution of the corrosion of iron in hydraulic binders analysed from 46- and 260-year-old buildings. Corros. Sci. 2010, 52, 3168–3179. [Google Scholar] [CrossRef]
  43. ASTM G1-03; Standard Practice for Preparing, Cleaning, and Evaluating Corrosion Test Specimens. ASTM International: West Conshohocken, PA, USA, 2017.
  44. Oikonomou, A.G.; Aggidis, G.A. Determination of the corrosion resistance of the welded steels used in underwater marine systems (including the submerged parts of wave energy converters). Mater. Today Proc. 2021, 44, 5048–5053. [Google Scholar] [CrossRef]
Figure 1. Specimen details.
Applsci 16 04723 g001
Figure 2. Weld area details: (a) AW specimen; (b) UIT-treated specimen.
Applsci 16 04723 g002
Figure 3. Experimental setup in the salt spray chamber: (a) specimens in chamber; (b) ABS support dimensions.
Applsci 16 04723 g003
Figure 4. Corroded surface sample under different conditions before chemical stripping: (a) AW corroded—42 days; (b) AW corroded—84 days; (c) AW corroded—126 days.
Applsci 16 04723 g004
Figure 5. Corroded surface sample under different conditions after chemical stripping: (a) AW corroded—42 days; (b) UIT corroded—42 days; (c) AW corroded—84 days; (d) UIT corroded—84 days; (e) AW corroded—126 days; (f) UIT corroded—126 days.
Applsci 16 04723 g005
Figure 6. IM observations of the cross-sectional microstructure of all specimens: (a) AW corroded—42 days; (b) UIT corroded—42 days; (c) AW corroded—84 days; (d) UIT corroded—84 days; (e) AW corroded—126 days; (f) UIT corroded—126 days.
Applsci 16 04723 g006
Figure 7. SEM observations of the cross-sectional microstructure: (a) UIT corroded—42 days; (b) UIT corroded—84 days; (c) UIT corroded—126 days.
Applsci 16 04723 g007aApplsci 16 04723 g007b
Figure 8. SEM observations of the rust outer layer of UIT-treated specimens at different exposure times: (a) 42 days; (b) 84 days; (c) 126 days.
Applsci 16 04723 g008
Figure 9. SEM observations of the rust morphologies of UIT-treated specimens after different times of exposure to salt spray: (a) the outer layer—42 days; (b) the inner layer—42 days; (c) the outer layer—84 days; (d) the inner layer—84 days; (e) the outer layer—126 days; (f) the inner layer—126 days.
Applsci 16 04723 g009aApplsci 16 04723 g009b
Figure 10. Acicular goethite morphologies in the outer rust layer of UIT-treated specimen after 126 days of salt spray exposure: (a) star-like shape; (b) needle-like shape.
Applsci 16 04723 g010
Figure 11. Raman characterization of the rust layers of UIT-treated specimens at different periods of salt spray exposure: (a) 42 days; (b) 84 days; (c) 126 days.
Applsci 16 04723 g011
Figure 12. Corrosion rate of AW and UIT specimens under salt spray exposure.
Applsci 16 04723 g012
Table 1. Chemical composition of S355J2 + N steel and G3Si1 filler metal.
Chemical Composition (wt%)
MaterialCMnSiPSCuFe
S355J20.21.60.550.0250.025≤0.55Balance
G3Si10.06–0.141.4–1.6<0.025<0.025--Balance
Table 2. Welding operating parameters.
Protective Gas Flow (Ferroline C12X2) (L/min)Intensity I
(A)
Voltage
U (V)
Speed
(mm/min)
2325526.1260
Table 3. Corrosion test parameters (ISO 9227 and ISO 16701 standards) [25,26].
T
(°C)
Volume Flow Rate
(mm/h)
[NaCl]
(%)
pHElectrical Conductivity
(µS/cm)
Total Test Duration
(Hours)
5015 ± 556.5–7.2183024
Disclaimer/Publisher’s Note: The statements, opinions and data contained in all publications are solely those of the individual author(s) and contributor(s) and not of MDPI and/or the editor(s). MDPI and/or the editor(s) disclaim responsibility for any injury to people or property resulting from any ideas, methods, instructions or products referred to in the content.