1. Introduction
Arched plastic-film greenhouses play an irreplaceable role in the production of vegetables, flowers, and forest and fruit seedlings due to their low construction costs, excellent light transmission, short construction period, and strong adaptability. However, owing to their lightweight and flexible structural characteristics [
1], such greenhouses are highly sensitive to wind action and are particularly vulnerable to peak wind events such as strong winds and hailstorms. Structural failures of plastic film greenhouses under severe weather conditions frequently lead to significant economic losses and agricultural production disruptions [
2,
3,
4]. To better understand the wind-induced responses of greenhouse structures, extensive studies have been conducted through wind tunnel experiments and numerical simulations. Wind tunnel testing has been widely adopted to investigate wind pressure distributions on single-span and multi-span greenhouses under various wind directions and structural configurations. Previous studies have examined the effects of roof shape, ventilation openings, windbreak configurations, and span arrangements on wind pressure coefficients and critical wind speeds. These investigations have provided valuable data for structural design and wind-resistant assessment of greenhouse systems. Richardson et al. [
5] conducted wind pressure tests and analyses on the plastic film surface of a single-span greenhouse and the surface of an arched greenhouse structure under natural wind conditions, discussing the advantages and disadvantages of various windbreak configurations. H. Moriyama et al. [
6] employed wind tunnel tests to measure the distribution of wind pressure coefficients on a pipe-framed greenhouse under different wind directions. They found that side openings had a differential impact on the internal and external pressure coefficients, with the internal pressure coefficient being more significantly affected. Kwon et al. [
3] conducted wind tunnel tests to systematically measure the wind pressure coefficients of four typical single-span greenhouses. They proposed recommended values for both overall and local wind pressure coefficients, which are applicable to structural safety design and the selection of cladding materials. This work provides key data support for the wind-resistant design of greenhouses in land reclamation areas. Yang et al. [
7] systematically compared the surface wind pressure distribution and critical wind speeds of single-span plastic greenhouses and solar greenhouses under different wind directions, offering an important basis for wind-resistant design and disaster prevention. Xie et al. [
8] investigated the influence of wind direction angle, roof openings, and eaves on the distribution of wind pressure coefficients through wind tunnel tests on a South China-type single-span plastic greenhouse. Wu [
9] found, via wind tunnel tests and numerical simulations, that the presence of a sunshade screen, along with wind speed and direction angle, significantly affects wind pressure distribution. Wang et al. [
10] conducted wind tunnel tests to study the effect of a sunshade screen on the surface wind pressure of an interlocking greenhouse structure. They observed that the wind pressure coefficients were higher when the ventilation windows were closed compared to when they were open, and the range of variation in the coefficients was substantial. Yang et al. [
11] derived the critical wind speeds for various zones from wind pressure data, providing critical data support for the wind-resistant design and disaster prevention of facility greenhouses. Bronkhorst A J et al. [
12] analyzed the overall horizontal wind load on multi-span, double-slope greenhouses through wind tunnel tests. Huang et al. [
13] conducted wind tunnel tests on agricultural greenhouses in tropical islands to investigate their wind pressure characteristics and influencing factors. They analyzed the wind pressure distribution patterns and local high-pressure generation mechanisms of two typical greenhouse types, and proposed a criterion for determining the non-Gaussian characteristics of wind pressure that considers roof shape and wind direction. Liu [
14] investigated the influence of different roof configurations on the surface wind pressure distribution of greenhouses through wind tunnel tests. The research results indicate that the roof configuration significantly affects the wind pressure characteristics of greenhouses, with the shape coefficient of the double-slope type of greenhouse being more compliant with code requirements.
In parallel, computational fluid dynamics (CFD) and finite element methods have been increasingly employed to simulate wind pressure distributions and structural responses of greenhouse structures. Numerical studies have evaluated the influence of roof openings, multi-span interference effects, and greenhouse clusters on aerodynamic loads. Some research has also focused on dynamic wind-induced responses and partial load factors in structural design codes. E.H. Mathews et al. [
15] conducted a numerical simulation study on the wind loads of an arched film greenhouse. By comparing the simulation results with measured data, they validated the reliability of the model, providing an effective method for the accurate prediction of greenhouse wind loads. Mistriotis et al. [
16] numerically simulated the external and internal wind pressure coefficients of a circular-arched greenhouse with openings using the finite element method. The analysis results indicate that the location or size of roof openings has a minor impact on the external wind pressure coefficients, but a significant influence on the internal coefficients. Briassoulis D. et al. [
17] developed a finite element model for a large arched greenhouse to analyze and validate its collapse modes, and estimated its performance against combined snow and wind loads under different loading combinations. Rack-woo Kim et al. [
18,
19] established a CFD model to evaluate the wind pressure coefficients of a typical Korean multi-span greenhouse. They analyzed the effects of wind direction, the number of spans, and design factors on these coefficients, and proposed recommended wind pressure coefficient values applicable to structural and cladding design. Cong W et al. [
20] simulated fluctuating wind and conducted time-domain analysis using ANSYS software, proposing wind-induced vibration coefficients for nodal displacements that are applicable to engineering design. This work provides an important basis for the dynamic wind resistance analysis and design of solar greenhouses. Guo et al. [
21] employed CFX-5 software to numerically simulate the surface wind pressure on a South China-type single-span plastic greenhouse, utilizing the turbulence k-ε model and structured non-uniform grids. They predicted the wind pressure distribution on the greenhouse surface and discussed the distribution characteristics at the eaves and ridges. Jiang [
22] employed CFD numerical simulation to investigate the wind pressure distribution patterns of both a single plastic greenhouse and a cluster of single greenhouses under multiple working conditions. Tao et al. [
23] utilized the ANSYS finite element analysis software for numerical simulation, analyzing the distribution patterns of wind pressure coefficients for three types of roof vent configurations in a Venlo-type multi-span greenhouse—continuous ridge vents, staggered roof vents, and fully open roof vents—under different wind directions and opening conditions. Cai [
24] conducted a study using CFD numerical simulation to examine the wind pressure coefficients of greenhouse clusters under various wind directions and arrangement patterns, as well as the complex relationships among these factors, providing a scientific reference for the wind-resistant design of circular-arched greenhouses. He et al. [
1] determined the partial factors for permanent loads and wind loads in the structural design of plastic greenhouses, providing a theoretical basis for specifying load factors in plastic greenhouse structural codes. Wei [
25] employed ABAQUS software to establish a finite element model of a plastic greenhouse with an arc-sided square steel tube frame and conducted a wind resistance performance analysis.
In recent years, numerical investigations of greenhouse aerodynamics have expanded from conventional single-structure simulations to more complex scenarios involving terrain effects, greenhouse-group interference, and geometric parameter sensitivity. For example, CFD-based studies have been used to evaluate wind pressure coefficients of single-span arched plastic greenhouses located in valley regions [
26], showing that topographic conditions can significantly affect the local wind-pressure distribution and the most unfavorable pressure zones on the greenhouse surface. Recent studies have also combined CFD and wind tunnel testing to investigate the wind-induced response of several typical greenhouse structural forms under multiple wind directions [
27], confirming that unfavorable wind effects may occur under oblique inflow rather than only under normal wind directions. In addition, recent numerical work has examined greenhouse-group interference under valley topography and the influence of greenhouse size on surface wind pressure distributions and wind-load shape factors [
28]. Meanwhile, fluid–structure interaction (FSI) has attracted increasing attention in agricultural wind-related studies [
26,
27]. However, the recent review literature indicates that current FSI applications are still mainly concentrated on wind–crop interaction and related biomechanical response problems, whereas direct FSI-based investigations for greenhouse wind-pressure design remain limited [
29]. Therefore, for studies focusing on local external pressure coefficients of tensioned greenhouse covers, wind tunnel testing and validated CFD approaches remain the dominant and more mature methods. In this context, the present study focuses on the local mean, fluctuating, and peak wind pressure characteristics of an arched plastic-film greenhouse under different terrain categories and wind directions, with particular emphasis on the role of terrain-induced turbulence intensity, which has not yet been systematically quantified in existing greenhouse wind-pressure studies.
Although previous experimental and numerical studies have significantly improved the understanding of greenhouse wind loads, important gaps still remain in the current literature. The existing studies have mainly focused on the effects of wind direction, structural form, roof openings, and greenhouse-group arrangement, while the role of terrain-dependent turbulence intensity in shaping local wind pressure characteristics has not yet been systematically clarified. In addition, although several recent CFD-based studies have considered topographic and geometric influences, experimental evidence on the coupled effect of oblique wind direction and terrain-induced turbulence on local cladding pressures of arched plastic-film greenhouses is still limited. As a result, the most unfavorable local loading condition and the corresponding critical pressure zones are not yet sufficiently established for practical design.
To address these gaps, the present study carries out boundary-layer wind tunnel tests on a 1:10 scale arched plastic-film greenhouse under three terrain categories and multiple wind directions. The scope of this work is to systematically quantify the effects of terrain-related turbulence intensity on the local mean, fluctuating, and peak wind pressure coefficients, and to identify the governing wind directions and critical roof zones relevant to local cladding design. The scientific added value of this study lies in demonstrating, through experimental evidence, how oblique wind and terrain-induced turbulence jointly control local suction amplification, and in establishing that the governing design condition is not normal wind alone but the coupled action of oblique inflow and high-turbulence terrain. These findings provide a more targeted aerodynamic basis for the wind-resistant design of local cladding structures in arched plastic-film greenhouses.
3. Results
3.1. Distribution of Mean Wind Pressure Coefficients Under Different Wind Directions
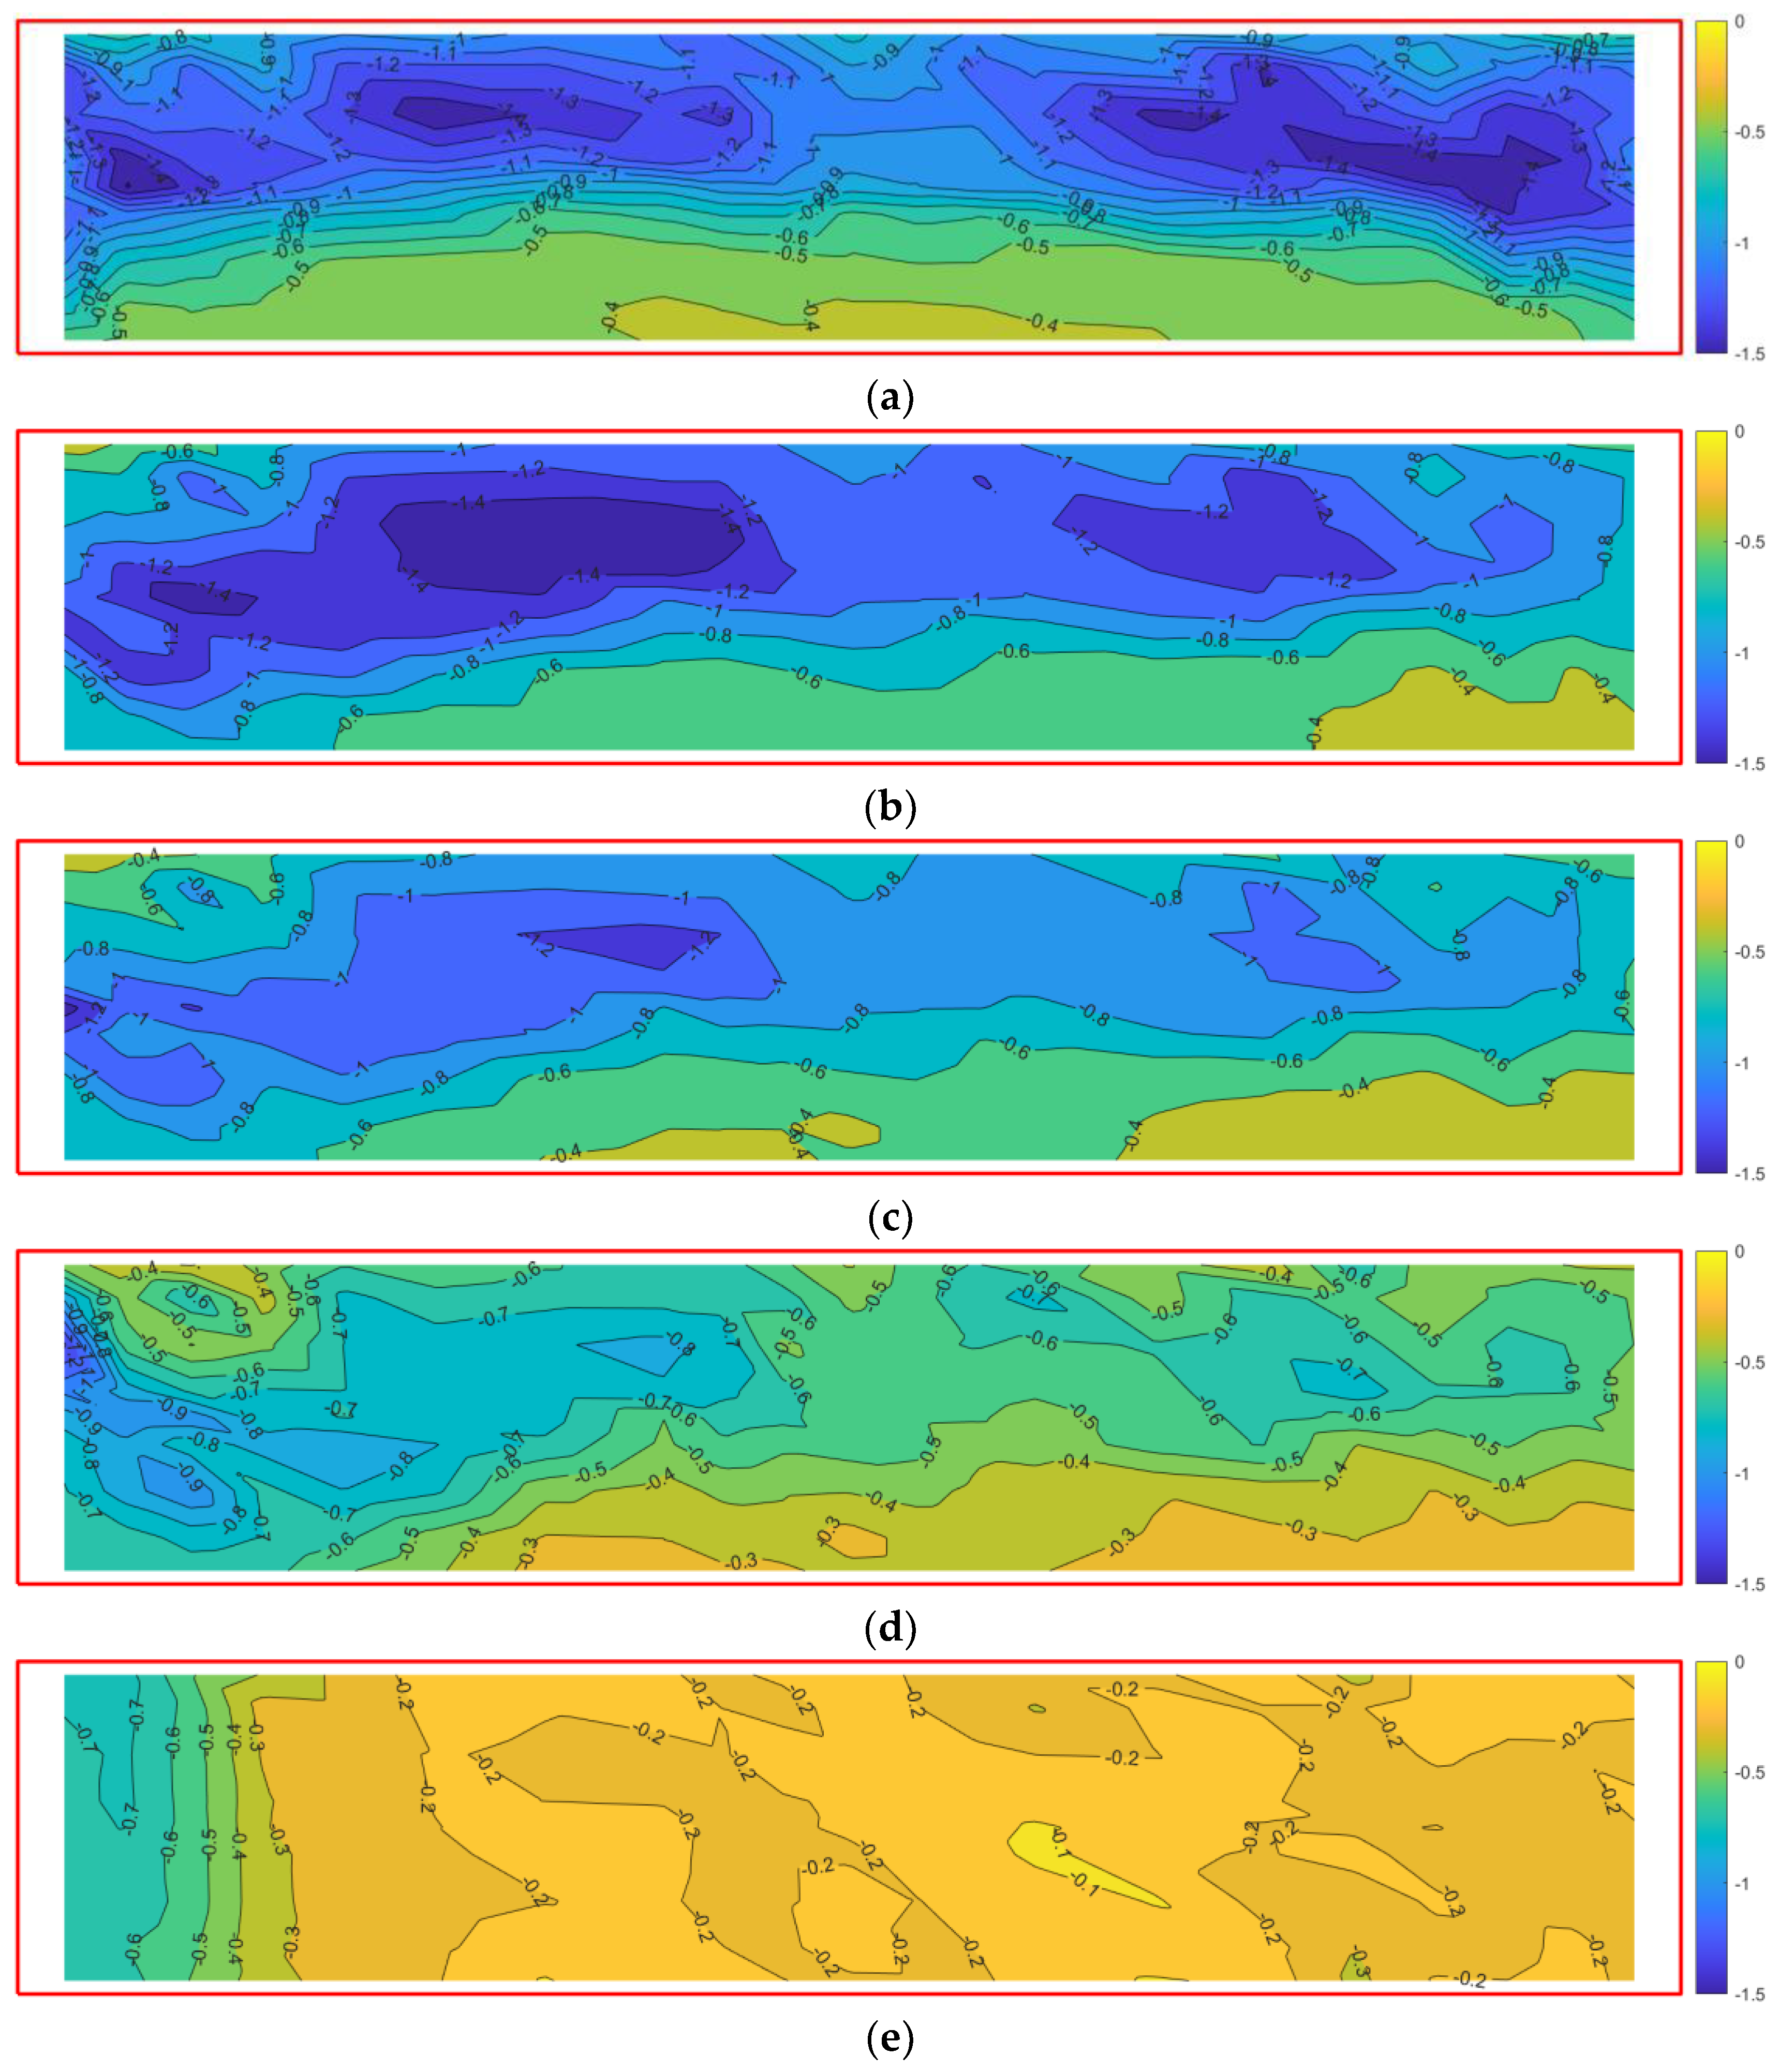
The test model is a biaxially symmetric structure. Five typical wind direction angles, 0°, 30°, 45°, 60° and 90°, were selected for discussion. The contour map of the mean wind pressure on the roof under typical wind direction angles under terrain category B is shown in
Figure 5. For visual consistency, the same color scale is used for all wind directions in
Figure 5, allowing for the direct comparison of the pressure magnitude and spatial distribution among different cases.
As the wind direction angle increases from 0° to 90°, the path of the oncoming flow around the greenhouse changes significantly, leading to a corresponding transition in the wind pressure distribution over the greenhouse surface.
When the wind direction angle is 0°, the airflow is perpendicular to the long side of the greenhouse and impinges symmetrically on the structure. Flow separation occurs near the front eave on the windward side, forming a cylindrical vortex. As a result, a strong negative-pressure region develops over the roof, with an approximately symmetric distribution.
At a wind direction angle of 30°, the flow pattern becomes asymmetric. One side of the roof is more directly exposed to the wind, whereas the other side is partially sheltered. The airflow first impinges on the windward corner region and then passes over the arched eave, where attachment and separation occur. This process produces a strong negative-pressure region near the windward arch-crown corner. Meanwhile, owing to the shielding effect of the upstream roof, the negative pressure on the leeward side is weakened, although its distribution range expands.
At a wind direction angle of 45°, one side of the greenhouse roof becomes almost fully windward. The airflow accelerates and separates over the windward surface, forming a relatively stable low-pressure region there, while the opposite side gradually falls within the wake region. Consequently, the absolute value of the pressure coefficient on that side decreases markedly.
At a wind direction angle of 60°, the oncoming flow mainly enters from one side of the greenhouse and then develops along the roof surface toward the other side. The separation point shifts further toward the windward side, and the low-pressure region becomes concentrated near the windward end and its vicinity. The absolute values of the pressure coefficient on the remaining roof surface decrease gradually.
When the wind direction angle reaches 90°, the wind acts perpendicularly to the short side of the greenhouse. The windward gable becomes the first area directly impacted by the airflow and exhibits strong negative pressure. The magnitude of this negative pressure reaches a maximum in that region and then gradually decreases along the ridge line, showing a more symmetric distribution.
Overall, as the wind direction angle increases, the low-pressure region gradually shifts from the central roof area toward the windward side and eventually toward the vicinity of the windward gable. At the same time, the asymmetry of the pressure distribution becomes more pronounced. The negative-pressure intensity is generally higher under oblique wind directions and weaker under crosswind conditions.
From a flow-mechanism perspective, the stagnation point on the greenhouse surface shifts progressively toward the windward side as the wind direction angle increases. This causes earlier flow acceleration and separation on the windward side, thereby moving the center of negative pressure in the same direction. When the wind direction angle is between 45° and 60°, the oncoming flow both impinges directly on the windward roof and sweeps along the arched surface. This combined effect induces a complex asymmetric separated flow near the windward corner and ridge, producing the most significant local negative pressure. When the wind direction angle reaches 90°, the oncoming flow mainly impinges on the gable and side edges, while the direct exposure of the central roof area is reduced. Consequently, the overall mean wind pressure level decreases.
3.2. Effect of Wind Direction on Local Wind Pressure over the Greenhouse Roof
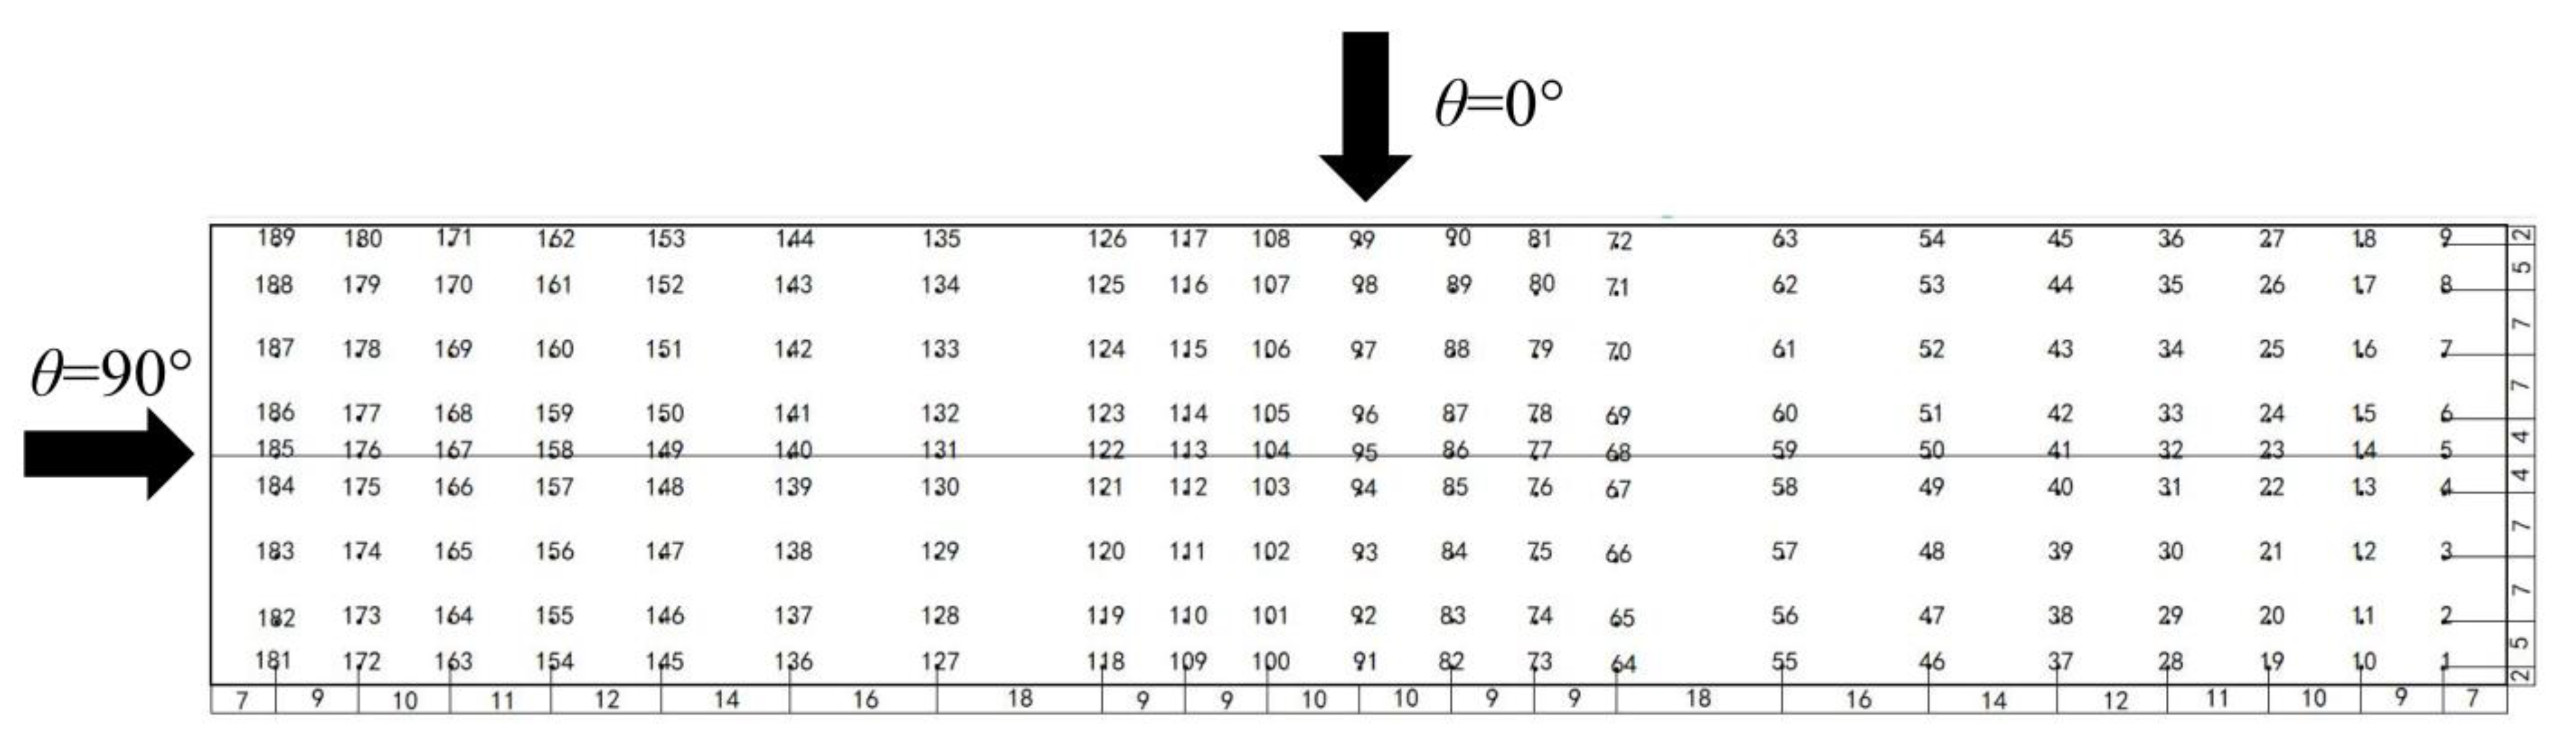
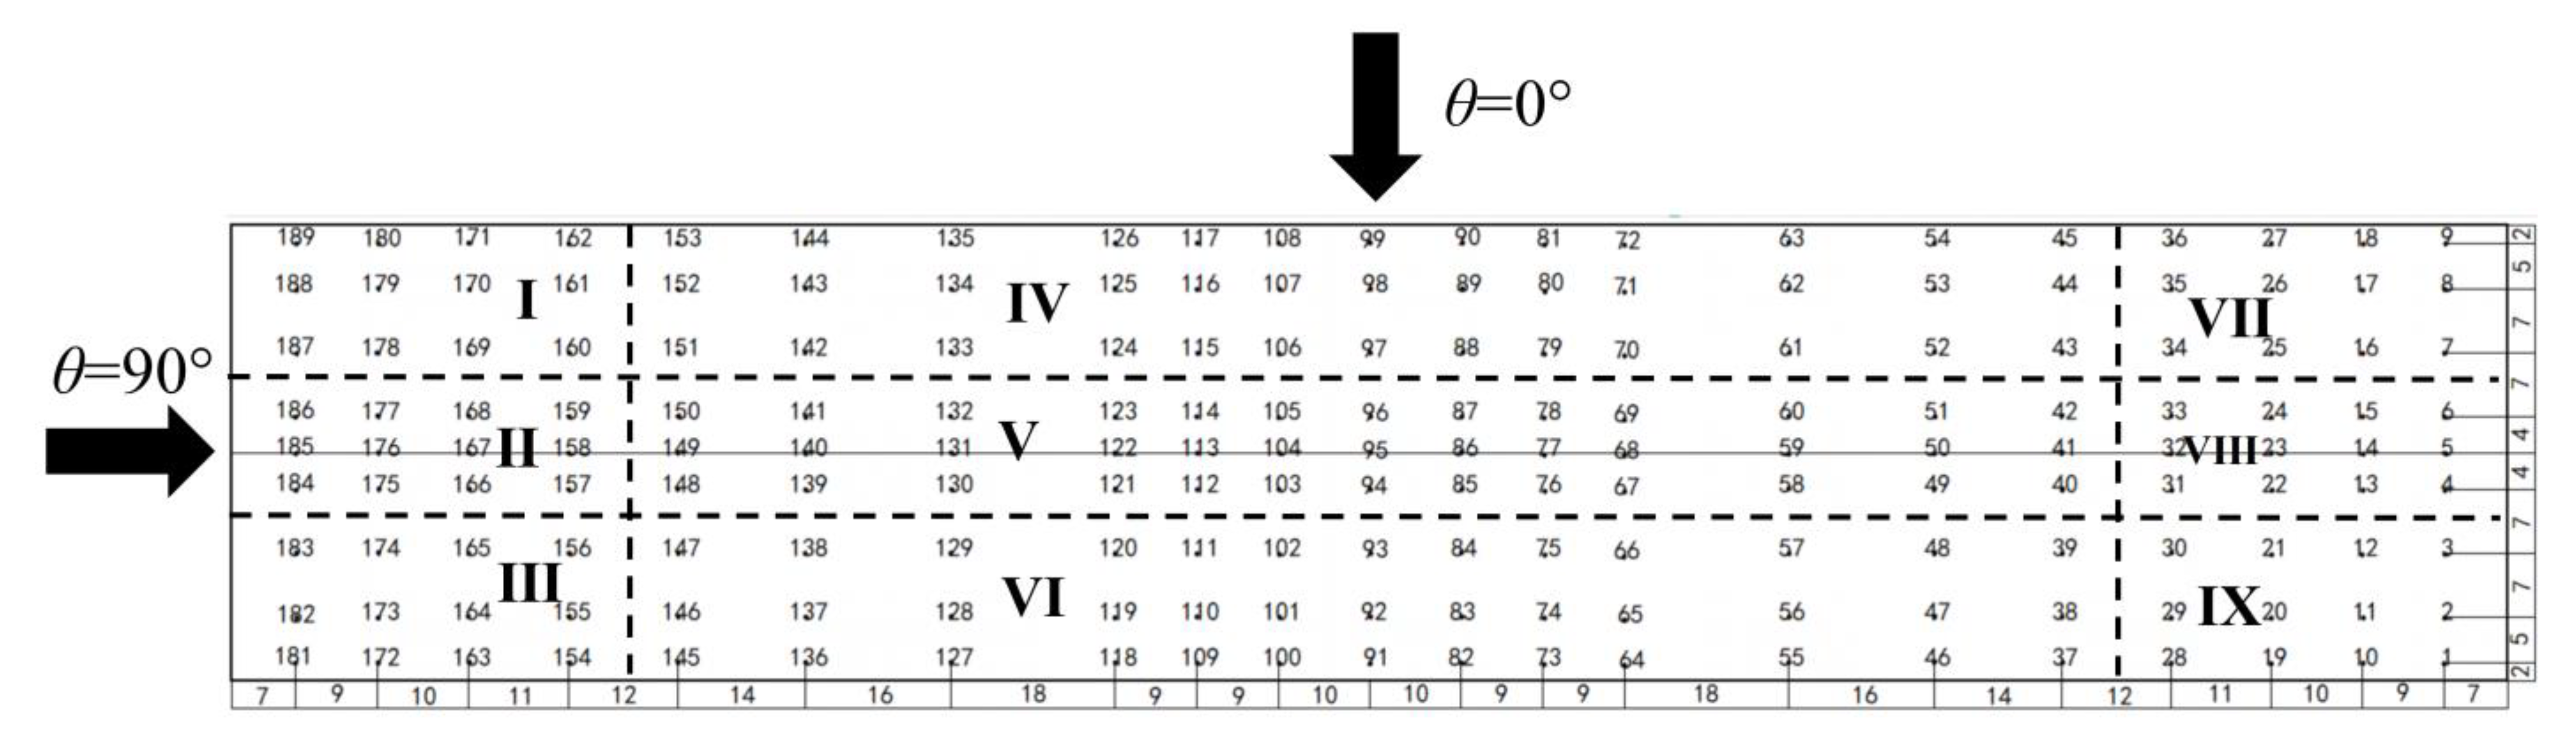
To investigate the distribution patterns of mean, fluctuating, and peak wind pressures on the windward roof area, ridge area, and corner area of the greenhouse roof under different wind direction angles and turbulence intensities, the measurement points in the local roof regions were divided into nine zones (as shown in
Figure 6), and wind tunnel tests were conducted under terrain category B at intervals of 15° within the range of 0° to 90°. The variations in wind pressure coefficients across different regions under the five typical wind direction angles of 0°, 30°, 45°, 60°, and 90° are shown in
Figure 7,
Figure 8 and
Figure 9.
3.2.1. Windward Roof Area
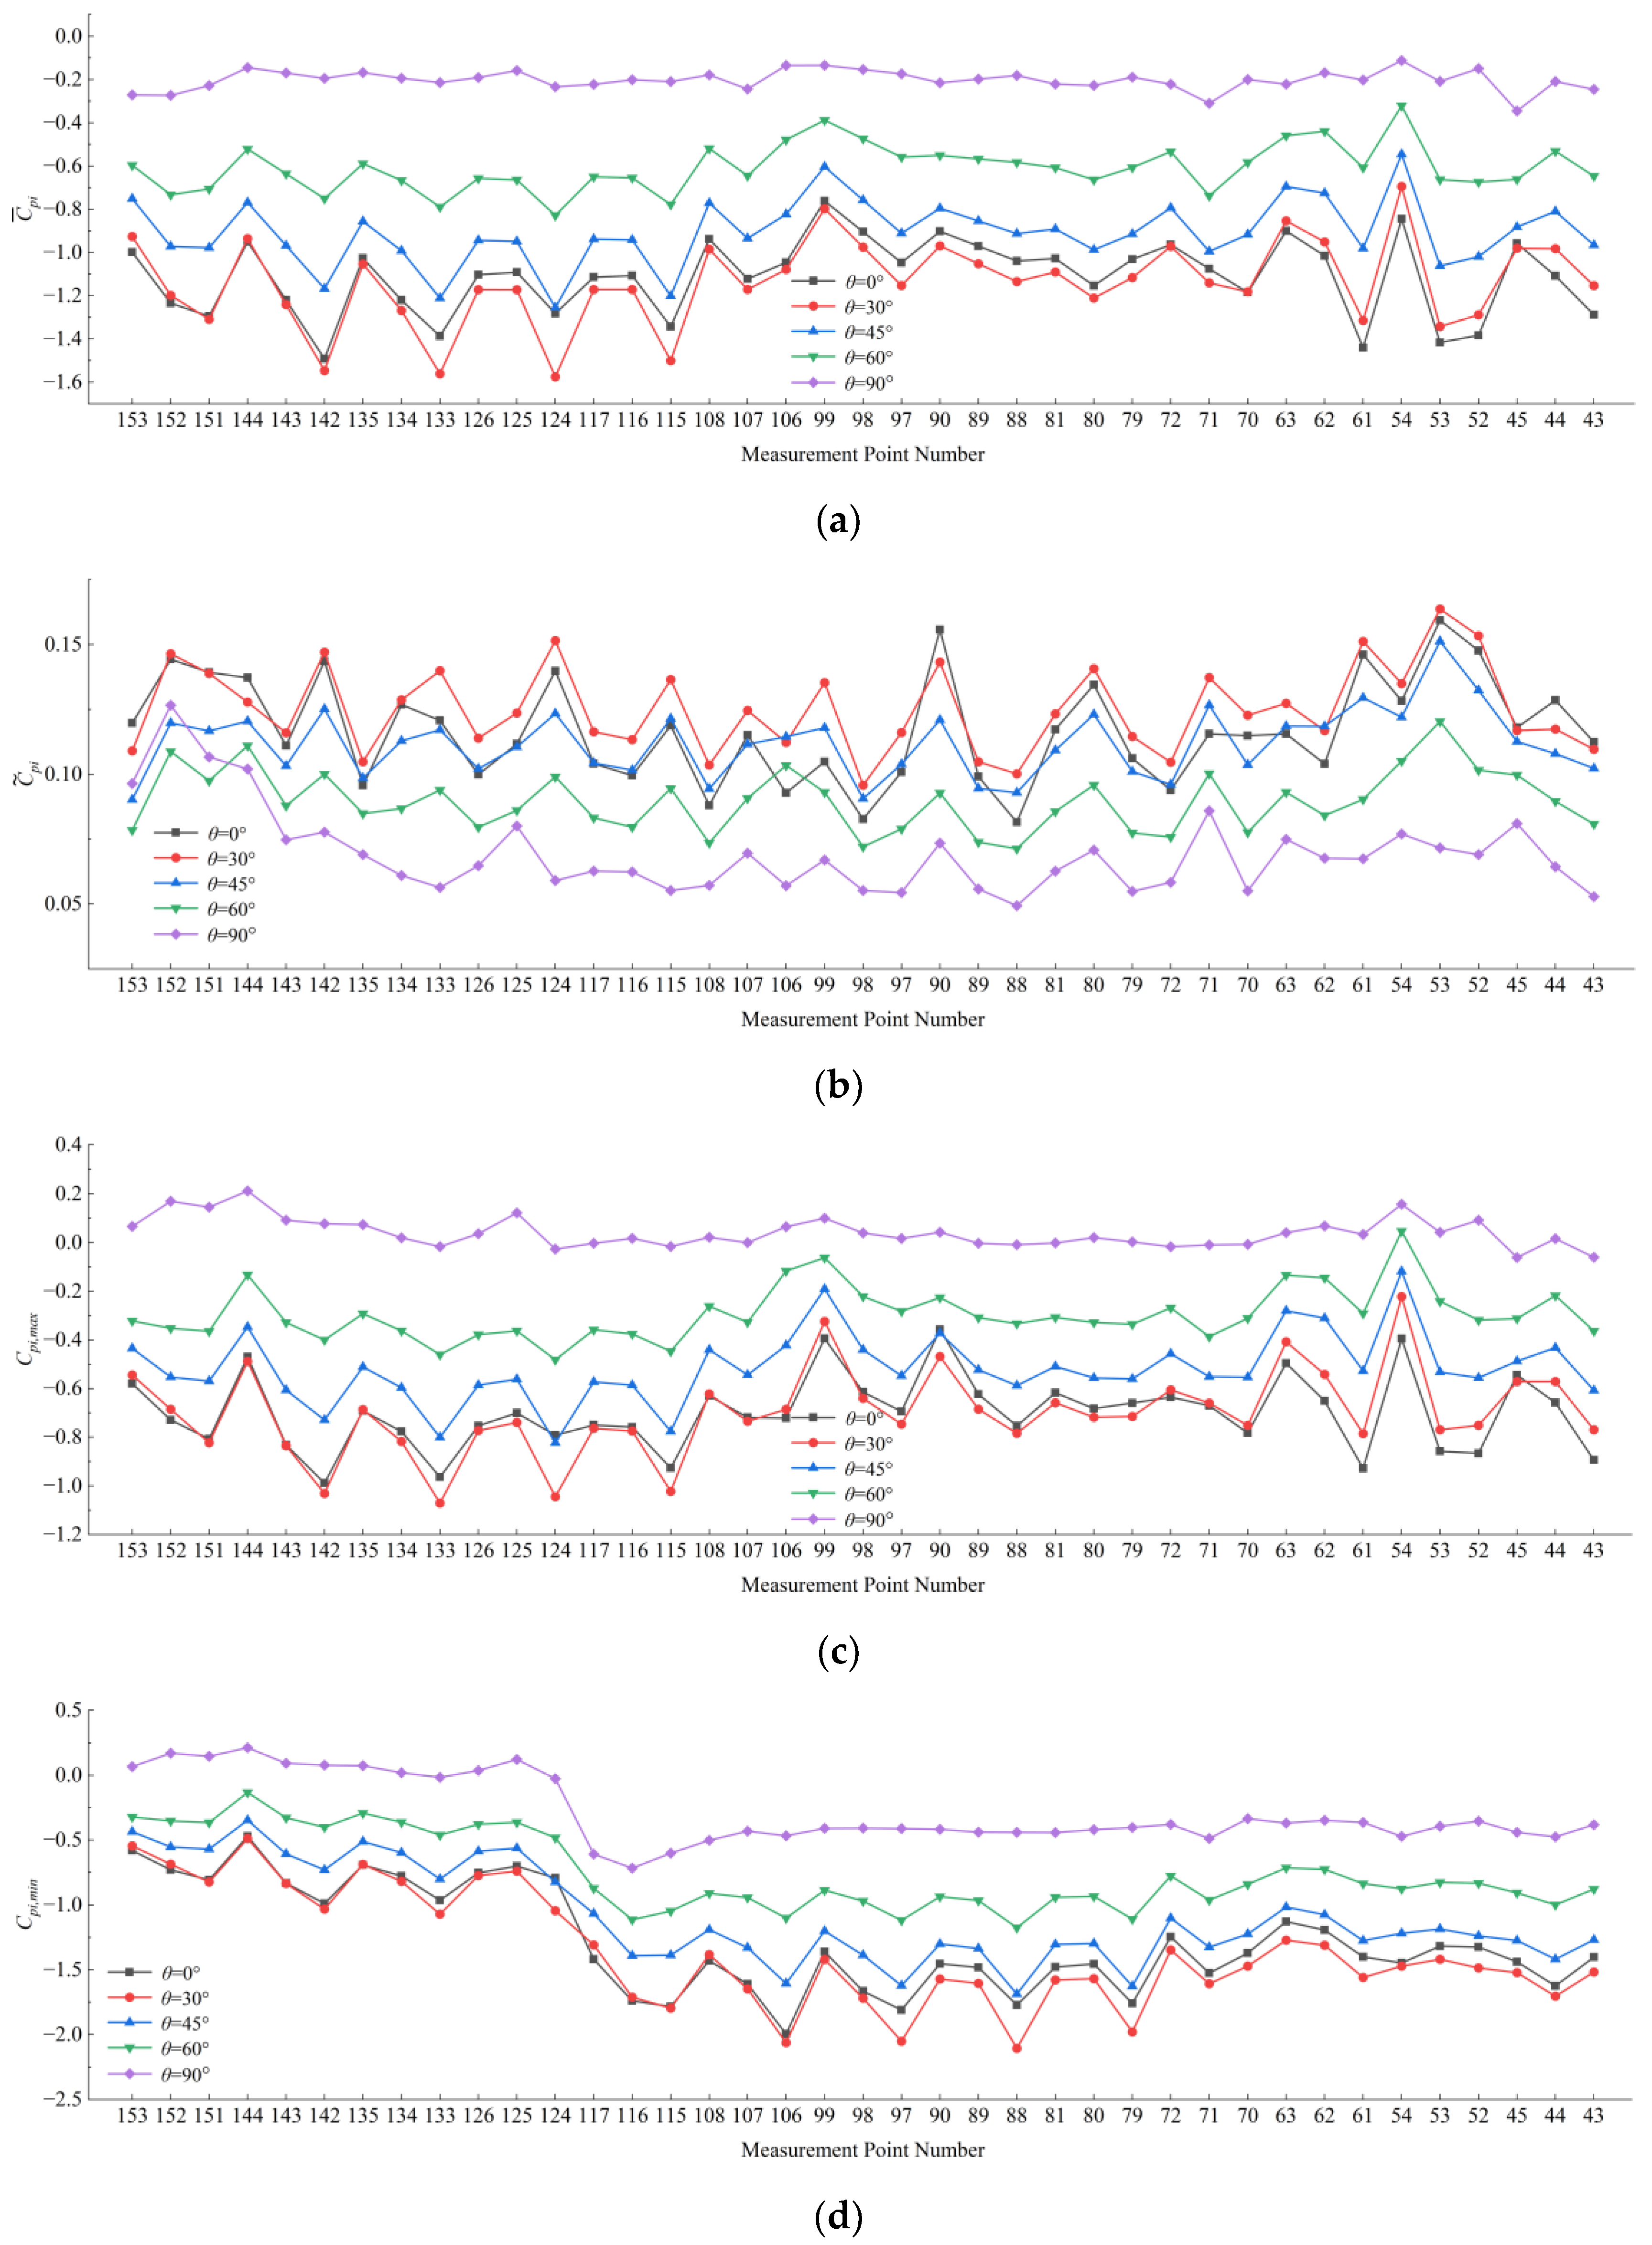
As shown in
Figure 7, wind direction has a significant influence on the wind pressure characteristics in the windward roof region.
Figure 7a shows that changes in wind direction strongly affect the measurement points in Zone IV. Under oblique winds, the absolute values of the mean wind pressure coefficients become larger, especially at measurement point 124, where the coefficient reaches 1.58 at a wind direction angle of 30°. When the wind direction angle is 0°, the incoming flow to the long side of the greenhouse is normal, and flow separation occurs at the windward roof leading edge, producing a strong suction region over the windward roof. When the wind direction angle is 90°, Zone IV becomes a side-flow region relative to the incoming wind, and the absolute values of the mean wind pressure coefficients decrease accordingly. In general, the absolute value of the mean wind pressure coefficient decreases with increasing distance from the dominant windward separation zone.
Figure 7b shows that the fluctuating wind pressure coefficients remain relatively high over a broad range of wind directions from 0° to 60°. Among them, those for the measurement point 53 reach 0.159 and 0.164 at 0° and 30°, respectively. This indicates that the windward roof region is not only sensitive to the mean separation pattern but also strongly affected by the unsteady motion of the separated shear layer.
Figure 7c,d show that, under a wind direction angle of 30°, the maximum wind pressure coefficient at measurement point 133 reaches 1.07, whereas the minimum wind pressure coefficient at measurement point 97 reaches −1.56. This indicates pronounced local suction extremes in this region.
Overall, the strong sensitivity of Zone IV to wind direction suggests that this region is mainly controlled by windward-edge flow separation. Under oblique winds, the separated shear layer becomes more asymmetric and unsteady, which explains why both fluctuating and peak suctions remain high over the wind-direction range from 0° to 60°.
3.2.2. Ridge Area
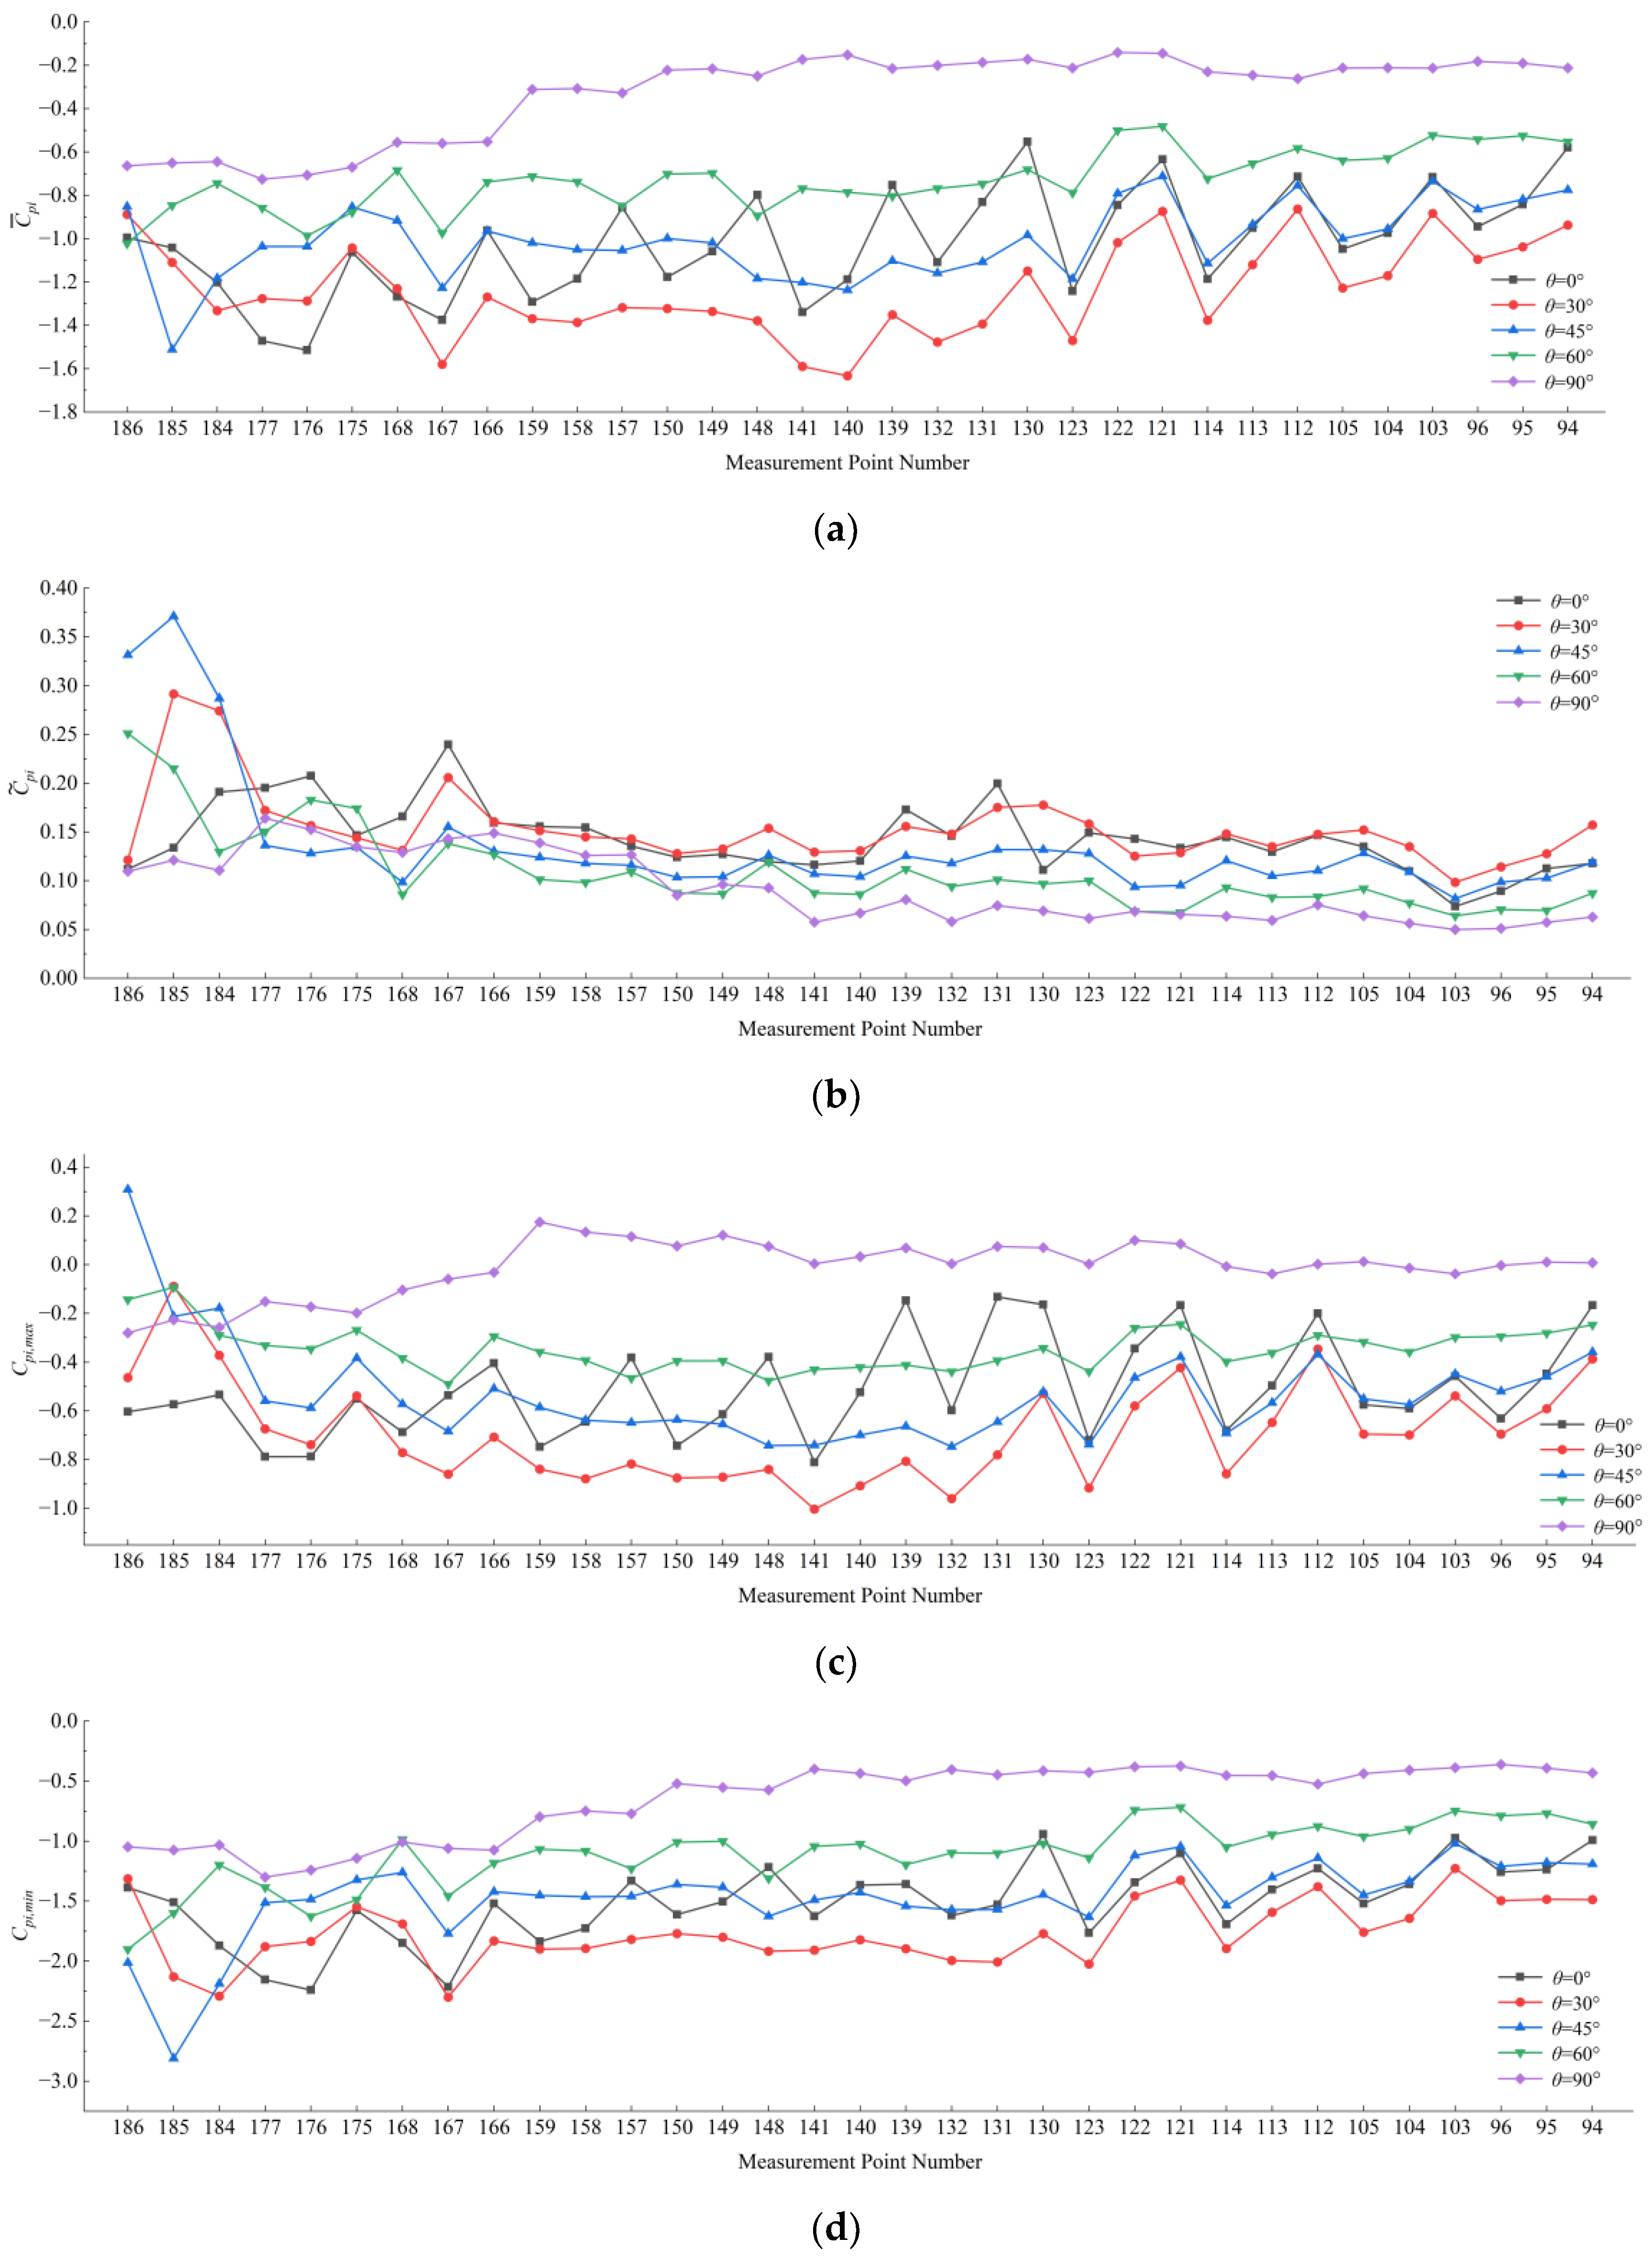
As shown in
Figure 8, wind direction has a significant influence on the pressure distribution in the ridge region. This region is located in the middle part of the roof, where the airflow often accelerates and undergoes local separation as it passes around the structure. Therefore, the wind pressure in this region is relatively sensitive to the incoming flow direction.
Figure 8a shows that measurement points near the gable ends, such as points 185, 184, 177, and 176, are subjected to stronger suction than those in the central ridge region. In addition, the suction generally decreases with increasing distance from the local leading edge relative to the incoming flow direction.
Figure 8b shows that, under oblique winds, the fluctuating wind pressure coefficients near the gable ends are significantly higher than those under 0° and 90°. In particular, at a wind direction angle of 45°, point 185 reaches the maximum value of 0.37. This indicates that the ridge-end regions are strongly affected by three-dimensional separated flow and local vortex disturbances under oblique wind conditions.
Figure 8c,d show that the measurement points closest to the incoming flow direction under oblique winds exhibit the largest absolute peak pressure coefficients. When the wind direction angle is 30°, the maximum wind pressure coefficient at point 141 reaches 1.00, whereas at 45°, point 185 reaches a minimum wind pressure coefficient of −2.81.
These results suggest that the ridge region, especially near the gable ends, is governed by three-dimensional flow effects rather than purely two-dimensional roof separation. Under oblique winds, lateral flow along the roof and local separated-flow disturbances near the ridge ends amplify both pressure fluctuations and local peak suctions.
3.2.3. Corner Area
As shown in
Figure 9, the measurement points in the windward roof-corner region are most strongly affected by wind direction.
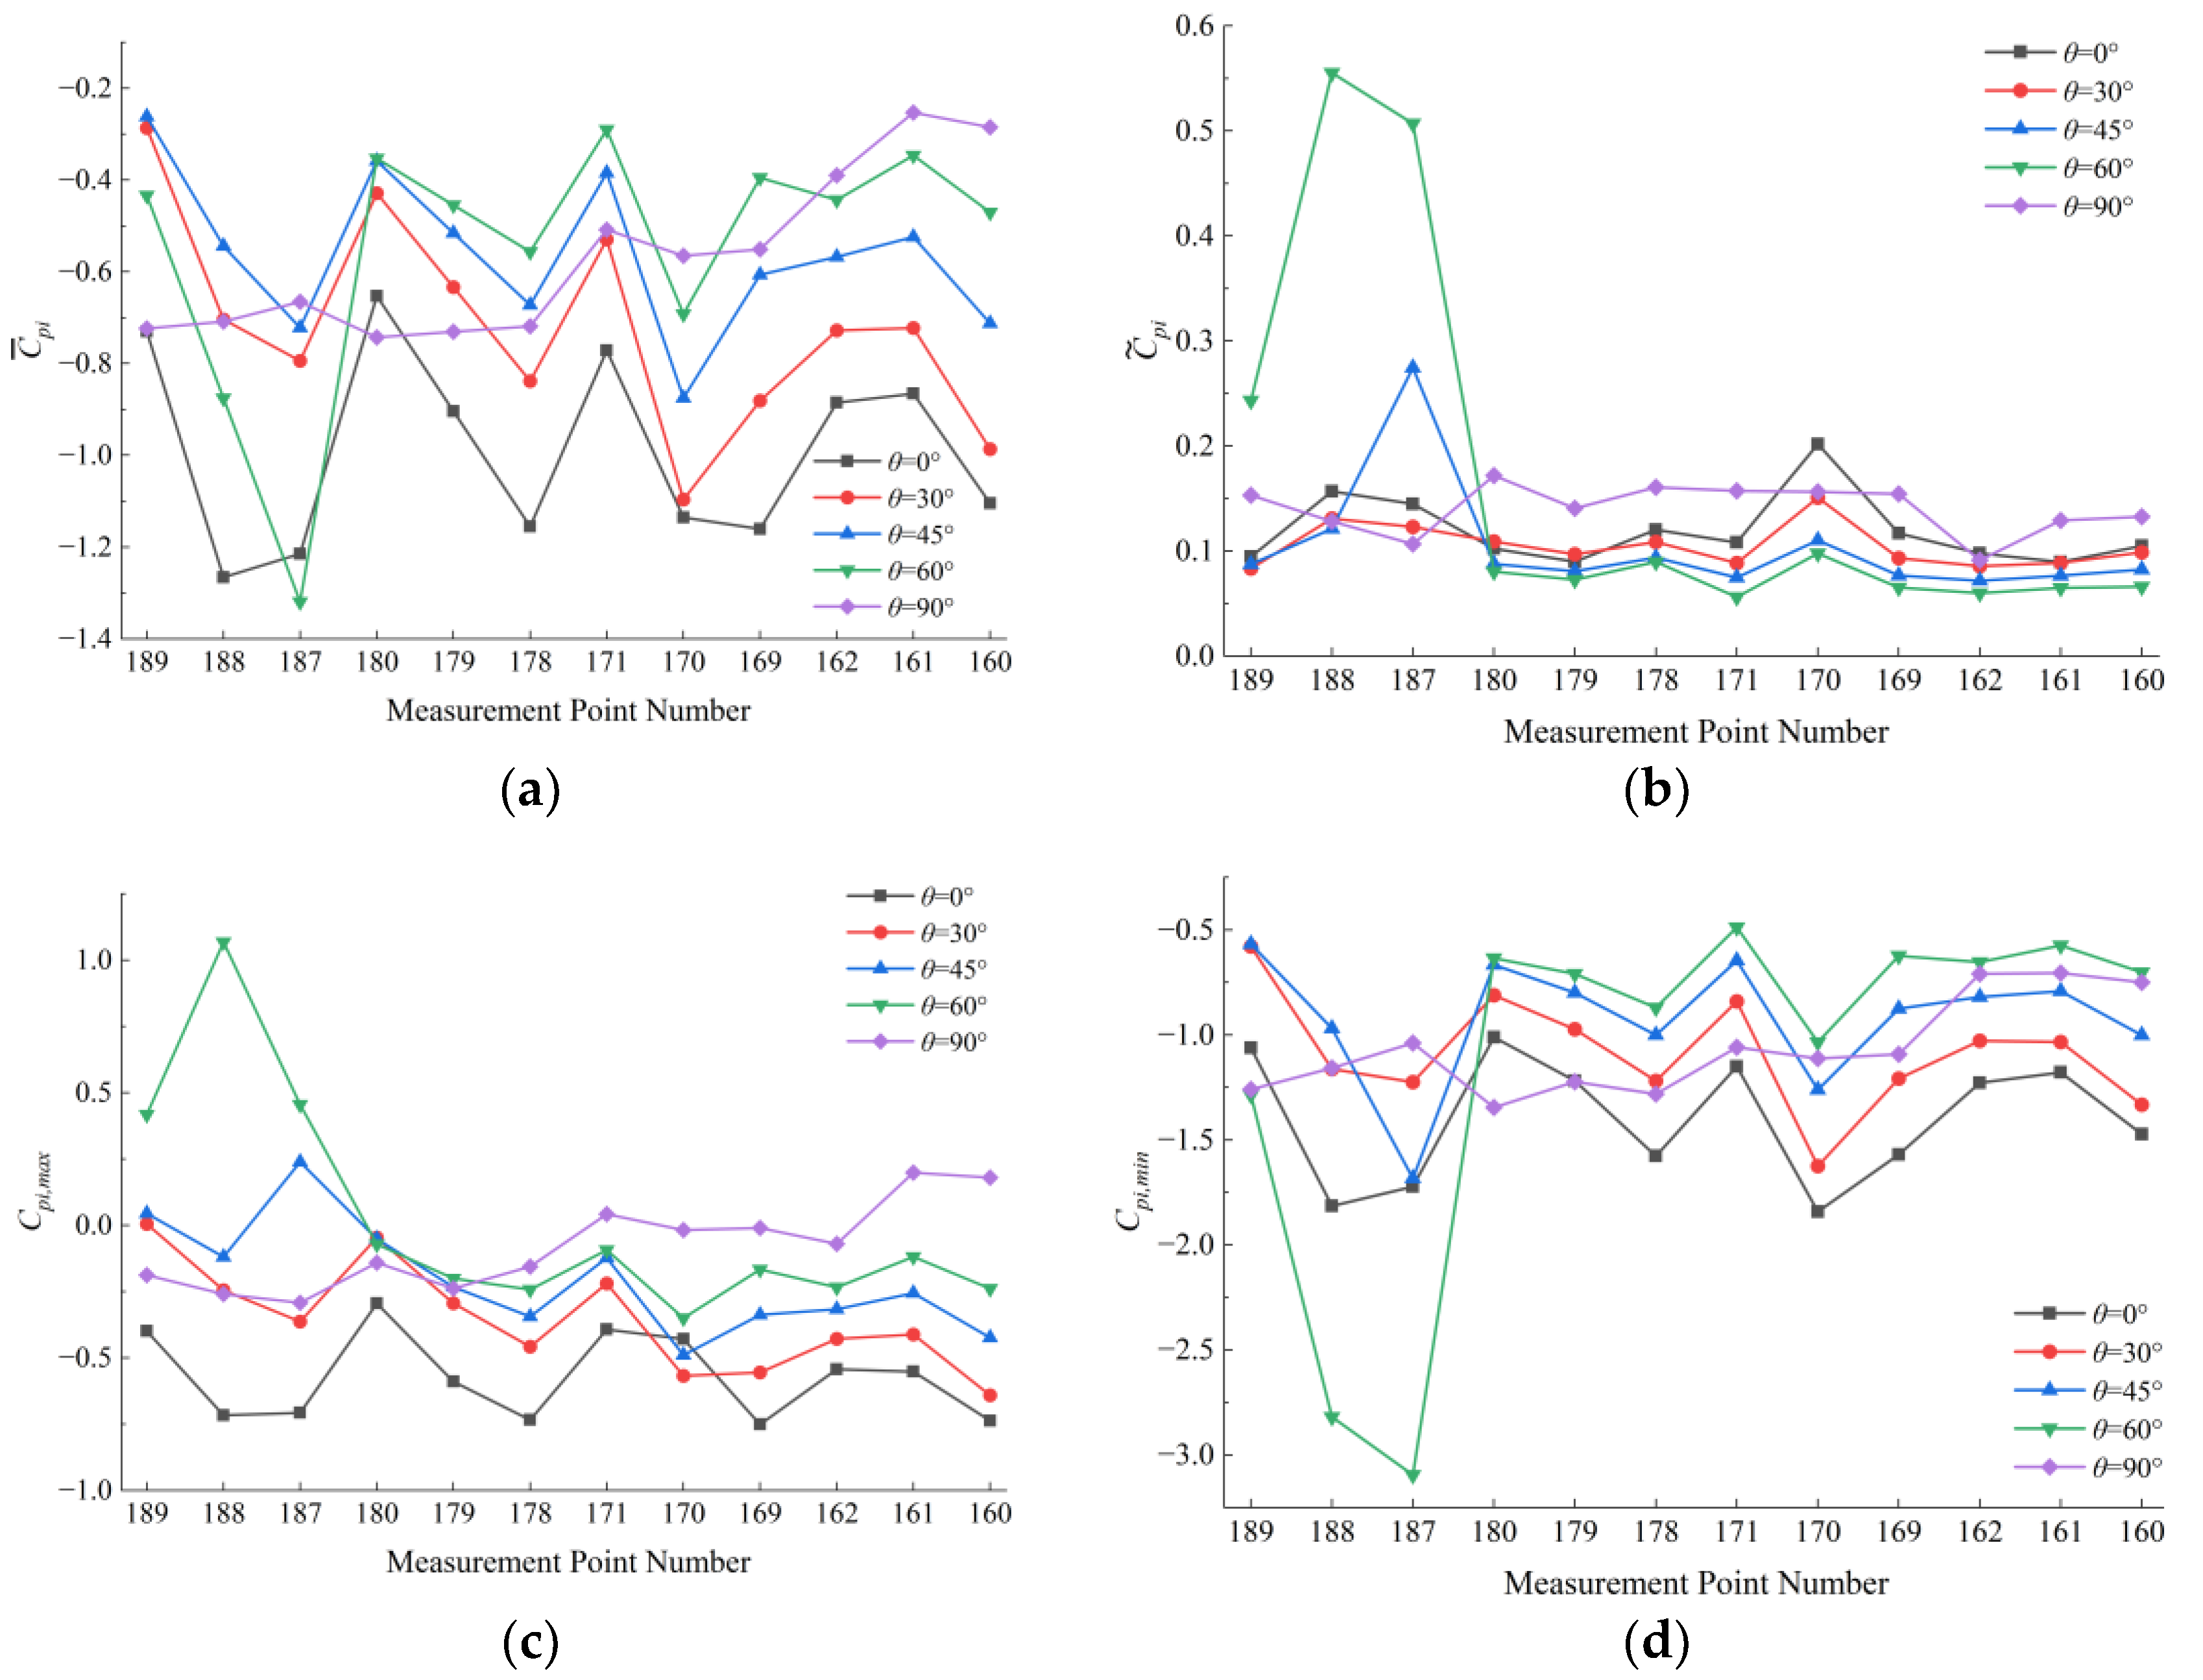
Figure 9a shows that, when the wind direction angle is 0°, the measurement points closer to the windward separation zone exhibit larger absolute values of the mean wind pressure coefficient. Specifically, points 188, 187, and 178 reach absolute mean wind pressure coefficients of 1.26, 1.21, and 1.16, respectively. Under oblique winds, the pressure coefficients in the roof-corner region change significantly. In particular, at a wind direction angle of 60°, point 187 reaches the largest absolute mean wind pressure coefficient of 1.32. In general, the absolute value of the mean wind pressure coefficient increases as the measurement point moves closer to the windward corner.
Figure 9b shows that the fluctuating wind pressure coefficients in the windward corner region vary significantly under oblique winds, whereas the variation is relatively small under 0° and 90°.
Figure 9c,d show that, under a wind direction angle of 60°, point 188 reaches a maximum wind pressure coefficient of 1.07, while point 187 reaches a minimum wind pressure coefficient of −3.09.
The corner region exhibits the strongest wind-direction sensitivity because it is the area where windward-edge separation, side flow, and three-dimensional local flow concentration interact most intensely. Under oblique winds, especially around 60°, this region is subjected simultaneously to direct windward loading and flow alignment along the roof surface, which is consistent with a corner-dominated three-dimensional separated-flow pattern. As a result, this region develops not only stronger mean suction but also larger pressure fluctuations and more severe negative pressure peaks. Therefore, the windward corner zone governs local cladding design under the most unfavorable loading condition.
3.3. Effect of Different Terrains on the Wind Pressure of Greenhouse Roof
To investigate the wind pressure characteristics of the arched plastic-film greenhouse roof under different terrain conditions, the wind pressure coefficients at local roof measurement points were analyzed for wind direction angles of 0°, 30°, 45°, 60°, and 90°.
In general, terrain-induced turbulence intensity affects different pressure statistics in different ways. The mean wind pressure coefficient is mainly governed by the time-averaged separation topology over the roof and therefore changes only moderately with increasing turbulence intensity. By contrast, the fluctuating and peak wind pressure coefficients are much more sensitive to the unsteady behavior of the separated flow. Stronger incoming turbulence can intensify shear-layer oscillation, enhance the instability of local corner and ridge-end flow structures, and increase the intermittency of extreme suction events. As a result, high-turbulence terrain mainly amplifies fluctuating and peak suctions, especially in the windward roof edge, roof corner, and near-gable ridge-end regions.
3.3.1. Wind Direction Angle of 0°
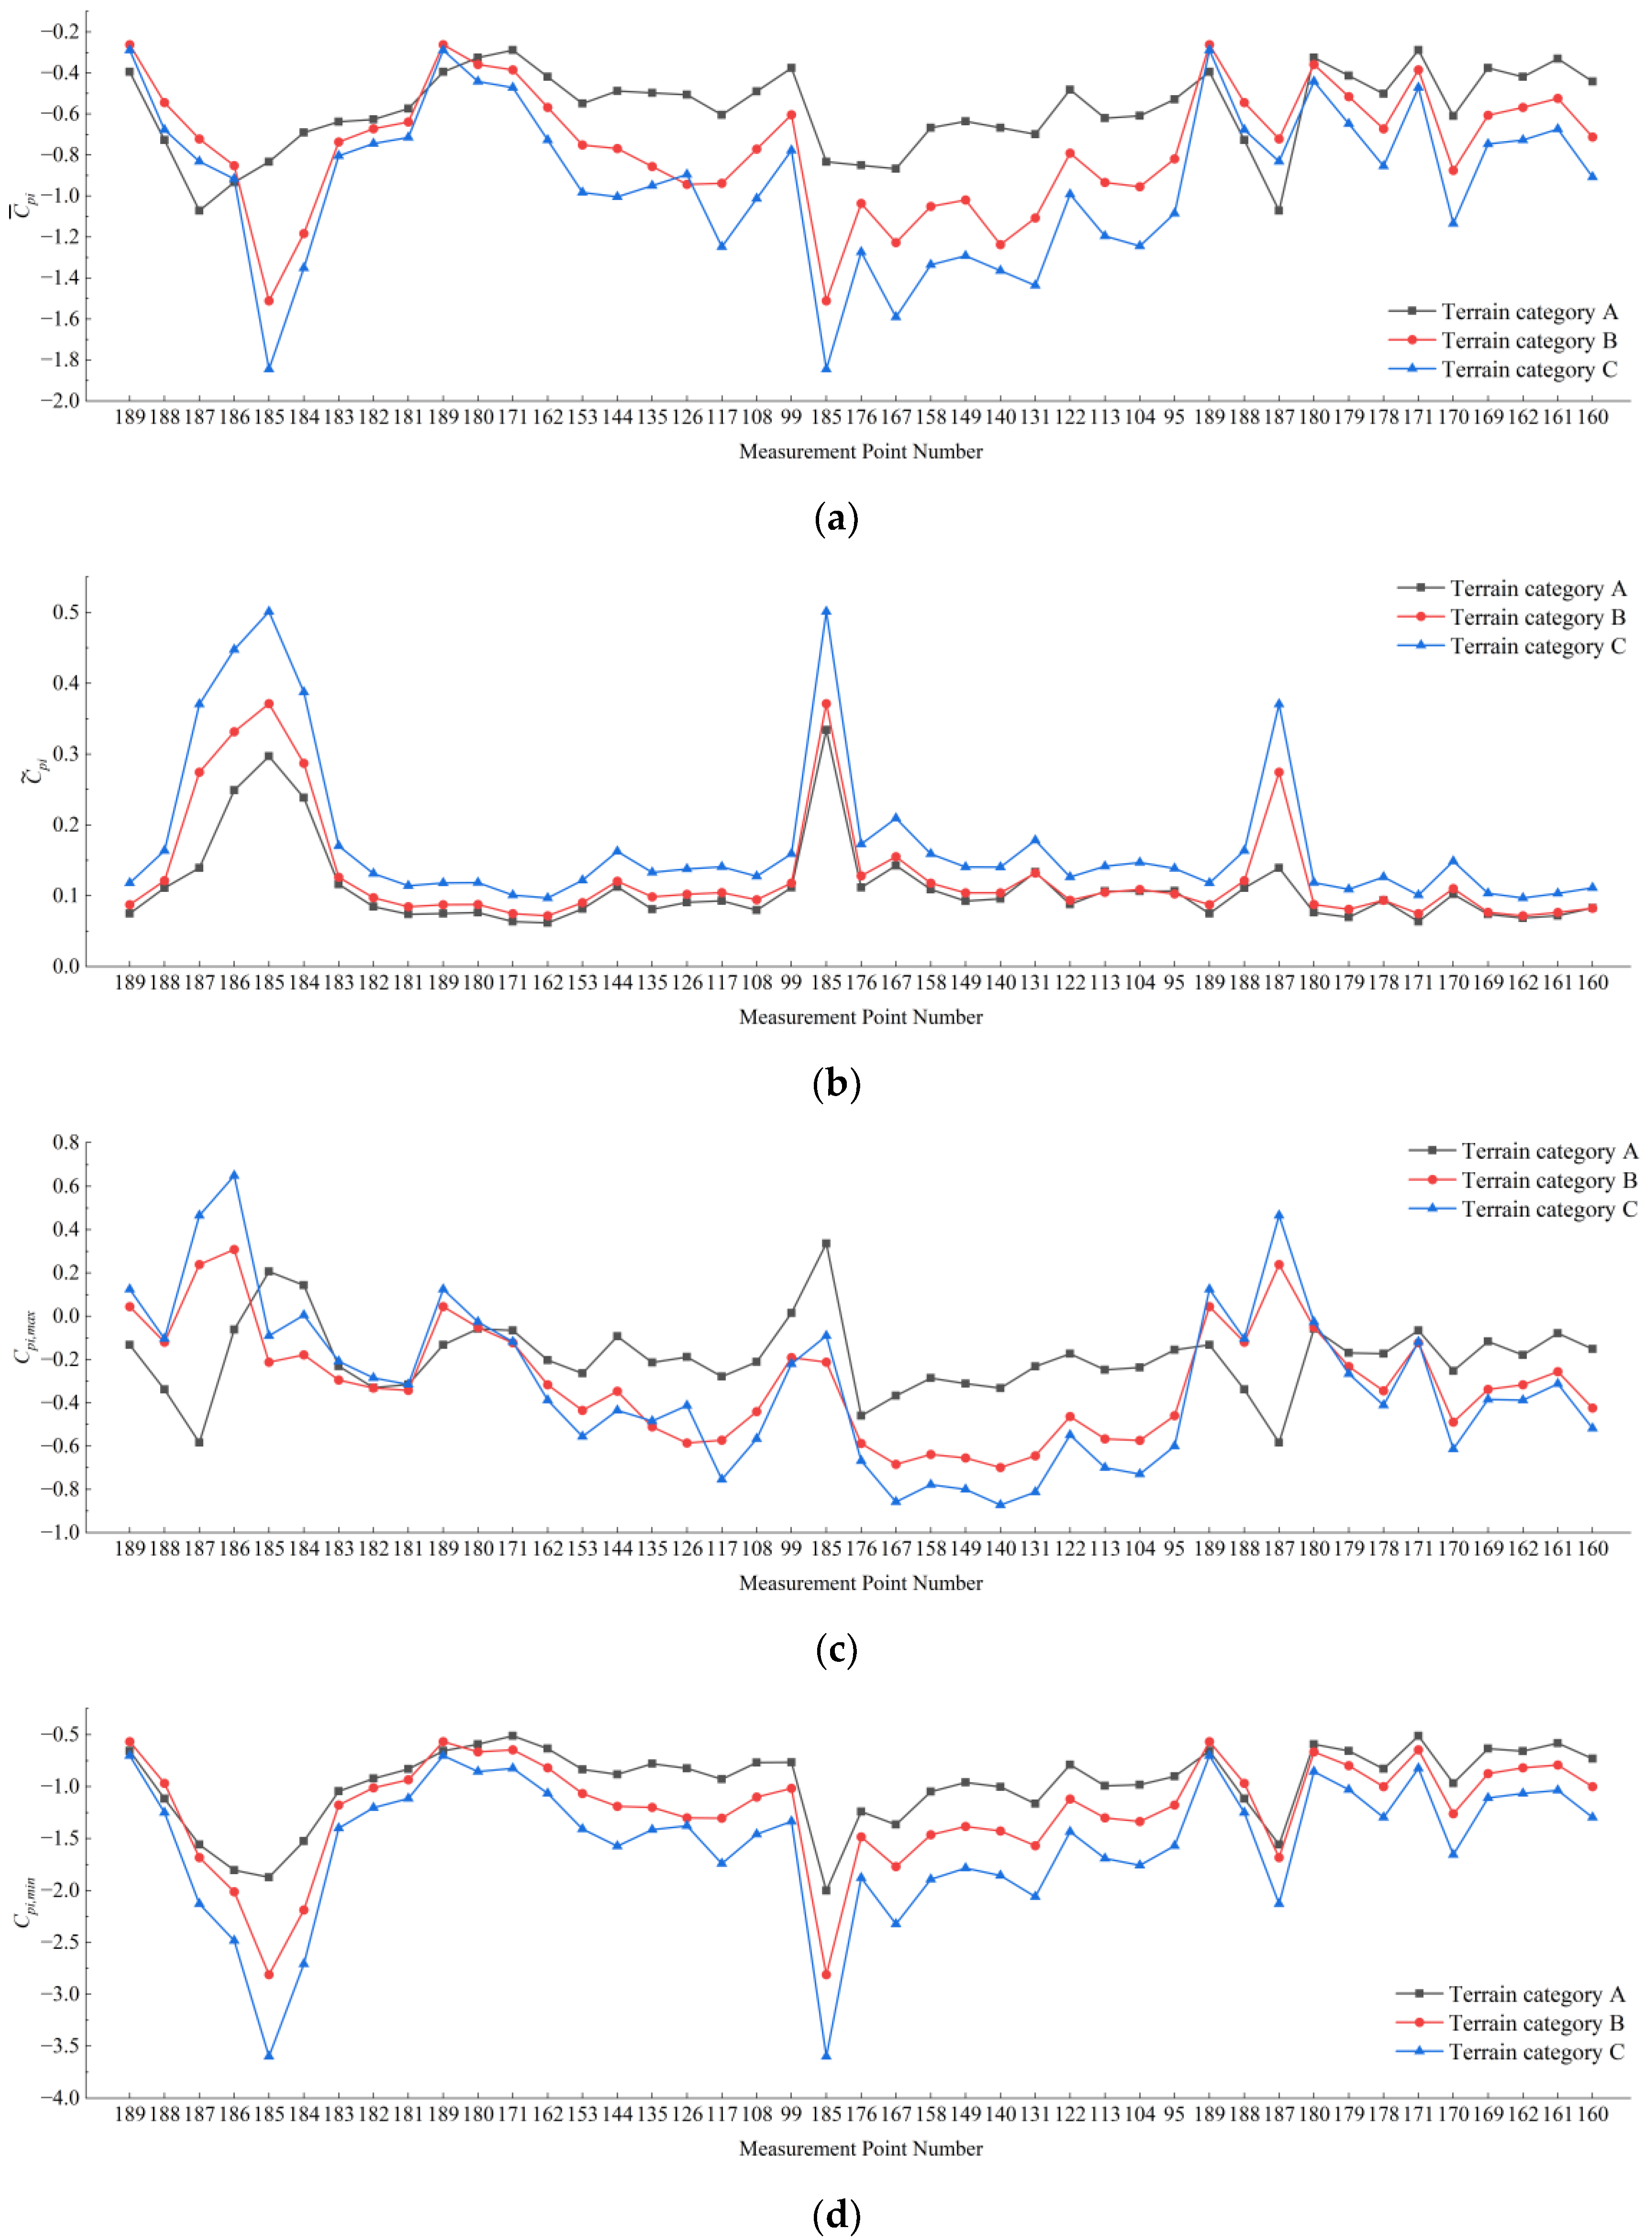
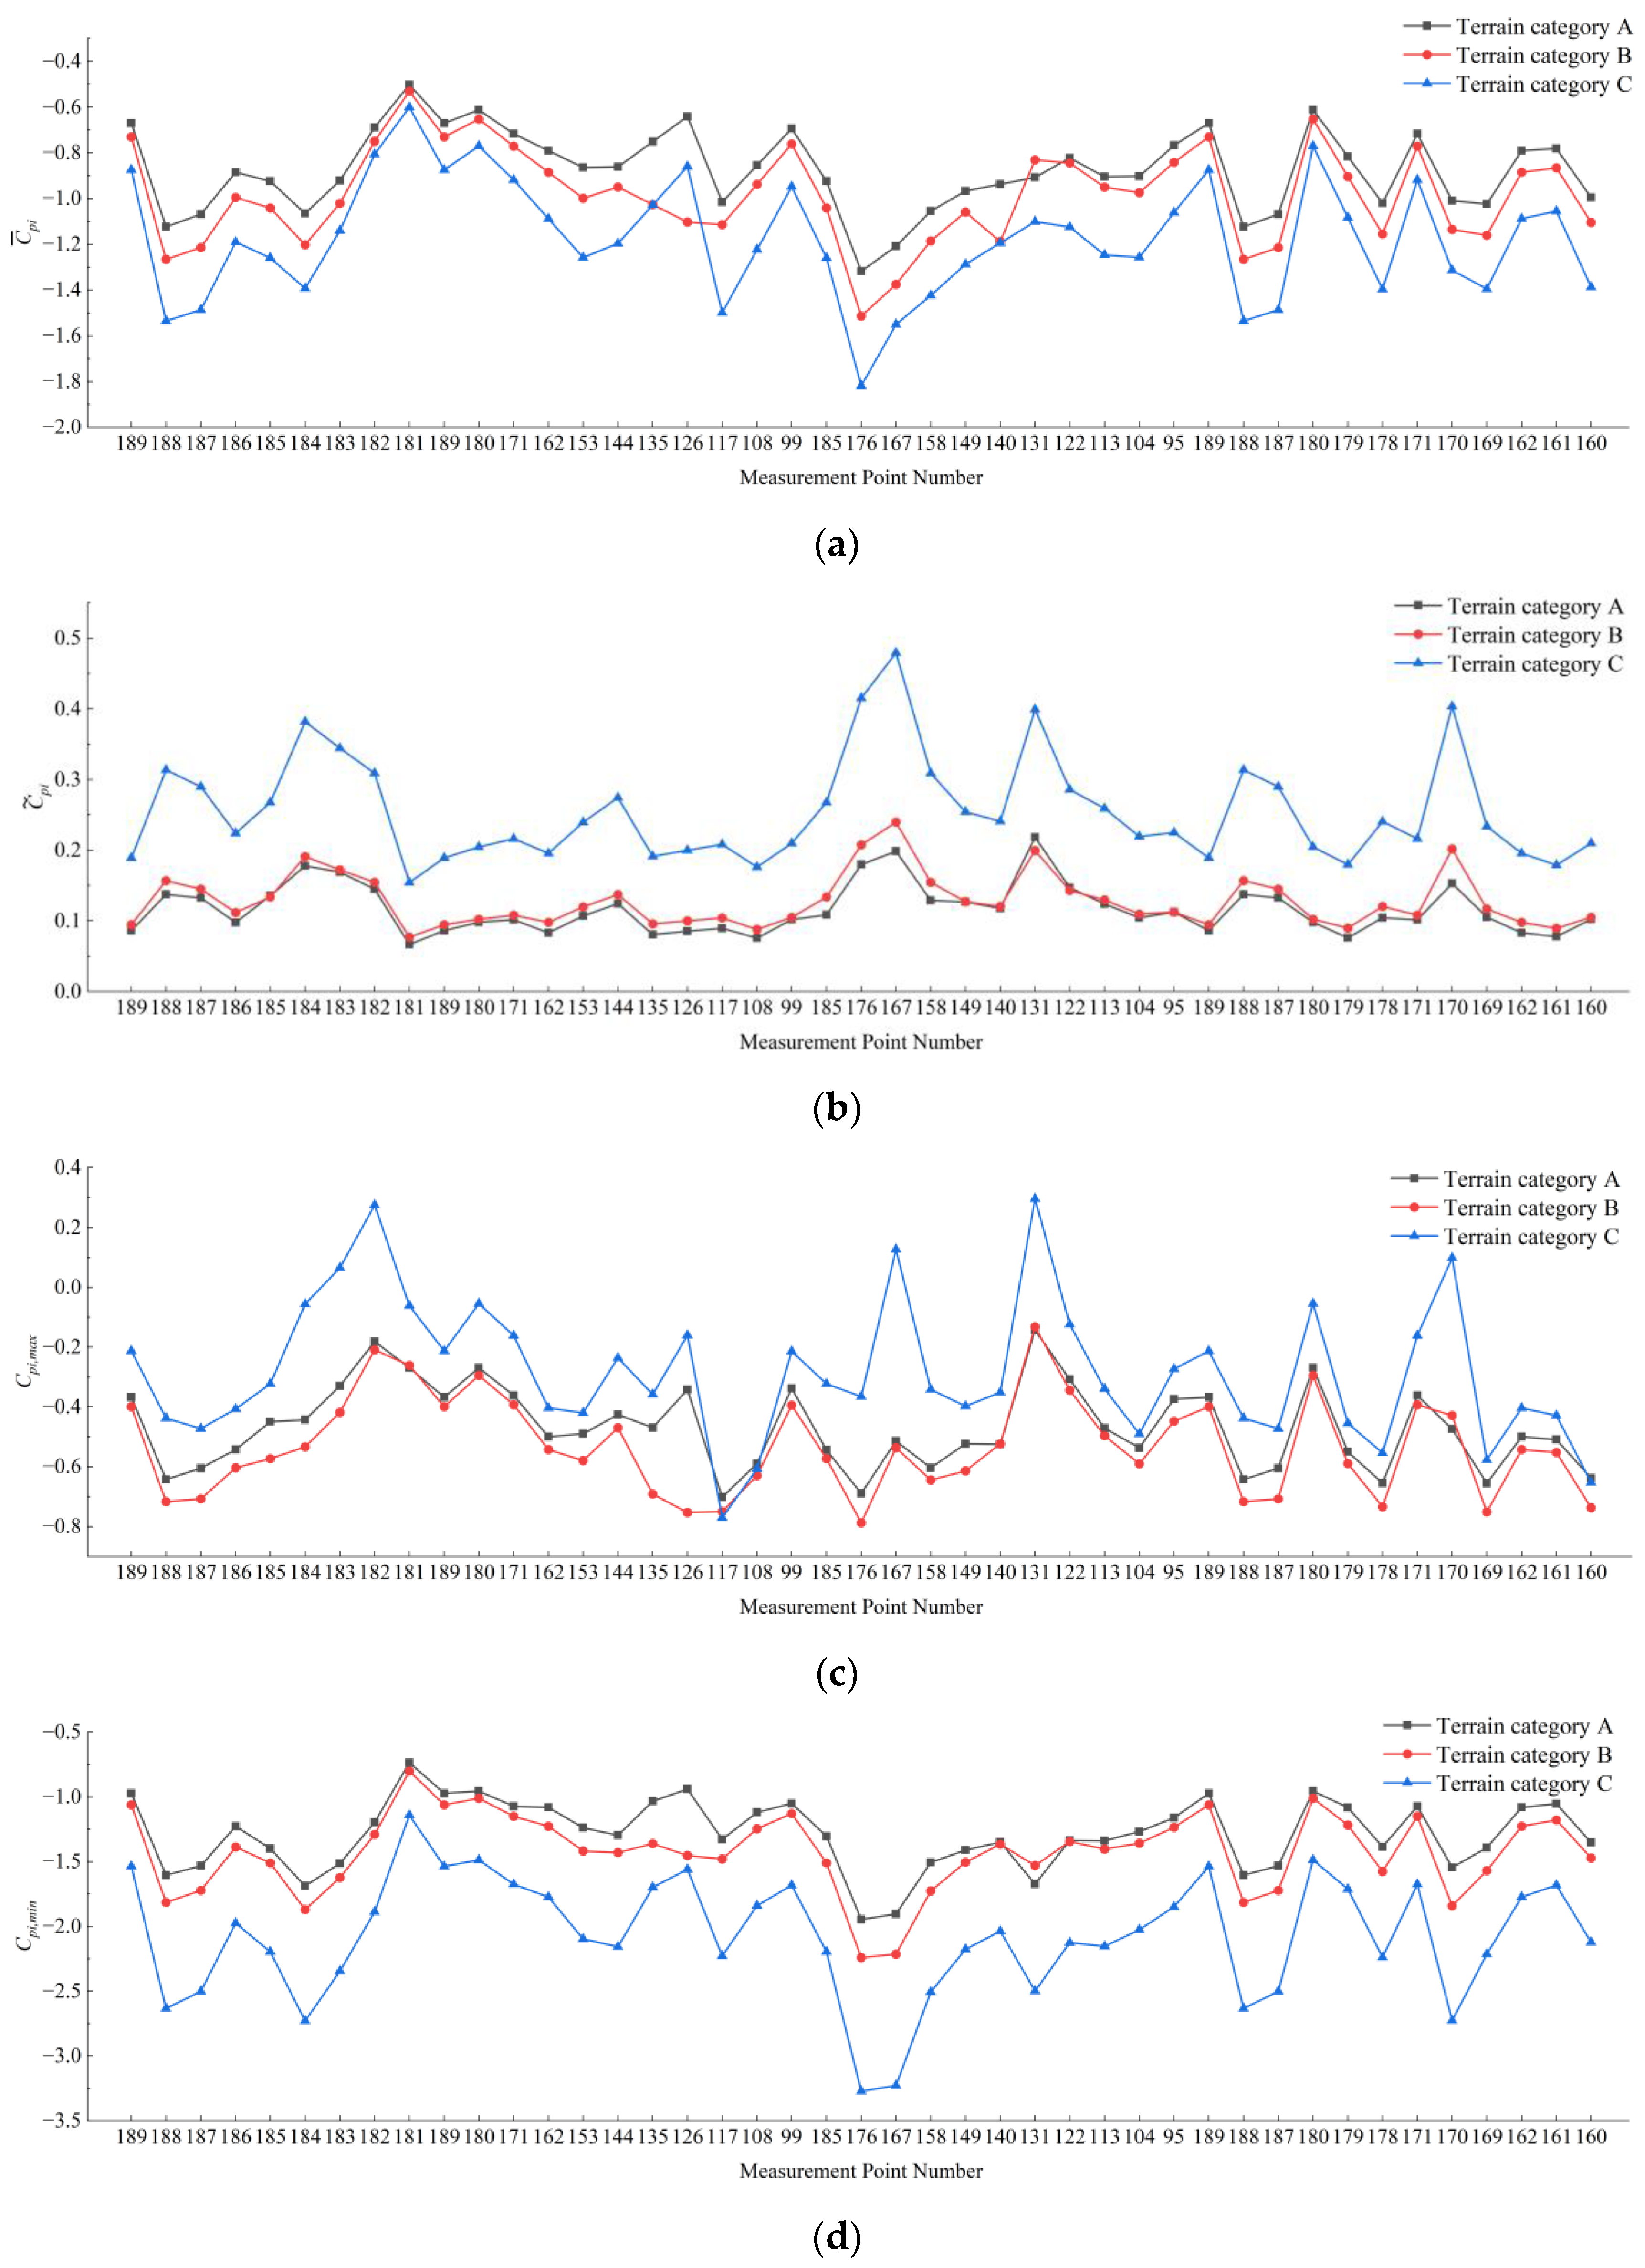
The influence of different terrains on the wind pressure coefficients at local measurement points on the greenhouse roof under a 0° wind direction angle is presented in
Figure 10.
As shown in
Figure 10a, under a 0° wind direction angle, changes in terrain category have a significant influence on the mean wind pressure coefficients in the leading edge of Zone IV (windward roof area) and Zone I (corner area), while their impact on the side edges of Zone II (short-side roof area) and Zones II and V (ridge area) is relatively minor. This indicates that when the airflow is perpendicular to the long side of the roof, the effect of terrain on the mean wind pressure coefficients is primarily concentrated in the windward roof region.
As shown in
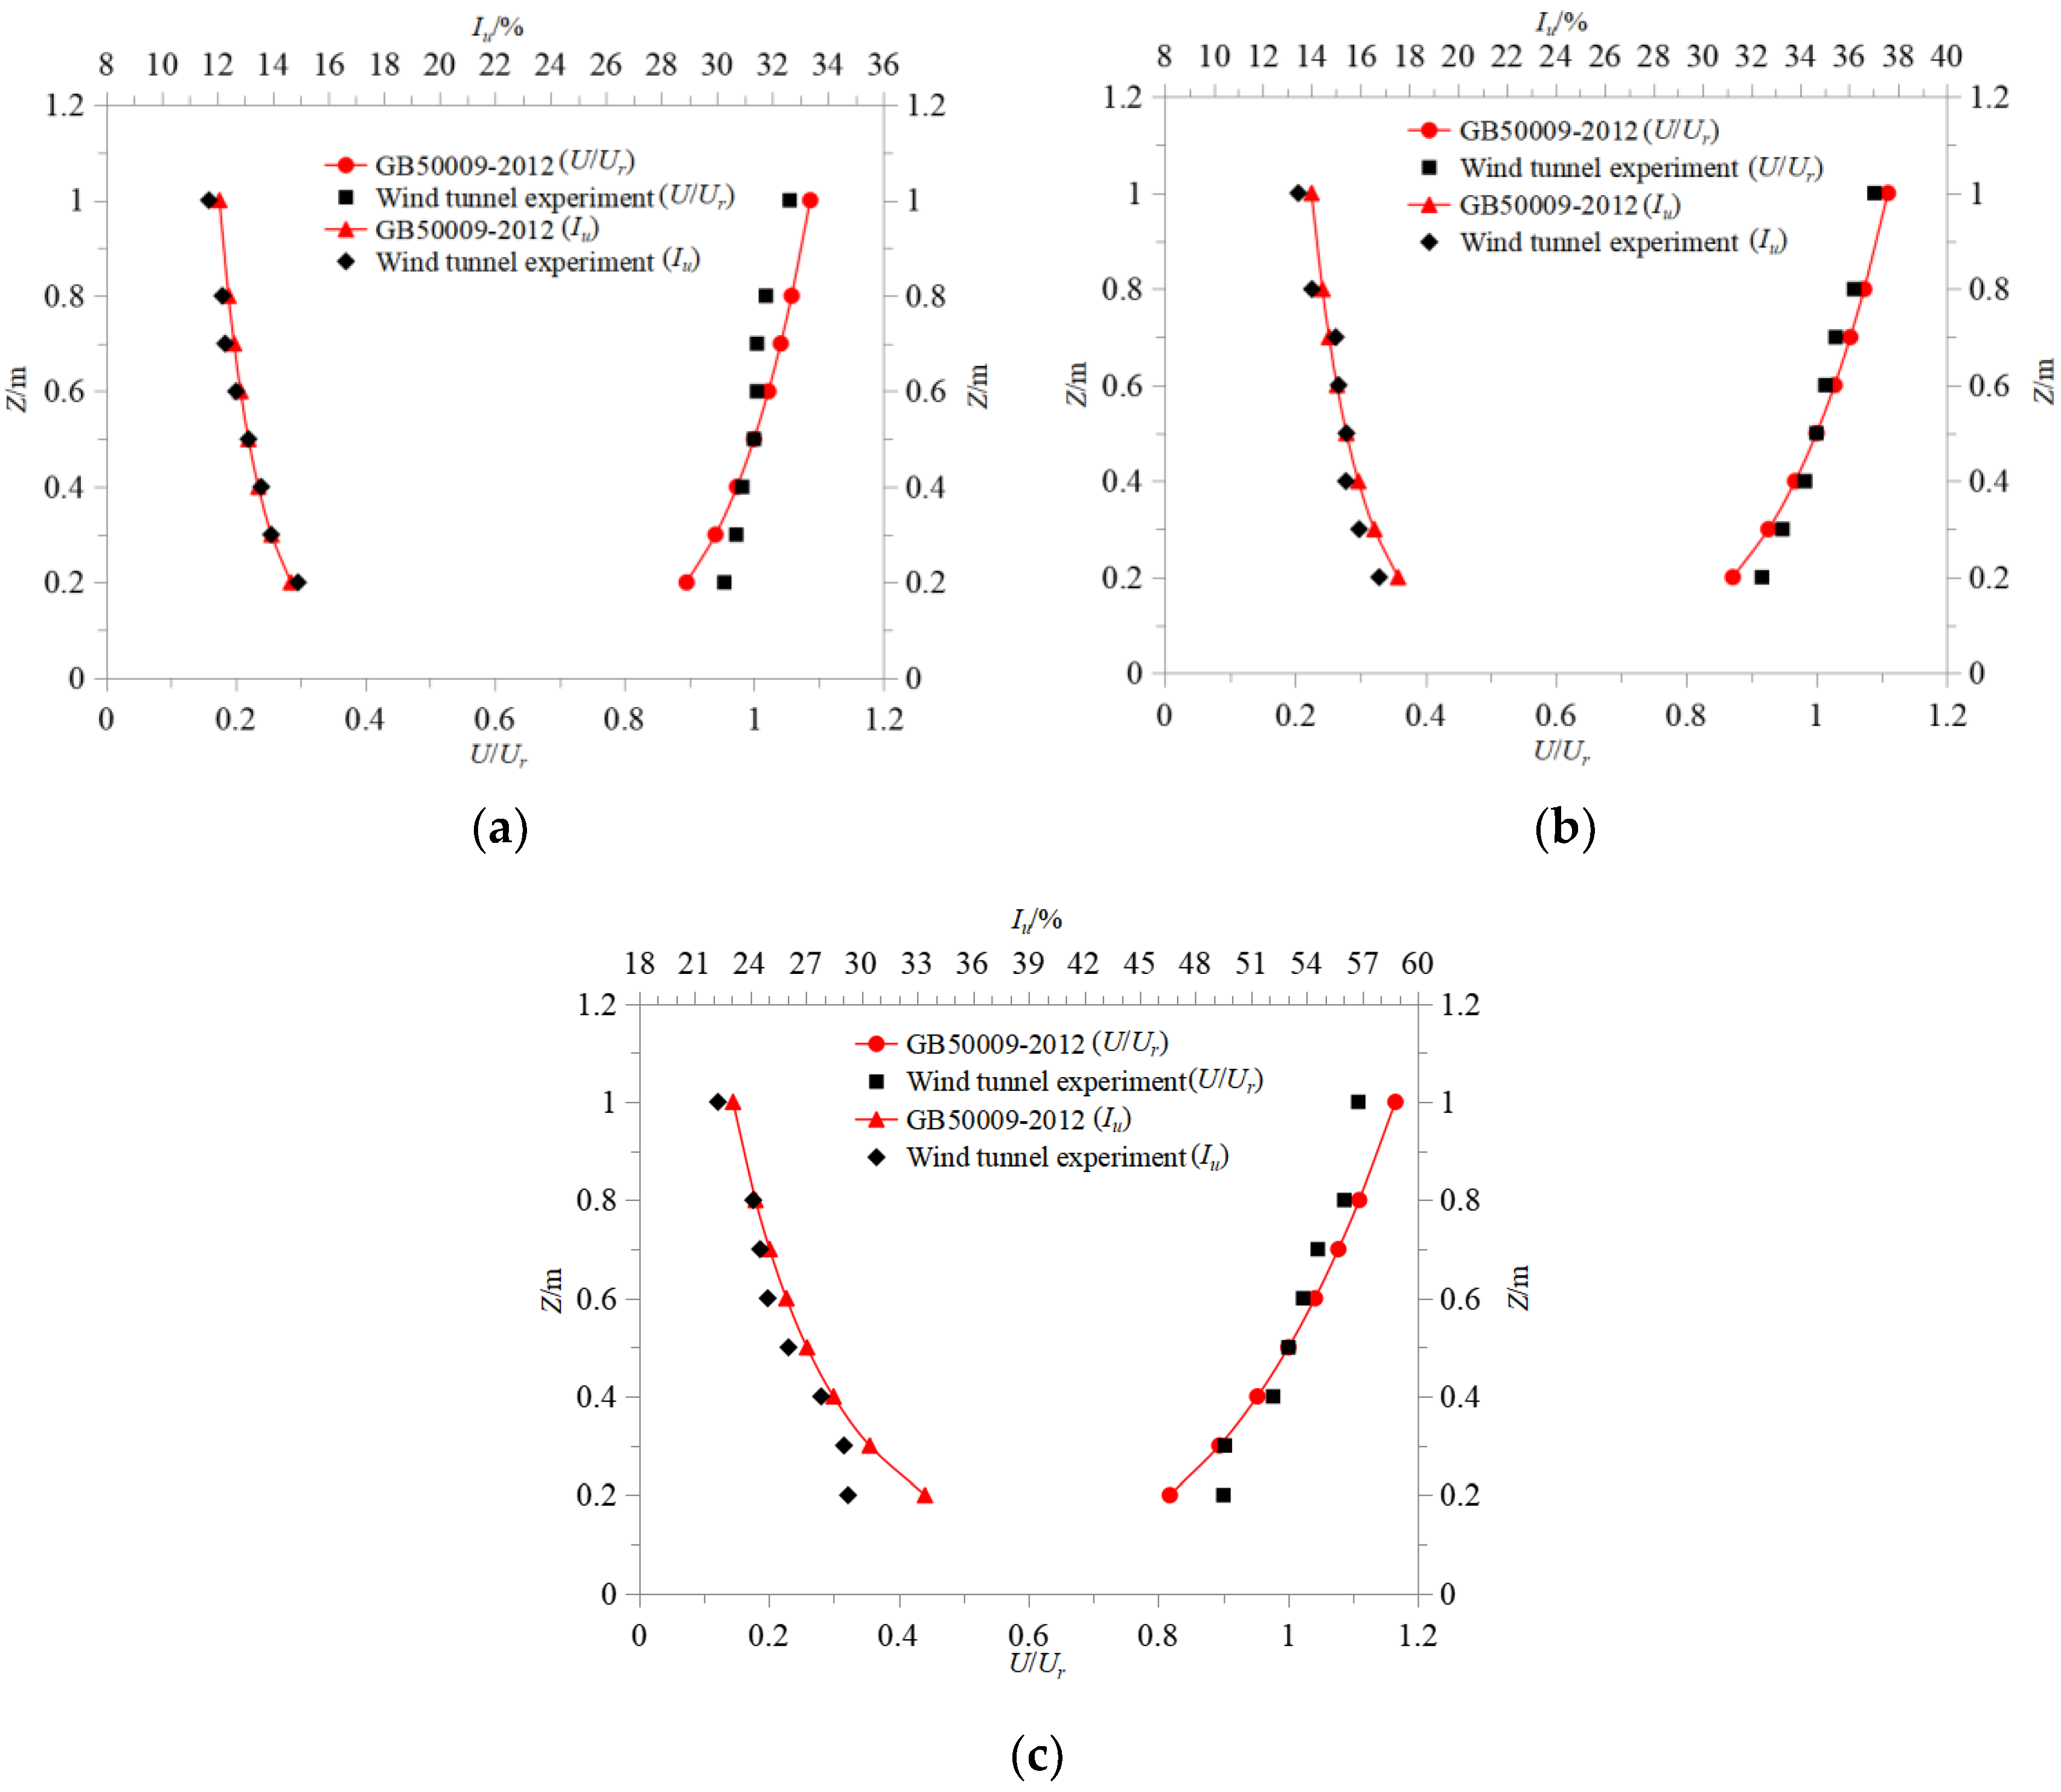
Figure 10b–d, changes in terrain types exert a more significant influence on the fluctuating and peak wind pressure coefficients. The absolute values of the mean, fluctuating, and peak wind pressure coefficients generally increase as the terrain transitions from category A to category C. The turbulence intensities at a height of 10 m are 11.7% for category A and 13.5% for category B, which are relatively close. Consequently, the variations in wind pressure coefficients under category A and B wind fields are not substantial. In contrast, the turbulence intensity for terrain category C is 22.3% at 10 m height, leading to significant differences in the measured wind pressure coefficients under terrain category C wind fields compared to those under terrain categories A and B. Under terrain category C, measurement point 176 exhibits the largest absolute values for both the mean wind pressure coefficient and the minimum wind pressure coefficient, reaching 1.82 and 3.3, respectively. Meanwhile, measurement point 167 attains the maximum fluctuating wind pressure coefficient of 0.48.
This indicates that under normal wind, terrain turbulence does not fundamentally alter the dominant windward-edge separation pattern, but it does enhance the unsteady response of the separated flow, thereby increasing the fluctuating and peak pressure coefficients.
3.3.2. Wind Direction Angle of 30°
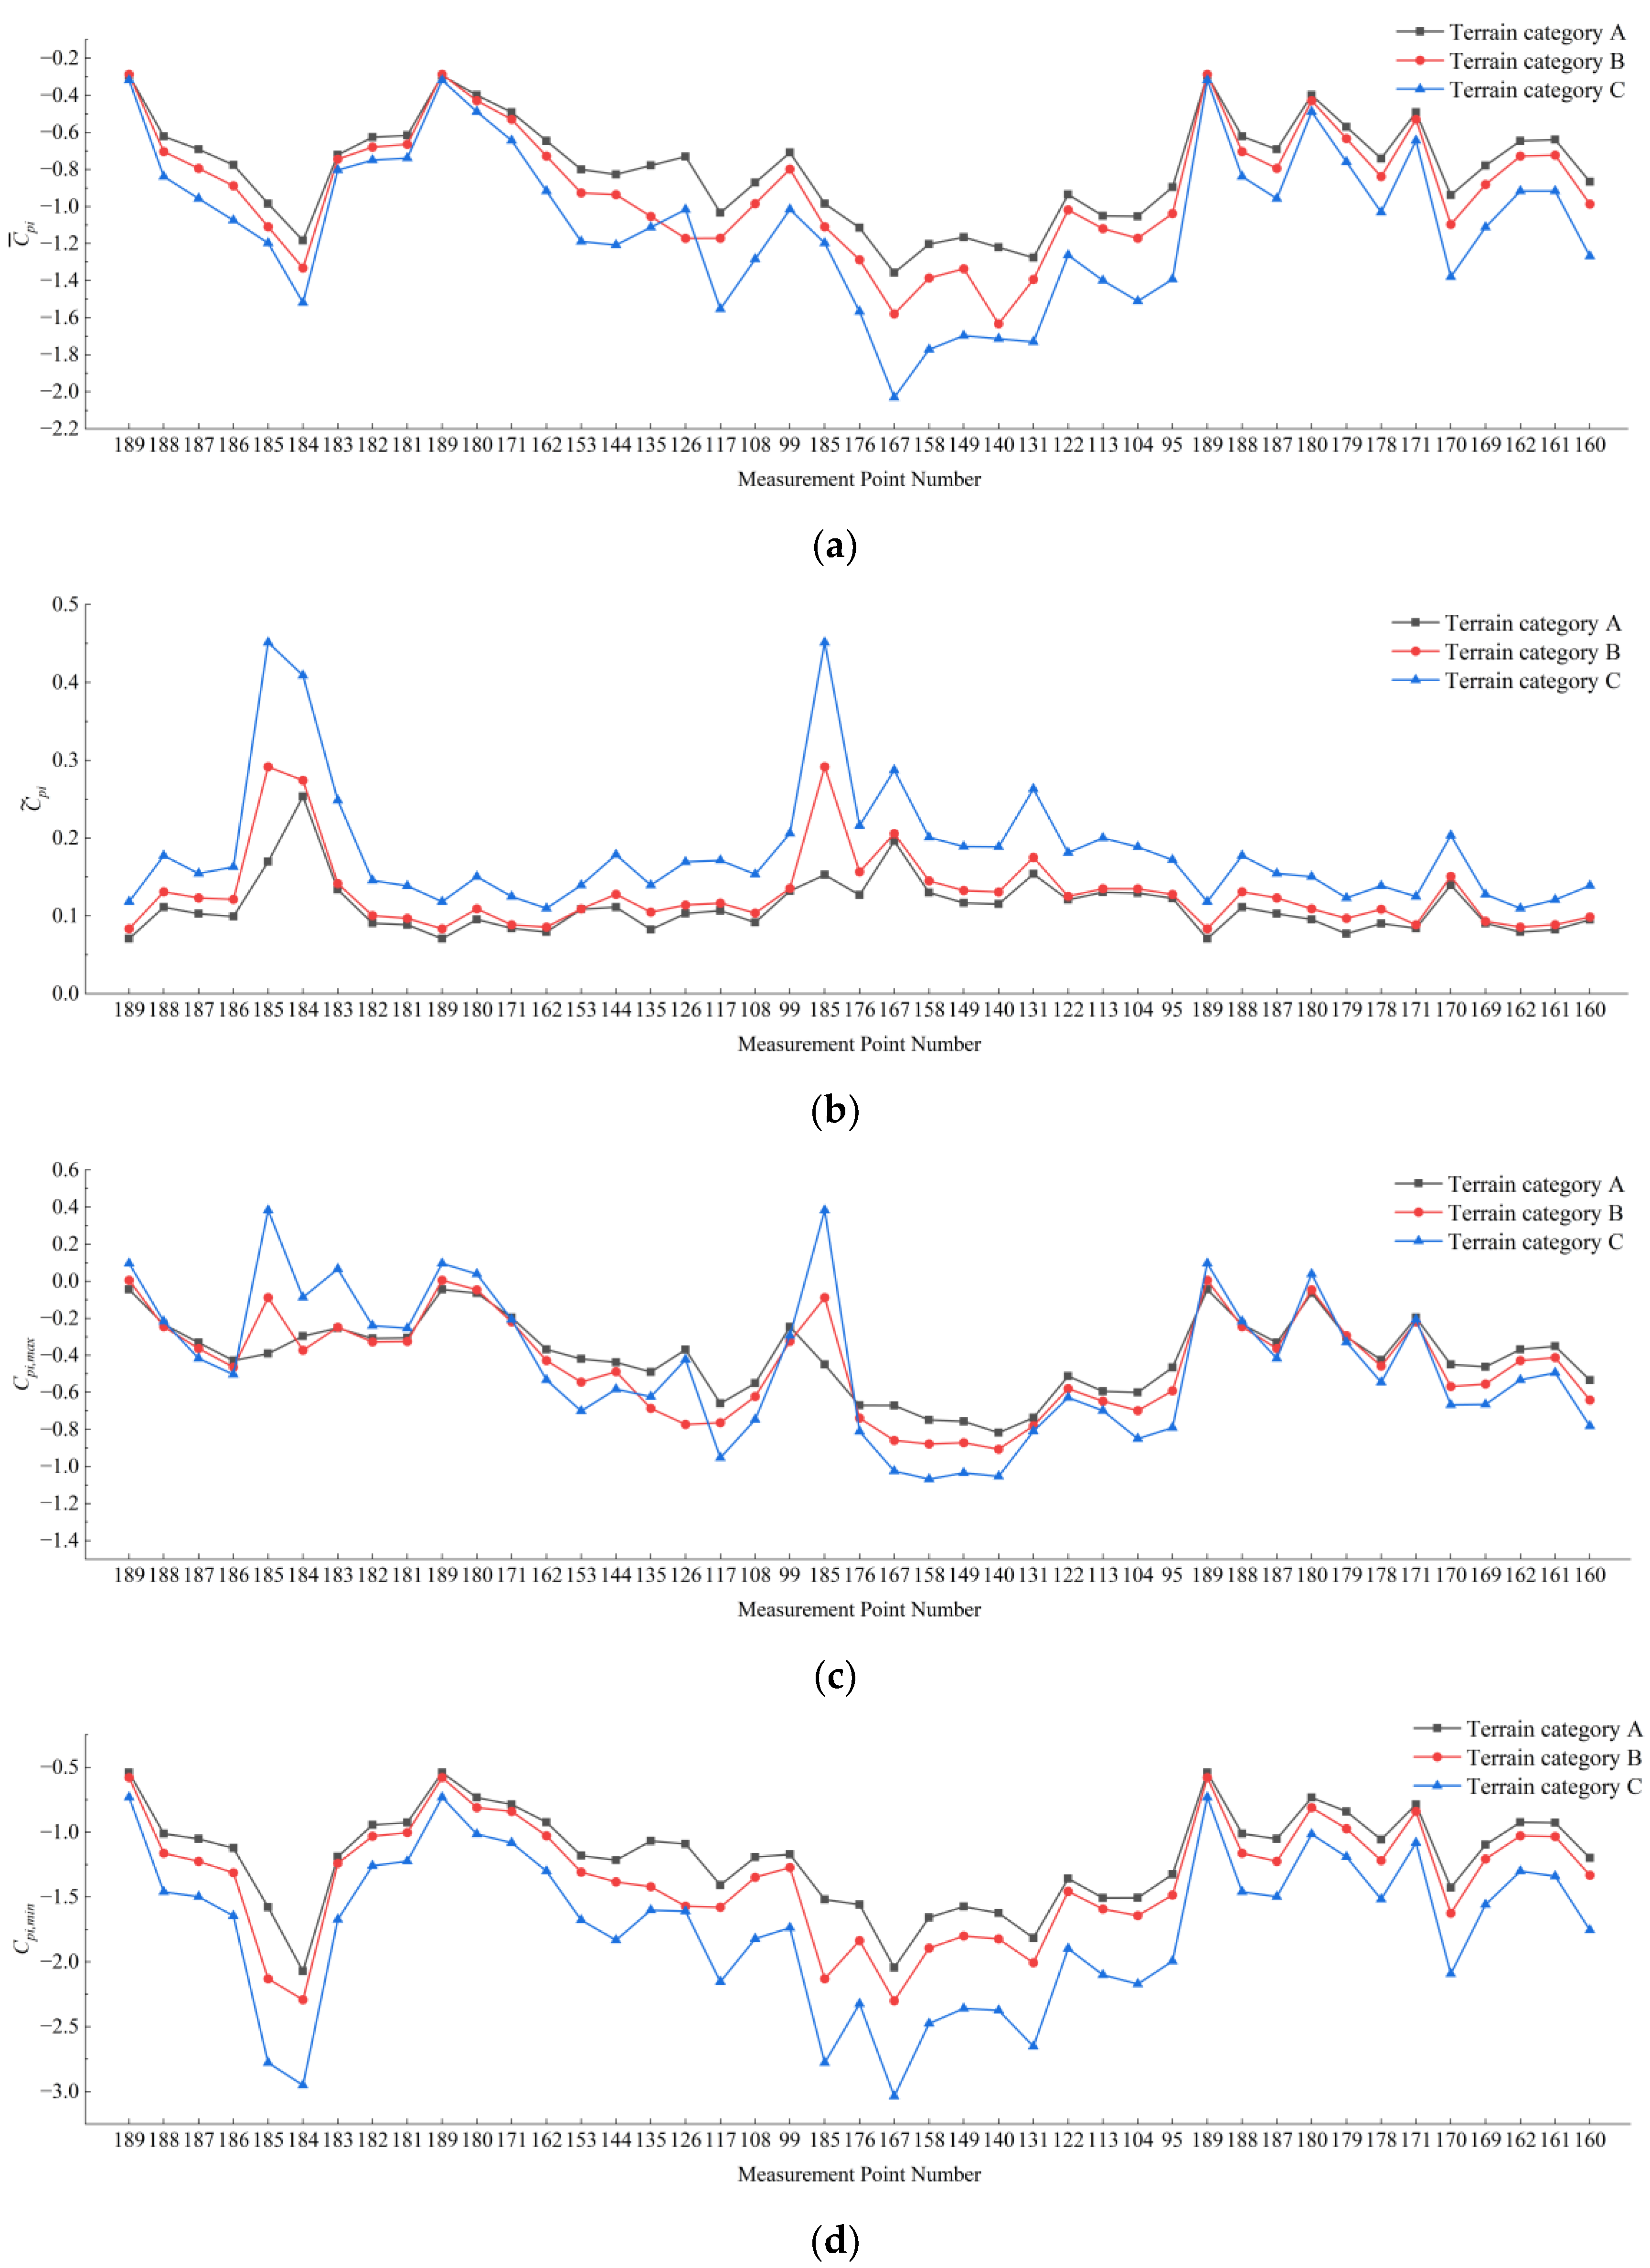
The influence of different terrains on the wind pressure coefficients at local measurement points on the greenhouse roof under a 30° wind direction angle is presented in
Figure 11.
As shown in
Figure 11a, changes in terrain category have a significant influence on the mean wind pressure coefficients in the leading edge of the windward roof area and the ridge zone of the greenhouse. Among these, measurement point 167 under terrain category C exhibits the largest absolute value of the mean wind pressure coefficient, reaching 2.03.
As shown in
Figure 11b–d, changes in terrain category have a significant influence on the fluctuating and peak wind pressure coefficients at the measurement points on the greenhouse roof. As the terrain transitions from category A to category C, the turbulence intensity gradually increases, leading to a corresponding rise in the absolute values of both the fluctuating and peak wind pressure coefficients at the roof measurement points. Under terrain category C, the fluctuating wind pressure coefficient at measurement point 185 reaches a maximum value of 0.45, the absolute value of the maximum wind pressure coefficient at measurement point 158 attains its peak of 1.07, and measurement point 167 exhibits the largest absolute value of the minimum wind pressure coefficient, which is 3.0.
The amplification observed under terrain category C suggests that stronger incoming turbulence increases the unsteadiness of the oblique separated flow and intensifies local suction intermittency near the windward roof and ridge regions.
3.3.3. Wind Direction Angle of 45°
The influence of different terrains on the wind pressure coefficients at local measurement points on the greenhouse roof under a 45° wind direction angle is presented in
Figure 12.
As shown in
Figure 12a, when the wind direction angle is 45°, changes in terrain types have a significant influence on the mean wind pressure coefficients in the ridge area of the greenhouse. Among these, measurement point 185 under terrain category C exhibits the largest absolute value of the mean wind pressure coefficient, reaching 1.84.
As shown in
Figure 12b–d, changes in terrain category have a significant influence on the fluctuating and peak wind pressure coefficients at the measurement points on the greenhouse roof. Among these, measurement point 185 under terrain category C exhibits the largest absolute values for both the fluctuating wind pressure coefficient and the minimum wind pressure coefficient, reaching 0.5 and 3.6, respectively. Meanwhile, measurement point 140 attains the maximum absolute value of the maximum wind pressure coefficient, which is 0.87.
At 45°, the ridge-end region becomes particularly sensitive to turbulence amplification, indicating that terrain turbulence interacts strongly with the three-dimensional separated flow near the gable-end ridge.
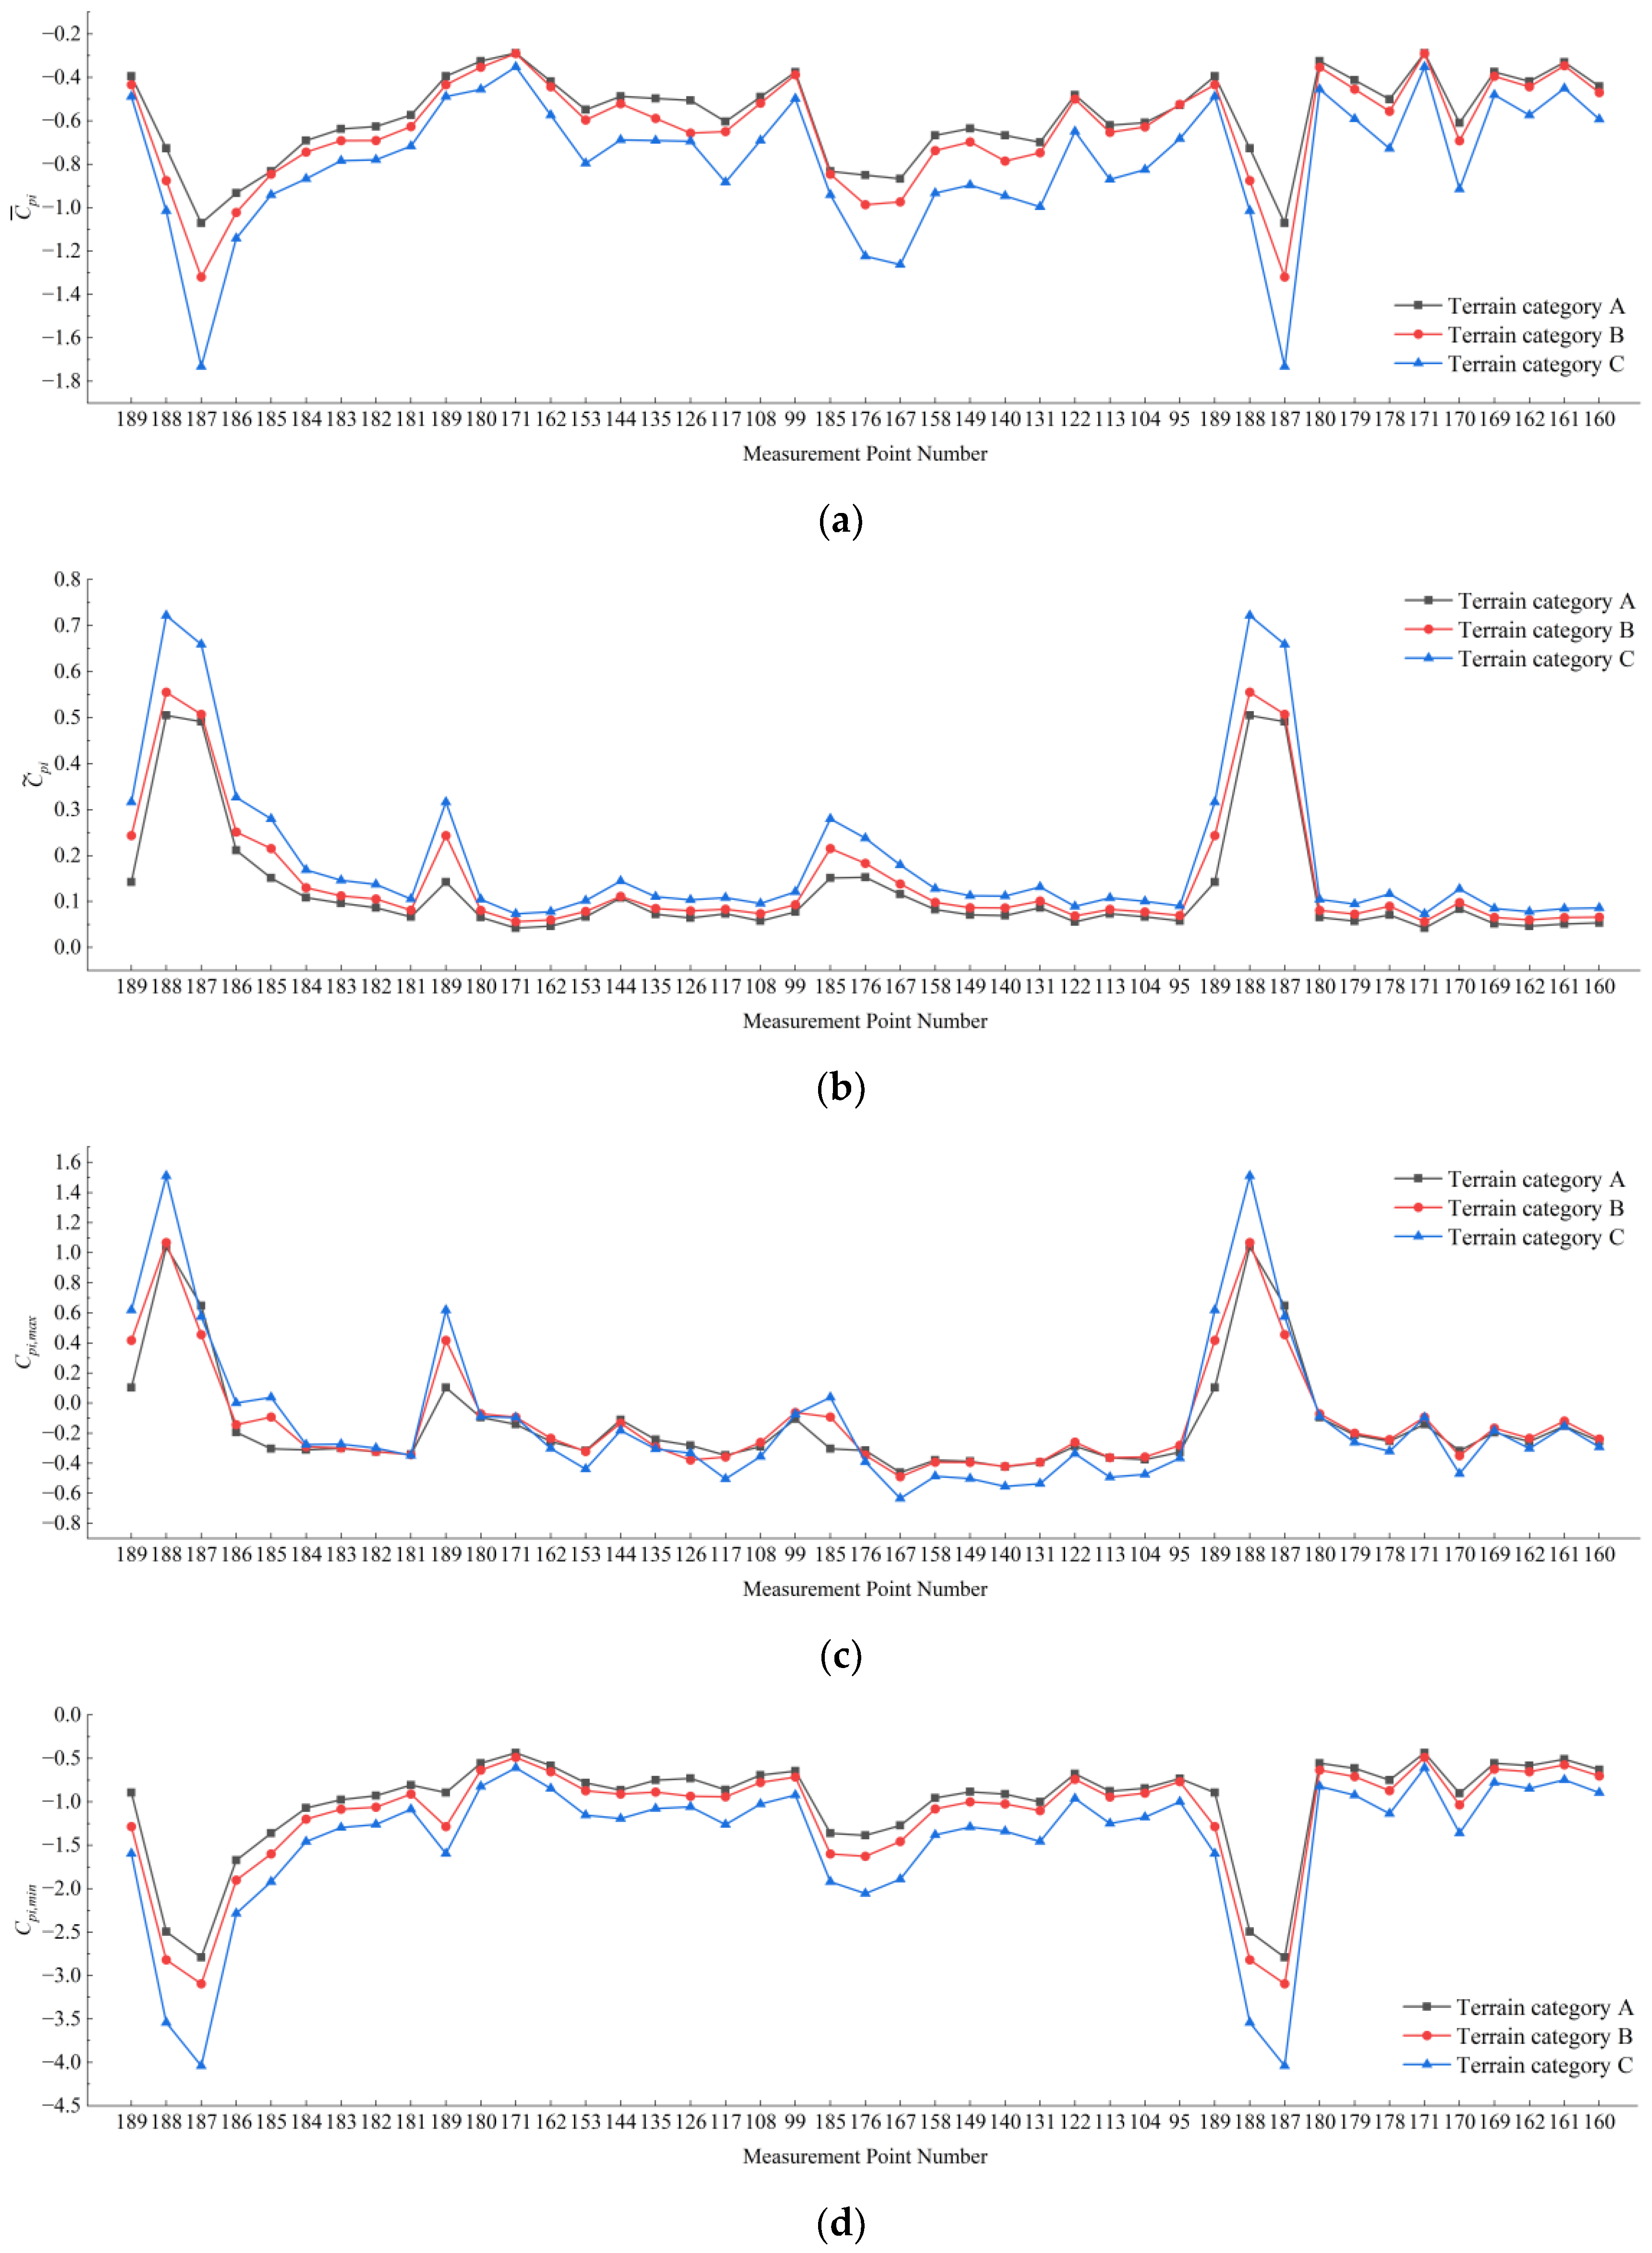
3.3.4. Wind Direction Angle of 60°
The influence of different terrains on the wind pressure coefficients at local measurement points on the greenhouse roof under a 60° wind direction angle is presented in
Figure 13.
As shown in
Figure 13a, when the wind direction angle is 60°, changes in terrain types have a significant influence on the wind pressure coefficients in the leading edge region of the windward roof and the windward corner zone of the greenhouse. Among these, the mean wind pressure coefficient at the corner measurement point 187 under terrain category C reaches the maximum absolute value of 1.73.
As shown in
Figure 13b–d, changes in terrain types exert a more pronounced influence on the fluctuating and peak wind pressure coefficients in the windward corner zone of the greenhouse. Specifically, under terrain category C, measurement point 188 exhibits the highest fluctuating wind pressure coefficient and maximum wind pressure coefficient, reaching 0.72 and 1.51, respectively, while measurement point 187 attains the largest absolute value of the minimum wind pressure coefficient at 4.04.
The particularly strong amplification in the corner region under terrain category C indicates that higher turbulence intensifies the instability of the corner-dominated separated flow, leading to larger pressure fluctuations and more severe instantaneous suction peaks.
3.3.5. Wind Direction Angle of 90°
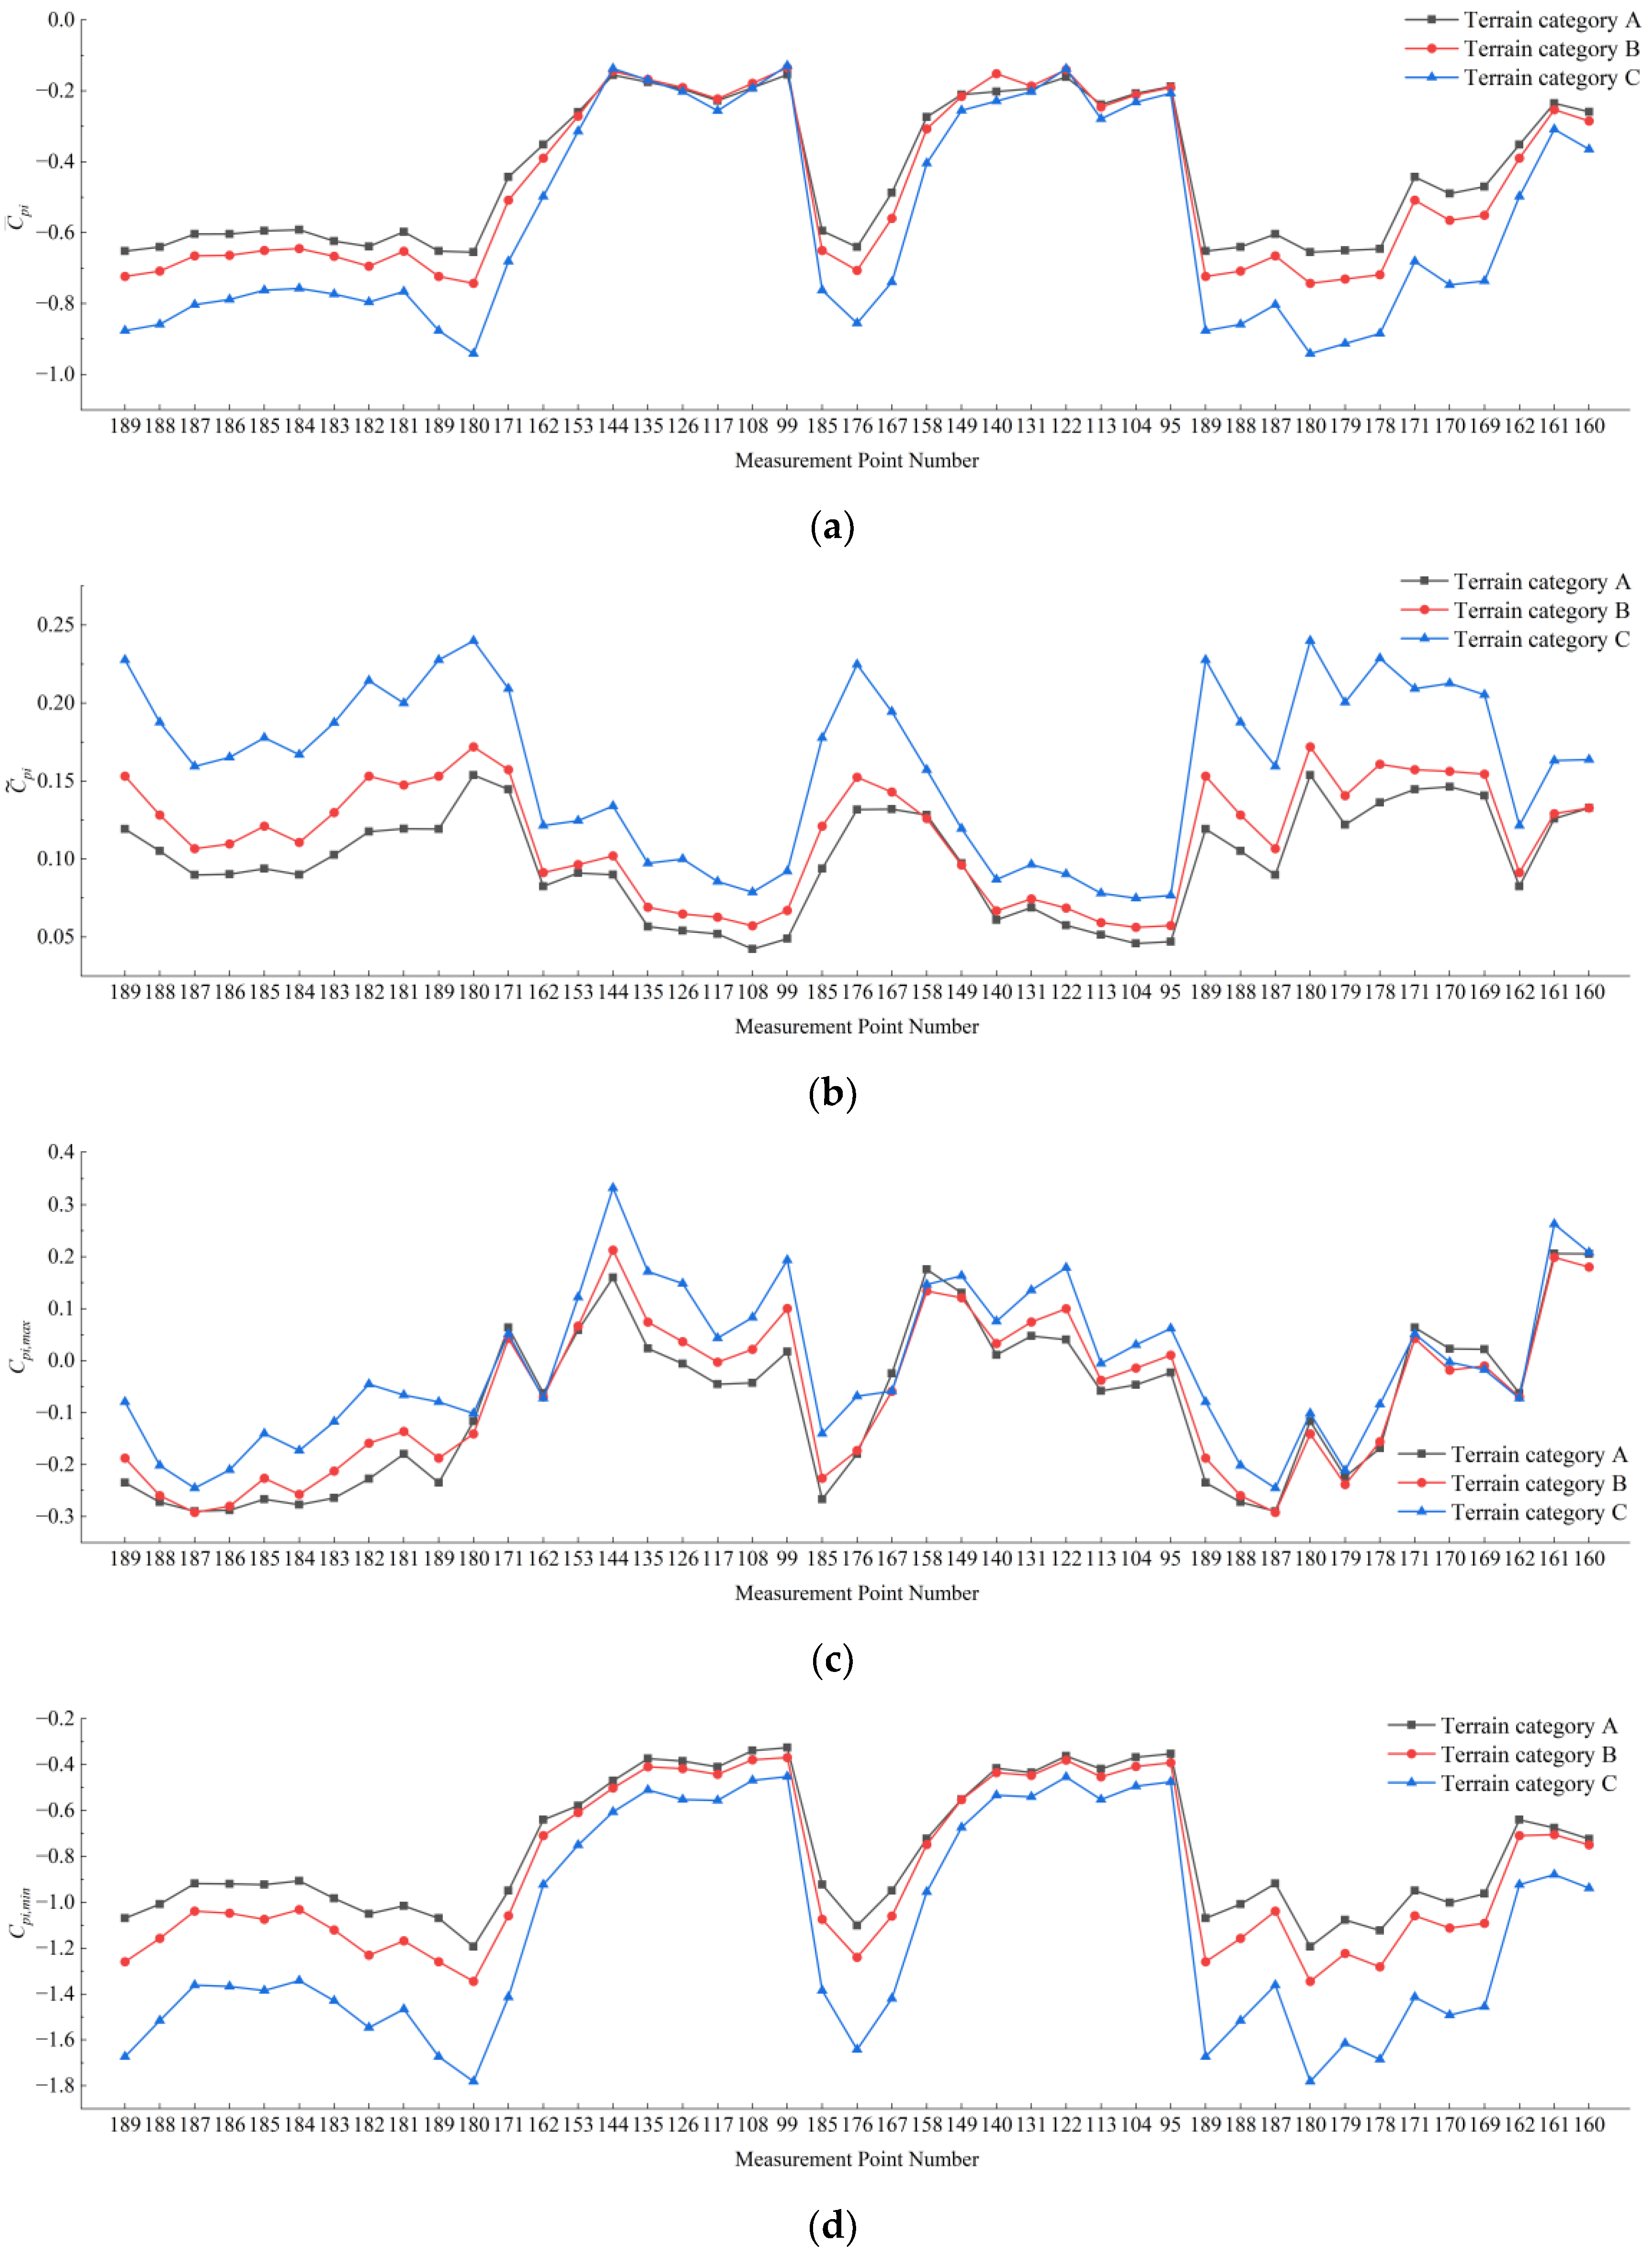
The influence of different terrains on the wind pressure coefficients at local measurement points on the greenhouse roof under a 90° wind direction angle is presented in
Figure 14.
As shown in
Figure 14a, under a wind direction angle of 90°, changes in terrain category have a significant influence on the mean wind pressure coefficients across the greenhouse roof area. At a wind direction angle of 90°, the airflow is perpendicular to the short side of the greenhouse roof, causing flow separation at the windward roof short-side edge and generating a high-negative-pressure zone in the leading-edge corner region. Therefore, variations in terrain category lead to more pronounced changes in the mean wind pressure coefficients within the windward roof short-side area. Moreover, the farther away from the leading edge of the windward roof, the weaker the influence of terrain on the mean wind pressure coefficients at the measurement points.
As shown in
Figure 14b–d, changes in terrain types have a significant influence on the fluctuating and peak wind pressure coefficients in the short-side roof area and the windward corner zone of the greenhouse. Specifically, under terrain category C, measurement point 180 in the corner area exhibits the maximum absolute values for both the fluctuating wind pressure coefficient and the minimum wind pressure coefficient, reaching 0.24 and 1.78, respectively.
Under 90° wind, the dominant suction region shifts to the gable-side leading edge, and the terrain effect is mainly reflected in the increased unsteadiness of the local separated flow rather than a major change in the mean pressure pattern.
3.4. Validation Against Published Experimental and CFD Results
To further assess the reliability of the present wind-tunnel results, the measured pressure characteristics were compared with independent published experimental and CFD-related studies on single-span greenhouse structures. The comparison focused on three aspects: (1) governing wind direction, (2) the location of critical pressure zones, and (3) the order of magnitude of the pressure coefficients.
First, the present study indicates that the most unfavorable local pressure condition occurs under oblique wind, especially around 60°, where the windward leading-edge corner and near-gable roof regions experience the largest absolute values of mean suction, fluctuating pressure coefficient, and negative peak pressure coefficient. This trend agrees well with previous greenhouse studies summarized in the review by Wang et al. [
34], which reported that, for single-span plastic greenhouses, the maximum negative roof pressure coefficient occurred at a wind direction angle of 60°, with a magnitude of about 1.49. The same review also noted that, for arch-type greenhouses, wind directions of 30° and 60° produced the maximum pressure effects.
Second, the critical pressure zones identified in the present work are consistent with the flow-separation patterns reported in previous studies. The current results show that the windward roof edge, roof corner, and near-gable ridge end are the most sensitive local zones. Huang et al. [
13] found that, for vaulted-roof greenhouse buildings, the roof shape significantly affects wind pressure characteristics, and the vaulted roof enhances the suction effect in the windward front zone and middle roof area. This supports the physical interpretation in the present study that strong local suction is associated with flow separation and vortex formation in the windward roof and corner regions.
Third, the magnitude of the present pressure coefficients is generally comparable with published values for arched greenhouse roofs. A review of Kwon et al.’s wind-tunnel data for peach-type single-span greenhouses [
35] shows that, under 0° wind direction, external pressure coefficients on windward roof segments may reach approximately −1.73 to −1.90 depending on roof curvature and roof location. These values are of the same order as the mean suction measured in the present study, while the more severe local peak suctions obtained here can be attributed to the combined effects of oblique wind direction, local corner measurements, and terrain-dependent turbulence intensity.
It should also be noted that exact one-to-one agreement is not expected, because the compared studies differ in greenhouse geometry, roof curvature, scale ratio, pressure tap layout, reference wind profile, and the definition of reported coefficients. In addition, many published studies report global or area-averaged coefficients, whereas the present study emphasizes local coefficients and explicitly considers the influence of terrain-induced turbulence intensity. Therefore, the validation in this paper is based primarily on consistency in the governing wind direction, the critical local zones, and the overall coefficient magnitude, rather than direct point-to-point equality.
Overall, the above comparison shows that the present measurements are consistent with independent greenhouse studies in terms of aerodynamic pattern, critical wind direction, and coefficient level, thereby supporting the validity of the present experimental results.
Table 2 is provided to summarize the literature-based validation of the present results.
4. Conclusions
Wind direction strongly governs the spatial distribution of local wind pressure coefficients over the arched roof. The most unfavorable condition occurs under oblique wind, especially around 60°, where the windward leading-edge corner exhibits the largest absolute values of mean suction, fluctuating pressure, and negative peak pressure coefficient.
As terrain roughness increases, the mean negative pressure, fluctuating pressure, and peak pressure on the greenhouse surface generally increase. However, the terrain effect is much more pronounced for fluctuating and peak pressures than for mean pressure. The influence of terrain on the mean wind pressure coefficient is mainly evident under oblique wind directions, whereas under 0° and 90° wind directions, it remains relatively limited.
The critical local zones are consistently located at the windward roof edge, roof corner, and near-gable ridge end. These regions show strong sensitivity to both wind direction and terrain-induced turbulence intensity, indicating that local cladding design should prioritize these zones.
Design wind actions for arched plastic-film greenhouses should not be based solely on normal wind. Within the scope of the present boundary-layer simulation, the coupled action of oblique wind and high-turbulence terrain should be regarded as the governing scenario for local cladding pressure design.