Article

Weighted-Sum Optimization of Shopping-Mall Atrium Morphology Using a Field-Based Visual Satisfaction Proxy and sDA-Based Daylight Sufficiency


1
School of Civil Engineering and Architecture, Zhejiang Sci-Tech University, Hangzhou 310018, China
2
School of Architecture & Urban Planning, Huazhong University of Science and Technology, Hubei Engineering and Technology Research Center of Urbanization, Wuhan 430074, China
3
School of Mechanics, Civil Engineering and Architecture, Northwestern Polytechnical University, Xi’an 710072, China
4
School of Architecture, Harbin Institute of Technology, Key Laboratory of Cold Region Urban and Rural Human Settlement Environment Science and Technology, Ministry of Industry and Information Technology, Harbin 150001, China
*
Author to whom correspondence should be addressed.
Appl. Sci. 2026, 16(10), 4680; https://doi.org/10.3390/app16104680
Submission received: 13 April 2026 / Revised: 1 May 2026 / Accepted: 5 May 2026 / Published: 9 May 2026
(This article belongs to the Section Civil Engineering)

Abstract

Daylighting in shopping-mall atriums affects both perceived visual quality and the availability of daylight for reducing electric-light use under daylight-responsive control. However, early-stage atrium design still lacks a reproducible workflow that connects field-based user-response evidence with parametric daylight simulation in retail settings. This study develops a weighted-sum design-search workflow for shopping-mall atrium morphology by combining a luminance-based visual satisfaction proxy with spatial daylight autonomy (sDA300/50%) as an annual daylight-sufficiency indicator. Morphological parameter ranges were derived from a survey of 150 atriums in 26 shopping malls in China, and three prevalent atrium types were retained for simulation-based testing. ClimateStudio/Radiance simulations were used to calculate scene mean luminance and sDA300/50%, and particle swarm optimization was used as a practical search algorithm under a fixed baseline weighting scenario. The reported high-scoring solutions reached sDA saturation, indicating that the final score differences were mainly governed by the luminance-based satisfaction term within the high-daylight-sufficiency region. This study contributes a retail-oriented, reproducible design-search workflow for early-stage atrium morphology decisions, while the results should be interpreted as scenario-based preferred solutions rather than statistically confirmed global optima or a complete visual-risk/energy-performance assessment.

1. Introduction

Atrium daylight performance is closely tied to geometric proportions, roof and façade openings, and climate context [1,2,3,4]. Reviews and simulation studies have established the value of climate-based daylight metrics and have shown that daylight availability in atriums is governed by plan form, well proportions, and glazing design [1,2,3,4]. In parallel, field and perception studies in shopping environments indicate that daylight quality shapes how users appraise public indoor space, and recent survey evidence from shopping malls suggests that customers place particularly high value on daylight quality and visual connection to the outside [5,6]. For retail-oriented atriums, therefore, daylighting design is not only a technical problem of light provision but also a user-centered problem of perceived environmental quality.
A second strand of the literature concerns optimization. Studies that combine visual and energy-related objectives have been reported for other building types such as offices and classrooms [7,8]. More recent work has extended parametric optimization to atrium buildings, commercial atria, and shopping-mall configurations [9,10,11,12]. Xue and Liu identified key design parameters for commercial atrium daylight optimization in cold regions through a Pareto-based workflow [10], and Adel and Sheta showed that shopping mall atrium and skylight configurations can be optimized in hot climates using ClimateStudio and glare-oriented visual comfort metrics [9]. Further recent studies have broadened atrium optimization to jointly consider daylight, energy, and thermal objectives in non-retail atrium buildings [11,12]. These contributions confirm that atrium optimization is an active and maturing field rather than an unexplored one.
The present study addresses a narrower problem within this landscape. Existing atrium optimization studies rely mainly on objective daylight, thermal, or glare indicators. A shopping-mall-oriented workflow that directly embeds a field-derived Lmean–satisfaction relationship into morphology design search remains insufficiently developed [8,9,10,11,12]. Against this background, the present study addresses the following research questions: (1) How can a field-derived relationship between scene mean luminance and user-reported lighting satisfaction be incorporated into a parametric daylighting workflow for shopping-mall atriums? (2) How do typical atrium morphologies perform when a luminance-based satisfaction proxy is combined with sDA-based daylight sufficiency under a weighted scalar formulation? (3) What parameter tendencies can be identified for prevalent shopping-mall atrium types, and what are the methodological limits of interpreting these tendencies as design recommendations?

2. Literature Review

2.1. Visual Comfort of Daylighting in Shopping Malls

Atrium daylighting plays a central role in the environmental quality of shopping malls. Atriums can enrich social interaction and support occupants’ psychological well-being [1]. Hourani and Hammad reported that daylighting quality shapes the dynamics of architectural space, reinforces its aesthetic and emotional dimensions, and enriches occupants’ experience and their sense of interest and pleasure [13]. Jin and Li found that increased daylight admission in atriums improves subjective lighting satisfaction [14]. Sachdev et al. further showed that window position and shape influence perceived satisfaction with lighting quality [15].
Daylighting also has positive effects on sales, customer retention, and dwell time in shopping malls. Heschong et al. reported that customers and employees viewed stores with overhead daylighting favorably, and that skylighting was strongly correlated with higher sales [16], which suggests a tangible commercial value of daylight in retail centers. The Lighting Research Center (LRC) examined organizational outcomes associated with daylight and found that windowless commercial properties commanded lower rents than those with windows [17]. Recent survey evidence from shopping malls further indicates that customers place greater importance on daylight quality and visual connection to the outside than on energy saving alone, which underscores the need to treat perceived lighting satisfaction as an explicit design criterion in retail atrium design [6].

2.2. Energy Performance in Atriums

Electric lighting accounts for a substantial share of electricity use in commercial buildings, and this share can be meaningfully reduced by exploiting daylight [18,19]. Retail sales have also been observed to rise with longer annual daylight availability and with improved daylighting design [20]. Among architectural strategies, the atrium remains one of the most effective means of delivering daylight into shopping malls.
To use this daylight efficiently, the relationships between daylight metrics and atrium morphological parameters have been studied extensively. Field measurements, scale models, and simulations have been used to examine the effects of geometry and surface reflectance on the daylight factor (DF) in atriums and adjacent spaces under overcast sky conditions [21,22,23,24,25,26,27,28,29,30]. Other studies have addressed the influence of atrium type, spatial proportion, roof opening design, and reflector configuration on daylight metrics within climate-based daylight modeling frameworks [2,4,31]. Spatial daylight autonomy (sDA) quantifies whether a space receives sufficient daylight on a horizontal work plane during standard operating hours over a year [32,33], and a simplified method for estimating daylight autonomy (DA) in atriums from spatial parameters has been proposed to support rapid early-design evaluation [3].

2.3. Scope of Daylight-Performance Indicators Used in This Study

The indicators used in this study have different scopes and should not be treated as interchangeable measures. Scene mean luminance (Lmean) is used here as an image-based variable linked to a previously established field regression between luminous conditions and subjective lighting satisfaction in shopping-mall public spaces. It is therefore interpreted as a satisfaction-oriented proxy rather than as a complete visual comfort or glare-risk metric. Spatial daylight autonomy (sDA300/50%) describes the percentage of analysis points that receive at least 300 lx from daylight for at least 50% of the occupied hours, and is used here to represent annual daylight sufficiency. Under an ideal daylight-responsive lighting-control assumption, high sDA indicates potential for reduced electric-light use, but it does not directly quantify operational lighting energy consumption. Annual sunlight exposure (ASE), daylight glare probability (DGP), and related glare or overexposure metrics remain important for complete annual visual-risk assessments, but they are outside the retained objective terms of the present weighted design-search formulation.

2.4. Optimization Approaches for Daylighting Performance

Recent atrium optimization studies show clear methodological divergence according to research scope. Xue and Liu optimized commercial atrium daylighting in cold regions through a Pareto-based parametric workflow centered on daylight quantity [10], whereas Adel and Sheta examined shopping mall atrium and skylight configurations in a hot climate using ClimateStudio together with glare-oriented metrics [9]. Other recent atrium studies have broadened the objective space to include daylight, energy, and thermal performance in non-retail building types [11,12]. Wagiman et al. demonstrated that visual comfort and energy efficiency can be jointly optimized within a PSO-family framework, although their study addressed office lighting systems and used a different visual-performance metric [8]. Together, these contributions confirm that atrium optimization is already an active field, and the niche of the present study is correspondingly narrow: a weighted-sum formulation is used to embed a field-derived Lmean–satisfaction relationship into the morphology search of shopping mall atriums, while acknowledging that glare-oriented and annual-risk metrics remain valuable for other daylight assessment tasks.
Daylight optimization studies have adopted different algorithmic strategies depending on how the design problem is framed. NSGA-II and MOPSO have been used when the aim is to preserve trade-offs between comfort and energy-related objectives [7,8], while recent atrium studies have often relied on Pareto-oriented tools such as Octopus or GA to explore alternative daylight, energy, or thermal solutions [9,10,11,12]. PSO has likewise been applied in simulation-based building optimization: Futrell et al. showed that a PSO variant could identify high-quality daylighting solutions in a classroom setting, although its convergence was slower than that of the hybrid alternative tested in the same study [34]. In the present work, PSO was chosen not because it is universally superior to GA, NSGA-II, or Octopus, but because the two criteria are combined into a single weighted fitness function; the task therefore reduces to searching for high-scoring solutions within bounded atrium parameter ranges. Wagiman et al. [8] are methodologically relevant in this respect, as they jointly optimized visual comfort and energy efficiency with a PSO-family method, although their framework targeted office lighting systems and used a different visual-performance metric. Within the present formulation, PSO therefore functions as a practical search engine for a retail-atrium-specific workflow rather than as the main contribution of this study. Because the two criteria are collapsed into a weighted scalar objective rather than explored as a Pareto front, PSO is used purely as a practical search algorithm under that formulation.

2.5. Research Objectives

The main objective of this study was to identify favorable shopping mall atrium morphologies under a weighted two-criteria formulation that combines subjective visual satisfaction with daylight sufficiency linked to potential reductions in electric-light use. Rather than estimating actual operational energy use, the framework evaluates daylight-linked lighting energy-saving potential under an ideal daylight-responsive control assumption.
The two daylighting criteria were integrated into a weighted scalar objective. The first criterion is a satisfaction-oriented visual term derived from a previously established relationship between scene mean luminance and subjective lighting satisfaction in shopping-mall public spaces [5]. The second criterion is sDA300/50%, used here as an annual daylight sufficiency metric and as a proxy for daylight-linked lighting energy-saving potential, rather than as a direct measure of operational lighting energy consumption. This formulation was designed for the present shopping-mall atrium workflow and should not be read as a replacement for glare-oriented or annual visual-risk metrics in other assessment tasks. Although sDA and ASE are commonly treated as complementary annual daylight metrics [2,35], ASE was not incorporated into the present weighted formulation, and the optimization results should therefore not be interpreted as a complete annual visual-risk assessment. The baseline 0.55/0.45 weighting scenario was informed by the revised 12-expert AHP evidence and further examined through weighting-scenario sensitivity analysis, as reported in Section 3.3.3 and Appendix A.

3. Methodology

The methodology comprised four steps: (1) construction of an atrium reference dataset and extraction of common shopping-mall atrium typologies; (2) simulation of luminance maps and sDA300/50% values using ClimateStudio/Radiance; (3) formulation of a weighted scalar objective combining a luminance-based visual satisfaction proxy with sDA-based daylight sufficiency; and (4) PSO-based design search for preferred parameter combinations under the adopted baseline weighting scenario. Figure 1 gives an overview of the workflow. The simulation workflow was implemented in Rhinoceros v7.3 and its built-in Grasshopper (Robert McNeel & Associates, Seattle, WA, USA), ClimateStudio v1.1 (Solemma LLC, Cambridge, MA, USA), and MATLAB v2020b (The MathWorks, Inc., Natick, MA, USA). ClimateStudio is a daylight and energy simulation plug-in developed by Solemma [36], and the daylight simulation procedure follows Radiance-based daylight simulation practice [37].

3.1. Atrium Reference Dataset and Typology Extraction

3.1.1. Mall Survey and Recorded Parameters

To anchor the morphology design search in empirically observed retail-atrium conditions, an atrium reference dataset was first compiled from 26 shopping malls in China. The case investigation was carried out in 2018 through on-site surveys and architectural drawing review. A mall was included if it contained at least one atrium, was in operation at the time of the survey, and was willing to provide drawings and permit on-site inspection. The 26 selected malls spanned seven major regions of China (Northeast, North, Central, East, South, Southwest, and Northwest). Within each mall, all atriums with access to daylight were counted. For every included atrium, the recorded attributes were plan form, well width, well length, corridor width, atrium location within the mall plan, and daylight-opening pattern. In total, 150 atriums were documented and served as the empirical basis for plan-form prevalence analysis and for defining the initial morphological parameter space.
As shown in Table 1, rectangular atriums made up 70.67% of the dataset, while each of the other plan forms accounted for 13.3% or less. Rectangular atriums were therefore adopted as the base plan form in the parametric modeling stage on the basis of prevalence and design applicability, rather than as a claim of universally superior daylight performance. Mall-level provenance, source composition, and screening information are provided in Supplementary Table S1.

3.1.2. Screening Procedure and Retained Typologies

A second screening step was then applied to the compiled dataset to identify daylighting atriums whose spatial location and daylight-opening configuration could be clearly classified. Atriums lacking accurate architectural drawings were excluded first, followed by those with overly complex daylighting conditions or plan forms that were difficult to categorize. This yielded 44 usable atriums for typology extraction. This screening step was used only for typology extraction, whereas the broader 150-atrium dataset remained the reference basis for plan-form prevalence and general morphological parameter information. Based on location within the mall plan, these atriums were grouped as central, semi-enclosed, corner, or linear; their daylighting patterns were coded as top-daylit, vertical-skylit, side-daylit, combined-daylit, two-sided-daylit, or upper-and-side-daylit. The resulting typology distribution is summarized in Table 2.
Among the screened atriums, the three most prevalent typologies were the central top-daylit atrium, the semi-enclosed side-daylit atrium, and the semi-enclosed combined-daylit atrium. These three were retained for the subsequent optimization study because they represented the dominant daylighting configurations within the screened dataset. The typology-specific counts, roles, and observed parameter ranges of the 44 retained atriums are provided in Supplementary Table S2.

3.1.3. Parameter Bounds Used in the Design Search

The parameter bounds used in the design search were derived from observed values in the atrium reference dataset rather than assigned arbitrarily. The extracted variables were well width, length-to-width ratio, corridor width, floor height, and number of floors. To allow for cross-typology comparison under a consistent morphological parameter space, the same broad search bounds were adopted for the three simulated atrium typologies, as listed in Table 3. The implications of using common rather than type-specific bounds are discussed as a limitation.

3.2. Daylight Simulation Setup

Simulation models were generated in Rhinoceros v7.3 and its built-in Grasshopper, after which the luminance maps and sDA300/50% values were computed in ClimateStudio v1.1.
Artificial lighting in the surrounding retail areas was configured to match typical retail visual requirements. The luminaire used was a linear suspended strip with a diffuse lens, 1.2 m in length, 100 W in rated power, and 10,240 lm in luminous flux. The distance from the luminaires to the boundary was 4 m, and the spacing between adjacent luminaires was 7.5–8.5 m. The resulting artificial-lighting luminance was approximately 40 cd/m2, close to the average level measured in the previous field study.

3.2.1. Weather Data, Climate Basis, and Simulation Periods

The daylight simulations used an EnergyPlus Weather (EPW) file representing the climate of Beijing, which was selected to match the climatic context of the modeled shopping-mall atrium cases. Annual sDA calculations were conducted using the hourly weather data contained in the EPW file over the 9:00–17:00 operating period, corresponding to 2920 occupied hours per year. For luminance-map simulations, representative dates were selected to capture seasonal solar-altitude conditions: 21 March, 21 June, 23 September, and 22 December. Because the March and September equinox conditions are similar in solar geometry, the 23 September results were used to represent both equinox conditions in the averaged visual-satisfaction calculation. The daily luminance-map simulation window was 9:00–17:00, with HDR images generated at 9:00, 13:00, and 17:00 to balance simulation duration and result resolution. An earlier study showed that horizontal HDR and Perez skies produced comparably accurate luminance maps; Perez skies were therefore adopted here [38]. Nine HDR images were simulated per viewpoint per floor, and the resulting fitness-function values were averaged.

3.2.2. Luminance-Map Simulation

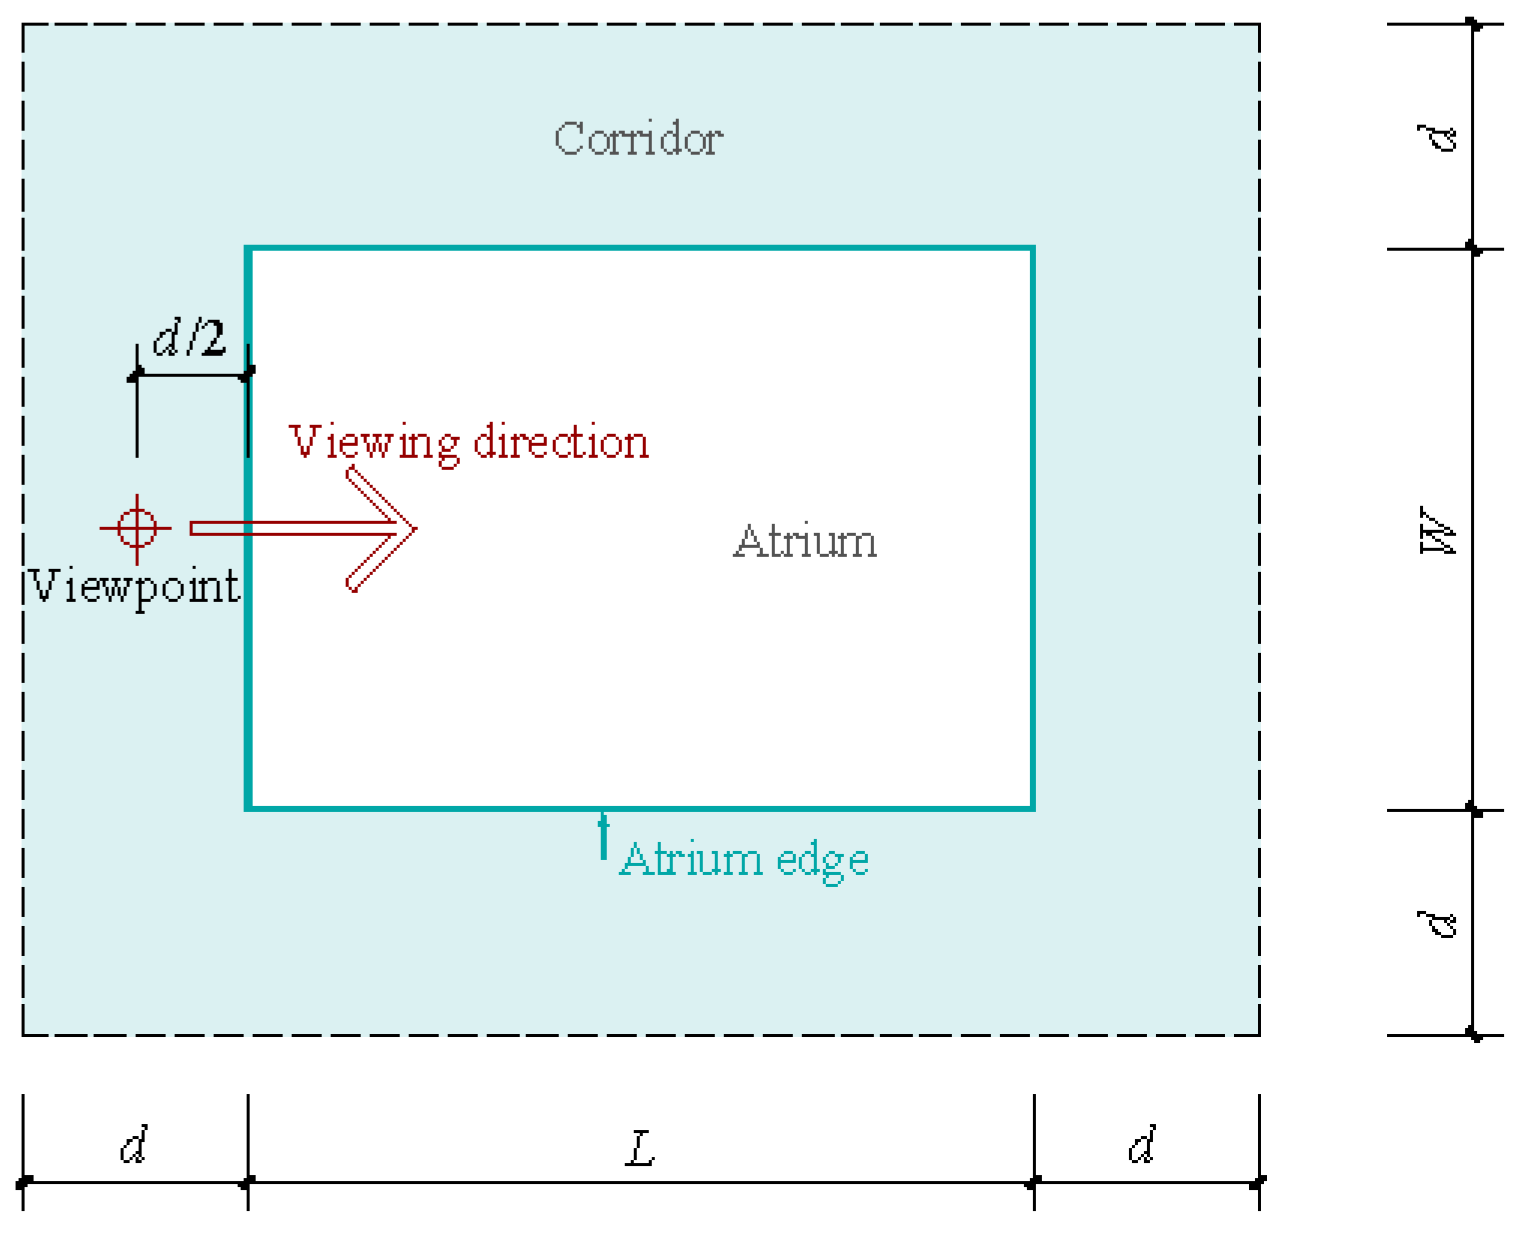
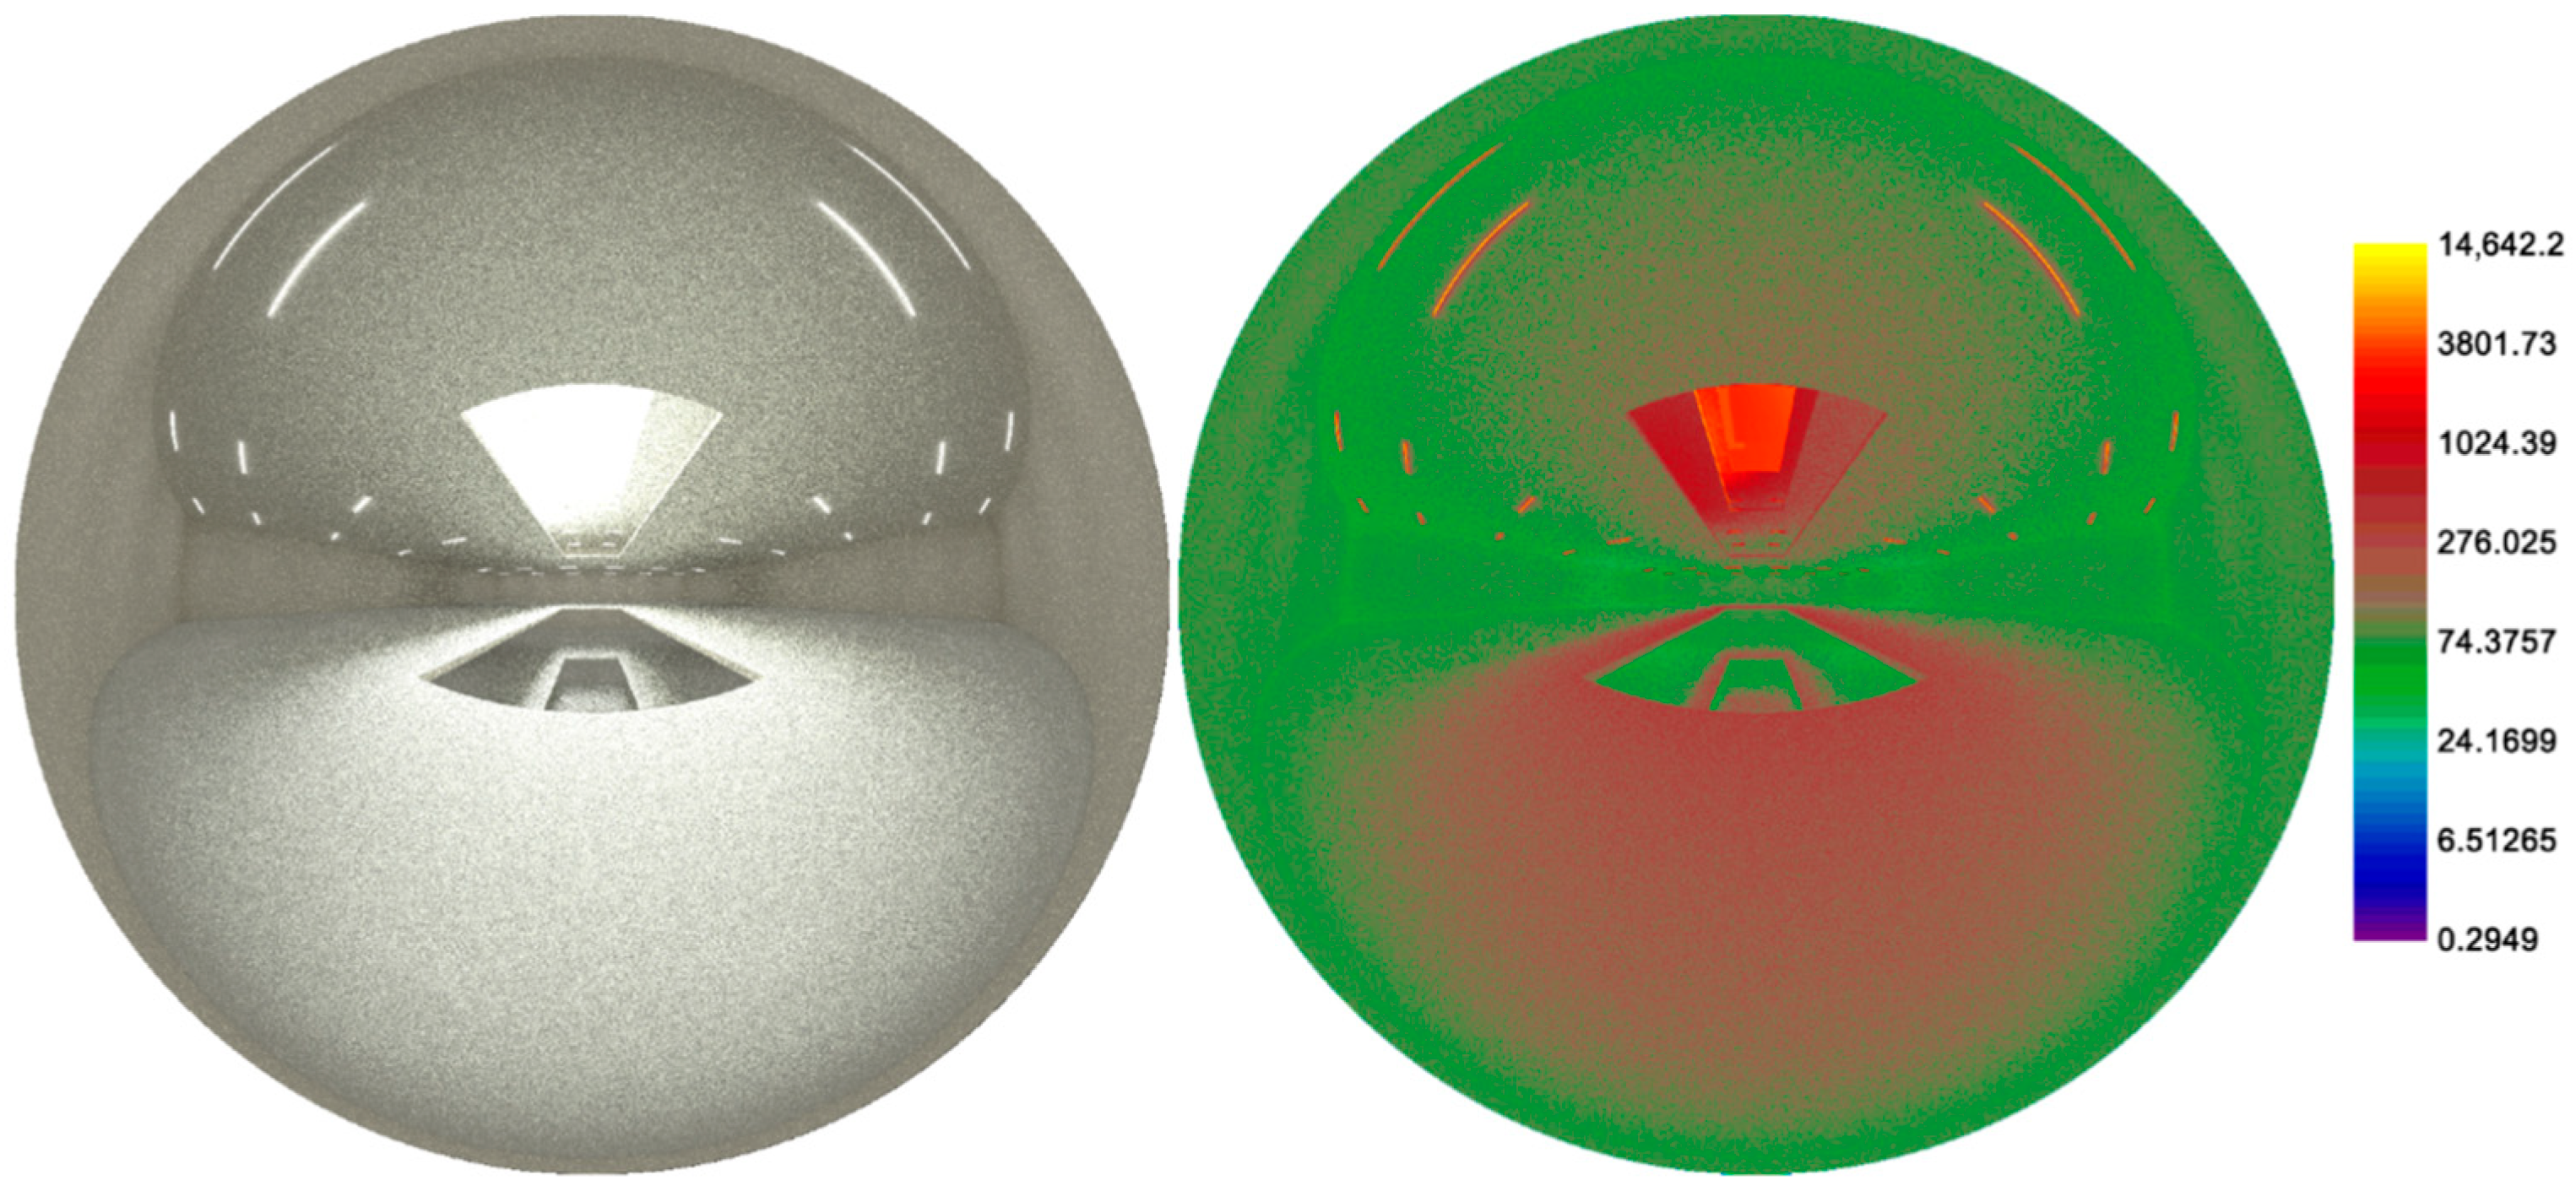
A simulated luminance map stores the usual red, green, and blue channels for each pixel, as in any conventional image format, together with an absolute luminance value per pixel that fixes the absolute brightness. The default high-quality preset in ClimateStudio v1.1 was used, with ab = 6, ad = 1024, lw = 0.01. A fisheye projection—an ultra-wide-angle panoramic projection—was selected to capture the luminous environment around the atrium; the field of view was 360°. Four samples per pixel were used, and the maps were rendered at 128 × 128 px. The viewpoint was placed at the middle of the corridor on the short side of the atrium (Figure 2), 1.5 m above the floor, and was oriented toward the atrium. Representative simulated luminance maps for the central atrium are shown in Figure 3.

3.2.3. sDA Simulation and Lighting-Standard Basis

Shopping-mall atriums accommodate a range of activities, including circulation, retail, exhibition, and leisure. The target illuminance of 300 lx and the 0.75 m horizontal analysis plane were selected with reference to the lighting standard value for general retail spaces in the Chinese Standard for Lighting Design of Buildings (GB 50034-2013) [39]. The sDA300/50% criterion follows the IES LM-83 daylight-assessment convention [35], in which an analysis point is considered daylit when it receives at least 300 lx for at least 50% of the occupied hours. As noted in Section 3.3.2, sDA is usually reported together with ASE in annual daylight assessment as a complementary indicator of potential overexposure risk [2,35].
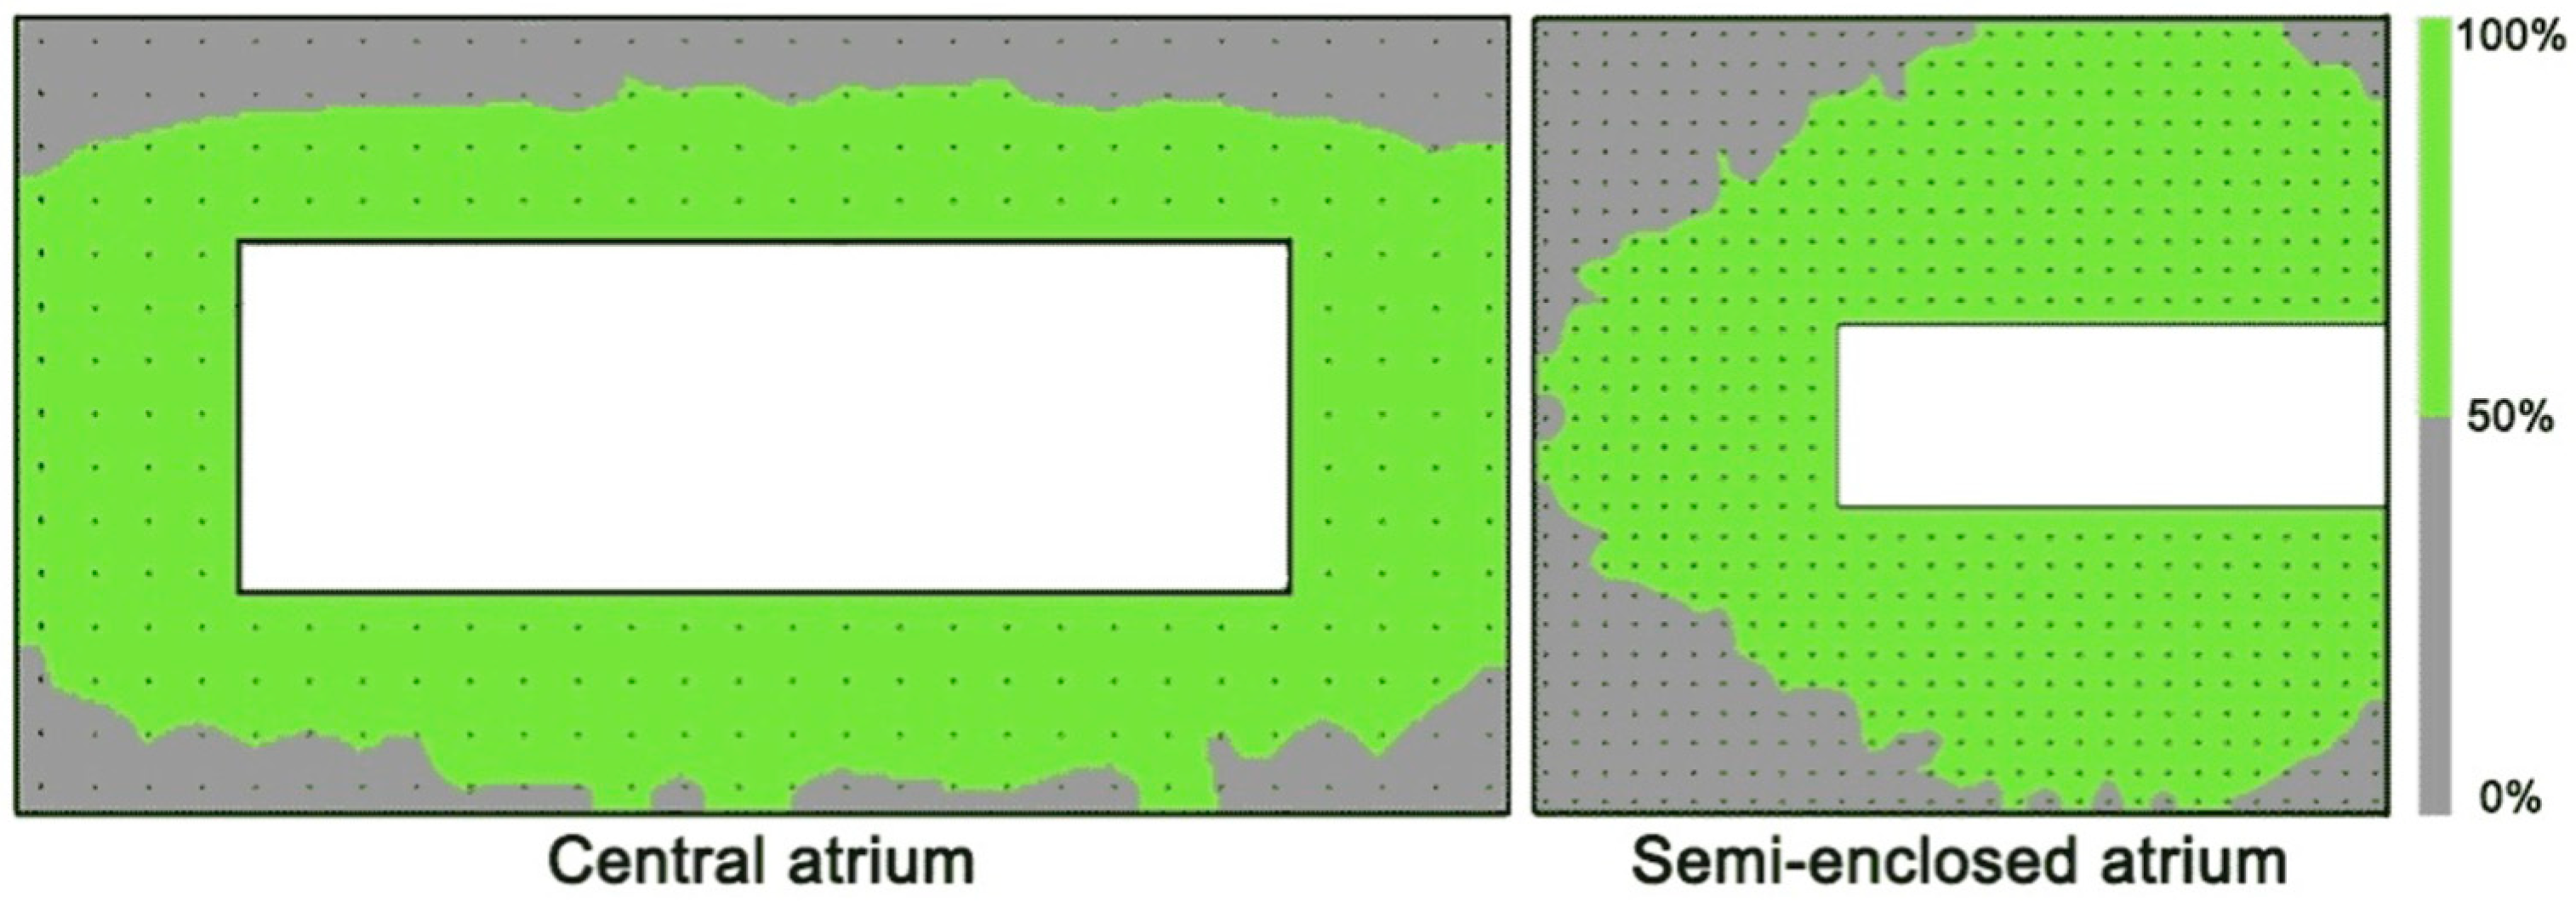
The sDA values were simulated in ClimateStudio v1.1 for Grasshopper, which supports several illuminance-based daylight availability metrics. For an accurate calculation, the spacing of the daylight sensor grid should not exceed 2 ft (610 mm) [40]. A sensitivity check in which the grid spacing was varied from 100 mm to 610 mm in 100 mm steps showed no meaningful change in sDA. To balance observation clarity with simulation speed, a grid spacing of 500 mm was adopted in this study. The calculation period covered 9:00–17:00, accumulating 2920 h across the year. Figure 4 shows the simulated sDA300/50% values for the different atrium types.

3.3. Weighted Objective Formulation

3.3.1. Luminance-Based Satisfaction Proxy

In addition to objective photometric metrics, subjective evaluation has been widely used in prior lighting-appraisal studies to assess users’ responses to the luminous environment [41,42]. In the authors’ earlier field study of public spaces in shopping centers, a quadratic regression was established between the scene mean luminance (Lmean) and subjective satisfaction under mixed lighting conditions, that is, when daylight and electric lighting were present simultaneously [5]. This relationship was obtained from the regression shown in “Figure 2 in [5]”, based on survey data from 61 respondents with R2 = 0.7944. In the present study, the predicted output of this regression is denoted SEvisual and is used for the subsequent design search, as given in Equation (1).
S E visual = 1.0284 L mean 2 + 2.055 L mean + 3.0034
where SEvisual is the model-predicted subjective satisfaction with the lighting environment, and Lmean is the scene mean luminance in kcd/m2.
In the earlier study [5], the original subjective evaluation was defined on a 1–5 scale. Within the calibrated Lmean range of 0.028–1.120 kcd/m2 adopted here, however, the predicted SEvisual values fall mainly between about 3 and 4.03. In principle, the interval 3–4.03 could itself be used for normalization, but doing so would map the lowest predicted values in the current model domain directly to zero and could over-penalize low-luminance conditions. For this reason, the present study retains 1—the theoretical lower bound of the original evaluation system—as the lower limit of normalization, and adopts 4.03, the maximum value predicted by Equation (1) within the adopted calibration range, as the upper limit. Accordingly, Equation (2) maps 1–4.03 onto 0–100. This treatment should be read as a modeling choice made for the present fitness-function construction, not as the only defensible normalization strategy; alternative intervals such as 1–5 or 3–4.03 would yield different absolute scales of f1 and could further shift its relative weight in the integrated objective function.
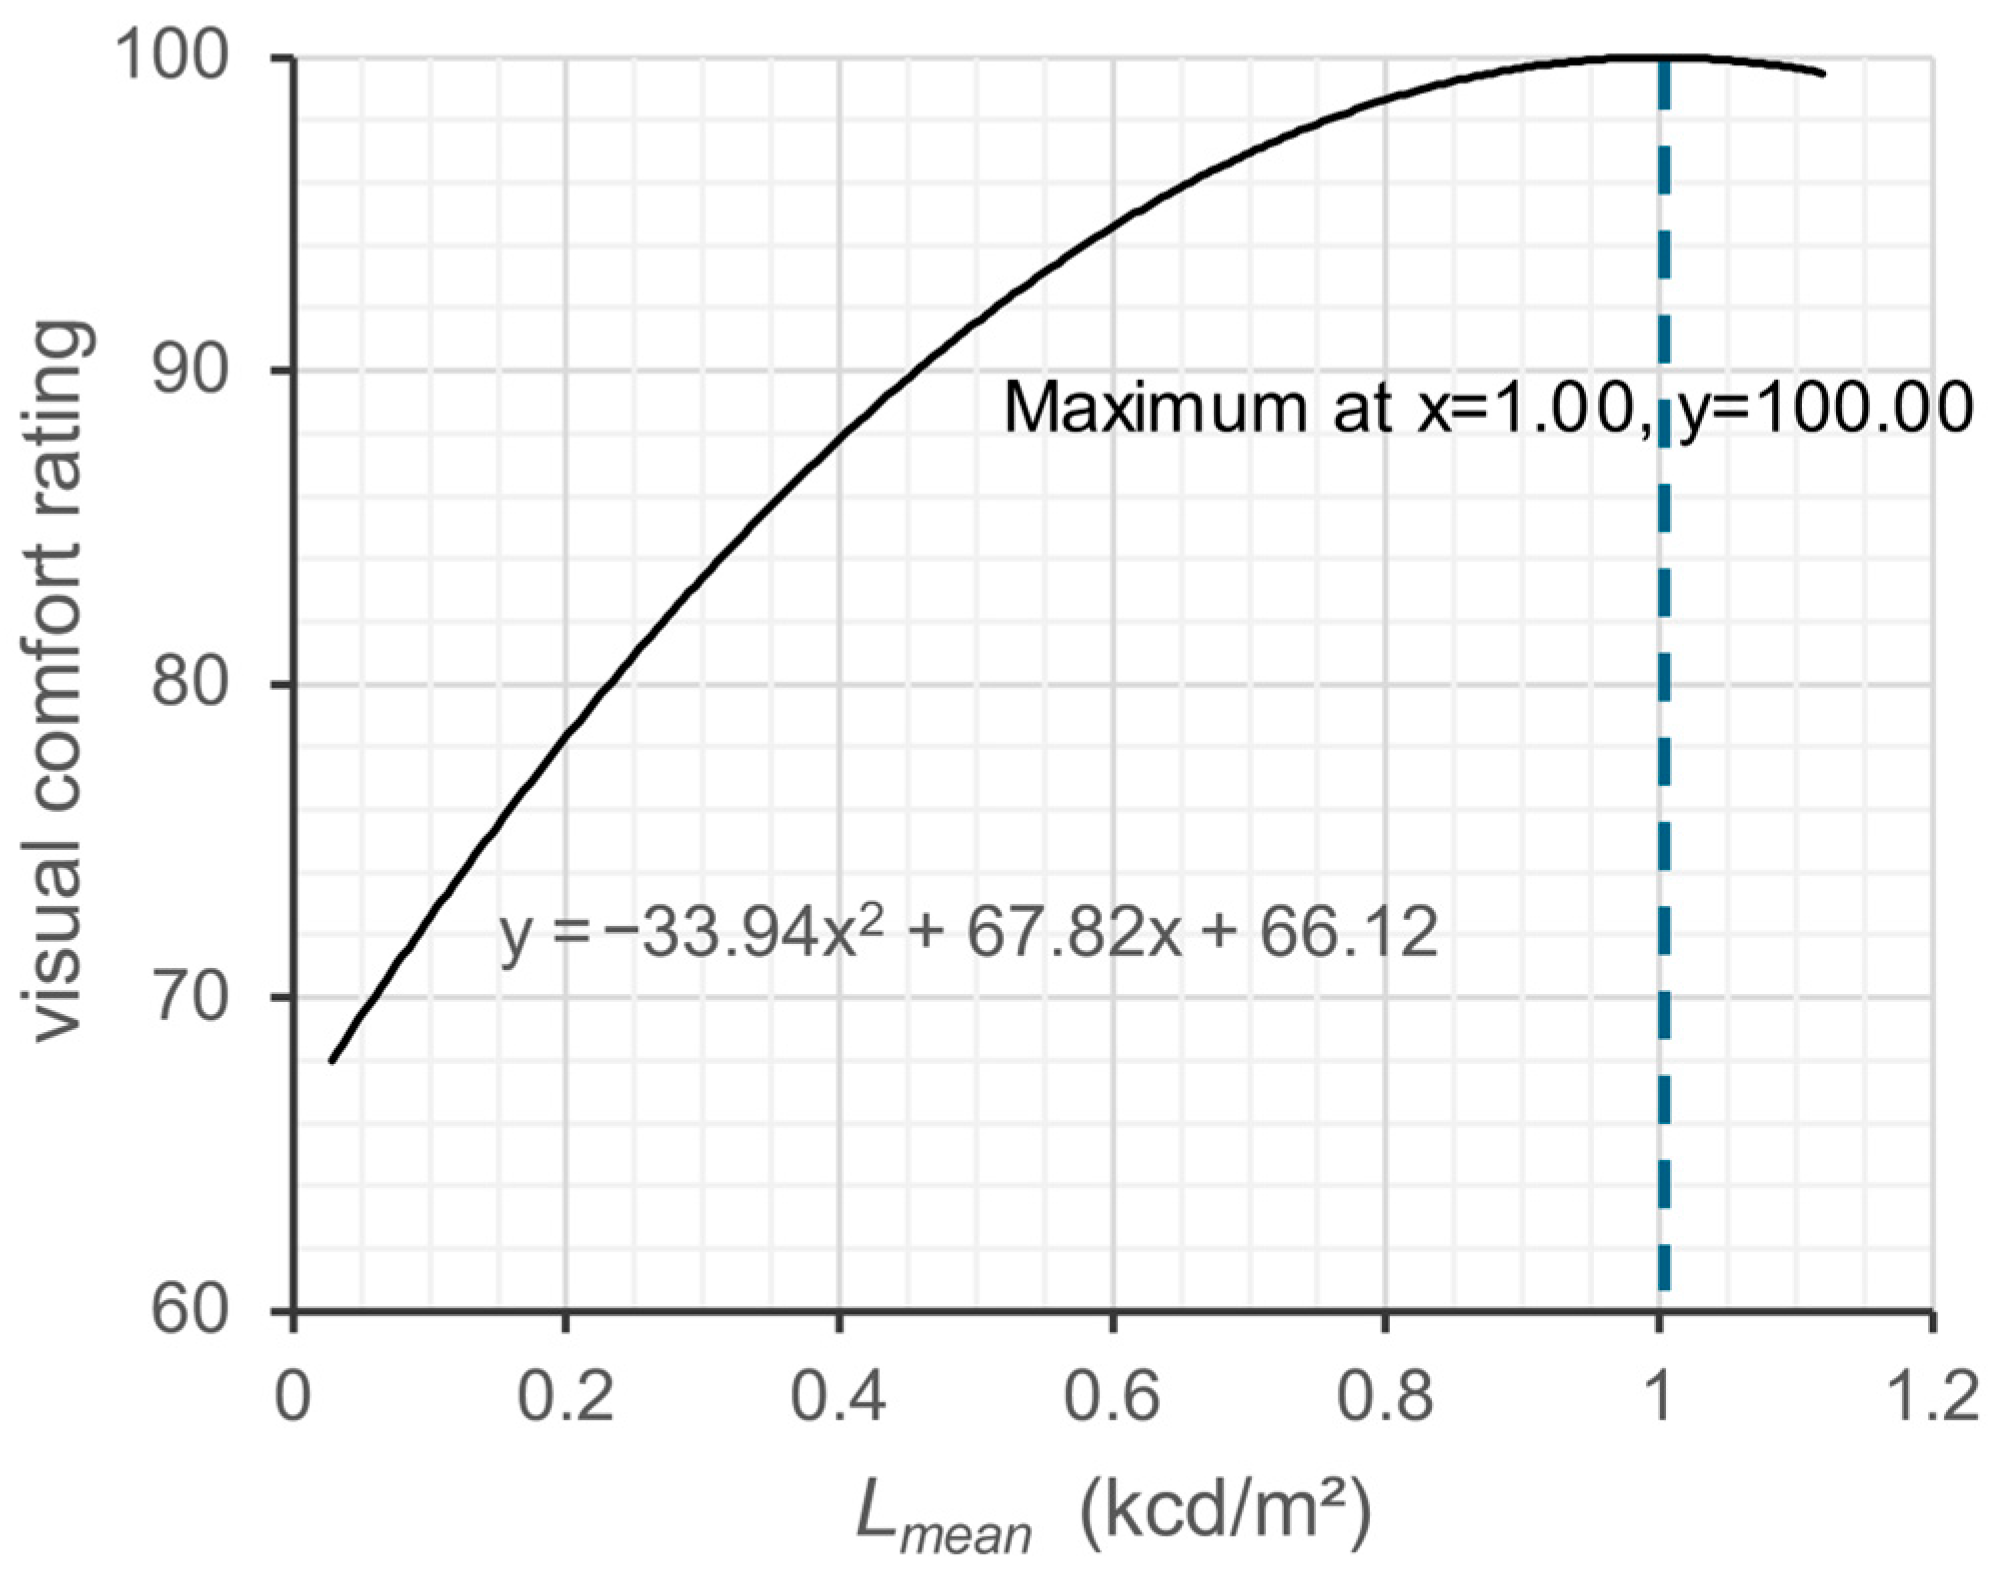
f 1 = 100 ( S E visual   1 ) / ( 4.03 1 ) = 33.941 L mean 2 + 67.822 L mean + 66.119
where f1 is the normalized luminance-based satisfaction proxy derived from the model-predicted SEvisual. The interval 1–4.03 was chosen so as to retain the theoretical lower bound of the original rating system while avoiding direct mapping of the current model-domain minimum onto zero.
The Lmean interval used in the present study, 0.028–1.120 kcd/m2, corresponds to the range of Lmean values produced by the PSO-driven simulations and lies within the calibration domain of the original regression in [5]. As shown in Figure 5, the normalized luminance-based satisfaction proxy reaches its maximum at Lmean ≈ 1.0 kcd/m2. Below this value the rating rises with increasing Lmean, whereas above it the rating decreases as Lmean continues to grow.

3.3.2. sDA-Based Daylight Sufficiency Term

sDA300/50% was used here as a daylight-sufficiency metric and, under an ideal daylight-responsive control assumption, as a proxy for daylight-linked lighting energy-saving potential. A higher sDA300/50% indicates that a larger proportion of the analyzed area can reach the target illuminance from daylight alone during occupied hours, and therefore has greater potential to reduce electric-light use. This interpretation should be read as a proxy-based assessment rather than as a direct estimate of measured or simulated operational lighting energy consumption.
In annual daylight assessment frameworks, sDA is commonly paired with ASE as a complementary metric for potential overexposure risk [2,35]. ASE was not included in the present objective formulation because the current workflow was built to combine a field-derived Lmean–satisfaction model with an annual daylight sufficiency indicator for early-stage morphology screening. Accordingly, the second criterion in this study should be interpreted as daylight sufficiency and daylight-linked lighting energy-saving potential, not as a complete annual visual-risk or energy-performance assessment. Because sDA300/50% is expressed as a percentage, the normalized second criterion is given by Equation (3).
f 2 = sDA 300 / 50 %
where f2 is the normalized daylight-sufficiency-based proxy for daylight-linked lighting energy-saving potential, and sDA300/50% is the percentage of analysis points that meet or exceed 300 lx for at least 50% of the analysis period.
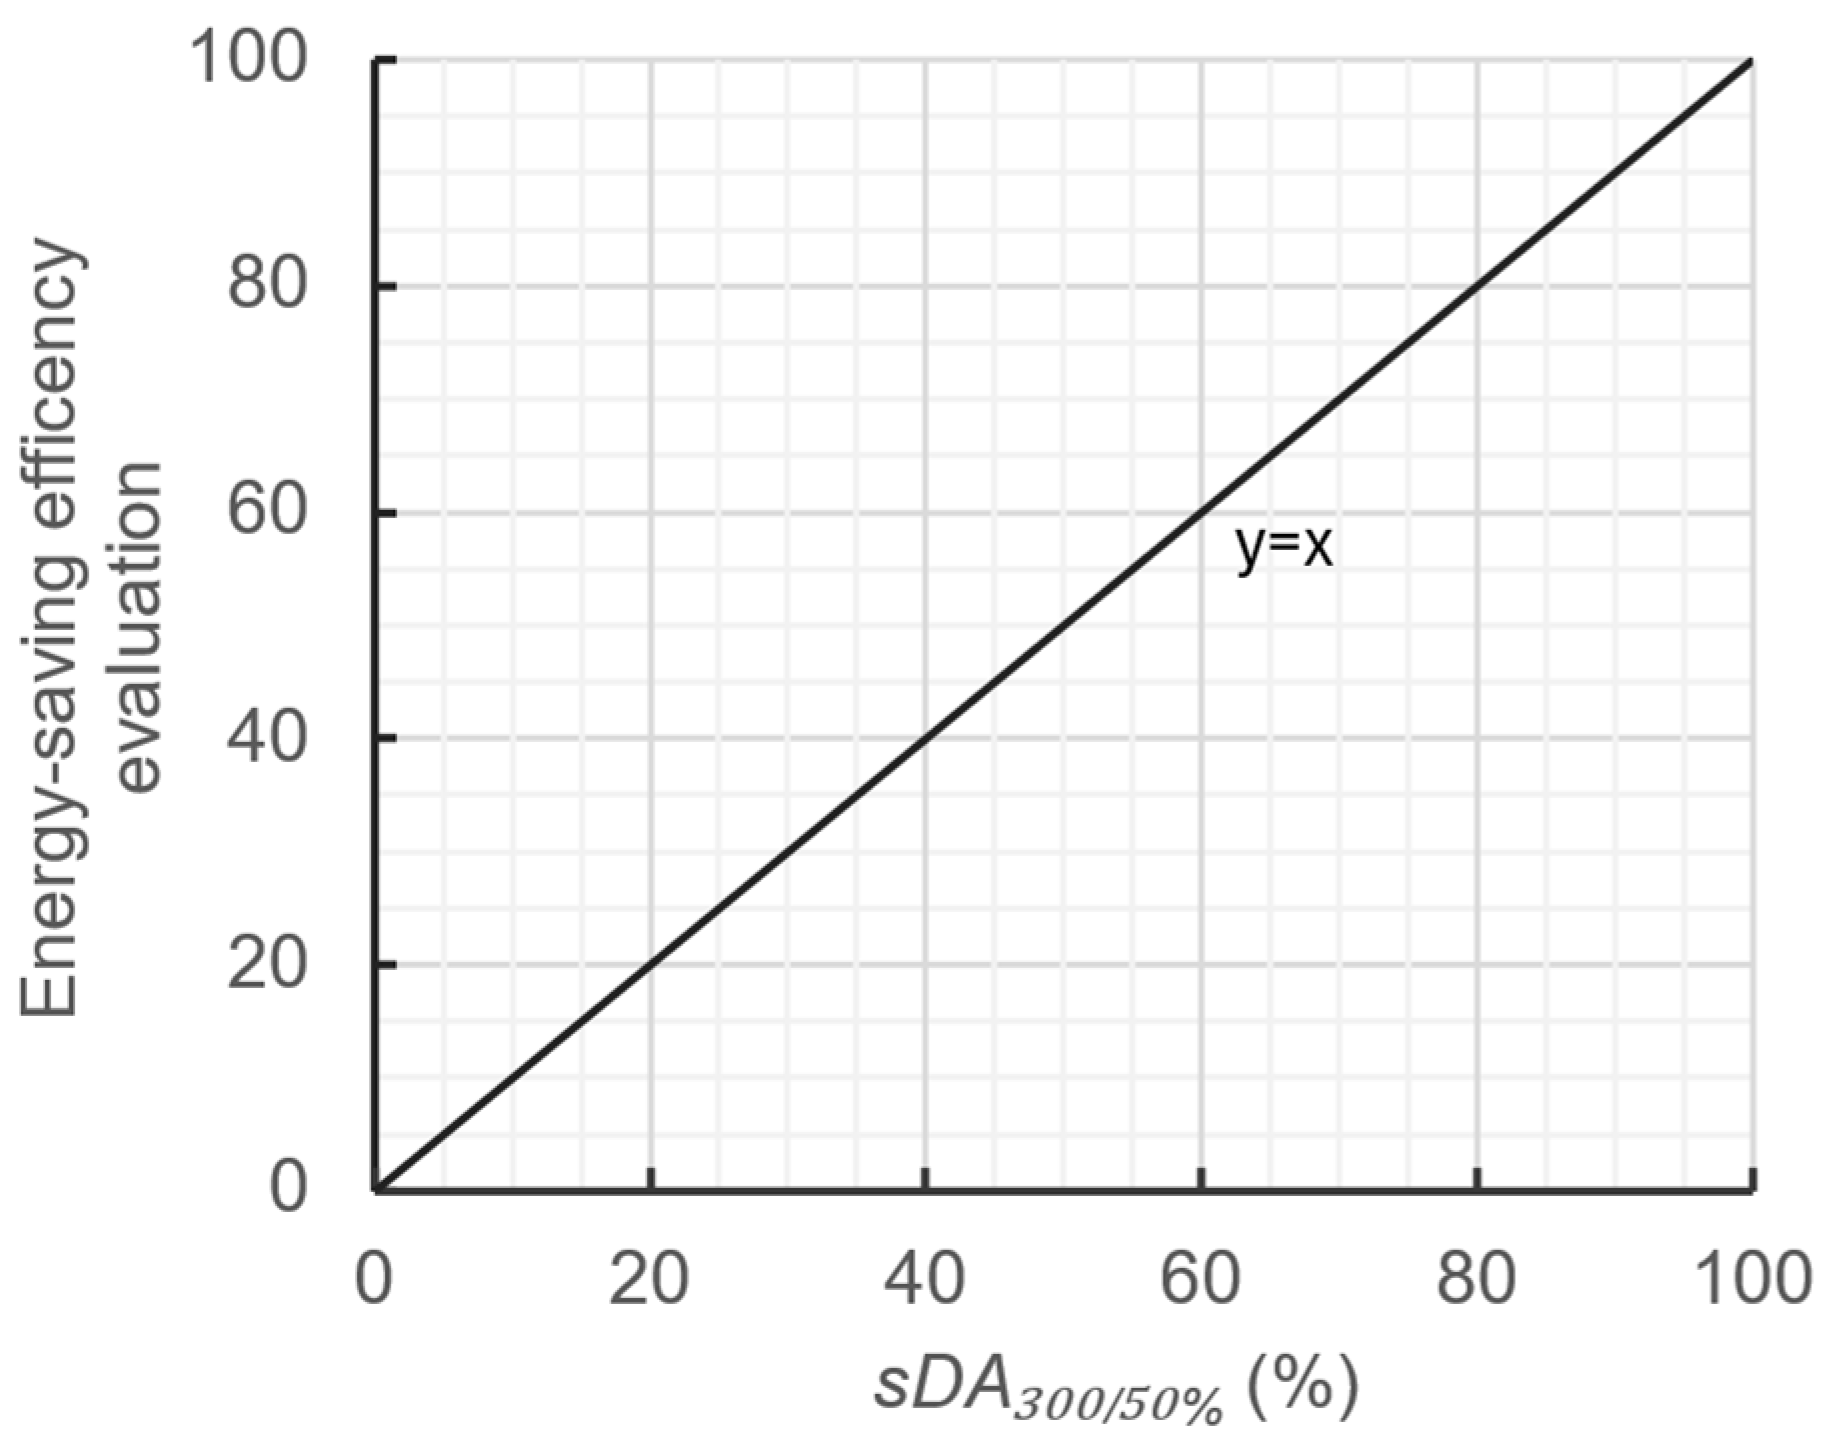
The Lmean-based term is used here specifically to operationalize the adopted field-derived satisfaction model within a morphology-oriented design-search workflow. It is therefore treated as a scene-based, satisfaction-oriented visual indicator for the present task, and is not intended as a substitute for glare- or annual-risk metrics that may be required in other daylight assessments. Figure 6 illustrates the normalized sDA-based daylight sufficiency term, which increases linearly with sDA300/50% and is used in this study as a proxy for daylight-linked lighting energy-saving potential under an ideal daylight-responsive control assumption.

3.3.3. Baseline Weighting Scenario and Sensitivity Analysis

The two retained objective terms in Equation (4) are a luminance-based visual satisfaction proxy (f1) and an sDA-based daylight-sufficiency term (f2). The AHP questionnaire covered four perceived daylight-performance criteria: uniformity, softness, subjective lighting satisfaction, and visual comfort rating. Because these four questionnaire criteria are not identical to the two retained objective terms, and because f2 is an sDA-based daylight-sufficiency term rather than a subjective satisfaction variable, the AHP results are not interpreted as direct objective weights for f1 and f2. Instead, they are retained as supporting expert-preference evidence indicating that satisfaction-oriented daylight appraisal was prioritized by the consulted expert panel.
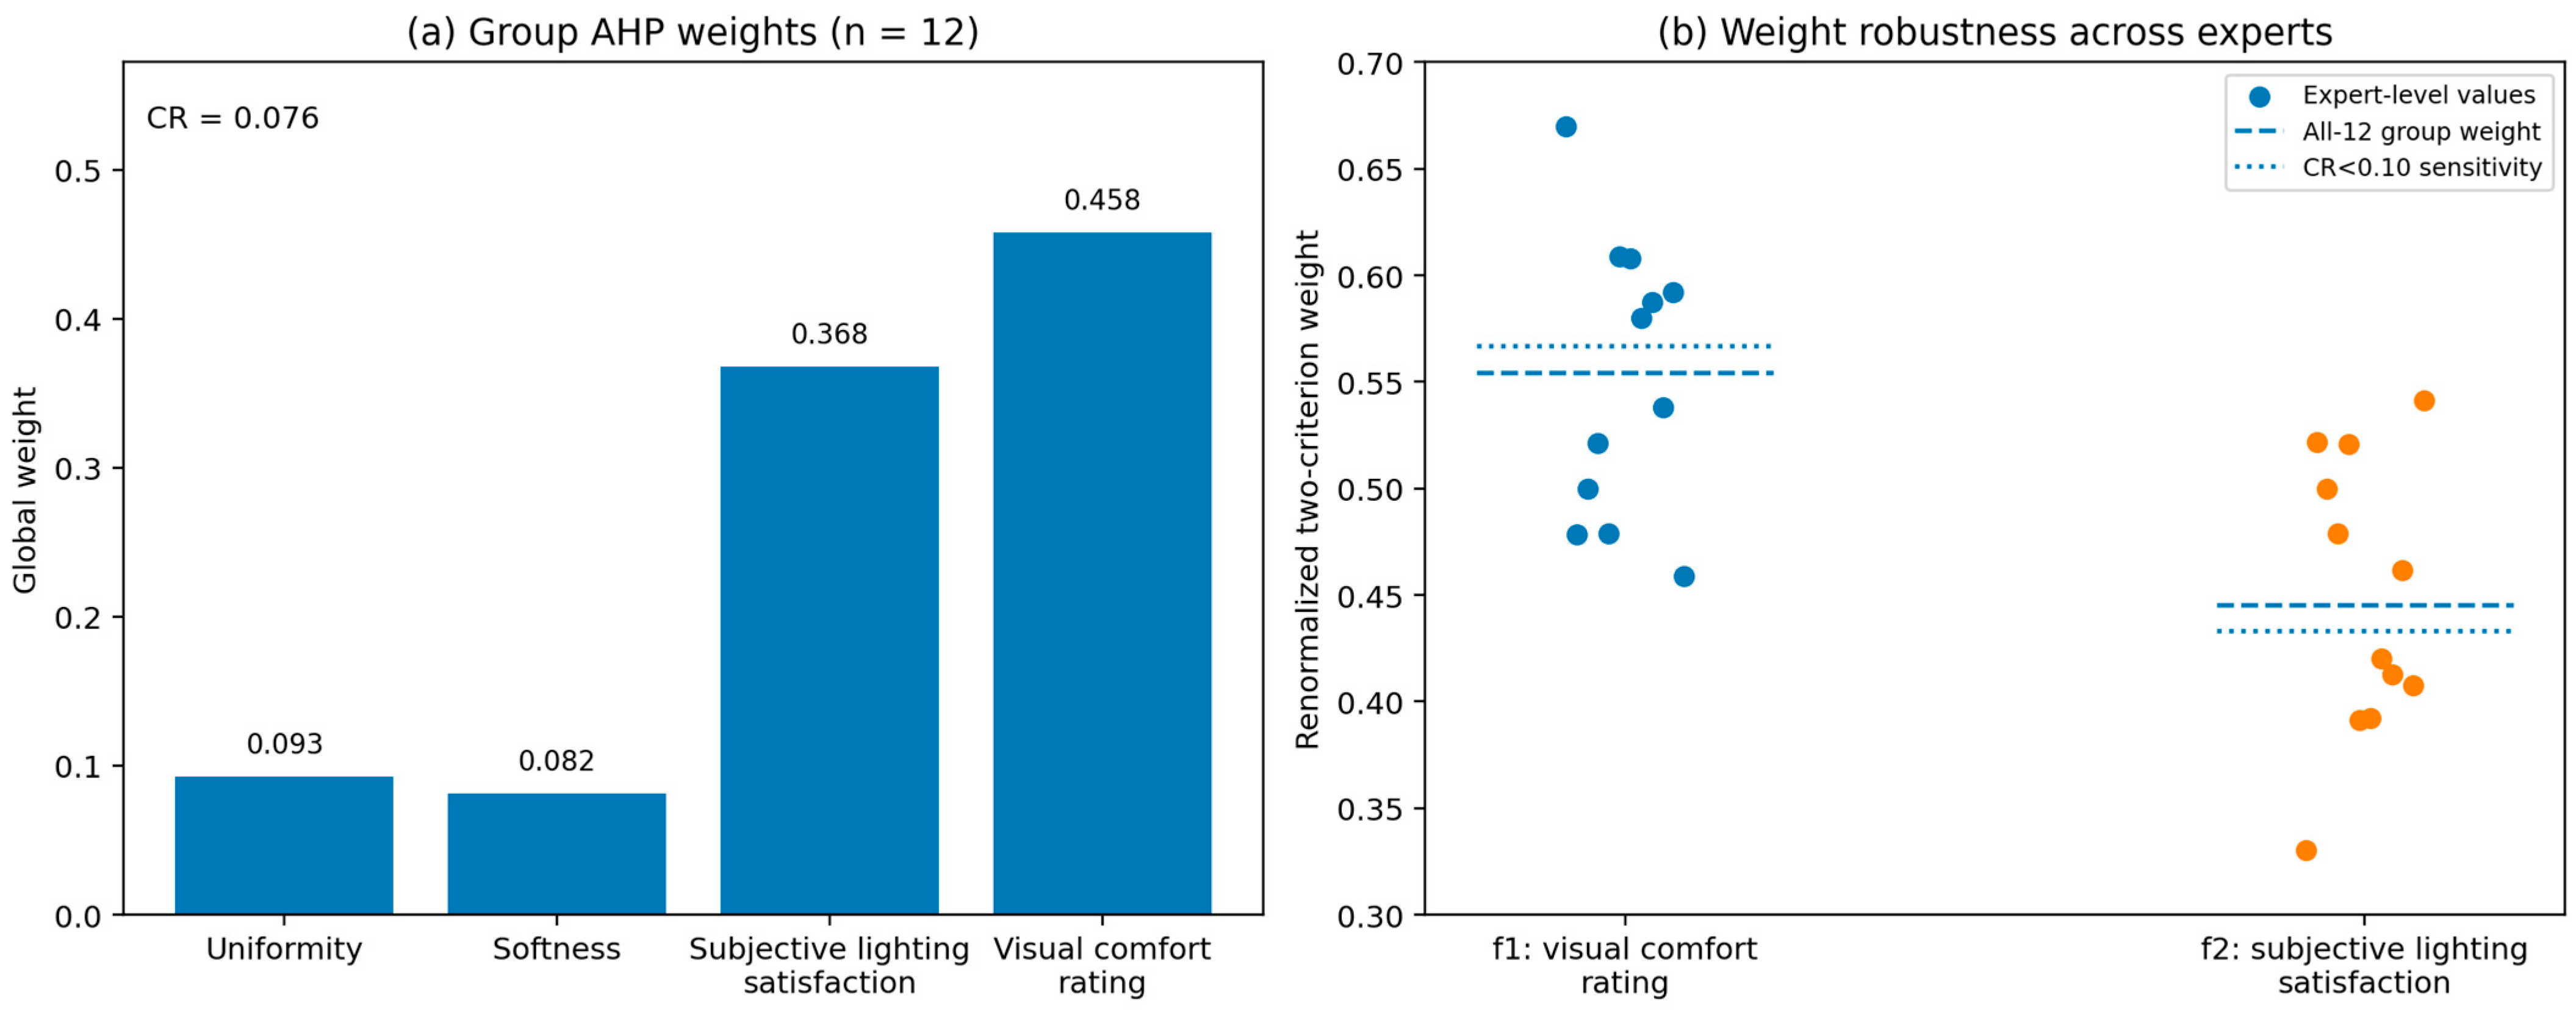
The AHP questionnaire was distributed by email in 2025 and completed by 12 experts, all of whom held doctoral degrees in architecture and had research backgrounds in architectural design, building physical environment, green building, and building energy efficiency. Each expert judgment matrix was reconstructed as a reciprocal matrix before aggregation, a step that also resolved one non-reciprocal pairwise entry in a single questionnaire. The 12 reconstructed matrices were then aggregated using the geometric mean of pairwise comparisons to form a group judgment matrix, and the group priority vector was obtained by the principal eigenvector method. The resulting group matrix showed acceptable consistency, with a consistency ratio (CR) of 0.076. The four global weights were 0.093 for uniformity, 0.082 for softness, 0.368 for subjective lighting satisfaction, and 0.458 for visual comfort rating.
For the weighted design-search demonstration, Equation (4) is formulated as a baseline weighting scenario rather than as a direct AHP-derived objective-weight assignment. The baseline scenario uses w1 = 0.55 for the luminance-based satisfaction term and w2 = 0.45 for the sDA-based daylight-sufficiency term. These values were selected to place a slightly higher emphasis on the satisfaction-oriented term while still assigning substantial weight to daylight sufficiency. To examine the influence of this assumption, a sensitivity analysis was conducted by varying w1 from 0.30 to 0.70, with w2 = 1 − w1. Expert-level results, the group judgment matrix, and the weighting-scenario sensitivity analysis are provided in Appendix A.
f   = w 1 · f 1 + w 2 · f 2
where f1 is the normalized luminance-based satisfaction proxy, f2 is the normalized sDA-based daylight-sufficiency term, and w1 and w2 are the scenario weights assigned to the two retained terms. In the baseline scenario used for the main analysis, w1 = 0.55 and w2 = 0.45. These weights should be interpreted as a scenario setting for the present design-search workflow rather than as a universal or directly AHP-derived measure of objective importance. Because the second term is based on sDA300/50% alone, f should be interpreted as combining a luminance-based satisfaction proxy with daylight sufficiency and the potential for reduced electric-light use under ideal daylight-responsive control, rather than with actual annual lighting energy consumption. ASE was not embedded in Equation (4) and should therefore be understood as an omitted complementary daylight-risk metric, not as an implicitly satisfied condition.

3.4. PSO-Based Design-Search Implementation

Particle swarm optimization (PSO), originally introduced by Kennedy and Eberhart [43], was used as the practical search algorithm for the weighted scalar objective [44]. In the present implementation, each particle encoded a candidate combination of well width, length-to-width ratio, corridor width, floor height, and number of floors. The length-to-width ratio was used to constrain well proportions so that the simulated atrium remained within conventional architectural ranges. The initial particles for each variable were randomly generated within the permitted value ranges and then used to build the corresponding Rhino–Grasshopper 3D geometry models.
In this framework, the five bounded morphological variables were evaluated through repeated external simulations, and each candidate solution returned a single scalar fitness value after the visual and daylight-sufficiency criteria had been weighted and combined. For this type of black-box, continuous-parameter search, PSO offers a relatively direct coupling strategy between MATLAB v2020b and the Rhino–Grasshopper v7.3/ClimateStudio v1.1 environment, and it has been used previously in building performance optimization [34,45]. The intent was therefore to obtain one preferred solution for each atrium type under a fixed weighting assumption, rather than to perform a Pareto-based multi-objective comparison.
This choice should not be read as evidence that PSO is generally the best algorithm for atrium daylighting optimization. Recent atrium studies have often adopted Pareto-oriented tools such as Octopus or GA [9,10,11,12], and such methods are better suited when the objective is to compare trade-offs explicitly across competing criteria. PSO can also be sensitive to population size and control parameters, and may converge prematurely or require careful tuning. PSO is therefore used here as a practical algorithmic component of a weighted search workflow, with the acknowledgment that alternative algorithms may produce different search behavior or different sets of preferred solutions.
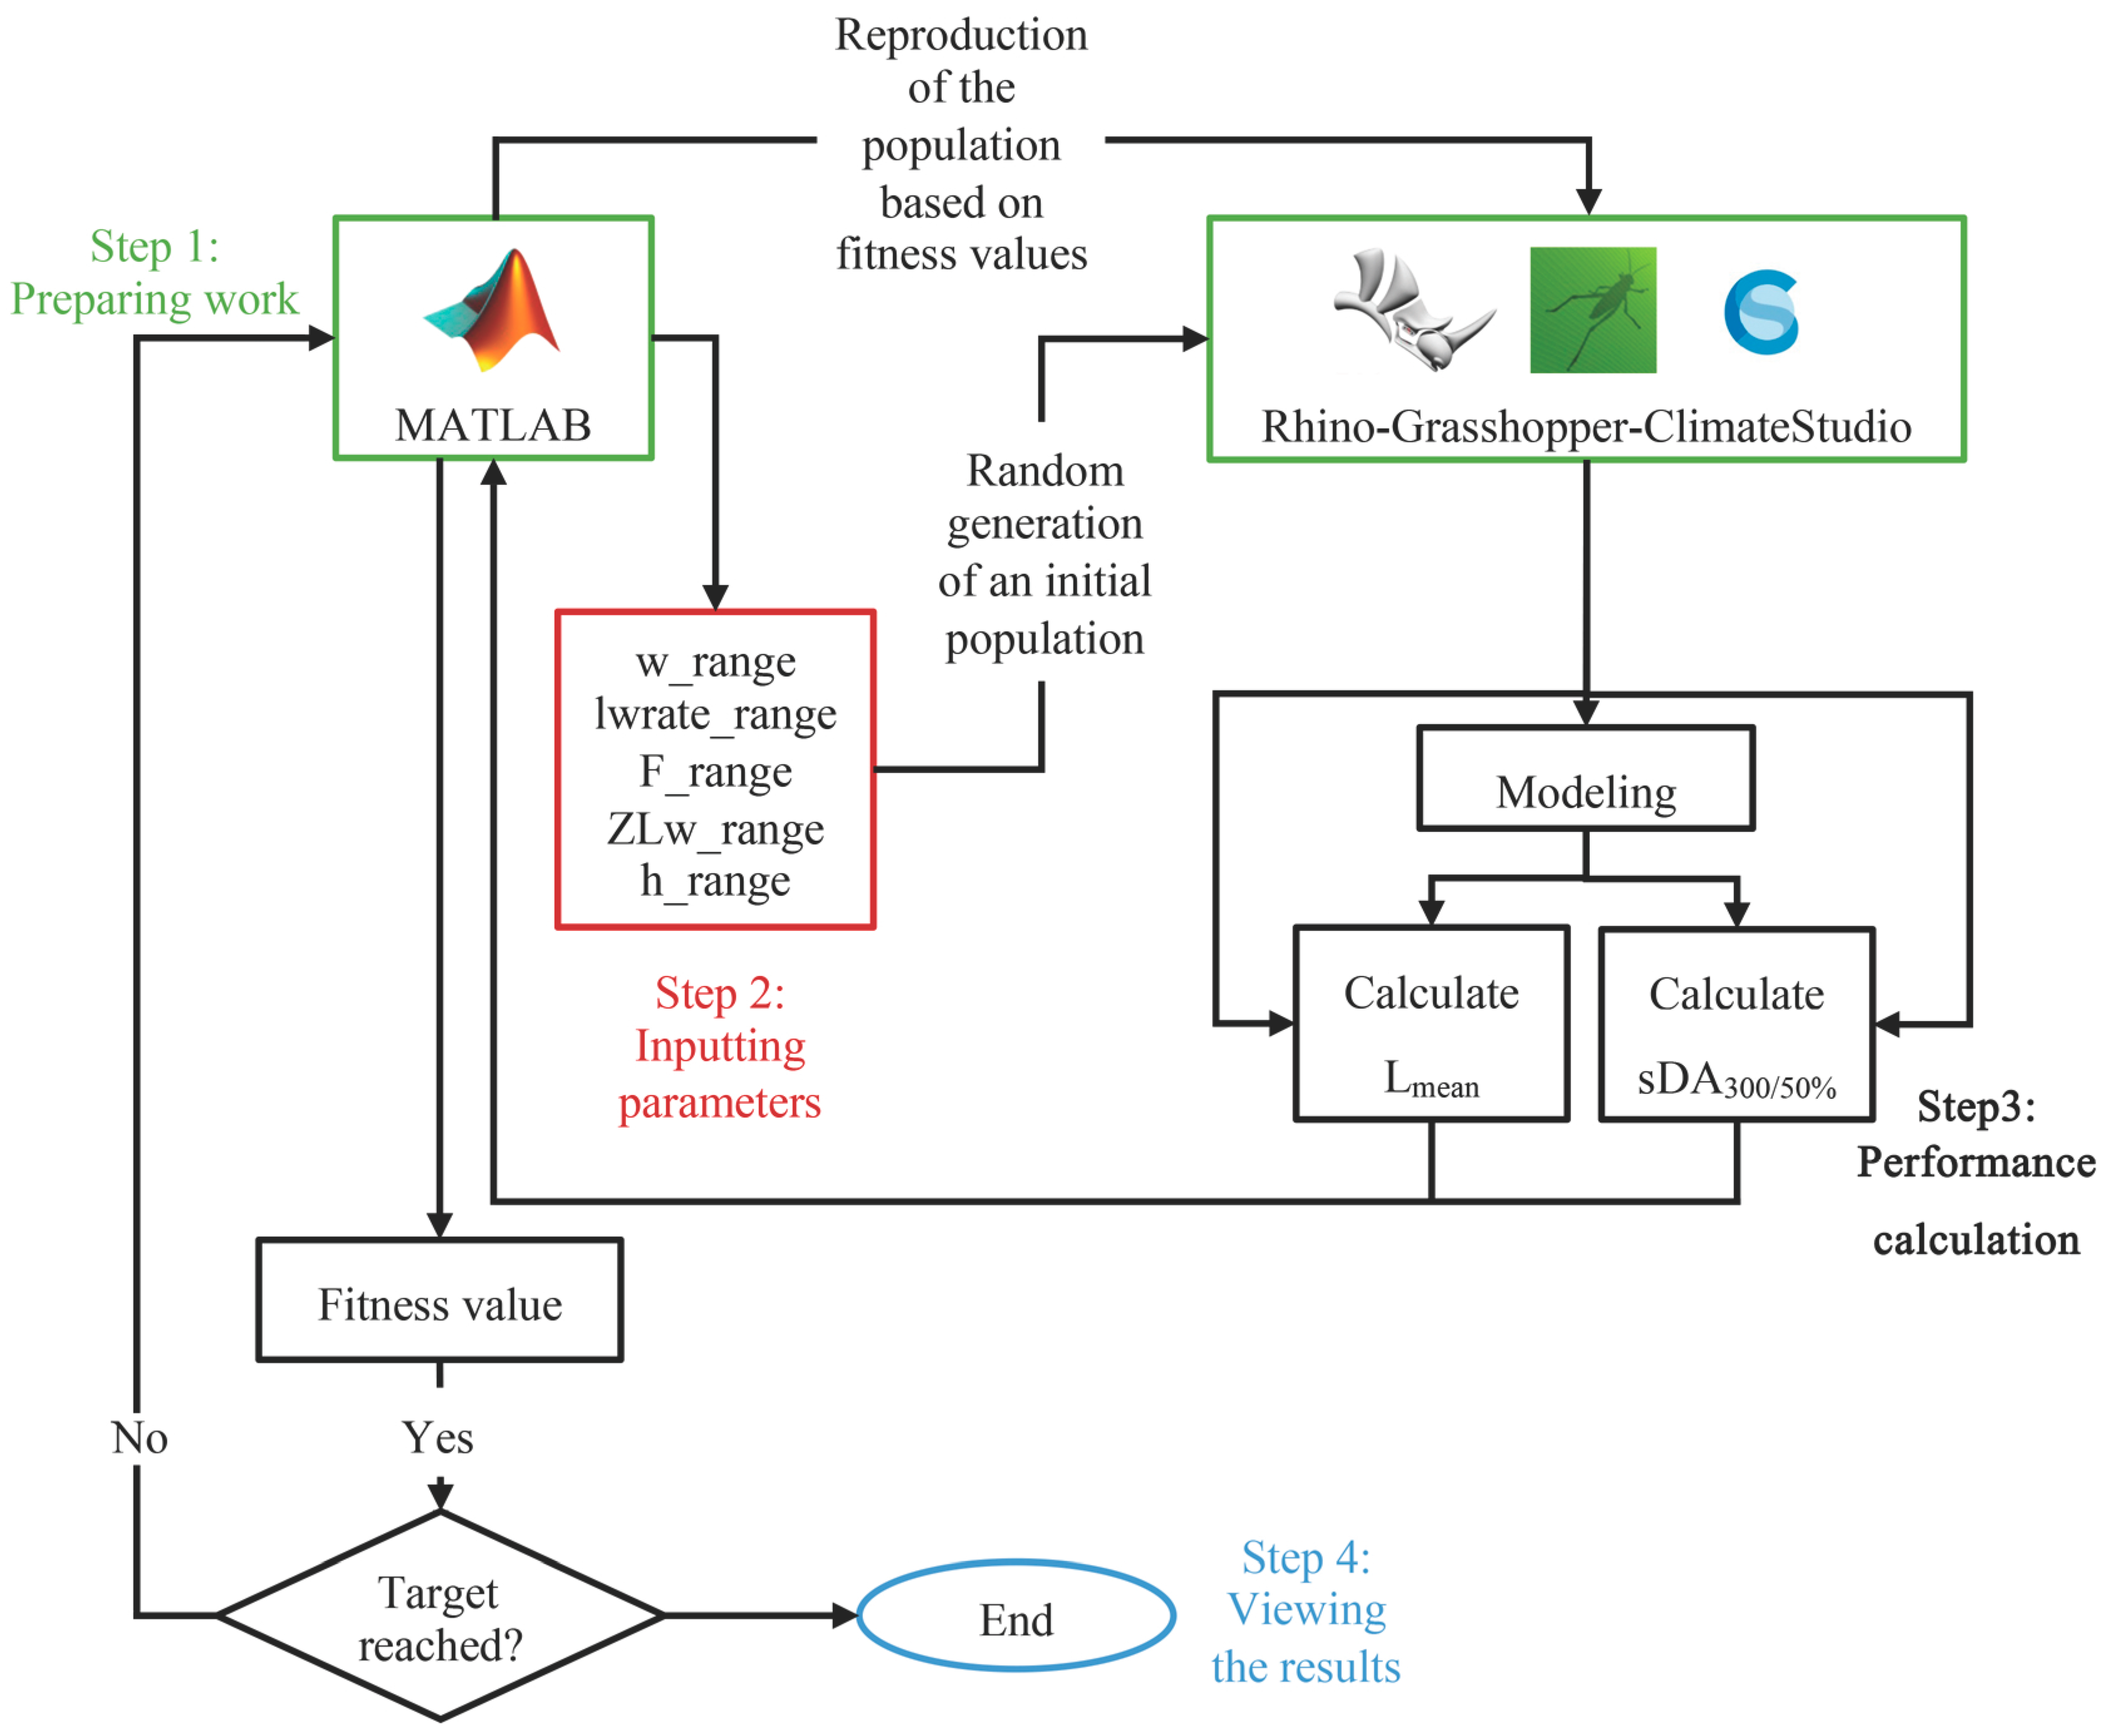
A flowchart of the daylighting-simulation-based design-search approach is given in Figure 7. The Grasshopper definition files, MATLAB v2020b scripts, and workflow instructions used in this study are described in the Code Availability Statement.
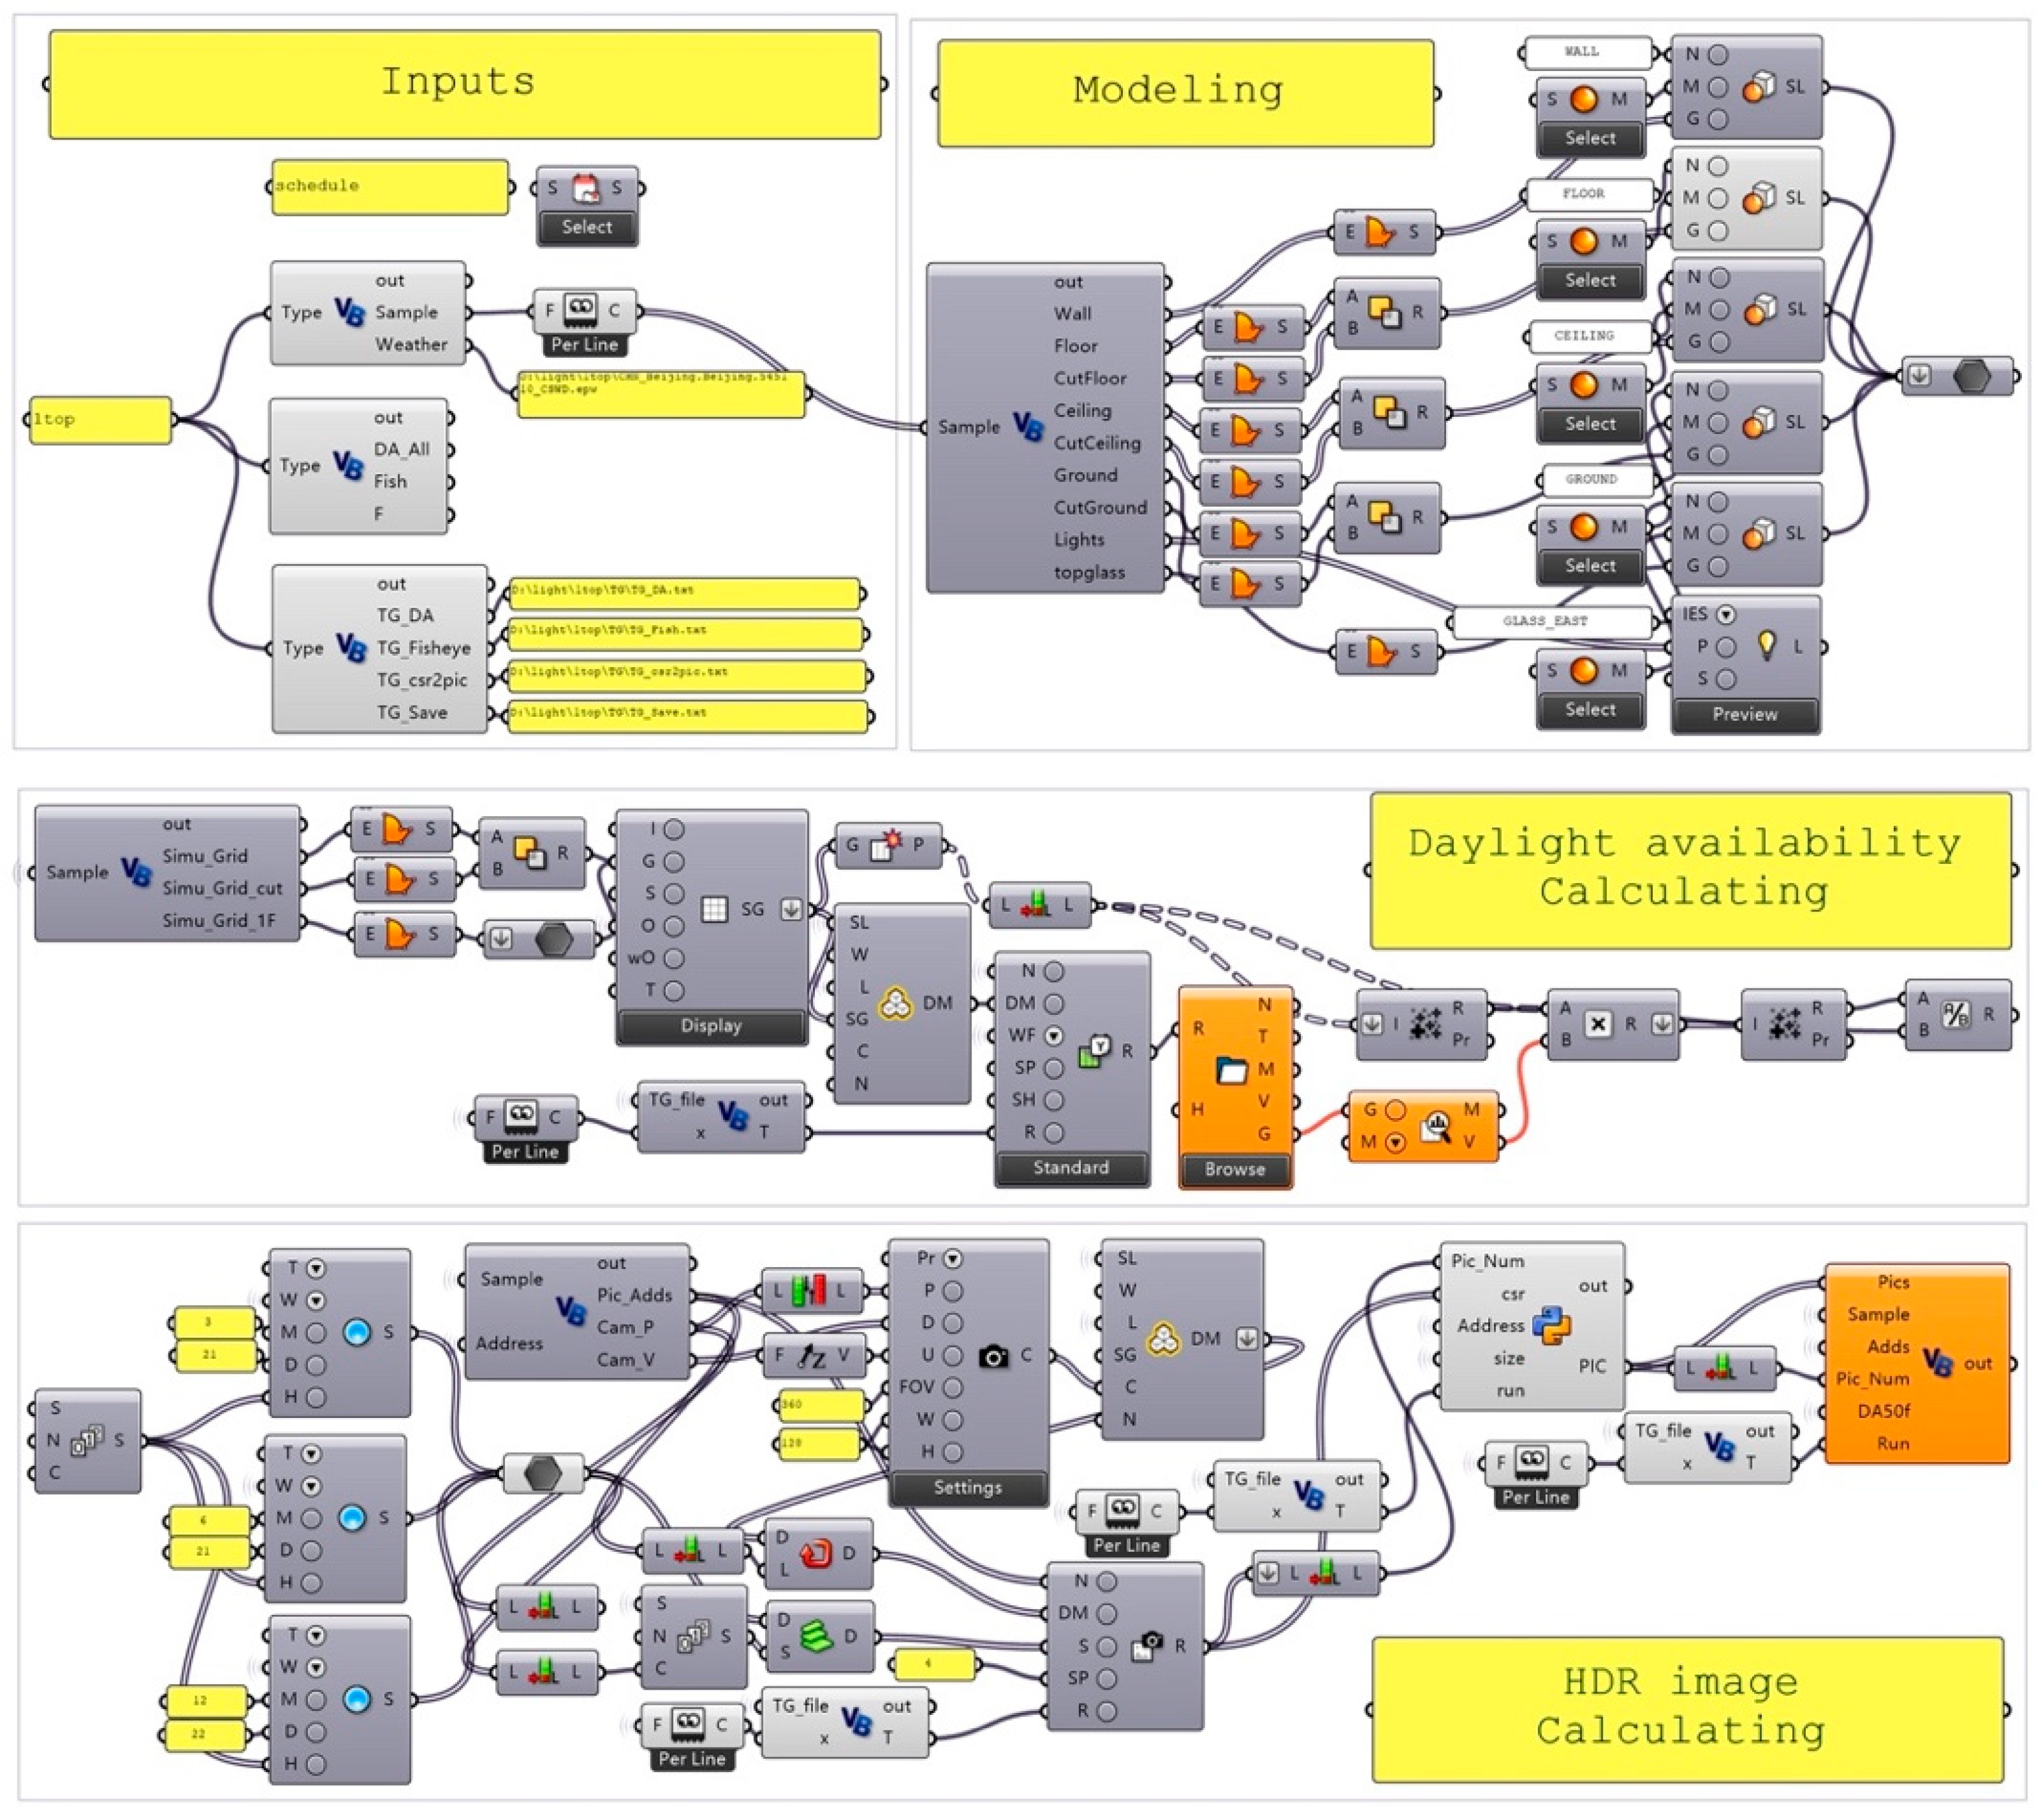
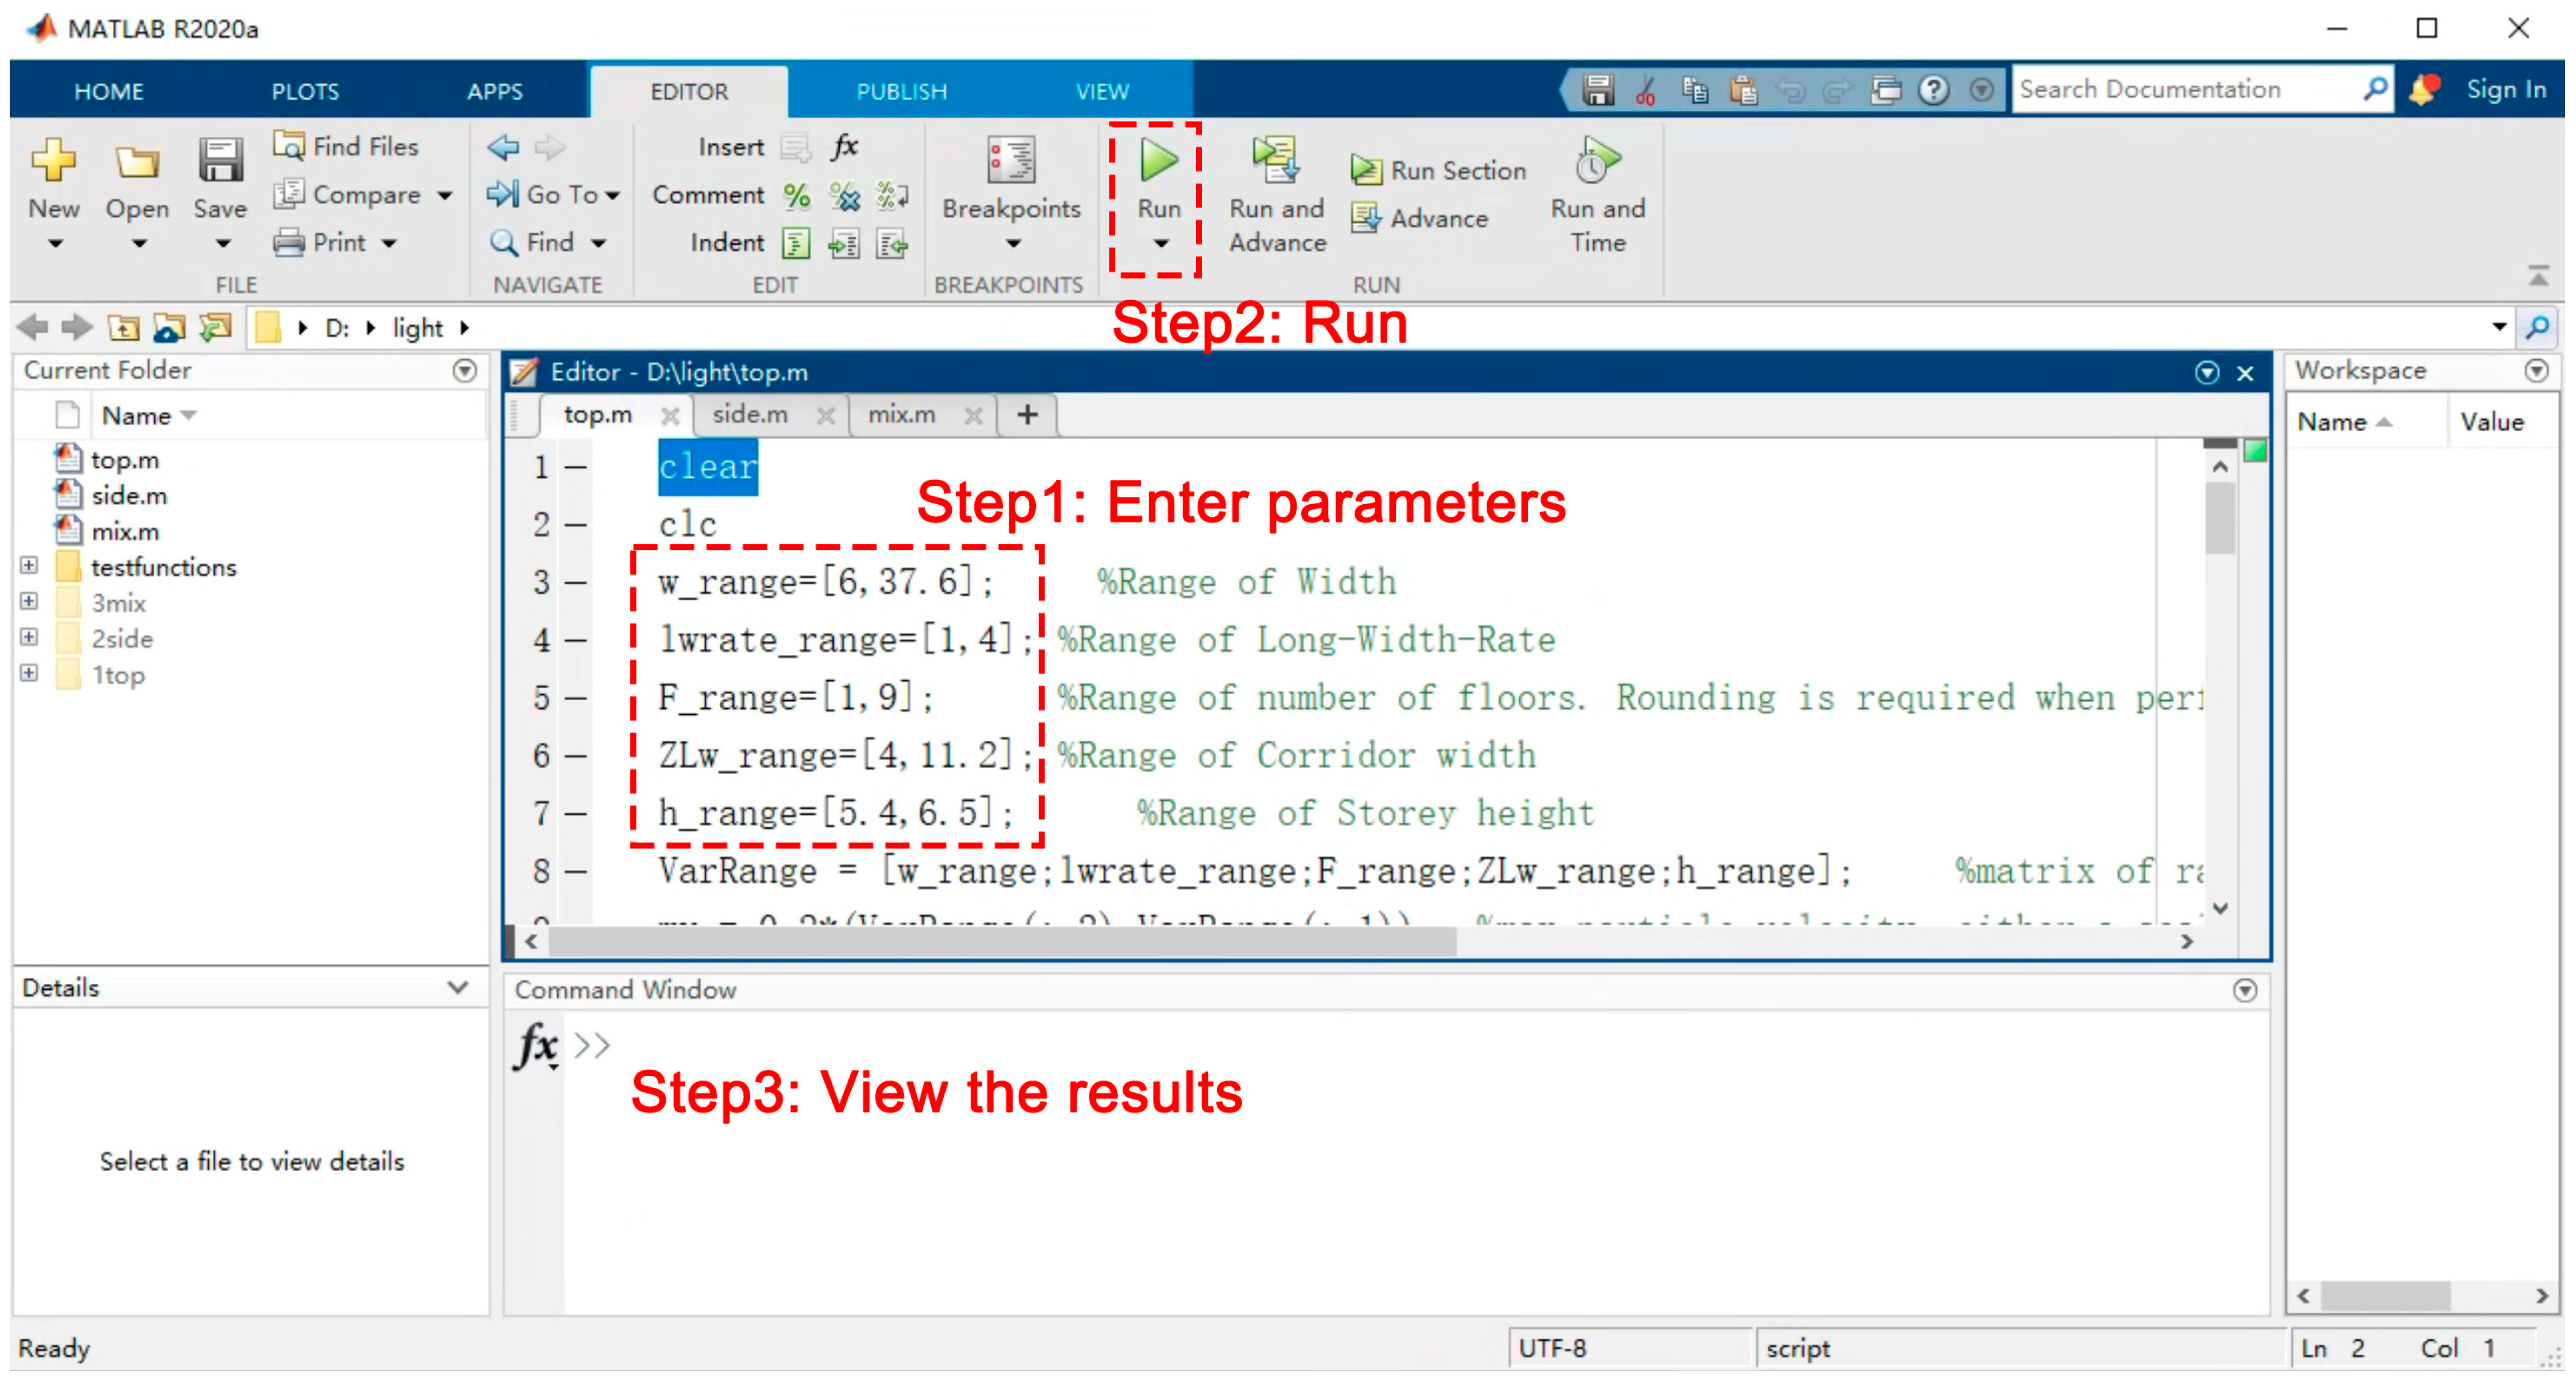
Rhino–Grasshopper v7.3 and ClimateStudio v1.1 were first installed on the host computer. The README file at the provided link was then consulted and the corresponding paths were configured. Finally, the relevant .gh files were opened in Grasshopper and the .m files in MATLAB v2020b, as shown in Figure 8 and Figure 9, respectively. The calculation itself consisted of three steps—entering parameters, running the calculation, and viewing the results (Figure 9).
Step 1—Entering parameters. The model parameters were entered into the input file. For a more complex model, variables can be modified or added by editing the program code.
Step 2—Running the calculation. Once the setup was complete, the run button was pressed and the automated design search began. During this process the randomly generated parameters were passed to the Grasshopper program, which performed the geometry construction and the Lmean and sDA300/50% simulations. The simulation outputs were then fed back to compute the integrated evaluation value. PSO was initialized with a swarm of random particles and searched for high-scoring solutions by updating the particles across generations.
Step 3—Viewing the results. Once the stopping criteria were met, the calculation terminated, and the highest-scoring solution identified in the run could be inspected in the command window.

4. Case Studies

4.1. Description of Building Models

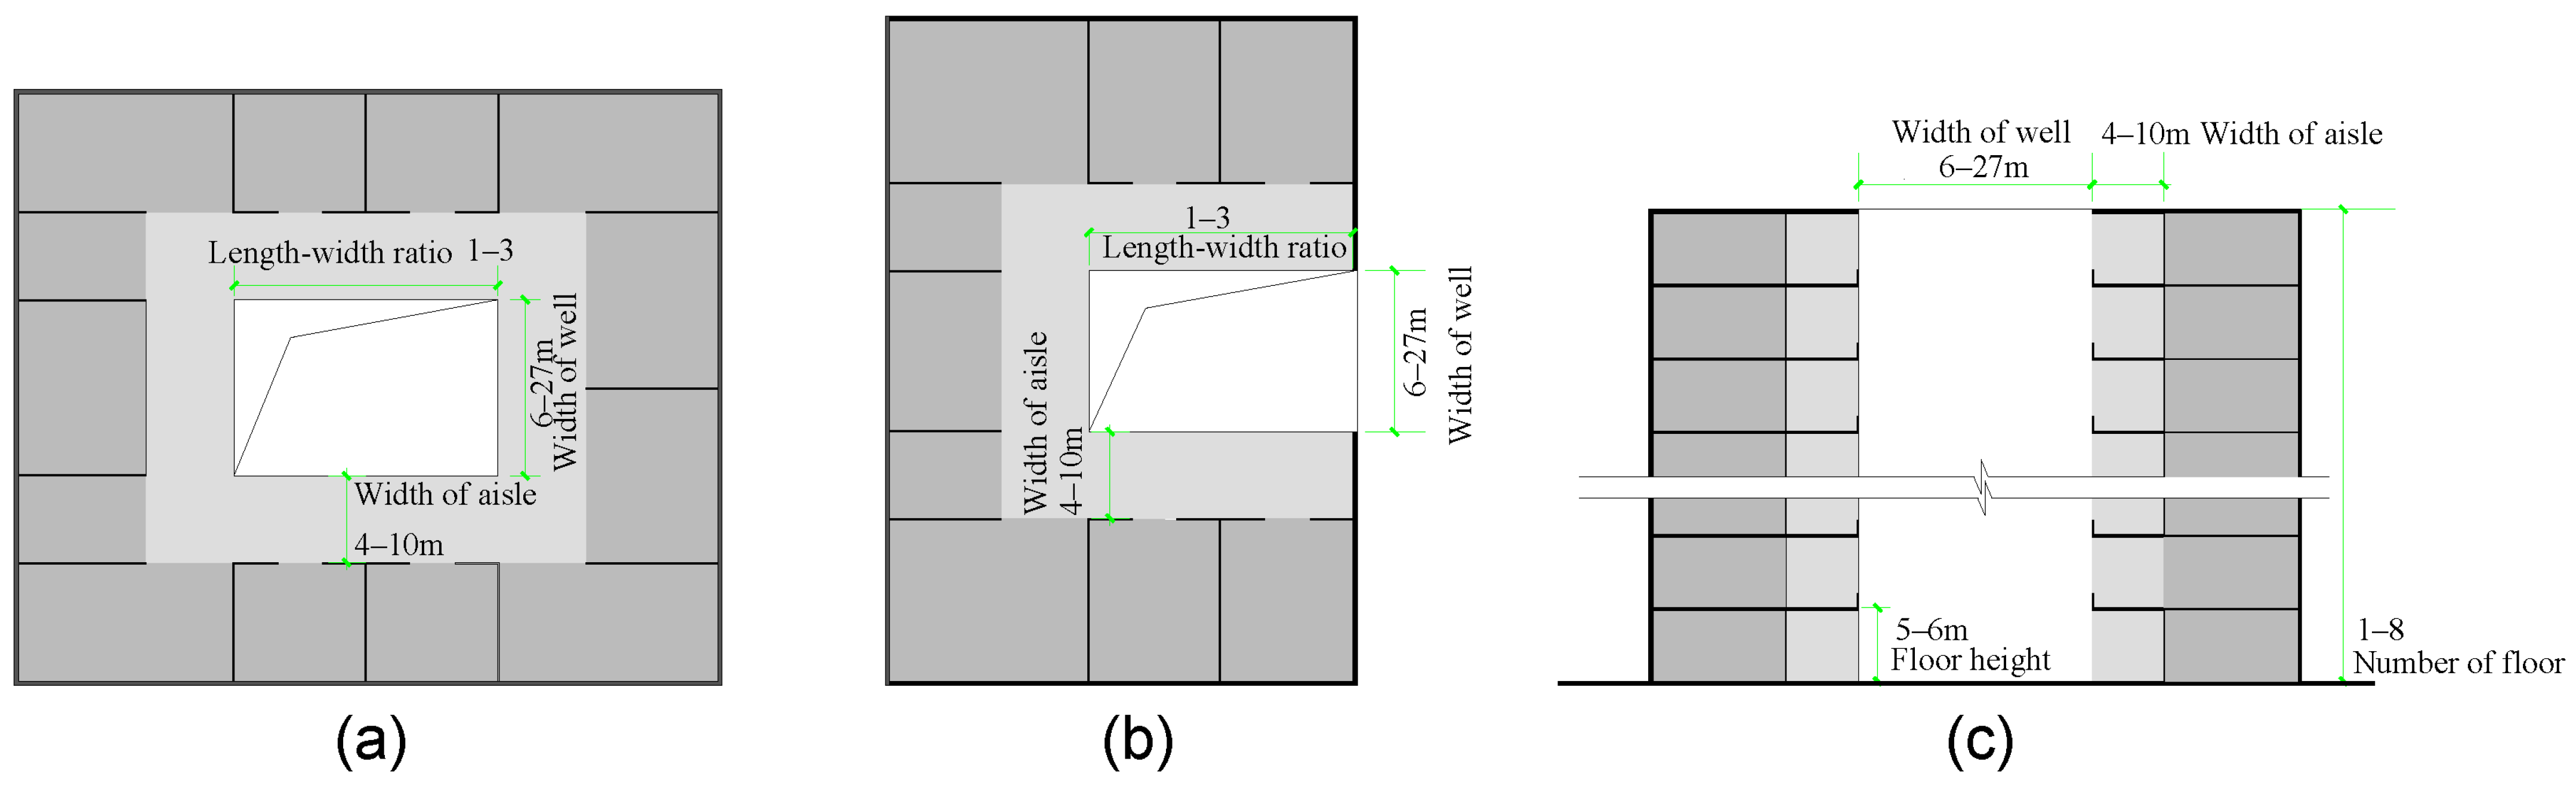
The developed method was applied to three test models representing the central top-daylit atrium, the semi-enclosed side-daylit atrium, and the semi-enclosed combined-daylit atrium. All three models used the common search bounds defined in Table 3 so that the typologies could be compared within the same morphological parameter space. A schematic of the atrium morphological parameters is shown in Figure 10. The long side of the central atrium was aligned east–west, and the side window of the semi-enclosed atrium faced east.

4.2. Setting of the Swarm Optimization

The population size was set to 24 and the maximum number of epochs to 50. The initial particle matrix for each variable was built by combining the design-parameter ranges. Both C1 and C2 were set to 2, and the inertial weight was set to 0.4. PSO control parameters followed those in [45] and were refined through preliminary trials conducted by the authors. Evolution of the population continued until either the maximum iteration count was reached or the best individual remained unchanged for ten consecutive generations.
Independent repeated-run statistics across alternative random seeds were not collected, and cross-run stability was therefore not evaluated in this study. Accordingly, the reported parameter combinations should be interpreted as the highest-scoring candidates identified under the present implementation settings rather than as statistically confirmed global optima.

5. Results

The results are presented in four parts. Section 5.1 summarizes the behavior of the two retained objective terms, namely the luminance-based satisfaction proxy f1 and the sDA-based daylight-sufficiency term f2. Section 5.2 presents the distribution of evaluated candidate solutions in the f1f2 plane and explains the saturation of the sDA-based term. Section 5.3 reports the preferred parameter combinations identified for the three atrium typologies under the adopted baseline weighting scenario. Section 5.4 compares the three reported solutions and discusses their practical interpretation.
Because independent repeated runs were not evaluated, the configurations should be interpreted as preferred solutions under the present search settings, not as statistically stable global optima.

5.1. Behavior of the Two Retained Objective Terms

The two retained objective terms showed different interpretive roles in the design-search results. The first term, f1, represents the normalized luminance-based satisfaction proxy derived from the Lmean–satisfaction regression. It varies with the simulated scene mean luminance and is therefore used to differentiate candidate solutions in terms of the adopted satisfaction-oriented visual indicator. The second term, f2, represents sDA-based daylight sufficiency. Because f2 is calculated from sDA300/50%, it increases with the percentage of analysis points that meet the 300 lx threshold for at least 50% of the occupied hours.
All results reported below are based on the baseline weighting scenario described in Section 3.3.3. The reported score should therefore be interpreted as a scenario-based weighted score combining f1 and f2, not as a universal measure of visual comfort or as a measure of actual operational lighting-energy performance.

5.2. Candidate-Solution Distribution and sDA Saturation

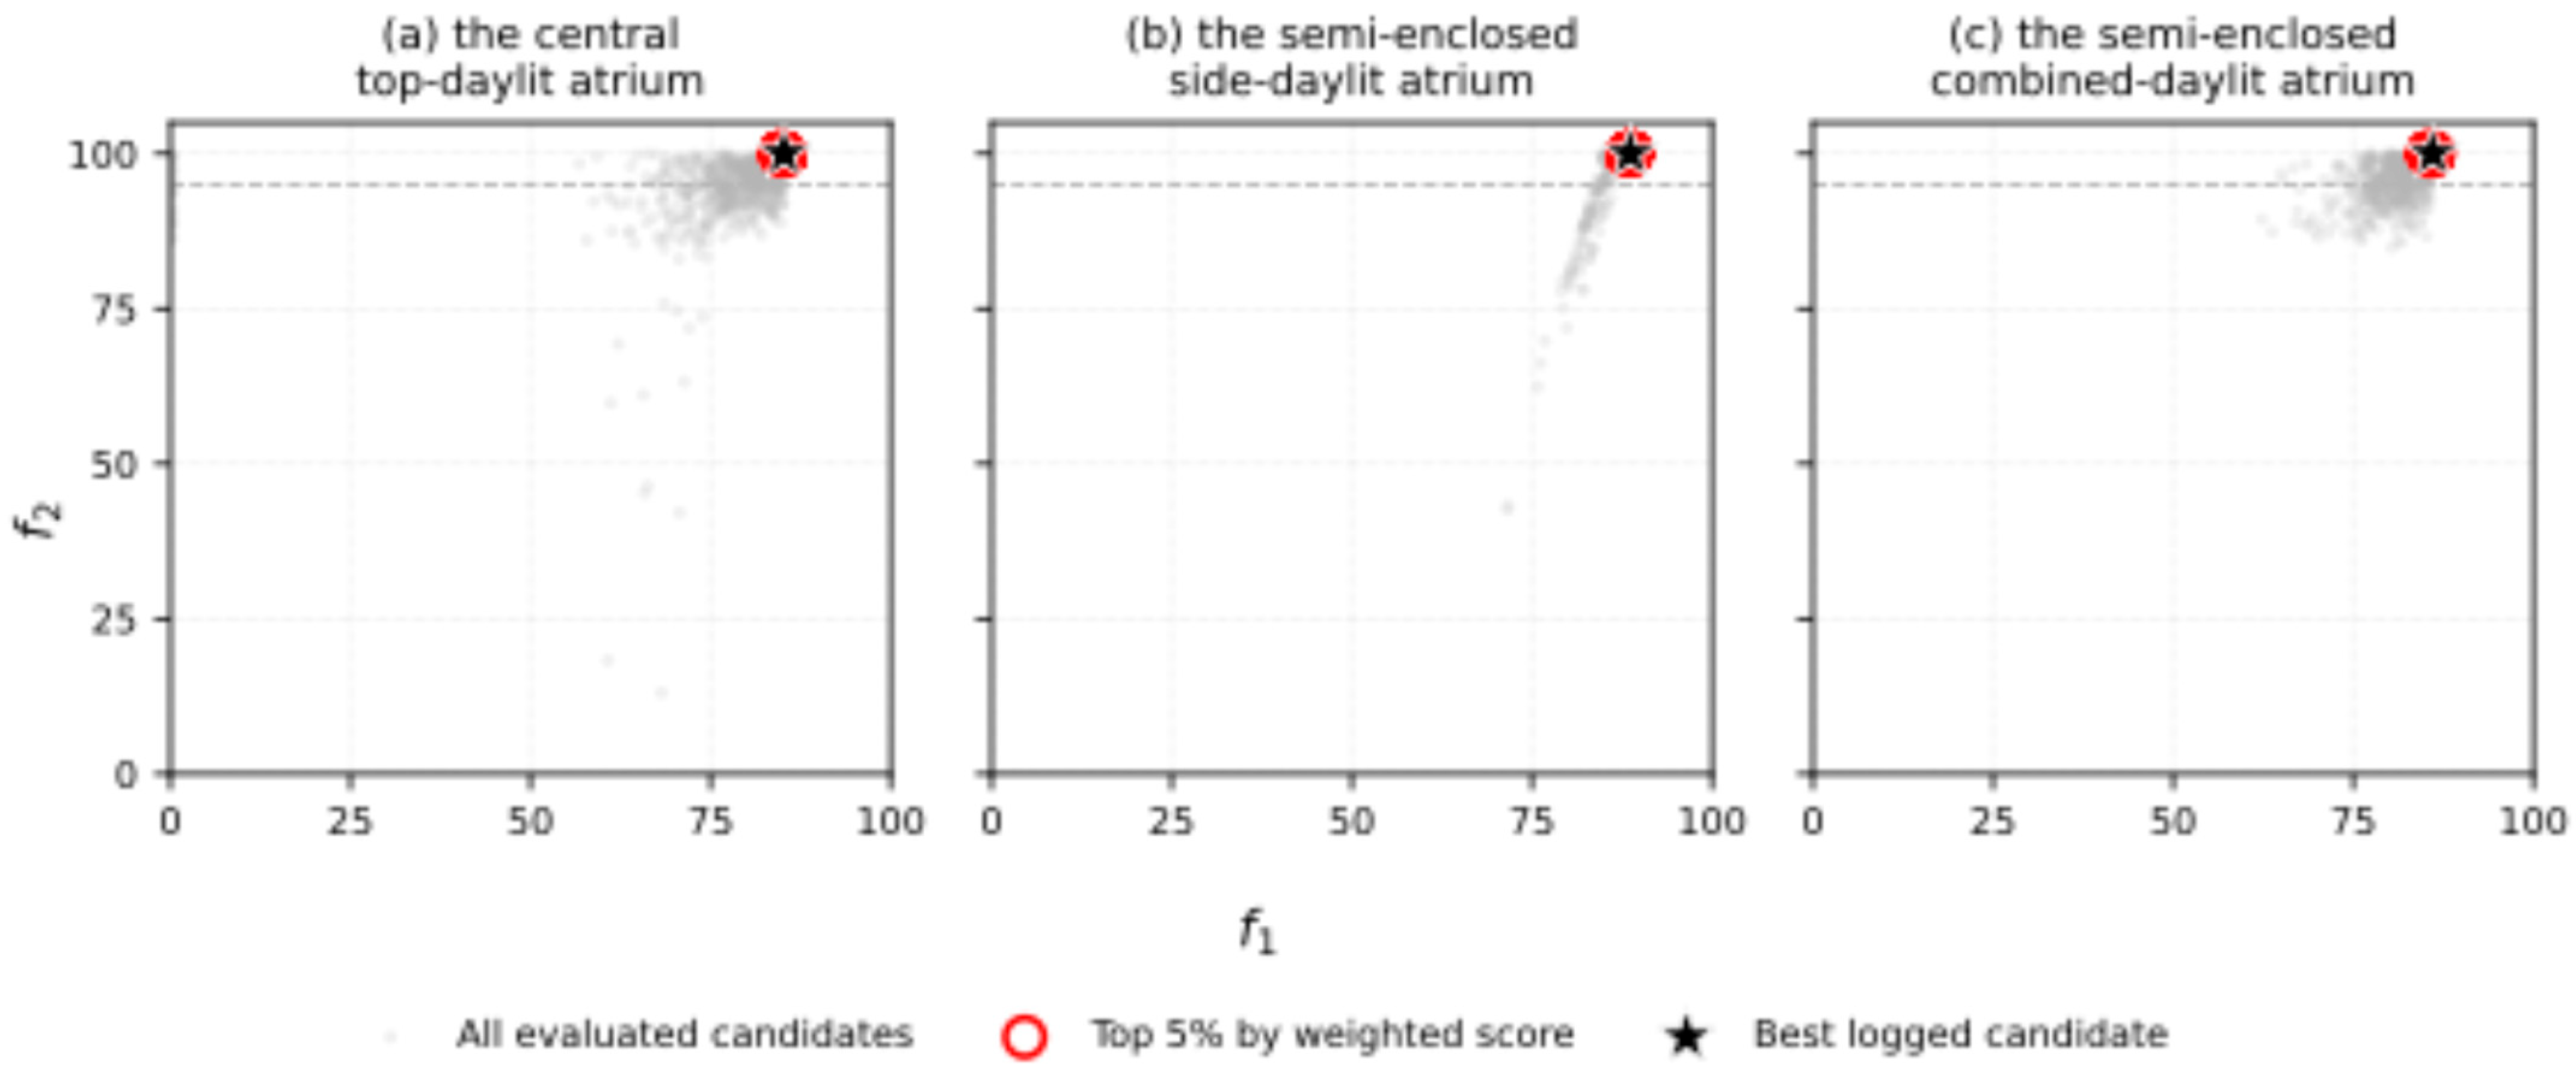
To examine whether the weighted search produced a broad two-criterion trade-off or a saturated daylight-sufficiency region, all evaluated candidate solutions recorded during the PSO runs were plotted in the f1f2 plane (Figure 11). Each point represents one simulated candidate solution, and the reported preferred solution for each atrium typology is marked separately.
Figure 11 shows that a substantial proportion of high-scoring candidates reached or approached the upper bound of the sDA-based term. This pattern indicates that the daylight-sufficiency term became saturated for many high-performing candidates, especially near the reported preferred solutions. Therefore, within this region, the weighted score no longer reflects a strong trade-off between f1 and f2. Instead, the remaining score differences are mainly associated with the luminance-based satisfaction term f1. The following preferred solutions should consequently be interpreted as high-scoring configurations within an sDA-saturated design region rather than as evidence of a broad visual–daylight trade-off across the full search space.

5.3. Preferred Solutions for the Three Atrium Typologies

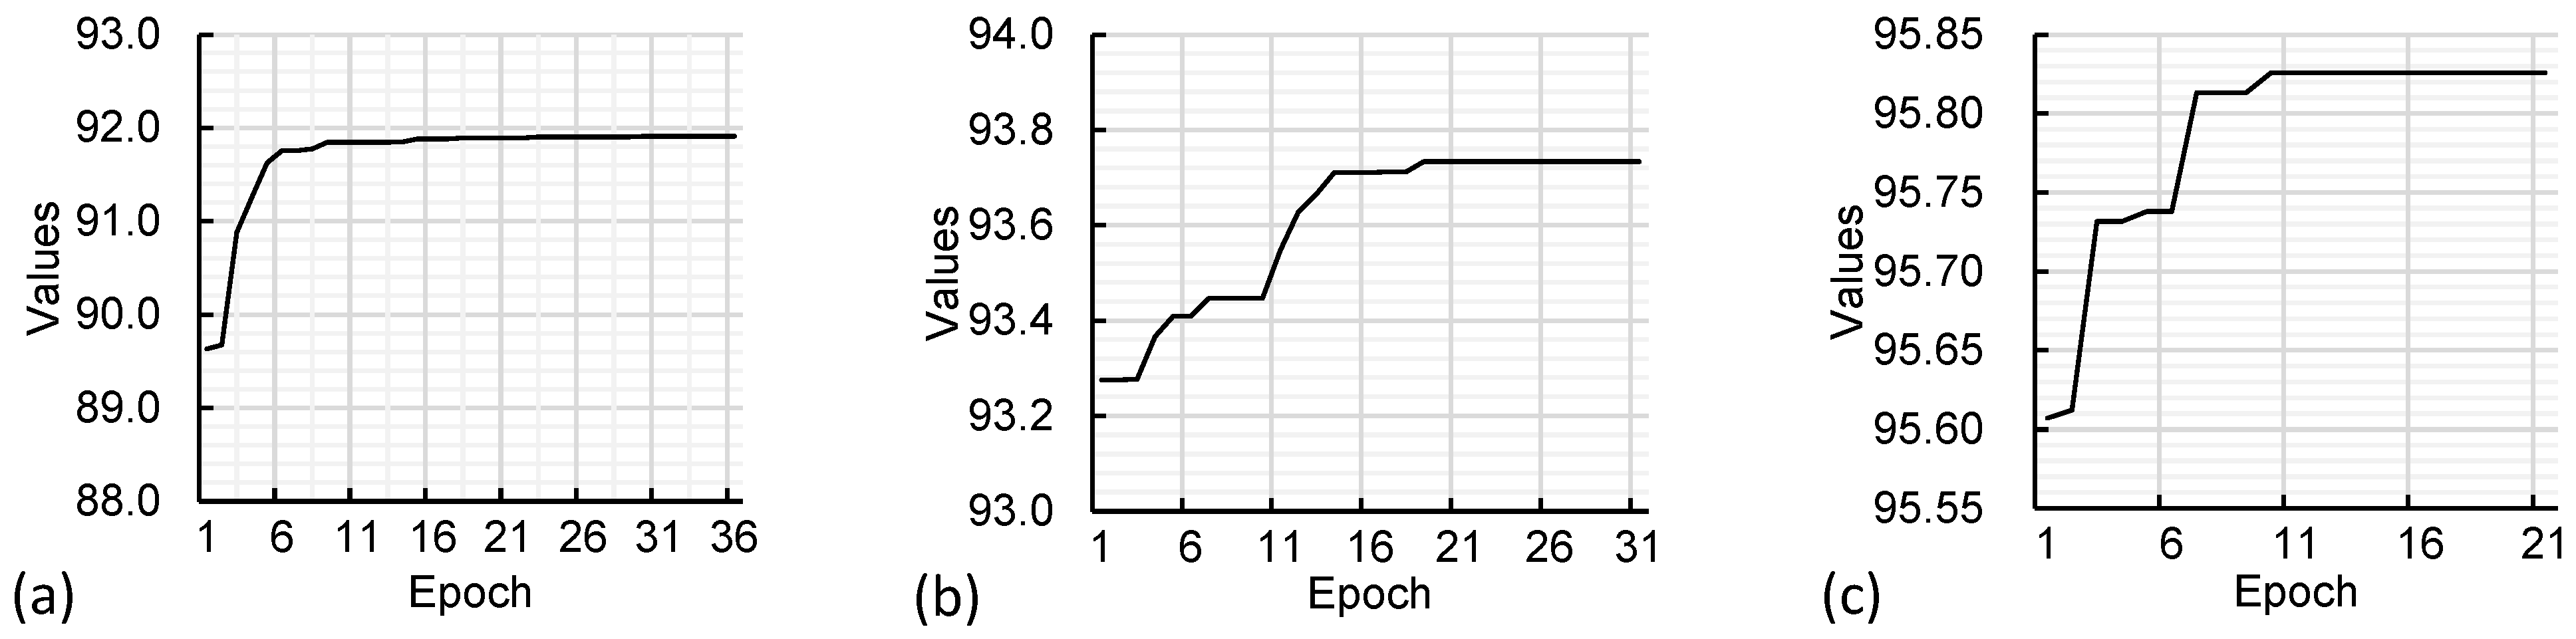
Using the PSO-based design-search procedure, one high-scoring parameter combination was identified for each atrium typology under the adopted baseline weighting scenario. Figure 12 shows representative fitness-improvement histories across epochs for the three atrium types. Within the present search settings, most score improvements occurred during the early and middle stages of the runs, whereas later epochs mainly refined the best-so-far solutions. These plots should be read as representative run histories under the current implementation, rather than as evidence of global convergence or cross-run stability.
Table 4 reports the preferred parameter combinations identified under the adopted baseline weighting scenario, together with the corresponding f1, f2, and weighted scores. These configurations are the highest-scoring solutions obtained under the present parameter bounds, PSO settings, and stopping criteria. They are therefore reported as preferred solutions under the current design-search setting, not as universally optimal atrium forms.
All three reported preferred solutions reached f2 = 100, indicating that they lie in a high-daylight-sufficiency region where the sDA-based term is saturated. Under this condition, the weighted score no longer reflects a strong trade-off between the two retained terms; instead, differences among the reported high-scoring solutions are mainly governed by the luminance-based satisfaction term. The results should therefore be interpreted as identifying preferred morphologies within an sDA-saturated design region rather than as demonstrating a broad visual–daylight trade-off across the full search space.
The semi-enclosed combined-daylit solution should be interpreted with particular caution. Its small well width, eight-floor height, floor area of only 68 m2, and low width-to-height ratio indicate a boundary-near mathematical solution generated under the present objective and constraint set. It is therefore not presented as a directly recommended architectural configuration. Additional functional, circulation, evacuation, and constructability constraints would be required before such a geometry could be considered a practically buildable atrium design.

5.4. Cross-Case Comparison and Practical Interpretation

The three reported solutions show different practical implications across the retained atrium typologies. The preferred central top-daylit atrium and the preferred semi-enclosed side-daylit atrium both had floor areas between 400 m2 and 800 m2, which corresponds to the conventional main-atrium size category [46]. By contrast, the preferred semi-enclosed combined-daylit atrium had a much smaller floor area of 68 m2, which reinforces the need to interpret this solution as a boundary-near mathematical outcome rather than as a direct design recommendation. It should also be noted that the reported preferred solutions were generated within the common cross-typology search bounds defined in Table 3, rather than within the narrower type-specific observed ranges summarized in Supplementary Table S2. Therefore, candidates that fall outside the observed range of a specific retained subtype should be interpreted as exploratory outcomes of the common bounded design-search space, not as direct interpolations from that subtype’s empirical sample.
The cross-sectional proportions also differed substantially. The central top-daylit atrium had a width-to-height ratio of 0.87, representing a moderate proportion. The semi-enclosed side-daylit atrium had a ratio of 2.19, indicating a more spacious section. The semi-enclosed combined-daylit atrium had a ratio of 0.15, indicating a very narrow and deep section [47]. These differences suggest that comparable weighted scores can be obtained through different morphological routes, but that the practical plausibility of each route depends on typology-specific functional and constructability constraints.
Overall, the results indicate three main findings. First, within the adopted search space, all reported preferred solutions satisfied the sDA-based daylight-sufficiency term, leading to saturation of f2. Second, once this saturation occurred, the luminance-based satisfaction term became the main differentiating component among the high-scoring candidates. Third, the practical interpretation of the preferred solutions was typology-dependent: the central top-daylit and semi-enclosed side-daylit solutions showed more conventional spatial proportions, whereas the semi-enclosed combined-daylit solution required additional architectural constraints before it could be considered practically applicable.

6. Discussion

6.1. Interpretation of the Retained Metrics and Weighting Scenario

The two retained terms in the present workflow have different scopes and should not be interpreted as a complete visual-comfort or energy-performance assessment. The first term, f1, is a luminance-based visual satisfaction proxy derived from the adopted regression between scene mean luminance (Lmean) and subjective lighting satisfaction in shopping-mall public spaces [5]. It is used here because it provides a direct link between simulated luminance conditions and field-based user-response evidence. However, it does not represent spatial variation across multiple user positions, directional discomfort, short-duration glare, or a complete annual visual-risk assessment.
The second term, f2, is based on sDA300/50% and represents annual daylight sufficiency. Under an ideal daylight-responsive lighting-control assumption, higher sDA indicates greater potential for reducing electric-light use, but it does not directly quantify measured or simulated operational lighting energy consumption. Therefore, the weighted score used in this study should be interpreted as a scenario-based design-search score combining a luminance-based satisfaction proxy and sDA-based daylight sufficiency, rather than as a universal index of visual comfort or actual lighting-energy performance.
This metric choice is task-specific rather than universal. Lmean was retained because it can be embedded transparently into the adopted field-derived satisfaction model. This does not imply that Lmean replaces glare-oriented or annual visual-risk metrics in other daylight assessment tasks. Daylight glare probability (DGP) and simplified daylight glare probability (SDG) remain important when discomfort glare or directional visual disturbance is the primary concern, and annual sunlight exposure (ASE) remains important where potential annual overexposure risk must be assessed [2,35]. The present workflow should therefore be read as a satisfaction-oriented morphology-screening approach, not as a complete annual visual-risk assessment framework.
The weighting scheme should also be interpreted within the adopted scenario. In the present formulation, the 0.55/0.45 split is not presented as a direct AHP-derived measurement of the relative importance of f1 and f2. Instead, it is used as a baseline weighting scenario informed by expert-preference evidence. The four-criterion AHP results are retained as supporting evidence that satisfaction-oriented daylight appraisal received relatively high priority in the consulted expert panel, while the final weighted objective is treated as a scenario setting for the present design-search demonstration. Different expert panels, decision contexts, or weighting scenarios may lead to different preferred solutions.

6.2. Trade-Off Behavior and sDA Saturation

The results show that the daylight-sufficiency term reached saturation in the reported preferred solutions. As reported in Table 4, f2 reached 100 for all three atrium typologies. This indicates that the preferred solutions were located in a high-daylight-sufficiency region where the sDA-based term had limited remaining ability to differentiate among neighboring high-scoring candidates.
This behavior affects how the weighted results should be interpreted. Once f2 is saturated, the weighted score no longer demonstrates a strong trade-off between the two retained terms. Instead, differences among the reported high-scoring solutions are mainly shaped by the luminance-based satisfaction term f1. Therefore, the reported solutions should be interpreted as preferred morphologies within an sDA-saturated design region, rather than as evidence of a broad visual–daylight trade-off across the full search space.
This finding does not invalidate the proposed workflow, but it narrows the interpretation of the results. For early-stage design search, the workflow can still help distinguish among daylight-sufficient candidate morphologies according to the adopted luminance-based satisfaction proxy. However, if the research aim is to preserve and compare the full trade-off structure between competing objectives, future work should adopt a Pareto-based formulation or reformulate the problem as maximizing the satisfaction-oriented visual term under an explicit daylight-sufficiency constraint.

6.3. Relationship with Recent Atrium Optimization Studies

The present study should be positioned as a narrow, retail-specific design-search workflow rather than as a broadly new optimization paradigm. Recent studies have already advanced atrium daylighting and optimization in several directions. Xue and Liu [10] optimized commercial atrium daylighting in cold regions through a Pareto-based parametric workflow, while Adel and Sheta [9] examined shopping-mall atrium and skylight configurations in a hot climate using ClimateStudio and glare-oriented visual-comfort metrics. Other recent atrium studies have further expanded the objective space to include daylight, energy, and thermal performance in non-retail building types [11,12]. These studies show that atrium optimization is an active and mature research area.
Within this context, the contribution of the present study is more narrowly defined. Rather than proposing a new general-purpose optimization algorithm or a complete visual-risk/energy-performance framework, this study assembles a shopping-mall-oriented weighted design-search workflow that connects three elements: survey-derived atrium morphology ranges, a field-derived Lmean–satisfaction relationship, and sDA-based annual daylight sufficiency. The workflow therefore adds value by embedding user-response evidence into early-stage morphology exploration for retail atriums.
Compared with Pareto-oriented atrium studies, the present weighted-sum formulation is simpler and more decision-specific. It does not preserve the full trade-off frontier, but it can provide a practical ranked score under a defined weighting scenario. This makes the workflow more suitable for early-stage screening and comparison of bounded morphology options than for final performance certification or comprehensive daylight-risk assessment.

6.4. Limitations and Future Work

Several limitations should be acknowledged. First, the visual term is based on one fisheye viewpoint located at the middle of the corridor on the short side of the atrium, at a height of 1.5 m, and on selected representative time points. This setup was suitable for constructing a controlled and repeatable satisfaction-oriented workflow, but it cannot represent all possible user positions, viewing directions, short-duration extreme brightness conditions, or discomfort-glare risks. Future work should include multiple viewpoints, annual glare metrics such as DGP or SDG, and annual overexposure indicators such as ASE.
Second, the daylight-related term is represented by sDA300/50%. This metric captures annual daylight sufficiency and can indicate daylight-linked lighting energy-saving potential under an ideal daylight-responsive control assumption, but it does not simulate actual operational lighting energy consumption. Future studies should couple daylight simulation with lighting-control schedules and operational energy simulation to quantify actual lighting-energy savings more directly.
Third, the reported PSO-derived solutions should be interpreted with caution. The present study used one set of PSO control parameters and did not report independent repeated-run or multi-start statistics. Therefore, the reported parameter combinations should be understood as preferred high-scoring solutions under the present implementation settings, not as statistically stable global optima. Future work should test repeated runs with different random seeds and compare PSO with Pareto-based or evolutionary algorithms such as NSGA-II, GA, MOPSO, or Octopus.
Fourth, the weighting scheme reflects a baseline scenario rather than a universal decision rule. Although the expert-preference evidence supports the use of a satisfaction-oriented weighting emphasis in this study, different expert panels, stakeholder groups, or project priorities may lead to different weights and different preferred solutions. Future work should compare multiple stakeholder-specific weighting scenarios or use Pareto-based methods to avoid collapsing the criteria into a single scalar objective.
Fifth, the simulation workflow was not calibrated against case-specific luminance or illuminance measurements for the three modeled atrium types. The Lmean–satisfaction relationship was adopted from an earlier field study of shopping-center public spaces and was not revalidated for every typology, viewpoint, or lighting condition simulated here. The results should therefore be interpreted as model-based design-search evidence rather than as measurement-validated predictions of user satisfaction in specific built atriums.
Finally, the parameter bounds and typology extraction were derived from a documented atrium dataset for Chinese shopping malls rather than from a statistically representative sample of all retail atriums. The semi-enclosed combined-daylit solution in particular appeared near the search boundary, with a very narrow and deep geometry. Additional functional, circulation, evacuation, and constructability constraints would be required before such a geometry could be considered practically buildable. Future studies should incorporate these architectural constraints and test the workflow across other climatic regions, retail formats, and atrium plan forms.

7. Conclusions

This study developed a weighted-sum design-search workflow for shopping-mall atrium morphology by combining a luminance-based visual satisfaction proxy with sDA-based daylight sufficiency. The workflow links survey-derived atrium parameter ranges, ClimateStudio v1.1/Radiance simulation, a baseline weighted scalar objective, and PSO-based search to support early-stage form exploration for three prevalent shopping-mall atrium typologies.
Under the adopted baseline weighting scenario and current search settings, the workflow identified preferred high-scoring parameter combinations for the central top-daylit, semi-enclosed side-daylit, and semi-enclosed combined-daylit atriums. All three reported preferred solutions reached saturation of the sDA-based term; the final score differences within the high-daylight-sufficiency region were therefore mainly shaped by the luminance-based satisfaction term. The semi-enclosed combined-daylit solution should be interpreted with particular caution because it appeared near the search boundary and would require additional functional and constructability assessment before being considered a practical architectural option.
The main contribution of this study is therefore not a universal optimum or a complete visual-comfort/energy-performance assessment, but a reproducible retail-atrium-oriented workflow that connects field-based user-response evidence with parametric daylight simulation. Within the limits of the present weighting scenario, simulation assumptions, parameter bounds, and PSO implementation settings, the workflow can help early-stage design teams narrow the morphology search space and compare daylight-sufficient atrium options. Future research should incorporate glare and annual overexposure indicators, operational lighting-energy simulation, repeated-run or Pareto-based optimization, measurement calibration, and additional architectural constraints.

Supplementary Materials

The following supporting information can be downloaded at: https://www.mdpi.com/article/10.3390/app16104680/s1, Figure S1. Screening procedure from the 150 documented atriums to the 44 atriums retained for typology extraction; Table S1. Mall-level provenance and screening summary of the atrium reference dataset used for typology extraction and parameter-range derivation; Table S2. Typology-specific counts, proportions, and observed parameter ranges of the 44 atriums retained for typology extraction.

Author Contributions

Conceptualization, H.W. and X.L.; methodology, H.W. and X.L.; investigation, H.W., X.L. and T.S.; formal analysis, H.W., X.L., T.S. and H.J.; writing—original draft preparation, H.W. and X.L.; writing—review and editing, H.W., X.L., T.S. and H.J.; supervision, H.J.; funding acquisition, H.W. and X.L. All authors have read and agreed to the published version of the manuscript.

Funding

This research was funded by the National Natural Science Foundation of China (grant numbers 51908506 and 52308022).

Institutional Review Board Statement

Ethical review and approval were waived for this study in accordance with local legislation. This study used an anonymous questionnaire administered to adult participants only, involved no intervention, posed no more than minimal risk, collected no personally identifiable information, and did not involve sensitive personal information or commercial interests. According to Article 32 of the Measures for the Ethical Review of Life Sciences and Medical Research Involving Human Beings (2023), research using anonymized information data under such conditions may be exempt from ethical review.

Informed Consent Statement

Informed consent was obtained from all subjects involved in this study. Before participation, the subjects were informed of the purpose of this study, the voluntary nature of participation, the anonymous handling of the responses, and the intended use of the data. Submission of a completed questionnaire was taken as consent to participate.

Data Availability Statement

The aggregated materials supporting the findings of this study are included in this article, Appendix A, and the Supplementary Materials. Additional de-identified materials are available from the corresponding author upon reasonable request. Certain architectural drawings and case-source documents are not publicly available because they were obtained from third parties and are subject to permission restrictions.

Code Availability Statement

The Grasshopper definition files, MATLAB scripts, and workflow instructions used in this study are publicly available in the GitHub repository Shopping-Mall-Atrium-Daylighting-Optimization, release v1.0.0, at https://github.com/wu-hu-peng/Shopping-Mall-Atrium-Daylighting-Optimization/releases/tag/v1.0.0 (accessed on 12 April 2026).

Conflicts of Interest

The authors declare no conflicts of interest. The funders had no role in the design of this study; in the collection, analysis, or interpretation of the data; in the writing of the manuscript; or in the decision to publish the results.

Abbreviations

The following abbreviations are used in this manuscript:
Lmeanmean luminance of a visual scene (kcd/m2)
sDAspatial daylight autonomy (%)
sDA300/50%percentage of analysis points that meet or exceed 300 lx for at least 50% of the analysis period (%)
SEvisualsubjective satisfaction with lighting environment
w_rangerange of well width (m)
lwrate_rangerange of the length-to-width ratio
F_rangerange of number of floors
Zlw_rangerange of corridor width (m)
h_rangerange of floor height (m)
C1a cognitive learning factor
C2a social learning factor

Appendix A. Expert-Preference Evidence and Weighting-Scenario Sensitivity Analysis

Appendix A.1. Individual Expert AHP Results

Table A1 reports, for each of the 12 experts, the individual consistency ratio, a CR < 0.10 flag, the four local weights obtained from the four-criterion reciprocal matrix, and the normalized shares of the two highest-weight satisfaction-oriented criteria. These normalized shares are reported as expert-preference evidence only and are not treated as direct weights for the retained objective terms in Equation (4).
Table A1. Expert-level consistency ratios and local weights.
Expert IDCRCR < 0.10UniformitySoftnessSubjective
Lighting
Satisfaction
Visual
Comfort
Rating
Normalized
Share of Visual
Comfort Rating
Normalized
Share of Subjective
Lighting Satisfaction
E010.043TRUE0.0880.0690.2780.5650.6700.330
E020.014TRUE0.0840.0650.4440.4070.4780.522
E030.143FALSE0.1650.0930.3710.3710.5000.500
E040.093TRUE0.1010.0630.4000.4360.5210.479
E050.156FALSE0.0790.1200.4170.3840.4790.521
E060.168FALSE0.0740.0830.3300.5130.6090.391
E070.133FALSE0.1150.0790.3160.4900.6080.392
E080.056TRUE0.0910.0740.3510.4840.5800.420
E090.186FALSE0.0740.1010.3400.4840.5870.413
E100.094TRUE0.0660.0820.3940.4590.5380.462
E110.053TRUE0.0890.0630.3460.5020.5920.408
E120.177FALSE0.1060.0980.4310.3650.4590.541

Appendix A.2. Group Judgment Matrix, Group Consistency, and Four-Criterion Global Weights

The 12 reconstructed reciprocal matrices were aggregated using the geometric mean of pairwise comparisons. Table A2 gives the resulting group judgment matrix, and Table A3 summarizes the principal-eigenvector-based global weights together with the consistency statistics of the group matrix. The group consistency ratio was 0.076, which satisfies the conventional CR < 0.10 threshold.
Table A2. Aggregated group judgment matrix of the four questionnaire criteria.
UniformitySoftnessSubjective Lighting SatisfactionVisual Comfort Rating
Uniformity1.0001.0000.2670.256
Softness1.0001.0000.1310.263
Subjective lighting satisfaction3.7477.6051.0000.463
visual comfort rating3.9063.8072.1611.000
Table A3. Group AHP results for the four questionnaire criteria, including global weights and consistency statistics.
CriterionGlobal_WeightRankLambda_MaxCICR
Uniformity0.09266134.2048690.0682900.075877
Softness0.0815374
Subjective lighting satisfaction0.3679392
Visual comfort rating0.4578631

Appendix A.3. Expert-Preference Evidence for the Baseline Weighting Scenario

The two highest-weight criteria in the four-criterion AHP results were visual comfort rating and subjective lighting satisfaction. When these two satisfaction-oriented criteria were considered alone, their normalized shares were 0.5544 and 0.4456, respectively. These values are reported only as expert-preference evidence showing that satisfaction-oriented daylight appraisal was prioritized by the consulted expert panel. They are not interpreted as direct objective weights for f1 and f2, because the retained terms in Equation (4) are a luminance-based satisfaction proxy and an sDA-based daylight-sufficiency term. Table A4 reports the normalized shares of the two highest-weight satisfaction-oriented AHP criteria.
Table A4. Normalized shares of the two highest-weight satisfaction-oriented AHP criteria.
AHP CriterionRaw Global WeightNormalized ShareRounded Share
Visual comfort rating0.4578630.5544460.55
Subjective lighting satisfaction0.3679390.4455540.45
Note: These rounded shares are reported as expert-preference evidence for the baseline weighting scenario. They are not interpreted as direct AHP-derived objective weights for f1 and f2.

Appendix A.4. Sensitivity Analysis of the Expert-Preference Evidence

Three sensitivity scenarios were considered in addition to the all-12-expert aggregation: (i) restricting aggregation to experts with CR < 0.10; (ii) applying an alternative repair rule to the single non-reciprocal pairwise entry; and (iii) averaging the individual normalized shares instead of aggregating the matrices. Across these scenarios, the normalized shares of the two highest-weight satisfaction-oriented criteria remained close to the all-12-expert result. The CR < 0.10 subset produced normalized shares of 0.567 and 0.433; the alternative repair rule produced 0.547 and 0.453; and the mean-of-individual-shares approach produced 0.553 and 0.447. These results indicate that the expert-preference evidence was reasonably stable, but they do not convert the baseline 0.55/0.45 scenario into a direct AHP-derived objective-weight assignment. Table A5 summarizes the sensitivity analysis of the normalized shares of the two highest-weight satisfaction-oriented AHP criteria. Figure A1 visualizes the revised group AHP results and the normalized shares of the two highest-weight satisfaction-oriented criteria.
Table A5. Sensitivity analysis of the normalized shares of the two highest-weight satisfaction-oriented AHP criteria.
ScenarioGroup CRNormalized Share of
Visual Comfort Rating
Normalized Share of Subjective
Lighting Satisfaction
All 12 experts0.0758770.5544460.445554
CR < 0.10 experts only0.0330770.5667810.433219
Alternative repair for conflicting pair0.069810.5467010.453299
Mean of individual weightsN/A0.5527470.447253
Figure A1. Revised group AHP results based on the 12 expert questionnaires. (a) Global weights of the four evaluated criteria obtained from the aggregated reciprocal judgment matrix (CR = 0.076); (b) normalized shares of the two highest-weight satisfaction-oriented criteria across individual experts, compared with the all-12 group result and the CR < 0.10 sensitivity result. These normalized shares are reported as expert-preference evidence only and are not direct objective weights for f1 and f2.
Applsci 16 04680 g0a1

Appendix A.5. Sensitivity of the Weighted Design-Search Results to Alternative Weighting Scenarios

Because the 0.55/0.45 split is used as a baseline weighting scenario rather than as a universal objective-weight assignment, a sensitivity check was conducted to examine whether alternative weighting scenarios would change the selected preferred candidates. The weight assigned to the luminance-based satisfaction term, w1, was varied from 0.30 to 0.70, while w2 was set as 1 − w1. For each atrium typology and each weighting scenario, the weighted score was recalculated for all evaluated candidate solutions, and the highest-scoring candidate was identified. Table A6 reports the highest-scoring candidate identified under each tested weighting scenario for the three atrium typologies.
Table A6. Weighting-scenario sensitivity analysis across the three atrium typologies.
Atrium
Type
ScenarioPreferred
Candidate ID
WL/WCwHFf1f2ScoreChange from
Baseline
w1w2
top-daylit0.300.70C-84915.501.858.275.85385.2910095.59Same candidate
top-daylit0.400.60C-84915.501.858.275.85385.2910094.12Same candidate
top-daylit0.500.50C-84915.501.858.275.85385.2910092.65Same candidate
top-daylit0.550.45C-84915.501.858.275.85385.2910091.91Baseline
top-daylit0.600.40C-84915.501.858.275.85385.2910091.18Same candidate
top-daylit0.700.30C-84915.501.858.275.85385.2910089.70Same candidate
side-daylit0.300.70S-54122.811.025.145.15288.6110096.58Same candidate
side-daylit0.400.60S-54122.811.025.145.15288.6110095.44Same candidate
side-daylit0.500.50S-54122.811.025.145.15288.6110094.30Same candidate
side-daylit0.550.45S-54122.811.025.145.15288.6110093.73Baseline
side-daylit0.600.40S-54122.811.025.145.15288.6110095.44Same candidate
side-daylit0.700.30S-54122.811.025.145.15288.6110092.02Same candidate
Combined0.300.70CS-7016.071.834.515.71886.0010095.80Same candidate
Combined0.400.60CS-7016.071.834.515.71886.0010094.40Same candidate
Combined0.500.50CS-7016.071.834.515.71886.0010093.00Same candidate
Combined0.550.45CS-7016.071.834.515.71886.0010092.30Baseline
Combined0.600.40CS-7016.071.834.515.71886.0010091.60Same candidate
Combined0.700.30CS-7016.071.834.515.71886.0010090.20Same candidate
Note: For all three atrium typologies, the same candidate was selected as the highest-scoring solution under all tested weighting scenarios. Therefore, the morphological parameters, f1, and f2 remain unchanged within each typology across scenarios, while the weighted score changes according to w1 and w2. W denotes atrium well width, L/W denotes length-to-width ratio, Cw denotes corridor width, H denotes floor height, and F denotes number of floors.

References

  1. Omrany, H.; Ghaffarianhoseini, A.; Berardi, U. Is Atrium an Ideal Form for Daylight in Buildings? Archit. Sci. Rev. 2020, 63, 47–62. [Google Scholar] [CrossRef]
  2. Mohsenin, M.; Hu, J. Assessing Daylight Performance in Atrium Buildings by Using Climate Based Daylight Modeling. Sol. Energy 2015, 119, 553–560. [Google Scholar] [CrossRef]
  3. Li, X.; Jin, H.; Kang, J. A Simplified Method of Calculating Daylight Autonomy through Spatial Parameters for Atriums in Shopping Streets. In Proceedings of the Building Simulation 2019 Conference Proceedings; International Building Performance Simulation Association: Rome, Italy, 2019. [Google Scholar]
  4. Li, J.; Ban, Q.; Chen, X.J. Glazing Sizing in Large Atrium Buildings: A Perspective of Balancing Daylight Quantity and Visual Comfort. Energies 2019, 12, 701. [Google Scholar] [CrossRef]
  5. Jin, H.; Li, X.; Kang, J. An Evaluation of the Lighting Environment in the Public Space of Shopping Centres. Build. Environ. 2017, 115, 228–235. [Google Scholar] [CrossRef]
  6. Mayhoub, M.S.; Rabboh, E.H. Daylighting in Shopping Malls: Customer’s Perception, Preference, and Satisfaction. Energy Build. 2022, 255, 111691. [Google Scholar] [CrossRef]
  7. Villa, C.; Labayrade, R. Energy Efficiency vs Subjective Comfort: A Multiobjective Optimisation Method under Uncertainty. In Proceedings of the Building Simulation 2011, Sydney, Australia, 14–16 November 2011. [Google Scholar]
  8. Wagiman, K.R.; Abdullah, M.N.; Hassan, M.Y. A New Metric for Optimal Visual Comfort and Energy Efficiency of Building Lighting System Considering Daylight Using Multi-Objective Particle Swarm Optimization. J. Build. Eng. 2021, 43, 102525. [Google Scholar] [CrossRef]
  9. Adel, A.; Sheta, W. A Comparative Analysis of Atrium and Skylight Configurations in Shopping Malls. J. Umm Al-Qura Univ. Eng. Archit. 2025. [Google Scholar] [CrossRef]
  10. Xue, Y.; Liu, W. A Study on Parametric Design Method for Optimization of Daylight in Commercial Building’s Atrium in Cold Regions. Sustainability 2022, 14, 7667. [Google Scholar] [CrossRef]
  11. Xiao, W.; Zhong, W.; Wu, H.; Zhang, T. Multiobjective Optimization of Daylighting, Energy, and Thermal Performance for Form Variables in Atrium Buildings in China’s Hot Summer and Cold Winter Climate. Energy Build. 2023, 297, 113476. [Google Scholar] [CrossRef]
  12. Wang, L.; Ibrahim, A.; Jiang, Y. Multi-Objective Optimization of Atrium Form Variables for Daylighting, Energy Consumption and Thermal Comfort of Teaching Buildings at the Early Design Stage in Cold Climates. Buildings 2025, 15, 4434. [Google Scholar] [CrossRef]
  13. Hourani, M.M.; Hammad, R.N. Impact of Daylight Quality on Architectural Space Dynamics: Case Study: City Mall–Amman, Jordan. Renew. Sustain. Energy Rev. 2012, 16, 3579–3585. [Google Scholar] [CrossRef]
  14. Jin, H.; Li, X. Light Environment Analysis and Design Strategies of Large Commercial Buildings—A Case Study in Harbin. J. Harbin Inst. Technol. 2014, 21, 1–9. [Google Scholar]
  15. Sachdev, S.; de Boer, J.; Steidle, A. Shifting Daylight Patterns: Daylight in Retail Spaces. In Proceedings of the Experiencing Light 2014: International Conference on the Effects of Light on Wellbeing, Eindhoven, The Netherlands, 10–11 November 2014. [Google Scholar]
  16. Heschong, L.; Wright, R.L.; Okura, S. Daylighting Impacts on Retail Sales Performance. J. Illum. Eng. Soc. 2002, 31, 21–25. [Google Scholar] [CrossRef]
  17. Boyce, P.; Hunter, C.; Howlett, O. The Benefits of Daylight through Windows; Lighting Research Center, Rensselaer Polytechnic Institute: Troy, NY, USA, 2003. [Google Scholar]
  18. Chow, S.K.; Li, D.H.; Lee, E.W. Analysis and Prediction of Daylighting and Energy Performance in Atrium Spaces Using Daylight-Linked Lighting Controls. Appl. Energy 2013, 112, 1016–1024. [Google Scholar] [CrossRef]
  19. Sliepenbeek, W.; van Broekhoven, L. Evaluation of Stimev, the All-Dutch Utility-Sponsered Lighting Rebate Programs. In Proceedings of the Right Light Three, Third European Conference on Energy-Efficient Lighting, Newcastle upon Tyne, UK, 18–21 June 1995. [Google Scholar]
  20. Peet, R.; Heschong, L.; Wright, R. Daylighting and Productivity in the Retail Sector. In Proceedings of the ACEEE Summer Study on Energy Efficiency in Buildings, Pacific Groove, CA, USA, 14–20 August 2004. [Google Scholar]
  21. Samant, S.; Yang, F. Daylighting in Atria: The Effect of Atrium Geometry and Reflectance Distribution. Light. Res. Technol. 2007, 39, 147–157. [Google Scholar] [CrossRef]
  22. Ghasemi, M.; Noroozi, M.; Kazemzadeh, M. The Influence of Well Geometry on the Daylight Performance of Atrium Adjoining Spaces: A Parametric Study. J. Build. Eng. 2015, 3, 39–47. [Google Scholar] [CrossRef]
  23. Littlefair, P.J. Daylight Prediction in Atrium Buildings. Sol. Energy 2002, 73, 105–109. [Google Scholar] [CrossRef]
  24. Kim, G.; Kim, J.T. Luminous Impact of Balcony Floor at Atrium Spaces with Different Well Geometries. Build. Environ. 2010, 45, 304–310. [Google Scholar] [CrossRef]
  25. Alraddadi, T.A. The Effect of the Stepped Section Atrium on Daylighting Performance. Archit. Sci. Rev. 2004, 47, 303–310. [Google Scholar] [CrossRef]
  26. Sharples, S.; Lash, D. Daylight in Atrium Buildings: A Critical Review. Archit. Sci. Rev. 2007, 50, 301–312. [Google Scholar] [CrossRef]
  27. Atif, M.; Boyer, L.L.; Degelman, L. Development of Atrium Daylighting Prediction: From an Algorithm to a Design Tool. J. Illum. Eng. Soc. 1995, 24, 3–12. [Google Scholar] [CrossRef][Green Version]
  28. Boubekri, M.; Anninos, W.Y. Daylighting Efficiency of an Atrium: Part 1-The Four-Sided Type. Archit. Sci. Rev. 1996, 39, 75–81. [Google Scholar] [CrossRef]
  29. Boubekri, M.; Anninos, W.Y. Daylighting Efficiency of an Atrium: Part II–the Three-Sided Type. Archit. Sci. Rev. 1996, 39, 83–88. [Google Scholar] [CrossRef]
  30. Boubekri, M.; Anninos, W.Y. Daylighting Efficiency of an Atrium: Part III–the Linear-Open-End Type. Archit. Sci. Rev. 1996, 39, 179–186. [Google Scholar] [CrossRef]
  31. Goharian, A.; Mahdavinejad, M.; Bemanian, M. Designerly Optimization of Devices (as Reflectors) to Improve Daylight and Scrutiny of the Light-Well’s Configuration. Build. Simul. 2021, 15, 933–956. [Google Scholar] [CrossRef]
  32. Reinhart, C.F.; Walkenhorst, O. Validation of Dynamic RADIANCE-Based Daylight Simulations for a Test Office with External Blinds. Energy Build. 2001, 33, 683–697. [Google Scholar] [CrossRef]
  33. Reinhart, C.F.; Andersen, M. Development and Validation of a Radiance Model for a Translucent Panel. Energy Build. 2006, 38, 890–904. [Google Scholar] [CrossRef]
  34. Futrell, B.J.; Ozelkan, E.C.; Brentrup, D. Optimizing Complex Building Design for Annual Daylighting Performance and Evaluation of Optimization Algorithms. Energy Build. 2015, 92, 234–245. [Google Scholar] [CrossRef]
  35. IES LM-83-12; Approved Method: IES Spatial Daylight Autonomy (sDA) and Annual Sunlight Exposure (ASE). Illuminating Engineering Society: New York, NY, USA, 2012.
  36. Solemma. Available online: https://www.solemma.com (accessed on 12 April 2026).
  37. Kong, Z.; Jakubiec, J.A. Instantaneous Lighting Quality within Higher Educational Classrooms in Singapore. Front. Archit. Res. 2021, 10, 787–802. [Google Scholar] [CrossRef]
  38. Kong, Z.; Utzinger, D.M.; Humann, C. Evaluation of a Hybrid Photo-Radiometer Sky Model Compared with the Perez Sky Model. Energy Build. 2018, 178, 318–330. [Google Scholar] [CrossRef]
  39. GB 50034-2013; Standard for Lighting Design of Buildings. China Architecture & Building Press: Beijing, China, 2013.
  40. U.S. Green Building Council. LEED Reference Guide for Building Design and Construction; U.S. Green Building Council: Washington, DC, USA, 2013. [Google Scholar]
  41. Galasiu, A.D.; Veitch, J.A. Occupant Preferences and Satisfaction with the Luminous Environment and Control Systems in Daylit Offices: A Literature Review. Energy Build. 2006, 38, 728–742. [Google Scholar] [CrossRef]
  42. Veitch, J.A.; Newsham, G.R.; Boyce, P.R.; Jones, C. Lighting Appraisal, Well-Being and Performance in Open-Plan Offices: A Linked Mechanisms Approach. Light. Res. Technol. 2008, 40, 133–151. [Google Scholar] [CrossRef]
  43. Kennedy, J.; Eberhart, R. Particle Swarm Optimization. In Proceedings of the ICNN’95—International Conference on Neural Networks; IEEE: Perth, WA, Australia, 1995; Volume 4, pp. 1942–1948. [Google Scholar]
  44. Shi, Y.; Eberhart, R. A Modified Particle Swarm Optimizer. In Proceedings of the 1998 IEEE International Conference on Evolutionary Computation, IEEE World Congress on Computational Intelligence; IEEE: Anchorage, AK, USA, 1998; pp. 69–73. [Google Scholar]
  45. Delgarm, N.; Sajadi, B.; Kowsary, F. Multi-Objective Optimization of the Building Energy Performance: A Simulation-Based Approach by Means of Particle Swarm Optimization (PSO). Appl. Energy 2016, 170, 293–303. [Google Scholar] [CrossRef]
  46. Zhang, J. Large Commercial Building Design; China Architecture & Building Press: Beijing, China, 2015. [Google Scholar]
  47. Chen, F. Building Wind Environment: Research on Wind Environment and Energy Efficient Architecture in Hot Summer & Winter Region; China Architecture & Building Press: Beijing, China, 2009. [Google Scholar]
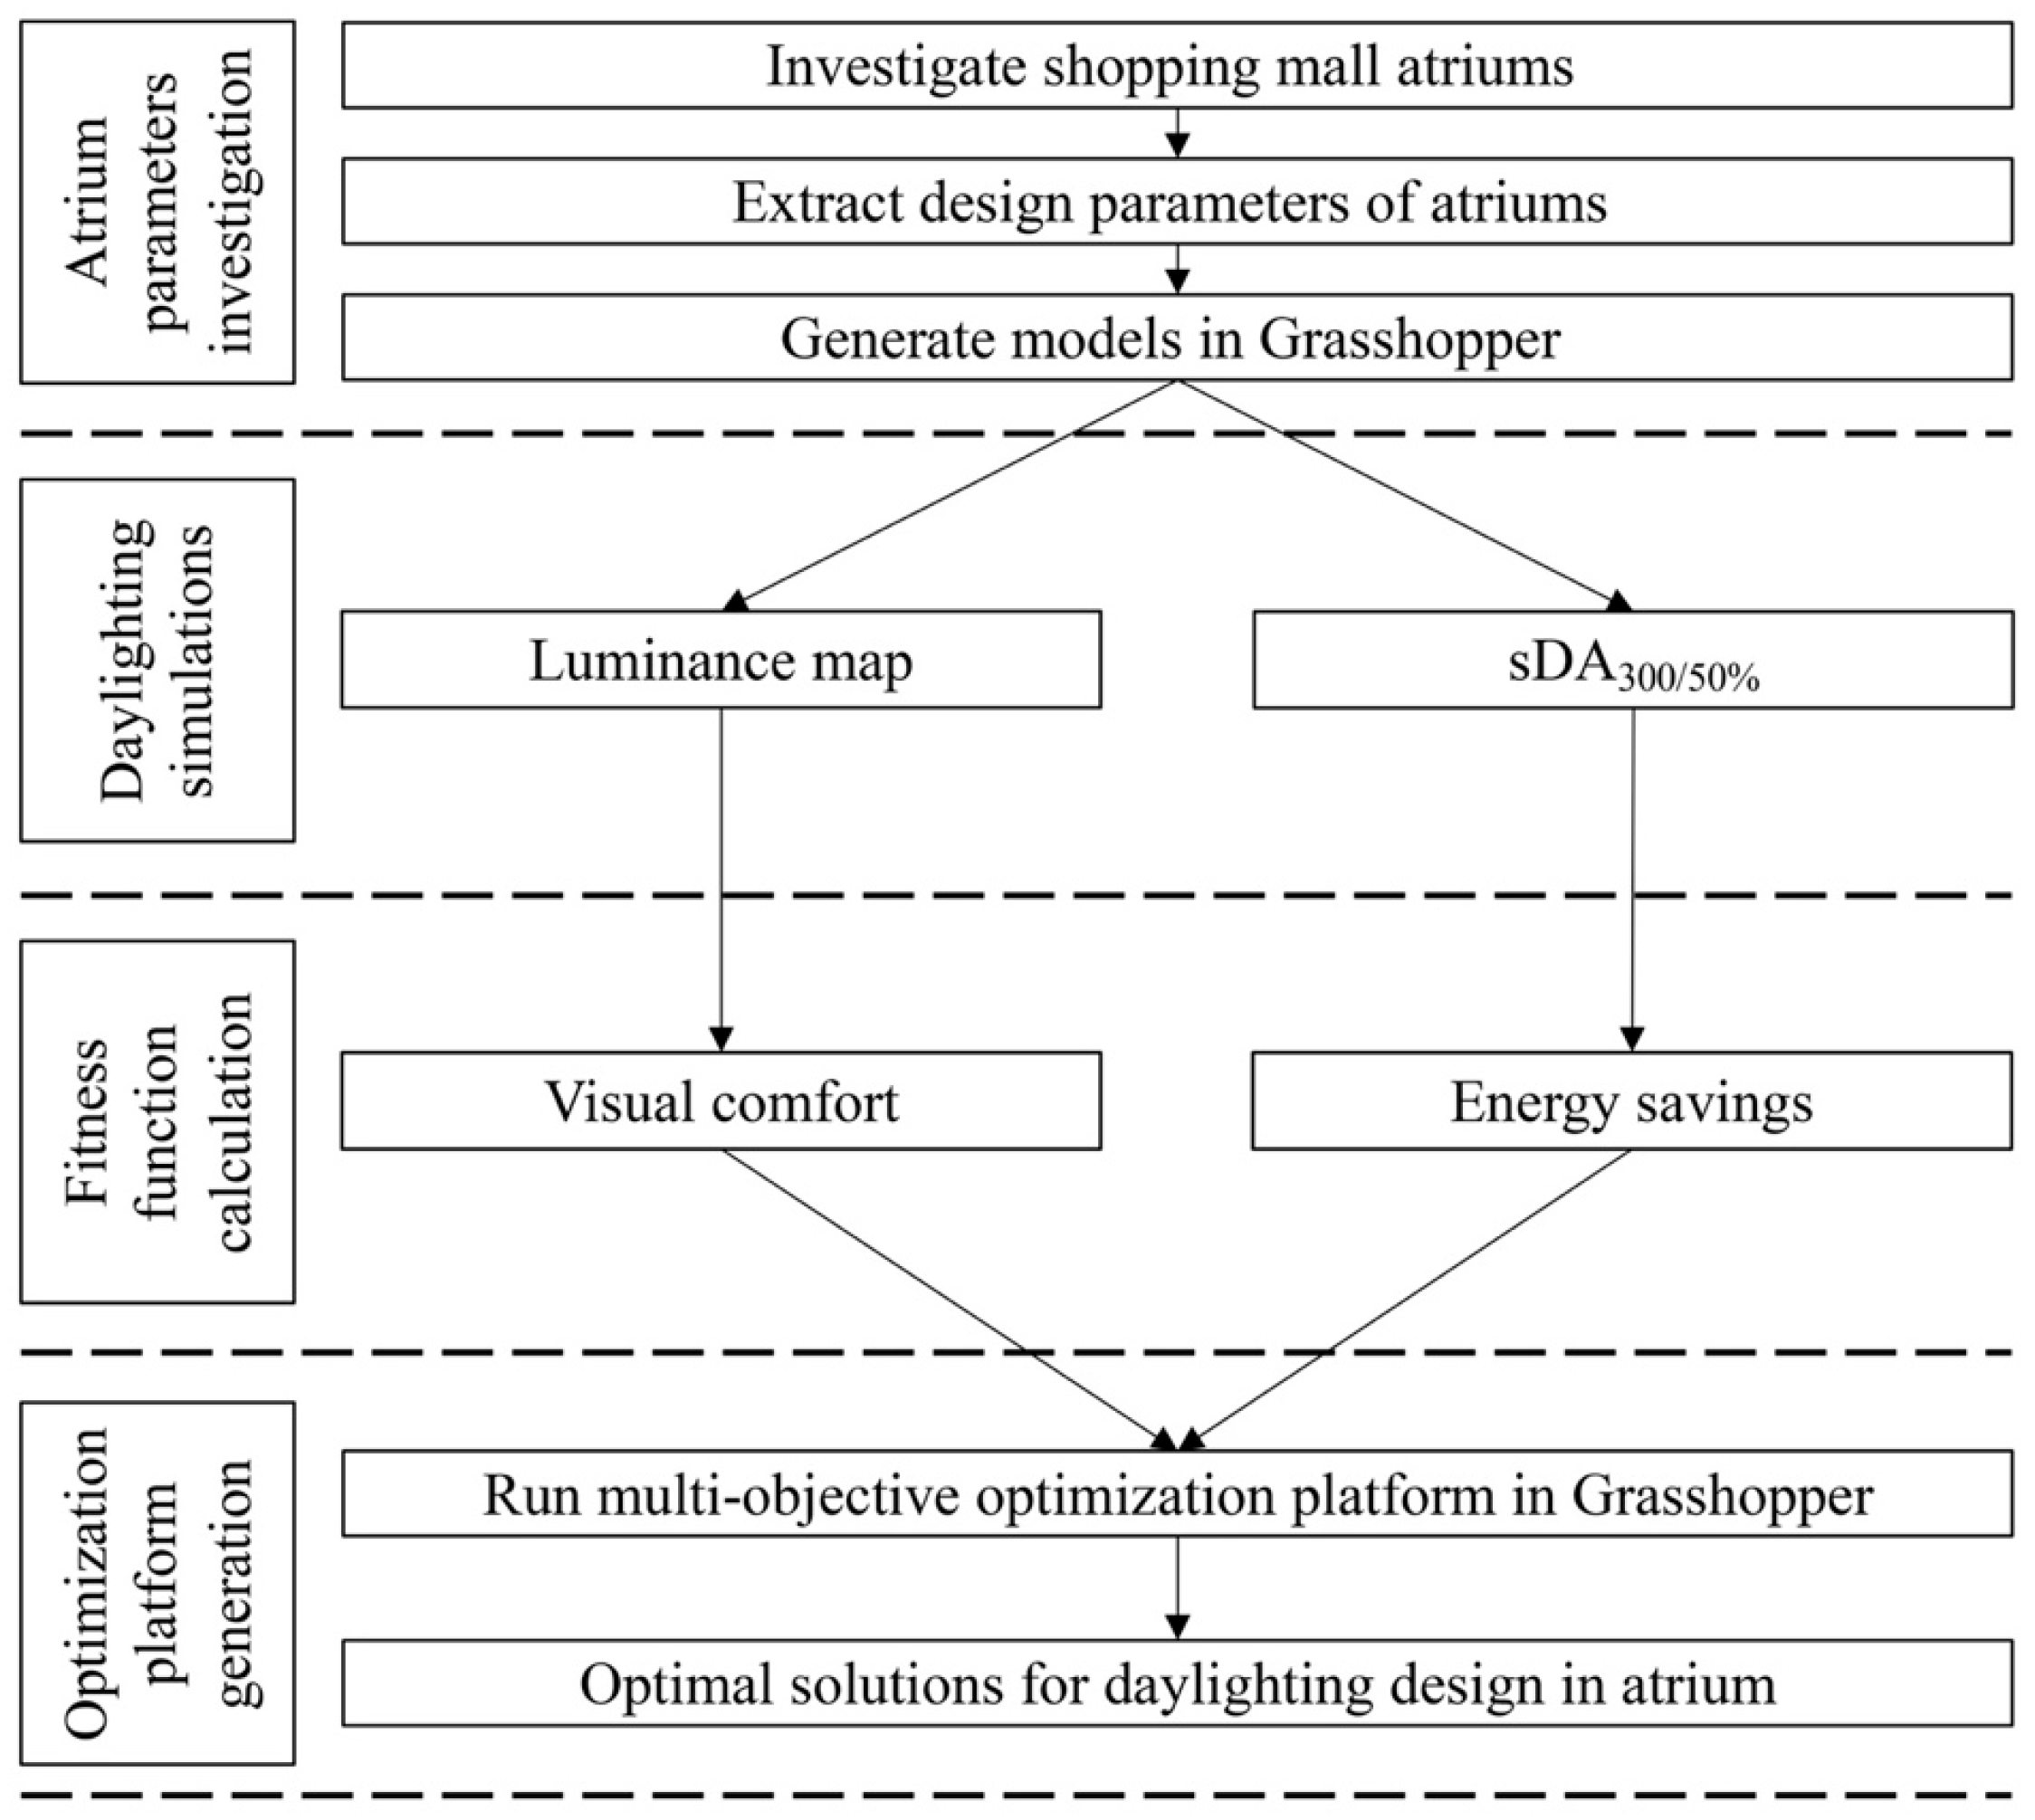
Figure 1. Overview of the research method.
Applsci 16 04680 g001
Figure 2. Viewpoint for luminance-based visual satisfaction evaluation. The white rectangle indicates the atrium well area, and the red arrow indicates the viewing direction from the selected corridor viewpoint.
Applsci 16 04680 g002
Figure 3. Simulated luminance maps for the central atrium.
Applsci 16 04680 g003
Figure 4. Simulated sDA300/50% values for the central atrium and the semi-enclosed atrium.
Applsci 16 04680 g004
Figure 5. Normalized luminance-based satisfaction proxy as a function of Lmean.
Applsci 16 04680 g005
Figure 6. Normalized sDA-based daylight sufficiency term used as a proxy for daylight-linked lighting energy-saving potential under an ideal daylight-responsive control assumption.
Applsci 16 04680 g006
Figure 7. Flowchart of the design-search approach based on daylighting simulation. The arrows indicate the sequence of data processing and simulation steps.
Applsci 16 04680 g007
Figure 8. Daylighting simulation program for the central top-daylit atrium in Grasshopper. The yellow labels indicate the four main parts of the Grasshopper definition: Inputs, Modeling, daylight-availability calculating, and HDR-image calculating. The connection wires and component port labels are standard Grasshopper interface elements.
Applsci 16 04680 g008
Figure 9. The calculation process in MATLAB v2020b.
Applsci 16 04680 g009
Figure 10. Diagram of the typical atrium morphological parameters for (a) plan view of the central atrium; (b) plan view of the semi-enclosed atrium; (c) section view of the typical daylighting atrium. The break mark in panel (c) indicates omitted intermediate floors used to schematically represent the variable number of floors in the range of 1–8.
Applsci 16 04680 g010
Figure 11. Distribution of evaluated candidate solutions in the f1f2 plane for the three atrium typologies. Each point represents one simulated candidate solution recorded during the PSO search. The reported preferred solutions are marked separately. The distribution shows that the highest-scoring candidates are located in a high-daylight-sufficiency region where the f2 term is saturated or nearly saturated; therefore, score differentiation among these candidates is mainly associated with the luminance-based satisfaction term f1.
Applsci 16 04680 g011
Figure 12. Representative fitness-improvement histories across epochs from the present PSO runs for (a) the central top-daylit atrium, (b) the semi-enclosed side-daylit atrium, and (c) the semi-enclosed combined-daylit atrium. These histories describe the present implementation settings and are not intended to demonstrate cross-run stability.
Applsci 16 04680 g012
Table 1. Planar parameter statistics for atriums.
Plan FormNumber of AtriumsPercentageRole in Subsequent Modeling
Rectangular10670.67%selected as base plan form
Oval2013.33%not retained as base plan form
Circular1510.00%not retained as base plan form
Irregular96.00%not retained as base plan form
Table 2. Location and daylighting patterns of atriums.
LocationCentral AtriumSemi-Enclosed AtriumCorner AtriumLinear Atrium
Daylighting
pattern
Applsci 16 04680 i001Applsci 16 04680 i002Applsci 16 04680 i003Applsci 16 04680 i004Applsci 16 04680 i005Applsci 16 04680 i006Applsci 16 04680 i007
Top-
daylit
Vertical
skylit
Side-
daylit
Combined-daylitTwo-sided daylitUpper and twoside daylitUpper and side daylit
Proportion47.7%6.8%20.5%9.2%6.8%4.5%4.5%
Table 3. Common search bounds adopted for the three simulated atrium typologies.
Typew_Rangelwrate_RangeZlw_Rangeh_RangeF_Range
Common bounds6–271–34–105–61–8
Table 4. Preferred parameter combinations identified by the PSO-based design search under the baseline weighting scenario and current search settings.
TypeCentral Atrium
with Top-Daylit
Semi-Enclosed Atrium
with Side-Daylit
Semi-Enclosed Atrium
with Combined-Daylit
Width15.5022.816.07
Length-width ratio1.851.021.83
Width of corridor8.275.144.51
Floor height5.855.155.71
Number of floors328
f185.2988.6186.00
f2100100100
Score91.9193.7392.30
Plan and Section viewApplsci 16 04680 i008
Disclaimer/Publisher’s Note: The statements, opinions and data contained in all publications are solely those of the individual author(s) and contributor(s) and not of MDPI and/or the editor(s). MDPI and/or the editor(s) disclaim responsibility for any injury to people or property resulting from any ideas, methods, instructions or products referred to in the content.